User login
No biopsy for 21% of adults with celiac disease
Patients with celiac disease often do not receive a biopsy or nutritional recommendations at diagnosis, according to the findings of a large survey study.
Strikingly, 21% of respondents did not have a confirmatory duodenal biopsy, reported Andrew M. Joelson, MD, of Columbia University Medical Center, New York, and his associates. Gastroenterologists diagnosed 66% of biopsied patients but only 31% of nonbiopsied patients (P less than .001). “Patients require more education about management of celiac disease and referral to gastroenterologists for duodenal biopsy confirmation,” the researchers wrote in the May issue of Clinical Gastroenterology and Hepatology.
Classic small-bowel findings in celiac disease (intraepithelial lymphocytes, crypt hyperplasia, and villous atrophy) are not pathognomonic, making serology important for diagnosis. European guidelines discuss forgoing biopsy in children whose antitissue transglutaminase antibody titers are at least 10-fold above the upper limit of normal. However, the American College of Gastroenterology and the American Gastroenterological Association continue to recommend combining serology with confirmatory small bowel biopsy. The extent to which physicians follow this advice is unclear, the researchers noted.
Therefore, they analyzed data from a questionnaire posted on the Celiac Disease Foundation website during a 7-month period in 2016. Among 982 adults with self-reported celiac disease, 780 said their diagnosis included both serology and biopsy and 202 said they received serology only. Only 40% of these nonbiopsied respondents said they sought nutritional counseling at diagnosis, compared with 59% of biopsied patients (P less than .001). Patients diagnosed by serology alone also were more likely to report using dietary supplements to aid gluten digestion (20% vs. 9% of biopsied respondents; P less than .001).
These associations remained statistically significant after adjustment for age and sex, said the researchers. Nonbiopsied patients had a significantly lower odds of having been diagnosed by a gastroenterologist (odds ratio, 0.16; 95% confidence interval, 0.07-0.37) and seeking nutritional counseling (OR, 0.45; 95% CI, 0.33-0.63) and were significantly more likely to use digestive supplements (OR, 2.61; 95%, CI 1.62-4.19).
Fully 87% of respondents always followed a strict gluten-free diet, but symptoms persisted in 65% of those who were not biopsied, compared with only 51% of those who were biopsied. There were too few responses to this question for the difference between groups to reach statistical significance, but the finding might reflect the greater diagnostic accuracy of biopsy, the researchers said. However, they cautioned that none of the associations in this study were necessarily causal, diagnoses were not independently validated, and the reliability of self-reported celiac diagnosis remains unclear.
Survey respondents also were self-selected – for example, 91% self-identified as white and 60% reported having a bachelor’s degree, compared with only about 77% and one-third of adults captured by U.S. Census Bureau data from 2017.
“Although these characteristics may limit the generalizability of our findings, this study nevertheless reflects a population of celiac disease that is not typically studied, such as those not attending large academic celiac disease centers, and those diagnosed without the involvement of a gastroenterologist,” the researchers wrote. “Future studies are warranted to further characterize this population regarding the long-term consequences of forgoing the duodenal biopsy, and to develop educational interventions to promote evidence-based diagnosis and management of celiac disease.”
SOURCE: Joelson AM et al. Clin Gastroenterol Hepatol. 2018 Sep 10. doi: 10.1016/j.cgh.2018.09.006.
Self-reported celiac disease diagnosis is not validated and perhaps more inaccurate now with the rise of other gluten-related disorders. Although misdiagnosis is possible, the finding in this study by Joelson et al. that 21% of self-reported celiac adults said they never had a confirmatory biopsy is remarkable. Another important observation is the low-quality celiac care among nonbiopsed adults, with less formal nutritional counseling and high use of gluten digestive supplements and persistent symptoms.

Nowadays, biopsy confirmation may not be necessary for all. There is strong evidence for nonbiopsy diagnosis in selected symptomatic children with high titers of tissue transglutaminase antibodies (more than 10 times the upper limit of normal) and a positive endomysial antibody in a second sample. Whether the nonbiopsy approach could be applicable also in adults remains controversial. Current guidelines recommend biopsy confirmation in all adults. However, emerging evidence favors celiac disease diagnosis without use of biopsy in selected adults.
Although the debate regarding pros and cons of nonbiopsy diagnosis is far from an end, this approach is here to stay. In the future, regardless of the method selected to confirm celiac disease diagnosis, the overall quality of celiac care should be ensured.
Alberto Rubio-Tapia, MD, is an assistant professor of medicine at the Mayo Clinic, Rochester, Minn. He has no conflicts of interest.
Self-reported celiac disease diagnosis is not validated and perhaps more inaccurate now with the rise of other gluten-related disorders. Although misdiagnosis is possible, the finding in this study by Joelson et al. that 21% of self-reported celiac adults said they never had a confirmatory biopsy is remarkable. Another important observation is the low-quality celiac care among nonbiopsed adults, with less formal nutritional counseling and high use of gluten digestive supplements and persistent symptoms.
Nowadays, biopsy confirmation may not be necessary for all. There is strong evidence for nonbiopsy diagnosis in selected symptomatic children with high titers of tissue transglutaminase antibodies (more than 10 times the upper limit of normal) and a positive endomysial antibody in a second sample. Whether the nonbiopsy approach could be applicable also in adults remains controversial. Current guidelines recommend biopsy confirmation in all adults. However, emerging evidence favors celiac disease diagnosis without use of biopsy in selected adults.
Although the debate regarding pros and cons of nonbiopsy diagnosis is far from an end, this approach is here to stay. In the future, regardless of the method selected to confirm celiac disease diagnosis, the overall quality of celiac care should be ensured.
Alberto Rubio-Tapia, MD, is an assistant professor of medicine at the Mayo Clinic, Rochester, Minn. He has no conflicts of interest.
Patients with celiac disease often do not receive a biopsy or nutritional recommendations at diagnosis, according to the findings of a large survey study.
Strikingly, 21% of respondents did not have a confirmatory duodenal biopsy, reported Andrew M. Joelson, MD, of Columbia University Medical Center, New York, and his associates. Gastroenterologists diagnosed 66% of biopsied patients but only 31% of nonbiopsied patients (P less than .001). “Patients require more education about management of celiac disease and referral to gastroenterologists for duodenal biopsy confirmation,” the researchers wrote in the May issue of Clinical Gastroenterology and Hepatology.
Classic small-bowel findings in celiac disease (intraepithelial lymphocytes, crypt hyperplasia, and villous atrophy) are not pathognomonic, making serology important for diagnosis. European guidelines discuss forgoing biopsy in children whose antitissue transglutaminase antibody titers are at least 10-fold above the upper limit of normal. However, the American College of Gastroenterology and the American Gastroenterological Association continue to recommend combining serology with confirmatory small bowel biopsy. The extent to which physicians follow this advice is unclear, the researchers noted.
Therefore, they analyzed data from a questionnaire posted on the Celiac Disease Foundation website during a 7-month period in 2016. Among 982 adults with self-reported celiac disease, 780 said their diagnosis included both serology and biopsy and 202 said they received serology only. Only 40% of these nonbiopsied respondents said they sought nutritional counseling at diagnosis, compared with 59% of biopsied patients (P less than .001). Patients diagnosed by serology alone also were more likely to report using dietary supplements to aid gluten digestion (20% vs. 9% of biopsied respondents; P less than .001).
These associations remained statistically significant after adjustment for age and sex, said the researchers. Nonbiopsied patients had a significantly lower odds of having been diagnosed by a gastroenterologist (odds ratio, 0.16; 95% confidence interval, 0.07-0.37) and seeking nutritional counseling (OR, 0.45; 95% CI, 0.33-0.63) and were significantly more likely to use digestive supplements (OR, 2.61; 95%, CI 1.62-4.19).
Fully 87% of respondents always followed a strict gluten-free diet, but symptoms persisted in 65% of those who were not biopsied, compared with only 51% of those who were biopsied. There were too few responses to this question for the difference between groups to reach statistical significance, but the finding might reflect the greater diagnostic accuracy of biopsy, the researchers said. However, they cautioned that none of the associations in this study were necessarily causal, diagnoses were not independently validated, and the reliability of self-reported celiac diagnosis remains unclear.
Survey respondents also were self-selected – for example, 91% self-identified as white and 60% reported having a bachelor’s degree, compared with only about 77% and one-third of adults captured by U.S. Census Bureau data from 2017.
“Although these characteristics may limit the generalizability of our findings, this study nevertheless reflects a population of celiac disease that is not typically studied, such as those not attending large academic celiac disease centers, and those diagnosed without the involvement of a gastroenterologist,” the researchers wrote. “Future studies are warranted to further characterize this population regarding the long-term consequences of forgoing the duodenal biopsy, and to develop educational interventions to promote evidence-based diagnosis and management of celiac disease.”
SOURCE: Joelson AM et al. Clin Gastroenterol Hepatol. 2018 Sep 10. doi: 10.1016/j.cgh.2018.09.006.
FROM CLINICAL GASTROENTEROLOGY AND HEPATOLOGY
CT scan honeycombing key to hypersensitivity pneumonitis prognosis
In patients with hypersensitivity pneumonitis, presence of radiologic honeycombing suggests a poor prognosis in line with what might be expected with idiopathic pulmonary fibrosis, results of a recent study suggest.
When radiologic honeycombing was present, event-free survival was uniformly poor, regardless of whether the patient had hypersensitivity pneumonitis (HP) or idiopathic pulmonary fibrosis (IPF). By contrast, HP patients with nonhoneycomb fibrosis had longer event-free survival than IPF patients with honeycomb features on CT, wrote researchers led by Margaret L. Salisbury, MD, of the division of pulmonary and critical care medicine at the University of Michigan, Ann Arbor.
“Given the uniformly poor outcome among subjects with radiologic honeycombing, pursuit of invasive diagnostic tests directed at differentiating IPF from HP may be of limited value,” Dr. Salisbury and her coinvestigators wrote in Chest.
In the study, 117 patients with HP and 161 with IPF underwent high-resolution CT, results of which were evaluated by three thoracic radiologists. Patients with HP who had no fibrosis on CT had the best event-free median survival, or time to transplant or death, at greater than 14.73 years. For HP patients with nonhoneycomb fibrosis, that median survival was greater than 7.95 years, compared with just 5.20 years in IPF patients without honeycomb features.
Looking specifically at patients with honeycomb features, median event-free survival was poor for both HP and IPF patients, at 2.76 and 2.81 years, respectively.
The HP patients with no fibrosis had a significant improvement in percent predicted forced vital capacity over time, while fibrotic patients experienced significant declines, the investigators wrote. Thus, HP patients with nonhoneycomb fibrosis had forced vital capacity declines despite longer transplant-free survival.
“These results highlight the importance of making a correct diagnosis of HP versus IPF in patients with nonhoneycomb fibrosis, as well as the limited utility in differentiating HP from IPF among patients with radiologic honeycombing,” Dr. Salisbury and her coinvestigators concluded.
Dr. Salisbury reported grants from the National Institutes of Health during the study. Her coauthors reported disclosures related to the NIH, Bayer, Centocor, Gilead, Promedior, Ikaria, Genentech, Nycomed/Takeda, Pfizer, and others.
SOURCE: Salisbury ML et al. Chest. 2019 Apr;155(4):699-711.
This study provides “clearly defined” phenotypes that are practical and potentially important for stratification and prognosis in patients with hypersensitivity pneumonitis (HP), according to David A. Lynch, MB.
“They should be widely adopted,” Dr. Lynch wrote of the three HP CT phenotypes in an editorial.
The study adds further evidence on the significance of honeycombing in the clinical course of fibrotic HP versus that of idiopathic pulmonary fibrosis, he added. Symptom duration in the HP patients was similar regardless of nonfibrotic, fibrotic, or honeycomb patterns, and was not linked to survival time. With that in mind, classifying HP based on fibrosis and its pattern may be more useful in determining prognosis than traditional acute, subacute, or chronic classification
That said, the present study does not provide much information on what demographic or exposure factors were associated with three phenotypes.
“Further study of this question will be important,” Dr. Lynch wrote. “Additionally, it will be important to understand the histologic correlates of the CT phenotypes.”
Dr. Lynch is with the department of radiology at National Jewish Health in Denver. His remarks are taken from his editorial that appeared in Chest (2019;155[4]:655-6). Dr. Lynch reported disclosures related to Genentech, Boehringer Ingelheim, Veracyte, Boehringer Ingelheim, and the France Foundation.
In patients with hypersensitivity pneumonitis, presence of radiologic honeycombing suggests a poor prognosis in line with what might be expected with idiopathic pulmonary fibrosis, results of a recent study suggest.
When radiologic honeycombing was present, event-free survival was uniformly poor, regardless of whether the patient had hypersensitivity pneumonitis (HP) or idiopathic pulmonary fibrosis (IPF). By contrast, HP patients with nonhoneycomb fibrosis had longer event-free survival than IPF patients with honeycomb features on CT, wrote researchers led by Margaret L. Salisbury, MD, of the division of pulmonary and critical care medicine at the University of Michigan, Ann Arbor.
“Given the uniformly poor outcome among subjects with radiologic honeycombing, pursuit of invasive diagnostic tests directed at differentiating IPF from HP may be of limited value,” Dr. Salisbury and her coinvestigators wrote in Chest.
In the study, 117 patients with HP and 161 with IPF underwent high-resolution CT, results of which were evaluated by three thoracic radiologists. Patients with HP who had no fibrosis on CT had the best event-free median survival, or time to transplant or death, at greater than 14.73 years. For HP patients with nonhoneycomb fibrosis, that median survival was greater than 7.95 years, compared with just 5.20 years in IPF patients without honeycomb features.
Looking specifically at patients with honeycomb features, median event-free survival was poor for both HP and IPF patients, at 2.76 and 2.81 years, respectively.
The HP patients with no fibrosis had a significant improvement in percent predicted forced vital capacity over time, while fibrotic patients experienced significant declines, the investigators wrote. Thus, HP patients with nonhoneycomb fibrosis had forced vital capacity declines despite longer transplant-free survival.
“These results highlight the importance of making a correct diagnosis of HP versus IPF in patients with nonhoneycomb fibrosis, as well as the limited utility in differentiating HP from IPF among patients with radiologic honeycombing,” Dr. Salisbury and her coinvestigators concluded.
Dr. Salisbury reported grants from the National Institutes of Health during the study. Her coauthors reported disclosures related to the NIH, Bayer, Centocor, Gilead, Promedior, Ikaria, Genentech, Nycomed/Takeda, Pfizer, and others.
SOURCE: Salisbury ML et al. Chest. 2019 Apr;155(4):699-711.
FROM CHEST®
Look for alcohol septal ablation in the next HOCM guideline
SNOWMASS, COLO. – Recent data on long-term outcomes of alcohol septal ablation for hypertrophic obstructive cardiomyopathy are “quite favorable” and will be considered in the deliberations of the task force charged with revising the 2011 American College of Cardiology/American Heart Association guidelines.

Paul Sorajja, MD, a member of the task force and director of the Center of Valve and Structural Heart Disease at the Minneapolis Heart Institute, explained that the 2011 ACC/AHA guidelines on hypertrophic cardiomyopathy took an appropriately cautious stance regarding alcohol septal ablation (ASA) in light of a 2010 Dutch report warning of an increased risk of sudden cardiac death following the procedure (Circ Heart Fail. 2010 May;3[3]:362-9) and a dearth of evidence to the contrary.
The 2011 guidelines recommend surgical myectomy performed in an experienced center as the class I treatment of choice for patients with severely symptomatic, drug-refractory hypertrophic obstructive cardiomyopathy (HOCM). ASA gets a class IIa recommendation for patients at high surgical risk, and is class III – meaning don’t do it – for patients under age 40 years if myectomy is a viable option (J Am Coll Cardiol. 2011 Dec 13;58[25]:e212-60), Dr. Sorajja noted at the Annual Cardiovascular Conference at Snowmass sponsored by the American College of Cardiology.
However, the cautionary Dutch study that influenced the 2011 guidelines is considered controversial, he explained. It was small – just 91 patients – and the operators used twice the normal volume of alcohol, with a resultant much larger, potentially arrhythmogenic myocardial ablation scar. So, many experts have been eagerly awaiting additional long-term studies. And that long-sought data has recently been piling up. Since the 2011 guidelines, six long-term studies have been published, including one led by Dr. Sorajja (Circulation. 2012 Nov 13;126[20]:2374-80). The results have been consistently favorable, with 5-year survival rates of 87%-96%, in line with rates in the general population.
The largest of these studies included 1,197 patients who underwent ASA at seven centers in four European countries. The 30-day mortality and pacemaker implantation rates were significantly lower in patients aged up to 50 years, compared with those aged 65 and up. The annual mortality rate during a mean follow-up of 5.4 years was 1% in patients age 50 years and younger, 2.1% in those aged 51-64, and 5.1% in the oldest group. Arrhythmic events occurred at a rate of about 1% per year in all three age groups. And 95% of patients in the youngest group were in New York Heart Association class I or II at last follow-up (JACC Cardiovasc Interv. 2017 Jun 12;10[11]:1134-43).
In an accompanying editorial, Michael A. Fifer, MD, of Massachusetts General Hospital, Boston, commented that “high-volume surgical myectomy centers are few and far between” and there is “a clear inverse relation between [surgical] procedure volume and outcomes.”
The study “provides the most robust data to date regarding the outcomes of ASA in younger patients, precisely the type of data that were missing at the time of writing of the ACCF/AHA and European Society of Cardiology guidelines. Given the favorable outcomes of ASA in this age group, and the unavailability of high-volume myectomy programs in many geographic regions, the time has come to liberalize the indication for ASA in younger patients,” declared Dr. Fifer (JACC Cardiovasc Interv. 2017 Jun 12;10[11]:1144-6).
The second-largest long-term study of ASA was a recent report on 952 German patients with a minimum 6-year follow-up. The estimated 5-, 10-, and 15-year survival rates were 95.8%, 88.3%, and 79.7%, respectively. Estimated survival free of cardiac events was 98.9% at 5 years, 97.0% at 10 years, and 96.5% at 15 years. About 5% of patients received an implantable cardioverter defibrillator.
The investigators concluded, “In this study, PTSMA [percutaneous transluminal septal myocardial ablation] could be proofed as a safe procedure with ongoing symptomatic improvement and excellent long-term survival. Therefore, PTSMA is a reasonable alternative to surgical myectomy in HOCM.” (J Am Coll Cardiol. 2018 Dec 18;72[24]:3087-94) It’s way too early in the ACC/AHA guideline revision process to say what the new recommendations will be, according to Dr. Sorajja.
One unsettled issue, in his view, is whether ASA outcomes are significantly better in high-volume centers. A study of all 11,248 patients who underwent surgical myectomy of ASA during 2003-2011 in a large U.S. inpatient database concluded that undergoing surgical myectomy in a bottom-tertile-volume hospital was independently associated with an adjusted 210% increased risk of inpatient all-cause mortality and a 280% increased risk of bleeding, but that being in the lowest tertile of ASA hospital volume wasn’t independently associated with increased risk after adjustment for potential confounders (JAMA Cardiol. 2016 Jun 1;1:[3]:324-32).
However, Dr. Sorajja indicated he didn’t find the statistically adjusted results in the ASA cohort persuasive.
“I will tell you that the favorable results in the long-term studies came from hospitals in the highest-volume tertile,” the cardiologist said.
At present, he considers surgical myectomy the gold standard therapy. With well-selected patients for ASA – that is, those for whom imaging has identified an appropriate septal artery for delivery of the alcohol, along with no more than 24 mm of septal hypertrophy so the alcohol dose can be limited to a maximum of 20-25 cc – it’s reasonable to expect gradient relief in more than 90% of patients, surgical-like results with optimal relief of left ventricular outflow tract obstruction and a residual gradient of less than 10 mm Hg in about 75%, and a procedural mortality of about 1%, he said.
Dr. Sorajja reported receiving research funding from Abbott Structural, Boston Scientific, Edwards Lifesciences, and Medtronic, and serving as a consultant to those companies and several others.
SNOWMASS, COLO. – Recent data on long-term outcomes of alcohol septal ablation for hypertrophic obstructive cardiomyopathy are “quite favorable” and will be considered in the deliberations of the task force charged with revising the 2011 American College of Cardiology/American Heart Association guidelines.
Paul Sorajja, MD, a member of the task force and director of the Center of Valve and Structural Heart Disease at the Minneapolis Heart Institute, explained that the 2011 ACC/AHA guidelines on hypertrophic cardiomyopathy took an appropriately cautious stance regarding alcohol septal ablation (ASA) in light of a 2010 Dutch report warning of an increased risk of sudden cardiac death following the procedure (Circ Heart Fail. 2010 May;3[3]:362-9) and a dearth of evidence to the contrary.
The 2011 guidelines recommend surgical myectomy performed in an experienced center as the class I treatment of choice for patients with severely symptomatic, drug-refractory hypertrophic obstructive cardiomyopathy (HOCM). ASA gets a class IIa recommendation for patients at high surgical risk, and is class III – meaning don’t do it – for patients under age 40 years if myectomy is a viable option (J Am Coll Cardiol. 2011 Dec 13;58[25]:e212-60), Dr. Sorajja noted at the Annual Cardiovascular Conference at Snowmass sponsored by the American College of Cardiology.
However, the cautionary Dutch study that influenced the 2011 guidelines is considered controversial, he explained. It was small – just 91 patients – and the operators used twice the normal volume of alcohol, with a resultant much larger, potentially arrhythmogenic myocardial ablation scar. So, many experts have been eagerly awaiting additional long-term studies. And that long-sought data has recently been piling up. Since the 2011 guidelines, six long-term studies have been published, including one led by Dr. Sorajja (Circulation. 2012 Nov 13;126[20]:2374-80). The results have been consistently favorable, with 5-year survival rates of 87%-96%, in line with rates in the general population.
The largest of these studies included 1,197 patients who underwent ASA at seven centers in four European countries. The 30-day mortality and pacemaker implantation rates were significantly lower in patients aged up to 50 years, compared with those aged 65 and up. The annual mortality rate during a mean follow-up of 5.4 years was 1% in patients age 50 years and younger, 2.1% in those aged 51-64, and 5.1% in the oldest group. Arrhythmic events occurred at a rate of about 1% per year in all three age groups. And 95% of patients in the youngest group were in New York Heart Association class I or II at last follow-up (JACC Cardiovasc Interv. 2017 Jun 12;10[11]:1134-43).
In an accompanying editorial, Michael A. Fifer, MD, of Massachusetts General Hospital, Boston, commented that “high-volume surgical myectomy centers are few and far between” and there is “a clear inverse relation between [surgical] procedure volume and outcomes.”
The study “provides the most robust data to date regarding the outcomes of ASA in younger patients, precisely the type of data that were missing at the time of writing of the ACCF/AHA and European Society of Cardiology guidelines. Given the favorable outcomes of ASA in this age group, and the unavailability of high-volume myectomy programs in many geographic regions, the time has come to liberalize the indication for ASA in younger patients,” declared Dr. Fifer (JACC Cardiovasc Interv. 2017 Jun 12;10[11]:1144-6).
The second-largest long-term study of ASA was a recent report on 952 German patients with a minimum 6-year follow-up. The estimated 5-, 10-, and 15-year survival rates were 95.8%, 88.3%, and 79.7%, respectively. Estimated survival free of cardiac events was 98.9% at 5 years, 97.0% at 10 years, and 96.5% at 15 years. About 5% of patients received an implantable cardioverter defibrillator.
The investigators concluded, “In this study, PTSMA [percutaneous transluminal septal myocardial ablation] could be proofed as a safe procedure with ongoing symptomatic improvement and excellent long-term survival. Therefore, PTSMA is a reasonable alternative to surgical myectomy in HOCM.” (J Am Coll Cardiol. 2018 Dec 18;72[24]:3087-94) It’s way too early in the ACC/AHA guideline revision process to say what the new recommendations will be, according to Dr. Sorajja.
One unsettled issue, in his view, is whether ASA outcomes are significantly better in high-volume centers. A study of all 11,248 patients who underwent surgical myectomy of ASA during 2003-2011 in a large U.S. inpatient database concluded that undergoing surgical myectomy in a bottom-tertile-volume hospital was independently associated with an adjusted 210% increased risk of inpatient all-cause mortality and a 280% increased risk of bleeding, but that being in the lowest tertile of ASA hospital volume wasn’t independently associated with increased risk after adjustment for potential confounders (JAMA Cardiol. 2016 Jun 1;1:[3]:324-32).
However, Dr. Sorajja indicated he didn’t find the statistically adjusted results in the ASA cohort persuasive.
“I will tell you that the favorable results in the long-term studies came from hospitals in the highest-volume tertile,” the cardiologist said.
At present, he considers surgical myectomy the gold standard therapy. With well-selected patients for ASA – that is, those for whom imaging has identified an appropriate septal artery for delivery of the alcohol, along with no more than 24 mm of septal hypertrophy so the alcohol dose can be limited to a maximum of 20-25 cc – it’s reasonable to expect gradient relief in more than 90% of patients, surgical-like results with optimal relief of left ventricular outflow tract obstruction and a residual gradient of less than 10 mm Hg in about 75%, and a procedural mortality of about 1%, he said.
Dr. Sorajja reported receiving research funding from Abbott Structural, Boston Scientific, Edwards Lifesciences, and Medtronic, and serving as a consultant to those companies and several others.
EXPERT ANALYSIS FROM ACC SNOWMASS 2019
Update: MS in Minority Populations
Click here to read the supplement.
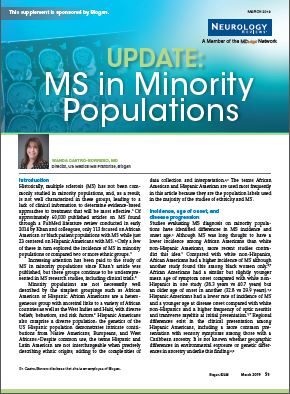
Historically, multiple sclerosis (MS) has not been commonly studied in minority populations. However, important challenges must be overcome to provide optimal MS treatment in this patient population. In this supplement from Neurology Reviews, Dr. Castro-Borrero discusses MS in African Americans and Hispanic Americans, including:
- Incidence, age of onset, and disease progression
- Barriers to optimal treatment
- Recommendations for improved MS management
About the Author
Click here to read the supplement.
Historically, multiple sclerosis (MS) has not been commonly studied in minority populations. However, important challenges must be overcome to provide optimal MS treatment in this patient population. In this supplement from Neurology Reviews, Dr. Castro-Borrero discusses MS in African Americans and Hispanic Americans, including:
- Incidence, age of onset, and disease progression
- Barriers to optimal treatment
- Recommendations for improved MS management
About the Author
Unilateral Facial Papules and Plaques
The Diagnosis: Unilateral Dermatomal Trichoepithelioma
Adnexal lesions presenting with a linear and/or dermatomal pattern rarely have been reported. Bolognia et al1 performed a comprehensive review of Blaschko lines and skin conditions that follow such a pattern. The authors found that adnexal-related lesions included linear nevus comedonicus, linear basal cell nevus with comedones (linear basaloid follicular hamartoma), unilateral nevoid basal cell carcinoma (BCC), linear trichoepithelioma, linear trichodiscoma, linear hamartoma of the follicular infundibulum, nevus sebaceous, syringocystadenoma papilliferum, porokeratotic eccrine ostial and dermal duct nevus, linear eccrine poroma, linear spiradenoma, linear syringoma, and linear eccrine syringofibroadenoma.1
Trichoepithelioma is a hair follicle-related neoplastic lesion presenting most commonly as the autosomal-dominant multiple familial type with lesions mainly centered on the face. Initial genetic studies associated the disease with loss of heterozygosity in the 9p21 region and further studies identified mutations in the CYLD (cylindromatosis [turban tumor syndrome]) gene on chromosome 16q12-q13.2,3 Unilateral, linear, and dermatomal forms of trichoepithelioma rarely are reported. In 1986, Geffner et al4 reported a case of linear and dermatomal trichoepithelioma in a 10-year-old girl. In addition to discrete solitary lesions affecting the face, she developed lesions on the left shoulder, left side of the trunk, and left lower leg following dermatomal distribution. In 2006, 2 cases of dermatomal trichoepitheliomas affecting the face in children, as in our case, were reported.5,6 Another case involving the neck was reported in 2016.7 Although classic multiple familial trichoepithelioma can be part of conditions such as Brooke-Spiegler8 and Rombo syndromes,9 no syndromal association has been reported thus far with the unilateral, linear, or dermatomal variants.
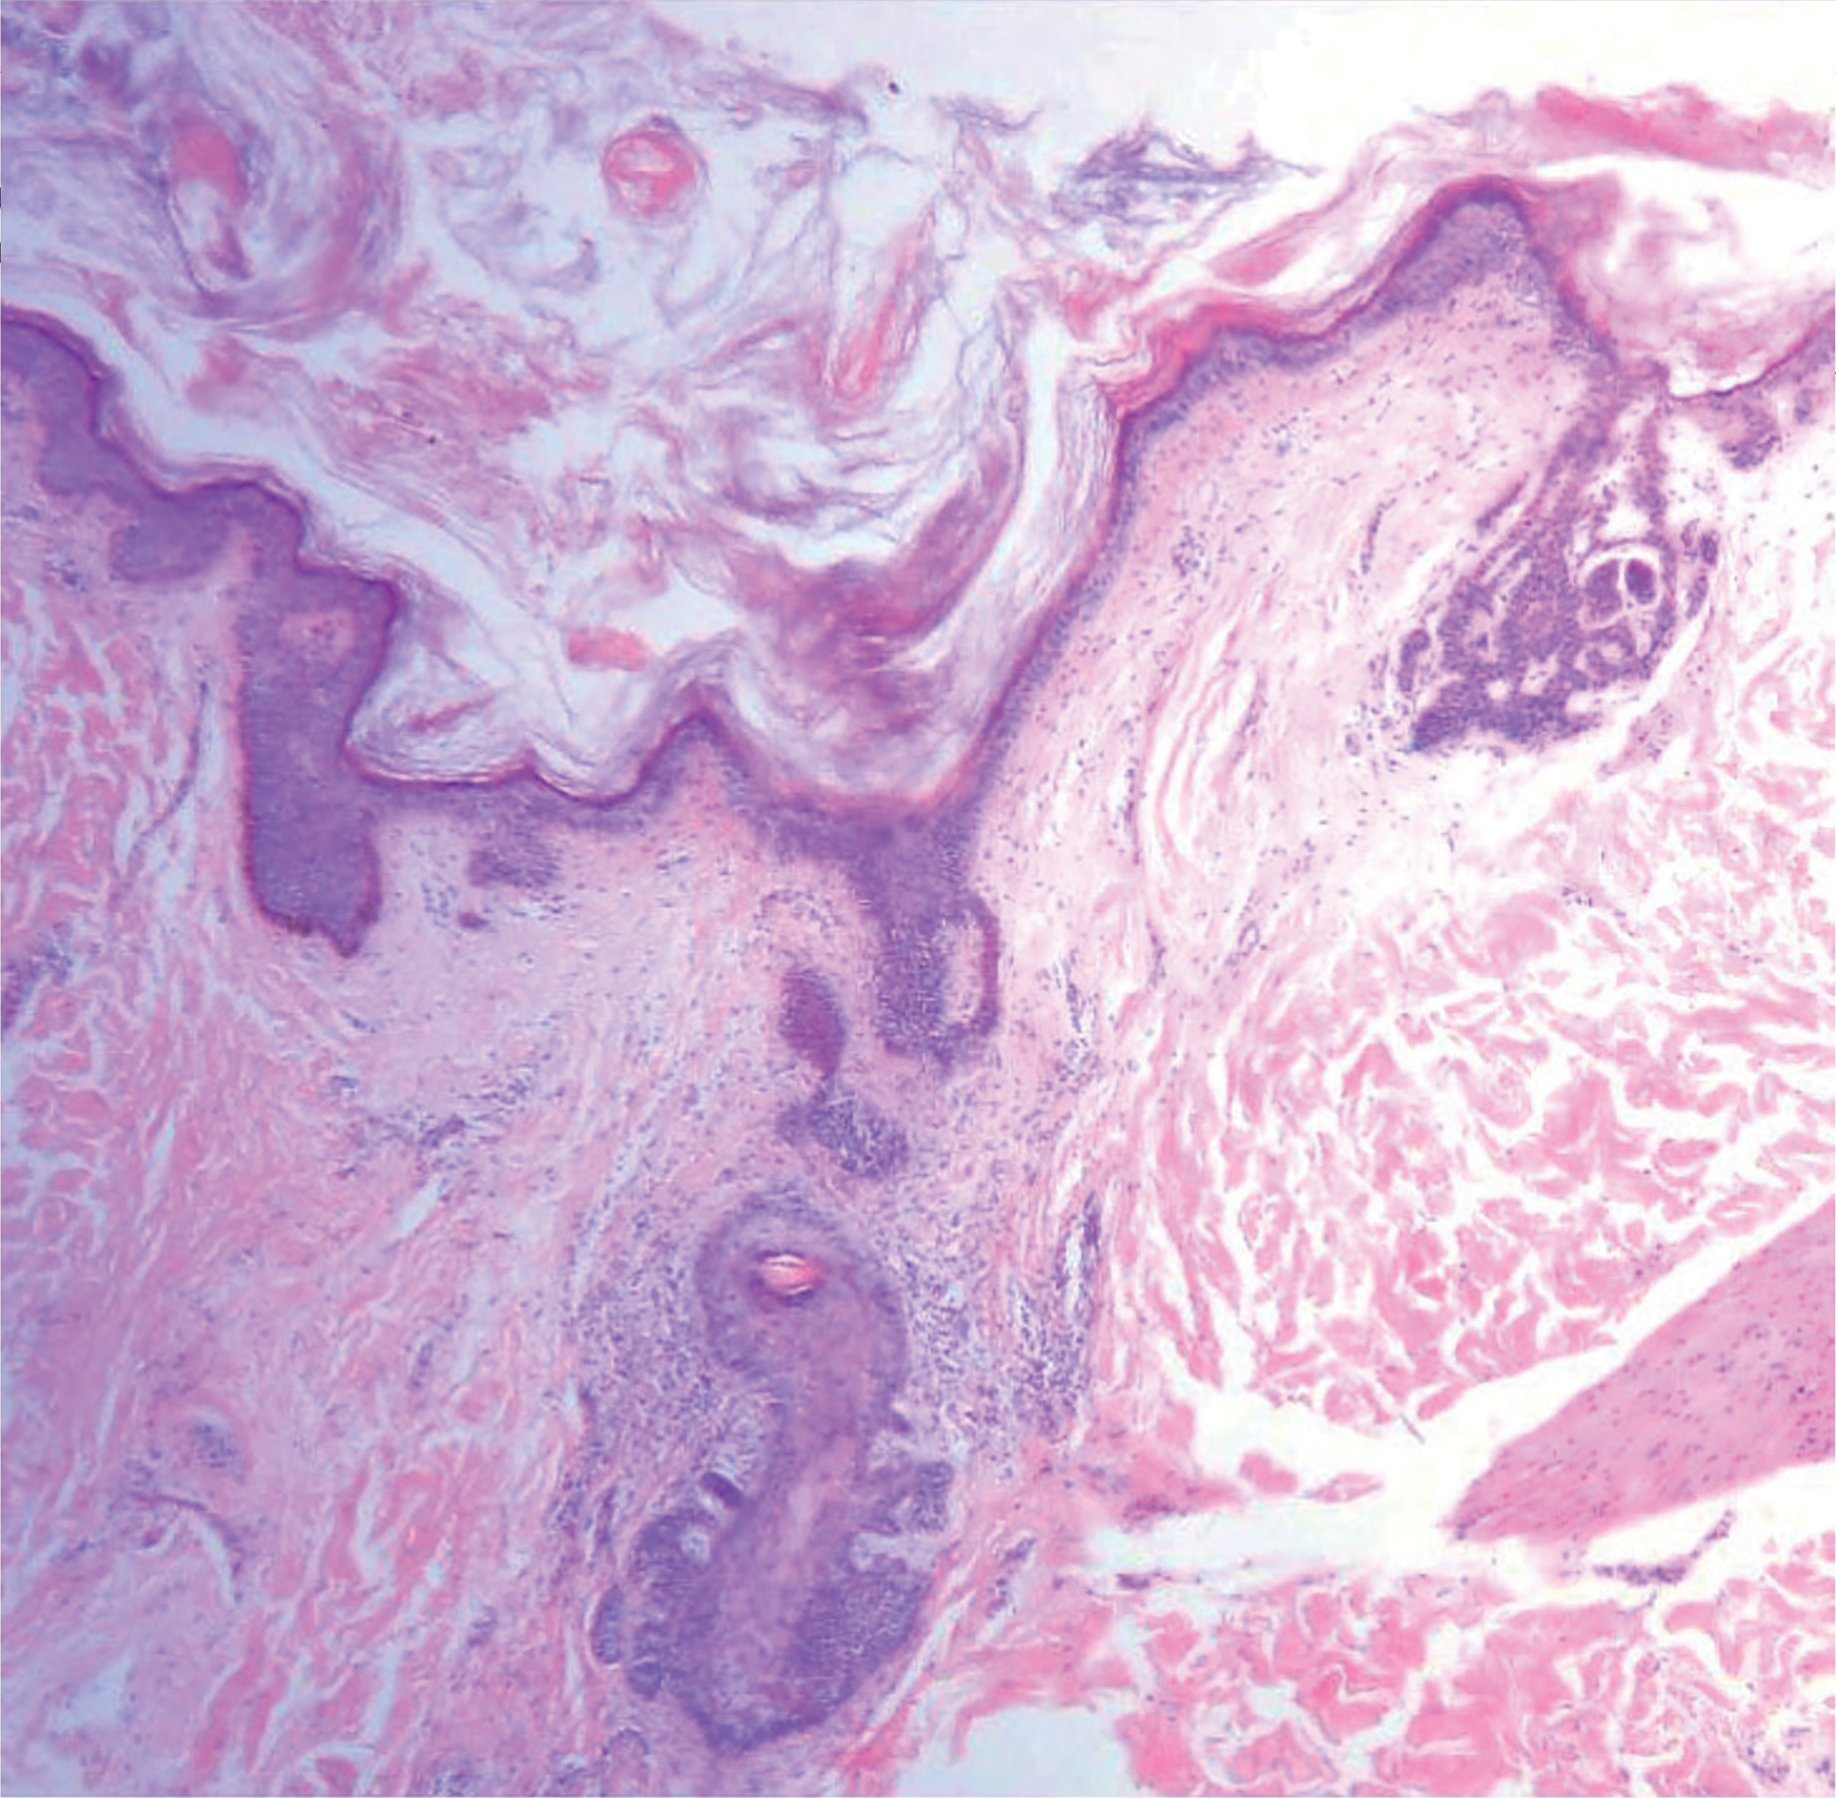
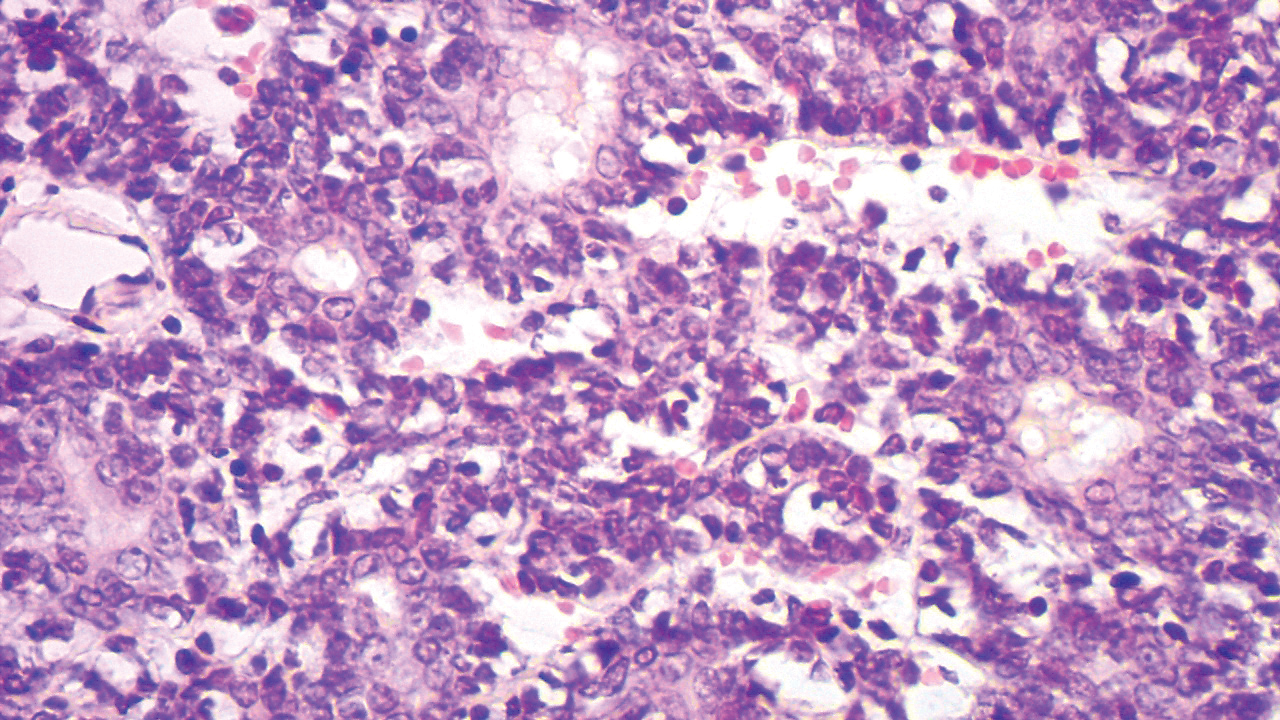
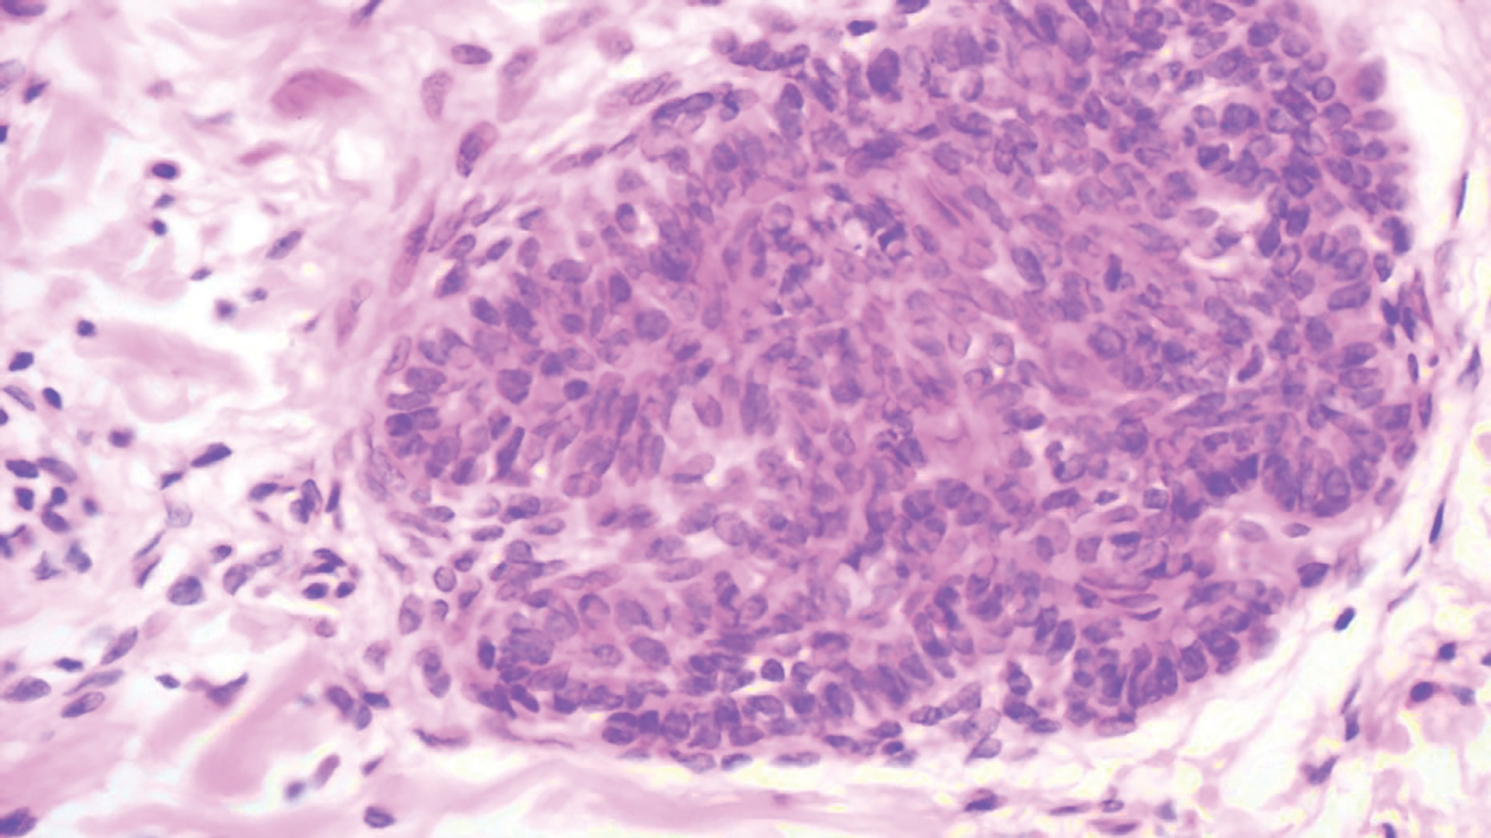
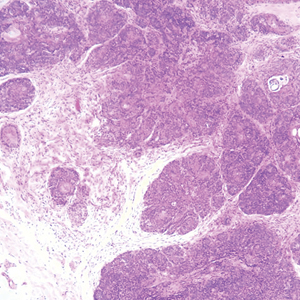
Our case showed typical histopathologic features of trichoepithelioma, including discrete islands of basaloid cells in the dermis set in a conspicuous fibroblastic stroma. Focal connection with the epidermis was present. Most of the islands showed peripheral palisading and horn cysts lined by eosinophilic cells. The fibroblastic component was tightly adherent to the epithelial component, and only stromal clefts were detected. Papillary mesenchymal bodies also were detected as oval aggregates of fibroblastic cells invaginating into epithelial islands to form hair papillae.
Histopathologically, the 2 most important differential diagnoses of trichoepithelioma include BCC and basaloid follicular hamartoma. In differentiating BCC from trichoepithelioma, the presence of dense fibroblastic stroma and papillary mesenchymal bodies characterize trichoepithelioma, while a fibromucinous stroma with mucinous retraction artifacts and clefting between the basaloid islands and the stroma characterize BCC (Figure 1).10 Immunohistochemical studies using antibodies against Bcl-2, CD34, CD10, androgen receptor, Ki-67, cytokeratin 19, and PHLDA1 (pleckstrin homologylike domain family A member 1) have reportedly been utilized to differentiate trichoepithelioma from BCC.11,12 Basaloid follicular hamartoma is characterized by thin anastomosing strands and branching cords of undifferentiated basaloid cells that replace or associate hair follicles in a latticelike pattern (Figure 2). The strands usually are vertically oriented perpendicular to the epidermis. Peripheral palisading is possible, and the basaloid strands are surrounded with cellular connective tissue stroma.13 Tumor islands in eccrine poroma show broad connections with the epidermis and are composed of poroid cells that show evident ductal differentiation with eosinophilic cuticles (Figure 3).14 Spiradenoma is characterized by capsulated deep-seated tumorous nodules not connected with the epidermis and composed of light and dark cells with ductal differentiation and vascular stroma (Figure 4). Scattered lymphocytes within the tumor lobules and in the stroma also are seen. Eosinophilic hyaline globules rarely can be present.15


Many pathologists consider trichoepithelioma as the superficial variant of trichoblastoma. According to the recent World Health Organization classification of benign tumors with follicular differentiation, trichoepithelioma is considered synonymous with trichoblastoma.16
Trichoepitheliomas are benign tumors, and therapy is mainly directed at removal for cosmetic purposes. Several methods of removal are available including electrocautery, laser therapy, and surgery. Awareness of the possible dermatomal distribution of hair follicle and other adnexal-related conditions is important, and such lesions should be thought of in the differential diagnosis of unilateral and/or dermatomal lesions.
- Bolognia JL, Orlow SJ, Glick SA. Lines of Blaschko. J Am Acad Dermatol. 1994;31(2, pt 1):157-190.
- Harada H, Hashimoto K, Ko MS. The gene for multiple familial trichoepithelioma maps to chromosome 9p21. J Invest Dermatol. 1996;107:41-43.
- Zheng G, Hu L, Huang W, et al. CYLD mutation causes multiple familial trichoepithelioma in three Chinese families. Hum Mutat. 2004;23:400.
- Geffner RE, Goslen JB, Santa Cruz DJ. Linear and dermatomal trichoepitheliomas. J Am Acad Dermatol. 1986;14(5, pt 2):927-930.
- Chang YC, Colome-Grimmer M, Kelly E. Multiple trichoepitheliomas in the lines of Blaschko. Pediatr Dermatol. 2006;23:149-151.
- Strauss RM, Merchant WJ, Stainforth JM, et al. Unilateral naevoid trichoepitheliomas on the face of a child. Clin Exp Dermatol. 2006;6:778-780.
- Laska AJ, Belli RA, Kobayashi TT. Linear trichoepithelioma on the neck of a 15-year-old girl. Dermatol Online J. 2016;22. pii:13030/qt87b6h4q8.
- Rasmussen JE. A syndrome of trichoepitheliomas, milia and cylindroma. Arch Dermatol. 1975;111:610-614.
- Michaelson G, Olsson E, Westermark P. The Rombo syndrome. Acta Derm Venereol. 1981;61:497-503.
- Brooke JD, Fitzpatrick JE, Golitz LE. Papillary mesenchymal bodies: a histologic finding useful in differentiating trichoepitheliomas from basal cell carcinomas. J Am Acad Dermatol. 1989;21(3, pt 1):523-528.
- Mostafa NA, Assaf M, Elhakim S, et al. Diagnostic accuracy of immunohistochemical markers in differentiation between basal cell carcinoma and trichoepithelioma in small biopsy specimens. J Cutan Pathol. 2018;45:807-816.
- Poniecka AW, Alexis JB. An immunohistochemical study of basal cell carcinoma and trichoepithelioma. Am J Dermatopathol. 1999;21:332-336.
- Abdel-Halim MRE, Fawzy M, Saleh M, et al. Linear unilateral basal cell nevus with comedones (linear nevoid basaloid follicular hamartoma): a case report. J Egypt Womens Dermatol Soc. 2016;13:46-48.
- Hyman AB, Brownstein MH. Eccrine poroma: analysis of 45 new cases. Dermatologica. 1969;138:28-38.
- Mambo NC. Eccrine spiradenoma: clinical and pathologic study of 49 tumors. J Cutan Pathol. 1983;10:312-320.
- Kutzner H, Kaddu S, Kanitakis J, et al. Trichoblastoma. In: Elder D, Massi D, Scolyer RA, et al, eds. WHO Classification of Skin Tumours. 4th ed. Lyon, France: IARC; 2018.
The Diagnosis: Unilateral Dermatomal Trichoepithelioma
Adnexal lesions presenting with a linear and/or dermatomal pattern rarely have been reported. Bolognia et al1 performed a comprehensive review of Blaschko lines and skin conditions that follow such a pattern. The authors found that adnexal-related lesions included linear nevus comedonicus, linear basal cell nevus with comedones (linear basaloid follicular hamartoma), unilateral nevoid basal cell carcinoma (BCC), linear trichoepithelioma, linear trichodiscoma, linear hamartoma of the follicular infundibulum, nevus sebaceous, syringocystadenoma papilliferum, porokeratotic eccrine ostial and dermal duct nevus, linear eccrine poroma, linear spiradenoma, linear syringoma, and linear eccrine syringofibroadenoma.1
Trichoepithelioma is a hair follicle-related neoplastic lesion presenting most commonly as the autosomal-dominant multiple familial type with lesions mainly centered on the face. Initial genetic studies associated the disease with loss of heterozygosity in the 9p21 region and further studies identified mutations in the CYLD (cylindromatosis [turban tumor syndrome]) gene on chromosome 16q12-q13.2,3 Unilateral, linear, and dermatomal forms of trichoepithelioma rarely are reported. In 1986, Geffner et al4 reported a case of linear and dermatomal trichoepithelioma in a 10-year-old girl. In addition to discrete solitary lesions affecting the face, she developed lesions on the left shoulder, left side of the trunk, and left lower leg following dermatomal distribution. In 2006, 2 cases of dermatomal trichoepitheliomas affecting the face in children, as in our case, were reported.5,6 Another case involving the neck was reported in 2016.7 Although classic multiple familial trichoepithelioma can be part of conditions such as Brooke-Spiegler8 and Rombo syndromes,9 no syndromal association has been reported thus far with the unilateral, linear, or dermatomal variants.
Our case showed typical histopathologic features of trichoepithelioma, including discrete islands of basaloid cells in the dermis set in a conspicuous fibroblastic stroma. Focal connection with the epidermis was present. Most of the islands showed peripheral palisading and horn cysts lined by eosinophilic cells. The fibroblastic component was tightly adherent to the epithelial component, and only stromal clefts were detected. Papillary mesenchymal bodies also were detected as oval aggregates of fibroblastic cells invaginating into epithelial islands to form hair papillae.
Histopathologically, the 2 most important differential diagnoses of trichoepithelioma include BCC and basaloid follicular hamartoma. In differentiating BCC from trichoepithelioma, the presence of dense fibroblastic stroma and papillary mesenchymal bodies characterize trichoepithelioma, while a fibromucinous stroma with mucinous retraction artifacts and clefting between the basaloid islands and the stroma characterize BCC (Figure 1).10 Immunohistochemical studies using antibodies against Bcl-2, CD34, CD10, androgen receptor, Ki-67, cytokeratin 19, and PHLDA1 (pleckstrin homologylike domain family A member 1) have reportedly been utilized to differentiate trichoepithelioma from BCC.11,12 Basaloid follicular hamartoma is characterized by thin anastomosing strands and branching cords of undifferentiated basaloid cells that replace or associate hair follicles in a latticelike pattern (Figure 2). The strands usually are vertically oriented perpendicular to the epidermis. Peripheral palisading is possible, and the basaloid strands are surrounded with cellular connective tissue stroma.13 Tumor islands in eccrine poroma show broad connections with the epidermis and are composed of poroid cells that show evident ductal differentiation with eosinophilic cuticles (Figure 3).14 Spiradenoma is characterized by capsulated deep-seated tumorous nodules not connected with the epidermis and composed of light and dark cells with ductal differentiation and vascular stroma (Figure 4). Scattered lymphocytes within the tumor lobules and in the stroma also are seen. Eosinophilic hyaline globules rarely can be present.15
Many pathologists consider trichoepithelioma as the superficial variant of trichoblastoma. According to the recent World Health Organization classification of benign tumors with follicular differentiation, trichoepithelioma is considered synonymous with trichoblastoma.16
Trichoepitheliomas are benign tumors, and therapy is mainly directed at removal for cosmetic purposes. Several methods of removal are available including electrocautery, laser therapy, and surgery. Awareness of the possible dermatomal distribution of hair follicle and other adnexal-related conditions is important, and such lesions should be thought of in the differential diagnosis of unilateral and/or dermatomal lesions.
- Bolognia JL, Orlow SJ, Glick SA. Lines of Blaschko. J Am Acad Dermatol. 1994;31(2, pt 1):157-190.
- Harada H, Hashimoto K, Ko MS. The gene for multiple familial trichoepithelioma maps to chromosome 9p21. J Invest Dermatol. 1996;107:41-43.
- Zheng G, Hu L, Huang W, et al. CYLD mutation causes multiple familial trichoepithelioma in three Chinese families. Hum Mutat. 2004;23:400.
- Geffner RE, Goslen JB, Santa Cruz DJ. Linear and dermatomal trichoepitheliomas. J Am Acad Dermatol. 1986;14(5, pt 2):927-930.
- Chang YC, Colome-Grimmer M, Kelly E. Multiple trichoepitheliomas in the lines of Blaschko. Pediatr Dermatol. 2006;23:149-151.
- Strauss RM, Merchant WJ, Stainforth JM, et al. Unilateral naevoid trichoepitheliomas on the face of a child. Clin Exp Dermatol. 2006;6:778-780.
- Laska AJ, Belli RA, Kobayashi TT. Linear trichoepithelioma on the neck of a 15-year-old girl. Dermatol Online J. 2016;22. pii:13030/qt87b6h4q8.
- Rasmussen JE. A syndrome of trichoepitheliomas, milia and cylindroma. Arch Dermatol. 1975;111:610-614.
- Michaelson G, Olsson E, Westermark P. The Rombo syndrome. Acta Derm Venereol. 1981;61:497-503.
- Brooke JD, Fitzpatrick JE, Golitz LE. Papillary mesenchymal bodies: a histologic finding useful in differentiating trichoepitheliomas from basal cell carcinomas. J Am Acad Dermatol. 1989;21(3, pt 1):523-528.
- Mostafa NA, Assaf M, Elhakim S, et al. Diagnostic accuracy of immunohistochemical markers in differentiation between basal cell carcinoma and trichoepithelioma in small biopsy specimens. J Cutan Pathol. 2018;45:807-816.
- Poniecka AW, Alexis JB. An immunohistochemical study of basal cell carcinoma and trichoepithelioma. Am J Dermatopathol. 1999;21:332-336.
- Abdel-Halim MRE, Fawzy M, Saleh M, et al. Linear unilateral basal cell nevus with comedones (linear nevoid basaloid follicular hamartoma): a case report. J Egypt Womens Dermatol Soc. 2016;13:46-48.
- Hyman AB, Brownstein MH. Eccrine poroma: analysis of 45 new cases. Dermatologica. 1969;138:28-38.
- Mambo NC. Eccrine spiradenoma: clinical and pathologic study of 49 tumors. J Cutan Pathol. 1983;10:312-320.
- Kutzner H, Kaddu S, Kanitakis J, et al. Trichoblastoma. In: Elder D, Massi D, Scolyer RA, et al, eds. WHO Classification of Skin Tumours. 4th ed. Lyon, France: IARC; 2018.

A 9-year-old boy presented with a slowly progressive lesion of 5 years’ duration affecting only the left side of the face in a dermatomal pattern. The patient denied any symptoms and had no other anomalies or family history of similar lesions. On physical examination the lesion was found to span a 12×7-cm area of the lateral half of the left cheek and was composed of multiple variable-sized, pinkish to flesh-colored papules that coalesced in some areas to form small plaques. Few milialike cysts were present. One papule was biopsied.
AFib, CVD risks similar after ustekinumab and TNF inhibitors in psoriatic patients
Patients with psoriasis or psoriatic arthritis who started ustekinumab (Stelara) versus a tumor necrosis factor inhibitor had no differences in the overall risks of incident atrial fibrillation (AFib) or major adverse cardiovascular events (MACE), according to authors of a retrospective cohort study of two commercial insurance databases.
Subgroup analyses in the study also revealed “no statistically significant heterogeneity” in risk of AFib or MACE by age, sex, or presence of diabetes, Moa P. Lee, PharmD, of Brigham and Women’s Hospital and Harvard Medical School, Boston, and her coauthors reported in JAMA Dermatology.
These findings provide additional evidence on cardiovascular risks with ustekinumab versus other treatments.
The findings are consistent with previous observations of a small but nonsignificant increase in cardiovascular disease among patients with psoriatic disease and provide new insight into the risk of AFib with psoriatic treatments with the two therapies, Dr. Lee and her colleagues wrote.
The retrospective study of two U.S. commercial health care claims databases included 60,028 adult patients with psoriasis or psoriatic arthritis who initiated therapy with ustekinumab (n = 9,071) or a tumor necrosis factor (TNF) inhibitor (n = 50,957), including adalimumab, certolizumab pegol, golimumab, etanercept, or infliximab. The investigators excluded any patient with an AFib diagnosis at baseline and those receiving any antiarrhythmic or anticoagulant treatment.
The incidence of AFib was 5.0 and 4.1 per 1,000 person-years in the ustekinumab and TNF inhibitor groups, respectively, with an adjusted hazard ratio of 1.08 (95% CI, 0.76-1.54). The incidence of MACE (a composite endpoint of MI, stroke, and coronary revascularization) was 6.2 and 6.1 per 1,000 person-years in the ustekinumab and TNF inhibitor groups, with an adjusted hazard ratio of 1.10 (95% CI, 0.80-1.52).
In subgroup analyses, the adjusted HR for AFib with ustekinumab versus TNF inhibitor was 1.46 (95% CI, 0.98-2.18) for patients aged 60 years and older and 1.47 (95% CI, 0.93-2.31) in patients with diabetes, the investigators wrote.
The adjusted HR for AFib with ustekinumab versus TNF inhibitors was 1.21 in men (95% CI, 0.87-1.69) and 0.82 in women (95% CI, 0.49-1.39), while for MACE, the HRs were 1.31 in men (95% CI, 0.97-1.76) and 0.91 in women (95% CI, 0.56-1.47).
“Although the risk of these cardiovascular outcomes appeared to be similar across the subpopulations included in our study, further investigations on potentially modifying treatment effects stratified by important risk factors may be warranted,” Dr. Lee and her coauthors wrote.
The study was supported by the division of pharmacoepidemiology and pharmacoeconomics at Brigham and Women’s Hospital. Several authors reported financial relationships with pharmaceutical companies marketing biologics for psoriasis and psoriatic arthritis.
SOURCE: Lee MP et al. JAMA Dermatol. 2019 Mar 27. doi: 10.1001/jamadermatol.2019.0001.
FROM JAMA DERMATOLOGY
ECHO Rheum widens rheumatology best practice care
according to the results of a qualitative and quantitative study.
Over a 9-year period, ECHO (Extension for Community Healthcare Outcomes) Rheum educated 2,230 primary care clinicians, the majority of whom were physicians (53%) or nurse practitioners (22%), and helped increase the clinicians’ confidence in managing rheumatic conditions locally while still having access to specialist guidance.
Participants in ECHO Rheum accrued a total of 1,958 CME credits between them, and 21 of 30 (70%) clinicians who participated in 2-day miniresidencies obtained online certification from the American College of Rheumatology.
“ECHO Rheum and programs like it have the potential to positively impact the national shortage of rheumatologic care for underserved patients,” Arthur Bankhurst, MD, and his associates from the University of New Mexico, Albuquerque wrote in Arthritis Care & Research. “Empowering the health care workforce by disseminating knowledge of best practice diagnosis and treatment has the potential to reduce suboptimal rheumatologic care and expand access for those suffering from rheumatologic conditions regardless of economic status or location.”
ECHO Rheum is part of the larger Project ECHO (Extension for Community Healthcare Outcomes), a program developed at UNM by gastroenterologist Sanjeev Arora, MD. Dr. Arora came up with the idea for the ECHO model in 2003 to try to improve access to best practice care for patients with hepatitis C. The potential of the model to translate across medical specialties was soon seen, however, and today, there are more than 40 teleECHO programs operating in New Mexico that also involve more than 400 community clinic sites. The ECHO model is also being used nationally, operating in more than 30 states, and globally in 31 countries.
According to information available via the Project ECHO website, “the ECHO model is not traditional ‘telemedicine’ where the specialist assumes care of the patient, but is instead telementoring, a guided practice model where the participating clinician retains responsibility for managing the patient.” The aim is to use medical education and care management to empower “clinicians everywhere to provide better care to more people, right where they live.”
The rheumatology arm of Project ECHO started in 2006 and follows the four main principles of the ECHO model: Using technology to leverage scarce resources, such as by facilitating regular educational sessions between central expert “hubs” at specialist centers and “spokes” at community practices; sharing best practice information to help reduce disparities in the quality of care; presenting and discussion around case histories; and evaluating and monitoring outcomes.
To demonstrate the effectiveness of ECHO Rheum, the team at UNM evaluated data on participants who had attended weekly teleconferencing sessions, lectures, grand rounds, and miniresidency training between June 2006 and June 2014.
The results demonstrated that “participation in ECHO Rheum provides clinicians in underresourced areas access to best practice knowledge and training in rheumatology,” Dr. Bankhurst and his coauthors observed.
Increased knowledge and confidence in managing rheumatic conditions among primary care physicians could help to reduce the ever-widening gap between the demand and supply of appropriate care. Indeed, while the projected population of adults with rheumatic disease is expected to grow to almost 67 million adults in the next 20 years, there is expected to be a shortfall of 4,700 full-time rheumatologists by 2030.
“Regular participation in teleECHO sessions creates a community of practice among rural clinicians,” the UNM team stated. Every week, participants were invited to attend a 90-minute virtual teleconference, either by video or telephone, that consisted of a brief evidence-based lecture by a subject matter expert and presentation of deidentified case histories submitted by the participants. Participants were able to obtain CME credits at no cost and learn how to use ACR-recommended disease activity measures, such as the Disease Activity Score in 28 joints.
Over the 9-year study period, 1,173 cases were presented, the majority of which (85%) reflected the three most common diagnoses seen in rheumatologic practice, namely RA (n = 715), fibromyalgia (n = 241), and systemic lupus erythematosus (n = 54). As might be expected, female cases were presented more often than male cases, as were cases involving patients aged 40-60 years, compared with other age groups.
“ECHO Rheum saw an increase in participation in 2010, when the ACR certification was offered at no cost, suggesting that ACR certification was an incentive for participation,” Dr. Bankhurst and his team observed.
In 2012, however, there was a drop-off in participation, which may have been caused by the end of funding for ACR certification or clinicians becoming “more confident in their abilities to diagnose and initiate treatment appropriately.” Clinical responsibilities may also have prevented clinicians from attending the weekly sessions.
“Although our formal collaboration with the ACR concluded when funds for this initiative came to an end, ECHO Rheum encourages clinicians to obtain certification in rheumatology and provides them with information about opportunities to offset the cost,” Dr. Bankhurst and his colleagues wrote.
Despite a decline in attendance at the weekly teleECHO sessions during the evaluation period, the UNM team believes that its continued use holds value for primary care practice. Since 2014, a further four clinicians have obtained ACR grant funding for certification and a number of the certified participants return to contribute to the weekly teleECHO sessions.
“This continued use of ECHO Rheum as a readily available resource for case presentations and acquisition of new learning about developments in treatment and medication demonstrates the long-term viability of the community of practice created by the program,” the team suggested.
“I think programs like this are going to be very important in addressing the physician shortage in rheumatology,” said Chad Deal, MD, in an interview.
Dr. Deal, who was not involved in the study, noted that such programs may work particularly well in underserved areas such as New Mexico, as shown in this study, as well as other states, such as in Alaska, North Dakota, and South Dakota. Essentially, “places where people are having to drive forever to get to a rheumatologist.”
“I like what they’ve done,” Dr. Deal said. It can make clinicians “feel much more comfortable with diagnosing and even treating inflammatory arthritis. I think that’s really important.”
It would be difficult to have harder outcomes measures, observed Dr. Deal, head of the Center for Osteoporosis and Metabolic Bone Disease and vice chair for quality and outcomes in the department of rheumatology at the Cleveland Clinic. “The goal is obviously early diagnosis and treatment of rheumatoid arthritis, let’s say, and improved outcomes, and that’s really difficult to show in any kind of program like this.”
Dr. Deal added that “maintaining any kind of program like this is difficult; physicians get busy, and like the authors note, sometimes clinicians get to a point where they are comfortable, and they don’t need it as much.”
Perhaps, these programs don’t need to run forever, he suggested. Perhaps a 1- or 2-year program may be sufficient for one group before moving on to focus on a different group of physicians.
Dr. Bankhurst and other authors of the study reported having no conflicts of interest. The work was funded by the Robert Wood Johnson Foundation, the New Mexico legislature, and the New Mexico Department of Health. Dr. Deal reported no conflicts of interest in relation to his comments.
SOURCE: Bankhurst A et al. Arthritis Care Res. 2019 Mar 30. doi: 10.1002/acr.23889.
Although there is controversy regarding a potential physician shortage in the United States, the incontrovertible fact that the number of rheumatologists is declining and the daily experience of difficulty and delay in access to rheumatologists would argue that there surely is a problem. Moreover, the variability in distribution has resulted in many smaller regions of the country having no or few practicing adult rheumatologists. While addressing rheumatologist physician shortage and distribution may be important avenues to pursue, there are many barriers to overcoming the evident lack of access. Thus, changes in the delivery of rheumatologic care are urgently needed, and increasing our ability to use primary care physicians and midlevel practitioners is one immediate avenue to address this problem.

What remains to be done, as the authors themselves note, is measurement of patient and population-level outcomes. It is clear that the demand for rheumatologic services will continue to grow, and disparities in the regional distribution of rheumatologists in the United States will exacerbate the growing limits to access. The use of the ECHO model in this study to facilitate primary care practitioners and other providers in the management of common musculoskeletal conditions, especially in underserved areas, clearly deserves further study.
Calvin R. Brown Jr., MD, is a professor of medicine in the division of rheumatology at Northwestern University, Chicago. He is the director of the rheumatology training program there.
Although there is controversy regarding a potential physician shortage in the United States, the incontrovertible fact that the number of rheumatologists is declining and the daily experience of difficulty and delay in access to rheumatologists would argue that there surely is a problem. Moreover, the variability in distribution has resulted in many smaller regions of the country having no or few practicing adult rheumatologists. While addressing rheumatologist physician shortage and distribution may be important avenues to pursue, there are many barriers to overcoming the evident lack of access. Thus, changes in the delivery of rheumatologic care are urgently needed, and increasing our ability to use primary care physicians and midlevel practitioners is one immediate avenue to address this problem.
What remains to be done, as the authors themselves note, is measurement of patient and population-level outcomes. It is clear that the demand for rheumatologic services will continue to grow, and disparities in the regional distribution of rheumatologists in the United States will exacerbate the growing limits to access. The use of the ECHO model in this study to facilitate primary care practitioners and other providers in the management of common musculoskeletal conditions, especially in underserved areas, clearly deserves further study.
Calvin R. Brown Jr., MD, is a professor of medicine in the division of rheumatology at Northwestern University, Chicago. He is the director of the rheumatology training program there.
according to the results of a qualitative and quantitative study.
Over a 9-year period, ECHO (Extension for Community Healthcare Outcomes) Rheum educated 2,230 primary care clinicians, the majority of whom were physicians (53%) or nurse practitioners (22%), and helped increase the clinicians’ confidence in managing rheumatic conditions locally while still having access to specialist guidance.
Participants in ECHO Rheum accrued a total of 1,958 CME credits between them, and 21 of 30 (70%) clinicians who participated in 2-day miniresidencies obtained online certification from the American College of Rheumatology.
“ECHO Rheum and programs like it have the potential to positively impact the national shortage of rheumatologic care for underserved patients,” Arthur Bankhurst, MD, and his associates from the University of New Mexico, Albuquerque wrote in Arthritis Care & Research. “Empowering the health care workforce by disseminating knowledge of best practice diagnosis and treatment has the potential to reduce suboptimal rheumatologic care and expand access for those suffering from rheumatologic conditions regardless of economic status or location.”
ECHO Rheum is part of the larger Project ECHO (Extension for Community Healthcare Outcomes), a program developed at UNM by gastroenterologist Sanjeev Arora, MD. Dr. Arora came up with the idea for the ECHO model in 2003 to try to improve access to best practice care for patients with hepatitis C. The potential of the model to translate across medical specialties was soon seen, however, and today, there are more than 40 teleECHO programs operating in New Mexico that also involve more than 400 community clinic sites. The ECHO model is also being used nationally, operating in more than 30 states, and globally in 31 countries.
According to information available via the Project ECHO website, “the ECHO model is not traditional ‘telemedicine’ where the specialist assumes care of the patient, but is instead telementoring, a guided practice model where the participating clinician retains responsibility for managing the patient.” The aim is to use medical education and care management to empower “clinicians everywhere to provide better care to more people, right where they live.”
The rheumatology arm of Project ECHO started in 2006 and follows the four main principles of the ECHO model: Using technology to leverage scarce resources, such as by facilitating regular educational sessions between central expert “hubs” at specialist centers and “spokes” at community practices; sharing best practice information to help reduce disparities in the quality of care; presenting and discussion around case histories; and evaluating and monitoring outcomes.
To demonstrate the effectiveness of ECHO Rheum, the team at UNM evaluated data on participants who had attended weekly teleconferencing sessions, lectures, grand rounds, and miniresidency training between June 2006 and June 2014.
The results demonstrated that “participation in ECHO Rheum provides clinicians in underresourced areas access to best practice knowledge and training in rheumatology,” Dr. Bankhurst and his coauthors observed.
Increased knowledge and confidence in managing rheumatic conditions among primary care physicians could help to reduce the ever-widening gap between the demand and supply of appropriate care. Indeed, while the projected population of adults with rheumatic disease is expected to grow to almost 67 million adults in the next 20 years, there is expected to be a shortfall of 4,700 full-time rheumatologists by 2030.
“Regular participation in teleECHO sessions creates a community of practice among rural clinicians,” the UNM team stated. Every week, participants were invited to attend a 90-minute virtual teleconference, either by video or telephone, that consisted of a brief evidence-based lecture by a subject matter expert and presentation of deidentified case histories submitted by the participants. Participants were able to obtain CME credits at no cost and learn how to use ACR-recommended disease activity measures, such as the Disease Activity Score in 28 joints.
Over the 9-year study period, 1,173 cases were presented, the majority of which (85%) reflected the three most common diagnoses seen in rheumatologic practice, namely RA (n = 715), fibromyalgia (n = 241), and systemic lupus erythematosus (n = 54). As might be expected, female cases were presented more often than male cases, as were cases involving patients aged 40-60 years, compared with other age groups.
“ECHO Rheum saw an increase in participation in 2010, when the ACR certification was offered at no cost, suggesting that ACR certification was an incentive for participation,” Dr. Bankhurst and his team observed.
In 2012, however, there was a drop-off in participation, which may have been caused by the end of funding for ACR certification or clinicians becoming “more confident in their abilities to diagnose and initiate treatment appropriately.” Clinical responsibilities may also have prevented clinicians from attending the weekly sessions.
“Although our formal collaboration with the ACR concluded when funds for this initiative came to an end, ECHO Rheum encourages clinicians to obtain certification in rheumatology and provides them with information about opportunities to offset the cost,” Dr. Bankhurst and his colleagues wrote.
Despite a decline in attendance at the weekly teleECHO sessions during the evaluation period, the UNM team believes that its continued use holds value for primary care practice. Since 2014, a further four clinicians have obtained ACR grant funding for certification and a number of the certified participants return to contribute to the weekly teleECHO sessions.
“This continued use of ECHO Rheum as a readily available resource for case presentations and acquisition of new learning about developments in treatment and medication demonstrates the long-term viability of the community of practice created by the program,” the team suggested.
“I think programs like this are going to be very important in addressing the physician shortage in rheumatology,” said Chad Deal, MD, in an interview.
Dr. Deal, who was not involved in the study, noted that such programs may work particularly well in underserved areas such as New Mexico, as shown in this study, as well as other states, such as in Alaska, North Dakota, and South Dakota. Essentially, “places where people are having to drive forever to get to a rheumatologist.”
“I like what they’ve done,” Dr. Deal said. It can make clinicians “feel much more comfortable with diagnosing and even treating inflammatory arthritis. I think that’s really important.”
It would be difficult to have harder outcomes measures, observed Dr. Deal, head of the Center for Osteoporosis and Metabolic Bone Disease and vice chair for quality and outcomes in the department of rheumatology at the Cleveland Clinic. “The goal is obviously early diagnosis and treatment of rheumatoid arthritis, let’s say, and improved outcomes, and that’s really difficult to show in any kind of program like this.”
Dr. Deal added that “maintaining any kind of program like this is difficult; physicians get busy, and like the authors note, sometimes clinicians get to a point where they are comfortable, and they don’t need it as much.”
Perhaps, these programs don’t need to run forever, he suggested. Perhaps a 1- or 2-year program may be sufficient for one group before moving on to focus on a different group of physicians.
Dr. Bankhurst and other authors of the study reported having no conflicts of interest. The work was funded by the Robert Wood Johnson Foundation, the New Mexico legislature, and the New Mexico Department of Health. Dr. Deal reported no conflicts of interest in relation to his comments.
SOURCE: Bankhurst A et al. Arthritis Care Res. 2019 Mar 30. doi: 10.1002/acr.23889.
FROM Arthritis care & research
Key clinical point: Primary care clinician confidence in managing rheumatic conditions can be increased by the ECHO Rheum program.
Major finding: Over a 9-year period, 2,230 primary care clinicians were educated via the program, with 21 of 30 (70%) participants obtaining American College of Rheumatology online accreditation.
Study details: A qualitative study looking at the success of a telementoring and medical education program in New Mexico between June 2006 and June 2014.
Disclosures: Dr. Bankhurst and other authors of the study reported having no conflicts of interest. The work was funded by the Robert Wood Johnson Foundation, the New Mexico legislature, and the New Mexico Department of Health. Dr. Deal reported no conflicts of interest in relation to his comments.
Source: Bankhurst A et al. Arthritis Care Res. 2019 Mar 30. doi: 10.1002/acr.23889.
IVC filter placement increases mortality in some VTE patients
Clinical question: How does inferior vena cava (IVC) filter placement affect 30-day mortality in patients with venous thromboembolism (VTE) with increased risk of bleeding when anticoagulation is not feasible?
Background: Standard treatment for VTE, including deep venous thrombosis (DVT) and pulmonary embolism (PE), is anticoagulation. However, for patients with active bleeding or increased risk of bleeding, anticoagulation may be contraindicated. In these circumstances, placing an IVC filter is recommended by major professional societies; however, the mortality benefit of IVC filter placement is uncertain.
Study design: A retrospective cohort study.
Setting: State Inpatient and Emergency Department Databases from California, Florida, and New York hospitals from 2005 to 2012.
Synopsis: The authors compared the 30-day mortality rates in 45,771 hospitalized adult patients with inpatient diagnosis codes of PE and/or DVT, as well as a contraindication to anticoagulation, who underwent IVC filter placement with 80,259 similar patients who did not undergo IVC filter placement. Baseline characteristics and coexisting conditions were similar in the two populations. The authors found that patients with IVC filter placement had an increased risk of 30-day mortality, compared with patients without an IVC filter placed (HR, 1.18; 95% CI, 1.13-1.22; P less than .001).
This study used observational data derived from reimbursement codes, which lacked unmeasured confounders (for example, severity of VTE and fragility score), so randomized, controlled trials are required to confirm the results. Nevertheless, this study should prompt physicians to carefully consider decisions to place an IVC filter in the setting of a contraindication to anticoagulation.
Bottom line: IVC filter placement in patients with VTE and contraindication for anticoagulation was associated with an increased 30-day mortality. Randomized, controlled trials are required to confirm the observed results.
Citation: Turner TE et al. Association of inferior vena cava filter placement for venous thromboembolic disease and a contraindication to anticoagulation with 30-day mortality. JAMA Network Open. 2018;1(3):e180452.
Dr. Kobaidze is an assistant professor of medicine in the division of hospital medicine at Emory University, Atlanta.
EULAR takes SLE guidance to the next level

The goal was “to update the EULAR recommendations for the management of systemic lupus erythematosus [SLE], based on literature review and expert consensus,” said authors led by Antonis Fanouriakis, MD, PhD, of the rheumatology and clinical immunology unit at Attikon University Hospital, Athens.
The team accomplished their aim in 33 recommendations – about twice as many as in 2008 – covering goals of therapy, treatment, specific manifestations, and comorbidities (Ann Rheum Dis. 2019 Mar 29. doi: 10.1136/annrheumdis-2019-215089).
A lot has changed in the past 11 years, and the new guidelines reflect that. Biologics, for instance, were barely mentioned in 2008, except as a topic for future research. The new document makes a strong recommendation for add-on belimumab (Benlysta) to be considered in persistently active or flaring extrarenal disease, and rituximab (Rituxan) for organ-threatening, refractory disease.
The group now also makes a strong recommendation for hydroxychloroquine (Plaquenil) for all lupus patients, barring contraindications, at a dose not exceeding 5 mg per kg real body weight, with ophthalmologic screening performed at baseline, after 5 years, and yearly thereafter. It also calls for routine antiphospholipid antibody testing.
Calcineurin inhibitors weren’t mentioned at all in 2008, but they show up in the new document with a moderate recommendation as first-line topical options for skin disease, along with glucocorticoids. The authors also made a moderate recommendation for diagnostic kidney biopsy, calling it “essential” to catch renal involvement early; EULAR was less certain in 2008. Also new in 2019, and barely mentioned in 2008, there’s an entire section on hematologic manifestations, as well as advice on thalidomide for cutaneous disease.
For hematologic disease, the group makes a weak recommendation for pulsed intravenous methylprednisolone and/or intravenous immunoglobulin, with mycophenolate, azathioprine, or cyclosporine for maintenance. Cyclophosphamide, along with rituximab, are options for severe hematologic cases.
Cardiovascular disease, like biologics, was mentioned mostly in 2008 as a topic for future research; the new guidelines contain an entire section on the issue. There’s a strong recommendation for regular assessment of traditional and disease-related risk factors, including persistently active disease; increased disease duration; medium or high titers of antiphospholipid antibodies; renal involvement; and chronic glucocorticoid use. High-risk people, the document notes, “may be candidates for preventative strategies as in the general population,” including low-dose aspirin and statins.
The new guidance is also more certain about mycophenolate for renal disease, with a strong recommendation for use as an induction and maintenance agent, with azathioprine the other strong candidate for maintenance. EULAR also made a weak recommendation for mycophenolate with low-dose calcineurin inhibitors in severe nephrotic syndrome, in some circumstances.
For antiphospholipid antibody carriers, EULAR noted that a recent randomized, open-label trial comparing rivaroxaban against warfarin “was prematurely terminated due to an excess of thromboembolic events in the rivaroxaban arm. Thus, in patients with SLE-antiphospholipid syndrome, “use of novel oral anticoagulants for secondary prevention should be avoided.”
The group notes that management should aim at “remission of disease symptoms and signs, prevention of damage accrual, and minimization of drug side effects, as well as improvement of quality of life.” To that end, it said newly defined low disease-activity states, such as an SLE Disease Activity Index score of 3 or less on antimalarials, are useful to guide treatment, and have comparable rates of remission and flare prevention.
SOURCE: Fanouriakis A et al. Ann Rheum Dis. 2019 Mar 29. doi: 10.1136/annrheumdis-2019-215089
FROM ANNALS OF THE RHEUMATIC DISEASES
Five-fraction SRBT schedule well tolerated with high tumor-control rate in central lung cancers
For patients with centrally located lung cancers in a multicenter phase 1/2 trial, a specific five-fraction radiotherapy schedule was well tolerated and linked to fairly low rates of treatment-related toxicity, investigators say.
The 12-Gy/fraction schedule of stereotactic body radiotherapy (SBRT) had a 7.2% rate of dose-limiting toxicities and a high tumor-control rate in the NRG Oncology/RTOG 0813 trial, which enrolled 120 patients with medically inoperable stage T1/2 N0M0 non–small cell lung cancers at 43 centers in the United States and Canada.
This is an important study that has implications for clinical practice, according to the investigators, led by Andrea Bezjak, MD, of Princess Margaret Cancer Centre in Toronto.
“The ability to treat patients with centrally located node-negative tumors in multiple institutions across the United States and Canada while maintaining plan qualities and achieving good patient outcomes and relatively modest rates of toxicity is an important achievement,” Dr. Bezjak and coinvestigators said in the Journal of Clinical Oncology.
These patients are frequently at increased risk from surgery, because of advanced age and the comorbidities that come with it, they added.
The 12-Gy/fraction dose level was the highest of nine dose levels included in the study protocol. Doses were delivered in five fractions over the course of 1.5-2 weeks. Investigators sought to determine the maximum tolerated dose of SRBT, defined as the level at which the probability of dose-limiting toxicities (grade 3 or greater) within the first year was as close to 20% as possible, without going over.
Thus, the 7.2% rate of dose-limiting toxicities at this highest-allowed dose level was “well below” that protocol-specified threshold, investigators said, commenting on results of the study.
The rate of local control at 2 years was 89.4% for the 12-Gy/fraction dose level. The 2-year overall survival was 70%, which compared favorably to what has been seen previously with use of SBRT in similar patients with peripheral tumors, according to Dr. Bezjak and colleagues.
Most deaths in the study were attributable to causes other than lung cancer, according to investigators, who noted that all accrued patients were deemed medically inoperable by an experienced thoracic surgeon.
“Thus, this study provides robust data about the safety and efficacy of a five-fraction SBRT schedule that is well tolerated and associated with relatively low rates of serious treatment-related toxicity,” they concluded.
Dr. Bezjak reported disclosures related to AstraZeneca and Abbvie. Coauthors provided disclosures related to Varian Medical Systems, Elekta, Accuray, Seattle Genetics, Celgene, Exelixis, Gilead Sciences, Illumina, Ions Pharmaceuticals, and EMD Serono, among others.
SOURCE: Bezjak A et al. J Clin Oncol. 2019 Apr 3. doi: 10.1200/JCO.18.00622.
FROM THE JOURNAL OF CLINICAL ONCOLOGY