User login
What’s Eating You? Ixodes Tick and Related Diseases, Part 2: Diagnosis and Treatment of Regional Tick-borne Diseases
The Ixodes tick is prevalent in temperate climates worldwide. During a blood meal, pathogens may be transmitted from the tick to its host. Borrelia burgdorferi, a spirochete responsible for Lyme disease, is the most prevalent pathogen transmitted by Ixodes ticks.1 Borrelia mayonii recently was identified as an additional cause of Lyme disease in the United States.2
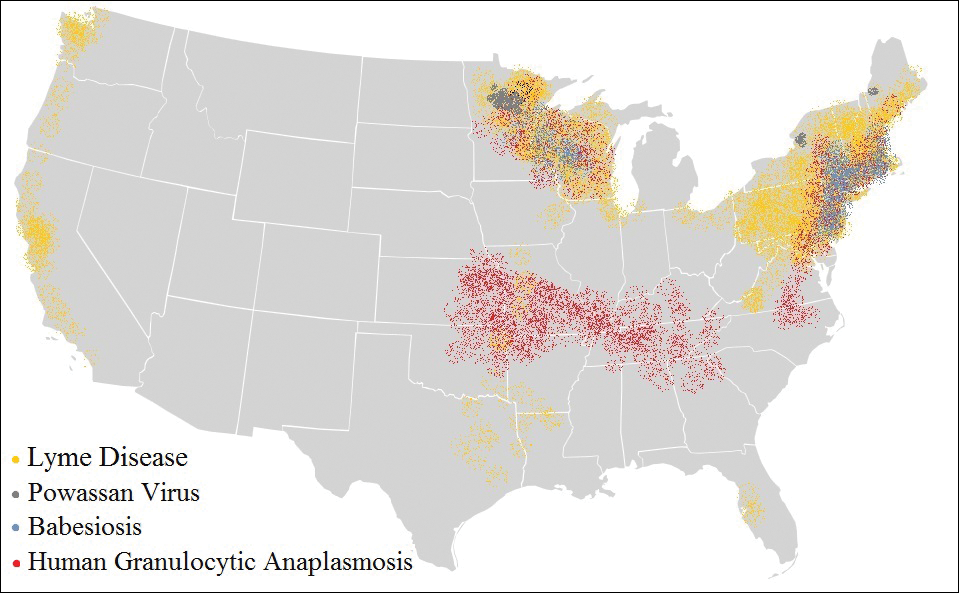
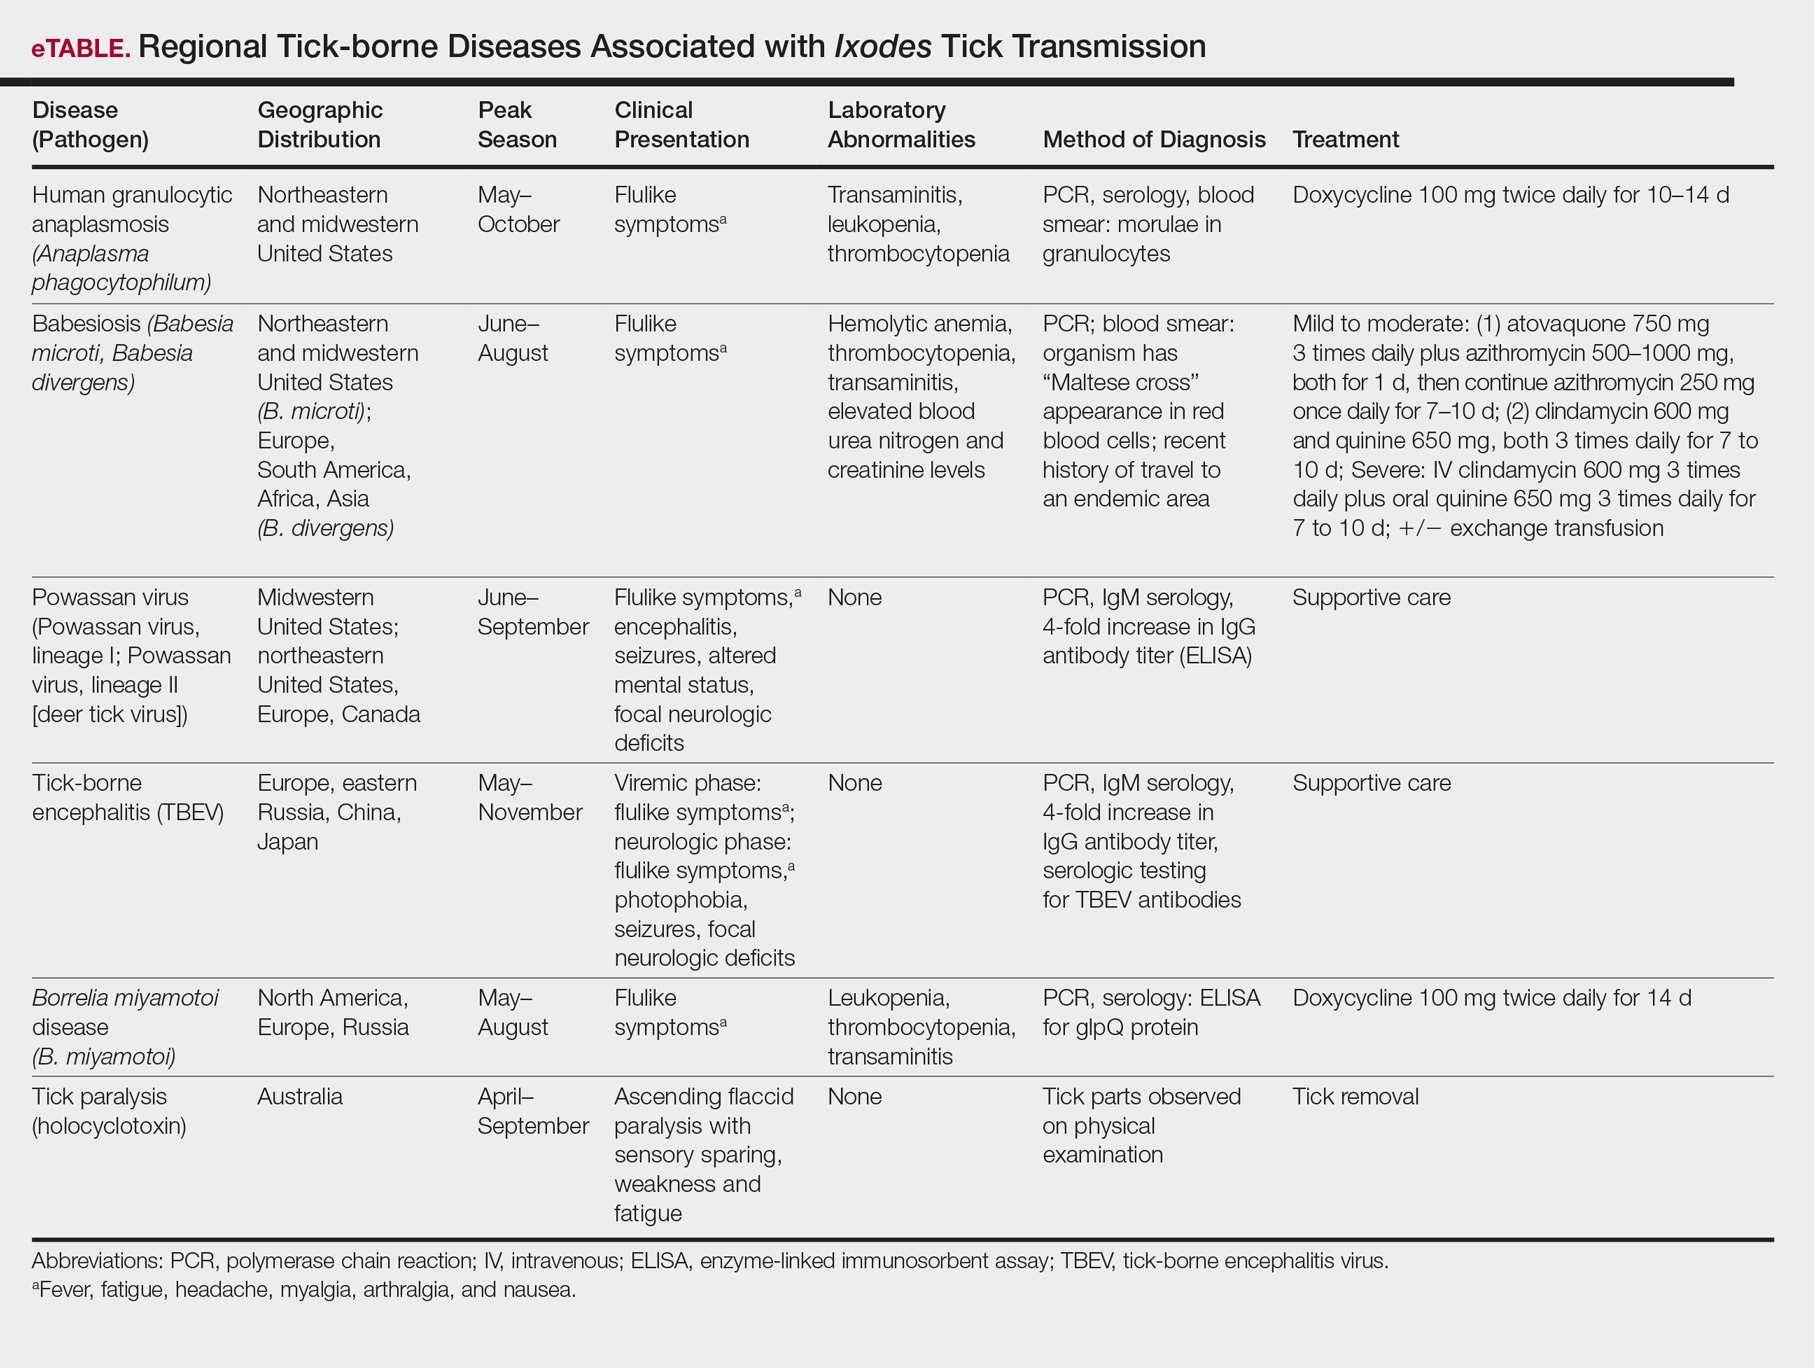
The Ixodes tick also is associated with several less common pathogens, including Babesia microti and the tick-borne encephalitis virus, which have been recognized as Ixodes-associated pathogens for many years.3,4 Other pathogens have been identified, including Anaplasma phagocytophilum, recognized in the 1990s as the cause of human granulocytic anaplasmosis, as well as the Powassan virus and Borrelia miyamotoi.5-7 Additionally, tick paralysis has been associated with toxins in the saliva of various species of several genera of ticks, including some Ixodes species.8 Due to an overlap in geographic distribution (Figure) and disease presentations (eTable), it is important that physicians be familiar with these regional pathogens transmitted by Ixodes ticks.
Human Granulocytic Anaplasmosis
Formerly known as human granulocytic ehrlichiosis, human granulocytic anaplasmosis is caused by A phagocytophilum and is transmitted by Ixodes scapularis, Ixodes pacificus, and Ixodes persulcatus. The incidence of human granulocytic anaplasmosis in the United States increased 12-fold from 2001 to 2011.9
Presenting symptoms generally are nonspecific, including fever, night sweats, headache, myalgias, and arthralgias, often resulting in misdiagnosis as a viral infection. Laboratory abnormalities include mild transaminitis, leukopenia, and thrombocytopenia.9,10 Although most infections resolve spontaneously, 3% of patients develop serious complications. The mortality rate is 0.6%.11
A diagnosis of human granulocytic anaplasmosis should be suspected in patients with a viral-like illness and exposure to ticks in an endemic area. The diagnosis can be confirmed by polymerase chain reaction (PCR), acute- and convalescent-phase serologic testing, or direct fluorescent antibody screening. Characteristic morulae may be present in granulocytes.12 Treatment typically includes doxycycline, which also covers B burgdorferi coinfection. When a diagnosis of human granulocytic anaplasmosis is suspected, treatment should never be delayed to await laboratory confirmation. If no clinical improvement is seen within 48 hours, alternate diagnoses or coinfection with B microti should be considered.10
Babesiosis
The protozoan B microti causes babesiosis in the United States, with Babesia divergens being more common in Europe.13 Reported cases of babesiosis in New York increased as much as 20-fold from 2001 to 2008.14 Transmission primarily is from the Ixodes tick but rarely can occur from blood transfusion.15 Tick attachment for at least 36 hours is required for transmission.13
The clinical presentation of babesiosis ranges from asymptomatic to fatal. Symptoms generally are nonspecific, resembling a viral infection and including headache, nausea, diarrhea, arthralgia, and myalgia. Laboratory evaluation may reveal hemolytic anemia, thrombocytopenia, transaminitis, and elevated blood urea nitrogen and creatinine levels.16 Rash is not typical. Resolution of symptoms generally occurs within 2 weeks of presentation, although anemia may persist for months.13 Severe disease is more common among elderly and immunocompromised patients. Complications include respiratory failure, renal failure, congestive heart failure, and disseminated intravascular coagulation. The mortality rate in the United States is approximately 10%.10,16
A diagnosis of babesiosis is made based on the presence of flulike symptoms, laboratory results, and history of recent travel to an endemic area. A thin blood smear allows identification of the organism in erythrocytes as ring forms or tetrads (a “Maltese cross” appearance).17 Polymerase chain reaction is more sensitive than a blood smear, especially in early disease.18 Indirect fluorescent antibody testing is species-specific but cannot verify active infection.10
Treatment of babesiosis is indicated for symptomatic patients with active infection. Positive serology alone is not an indication for treatment. Asymptomatic patients with positive serology should have diagnostic testing repeated in 3 months with subsequent treatment if parasitemia persists. Mild disease is treated with atovaquone plus azithromycin or clindamycin plus quinine. Severe babesiosis is treated with quinine and intravenous clindamycin and may require exchange transfusion.10 Coinfection with B burgdorferi should be considered in patients with flulike symptoms and erythema migrans or treatment failure. Coinfection is diagnosed by Lyme serology plus PCR for B microti. This is an important consideration because treatment of babesiosis does not eradicate B burgdorferi infection.19
Powassan Virus
Powassan virus is a flavivirus that causes encephalitis. It is transmitted by Ixodes cookei (Powassan virus, lineage I) in the Great Lakes region and by I scapularis (Powassan virus, lineage II, or deer tick virus) in the northeastern United States. Transmission can occur within 15 minutes of tick attachment.6,20,21
Patients typically present with fever, headache, altered mental status, seizures, and focal neurologic deficits. Gastrointestinal symptoms and rash also have been reported.21 The diagnosis is made based on clinical presentation and laboratory testing with PCR or enzyme-linked immunosorbent assay (ELISA). Cross-reactivity on ELISA exists, necessitating confirmation with a neutralizing antibody or PCR. Treatment is supportive. Corticosteroids and intravenous immunoglobulin have been proposed as treatment modalities, but evidence of their efficacy is limited.22
Tick-borne Encephalitis
Tick-borne encephalitis is caused by the flavivirus tick-borne encephalitis virus in Europe and Asia. The tick-borne encephalitis virus is transmitted by Ixodes ricinus in Europe and by Ixodes persulcatus in eastern Russia, China, and Japan. It also has been associated with consumption of unpasteurized milk.23,24
Tick-borne encephalitis presents in a biphasic pattern. The initial viremic phase can persist for as long as 8 days with headache, nausea, myalgia, and fever. One-third of patients then enter an asymptomatic phase, followed by virus penetration into the central nervous system. The neurologic phase produces continued headache and fever with photophobia, focal neurologic deficits, seizures, respiratory depression, or coma. Neurologic sequelae persist in 10% to 20% of patients.25,26
In the viremic stage, diagnosis is made with PCR or culture. During the latent phase or neurologic phase, serologic testing for tick-borne encephalitis virus antibodies is indicated. Neutralizing antibody evaluation may be necessary due to cross-reactivity among flaviviruses.27 Treatment is supportive. An inactivated vaccine is available for high-risk populations.28
Borrelia miyamotoi Disease
Borrelia miyamotoi is a symbiont of the Ixodes tick formerly believed to have no pathogenic significance; however, B miyamotoi was isolated in febrile patients in Russia in 20117 and was identified as a pathogen in both North America29 and Europe in 2013.30 Disease presentation includes nonspecific symptoms of fever, fatigue, headache, arthralgia, myalgia, and nausea. Rash is uncommon. Laboratory abnormalities include leukopenia, thrombocytopenia, and transaminitis.31,32 Meningoencephalitis may occur in immunocompromised patients.29,30
The diagnosis of B miyamotoi disease is confirmed by PCR or serology. An ELISA that is positive for B burgdorferi IgM but negative with confirmatory immunoblot suggests B miyamotoi disease. Seroconversion using a glpQ protein ELISA also can be assessed.31 If ELISA is positive, Lyme disease can be excluded because B burgdorferi does not possess g1pQ. Treatment is with doxycycline.32
Tick Paralysis
Tick paralysis is an intoxication with holocyclotoxin from the saliva of gravid hard ticks. In the United States, intoxication is associated with ticks of various species of Amblyomma, Dermacentor, and Ixodes in the Northwest, Southeast, and Northeast. In Australia, intoxication is associated with Ixodes.33 Patients present with weakness and fatigue, progressing to ascending flaccid paralysis with sensory sparing. The treatment is tick removal.8,33
Conclusion
Arthropods carry many regional pathogens. Physicians outside of those regions should seek a travel history and be alert for imported disease.
- Steere AC, Grodzicki RL, Kornblatt AN, et al. The spirochetal etiology of Lyme disease. N Engl J Med. 1983;308:733-740.
- Dolan MC, Hojgaard A, Hoxmeier JC, et al. Vector competence of the blacklegged tick, Ixodes scapularis, for the recently recognized Lyme borreliosis spirochete Candidatus Borrelia mayonii. Ticks Tick Borne Dis. 2016;7:665-669.
- Rudzinska MA, Spielman A, Riek RF, et al. Intraerythrocytic ‘gametocytes’ of Babesia microti and their maturation in ticks. Can J Zool. 1979;57:424-434.
- Casals J, Olitsky PK. Enduring immunity following vaccination of mice with formalin-inactivated virus of Russian spring-summer (Far Eastern, tick-borne) encephalitis; correlation with serum-neutralizing and complement-fixing antibodies. J Exp Med. 1945;82:431-443.
- Magnarelli LA, Stafford KC III, Mather TN, et al. Hemocytic rickettsia-like organisms in ticks: serologic reactivity with antisera to Ehrlichiae and detection of DNA of agent of human granulocytic ehrlichiosis by PCR. J Clin Microbiol. 1995;33:2710-2714.
- McLean DM, Donohue WL. Powassan virus: isolation of virus from a fatal case of encephalitis. Can Med Assoc J. 1959;80:708-711.
- Platonov AE, Karan LS, Kolyasnikova NM, et al. Humans infected with relapsing fever spirochete Borrelia miyamotoi, Russia. Emerg Infect Dis. 2011;17:1816-1823.
- Diaz JH. A 60-year meta-analysis of tick paralysis in the United States: a predictable, preventable, and often misdiagnosed poisoning. J Med Toxicol. 2010;6:15-21.
- Bakken J, Dumler JS. Human granulocytic anaplasmosis. Infect Dis Clin North Am. 2015;29:341-355.
- Chapman AS, Bakken JS, Folk SM, et al; Tickborne Rickettsial Diseases Working Group; CDC. Diagnosis and management of tickborne rickettsial diseases: Rocky Mountain spotted fever, ehrlichioses, and anaplasmosis—United States: a practical guide for physicians and other health-care and public health professionals. MMWR Recomm Rep. 2006;55(RR-4):1-27.
- Dahlgren FS, Mandel EJ, Krebs JW, et al. Increasing incidence of Ehrlichia chaffeensis and Anaplasma phagocytophilum in the United States, 2000-2007. Am J Trop Med Hyg. 2011;85:124-130.
- Aguero-Rosenfeld ME. Diagnosis of human granulocytic ehrlichiosis: state of the art. Vector Borne Zoonotic Dis. 2002;2:233-239.
- Vannier EG, Diuk-Wasser MA, Ben Mamoun C, et al. Babesiosis. Infect Dis Clin North Am. 2015;29:357-370.
- Joseph JT, Roy SS, Shams N, et al. Babesiosis in Lower Hudson Valley, New York, USA. Emerg Infect Dis. 2011;17:843-847.
- McQuiston JH, Childs JE, Chamberland ME, et al. Transmission of tickborne agents by blood transfusions: a review of known and potential risks in the United States. Transfusion. 2000;40:274-284.
- Hatcher JC, Greenberg PD, Antique J, et al. Severe babesiosis in Long Island: review of 34 cases and their complications. Clin Infect Dis. 2001;32:1117-1125.
- Healy GR, Ruebush TK. Morphology of Babesia microti in human blood smears. Am J Clin Pathol. 1980;73:107-109.
- Kowalski TJ, Jobe DA, Dolan EC, et al. The emergence of clinically relevant babesiosis in southwestern Wisconsin. WMJ. 2015;114:152-157.
- Krause PJ, Telford SR III, Spielman A, et al. Concurrent Lyme disease and babesiosis. evidence for increased severity and duration of illness. JAMA. 1996;275:1657-1660.
- Centers for Disease Control and Prevention. Statistics & maps. http://www.cdc.gov/powassan/statistics.html. Updated February 14, 2017. Accessed December 11, 2017.
- Piantadosi A, Rubin DB, McQuillen DP, et al. Emerging cases of Powassan virus encephalitis in New England: clinical presentation, imaging, and review of the literature. Clin Infect Dis. 2016;62:707-713.
- El Khoury MY, Camargo JF, White JL, et al. Potential role of deer tick virus in Powassan encephalitis cases in Lyme disease-endemic areas of New York, U.S.A. Emerg Infect Dis. 2013;19:1926-1933.
- World Health Organization (WHO). Vaccines against tick-borne encephalitis: WHO position paper. Wkly Epidemiol Rec. 2011;86:241-256.
- Centers for Disease Control and Prevention (CDC). Tick-borne encephalitis among U.S. travelers to Europe and Asia—2000-2009. JAMA. 2010;303:2132-2135.
- Valarcher JF, Hägglund S, Juremalm M, et al. Tick-borne encephalitits. Rev Sci Tech. 2015;34:453-466.
- Schultze D, Dollenmaier G, Rohner A, et al. Benefit of detecting tick-borne encephalitis viremia in the first phase of illness. J Clin Virol. 2007;38:172-175.
- Holzmann H. Diagnosis of tick-borne encephalitis. Vaccine. 2003;21(suppl 1):S36-S40.
- Zavadska D, Anca I, André F, et al. Recommendations for tick-borne encephalitis vaccination from the Central European Vaccination Awareness Group. Hum Vaccin Immunother. 2013;9:362-374.
- Gugliotta JL, Goethert HK, Berardi VP, et al. Meningoencephalitis from Borrelia miyamotoi in an immunocompromised patient. N Engl J Med. 2013;368:240-245.
- Hovius JW, de Wever B, Sohne M, et al. A case of meningoencephalitis by the relapsing fever spirochaete Borrelia miyamotoi in Europe. Lancet. 2013;382:658.
- Molloy PJ, Telford SR III, Chowdri HR, et al. Borrelia miyamotoi disease in the northeastern United States: a case series. Ann Intern Med. 2015;163:91-98.
- Telford SR 3rd, Goethert HK, Molloy PJ, et al. Borrelia miyamotoi disease: neither Lyme disease nor relapsing fever. Clin Lab Med. 2015;35:867-882.
- Diaz JH. A comparative meta-analysis of tick paralysis in the United States and Australia. Clin Toxicol (Phila). 2015;53:874-883.
The Ixodes tick is prevalent in temperate climates worldwide. During a blood meal, pathogens may be transmitted from the tick to its host. Borrelia burgdorferi, a spirochete responsible for Lyme disease, is the most prevalent pathogen transmitted by Ixodes ticks.1 Borrelia mayonii recently was identified as an additional cause of Lyme disease in the United States.2
The Ixodes tick also is associated with several less common pathogens, including Babesia microti and the tick-borne encephalitis virus, which have been recognized as Ixodes-associated pathogens for many years.3,4 Other pathogens have been identified, including Anaplasma phagocytophilum, recognized in the 1990s as the cause of human granulocytic anaplasmosis, as well as the Powassan virus and Borrelia miyamotoi.5-7 Additionally, tick paralysis has been associated with toxins in the saliva of various species of several genera of ticks, including some Ixodes species.8 Due to an overlap in geographic distribution (Figure) and disease presentations (eTable), it is important that physicians be familiar with these regional pathogens transmitted by Ixodes ticks.
Human Granulocytic Anaplasmosis
Formerly known as human granulocytic ehrlichiosis, human granulocytic anaplasmosis is caused by A phagocytophilum and is transmitted by Ixodes scapularis, Ixodes pacificus, and Ixodes persulcatus. The incidence of human granulocytic anaplasmosis in the United States increased 12-fold from 2001 to 2011.9
Presenting symptoms generally are nonspecific, including fever, night sweats, headache, myalgias, and arthralgias, often resulting in misdiagnosis as a viral infection. Laboratory abnormalities include mild transaminitis, leukopenia, and thrombocytopenia.9,10 Although most infections resolve spontaneously, 3% of patients develop serious complications. The mortality rate is 0.6%.11
A diagnosis of human granulocytic anaplasmosis should be suspected in patients with a viral-like illness and exposure to ticks in an endemic area. The diagnosis can be confirmed by polymerase chain reaction (PCR), acute- and convalescent-phase serologic testing, or direct fluorescent antibody screening. Characteristic morulae may be present in granulocytes.12 Treatment typically includes doxycycline, which also covers B burgdorferi coinfection. When a diagnosis of human granulocytic anaplasmosis is suspected, treatment should never be delayed to await laboratory confirmation. If no clinical improvement is seen within 48 hours, alternate diagnoses or coinfection with B microti should be considered.10
Babesiosis
The protozoan B microti causes babesiosis in the United States, with Babesia divergens being more common in Europe.13 Reported cases of babesiosis in New York increased as much as 20-fold from 2001 to 2008.14 Transmission primarily is from the Ixodes tick but rarely can occur from blood transfusion.15 Tick attachment for at least 36 hours is required for transmission.13
The clinical presentation of babesiosis ranges from asymptomatic to fatal. Symptoms generally are nonspecific, resembling a viral infection and including headache, nausea, diarrhea, arthralgia, and myalgia. Laboratory evaluation may reveal hemolytic anemia, thrombocytopenia, transaminitis, and elevated blood urea nitrogen and creatinine levels.16 Rash is not typical. Resolution of symptoms generally occurs within 2 weeks of presentation, although anemia may persist for months.13 Severe disease is more common among elderly and immunocompromised patients. Complications include respiratory failure, renal failure, congestive heart failure, and disseminated intravascular coagulation. The mortality rate in the United States is approximately 10%.10,16
A diagnosis of babesiosis is made based on the presence of flulike symptoms, laboratory results, and history of recent travel to an endemic area. A thin blood smear allows identification of the organism in erythrocytes as ring forms or tetrads (a “Maltese cross” appearance).17 Polymerase chain reaction is more sensitive than a blood smear, especially in early disease.18 Indirect fluorescent antibody testing is species-specific but cannot verify active infection.10
Treatment of babesiosis is indicated for symptomatic patients with active infection. Positive serology alone is not an indication for treatment. Asymptomatic patients with positive serology should have diagnostic testing repeated in 3 months with subsequent treatment if parasitemia persists. Mild disease is treated with atovaquone plus azithromycin or clindamycin plus quinine. Severe babesiosis is treated with quinine and intravenous clindamycin and may require exchange transfusion.10 Coinfection with B burgdorferi should be considered in patients with flulike symptoms and erythema migrans or treatment failure. Coinfection is diagnosed by Lyme serology plus PCR for B microti. This is an important consideration because treatment of babesiosis does not eradicate B burgdorferi infection.19
Powassan Virus
Powassan virus is a flavivirus that causes encephalitis. It is transmitted by Ixodes cookei (Powassan virus, lineage I) in the Great Lakes region and by I scapularis (Powassan virus, lineage II, or deer tick virus) in the northeastern United States. Transmission can occur within 15 minutes of tick attachment.6,20,21
Patients typically present with fever, headache, altered mental status, seizures, and focal neurologic deficits. Gastrointestinal symptoms and rash also have been reported.21 The diagnosis is made based on clinical presentation and laboratory testing with PCR or enzyme-linked immunosorbent assay (ELISA). Cross-reactivity on ELISA exists, necessitating confirmation with a neutralizing antibody or PCR. Treatment is supportive. Corticosteroids and intravenous immunoglobulin have been proposed as treatment modalities, but evidence of their efficacy is limited.22
Tick-borne Encephalitis
Tick-borne encephalitis is caused by the flavivirus tick-borne encephalitis virus in Europe and Asia. The tick-borne encephalitis virus is transmitted by Ixodes ricinus in Europe and by Ixodes persulcatus in eastern Russia, China, and Japan. It also has been associated with consumption of unpasteurized milk.23,24
Tick-borne encephalitis presents in a biphasic pattern. The initial viremic phase can persist for as long as 8 days with headache, nausea, myalgia, and fever. One-third of patients then enter an asymptomatic phase, followed by virus penetration into the central nervous system. The neurologic phase produces continued headache and fever with photophobia, focal neurologic deficits, seizures, respiratory depression, or coma. Neurologic sequelae persist in 10% to 20% of patients.25,26
In the viremic stage, diagnosis is made with PCR or culture. During the latent phase or neurologic phase, serologic testing for tick-borne encephalitis virus antibodies is indicated. Neutralizing antibody evaluation may be necessary due to cross-reactivity among flaviviruses.27 Treatment is supportive. An inactivated vaccine is available for high-risk populations.28
Borrelia miyamotoi Disease
Borrelia miyamotoi is a symbiont of the Ixodes tick formerly believed to have no pathogenic significance; however, B miyamotoi was isolated in febrile patients in Russia in 20117 and was identified as a pathogen in both North America29 and Europe in 2013.30 Disease presentation includes nonspecific symptoms of fever, fatigue, headache, arthralgia, myalgia, and nausea. Rash is uncommon. Laboratory abnormalities include leukopenia, thrombocytopenia, and transaminitis.31,32 Meningoencephalitis may occur in immunocompromised patients.29,30
The diagnosis of B miyamotoi disease is confirmed by PCR or serology. An ELISA that is positive for B burgdorferi IgM but negative with confirmatory immunoblot suggests B miyamotoi disease. Seroconversion using a glpQ protein ELISA also can be assessed.31 If ELISA is positive, Lyme disease can be excluded because B burgdorferi does not possess g1pQ. Treatment is with doxycycline.32
Tick Paralysis
Tick paralysis is an intoxication with holocyclotoxin from the saliva of gravid hard ticks. In the United States, intoxication is associated with ticks of various species of Amblyomma, Dermacentor, and Ixodes in the Northwest, Southeast, and Northeast. In Australia, intoxication is associated with Ixodes.33 Patients present with weakness and fatigue, progressing to ascending flaccid paralysis with sensory sparing. The treatment is tick removal.8,33
Conclusion
Arthropods carry many regional pathogens. Physicians outside of those regions should seek a travel history and be alert for imported disease.
- Steere AC, Grodzicki RL, Kornblatt AN, et al. The spirochetal etiology of Lyme disease. N Engl J Med. 1983;308:733-740.
- Dolan MC, Hojgaard A, Hoxmeier JC, et al. Vector competence of the blacklegged tick, Ixodes scapularis, for the recently recognized Lyme borreliosis spirochete Candidatus Borrelia mayonii. Ticks Tick Borne Dis. 2016;7:665-669.
- Rudzinska MA, Spielman A, Riek RF, et al. Intraerythrocytic ‘gametocytes’ of Babesia microti and their maturation in ticks. Can J Zool. 1979;57:424-434.
- Casals J, Olitsky PK. Enduring immunity following vaccination of mice with formalin-inactivated virus of Russian spring-summer (Far Eastern, tick-borne) encephalitis; correlation with serum-neutralizing and complement-fixing antibodies. J Exp Med. 1945;82:431-443.
- Magnarelli LA, Stafford KC III, Mather TN, et al. Hemocytic rickettsia-like organisms in ticks: serologic reactivity with antisera to Ehrlichiae and detection of DNA of agent of human granulocytic ehrlichiosis by PCR. J Clin Microbiol. 1995;33:2710-2714.
- McLean DM, Donohue WL. Powassan virus: isolation of virus from a fatal case of encephalitis. Can Med Assoc J. 1959;80:708-711.
- Platonov AE, Karan LS, Kolyasnikova NM, et al. Humans infected with relapsing fever spirochete Borrelia miyamotoi, Russia. Emerg Infect Dis. 2011;17:1816-1823.
- Diaz JH. A 60-year meta-analysis of tick paralysis in the United States: a predictable, preventable, and often misdiagnosed poisoning. J Med Toxicol. 2010;6:15-21.
- Bakken J, Dumler JS. Human granulocytic anaplasmosis. Infect Dis Clin North Am. 2015;29:341-355.
- Chapman AS, Bakken JS, Folk SM, et al; Tickborne Rickettsial Diseases Working Group; CDC. Diagnosis and management of tickborne rickettsial diseases: Rocky Mountain spotted fever, ehrlichioses, and anaplasmosis—United States: a practical guide for physicians and other health-care and public health professionals. MMWR Recomm Rep. 2006;55(RR-4):1-27.
- Dahlgren FS, Mandel EJ, Krebs JW, et al. Increasing incidence of Ehrlichia chaffeensis and Anaplasma phagocytophilum in the United States, 2000-2007. Am J Trop Med Hyg. 2011;85:124-130.
- Aguero-Rosenfeld ME. Diagnosis of human granulocytic ehrlichiosis: state of the art. Vector Borne Zoonotic Dis. 2002;2:233-239.
- Vannier EG, Diuk-Wasser MA, Ben Mamoun C, et al. Babesiosis. Infect Dis Clin North Am. 2015;29:357-370.
- Joseph JT, Roy SS, Shams N, et al. Babesiosis in Lower Hudson Valley, New York, USA. Emerg Infect Dis. 2011;17:843-847.
- McQuiston JH, Childs JE, Chamberland ME, et al. Transmission of tickborne agents by blood transfusions: a review of known and potential risks in the United States. Transfusion. 2000;40:274-284.
- Hatcher JC, Greenberg PD, Antique J, et al. Severe babesiosis in Long Island: review of 34 cases and their complications. Clin Infect Dis. 2001;32:1117-1125.
- Healy GR, Ruebush TK. Morphology of Babesia microti in human blood smears. Am J Clin Pathol. 1980;73:107-109.
- Kowalski TJ, Jobe DA, Dolan EC, et al. The emergence of clinically relevant babesiosis in southwestern Wisconsin. WMJ. 2015;114:152-157.
- Krause PJ, Telford SR III, Spielman A, et al. Concurrent Lyme disease and babesiosis. evidence for increased severity and duration of illness. JAMA. 1996;275:1657-1660.
- Centers for Disease Control and Prevention. Statistics & maps. http://www.cdc.gov/powassan/statistics.html. Updated February 14, 2017. Accessed December 11, 2017.
- Piantadosi A, Rubin DB, McQuillen DP, et al. Emerging cases of Powassan virus encephalitis in New England: clinical presentation, imaging, and review of the literature. Clin Infect Dis. 2016;62:707-713.
- El Khoury MY, Camargo JF, White JL, et al. Potential role of deer tick virus in Powassan encephalitis cases in Lyme disease-endemic areas of New York, U.S.A. Emerg Infect Dis. 2013;19:1926-1933.
- World Health Organization (WHO). Vaccines against tick-borne encephalitis: WHO position paper. Wkly Epidemiol Rec. 2011;86:241-256.
- Centers for Disease Control and Prevention (CDC). Tick-borne encephalitis among U.S. travelers to Europe and Asia—2000-2009. JAMA. 2010;303:2132-2135.
- Valarcher JF, Hägglund S, Juremalm M, et al. Tick-borne encephalitits. Rev Sci Tech. 2015;34:453-466.
- Schultze D, Dollenmaier G, Rohner A, et al. Benefit of detecting tick-borne encephalitis viremia in the first phase of illness. J Clin Virol. 2007;38:172-175.
- Holzmann H. Diagnosis of tick-borne encephalitis. Vaccine. 2003;21(suppl 1):S36-S40.
- Zavadska D, Anca I, André F, et al. Recommendations for tick-borne encephalitis vaccination from the Central European Vaccination Awareness Group. Hum Vaccin Immunother. 2013;9:362-374.
- Gugliotta JL, Goethert HK, Berardi VP, et al. Meningoencephalitis from Borrelia miyamotoi in an immunocompromised patient. N Engl J Med. 2013;368:240-245.
- Hovius JW, de Wever B, Sohne M, et al. A case of meningoencephalitis by the relapsing fever spirochaete Borrelia miyamotoi in Europe. Lancet. 2013;382:658.
- Molloy PJ, Telford SR III, Chowdri HR, et al. Borrelia miyamotoi disease in the northeastern United States: a case series. Ann Intern Med. 2015;163:91-98.
- Telford SR 3rd, Goethert HK, Molloy PJ, et al. Borrelia miyamotoi disease: neither Lyme disease nor relapsing fever. Clin Lab Med. 2015;35:867-882.
- Diaz JH. A comparative meta-analysis of tick paralysis in the United States and Australia. Clin Toxicol (Phila). 2015;53:874-883.
Practice Points
- Apart from the more familiar Borrelia burgdorferi, several less common pathogens associated with diseases transmitted by Ixodes ticks include Anaplasma phagocytophilum, Babesia microti, Borrelia miyamotoi, the Powassan virus, and the tick-borne encephalitis virus.
- Overlap in both the geographic distribution and the clinical presentations of these uncommon pathogens underscores the importance of being familiar with their capacity for causing illness and effective treatment.
- Intoxication with the saliva of some Ixodes species can cause an ascending flaccid tick paralysis.
Do industry payments increase prescribing for some targeted therapies?
Physicians receiving general payments from the company marketing a targeted cancer therapy were more likely to prescribe it in three out of six drugs evaluated, researchers reported.
Prescribing of sunitinib, dasatinib, and nilotinib was increased for physicians receiving such payments versus not receiving them, while prescribing of imatinib, sorafenib, and pazopanib were not, according to the analysis by Aaron P. Mitchell, MD, of the Lineberger Comprehensive Cancer Center, UNC School of Medicine, University of North Carolina at Chapel Hill, and his coauthors.
In previous studies, pharmaceutical industry payments to physicians have been associated with “higher-cost, brand-name pharmaceutical prescribing,” Dr. Mitchell and his colleagues wrote. The report was published in JAMA Internal Medicine.
“Whether industry payments are associated with physician treatment choice in oncology is uncertain,” they said.
To evaluate the association between payments to oncologists and drug selection, Dr. Mitchell and his colleagues linked Open Payments data from the Centers for Medicare & Medicaid Services to data from Medicare Part D Prescriber Public Use File for the years 2013-2014.
The primary variable in the study was payments received during 2013, according to investigators, and the primary outcome of the analysis was prescriptions filled during 2014.
Open Payments reported in 2013 had a total dollar value of $4.08 billion, including $1.20 billion paid to physicians, according to CMS data.
The researchers focused on targeted therapies for two therapeutic areas: metastatic renal cell carcinoma (RCC), including sorafenib, sunitinib, and pazopanib; and chronic myeloid leukemia (CML), including imatinib, dasatinib, and nilotinib.
They limited their analysis to physicians listed as oncologists who filled at least 20 prescriptions for each of the three drugs in metastatic RCC (n = 354) or in CML (n = 2,225).
Receiving payments categorized as “general,” such as gifts, speaker fees, meals, and travel, increased the odds of prescribing drugs for both metastatic RCC (odds ratio, 2.05; 95% confidence interval, 1.34-3.14; P = .001) and for CML (odds ratio, 1.29; 95% CI, 1.13-1.47; P less than .001).
By contrast, research payments did not increase the odds of prescribing those drugs, the investigators reported.
Looking at specific drugs, they found that receipt of general payments from a drug’s manufacturer was associated with increased prescribing of sunitinib (50.5% versus 34.4%, P = .01), dasatinib (13.8% versus 11.4%, P = .02), and nilotinib (15.4% vs 12.5%, P = .01).
However, no such association was found for sorafenib or pazopanib.
For imatinib, by contrast, investigators said industry payments were associated with a prescribing decrease.
“This may reflect a strategy by the manufacturer of imatinib, which also produces nilotinib, to promote switching to nilotinib before the patent expiration of imatinib in 2015,” the researchers wrote.
Dr. Mitchell and his coauthors reported no conflict of interest disclosures related to the study.
SOURCE: Mitchell AP, et al. JAMA Intern Med. 2018 Apr 9. doi: 0.1001/jamainternmed.2018.0776.
FROM JAMA INTERNAL MEDICINE
Key clinical point: Oncologists receiving general payments from the company marketing a cancer drug were more likely to prescribe it in three out of six drugs evaluated.
Major finding: Prescribing was significantly increased for sunitinib (50.5% versus 34.4%, P = .01), dasatinib (13.8% versus 11.4%, P = .02), and nilotinib (15.4% vs. 12.5%, P = .01), but not for imatinib, sorafenib, or pazopanib.
Study details: An analysis of Centers for Medicare & Medicaid Services Open Payments data and Medicare Part D Prescriber Public Use File for the years 2013 to 2014.
Disclosures: The authors reported no conflict of interest disclosures related to the study.
Source: Mitchell AP et al. JAMA Intern Med. 2018 Apr 9. doi: 0.1001/jamainternmed.2018.0776.
SSRI exposure in utero may change brain structure and connectivity
Prenatal exposure to selective serotonin reuptake inhibitors (SSRIs) was associated with fetal brain development in brain regions important in emotional processing, results of an imaging study show.
Compared to controls, SSRI-exposed infants had significant gray matter volume expansion and increased white matter structural connectivity in the amygdala and insula, according to results published in JAMA Pediatrics.
“Our findings suggest a potential association between prenatal SSRI exposure, likely via aberrant serotonin signaling, and the development of the amygdala-insula circuit in the fetal brain,” wrote Claudia Lugo-Candelas, PhD, of Columbia University Medical Center, New York, and her coauthors.
An increasing number of pregnant women are taking SSRIs, in part due to increased awareness of the negative effects of untreated prenatal maternal depression (PMD), the investigators said in their report.
“Because untreated PMD poses risks to both the infant and mother, the decision to initiate, continue, or suspend SSRI treatment remains a clinical dilemma,” they wrote.
Animal studies suggest atypical serotonergic signaling from prenatal SSRI exposure could change fetal brain development and affect function later in life, they explained.
Studies in humans have produced mixed results, but in a recent national registry study including more than 15,000 individuals exposed to SSRIs prenatally, exposure was linked to increased rates of depression.
To evaluate the impact of prenatal SSRI exposure on brain development, Dr. Lugo-Candelas and colleagues used structural and diffusion magnetic resonance imaging (MRI) to evaluate the brains of 98 infants.
They included 16 infants with in utero exposure to SSRIs, 21 born to mothers with untreated maternal depression, and 61 healthy control subjects, all evaluated between 2011 and 2016.
Infants exposed to SSRIs in utero had significant (P less than .05) gray matter volume expansion versus controls in both the right amygdala (Cohen’s d, 0.65; 95 %CI, 0.06-1.23) and the right insula (Cohen’s d = 0.86; 95% CI, 0.26-1.14).
The SSRI-exposed infants also had a significant (P less than .05) increase in connectivity between the right amygdala and the right insula versus controls (Cohen’s d, 0.99; 95% CI, 0.40-1.57).
Whether these neurodevelopmental changes translate into long-term behavioral or psychological outcomes should be evaluated in subsequent studies, Dr. Lugo-Candelas and colleagues said.
Abnormalities in amygdala-insula circuitry may lead to anxiety or depression, they wrote.
“The structurally primed circuit in the infant brains could lead to maladaptive fear processing in their later life, such as generalization of conditioned fear or negative attention bias,” they added.
Dr. Lugo-Candelas reported no conflicts of interest related to the study. One study coauthor reported research support from Shire Pharmaceuticals and Aevi Genomics.
SOURCE: Lugo-Candelas C, et al. JAMA Pediatr. 2018 Apr 9. doi: 10.1001/jamapediatrics.2017.5227.
FROM JAMA PEDIATRICS
Key clinical point: Prenatal selective serotonin reuptake inhibitor (SSRI) exposure was associated with fetal brain development, especially in regions of the brain important to emotional processing.
Major finding: Compared to controls, SSRI-exposed infants had significant gray matter volume expansion and increased white matter structural connectivity in the amygdala and insula.
Study details: A two-center cohort study of data collected between 2011 and 2016 for 98 infants, including 16 with in utero exposure to SSRIs.
Disclosures: One study author reported research support from Shire Pharmaceuticals and Aevi Genomics.
Source: Lugo-Candelas C et al. JAMA Pediatr. 2018 Apr 9. doi: 10.1001/jamapediatrics.2017.5227.
The outcomes of “GOLD 2017”
After the Global Initiative for Chronic Obstructive Lung Disease released updated recommendations for grading COPD patients’ level of disease in November of 2016, Imran Iftikhar, MD, tried to incorporate them into his practice, but he encountered problems.
For one thing, the new classification system, which became known as GOLD 2017, uncoupled spirometry results from the ABCD treatment algorithm. “I found it wasn’t really helping me in terms of prognostication or COPD management,” said Dr. Iftikhar, section chief of pulmonary and critical care at Emory Saint Joseph’s Hospital, Atlanta. “Although the purpose of the GOLD classification was not really meant for prognostication, most practicing physicians are frequently asked about prognosis by patients, and I am not sure if the 2017 reclassification really helps with that.”
The GOLD 2017 classification simplified the chronic obstructive pulmonary disease staging that was available from 2011 to 2015 from three variables (spirometry thresholds, exacerbation risk, and dyspnea scale) to two variables (exacerbation risk and dyspnea scale). In the 2017 report, authors of the new guidelines characterized forced expiratory volume in 1 second (FEV1) as “a poor predictor of disease status” and proposed that clinicians derive ABCD groups exclusively from patient symptoms and their exacerbations. FEV1 is an “important parameter at the population level” in predicting hospitalization and mortality, the authors wrote, but keeping results separate “acknowledges the limitations of FEV1 in making treatment decisions for individualized patient care and highlights the importance of patient symptoms and exacerbation risks in guiding therapies in COPD.”
According to Meilan Han, MD, MS, a member of the GOLD Science Committee, since release of the 2017 guidelines, “clinicians have indicated that they like the flexibility the system provides in separating spirometry, symptoms, and exacerbation risk as this more accurately reflects the heterogeneity we see in the COPD patient population.” Nevertheless, how this approach influences long-term outcomes remains unclear.
Daniel Ouellette, MD, FCCP, a pulmonologist with the Henry Ford Health System in Detroit, described the GOLD 2017 criteria as “a good step forward” but said he wasn’t sure if the optimal or perfect tool exists for categorizing COPD patients’ level of disease.
“I think what we see is an effort to use all of these criteria to help us better treat our patients. I think ,” he said in an interview.
“All guidelines need to be modified as further research becomes available. I think that the frontiers of this area are going to be to incorporate new elements such as tobacco history, more emphasis on clinical signs and symptoms, and use of markers other than spirometry, such as eosinophil count, to categorize patients with COPD,” Dr. Ouellette added.
In an analysis of the GOLD 2017 criteria applied to 819 COPD patients in Spain and the United States, published online Nov. 3, 2017, in the American Journal of Respiratory and Critical Care Medicine, Carlos Cabrera López, MD, and his colleagues concluded that the mortality risk was better predicted by the 2015 GOLD classification system than by the 2017 iteration (Am J Respir Crit Care Med. 2018 Feb. doi: 10.101164/rccm.201707-1363OC).
The distribution of Charlson index scores also changed. Whereas group D was higher than B in 2015, they became similar in the 2017 system. For her part, Dr. Han emphasized that the primary goal of the GOLD ABCD classification system is to categorize patients with respect to treatment groups. “Current therapy targets symptoms and exacerbations, which are the key current elements of the classification schema,” she said in an interview. “The results of the Cabrera Lopez analysis are not necessarily unexpected, as FEV1 is associated with mortality.”
In a prospective, multicenter analysis, Portuguese researchers compared the performance of GOLD 2011 and 2017 in terms of how 200 COPD patients were reclassified, the level of agreement between the two iterations, and the performance of each to predict future exacerbations (COPD. 2018 Feb;15[1]; 21-6). They found that about half of patients classified as GOLD D under the 2011 guidelines became classified as GOLD B when the 2017 version was used, and the extent of agreement between the two iterations was moderate (P less than .001). They also found that the two versions of the guidelines were equivalently effective at predicting exacerbations (69.7% vs. 67.6% in the 2011 and 2017 iterations, respectively). In addition, patients who met the criteria for a GOLD B grouping in the 2017 iteration exacerbated 17% more often and had a lower percent predicted post bronchodilator FEV1 than did those who met the criteria for a GOLD B classification under the 2011 guidelines.
Dr. Han, who is also an associate professor of medicine at the University of Michigan Hospital, acknowledged that GOLD 2017 has resulted in the reclassification of some previously group D patients as group B patients. “Our primary goal is to aid clinicians with the diagnosis and management of patients with COPD,” she said. “We look forward to additional data coming in from ongoing clinical trials that will provide longer term data to further refine treatment algorithms.”
In a recent study of more than 33,000 Danish patients older than age 30 with COPD, researchers led by Anne Gedebjerg, MD, found that the GOLD 2017 ABCD classification did not predict all-cause and respiratory mortality more accurately than previous GOLD iterations from 2007 and 2011. Area under the curve for all-cause mortality was 0.61 for GOLD 2007, 0.61 for GOLD 2011, and 0.63 for GOLD 2017, while the area under the curve for respiratory mortality was 0.64 for GOLD 2007, 0.63 for GOLD 2011, and 0.65 for GOLD 2017 (Lancet Respir Med. 2018 Jan;6[3]:204-12).
However, when the spirometric stages 1-4 were combined with the A to D groupings based on symptoms and exacerbations, the 2017 classification predicted mortality with greater accuracy, compared with previous iterations (P less than .0001). “My practice is very much like this paper,” Dr. Iftikhar said. “I use both the spirometric grade and the ABCD grouping to specify which ‘group’ and ‘grade’ my patient belongs to. I think future investigators need to combine ABCD with spirometry classification to see how we can improve the classification system.”
In a commentary published in the same issue of the Lancet Respiratory Medicine as the large Danish study, Joan B. Soriano, MD, PhD, wrote that the 2011 GOLD guideline’s collapse of four spirometric thresholds (greater than 80%, 50%-80%, 30%-50%, and less than 30%) into just two (greater than 50% or 50% or less) “reduced the system’s ability to inform and predict mortality from the short term up to 10 years” (Lancet Respir Med. 2018 Jan;6[3]:165-6).
Lung function remains the best available biomarker for life expectancy in both patients with COPD and the general population,” wrote Dr. Soriano, a respiratory medicine researcher based in Madrid, Spain.
Additional important outcomes
Dr. Ouellette noted that while mortality is an important outcome for COPD patients, it’s not the only outcome of interest. “In addition to [trying to] help people live longer, which is certainly a desirable goal, we also want to make people be able to be more functional during their life, have fewer hospitalizations, and have less of a need of other types of supportive medical care for worsening of their disease,” he said. “The fact that the current guidelines don’t improve mortality more than the previous ones may not be a negative thing. It may tell us that the previous guidelines already did a pretty good job of helping us to improve mortality.”
Dr. Ouellette was quick to add that none of inhaled drugs currently available to treat COPD have been conclusively shown to improve mortality. “The only things we know that improve mortality for COPD patients are quitting smoking and using oxygen if a patient meets predefined goals for oxygen,” he said. “So the fact that GOLD criteria doesn’t improve mortality shouldn’t make us think that it’s not a useful tool. We already know that the medicines may not help people live longer.”
Dr. Han pointed out that spirometry “is still used to further clarify the choice of therapy recommended based on the nature and degree of airflow obstruction in light of severity of patient symptoms. The data are still designed to be used in conjunction to personalize therapy for patients.”
She added that the GOLD Science Committee “welcomes additional data analyses so that future recommendations can be further refined.”
Dr. Han disclosed that she has consulted for Boehringer Ingelheim, AstraZeneca, and GlaxoSmithKline. She has also received in-kind research support from Novartis and Sunovion.
Dr. Iftikhar reported having no financial disclosures. Dr. Ouellette is a member of CHEST® Physician’s editorial advisory board. He disclosed being part of a federally funded study being carried out by the Patient-Centered Outcomes Research Institute.
There was no industry involvement in the GOLD 2017 report, but many of its authors and board members had pharmaceutical company ties, and GOLD’s treatment advice relies on data from industry-sponsored studies.
Bring the Whole Team to VAM
Have you registered yet for the 2018 Vascular Annual Meeting in Boston? This year, bring your vascular team – there will be programming for nurses, technicians, nurse practitioners and PAs. In addition to VAM sessions of interests to nurses, the Society for Vascular Nursing will hold its annual conference in alignment with VAM, on June 20-21. Registration for SVN covers attendance at both meetings. And PAs will their own section of programming from 1 to 5 p.m. Thursday, June 21. Learn more about VAM here. And register today.
Have you registered yet for the 2018 Vascular Annual Meeting in Boston? This year, bring your vascular team – there will be programming for nurses, technicians, nurse practitioners and PAs. In addition to VAM sessions of interests to nurses, the Society for Vascular Nursing will hold its annual conference in alignment with VAM, on June 20-21. Registration for SVN covers attendance at both meetings. And PAs will their own section of programming from 1 to 5 p.m. Thursday, June 21. Learn more about VAM here. And register today.
Have you registered yet for the 2018 Vascular Annual Meeting in Boston? This year, bring your vascular team – there will be programming for nurses, technicians, nurse practitioners and PAs. In addition to VAM sessions of interests to nurses, the Society for Vascular Nursing will hold its annual conference in alignment with VAM, on June 20-21. Registration for SVN covers attendance at both meetings. And PAs will their own section of programming from 1 to 5 p.m. Thursday, June 21. Learn more about VAM here. And register today.
Learn to Negotiate Physician Compensation Agreements
SVS and the SVS Community Practice Committee will hold a webinar for SVS members on April 30 on “Negotiating Physician Employment Agreements.” The 75-minute webinar will begin at 8 p.m. Eastern time. Topics will include current trends, regulatory overview and key contractual provisions. Learn more here. Register here.
SVS and the SVS Community Practice Committee will hold a webinar for SVS members on April 30 on “Negotiating Physician Employment Agreements.” The 75-minute webinar will begin at 8 p.m. Eastern time. Topics will include current trends, regulatory overview and key contractual provisions. Learn more here. Register here.
SVS and the SVS Community Practice Committee will hold a webinar for SVS members on April 30 on “Negotiating Physician Employment Agreements.” The 75-minute webinar will begin at 8 p.m. Eastern time. Topics will include current trends, regulatory overview and key contractual provisions. Learn more here. Register here.
Tackling opioids and maternal health in US Congress
The video associated with this article is no longer available on this site. Please view all of our videos on the MDedge YouTube channel
The video associated with this article is no longer available on this site. Please view all of our videos on the MDedge YouTube channel
The video associated with this article is no longer available on this site. Please view all of our videos on the MDedge YouTube channel

Pregnant women in clinical trials: FDA questions how to include them
Pregnant women are rarely included in clinical drug trials, creating a significant and potentially dangerous gap in knowledge. Now, a new draft guidance from the Food and Drug Administration broadens the discussion about these trials, suggesting issues to consider – including ethics and risks – when testing medications in pregnant women.
“The guidance opens the possibility of ethical conduct of trials in pregnant women but carefully lays out the caveats to be considered,” Christina Chambers, PhD, a perinatal epidemiologist at the University of California, San Diego, said in an interview. “With proper planning and thoughtful consultation with the relevant experts, this change in regulatory limitations will benefit pregnant women and their children.”

Attitudes have evolved toward more acceptance of including pregnant women in drug trials, according to a 2015 committee opinion from the American College of Obstetricians and Gynecologists. Still, “concerns about the potential for pregnancy in research trial participants have led to practices involving overly burdensome contraception requirements,” the opinion states. “Although changes have been made to encourage and recruit more women into research studies, a gap still exists in the available data on health and disease in women, including those who are pregnant” (Obstet Gynecol 2015;126:e100-7).
[polldaddy:9979976]
The draft guidance, released April 6 by the FDA, is “intended to advance scientific research in pregnant women, and discusses issues that should be considered within the framework of human subject protection regulations,” according to posting comments in the Federal Register.
The draft notes that in some cases, the lack of data about drugs may harm pregnant women and their fetuses by leading physicians to be fearful about prescribing medication. Conversely, physicians and pregnant women are often in the dark about the risks and benefits of medications that are prescribed and used, according to the draft.
In terms of research going forward, the guidance says “development of accessible treatment options for the pregnant population is a significant public health issue.”
The guidance, which recommends that clinical trial sponsors consider enlisting ethicists to take part in drug development program, offers these guidelines, among others, to drugmakers:
- It is “ethically justifiable” to include pregnant women in clinical trials under specific circumstances. “Sponsors should consider meeting with the appropriate FDA review division early in the development phase to discuss when and how to include pregnant women in the drug development plan. These discussions should involve FDA experts in bioethics and maternal health.”
- “Pregnant women can be enrolled in clinical trials that involve greater than minimal risk to the fetuses if the trials offer the potential for direct clinical benefit to the enrolled pregnant women and/or their fetuses.”
- A new pregnancy during a randomized, blinded clinical trial should prompt unblinding “so that counseling may be offered based on whether the fetus has been exposed to the investigational drug, placebo, or control.”
- The pregnant woman may continue the trial if potential benefits outweigh the risks.
- In general, pregnant women should not be enrolled in phase 1 and phase 2 clinical trials. Instead, those trials should be completed first “in a nonpregnant population that include females of reproductive potential.”
- Several types of events may call for the cessation of a clinical trial that includes pregnant women, such as serious maternal or fetal adverse events.

The draft guidance should take note of the fact that birth defects often don’t appear for months or even longer, according to Gerald Briggs, BPharm, FCCP, clinical professor of pharmacy at the University of California, San Francisco. “Until first year of life or later, the babies need to be monitored,” he said in an interview.
Mr. Briggs, who led a 2015 report examining the role of pregnant women in phase 4 clinical drug trials, added that the document should take note of recommendations from clinical teratologists regarding the design of animal studies that should be performed prior to human trials (Am J Obstet Gynecol. 2015;213(6):810-5).
Comments on the draft guidance can be made at www.federalregister.gov and are due by June 8, 2018.
Dr. Chambers and Mr. Briggs reported no relevant disclosures.
Pregnant women are rarely included in clinical drug trials, creating a significant and potentially dangerous gap in knowledge. Now, a new draft guidance from the Food and Drug Administration broadens the discussion about these trials, suggesting issues to consider – including ethics and risks – when testing medications in pregnant women.
“The guidance opens the possibility of ethical conduct of trials in pregnant women but carefully lays out the caveats to be considered,” Christina Chambers, PhD, a perinatal epidemiologist at the University of California, San Diego, said in an interview. “With proper planning and thoughtful consultation with the relevant experts, this change in regulatory limitations will benefit pregnant women and their children.”
Attitudes have evolved toward more acceptance of including pregnant women in drug trials, according to a 2015 committee opinion from the American College of Obstetricians and Gynecologists. Still, “concerns about the potential for pregnancy in research trial participants have led to practices involving overly burdensome contraception requirements,” the opinion states. “Although changes have been made to encourage and recruit more women into research studies, a gap still exists in the available data on health and disease in women, including those who are pregnant” (Obstet Gynecol 2015;126:e100-7).
[polldaddy:9979976]
The draft guidance, released April 6 by the FDA, is “intended to advance scientific research in pregnant women, and discusses issues that should be considered within the framework of human subject protection regulations,” according to posting comments in the Federal Register.
The draft notes that in some cases, the lack of data about drugs may harm pregnant women and their fetuses by leading physicians to be fearful about prescribing medication. Conversely, physicians and pregnant women are often in the dark about the risks and benefits of medications that are prescribed and used, according to the draft.
In terms of research going forward, the guidance says “development of accessible treatment options for the pregnant population is a significant public health issue.”
The guidance, which recommends that clinical trial sponsors consider enlisting ethicists to take part in drug development program, offers these guidelines, among others, to drugmakers:
- It is “ethically justifiable” to include pregnant women in clinical trials under specific circumstances. “Sponsors should consider meeting with the appropriate FDA review division early in the development phase to discuss when and how to include pregnant women in the drug development plan. These discussions should involve FDA experts in bioethics and maternal health.”
- “Pregnant women can be enrolled in clinical trials that involve greater than minimal risk to the fetuses if the trials offer the potential for direct clinical benefit to the enrolled pregnant women and/or their fetuses.”
- A new pregnancy during a randomized, blinded clinical trial should prompt unblinding “so that counseling may be offered based on whether the fetus has been exposed to the investigational drug, placebo, or control.”
- The pregnant woman may continue the trial if potential benefits outweigh the risks.
- In general, pregnant women should not be enrolled in phase 1 and phase 2 clinical trials. Instead, those trials should be completed first “in a nonpregnant population that include females of reproductive potential.”
- Several types of events may call for the cessation of a clinical trial that includes pregnant women, such as serious maternal or fetal adverse events.
The draft guidance should take note of the fact that birth defects often don’t appear for months or even longer, according to Gerald Briggs, BPharm, FCCP, clinical professor of pharmacy at the University of California, San Francisco. “Until first year of life or later, the babies need to be monitored,” he said in an interview.
Mr. Briggs, who led a 2015 report examining the role of pregnant women in phase 4 clinical drug trials, added that the document should take note of recommendations from clinical teratologists regarding the design of animal studies that should be performed prior to human trials (Am J Obstet Gynecol. 2015;213(6):810-5).
Comments on the draft guidance can be made at www.federalregister.gov and are due by June 8, 2018.
Dr. Chambers and Mr. Briggs reported no relevant disclosures.
MDedge Daily News: Skin disorders defeat weekend warriors
CMS finalizes measures to help combat the opioid crisis. Enrollment slides on health exchanges in 2018. And the sensitivity of vibration-based neuropathy detectors varies widely.
Listen to the MDedge Daily News podcast for all the details on today’s top news.
CMS finalizes measures to help combat the opioid crisis. Enrollment slides on health exchanges in 2018. And the sensitivity of vibration-based neuropathy detectors varies widely.
Listen to the MDedge Daily News podcast for all the details on today’s top news.
CMS finalizes measures to help combat the opioid crisis. Enrollment slides on health exchanges in 2018. And the sensitivity of vibration-based neuropathy detectors varies widely.
Listen to the MDedge Daily News podcast for all the details on today’s top news.

Reducing the Expenditures and Workload Associated With VA Partial-Fill Prescription Processing
According to the US Department of Veterans Affairs (VA) Pharmacy Benefits Management Service, about 80% of all outpatient prescriptions filled by the VA are sent to veterans by mail order, using the Centralized Mail Order Pharmacy (CMOP) network of highly automated pharmacies around the country.1 During fiscal year (FY) 2016, the 7 VA CMOP facilities throughout the US processed 119.7 million outpatient prescriptions. Each day, these CMOPs process nearly 470,000 prescriptions, an evidence of the efficiency provided through this mail-order service.1 The use of CMOP results in lower processing costs and increased convenience for veterans compared with filling prescriptions at pharmacies at individual VA facilities. Notably, VA CMOP has been rated “among the best” mail-order pharmacies in customer satisfaction according to the 2017 J.D. Power US Pharmacy Study.2
Background
Within the Fayetteville VA Medical Center (FVAMC) system in North Carolina, on-site patients receive a new prescription where an on-site pharmacy is available (at health care centers [HCC] and the medical center). For veterans seen at community-based outpatient clinics (CBOCs), emergent new prescriptions are filled through vouchers at contract community pharmacies, and nonemergent new prescriptions are filled by the CMOP (Figure 1). 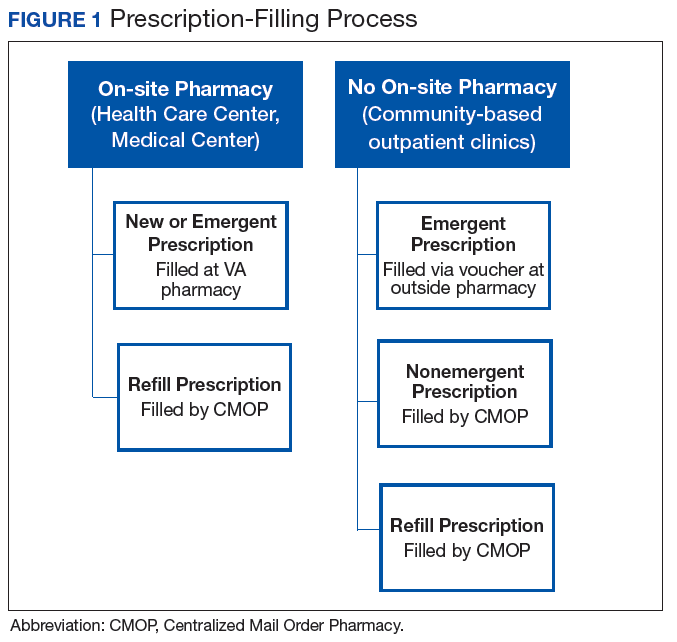
The appropriate use of the VA CMOP for refills is intended to allow on-site pharmacy staff to focus on providing customer service for veterans requesting medication counseling from a clinical pharmacist, as well as those with new, changing, or urgent prescription needs. Filling prescriptions through the CMOP also can help control the VA facility pharmacy budget.
Despite the established mail-order process, FVAMC staff noted a high volume of medication refill and partial-fill prescriptions being requested at the on-site pharmacy. When a veteran presented to a pharmacy requesting a medication refill, pharmacy staff members ordered a refill to be filled by the CMOP and provided a limited quantity, otherwise known as a partial fill, to serve as an emergency supply to supplement the veteran until the full quantity of the prescription arrived by mail. Partial fills also were completed for new prescriptions that veterans requested to pick up at the on-site pharmacy. For new 90-day supply prescriptions, pharmacy staff often filled a 30-day supply in addition to submitting the entire 90-day prescription through the CMOP, which led to an unnecessary increase in material expenditures and workload.Preliminary data noted the most frequently used partial-fill days’ supply to be 10 days. Due to the lack of partial-fill criteria, prescriptions of all classes, quantities, and days’ supplies were provided as partial fills. Prior to the implementation of this quality improvement (QI) project, there was no standard approach for how to handle these requests.
Partial fills do not provide copay reimbursement to the facility filling the prescription. In an effort to steward the funds provided to the FVAMC pharmacy department wisely, an evaluation was performed with reference to partial fills. During FY 2016, about $350,000 was spent on medications, materials, and workload associated with the partial filling of FVAMC prescriptions. With respect to unique individuals who were provided care over the course of FY 2015 and 2016, the number of unique patients served by local comparator hospitals increased by only 2%, while the number of unique patients served by FVAMC increased by 12%. This substantial growth in the number of veterans served places further emphasis on the necessity of stewarding the allotted pharmacy budget. Moreover, the excessive number of medication refill and partial-fill prescriptions filled at on-site VA pharmacies can contribute to increased wait times for veterans with urgent prescription needs.
In November 2016, FVAMC implemented an updated partial-fill guidance. Partial-fill process and refill education was provided for VA staff and veterans in an effort to allow all parties involved to use pharmacy services efficiently. This analysis reviewed the reduction in partial-fill expenditures with a secondary focus on workload expenditures following the execution of this education.
Methods
This project was deemed to be a QI project and did not require institutional review board approval. Implementation for this QI project began in November 2016. Baseline raw drug cost, number, and class of prescriptions partialed were retrospectively collected for a 90-day period prior to implementation using all available data. Postintervention data were collected for 90 days following the implementation phase to compare partial-fill expenditures and workload expenditures with baseline data.
Calculations
Materials included in the partial-fill expenditure calculation were prescription vials, prescription vial caps, and prescription labeling. Material cost per partial fill was determined by using the facility’s wholesaler acquisition unit costs to estimate a summed cost for an individual prescription vial and prescription vial cap. The estimated acquisition price of 7 prescription-labeling pages was used in the material calculation, as this was the average number of pages used when performing test partial fills.
The following equation was used to calculate total partial-fill expenditures for any specified time frame:
Total partial-fill expenditure = total raw drug cost + (material cost × number of partial fills)
In addition, the average personnel cost per partial-fill prescription was determined. Average workload expenditure per partial fill was calculated by filling a subset of 10 test prescriptions and multiplying the average time spent by an average of the general station (GS) rate for pharmacists and technicians. The average hourly rate of a GS-12 pharmacist was calculated based on an average of the 10 available pay grades within the GS-12 ranking. The average hourly rate of a GS-6 pharmacy technician was calculated based on an average of the 10 available pay grades within the GS-6 ranking.3 The average workload expenditures were calculated using the following equations:
Average pharmacist workload expenditure per partial fill = time (in hours) × average hourly rate.
Average technician workload expenditure per partial fill = time (in hours) × average hourly rate.
Partial-Fill Guidance
Updated partial-fill guidance was drafted designating acceptable prescriptions to be limited to those responsible for preventing hospitalization and treatment of acute illness. This guidance provided generalized examples of medication classes that could be acceptable for partial filling, though it was not intended to be an all-inclusive list. The guidance also noted examples of classes or groups that should not be partial filled for nonemergent reasons (vitamins, nonprescription items, antilipemics), as well as controlled substances. The refill-process education was reiterated throughout the entirety of the guidance. Specifically, if a pharmacy staff member was to perform a partial fill, a review explaining the appropriate refill process to the veteran also must be provided. If the medication was determined to be of emergent need and not yet transmitted for filling via the CMOP, the directive recommended to fill the entire quantity locally as a onetime fill.
If a onetime on-site fill was determined infeasible, partial-fill quantities were recommended to be limited to only a 7-day supply, and the full quantity filled through the CMOP. Anticipated mail wait time for CMOP prescription delivery was estimated to be less than 7 days based on experience, local pending queues, and guidance from the regional CMOP; however, time could vary among VA and CMOP facilities. Original prescriptions were to be filled for the entire quantity for the first fill at the on-site pharmacy if requested by the veteran. If the pharmacy had an insufficient quantity for an entire initial supply, it could then be partial filled for a 7-day supply and then filled through the CMOP.
The final portion of the partial-fill guidance pertained to the use of partial-fill justification codes. Prior to the execution of the partial-fill guidance, free text was entered into the comments field when processing a partial-fill prescription, as the prescription-processing system used requires a comment to proceed with the partial fill. The use of these codes served to streamline data collection in the postintervention phase and helped identify areas for further education following the close of this project.
Education
Education to the pharmacy staff was disseminated by various modalities, including in-person sessions and written and electronic correspondences. This written guidance was distributed to pharmacy staff by e-mail, the pharmacy newsletter (Rx-tra), signage posted throughout the outpatient pharmacies, and on the facility’s pharmacy Microsoft SharePoint (Redmond, WA) site. In-services provided during pharmacy staff meetings detailed information on the updated partial-fill guidance. A FVAMC Talent Management System (TMS) training module was developed and assigned to all pharmacy service staff to reiterate key points regarding this QI initiative (eAppendix).
Nonpharmacy staff were educated through staff and in-service meetings and e-mail correspondences. These in-services emphasized how nurses, medical support assistants, and health care providers (HCPs) could assist veterans by knowing the correct refill process, ensuring sufficient refills remained until the next appointment, and providing continual refill-process education.
Following implementation, all veterans receiving prescriptions through the on-site pharmacies in the FVAMC were provided a copy of the refill-process handout with each trip to the pharmacy. Nonpharmacy staff and HCPs also were provided this handout to distribute to patients. The intent of this handout was to clearly detail the various ways in which refills could be ordered and the time frame in which they should be ordered. The pharmacy became involved in new patient orientation classes for all veterans new to FVAMC. Digital signage and messaging was created and circulated throughout several of the FVAMC facilities.
Results
The results of calculations for material cost, personnel time spent, hourly employee rates, and average workload expenditure per partial fill are summarized in Table 1. 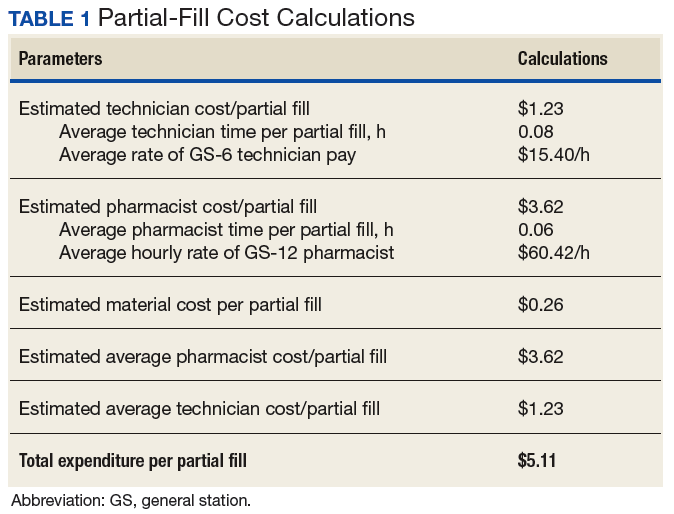
Following the implementation of partial-fill and refill-process education, there was a 54.3% decrease in the total number of partial fills from 5,596 in the 90 days prior to implementation, to 2,555 partials completed over the 90 days postimplementation. Regarding the primary objective, total partial-fill expenditures decreased from $52,015.44 to $44,063.01 (-15.3%). When dissecting the individual components of partial-fill expenditures, material expenditures decreased from $1,454.96 to $664.28 (-54.3%), and raw drug cost expenditures decreased from $50,596.48 to $43,398.73 (-14.3%). Workload expenditures also decreased from $27,140.60 to $12,391.75 (-54.3%).
Several points of descriptive information also were collected. The average days’ supply trended down from a mode of 10 days to 7 days. This reduction in days’ supply likely was seen because staff became more aware of the customary amount required to bridge the veteran until the CMOP supply arrived by mail. Postintervention data showed a 70% utilization of partial-fill reasoning codes. The reasons for partial filling of prescriptions are summarized in Table 2. 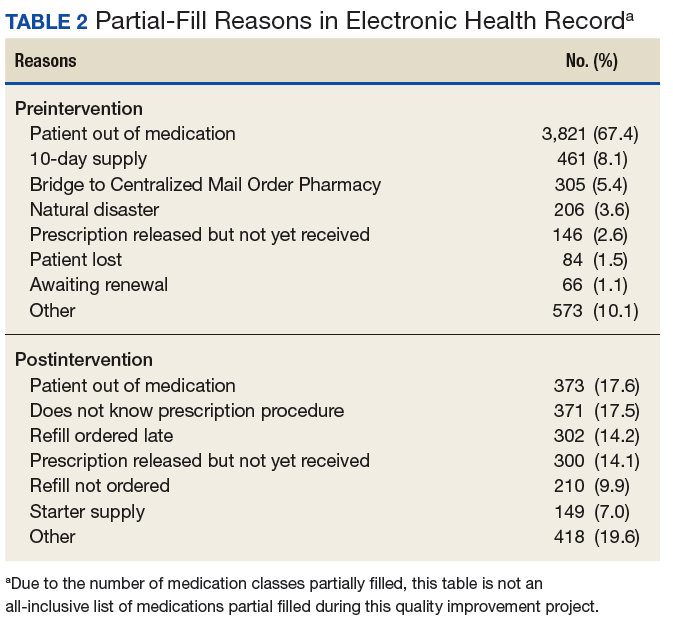
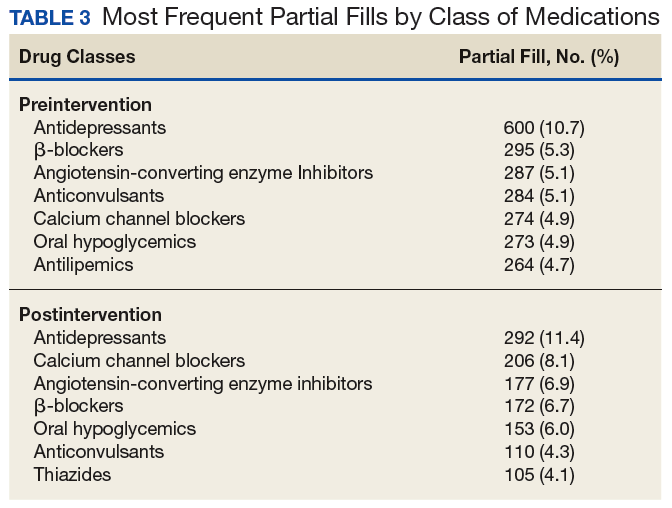
Discussion
Following the implementation of the updated partial-fill guidance and provision of education to the FVAMC veterans and staff, a noteworthy cost savings was observed with respect to both material and workload expenditures. This large reduction in expenditure likely was not related to a reduction in the total prescription volume, as the number of total prescriptions filled by the CMOP and at FVAMC were similar in both the preliminary and postintervention periods. When the results of this 3-month QI project were extrapolated, the annual projected cost avoidance was $91,949.12.
Of note, there was no established process for adjudicating appeals to the partial-fill guidance. Any extenuating circumstances that fell outside the guidance were addressed by the outpatient pharmacy supervisor. There was no formal documentation for these disputed cases. Since there was no prespecified supervisory override code, the most appropriate partial-fill code was entered into the comments field for these scenarios. As such, there is no way to distinguish precisely how many of these partial fills were escalated to a supervisory level for a decision.
The positive fiscal impact noted from the implementation of this project should not be viewed as the only utility for such guidance. Though not directly measured within the confines of this project, a reduction in pharmacy staff time spent on partial-fill prescriptions will likely result in shorter pharmacy wait times, line lengths, and streamlining of pharmacy workflow. When the pharmacy staff is free to work on pressing issues rather than on continually educating veterans on the partial-fill or refill process, many will benefit. Veteran satisfaction was not directly measured during this project but could be an interesting topic to review as a future study.
Each VA facility is unique, with its own challenges for implementation of a project such as this. Nevertheless, the incorporation of a formal guidance and education process, perhaps adapted to the indi vidual facility’s needs may be considered for overall pharmacy operations QI.
Limitations
During the preliminary data collection period, FVAMC and its catchment area were impacted by a natural disaster, Hurricane Matthew. Based on a review of the text entered into the comments field for all partial fills, about 4% of the partial fills completed in the preliminary phase can be attributed to the hurricane. The effects of this hurricane may have potentially increased the number of partial fills completed in the preliminary phase compared with that in the postintervention phase, due to the number of veterans who were temporarily or permanently displaced from their homes. This increase in partial fills and associated expenses preintervention likely caused a slightly higher cost savings to be reflected in the postimplementation phase than what would have traditionally been observed without extenuating factors.
Several other limitations must be considered for this QI project. The implementation phase, during which all education and training was completed, was only 1 month. A longer implementation period and more opportunities to educate veterans and staff might have created a greater impact on the results. Additionally, because there were no data collected on New Patient Orientation attendance for this project, it is unclear exactly how many veterans received refill-process education through this outlet.
Though all staff members were trained on the appropriate process, it was discovered during interim analysis that several pharmacists were not following the partial-fill guidance, potentially negatively impacting the results. It is likely that staff would have benefited from continual reeducation of the process throughout the entirety of the project, as the restriction of partial filling was a novel concept to many. In addition to continual reeducation of current employees, any new hires would likely need this information as part of initial training.
Cost variance in the type of partial fills completed between the preliminary and postintervention phases also may have negatively impacted the results. The postintervention phase contained 2 high-cost classes of drugs (antivirals and immunoglobulins) that received multiple partial fills but were not partialed in the preliminary phase, which increased the raw drug cost in the postintervention phase.
Conclusion
The implementation of partial-fill and process education to FVAMC staff and veterans proved beneficial in reducing the expenditures and workload associated with partial-fill prescription processing. The continued use of the updated partial-fill guidance will provide a standardized approach for pharmacy staff when completing partial-fill prescriptions.
Facilities may consider annual reeducation on their guidance through a local TMS module, as well as occasional process reminders during staff meetings to improve staff adherence to the guidance. Moreover, the sustained incorporation of improved refill process education to new patients and with every prescription pickup could help guide the FVAMC veteran population to use pharmacy services more effectively. The adoption of such procedures may be useful for VA facilities’ health care system looking to maximize the use of funding provided for prescription services as well as improve veterans’ understanding of how to appropriately order prescription refills.
1. US Department of Veterans Affairs. Pharmacy benefits management services. https://www.pbm.va.gov/PBM/CMOP/VA_Mail_Order_Pharmacy.asp. Updated July 14, 2017. Accessed on February 26, 2018.
2. J.D. Power. Decline in pharmacy customer satisfaction driven by prescription drug costs, J. D. Power finds. [press release]. http://www.jdpower.com/press-releases/jd-power-2017-us-pharmacy-study. Published September 5, 2017. Accessed February 26, 2018.
3. US Office of Personnel Management. Pay and leave. https://www.opm.gov/policy-data-oversight/pay-leave/salaries-wages/. Accessed February 26, 2018.
4. Aragon BR, Pierce RA, Jones WN. VA CMOPs: producing a pattern of quality and efficiency in government. J Am Pharm Assoc (2003). 2012;52(6):810-815.
According to the US Department of Veterans Affairs (VA) Pharmacy Benefits Management Service, about 80% of all outpatient prescriptions filled by the VA are sent to veterans by mail order, using the Centralized Mail Order Pharmacy (CMOP) network of highly automated pharmacies around the country.1 During fiscal year (FY) 2016, the 7 VA CMOP facilities throughout the US processed 119.7 million outpatient prescriptions. Each day, these CMOPs process nearly 470,000 prescriptions, an evidence of the efficiency provided through this mail-order service.1 The use of CMOP results in lower processing costs and increased convenience for veterans compared with filling prescriptions at pharmacies at individual VA facilities. Notably, VA CMOP has been rated “among the best” mail-order pharmacies in customer satisfaction according to the 2017 J.D. Power US Pharmacy Study.2
Background
Within the Fayetteville VA Medical Center (FVAMC) system in North Carolina, on-site patients receive a new prescription where an on-site pharmacy is available (at health care centers [HCC] and the medical center). For veterans seen at community-based outpatient clinics (CBOCs), emergent new prescriptions are filled through vouchers at contract community pharmacies, and nonemergent new prescriptions are filled by the CMOP (Figure 1).
The appropriate use of the VA CMOP for refills is intended to allow on-site pharmacy staff to focus on providing customer service for veterans requesting medication counseling from a clinical pharmacist, as well as those with new, changing, or urgent prescription needs. Filling prescriptions through the CMOP also can help control the VA facility pharmacy budget.
Despite the established mail-order process, FVAMC staff noted a high volume of medication refill and partial-fill prescriptions being requested at the on-site pharmacy. When a veteran presented to a pharmacy requesting a medication refill, pharmacy staff members ordered a refill to be filled by the CMOP and provided a limited quantity, otherwise known as a partial fill, to serve as an emergency supply to supplement the veteran until the full quantity of the prescription arrived by mail. Partial fills also were completed for new prescriptions that veterans requested to pick up at the on-site pharmacy. For new 90-day supply prescriptions, pharmacy staff often filled a 30-day supply in addition to submitting the entire 90-day prescription through the CMOP, which led to an unnecessary increase in material expenditures and workload.Preliminary data noted the most frequently used partial-fill days’ supply to be 10 days. Due to the lack of partial-fill criteria, prescriptions of all classes, quantities, and days’ supplies were provided as partial fills. Prior to the implementation of this quality improvement (QI) project, there was no standard approach for how to handle these requests.
Partial fills do not provide copay reimbursement to the facility filling the prescription. In an effort to steward the funds provided to the FVAMC pharmacy department wisely, an evaluation was performed with reference to partial fills. During FY 2016, about $350,000 was spent on medications, materials, and workload associated with the partial filling of FVAMC prescriptions. With respect to unique individuals who were provided care over the course of FY 2015 and 2016, the number of unique patients served by local comparator hospitals increased by only 2%, while the number of unique patients served by FVAMC increased by 12%. This substantial growth in the number of veterans served places further emphasis on the necessity of stewarding the allotted pharmacy budget. Moreover, the excessive number of medication refill and partial-fill prescriptions filled at on-site VA pharmacies can contribute to increased wait times for veterans with urgent prescription needs.
In November 2016, FVAMC implemented an updated partial-fill guidance. Partial-fill process and refill education was provided for VA staff and veterans in an effort to allow all parties involved to use pharmacy services efficiently. This analysis reviewed the reduction in partial-fill expenditures with a secondary focus on workload expenditures following the execution of this education.
Methods
This project was deemed to be a QI project and did not require institutional review board approval. Implementation for this QI project began in November 2016. Baseline raw drug cost, number, and class of prescriptions partialed were retrospectively collected for a 90-day period prior to implementation using all available data. Postintervention data were collected for 90 days following the implementation phase to compare partial-fill expenditures and workload expenditures with baseline data.
Calculations
Materials included in the partial-fill expenditure calculation were prescription vials, prescription vial caps, and prescription labeling. Material cost per partial fill was determined by using the facility’s wholesaler acquisition unit costs to estimate a summed cost for an individual prescription vial and prescription vial cap. The estimated acquisition price of 7 prescription-labeling pages was used in the material calculation, as this was the average number of pages used when performing test partial fills.
The following equation was used to calculate total partial-fill expenditures for any specified time frame:
Total partial-fill expenditure = total raw drug cost + (material cost × number of partial fills)
In addition, the average personnel cost per partial-fill prescription was determined. Average workload expenditure per partial fill was calculated by filling a subset of 10 test prescriptions and multiplying the average time spent by an average of the general station (GS) rate for pharmacists and technicians. The average hourly rate of a GS-12 pharmacist was calculated based on an average of the 10 available pay grades within the GS-12 ranking. The average hourly rate of a GS-6 pharmacy technician was calculated based on an average of the 10 available pay grades within the GS-6 ranking.3 The average workload expenditures were calculated using the following equations:
Average pharmacist workload expenditure per partial fill = time (in hours) × average hourly rate.
Average technician workload expenditure per partial fill = time (in hours) × average hourly rate.
Partial-Fill Guidance
Updated partial-fill guidance was drafted designating acceptable prescriptions to be limited to those responsible for preventing hospitalization and treatment of acute illness. This guidance provided generalized examples of medication classes that could be acceptable for partial filling, though it was not intended to be an all-inclusive list. The guidance also noted examples of classes or groups that should not be partial filled for nonemergent reasons (vitamins, nonprescription items, antilipemics), as well as controlled substances. The refill-process education was reiterated throughout the entirety of the guidance. Specifically, if a pharmacy staff member was to perform a partial fill, a review explaining the appropriate refill process to the veteran also must be provided. If the medication was determined to be of emergent need and not yet transmitted for filling via the CMOP, the directive recommended to fill the entire quantity locally as a onetime fill.
If a onetime on-site fill was determined infeasible, partial-fill quantities were recommended to be limited to only a 7-day supply, and the full quantity filled through the CMOP. Anticipated mail wait time for CMOP prescription delivery was estimated to be less than 7 days based on experience, local pending queues, and guidance from the regional CMOP; however, time could vary among VA and CMOP facilities. Original prescriptions were to be filled for the entire quantity for the first fill at the on-site pharmacy if requested by the veteran. If the pharmacy had an insufficient quantity for an entire initial supply, it could then be partial filled for a 7-day supply and then filled through the CMOP.
The final portion of the partial-fill guidance pertained to the use of partial-fill justification codes. Prior to the execution of the partial-fill guidance, free text was entered into the comments field when processing a partial-fill prescription, as the prescription-processing system used requires a comment to proceed with the partial fill. The use of these codes served to streamline data collection in the postintervention phase and helped identify areas for further education following the close of this project.
Education
Education to the pharmacy staff was disseminated by various modalities, including in-person sessions and written and electronic correspondences. This written guidance was distributed to pharmacy staff by e-mail, the pharmacy newsletter (Rx-tra), signage posted throughout the outpatient pharmacies, and on the facility’s pharmacy Microsoft SharePoint (Redmond, WA) site. In-services provided during pharmacy staff meetings detailed information on the updated partial-fill guidance. A FVAMC Talent Management System (TMS) training module was developed and assigned to all pharmacy service staff to reiterate key points regarding this QI initiative (eAppendix).
Nonpharmacy staff were educated through staff and in-service meetings and e-mail correspondences. These in-services emphasized how nurses, medical support assistants, and health care providers (HCPs) could assist veterans by knowing the correct refill process, ensuring sufficient refills remained until the next appointment, and providing continual refill-process education.
Following implementation, all veterans receiving prescriptions through the on-site pharmacies in the FVAMC were provided a copy of the refill-process handout with each trip to the pharmacy. Nonpharmacy staff and HCPs also were provided this handout to distribute to patients. The intent of this handout was to clearly detail the various ways in which refills could be ordered and the time frame in which they should be ordered. The pharmacy became involved in new patient orientation classes for all veterans new to FVAMC. Digital signage and messaging was created and circulated throughout several of the FVAMC facilities.
Results
The results of calculations for material cost, personnel time spent, hourly employee rates, and average workload expenditure per partial fill are summarized in Table 1.
Following the implementation of partial-fill and refill-process education, there was a 54.3% decrease in the total number of partial fills from 5,596 in the 90 days prior to implementation, to 2,555 partials completed over the 90 days postimplementation. Regarding the primary objective, total partial-fill expenditures decreased from $52,015.44 to $44,063.01 (-15.3%). When dissecting the individual components of partial-fill expenditures, material expenditures decreased from $1,454.96 to $664.28 (-54.3%), and raw drug cost expenditures decreased from $50,596.48 to $43,398.73 (-14.3%). Workload expenditures also decreased from $27,140.60 to $12,391.75 (-54.3%).
Several points of descriptive information also were collected. The average days’ supply trended down from a mode of 10 days to 7 days. This reduction in days’ supply likely was seen because staff became more aware of the customary amount required to bridge the veteran until the CMOP supply arrived by mail. Postintervention data showed a 70% utilization of partial-fill reasoning codes. The reasons for partial filling of prescriptions are summarized in Table 2.
Discussion
Following the implementation of the updated partial-fill guidance and provision of education to the FVAMC veterans and staff, a noteworthy cost savings was observed with respect to both material and workload expenditures. This large reduction in expenditure likely was not related to a reduction in the total prescription volume, as the number of total prescriptions filled by the CMOP and at FVAMC were similar in both the preliminary and postintervention periods. When the results of this 3-month QI project were extrapolated, the annual projected cost avoidance was $91,949.12.
Of note, there was no established process for adjudicating appeals to the partial-fill guidance. Any extenuating circumstances that fell outside the guidance were addressed by the outpatient pharmacy supervisor. There was no formal documentation for these disputed cases. Since there was no prespecified supervisory override code, the most appropriate partial-fill code was entered into the comments field for these scenarios. As such, there is no way to distinguish precisely how many of these partial fills were escalated to a supervisory level for a decision.
The positive fiscal impact noted from the implementation of this project should not be viewed as the only utility for such guidance. Though not directly measured within the confines of this project, a reduction in pharmacy staff time spent on partial-fill prescriptions will likely result in shorter pharmacy wait times, line lengths, and streamlining of pharmacy workflow. When the pharmacy staff is free to work on pressing issues rather than on continually educating veterans on the partial-fill or refill process, many will benefit. Veteran satisfaction was not directly measured during this project but could be an interesting topic to review as a future study.
Each VA facility is unique, with its own challenges for implementation of a project such as this. Nevertheless, the incorporation of a formal guidance and education process, perhaps adapted to the indi vidual facility’s needs may be considered for overall pharmacy operations QI.
Limitations
During the preliminary data collection period, FVAMC and its catchment area were impacted by a natural disaster, Hurricane Matthew. Based on a review of the text entered into the comments field for all partial fills, about 4% of the partial fills completed in the preliminary phase can be attributed to the hurricane. The effects of this hurricane may have potentially increased the number of partial fills completed in the preliminary phase compared with that in the postintervention phase, due to the number of veterans who were temporarily or permanently displaced from their homes. This increase in partial fills and associated expenses preintervention likely caused a slightly higher cost savings to be reflected in the postimplementation phase than what would have traditionally been observed without extenuating factors.
Several other limitations must be considered for this QI project. The implementation phase, during which all education and training was completed, was only 1 month. A longer implementation period and more opportunities to educate veterans and staff might have created a greater impact on the results. Additionally, because there were no data collected on New Patient Orientation attendance for this project, it is unclear exactly how many veterans received refill-process education through this outlet.
Though all staff members were trained on the appropriate process, it was discovered during interim analysis that several pharmacists were not following the partial-fill guidance, potentially negatively impacting the results. It is likely that staff would have benefited from continual reeducation of the process throughout the entirety of the project, as the restriction of partial filling was a novel concept to many. In addition to continual reeducation of current employees, any new hires would likely need this information as part of initial training.
Cost variance in the type of partial fills completed between the preliminary and postintervention phases also may have negatively impacted the results. The postintervention phase contained 2 high-cost classes of drugs (antivirals and immunoglobulins) that received multiple partial fills but were not partialed in the preliminary phase, which increased the raw drug cost in the postintervention phase.
Conclusion
The implementation of partial-fill and process education to FVAMC staff and veterans proved beneficial in reducing the expenditures and workload associated with partial-fill prescription processing. The continued use of the updated partial-fill guidance will provide a standardized approach for pharmacy staff when completing partial-fill prescriptions.
Facilities may consider annual reeducation on their guidance through a local TMS module, as well as occasional process reminders during staff meetings to improve staff adherence to the guidance. Moreover, the sustained incorporation of improved refill process education to new patients and with every prescription pickup could help guide the FVAMC veteran population to use pharmacy services more effectively. The adoption of such procedures may be useful for VA facilities’ health care system looking to maximize the use of funding provided for prescription services as well as improve veterans’ understanding of how to appropriately order prescription refills.
1. US Department of Veterans Affairs. Pharmacy benefits management services. https://www.pbm.va.gov/PBM/CMOP/VA_Mail_Order_Pharmacy.asp. Updated July 14, 2017. Accessed on February 26, 2018.
2. J.D. Power. Decline in pharmacy customer satisfaction driven by prescription drug costs, J. D. Power finds. [press release]. http://www.jdpower.com/press-releases/jd-power-2017-us-pharmacy-study. Published September 5, 2017. Accessed February 26, 2018.
3. US Office of Personnel Management. Pay and leave. https://www.opm.gov/policy-data-oversight/pay-leave/salaries-wages/. Accessed February 26, 2018.
4. Aragon BR, Pierce RA, Jones WN. VA CMOPs: producing a pattern of quality and efficiency in government. J Am Pharm Assoc (2003). 2012;52(6):810-815.