User login
Do You Trust Your Employer?
Recently, I was talking with a colleague who works for a large hospital and health care system. While discussing his experiences over the past five years, he suddenly stopped and blurted out, “I don’t trust this organization. Nobody trusts this organization!”
Taken aback, I asked what made him say that.
First of all, he explained, there is a complete and pervasive lack of transparency as to both short- and long-term goals for the organization. Information is treated as proprietary thinking by nonclinical “corporate folks” and not released to the boots-on-the-ground clinician—which makes it difficult to work toward goals efficiently.
Furthermore, he related, there is consistent failure to provide accurate financial data or any plans to improve the organization’s financial position in the marketplace. This prevents providers from making a positive impact on cost containment. No one is invested. Provider compensation packages are neither universal nor simple. The financial folks devise complex formulas that do not account for the vagaries and complexities of health care. This health care organization views every patient as a Financial Information Number and makes no allowance for the fact that many have complex illnesses requiring significant time and attention.
Lastly, he described a systematic and insidious elimination of support staff at all levels—but particularly bedside nurses. The traditional “nursing safety net”—especially relevant in academic institutions—is in tatters, which threatens to undermine day-to-day success in patient care. Staffing of ancillary providers (those in physical, occupational, or speech-language therapy) has been cut back, which means patients wait longer to see these specialists and primary medical providers are frustrated by the lack of progress their patients make.
Stunned by his comments, I started thinking: How many of us recognize some or all of this description? How many trust the organization we work for? Realizing that a huge percentage of NPs, PAs, and physicians work for large entities, these are important questions.
Trust is central to human interaction on both personal and professional levels. Tschannen-Moran defines it as “one’s willingness to be vulnerable to another, based on the confidence that the other is benevolent, honest, open, reliable, and competent.”1
Continue to: A more focused definition of organizational trust
Organizational trust may require a broader and yet more focused definition—such as that of Cummings and Bromley, who stipulate that trust is a belief, held by an individual or groups of individuals, that another individual or group
- Makes a good faith effort to behave in accordance with any (explicit or implicit) commitments
- Is honest
- Does not take excessive advantage of another, even when the opportunity to do so exists.2
Thus, organizational (or collective) trust refers to the propensity of workgroups, administrators, and employees to trust others within the organization.
But does it really matter if we experience this kind of trust for our employer? Can’t we just show up and do our jobs? Frankly, no (at least, if we truly care about the work that we do).
Research has demonstrated that trust is a critical part of creating a shared vision; employees tend to help one another and work collaboratively when trust is present.3,4 Trust is also the foundation for flexibility and innovation.5 Employees are generally happier, more satisfied, and less stressed in high-trust organizations—and it has been shown that organizations benefit, too.6
By contrast, low-trust organizations usually create barriers to effective performance. In the absence of trust, people create rules and restrictions that mandate how others should act.4 Valuable time is then spent studying, enforcing, discussing, and rewriting rules. This yields low-flexibility results and leaves employees to simply follow and enforce policies. Another outcome is high transaction costs and less efficient work—meaning that processes become slower and more restricted by policies and paperwork.4 Low trust is also a barrier to change.7
Although we recognize organizational trust as an essential component of effective leadership, it remains an issue—one that can make or break an organization’s culture. Lack of trust, particularly between management and employees, creates a hostile work environment in which stress levels are high and productivity is reduced.
Continue to: Three dimensions of trust
There are three dimensions of trust, according to the Grunig Relationship Instrument:
Competence: The belief that an organization has the ability to do what it says it will do (this includes effectiveness and survivability in the marketplace).
Integrity: The belief that an organization is fair and just.
Dependability/reliability: The belief that an organization will do what it says it will do (ie, acts consistently and dependably).8
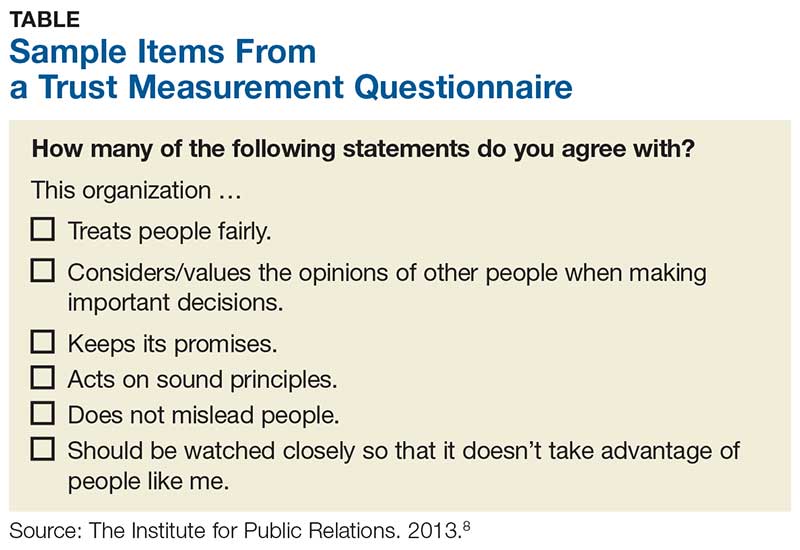
These concepts have been integrated into a “trust measurement questionnaire” that assists in the assessment of an organization’s trustworthiness. While this tool has been used in a variety of industries and has even been used to assess business-to-business relationships, some of the most relevant items for individual employees are outlined in the Table.8
But measuring trust is only effective if it leads to action. Once you’ve realized you don’t trust your employer, what should you do about it? Unfortunately, the answer is often “push for change or leave!” Aside from voicing your concerns or requesting more information (or leaving), the onus is really on the leaders of the organization to improve communication (among other things).
Continue to: 7 ways leaders can improve trust within their organization
According to Gleeson, there are seven ways leaders can improve trust within their organization, which include
- Having the right people in the right job, since trust must be demonstrated from top to bottom and vice versa
- Being transparent
- Sharing information with all vested parties, from industry partners to customers to employees
- Providing resources to all parties in an equitable manner
- Offering feedback to employees at all levels, perhaps through regular “status update” meetings
- Facing challenges head-on, using teamwork to promote trust and positive attitudes
- Leading by example—the organization’s values and mission should be exemplified by everyone.9
If we want to be leaders, not only within our professions but within our workplaces, we must nurture the ideas of trust, transparency, and communication. I am very interested in hearing from you about organizations that you feel are trustworthy and what makes them so—and what experiences you’ve had that led you to avoid or leave employment situations (you need not “name names,” of course). You can reach me at [email protected].
1. Tschannen-Moran M. Trust Matters: Leadership for Successful Schools. San Francisco, CA: Jossey-Bass; 2004.
2. Cummings LL, Bromley P. The organizational trust inventory (OTI): development and validation. In: Kramer R, Tyler E, eds. Trust in Organizations: Frontiers of Theory and Research. Thousand Oaks, CA: Sage; 1996:302, 330, 429.
3. Roueche JE, Baker GA, Rose RR, eds. Shared Vision: Transformational Leadership in American Community Colleges. Washington, DC: American Association of Community and Junior Colleges; 1989.
4. Henkin AB, Dee JR. The power of trust: teams and collective action in self-managed schools. J School Leadership. 2001;11(1):48-62.
5. Dervitsiotis KN. Building trust for excellence in performance and adaptation to change. Total Qual Manage Bus Excellence. 2006;17(7):795-810.
6. Costa AC, Roe RA, Taillieu T. Trust within teams: the relation with performance effectiveness. Eur J Work Org Psychol. 2001;10(3):225.
7. Kesler R, Perry C, Shay G. So they are resistant to change? Strategies for moving an immovable object. In: The Olympics of Leadership: Overcoming Obstacles, Balancing Skills, Taking Risks: Proceedings of the Annual International Conference of the National Community College Chair Academy (5th, Phoenix, Arizona, February 14-17, 1996). Mesa, AZ: National Community College Chair Academy; 1996.
8. The Institute for Public Relations Commission on PR Measurement and Evaluation, University of Florida. Guidelines for measuring trust in organizations. 2013. http://painepublishing.com/wp-content/uploads/2013/10/Grunig-relationship-instrument.pdf. Accessed March 13, 2018.
9. Gleeson B. 7 ways leaders can improve trust within their organizations. Published June 24, 2015. Inc.com. www.inc.com/brent-gleeson/7-ways-leaders-can-improve-trust-within-their-organizations.html. Accessed March 13, 2018.

Recently, I was talking with a colleague who works for a large hospital and health care system. While discussing his experiences over the past five years, he suddenly stopped and blurted out, “I don’t trust this organization. Nobody trusts this organization!”
Taken aback, I asked what made him say that.
First of all, he explained, there is a complete and pervasive lack of transparency as to both short- and long-term goals for the organization. Information is treated as proprietary thinking by nonclinical “corporate folks” and not released to the boots-on-the-ground clinician—which makes it difficult to work toward goals efficiently.
Furthermore, he related, there is consistent failure to provide accurate financial data or any plans to improve the organization’s financial position in the marketplace. This prevents providers from making a positive impact on cost containment. No one is invested. Provider compensation packages are neither universal nor simple. The financial folks devise complex formulas that do not account for the vagaries and complexities of health care. This health care organization views every patient as a Financial Information Number and makes no allowance for the fact that many have complex illnesses requiring significant time and attention.
Lastly, he described a systematic and insidious elimination of support staff at all levels—but particularly bedside nurses. The traditional “nursing safety net”—especially relevant in academic institutions—is in tatters, which threatens to undermine day-to-day success in patient care. Staffing of ancillary providers (those in physical, occupational, or speech-language therapy) has been cut back, which means patients wait longer to see these specialists and primary medical providers are frustrated by the lack of progress their patients make.
Stunned by his comments, I started thinking: How many of us recognize some or all of this description? How many trust the organization we work for? Realizing that a huge percentage of NPs, PAs, and physicians work for large entities, these are important questions.
Trust is central to human interaction on both personal and professional levels. Tschannen-Moran defines it as “one’s willingness to be vulnerable to another, based on the confidence that the other is benevolent, honest, open, reliable, and competent.”1
Continue to: A more focused definition of organizational trust
Organizational trust may require a broader and yet more focused definition—such as that of Cummings and Bromley, who stipulate that trust is a belief, held by an individual or groups of individuals, that another individual or group
- Makes a good faith effort to behave in accordance with any (explicit or implicit) commitments
- Is honest
- Does not take excessive advantage of another, even when the opportunity to do so exists.2
Thus, organizational (or collective) trust refers to the propensity of workgroups, administrators, and employees to trust others within the organization.
But does it really matter if we experience this kind of trust for our employer? Can’t we just show up and do our jobs? Frankly, no (at least, if we truly care about the work that we do).
Research has demonstrated that trust is a critical part of creating a shared vision; employees tend to help one another and work collaboratively when trust is present.3,4 Trust is also the foundation for flexibility and innovation.5 Employees are generally happier, more satisfied, and less stressed in high-trust organizations—and it has been shown that organizations benefit, too.6
By contrast, low-trust organizations usually create barriers to effective performance. In the absence of trust, people create rules and restrictions that mandate how others should act.4 Valuable time is then spent studying, enforcing, discussing, and rewriting rules. This yields low-flexibility results and leaves employees to simply follow and enforce policies. Another outcome is high transaction costs and less efficient work—meaning that processes become slower and more restricted by policies and paperwork.4 Low trust is also a barrier to change.7
Although we recognize organizational trust as an essential component of effective leadership, it remains an issue—one that can make or break an organization’s culture. Lack of trust, particularly between management and employees, creates a hostile work environment in which stress levels are high and productivity is reduced.
Continue to: Three dimensions of trust
There are three dimensions of trust, according to the Grunig Relationship Instrument:
Competence: The belief that an organization has the ability to do what it says it will do (this includes effectiveness and survivability in the marketplace).
Integrity: The belief that an organization is fair and just.
Dependability/reliability: The belief that an organization will do what it says it will do (ie, acts consistently and dependably).8
These concepts have been integrated into a “trust measurement questionnaire” that assists in the assessment of an organization’s trustworthiness. While this tool has been used in a variety of industries and has even been used to assess business-to-business relationships, some of the most relevant items for individual employees are outlined in the Table.8
But measuring trust is only effective if it leads to action. Once you’ve realized you don’t trust your employer, what should you do about it? Unfortunately, the answer is often “push for change or leave!” Aside from voicing your concerns or requesting more information (or leaving), the onus is really on the leaders of the organization to improve communication (among other things).
Continue to: 7 ways leaders can improve trust within their organization
According to Gleeson, there are seven ways leaders can improve trust within their organization, which include
- Having the right people in the right job, since trust must be demonstrated from top to bottom and vice versa
- Being transparent
- Sharing information with all vested parties, from industry partners to customers to employees
- Providing resources to all parties in an equitable manner
- Offering feedback to employees at all levels, perhaps through regular “status update” meetings
- Facing challenges head-on, using teamwork to promote trust and positive attitudes
- Leading by example—the organization’s values and mission should be exemplified by everyone.9
If we want to be leaders, not only within our professions but within our workplaces, we must nurture the ideas of trust, transparency, and communication. I am very interested in hearing from you about organizations that you feel are trustworthy and what makes them so—and what experiences you’ve had that led you to avoid or leave employment situations (you need not “name names,” of course). You can reach me at [email protected].
Recently, I was talking with a colleague who works for a large hospital and health care system. While discussing his experiences over the past five years, he suddenly stopped and blurted out, “I don’t trust this organization. Nobody trusts this organization!”
Taken aback, I asked what made him say that.
First of all, he explained, there is a complete and pervasive lack of transparency as to both short- and long-term goals for the organization. Information is treated as proprietary thinking by nonclinical “corporate folks” and not released to the boots-on-the-ground clinician—which makes it difficult to work toward goals efficiently.
Furthermore, he related, there is consistent failure to provide accurate financial data or any plans to improve the organization’s financial position in the marketplace. This prevents providers from making a positive impact on cost containment. No one is invested. Provider compensation packages are neither universal nor simple. The financial folks devise complex formulas that do not account for the vagaries and complexities of health care. This health care organization views every patient as a Financial Information Number and makes no allowance for the fact that many have complex illnesses requiring significant time and attention.
Lastly, he described a systematic and insidious elimination of support staff at all levels—but particularly bedside nurses. The traditional “nursing safety net”—especially relevant in academic institutions—is in tatters, which threatens to undermine day-to-day success in patient care. Staffing of ancillary providers (those in physical, occupational, or speech-language therapy) has been cut back, which means patients wait longer to see these specialists and primary medical providers are frustrated by the lack of progress their patients make.
Stunned by his comments, I started thinking: How many of us recognize some or all of this description? How many trust the organization we work for? Realizing that a huge percentage of NPs, PAs, and physicians work for large entities, these are important questions.
Trust is central to human interaction on both personal and professional levels. Tschannen-Moran defines it as “one’s willingness to be vulnerable to another, based on the confidence that the other is benevolent, honest, open, reliable, and competent.”1
Continue to: A more focused definition of organizational trust
Organizational trust may require a broader and yet more focused definition—such as that of Cummings and Bromley, who stipulate that trust is a belief, held by an individual or groups of individuals, that another individual or group
- Makes a good faith effort to behave in accordance with any (explicit or implicit) commitments
- Is honest
- Does not take excessive advantage of another, even when the opportunity to do so exists.2
Thus, organizational (or collective) trust refers to the propensity of workgroups, administrators, and employees to trust others within the organization.
But does it really matter if we experience this kind of trust for our employer? Can’t we just show up and do our jobs? Frankly, no (at least, if we truly care about the work that we do).
Research has demonstrated that trust is a critical part of creating a shared vision; employees tend to help one another and work collaboratively when trust is present.3,4 Trust is also the foundation for flexibility and innovation.5 Employees are generally happier, more satisfied, and less stressed in high-trust organizations—and it has been shown that organizations benefit, too.6
By contrast, low-trust organizations usually create barriers to effective performance. In the absence of trust, people create rules and restrictions that mandate how others should act.4 Valuable time is then spent studying, enforcing, discussing, and rewriting rules. This yields low-flexibility results and leaves employees to simply follow and enforce policies. Another outcome is high transaction costs and less efficient work—meaning that processes become slower and more restricted by policies and paperwork.4 Low trust is also a barrier to change.7
Although we recognize organizational trust as an essential component of effective leadership, it remains an issue—one that can make or break an organization’s culture. Lack of trust, particularly between management and employees, creates a hostile work environment in which stress levels are high and productivity is reduced.
Continue to: Three dimensions of trust
There are three dimensions of trust, according to the Grunig Relationship Instrument:
Competence: The belief that an organization has the ability to do what it says it will do (this includes effectiveness and survivability in the marketplace).
Integrity: The belief that an organization is fair and just.
Dependability/reliability: The belief that an organization will do what it says it will do (ie, acts consistently and dependably).8
These concepts have been integrated into a “trust measurement questionnaire” that assists in the assessment of an organization’s trustworthiness. While this tool has been used in a variety of industries and has even been used to assess business-to-business relationships, some of the most relevant items for individual employees are outlined in the Table.8
But measuring trust is only effective if it leads to action. Once you’ve realized you don’t trust your employer, what should you do about it? Unfortunately, the answer is often “push for change or leave!” Aside from voicing your concerns or requesting more information (or leaving), the onus is really on the leaders of the organization to improve communication (among other things).
Continue to: 7 ways leaders can improve trust within their organization
According to Gleeson, there are seven ways leaders can improve trust within their organization, which include
- Having the right people in the right job, since trust must be demonstrated from top to bottom and vice versa
- Being transparent
- Sharing information with all vested parties, from industry partners to customers to employees
- Providing resources to all parties in an equitable manner
- Offering feedback to employees at all levels, perhaps through regular “status update” meetings
- Facing challenges head-on, using teamwork to promote trust and positive attitudes
- Leading by example—the organization’s values and mission should be exemplified by everyone.9
If we want to be leaders, not only within our professions but within our workplaces, we must nurture the ideas of trust, transparency, and communication. I am very interested in hearing from you about organizations that you feel are trustworthy and what makes them so—and what experiences you’ve had that led you to avoid or leave employment situations (you need not “name names,” of course). You can reach me at [email protected].
1. Tschannen-Moran M. Trust Matters: Leadership for Successful Schools. San Francisco, CA: Jossey-Bass; 2004.
2. Cummings LL, Bromley P. The organizational trust inventory (OTI): development and validation. In: Kramer R, Tyler E, eds. Trust in Organizations: Frontiers of Theory and Research. Thousand Oaks, CA: Sage; 1996:302, 330, 429.
3. Roueche JE, Baker GA, Rose RR, eds. Shared Vision: Transformational Leadership in American Community Colleges. Washington, DC: American Association of Community and Junior Colleges; 1989.
4. Henkin AB, Dee JR. The power of trust: teams and collective action in self-managed schools. J School Leadership. 2001;11(1):48-62.
5. Dervitsiotis KN. Building trust for excellence in performance and adaptation to change. Total Qual Manage Bus Excellence. 2006;17(7):795-810.
6. Costa AC, Roe RA, Taillieu T. Trust within teams: the relation with performance effectiveness. Eur J Work Org Psychol. 2001;10(3):225.
7. Kesler R, Perry C, Shay G. So they are resistant to change? Strategies for moving an immovable object. In: The Olympics of Leadership: Overcoming Obstacles, Balancing Skills, Taking Risks: Proceedings of the Annual International Conference of the National Community College Chair Academy (5th, Phoenix, Arizona, February 14-17, 1996). Mesa, AZ: National Community College Chair Academy; 1996.
8. The Institute for Public Relations Commission on PR Measurement and Evaluation, University of Florida. Guidelines for measuring trust in organizations. 2013. http://painepublishing.com/wp-content/uploads/2013/10/Grunig-relationship-instrument.pdf. Accessed March 13, 2018.
9. Gleeson B. 7 ways leaders can improve trust within their organizations. Published June 24, 2015. Inc.com. www.inc.com/brent-gleeson/7-ways-leaders-can-improve-trust-within-their-organizations.html. Accessed March 13, 2018.
1. Tschannen-Moran M. Trust Matters: Leadership for Successful Schools. San Francisco, CA: Jossey-Bass; 2004.
2. Cummings LL, Bromley P. The organizational trust inventory (OTI): development and validation. In: Kramer R, Tyler E, eds. Trust in Organizations: Frontiers of Theory and Research. Thousand Oaks, CA: Sage; 1996:302, 330, 429.
3. Roueche JE, Baker GA, Rose RR, eds. Shared Vision: Transformational Leadership in American Community Colleges. Washington, DC: American Association of Community and Junior Colleges; 1989.
4. Henkin AB, Dee JR. The power of trust: teams and collective action in self-managed schools. J School Leadership. 2001;11(1):48-62.
5. Dervitsiotis KN. Building trust for excellence in performance and adaptation to change. Total Qual Manage Bus Excellence. 2006;17(7):795-810.
6. Costa AC, Roe RA, Taillieu T. Trust within teams: the relation with performance effectiveness. Eur J Work Org Psychol. 2001;10(3):225.
7. Kesler R, Perry C, Shay G. So they are resistant to change? Strategies for moving an immovable object. In: The Olympics of Leadership: Overcoming Obstacles, Balancing Skills, Taking Risks: Proceedings of the Annual International Conference of the National Community College Chair Academy (5th, Phoenix, Arizona, February 14-17, 1996). Mesa, AZ: National Community College Chair Academy; 1996.
8. The Institute for Public Relations Commission on PR Measurement and Evaluation, University of Florida. Guidelines for measuring trust in organizations. 2013. http://painepublishing.com/wp-content/uploads/2013/10/Grunig-relationship-instrument.pdf. Accessed March 13, 2018.
9. Gleeson B. 7 ways leaders can improve trust within their organizations. Published June 24, 2015. Inc.com. www.inc.com/brent-gleeson/7-ways-leaders-can-improve-trust-within-their-organizations.html. Accessed March 13, 2018.
A guide to providing wide-ranging care to newborns
Caring for a newborn can be a source of joy for family physicians (FPs). In this article, we examine care provided in the first month of life, including a thorough physical examination, safe hospital discharge procedures, assessment of neonatal feeding, evaluation of jaundice and fever, and prevention of sudden infant death syndrome (SIDS). In addition, we describe how FPs can support women of childbearing age between pregnancies, with the goal of reducing the risk of adverse outcomes in future pregnancies. (See “Your role in risk assessment and interventions during the interconception period.”)
SIDEBAR
Your role in risk assessment and interventions during the interconception period
Interconception care is the care of women of childbearing age between pregnancies (from the end of a pregnancy to conception of the next). It includes medical and psychological interventions to modify their risk factors to improve future birth outcomes. In 2006, the Centers for Disease Control and Prevention Work Group and Select Panel on Preconception Care recommended risk assessment and intervention in the interconception period, especially for women who have experienced previous adverse outcomes of pregnancy.1
After the birth of a child, many women who had been receiving regular prenatal care stop seeing providers for their health care or return to a pattern of fragmented care.2-4 They often revert to behaviors, such as smoking and substance abuse, that put future pregnancies at risk.2,4,5 In addition, the maternal and family focus often shifts from caring for the woman to caring for the newborn, ignoring the health care needs of the mother.2,4,5
The IMPLICIT (Interventions to Minimize Preterm and Low birth weight Infants through Continuous Improvement Techniques) Network is a perinatal quality collaborative of family medicine residency programs and community health centers that uses continuous quality improvement processes to improve the health of women and decrease preterm birth and infant mortaility.6,7 The IMPLICIT interconception care model targets 4 risk factors that not only meet the model's requirements, but have a solid base of evidence5-8 by which to mitigate those risk factors and thus improve birth outcomes:
- tobacco use
- depression risk
- use of contraception to prolong interpregnancy interval
- use of a multivitamin with folic acid.
During newborn and well-child visits, screening for maternal health in these 4 key areas and providing point-of-care interventions can markedly improve maternal and perinatal health outcomes. Although the IMPLICIT Network continues to engage in the study of this model of addressing maternal health during newborn and infant visits, initial evidence demonstrates that these interventions exert positive effects on modifiable risk factors.6,8,9
Sidebar references
1. Johnson K, Posner SF, Biermann J, et al. Recommendations to improve preconception health and health care---United States. A report of the CDC/ATSDR Preconception Care Work Group and the Select Panel on Preconception Care. April 21, 2006. Available at: https://www.cdc.gov/mmwr/preview/mmwrhtml/rr5506a1.htm. Accessed February 1, 2018.
2. DiBari JN, Yu SM, Chao SM, et al. Use of postpartum care: predictors and barriers. J Pregnancy. 2014;2014:530769.
3. Liberto TL. Screening for depression and help-seeking in postpartum women during well-baby pediatric visits: an integrated review. J Pediatr Health Care. 2012;26:109-117.
4. Fung WL, Goldstein AO, Butzen AY, et al. Smoking cessation in pregnancy: a review of postpartum relapse prevention strategies. J Am Board Fam Prac. 2004;17:264-275.
5. Fang W, Goldstein AO, Butzen AY, et al. Smoking cessation in pregnancy: a review of postpartum relapse prevention strategies. J Am Board Fam Pract. 2004;17:264-275.
6. Rosener SE, Barr WB, Frayne DJ, et al. Interconception care for mothers during well-child visits with family physicians: an IMPLICIT Network Study. Ann Fam Med. 2016;14:350-355.
7. Bennett IM, Coco A, Anderson J, et al. Improving maternal care with a continuous quality improvement strategy: a report from the Interventions to Minimize Preterm and Low Birth Weight Infants through Continuous Improvement Techniques (IMPLICIT) Network. J Am Board Fam Med. 2009;22:380-386.
8. Conde-Agudelo A, Rosas-Bermúdez A, Kafury-Goeta AC. Birth spacing and risk of adverse perinatal outcomes: a meta-analysis. JAMA. 2006;295:1809-1823.
9. Ebbert JO, Jacobson RM. Reducing childhood tobacco smoke exposure. JAMA. 2016;315:2610-2611.
Ensuring a thorough exam, making use of a discharge checklist
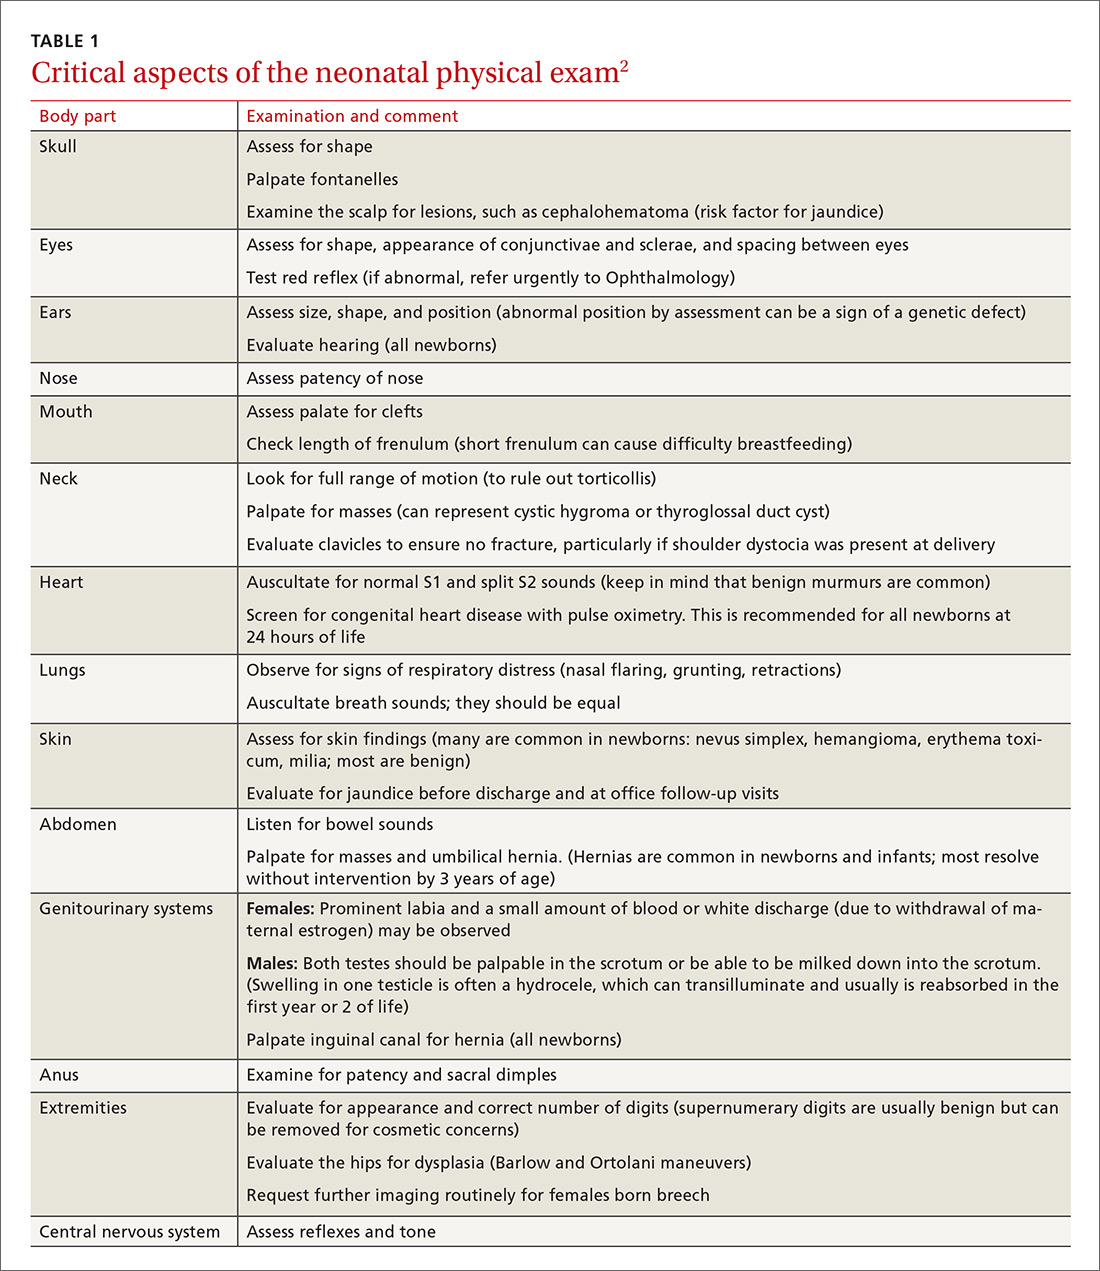
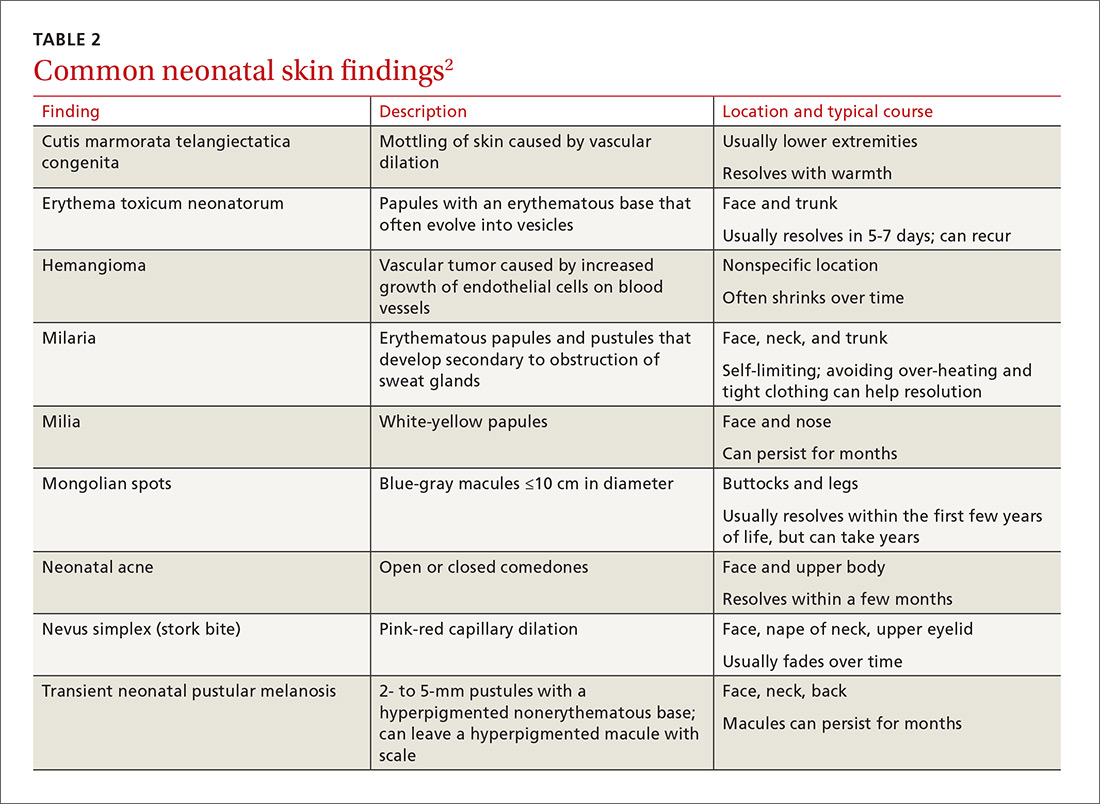
Before parents leave the hospital with their newborn, it is essential that they receive written and verbal counseling on important issues in neonatal care. A discharge checklist can help make sure all topics have been covered.1 A hearing screen and pulse oximetry before discharge are required for all newborns in most states, in addition to important preventive counseling for parents. TABLE 12 and TABLE 22 summarize important newborn physical exam findings and common skin conditions. Parents should be given additional written information regarding prevention of SIDS and proper use of car seats.
Hospital physicians should assess maternal medical and psychosocial readiness for discharge. Through shared decision-making with the newborn’s parents, physicians should create a plan for outpatient follow-up. Assessment through a physician home visit can provide safe and effective care similar to what is provided at a visit to an office medical practice.3-7 A follow-up appointment should be made 2 to 5 days before discharge, preferably connecting the newborn to a medical home where comprehensive health care services are offered.1,5,6,8
Age, gestational age, risk factors for hyperbilirubinemia, and the timing and level of bilirubin testing should be considered when establishing a follow-up interval. Most newborns who are discharged before 72 hours of age should have a follow-up visit in 2 days; a newborn who has a recognized risk factor for a health problem should be seen sooner. Newborns in the “low-risk zone” (ie, no recognized risk factors) should be seen based on age at discharge or need for breastfeeding support.9
Tracking baby’s weight, ensuring proper feeding
A newborn who is discharged at 24 hours of life, or sooner, should be seen in the office within 2 days of discharge to 1) ensure that he (she) is getting proper nutrition and 2) monitor his weight1,3,5 (TABLE 310-13). All newborns should be seen again at 2 weeks of life, with additional visits more frequently if there are concerns about nutrition.1
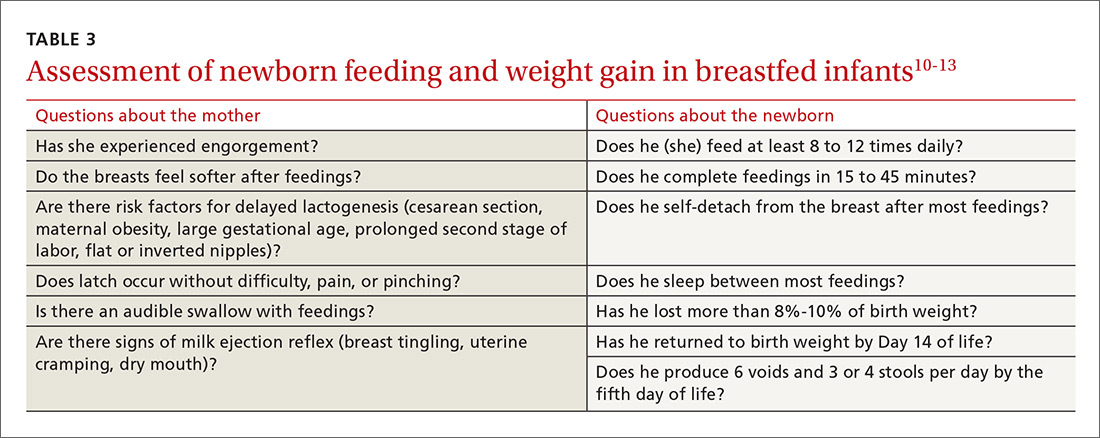
Recording an accurate weight is critical; the newborn should be weighed completely undressed and without a diaper. Healthy newborns can safely lose up to 10% of birth weight within the first week of life; they should be back to their birth weight by approximately 2 weeks of life.10,11 A healthy newborn loses approximately 0.5 to 1 oz a day;11 greater than 10% loss of birth weight should trigger a thorough medical work-up and feeding assessment.
Breastfeeding. For breastfeeding mothers, physicians should recommend on-demand feeding or a feeding at least every 2 or 3 hours. Adequate intake in breastfed infants can be intimidating for new parents to monitor, but they can use a written chart or any of several available smartphone applications to document length and timing of feeds and frequency of urination and bowel movements. By the fifth day of life, a newborn should be having at least 6 voids and 3 or 4 stools a day.10-12
In addition, physicians can counsel parents on what to look for—in the mother and the newborn—to confirm that breastfeeding is successful, with adequate nutritional intake (TABLE 310-13). Physicians should recommend against providing a pacifier to breastfeeding infants during the first several weeks of life—or until breastfeeding is well established (usually at 3 or 4 weeks of age). The World Health Organization (WHO) recommends against providing bottles, pacifiers, and artificial nipples to breastfeeding newborns.14 Liquids other than colostrum or breast milk should not be given unless there is a documented medical need, such as inadequate weight gain or feeding difficulty.15 If the newborn experiences early latch difficulties, supplementation with expressed breast milk is preferable to supplementation with formula. Assistance from a trained lactation consultant is a key element in the support of the breastfeeding dyad.11,12,16
Breastfeeding optimizes development of the newborn’s immune system, thus bolstering disease prevention; it also assists with maternal postpartum weight loss and psychological well-being. Exclusively or primarily formula-fed newborns are at increased risk of gastrointestinal, ear, and respiratory infections throughout infancy and childhood; type 1 diabetes mellitus; asthma; childhood and adult obesity; and leukemia.17,18 Mothers who feed their newborn primarily formula increase their own risk of obesity, type 2 diabetes mellitus, ovarian and breast cancer, and depression.17-22
Infant feeding is a personal and family choice but, in the absence of medical contraindications—such as maternal human immunodeficiency virus infection and galactosemia—exclusive breastfeeding should be recommended.17,18 FPs are well suited to support the mother–infant breastfeeding dyad in the neonatal period, based on expert recommendations. Specifically, the American Academy of Family Physicians (AAFP) and American Academy of Pediatrics (AAP) recommend that all infants be exclusively breastfed for the first 6 months of life and continue some breastfeeding through the first year or longer.17,18 WHO recommends breastfeeding until 24 months of age—longer if mother and infant want to, unless breastfeeding is contraindicated.14,17,18
Physicians should provide up-to-date information to parents regarding the risks and benefits of feeding choices. Support for breastfeeding mothers postnatally has been shown to be helpful in lengthening the time of exclusive breastfeeding.12 Certain medications pass through breast milk, and updated guides to medication cautions can be found at the National Institutes of Health’s LACTMED Web site (https://toxnet.nlm.nih.gov/newtoxnet/lactmed.htm).13 In many cases, when a maternal medication is incompatible with breastfeeding, the family physician can consider substituting another appropriate medication that is compatible.
Physician recommendation and support improves the rate of breastfeeding, but many mother–infant dyads require additional support to maintain breastfeeding for the recommended duration; such support can take the form of a certified lactation consultant or counselor, doula, or peer counselor.23-25 Although structured breastfeeding education in the antenatal period has been demonstrated to be effective in improving breastfeeding initiation and duration, recent research shows that support groups and assistance from the professionals previously mentioned also improve the breastfeeding rate.26-28
The AAFP recommends that FPs’ offices adopt specific, evidence-based practices that can have an impact on breastfeeding initiation and duration. Such practices include phone and in-person breastfeeding support from nursing staff and removing any formula advertisements from the office.17
Formula feeding. When parents choose formula feeding, most infants tolerate cow’s milk-based formula.29 For healthy term infants, differences between brands of formula are generally insignificant. Soy-protein formulas are of value only if lactose intolerance is strongly suspected, such as after prolonged episodes of loose stools. Even then, intolerance is usually transient and cow’s milk-based formula can be tried again in 2 to 4 weeks.
Physicians should recommend 20 kcal/oz of iron-fortified formula for infants who are fed formula—except in special circumstances, such as premature newborns, who may require a more calorie-dense formula. Parents should pay special attention to the manufacturer’s instructions for mixing formula with water because overdilution can cause hyponatremia. Typical volume for newborns should be at least 15 to 30 mL/feed for the first few days; newborns should not go more than 4 hours between feedings. Within the first week, newborns will start taking 60 to 90 mL/feed and increase that gradually to approximately 120 mL/feed by the end of the first month of life. On average, infants need a little more than 100 kcal/kg of body weight a day; for a 3.5-kg infant, that is at least 500 mL of formula over the course of a day.17,22
Because formula does not contain fluoride, physicians should recommend that parents mix formula that is provided as a powder with fluoridated water. Low-iron formula offers no advantage; feeding with it will cause iron-deficiency anemia in most infants.
When tongue-tie interferes with feeding
Tongue-tie—or ankyloglossia, an atypically short or thick lingual frenulum—is present in 3% to 16% of all births. The condition can make breastfeeding difficult; result in poor neonatal weight gain; and cause sore nipples in 25% to 44% of cases.30 Once tongue-tie is noted, the physician should talk to the mother about the history of feeding success, including whether her nipples are sore and whether the newborn is having difficulty feeding (ie, transferring milk). The Hazelbaker Assessment Tool for Lingual Frenulum Function and the simpler Bristol Tongue Assessment Tool can be used to assess the severity of tongue-tie.30-35
When tongue-tie interferes with feeding, a physician who is not trained in treatment can refer the mother and infant to a specialist in the community. Frenotomy has been used for many years as a treatment for tongue-tie; improvement in nipple pain and the mother-reported breastfeeding score have been reported postoperatively in several studies.30-33
Ensure proper vitamin D intake through supplementation
Newborns should consume 400 IU/d of supplemental vitamin D to prevent deficiency and its clinical manifestation, rickets, or other associated abnormalities of calcium metabolism. Deficiency of vitamin D has also been linked to a number of other conditions, including developmental delay and, possibly, type 1 diabetes mellitus in childhood and cardiovascular disease later in life.36
In the first months of life, few infants who are solely formula-fed will consume a full liter daily; for them, supplementation of vitamin D for at least one month should be prescribed.35 For breastfed infants, high-dosage maternal vitamin D supplementation may be effective, precluding infant oral vitamin D supplementation36; however, neither the AAFP nor the AAP has issued guidance promoting maternal supplementation in lieu of direct oral infant supplementation.37
Jaundice prevention—and recognition
An elevated bilirubin level is seen in most newborns in the first days of life because of increased production and decreased clearance of bilirubin—a condition known as physiologic jaundice. Conditions that aggravate physiologic hyperbilirubinemia include inborn errors of metabolism, ABO blood-group incompatibility, hemoglobin variants, and inflammatory states such as sepsis. It is important to distinguish physiologic jaundice from exaggerated physiologic and pathologic forms of hyperbilirubinemia; the latter is a medical emergency. Before we get to that, a word about prevention.
Prevention. Because poor caloric intake and dehydration are associated with hyperbilirubinemia, physicians should advise breastfeeding mothers to feed their newborn at least 8 to 12 times daily during the first week of life. However, routine supplementation of liquids other than breast milk should be discouraged in newborns who are not dehydrated.38
All pregnant women should be tested for ABO and Rh (D) blood types and undergo serum screening for isoimmune antibodies. Randomized trials have demonstrated that the incidence of significant hyperbilirubinemia can be reduced if, for Rh-negative mothers and those who did not undergo prenatal blood-group testing, infant cord blood is tested for 1) ABO and Rh (D) types and 2) direct antibody (Coombs’ test).38,39
Screening and assessment. It is recommended that all newborns be screened for jaundice before discharge by 1) assessment of clinical risk factors or 2) testing of transcutaneous bilirubin (TcB) or total serum bilirubin (TSB). Furthermore, because evidence shows that treating clinical jaundice can improve outcomes and rehospitalization, TSB should be measured in every newborn who has clinical jaundice in the first 24 hours of life. Measurement of TcB or TSB should also be performed on all infants in whom there appears to be clinical jaundice that is excessive for age.38,39
During routine clinical care, TcB measurement provides a reasonable estimate of the TSB level in healthy newborns at levels less than 15 mg/dL,40 although TcB testing might not be available in the outpatient office. An AAP management algorithm can help determine when a newborn should be seen for outpatient follow-up based on risk of hyperbilirubinemia; higher-risk newborns should be reevaluated in 24 hours.9 Outpatient visual assessment of jaundice for cephalocaudal progression—in a well-lit room, with a fully undressed newborn—correlates well with TSB test results. However, visual assessment should not be used alone to screen for hyperbilirubinemia; recent studies have demonstrated that such assessment lacks clinical reliability.40
Laboratory assessment. All bilirubin levels should be interpreted based on the newborn’s age in hours. The need for phototherapy should be based on the zone (low, low-intermediate, high-intermediate, or high, as categorized in the AAP nomogram38 in which the TSB level falls. TABLE 438-40 provides recommendations for laboratory studies based on risk factors. Standard curves for risk stratification have been developed by the AAP.37,38
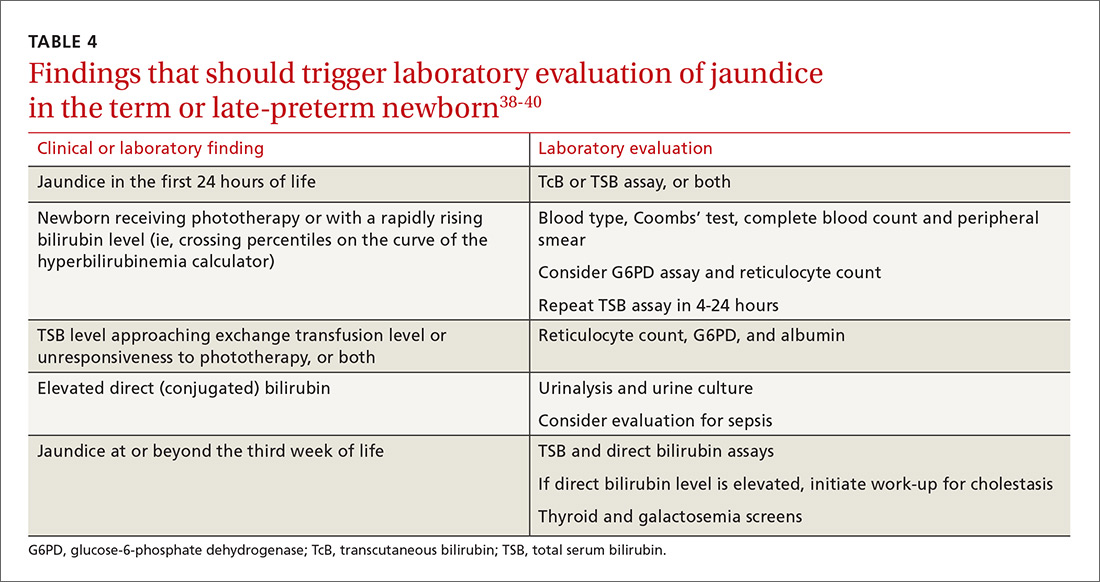
Treatment. Decisions to initiate treatment should be based on the AAP algorithm.38 When initiating phototherapy, precautions include ensuring adequate fluid intake, patching eyes, and monitoring temperature. Phototherapy can generally be stopped when the TSB level falls by 5 mg/dL or below 14 mg/dL. Home phototherapy, using a fiberoptic blanket, for uncomplicated jaundice (in carefully selected newborns with reliable parents) allows continued breastfeeding and bonding with the family, and can significantly decrease the rate of rehospitalization for infants older than 34 weeks.41
Breastfeeding is often associated with a higher bilirubin level than is seen in infants fed formula exclusively; increasing the frequency of feeding usually reduces the bilirubin level. So-called breast-milk jaundice is a delayed, but common, form of jaundice that is usually diagnosed in the second week of life and peaks by the end of the second week, resolving gradually over one to 4 months. If evaluation reveals no pathologic source, breastfeeding can generally be continued. Temporary discontinuation of breastfeeding to consider a diagnosis of breast-milk jaundice or other reasons for an elevated bilirubin level increases the risk of breastfeeding failure and is usually unnecessary.12,37,39
Fever—a full work-up, thorough history are key
Concern about serious bacterial illness (SBI) makes the evaluation of fever critical for those who care for newborns. Many studies have attempted to identify which newborns might be able to be cared for safely as outpatients to prevent unnecessary testing and antibiotics.5,42 Regrettably, SBI in infants remains difficult to predict, and protocols that have been developed may miss as many as 1 of every 10 newborns who has SBI.43 Initial management of all infants 28 days old or younger with fever must therefore include a full work-up, including lumbar puncture and empiric antibiotics.44
Evaluation. When an infant younger than 28 days has a fever, the physician should first verify that the temperature was taken rectally and how it was documented. In an infant who has a history of prematurity, it is crucial to correct for chronological age when deciding on proper evaluation.
Additional important findings in the history include a significant change in behavior, associated symptoms, and exposure to sick contacts. The maternal and birth history, including prolonged rupture of membranes, colonization with group B Streptococcus, administration of antibiotics at delivery, and genital herpes simplex virus (HSV) infection may suggest a cause for fever.45
The evaluation of fever might include the white blood cell (WBC) count, blood culture, measurement of markers of inflammation, urine studies, lumbar puncture, stool culture, and chest radiograph. Traditionally, the WBC count has been utilized as a standard marker for sepsis, although it has a low sensitivity and specificity for SBI, especially in newborns.46 Blood cultures should be obtained routinely in the newborn with fever, and before antibiotics are administered in older infants.
Procalcitonin (PCT; a calcitonin precursor) and the inflammatory marker C-reactive protein (CRP) have been shown, in several large studies, to have relatively high sensitivity and specificity for SBI; measurement of these constituents may enhance detection of serious illness.46-49 In a large study of 2047 febrile infants older than 30 months, the PCT level was determined to be more accurate than the CRP level, the WBC count, and the absolute neutrophil count in predicting SBI.48,49 PCT shows the most promise for preventing a full fever work-up and empiric antibiotics. It has not yet been widely translated into practice, however, because of a lack of clear guidance on how to combine PCT levels with other laboratory markers and clinical decision-making.48-50
Urinalysis (UA) should be obtained for all newborns who present with fever. Traditionally, it was recommended that urine should be cultured for all newborns with fever; however, more recent data show that the initial urinalysis is much more sensitive than once thought. In a study, UA was positive (defined as pyuria or a positive leukocyte esterase test, or both) in all but 1 of 203 infants who had bacteremic UTI (sensitivity, 99.5%).51
Stool culture is necessary in newborns only when they present with blood or mucus in diarrhea. Lumbar puncture should be performed in all febrile newborns and all newborns for whom empiric antibiotics have been prescribed.43,44 A chest radiograph may be useful in diagnosis when a newborn has any other sign of pulmonary disease: respiratory rate >50/min, retractions, wheezing, grunting, stridor, nasal flaring, cough, and positive findings on lung examination.43,44
Treatment. Management for all newborns who have a rectal temperature ≥38° C includes admission to the hospital and empiric antibiotics; guidance is based primarily on expert consensus. Common pathogens for SBI include group B Strep, Escherichia coli, Enterococcus spp., and Listeria monocytogenes.43,44 Empiric antibiotics, including ampicillin (to cover L monocytogenes) and cefotaxime or gentamicin should be started immediately after sending for blood, urine, and cerebrospinal fluid (CSF) cultures.43-45
All infants who are ill-appearing or have vesicles, seizures, or a maternal history of genital HSV infection should also be started on empiric acyclovir. Vesicles should be cultured and CSF should be sent for HSV DNA polymerase chain reaction before acyclovir is administered.43-45
Sudden infant death syndrome: Steps to take to minimize risk
SIDS is defined as the sudden death of a child younger than 1 year that remains unexplained after a thorough case investigation and comprehensive review of the clinical history. The risk of SIDS in the United States is less than 1 for every 1000 live births; incidence peaks between 2 and 4 months of age.52 In the United States, SIDS and other sleep-related infant deaths, such as strangulation in bed or accidental suffocation, account for more than 4000 deaths a year.53 The incidence of SIDS declined markedly after the “Back to Sleep” campaign was launched in 2003, but has leveled off since 2005.53-55
Numerous risk factors for SIDS have been identified, including maternal factors (young maternal age, maternal smoking during pregnancy, late or no prenatal care) and infant and environmental factors (prematurity, low birth weight, male gender, prone sleeping position, sleeping on a soft surface or with bedding accessories, bed-sharing (ie, sleeping in the parents’ bed), and overheating. In many cases, the risk factors are modifiable; sleeping in the prone position is the most meaningful modifiable risk factor.
To minimize the risk for SIDS, parents should be educated on the risk factors—prenatally as well as at each infant well visit. Home monitors have not been proven to reduce the incidence of SIDS and are not recommended for that purpose.54-57 Although evidence is strongest for supine positioning as a preventive intervention for SIDS, other evidence-based recommendations include use of a firm sleep surface; breastfeeding; use of a pacifier; room-sharing with parents without bed-sharing; routine immunization; avoidance of overheating; avoiding falling asleep with the infant on a chair or couch; and avoiding exposure to tobacco smoke, alcohol, and drugs of abuse.55,56 A recent systematic review showed that large-scale community interventions and education campaigns can play a significant role in parental and community adoption of safe sleep recommendations; however, families and communities rarely exhibit complete adherence to safe sleep practices.57
Other concerns in the first month of life and immediately beyond
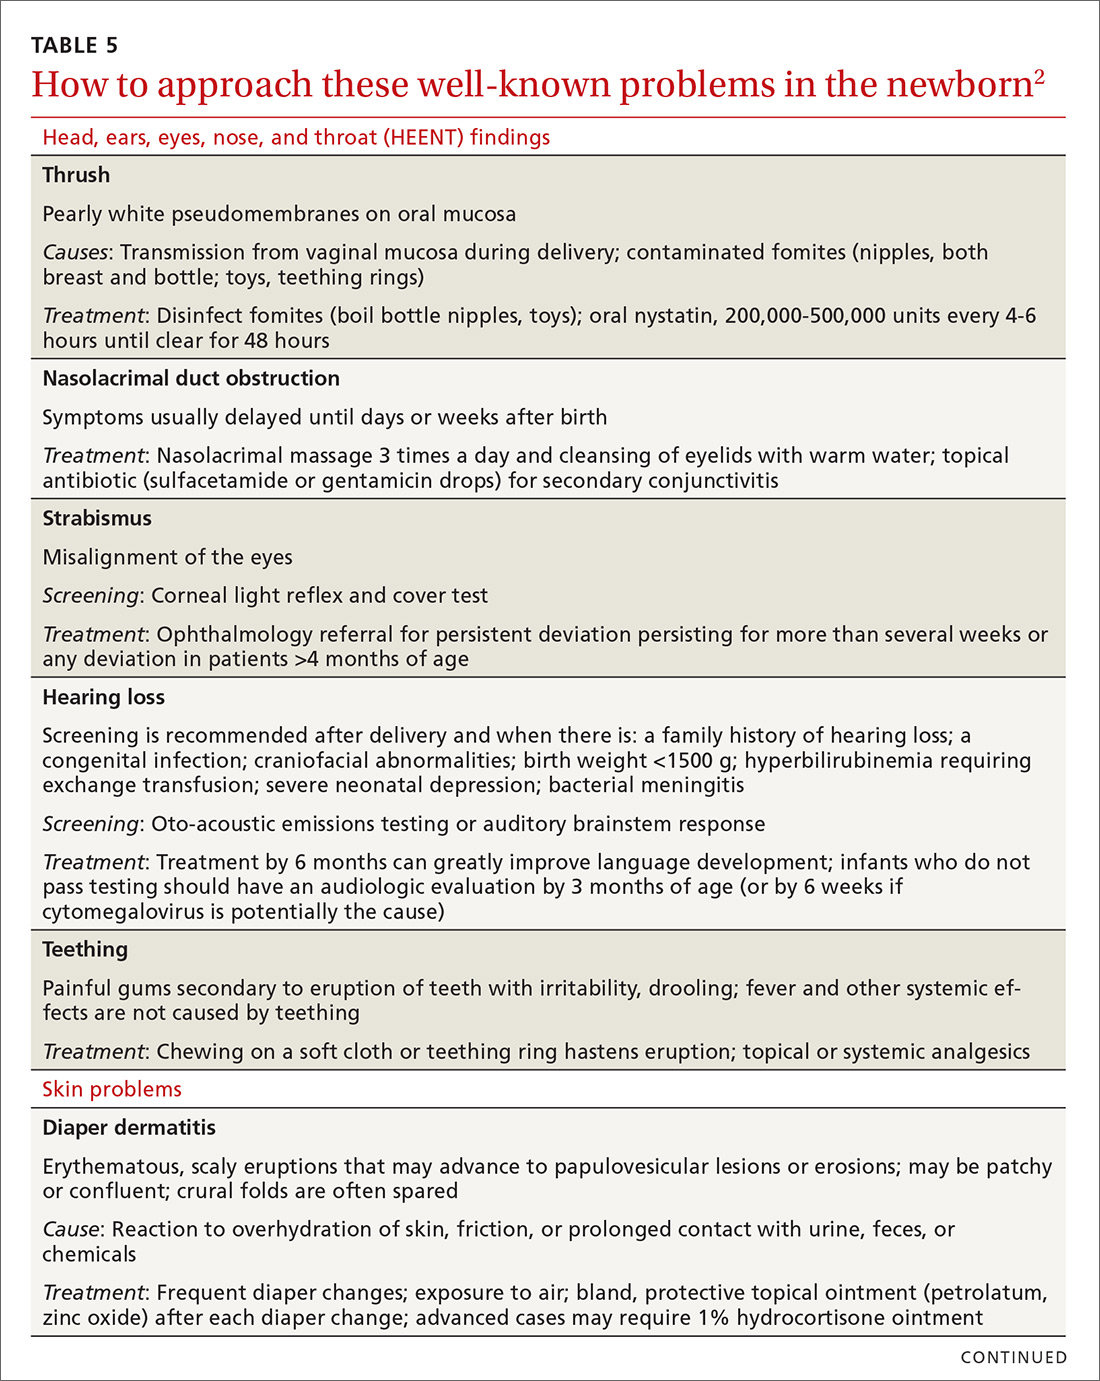
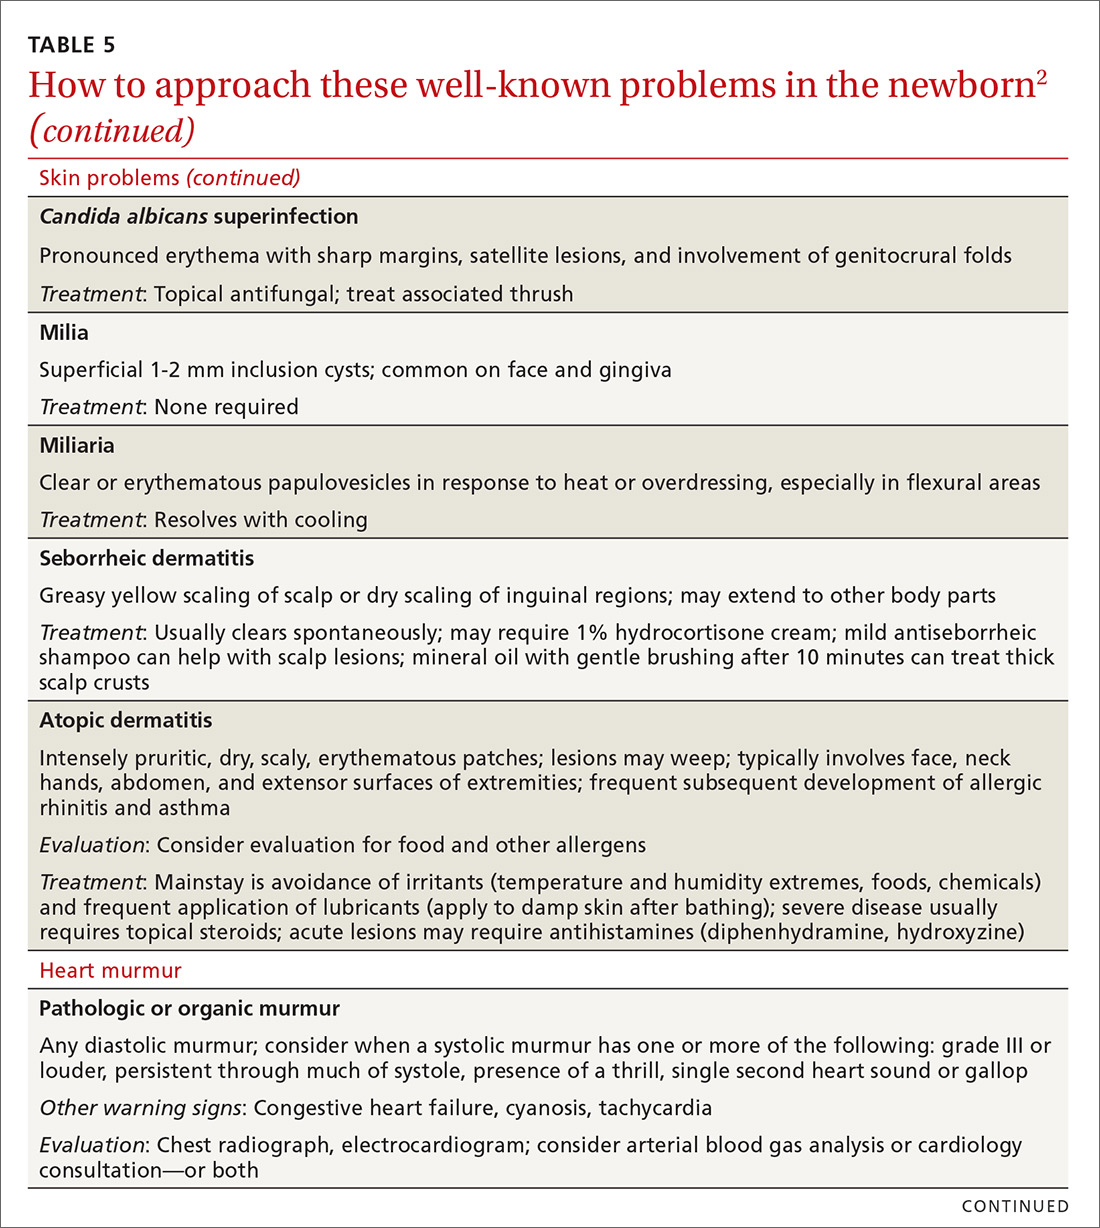
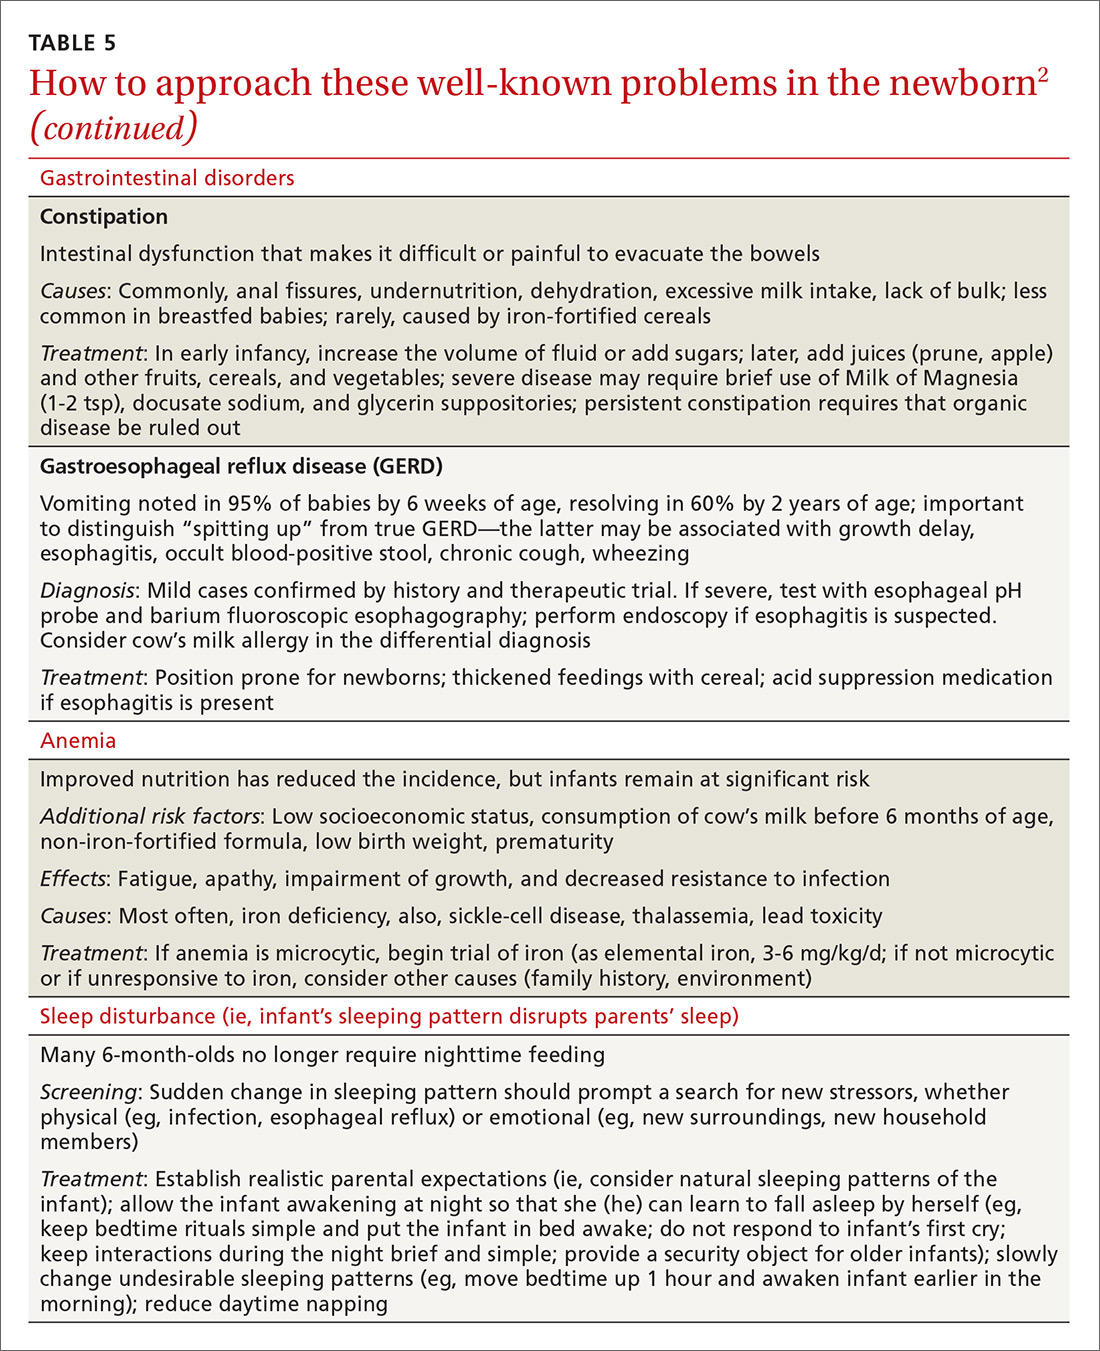
In TABLE 5,2 we list additional common newborn problems not reviewed in the text of this article and summarize evidence-based treatment strategies.
CORRESPONDENCE
Scott Hartman, MD, Associate Professor, Department of Family Medicine, University of Rochester Medical Center, 777 South Clinton Avenue, Rochester, NY 14620; [email protected].
Acknowledgement
We thank Nancy Phillips for her assistance in the preparation of this article.
1. Langan RC. Discharge procedures for healthy newborns. Am Fam Physician. 2006;73:849-852.
2. Hartman S, Taylor A. Problems of the newborn and infant. In: Paulman PM, Taylor RB, Paulman AA, et al, eds. Family Medicine: Principles and Practice. 7th ed. Cham, Switzerland: Springer Cham; 2016:217-239.
3. Meara E, Kotagal UR, Atherton HD, et al. Impact of early newborn discharge legislation and early follow-up visits on infant outcomes in a state Medicaid population. Pediatrics. 2004;113:1619-1627.
4. Benitz WE; Committee on Fetus and Newborn, American Academy of Pediatrics. Hospital stay for healthy term newborn infants. Pediatrics. 2015;135:948-953.
5. Escobar GJ, Greene JD, Hulac P, et al. Rehospitalisation after birth hospitalisation: patterns among infants of all gestations. Arch Dis Child. 2005;90:125-131.
6. Escobar GJ, Braveman PA, Ackerson L, et al. A randomized comparison of home visits and hospital-based group follow-up visits after early postpartum discharge. Pediatrics. 2001;108:719-727.
7. Meara E, Kotagal UR, Atherton HD, et al. Impact of early newborn discharge legislation and early follow-up visits on infant outcomes in a state Medicaid population. Pediatrics. 2004;113:1619–1627.
8. Benitz WE; Committee on Fetus and Newborn, American Academy of Pediatrics. Hospital stay for healthy term newborn infants. Pediatrics. 2015;135:948-953.
9. Maisels MJ, Vinod VK, Bhutani D, et al. Hyperbilirubinemia in the newborn infant ≥35 weeks’ gestation: an update with clarifications. Pediatrics. 2009;124:1193-1198.
10. Crossland DS, Richmond S, Hudson M, et al. Weight change in the term baby in the first 2 weeks of life. Acta Paediatrica. 2008;97:425-429.
11. Noel-Weiss J, Courant G, Woodend AK. Physiological weight loss in the breastfed neonate: a systematic review. Open Med. 2008;2:e99-e110.
12. Holmes AV, McLeod AY, Bunik M. ABM Clinical Protocol #5: Peripartum breastfeeding management for the healthy mother and infant at term. Breastfeed Med. 2013;8:469-473.
13. National Library of Medicine. Drugs and Lactation Database (LactMed). Available at: http://toxnet.nlm.nih.gov/newtoxnet/lactmed.htm. Accessed February 1, 2018.
14. World Health Organization. Guideline: Protecting, promoting and supporting breastfeeding in facilities providing maternity and newborn services. Available at: http://www.who.int/nutrition/publications/guidelines/breastfeeding-facilities-maternity-newborn/en/. Accessed March 23, 2018.
15. Chantry CJ, Dewey KG, Peerson JM, et al. In-hospital formula use increases early breastfeeding cessation among first-time mothers intending to exclusively breastfeed. J Pediatr. 2014;164:1339-1345.
16. Patel S, Patel S. The effectiveness of lactation consultants and lactation counselors on breastfeeding outcomes. J Hum Lact. 2015;32:530-541.
17. Position Paper: Breastfeeding, family physicians supporting. American Academy of Family Physicians Breastfeeding Advisory Committee. Available at: www.aafp.org/about/policies/all/breastfeeding-support.html. 2017. Accessed February 1, 2018.
18. Eidelman AI, Schanler RJ; Section on Breastfeeding. Policy Statement: Breastfeeding and the use of human milk. Pediatrics. 2012;129:e827-e841.
19. Ip S, Chung M, Raman G, et al. A summary of the Agency for Healthcare Research and Quality’s evidence report on breastfeeding in developed countries. Breastfeed Med. 2009;4 Suppl 1:S17-S30.
20. Schwarz EB, Ray RM, Stuebe AM, et al. Duration of lactation and risk factors for maternal cardiovascular disease. Obstet Gynecol. 2009;113:974-982.
21. Luan NN, Wu QJ, Gong TT, et al. Breastfeeding and ovarian cancer risk: a meta-analysis of epidemiologic studies. Am J Clin Nutr. 2013;98:1020-1031.
22. Ip S, Chung M, Raman G, et al. Breastfeeding and maternal and infant health outcomes in developed countries. Evid Rep Technol Assess (Full Rep). 2007;(153):1-186.
23. Hartman S, Barnett J, Bonuck KA. Implementing international board-certified lactation consultants intervention into routine care: barriers and recommendations. Clinical Lactation. 2012;3:131-137.
24. Hodnett ED, Gates S, Hofmeyr GJ, et al. Continuous support for women during childbirth. Cochrane Database Syst Rev. 2013;7:CD003766.
25. Lassi ZS, Das JK, Salam RA, et al. Evidence from community-level inputs to improve quality of care for maternal and newborn health: interventions and findings. Reprod Health. 2014;11(Suppl 2):S2.
26. Chapman DJ, Pérez-Escamilla R. Breastfeeding among minority women: moving from risk factors to interventions. Adv Nutr. 2012;3:95-104.
27. Rosen-Carole C, Hartman S; Academy of Breastfeeding Medicine. ABM Clinical Protocol #19: Breastfeeding promotion in the prenatal setting, revision 2015. Breastfeed Med. 2015;10:451-457.
28. Tanner-Smith EE, Steinka-Fry KT, Lipsey MW. Effects of CenteringPregnancy group prenatal care on breastfeeding outcomes. J Midwifery Womens Health. 2013;58:389-395.
29. Singhal A, Kennedy K, Lanigan J, et al. Dietary nucleotides and early growth in formula-fed infants: a randomized controlled trial. Pediatrics. 2010;126:e946-e953.
30. Demirci JR, Bogen DL, Holland C, et al. Characteristics of breastfeeding discussions at the initial prenatal visit. Obstet Gynecol. 2013;122:1263-1270.
31. Ingram J, Johnson D, Copeland M, et al. The development of a tongue assessment tool to assist with tongue tie identification. Arch Dis Child Fetal Neonatal Ed. 2015;100:F344-F348.
32. Power RF, Murphy JF. Tongue tie and frenotomy in infants with breastfeeding difficulties: achieving a balance. Arch Dis Child. 2015;100:489-494.
33. Buryk M, Bloom D, Shope T. Efficacy of neonatal release of ankyloglossia: a randomized trial. Pediatrics. 2011;128:280-288.
34. Francis DO, Krishnaswami S, McPheeters M. Treatment of ankyloglossia and breastfeeding outcomes: a systematic review. Pediatrics. 2015;135:e1458-e1466.
35. Amir LH, James JP, Donath SM. Reliability of the Hazelbaker Assessment Tool for Lingual Frenulum Function. Int Breastfeed J. 2006;1:3.
36. Misra M, Pacaud D, Petryk A, et al; Drug and Therapeutics Committee of the Lawson Wilkins Pediatric Endocrine Society. Vitamin D deficiency in children and its management: review of current knowledge and recommendations. Pediatrics. 2008;122:398-417.
37. Hollis BW, Wagner CL, Howard CR, et al. Maternal versus infant vitamin D supplementation during lactation: a randomized controlled trial. Pediatrics. 2015;136:625-634.
38. American Academy of Pediatrics Subcommittee on Hyperbilirubinemia. Management of hyperbilirubinemia in the newborn infant 35 or more weeks of gestation. Pediatrics. 2004;114;297-316 [erratum: Pediatrics. 2004;114:1138].
39. Ip S, Chung M, Kulig J, et al; American Academy of Pediatrics Subcommittee on Hyperbilirubinemia. An evidence-based review of important issues concerning neonatal hyperbilirubinemia. Pediatrics. 2004;114:e130-e153.
40. Taylor JA, Burgos AE, Flaherman V, et al. Discrepancies between transcutaneous and serum bilirubin measurements. Pediatrics. 2015:135:224-231.
41. Newman TB. Data suggest visual assessment of jaundice in newborns is helpful. J Pediatr. 2009;154:466; author reply 466-467.
42. Roberts KB. Young, febrile infants: a 30-year odyssey ends where it started. JAMA. 2004;291:1261-1262.
43. Bhatti M, Chu A, Hageman JR, et al. Future directions in the evaluation and management of neonatal sepsis. NeoReviews. 2012;13:e103-e110.
44. American College of Emergency Physicians Clinical Policies Committee; American College of Emergency Physicians Clinical Policies Subcommittee on Pediatric Fever. Clinical policy for children younger than three years presenting to the emergency department with fever. Ann Emerg Med. 2003;42:530-545.
45. Schrag SJ, Farley MM, Petit S, et al. Epidemiology of invasive early-onset neonatal sepsis, 2005 to 2014. Pediatrics. 2016;138:pii: e20162013.
46. Bonadio W, Maida G. Urinary tract infection in outpatient febrile infants younger than 30 days of age: a 10-year evaluation. Pediatr Infect Disease J. 2014;33:342-344.
47. Bressan S, Gomez B, Mintegi S, et al. Diagnostic performance of the lab-score in predicting severe and invasive bacterial infections in well-appearing young febrile infants. Pediatr Infect Dis J. 2012;31:1239-1244.
48. Milcent K, Faesch S, Gras-Le Guen C, et al. Use of procalcitonin assays to predict serious bacterial infection in young febrile infants. JAMA Pediatr. 2016;170:62-69.
49. Kuppermann N, Mahajan P. Role of serum procalcitonin in identifying young febrile infants with invasive bacterial infections: one step closer to the Holy Grail? JAMA Pediatr. 2016;170:17-18.
50. England JT, Del Vecchio MT, Aronoff SC. Use of serum procalcitonin in evaluation of febrile infants: a meta-analysis of 2317 patients. J Emerg Med. 2014;47:682-688.
51. Schroeder AR, Chang PW, Shen MW, et al. Diagnostic accuracy of the urinalysis for urinary tract infection in infants <3 months of age. Pediatrics. 2015;135:965-971.
52. Salm Ward TC, Balfour GM. Infant safe sleep interventions, 1990-2015: a review. J Community Health. 2016;41:180-196.
53. Goldstein RD, Trachtenberg FL, Sens MA, et al. Overall postneonatal mortality and rates of SIDS. Pediatrics. 2016;137:e20152298.
54. Task Force on Sudden Infant Death Syndrome, Moon RY. SIDS and other sleep-related infant deaths: expansion of recommendations for a safe infant sleeping environment. Pediatrics. 2011;128:e1341-1367.
55. Smith LA, Geller NL, Kellams AL, et al. Infant sleep location and breastfeeding practices in the United States: 2011-2014. Acad Pediatr. 2016;16:540-549.
56. Task Force on Sudden Infant Death Syndrome. SIDS and other sleep-related infant deaths: updated 2016 recommendations for a safe infant sleeping environment. Pediatrics. 2016;138;e20162938.
57. Corriveau SK, Drake, EE. Kellams AL, et al. Evaluation of an office protocol to increase exclusivity of breastfeeding. Pediatrics. 2013;131:942-950.
Caring for a newborn can be a source of joy for family physicians (FPs). In this article, we examine care provided in the first month of life, including a thorough physical examination, safe hospital discharge procedures, assessment of neonatal feeding, evaluation of jaundice and fever, and prevention of sudden infant death syndrome (SIDS). In addition, we describe how FPs can support women of childbearing age between pregnancies, with the goal of reducing the risk of adverse outcomes in future pregnancies. (See “Your role in risk assessment and interventions during the interconception period.”)
SIDEBAR
Your role in risk assessment and interventions during the interconception period
Interconception care is the care of women of childbearing age between pregnancies (from the end of a pregnancy to conception of the next). It includes medical and psychological interventions to modify their risk factors to improve future birth outcomes. In 2006, the Centers for Disease Control and Prevention Work Group and Select Panel on Preconception Care recommended risk assessment and intervention in the interconception period, especially for women who have experienced previous adverse outcomes of pregnancy.1
After the birth of a child, many women who had been receiving regular prenatal care stop seeing providers for their health care or return to a pattern of fragmented care.2-4 They often revert to behaviors, such as smoking and substance abuse, that put future pregnancies at risk.2,4,5 In addition, the maternal and family focus often shifts from caring for the woman to caring for the newborn, ignoring the health care needs of the mother.2,4,5
The IMPLICIT (Interventions to Minimize Preterm and Low birth weight Infants through Continuous Improvement Techniques) Network is a perinatal quality collaborative of family medicine residency programs and community health centers that uses continuous quality improvement processes to improve the health of women and decrease preterm birth and infant mortaility.6,7 The IMPLICIT interconception care model targets 4 risk factors that not only meet the model's requirements, but have a solid base of evidence5-8 by which to mitigate those risk factors and thus improve birth outcomes:
- tobacco use
- depression risk
- use of contraception to prolong interpregnancy interval
- use of a multivitamin with folic acid.
During newborn and well-child visits, screening for maternal health in these 4 key areas and providing point-of-care interventions can markedly improve maternal and perinatal health outcomes. Although the IMPLICIT Network continues to engage in the study of this model of addressing maternal health during newborn and infant visits, initial evidence demonstrates that these interventions exert positive effects on modifiable risk factors.6,8,9
Sidebar references
1. Johnson K, Posner SF, Biermann J, et al. Recommendations to improve preconception health and health care---United States. A report of the CDC/ATSDR Preconception Care Work Group and the Select Panel on Preconception Care. April 21, 2006. Available at: https://www.cdc.gov/mmwr/preview/mmwrhtml/rr5506a1.htm. Accessed February 1, 2018.
2. DiBari JN, Yu SM, Chao SM, et al. Use of postpartum care: predictors and barriers. J Pregnancy. 2014;2014:530769.
3. Liberto TL. Screening for depression and help-seeking in postpartum women during well-baby pediatric visits: an integrated review. J Pediatr Health Care. 2012;26:109-117.
4. Fung WL, Goldstein AO, Butzen AY, et al. Smoking cessation in pregnancy: a review of postpartum relapse prevention strategies. J Am Board Fam Prac. 2004;17:264-275.
5. Fang W, Goldstein AO, Butzen AY, et al. Smoking cessation in pregnancy: a review of postpartum relapse prevention strategies. J Am Board Fam Pract. 2004;17:264-275.
6. Rosener SE, Barr WB, Frayne DJ, et al. Interconception care for mothers during well-child visits with family physicians: an IMPLICIT Network Study. Ann Fam Med. 2016;14:350-355.
7. Bennett IM, Coco A, Anderson J, et al. Improving maternal care with a continuous quality improvement strategy: a report from the Interventions to Minimize Preterm and Low Birth Weight Infants through Continuous Improvement Techniques (IMPLICIT) Network. J Am Board Fam Med. 2009;22:380-386.
8. Conde-Agudelo A, Rosas-Bermúdez A, Kafury-Goeta AC. Birth spacing and risk of adverse perinatal outcomes: a meta-analysis. JAMA. 2006;295:1809-1823.
9. Ebbert JO, Jacobson RM. Reducing childhood tobacco smoke exposure. JAMA. 2016;315:2610-2611.
Ensuring a thorough exam, making use of a discharge checklist
Before parents leave the hospital with their newborn, it is essential that they receive written and verbal counseling on important issues in neonatal care. A discharge checklist can help make sure all topics have been covered.1 A hearing screen and pulse oximetry before discharge are required for all newborns in most states, in addition to important preventive counseling for parents. TABLE 12 and TABLE 22 summarize important newborn physical exam findings and common skin conditions. Parents should be given additional written information regarding prevention of SIDS and proper use of car seats.
Hospital physicians should assess maternal medical and psychosocial readiness for discharge. Through shared decision-making with the newborn’s parents, physicians should create a plan for outpatient follow-up. Assessment through a physician home visit can provide safe and effective care similar to what is provided at a visit to an office medical practice.3-7 A follow-up appointment should be made 2 to 5 days before discharge, preferably connecting the newborn to a medical home where comprehensive health care services are offered.1,5,6,8
Age, gestational age, risk factors for hyperbilirubinemia, and the timing and level of bilirubin testing should be considered when establishing a follow-up interval. Most newborns who are discharged before 72 hours of age should have a follow-up visit in 2 days; a newborn who has a recognized risk factor for a health problem should be seen sooner. Newborns in the “low-risk zone” (ie, no recognized risk factors) should be seen based on age at discharge or need for breastfeeding support.9
Tracking baby’s weight, ensuring proper feeding
A newborn who is discharged at 24 hours of life, or sooner, should be seen in the office within 2 days of discharge to 1) ensure that he (she) is getting proper nutrition and 2) monitor his weight1,3,5 (TABLE 310-13). All newborns should be seen again at 2 weeks of life, with additional visits more frequently if there are concerns about nutrition.1
Recording an accurate weight is critical; the newborn should be weighed completely undressed and without a diaper. Healthy newborns can safely lose up to 10% of birth weight within the first week of life; they should be back to their birth weight by approximately 2 weeks of life.10,11 A healthy newborn loses approximately 0.5 to 1 oz a day;11 greater than 10% loss of birth weight should trigger a thorough medical work-up and feeding assessment.
Breastfeeding. For breastfeeding mothers, physicians should recommend on-demand feeding or a feeding at least every 2 or 3 hours. Adequate intake in breastfed infants can be intimidating for new parents to monitor, but they can use a written chart or any of several available smartphone applications to document length and timing of feeds and frequency of urination and bowel movements. By the fifth day of life, a newborn should be having at least 6 voids and 3 or 4 stools a day.10-12
In addition, physicians can counsel parents on what to look for—in the mother and the newborn—to confirm that breastfeeding is successful, with adequate nutritional intake (TABLE 310-13). Physicians should recommend against providing a pacifier to breastfeeding infants during the first several weeks of life—or until breastfeeding is well established (usually at 3 or 4 weeks of age). The World Health Organization (WHO) recommends against providing bottles, pacifiers, and artificial nipples to breastfeeding newborns.14 Liquids other than colostrum or breast milk should not be given unless there is a documented medical need, such as inadequate weight gain or feeding difficulty.15 If the newborn experiences early latch difficulties, supplementation with expressed breast milk is preferable to supplementation with formula. Assistance from a trained lactation consultant is a key element in the support of the breastfeeding dyad.11,12,16
Breastfeeding optimizes development of the newborn’s immune system, thus bolstering disease prevention; it also assists with maternal postpartum weight loss and psychological well-being. Exclusively or primarily formula-fed newborns are at increased risk of gastrointestinal, ear, and respiratory infections throughout infancy and childhood; type 1 diabetes mellitus; asthma; childhood and adult obesity; and leukemia.17,18 Mothers who feed their newborn primarily formula increase their own risk of obesity, type 2 diabetes mellitus, ovarian and breast cancer, and depression.17-22
Infant feeding is a personal and family choice but, in the absence of medical contraindications—such as maternal human immunodeficiency virus infection and galactosemia—exclusive breastfeeding should be recommended.17,18 FPs are well suited to support the mother–infant breastfeeding dyad in the neonatal period, based on expert recommendations. Specifically, the American Academy of Family Physicians (AAFP) and American Academy of Pediatrics (AAP) recommend that all infants be exclusively breastfed for the first 6 months of life and continue some breastfeeding through the first year or longer.17,18 WHO recommends breastfeeding until 24 months of age—longer if mother and infant want to, unless breastfeeding is contraindicated.14,17,18
Physicians should provide up-to-date information to parents regarding the risks and benefits of feeding choices. Support for breastfeeding mothers postnatally has been shown to be helpful in lengthening the time of exclusive breastfeeding.12 Certain medications pass through breast milk, and updated guides to medication cautions can be found at the National Institutes of Health’s LACTMED Web site (https://toxnet.nlm.nih.gov/newtoxnet/lactmed.htm).13 In many cases, when a maternal medication is incompatible with breastfeeding, the family physician can consider substituting another appropriate medication that is compatible.
Physician recommendation and support improves the rate of breastfeeding, but many mother–infant dyads require additional support to maintain breastfeeding for the recommended duration; such support can take the form of a certified lactation consultant or counselor, doula, or peer counselor.23-25 Although structured breastfeeding education in the antenatal period has been demonstrated to be effective in improving breastfeeding initiation and duration, recent research shows that support groups and assistance from the professionals previously mentioned also improve the breastfeeding rate.26-28
The AAFP recommends that FPs’ offices adopt specific, evidence-based practices that can have an impact on breastfeeding initiation and duration. Such practices include phone and in-person breastfeeding support from nursing staff and removing any formula advertisements from the office.17
Formula feeding. When parents choose formula feeding, most infants tolerate cow’s milk-based formula.29 For healthy term infants, differences between brands of formula are generally insignificant. Soy-protein formulas are of value only if lactose intolerance is strongly suspected, such as after prolonged episodes of loose stools. Even then, intolerance is usually transient and cow’s milk-based formula can be tried again in 2 to 4 weeks.
Physicians should recommend 20 kcal/oz of iron-fortified formula for infants who are fed formula—except in special circumstances, such as premature newborns, who may require a more calorie-dense formula. Parents should pay special attention to the manufacturer’s instructions for mixing formula with water because overdilution can cause hyponatremia. Typical volume for newborns should be at least 15 to 30 mL/feed for the first few days; newborns should not go more than 4 hours between feedings. Within the first week, newborns will start taking 60 to 90 mL/feed and increase that gradually to approximately 120 mL/feed by the end of the first month of life. On average, infants need a little more than 100 kcal/kg of body weight a day; for a 3.5-kg infant, that is at least 500 mL of formula over the course of a day.17,22
Because formula does not contain fluoride, physicians should recommend that parents mix formula that is provided as a powder with fluoridated water. Low-iron formula offers no advantage; feeding with it will cause iron-deficiency anemia in most infants.
When tongue-tie interferes with feeding
Tongue-tie—or ankyloglossia, an atypically short or thick lingual frenulum—is present in 3% to 16% of all births. The condition can make breastfeeding difficult; result in poor neonatal weight gain; and cause sore nipples in 25% to 44% of cases.30 Once tongue-tie is noted, the physician should talk to the mother about the history of feeding success, including whether her nipples are sore and whether the newborn is having difficulty feeding (ie, transferring milk). The Hazelbaker Assessment Tool for Lingual Frenulum Function and the simpler Bristol Tongue Assessment Tool can be used to assess the severity of tongue-tie.30-35
When tongue-tie interferes with feeding, a physician who is not trained in treatment can refer the mother and infant to a specialist in the community. Frenotomy has been used for many years as a treatment for tongue-tie; improvement in nipple pain and the mother-reported breastfeeding score have been reported postoperatively in several studies.30-33
Ensure proper vitamin D intake through supplementation
Newborns should consume 400 IU/d of supplemental vitamin D to prevent deficiency and its clinical manifestation, rickets, or other associated abnormalities of calcium metabolism. Deficiency of vitamin D has also been linked to a number of other conditions, including developmental delay and, possibly, type 1 diabetes mellitus in childhood and cardiovascular disease later in life.36
In the first months of life, few infants who are solely formula-fed will consume a full liter daily; for them, supplementation of vitamin D for at least one month should be prescribed.35 For breastfed infants, high-dosage maternal vitamin D supplementation may be effective, precluding infant oral vitamin D supplementation36; however, neither the AAFP nor the AAP has issued guidance promoting maternal supplementation in lieu of direct oral infant supplementation.37
Jaundice prevention—and recognition
An elevated bilirubin level is seen in most newborns in the first days of life because of increased production and decreased clearance of bilirubin—a condition known as physiologic jaundice. Conditions that aggravate physiologic hyperbilirubinemia include inborn errors of metabolism, ABO blood-group incompatibility, hemoglobin variants, and inflammatory states such as sepsis. It is important to distinguish physiologic jaundice from exaggerated physiologic and pathologic forms of hyperbilirubinemia; the latter is a medical emergency. Before we get to that, a word about prevention.
Prevention. Because poor caloric intake and dehydration are associated with hyperbilirubinemia, physicians should advise breastfeeding mothers to feed their newborn at least 8 to 12 times daily during the first week of life. However, routine supplementation of liquids other than breast milk should be discouraged in newborns who are not dehydrated.38
All pregnant women should be tested for ABO and Rh (D) blood types and undergo serum screening for isoimmune antibodies. Randomized trials have demonstrated that the incidence of significant hyperbilirubinemia can be reduced if, for Rh-negative mothers and those who did not undergo prenatal blood-group testing, infant cord blood is tested for 1) ABO and Rh (D) types and 2) direct antibody (Coombs’ test).38,39
Screening and assessment. It is recommended that all newborns be screened for jaundice before discharge by 1) assessment of clinical risk factors or 2) testing of transcutaneous bilirubin (TcB) or total serum bilirubin (TSB). Furthermore, because evidence shows that treating clinical jaundice can improve outcomes and rehospitalization, TSB should be measured in every newborn who has clinical jaundice in the first 24 hours of life. Measurement of TcB or TSB should also be performed on all infants in whom there appears to be clinical jaundice that is excessive for age.38,39
During routine clinical care, TcB measurement provides a reasonable estimate of the TSB level in healthy newborns at levels less than 15 mg/dL,40 although TcB testing might not be available in the outpatient office. An AAP management algorithm can help determine when a newborn should be seen for outpatient follow-up based on risk of hyperbilirubinemia; higher-risk newborns should be reevaluated in 24 hours.9 Outpatient visual assessment of jaundice for cephalocaudal progression—in a well-lit room, with a fully undressed newborn—correlates well with TSB test results. However, visual assessment should not be used alone to screen for hyperbilirubinemia; recent studies have demonstrated that such assessment lacks clinical reliability.40
Laboratory assessment. All bilirubin levels should be interpreted based on the newborn’s age in hours. The need for phototherapy should be based on the zone (low, low-intermediate, high-intermediate, or high, as categorized in the AAP nomogram38 in which the TSB level falls. TABLE 438-40 provides recommendations for laboratory studies based on risk factors. Standard curves for risk stratification have been developed by the AAP.37,38
Treatment. Decisions to initiate treatment should be based on the AAP algorithm.38 When initiating phototherapy, precautions include ensuring adequate fluid intake, patching eyes, and monitoring temperature. Phototherapy can generally be stopped when the TSB level falls by 5 mg/dL or below 14 mg/dL. Home phototherapy, using a fiberoptic blanket, for uncomplicated jaundice (in carefully selected newborns with reliable parents) allows continued breastfeeding and bonding with the family, and can significantly decrease the rate of rehospitalization for infants older than 34 weeks.41
Breastfeeding is often associated with a higher bilirubin level than is seen in infants fed formula exclusively; increasing the frequency of feeding usually reduces the bilirubin level. So-called breast-milk jaundice is a delayed, but common, form of jaundice that is usually diagnosed in the second week of life and peaks by the end of the second week, resolving gradually over one to 4 months. If evaluation reveals no pathologic source, breastfeeding can generally be continued. Temporary discontinuation of breastfeeding to consider a diagnosis of breast-milk jaundice or other reasons for an elevated bilirubin level increases the risk of breastfeeding failure and is usually unnecessary.12,37,39
Fever—a full work-up, thorough history are key
Concern about serious bacterial illness (SBI) makes the evaluation of fever critical for those who care for newborns. Many studies have attempted to identify which newborns might be able to be cared for safely as outpatients to prevent unnecessary testing and antibiotics.5,42 Regrettably, SBI in infants remains difficult to predict, and protocols that have been developed may miss as many as 1 of every 10 newborns who has SBI.43 Initial management of all infants 28 days old or younger with fever must therefore include a full work-up, including lumbar puncture and empiric antibiotics.44
Evaluation. When an infant younger than 28 days has a fever, the physician should first verify that the temperature was taken rectally and how it was documented. In an infant who has a history of prematurity, it is crucial to correct for chronological age when deciding on proper evaluation.
Additional important findings in the history include a significant change in behavior, associated symptoms, and exposure to sick contacts. The maternal and birth history, including prolonged rupture of membranes, colonization with group B Streptococcus, administration of antibiotics at delivery, and genital herpes simplex virus (HSV) infection may suggest a cause for fever.45
The evaluation of fever might include the white blood cell (WBC) count, blood culture, measurement of markers of inflammation, urine studies, lumbar puncture, stool culture, and chest radiograph. Traditionally, the WBC count has been utilized as a standard marker for sepsis, although it has a low sensitivity and specificity for SBI, especially in newborns.46 Blood cultures should be obtained routinely in the newborn with fever, and before antibiotics are administered in older infants.
Procalcitonin (PCT; a calcitonin precursor) and the inflammatory marker C-reactive protein (CRP) have been shown, in several large studies, to have relatively high sensitivity and specificity for SBI; measurement of these constituents may enhance detection of serious illness.46-49 In a large study of 2047 febrile infants older than 30 months, the PCT level was determined to be more accurate than the CRP level, the WBC count, and the absolute neutrophil count in predicting SBI.48,49 PCT shows the most promise for preventing a full fever work-up and empiric antibiotics. It has not yet been widely translated into practice, however, because of a lack of clear guidance on how to combine PCT levels with other laboratory markers and clinical decision-making.48-50
Urinalysis (UA) should be obtained for all newborns who present with fever. Traditionally, it was recommended that urine should be cultured for all newborns with fever; however, more recent data show that the initial urinalysis is much more sensitive than once thought. In a study, UA was positive (defined as pyuria or a positive leukocyte esterase test, or both) in all but 1 of 203 infants who had bacteremic UTI (sensitivity, 99.5%).51
Stool culture is necessary in newborns only when they present with blood or mucus in diarrhea. Lumbar puncture should be performed in all febrile newborns and all newborns for whom empiric antibiotics have been prescribed.43,44 A chest radiograph may be useful in diagnosis when a newborn has any other sign of pulmonary disease: respiratory rate >50/min, retractions, wheezing, grunting, stridor, nasal flaring, cough, and positive findings on lung examination.43,44
Treatment. Management for all newborns who have a rectal temperature ≥38° C includes admission to the hospital and empiric antibiotics; guidance is based primarily on expert consensus. Common pathogens for SBI include group B Strep, Escherichia coli, Enterococcus spp., and Listeria monocytogenes.43,44 Empiric antibiotics, including ampicillin (to cover L monocytogenes) and cefotaxime or gentamicin should be started immediately after sending for blood, urine, and cerebrospinal fluid (CSF) cultures.43-45
All infants who are ill-appearing or have vesicles, seizures, or a maternal history of genital HSV infection should also be started on empiric acyclovir. Vesicles should be cultured and CSF should be sent for HSV DNA polymerase chain reaction before acyclovir is administered.43-45
Sudden infant death syndrome: Steps to take to minimize risk
SIDS is defined as the sudden death of a child younger than 1 year that remains unexplained after a thorough case investigation and comprehensive review of the clinical history. The risk of SIDS in the United States is less than 1 for every 1000 live births; incidence peaks between 2 and 4 months of age.52 In the United States, SIDS and other sleep-related infant deaths, such as strangulation in bed or accidental suffocation, account for more than 4000 deaths a year.53 The incidence of SIDS declined markedly after the “Back to Sleep” campaign was launched in 2003, but has leveled off since 2005.53-55
Numerous risk factors for SIDS have been identified, including maternal factors (young maternal age, maternal smoking during pregnancy, late or no prenatal care) and infant and environmental factors (prematurity, low birth weight, male gender, prone sleeping position, sleeping on a soft surface or with bedding accessories, bed-sharing (ie, sleeping in the parents’ bed), and overheating. In many cases, the risk factors are modifiable; sleeping in the prone position is the most meaningful modifiable risk factor.
To minimize the risk for SIDS, parents should be educated on the risk factors—prenatally as well as at each infant well visit. Home monitors have not been proven to reduce the incidence of SIDS and are not recommended for that purpose.54-57 Although evidence is strongest for supine positioning as a preventive intervention for SIDS, other evidence-based recommendations include use of a firm sleep surface; breastfeeding; use of a pacifier; room-sharing with parents without bed-sharing; routine immunization; avoidance of overheating; avoiding falling asleep with the infant on a chair or couch; and avoiding exposure to tobacco smoke, alcohol, and drugs of abuse.55,56 A recent systematic review showed that large-scale community interventions and education campaigns can play a significant role in parental and community adoption of safe sleep recommendations; however, families and communities rarely exhibit complete adherence to safe sleep practices.57
Other concerns in the first month of life and immediately beyond
In TABLE 5,2 we list additional common newborn problems not reviewed in the text of this article and summarize evidence-based treatment strategies.
CORRESPONDENCE
Scott Hartman, MD, Associate Professor, Department of Family Medicine, University of Rochester Medical Center, 777 South Clinton Avenue, Rochester, NY 14620; [email protected].
Acknowledgement
We thank Nancy Phillips for her assistance in the preparation of this article.
Caring for a newborn can be a source of joy for family physicians (FPs). In this article, we examine care provided in the first month of life, including a thorough physical examination, safe hospital discharge procedures, assessment of neonatal feeding, evaluation of jaundice and fever, and prevention of sudden infant death syndrome (SIDS). In addition, we describe how FPs can support women of childbearing age between pregnancies, with the goal of reducing the risk of adverse outcomes in future pregnancies. (See “Your role in risk assessment and interventions during the interconception period.”)
SIDEBAR
Your role in risk assessment and interventions during the interconception period
Interconception care is the care of women of childbearing age between pregnancies (from the end of a pregnancy to conception of the next). It includes medical and psychological interventions to modify their risk factors to improve future birth outcomes. In 2006, the Centers for Disease Control and Prevention Work Group and Select Panel on Preconception Care recommended risk assessment and intervention in the interconception period, especially for women who have experienced previous adverse outcomes of pregnancy.1
After the birth of a child, many women who had been receiving regular prenatal care stop seeing providers for their health care or return to a pattern of fragmented care.2-4 They often revert to behaviors, such as smoking and substance abuse, that put future pregnancies at risk.2,4,5 In addition, the maternal and family focus often shifts from caring for the woman to caring for the newborn, ignoring the health care needs of the mother.2,4,5
The IMPLICIT (Interventions to Minimize Preterm and Low birth weight Infants through Continuous Improvement Techniques) Network is a perinatal quality collaborative of family medicine residency programs and community health centers that uses continuous quality improvement processes to improve the health of women and decrease preterm birth and infant mortaility.6,7 The IMPLICIT interconception care model targets 4 risk factors that not only meet the model's requirements, but have a solid base of evidence5-8 by which to mitigate those risk factors and thus improve birth outcomes:
- tobacco use
- depression risk
- use of contraception to prolong interpregnancy interval
- use of a multivitamin with folic acid.
During newborn and well-child visits, screening for maternal health in these 4 key areas and providing point-of-care interventions can markedly improve maternal and perinatal health outcomes. Although the IMPLICIT Network continues to engage in the study of this model of addressing maternal health during newborn and infant visits, initial evidence demonstrates that these interventions exert positive effects on modifiable risk factors.6,8,9
Sidebar references
1. Johnson K, Posner SF, Biermann J, et al. Recommendations to improve preconception health and health care---United States. A report of the CDC/ATSDR Preconception Care Work Group and the Select Panel on Preconception Care. April 21, 2006. Available at: https://www.cdc.gov/mmwr/preview/mmwrhtml/rr5506a1.htm. Accessed February 1, 2018.
2. DiBari JN, Yu SM, Chao SM, et al. Use of postpartum care: predictors and barriers. J Pregnancy. 2014;2014:530769.
3. Liberto TL. Screening for depression and help-seeking in postpartum women during well-baby pediatric visits: an integrated review. J Pediatr Health Care. 2012;26:109-117.
4. Fung WL, Goldstein AO, Butzen AY, et al. Smoking cessation in pregnancy: a review of postpartum relapse prevention strategies. J Am Board Fam Prac. 2004;17:264-275.
5. Fang W, Goldstein AO, Butzen AY, et al. Smoking cessation in pregnancy: a review of postpartum relapse prevention strategies. J Am Board Fam Pract. 2004;17:264-275.
6. Rosener SE, Barr WB, Frayne DJ, et al. Interconception care for mothers during well-child visits with family physicians: an IMPLICIT Network Study. Ann Fam Med. 2016;14:350-355.
7. Bennett IM, Coco A, Anderson J, et al. Improving maternal care with a continuous quality improvement strategy: a report from the Interventions to Minimize Preterm and Low Birth Weight Infants through Continuous Improvement Techniques (IMPLICIT) Network. J Am Board Fam Med. 2009;22:380-386.
8. Conde-Agudelo A, Rosas-Bermúdez A, Kafury-Goeta AC. Birth spacing and risk of adverse perinatal outcomes: a meta-analysis. JAMA. 2006;295:1809-1823.
9. Ebbert JO, Jacobson RM. Reducing childhood tobacco smoke exposure. JAMA. 2016;315:2610-2611.
Ensuring a thorough exam, making use of a discharge checklist
Before parents leave the hospital with their newborn, it is essential that they receive written and verbal counseling on important issues in neonatal care. A discharge checklist can help make sure all topics have been covered.1 A hearing screen and pulse oximetry before discharge are required for all newborns in most states, in addition to important preventive counseling for parents. TABLE 12 and TABLE 22 summarize important newborn physical exam findings and common skin conditions. Parents should be given additional written information regarding prevention of SIDS and proper use of car seats.
Hospital physicians should assess maternal medical and psychosocial readiness for discharge. Through shared decision-making with the newborn’s parents, physicians should create a plan for outpatient follow-up. Assessment through a physician home visit can provide safe and effective care similar to what is provided at a visit to an office medical practice.3-7 A follow-up appointment should be made 2 to 5 days before discharge, preferably connecting the newborn to a medical home where comprehensive health care services are offered.1,5,6,8
Age, gestational age, risk factors for hyperbilirubinemia, and the timing and level of bilirubin testing should be considered when establishing a follow-up interval. Most newborns who are discharged before 72 hours of age should have a follow-up visit in 2 days; a newborn who has a recognized risk factor for a health problem should be seen sooner. Newborns in the “low-risk zone” (ie, no recognized risk factors) should be seen based on age at discharge or need for breastfeeding support.9
Tracking baby’s weight, ensuring proper feeding
A newborn who is discharged at 24 hours of life, or sooner, should be seen in the office within 2 days of discharge to 1) ensure that he (she) is getting proper nutrition and 2) monitor his weight1,3,5 (TABLE 310-13). All newborns should be seen again at 2 weeks of life, with additional visits more frequently if there are concerns about nutrition.1
Recording an accurate weight is critical; the newborn should be weighed completely undressed and without a diaper. Healthy newborns can safely lose up to 10% of birth weight within the first week of life; they should be back to their birth weight by approximately 2 weeks of life.10,11 A healthy newborn loses approximately 0.5 to 1 oz a day;11 greater than 10% loss of birth weight should trigger a thorough medical work-up and feeding assessment.
Breastfeeding. For breastfeeding mothers, physicians should recommend on-demand feeding or a feeding at least every 2 or 3 hours. Adequate intake in breastfed infants can be intimidating for new parents to monitor, but they can use a written chart or any of several available smartphone applications to document length and timing of feeds and frequency of urination and bowel movements. By the fifth day of life, a newborn should be having at least 6 voids and 3 or 4 stools a day.10-12
In addition, physicians can counsel parents on what to look for—in the mother and the newborn—to confirm that breastfeeding is successful, with adequate nutritional intake (TABLE 310-13). Physicians should recommend against providing a pacifier to breastfeeding infants during the first several weeks of life—or until breastfeeding is well established (usually at 3 or 4 weeks of age). The World Health Organization (WHO) recommends against providing bottles, pacifiers, and artificial nipples to breastfeeding newborns.14 Liquids other than colostrum or breast milk should not be given unless there is a documented medical need, such as inadequate weight gain or feeding difficulty.15 If the newborn experiences early latch difficulties, supplementation with expressed breast milk is preferable to supplementation with formula. Assistance from a trained lactation consultant is a key element in the support of the breastfeeding dyad.11,12,16
Breastfeeding optimizes development of the newborn’s immune system, thus bolstering disease prevention; it also assists with maternal postpartum weight loss and psychological well-being. Exclusively or primarily formula-fed newborns are at increased risk of gastrointestinal, ear, and respiratory infections throughout infancy and childhood; type 1 diabetes mellitus; asthma; childhood and adult obesity; and leukemia.17,18 Mothers who feed their newborn primarily formula increase their own risk of obesity, type 2 diabetes mellitus, ovarian and breast cancer, and depression.17-22
Infant feeding is a personal and family choice but, in the absence of medical contraindications—such as maternal human immunodeficiency virus infection and galactosemia—exclusive breastfeeding should be recommended.17,18 FPs are well suited to support the mother–infant breastfeeding dyad in the neonatal period, based on expert recommendations. Specifically, the American Academy of Family Physicians (AAFP) and American Academy of Pediatrics (AAP) recommend that all infants be exclusively breastfed for the first 6 months of life and continue some breastfeeding through the first year or longer.17,18 WHO recommends breastfeeding until 24 months of age—longer if mother and infant want to, unless breastfeeding is contraindicated.14,17,18
Physicians should provide up-to-date information to parents regarding the risks and benefits of feeding choices. Support for breastfeeding mothers postnatally has been shown to be helpful in lengthening the time of exclusive breastfeeding.12 Certain medications pass through breast milk, and updated guides to medication cautions can be found at the National Institutes of Health’s LACTMED Web site (https://toxnet.nlm.nih.gov/newtoxnet/lactmed.htm).13 In many cases, when a maternal medication is incompatible with breastfeeding, the family physician can consider substituting another appropriate medication that is compatible.
Physician recommendation and support improves the rate of breastfeeding, but many mother–infant dyads require additional support to maintain breastfeeding for the recommended duration; such support can take the form of a certified lactation consultant or counselor, doula, or peer counselor.23-25 Although structured breastfeeding education in the antenatal period has been demonstrated to be effective in improving breastfeeding initiation and duration, recent research shows that support groups and assistance from the professionals previously mentioned also improve the breastfeeding rate.26-28
The AAFP recommends that FPs’ offices adopt specific, evidence-based practices that can have an impact on breastfeeding initiation and duration. Such practices include phone and in-person breastfeeding support from nursing staff and removing any formula advertisements from the office.17
Formula feeding. When parents choose formula feeding, most infants tolerate cow’s milk-based formula.29 For healthy term infants, differences between brands of formula are generally insignificant. Soy-protein formulas are of value only if lactose intolerance is strongly suspected, such as after prolonged episodes of loose stools. Even then, intolerance is usually transient and cow’s milk-based formula can be tried again in 2 to 4 weeks.
Physicians should recommend 20 kcal/oz of iron-fortified formula for infants who are fed formula—except in special circumstances, such as premature newborns, who may require a more calorie-dense formula. Parents should pay special attention to the manufacturer’s instructions for mixing formula with water because overdilution can cause hyponatremia. Typical volume for newborns should be at least 15 to 30 mL/feed for the first few days; newborns should not go more than 4 hours between feedings. Within the first week, newborns will start taking 60 to 90 mL/feed and increase that gradually to approximately 120 mL/feed by the end of the first month of life. On average, infants need a little more than 100 kcal/kg of body weight a day; for a 3.5-kg infant, that is at least 500 mL of formula over the course of a day.17,22
Because formula does not contain fluoride, physicians should recommend that parents mix formula that is provided as a powder with fluoridated water. Low-iron formula offers no advantage; feeding with it will cause iron-deficiency anemia in most infants.
When tongue-tie interferes with feeding
Tongue-tie—or ankyloglossia, an atypically short or thick lingual frenulum—is present in 3% to 16% of all births. The condition can make breastfeeding difficult; result in poor neonatal weight gain; and cause sore nipples in 25% to 44% of cases.30 Once tongue-tie is noted, the physician should talk to the mother about the history of feeding success, including whether her nipples are sore and whether the newborn is having difficulty feeding (ie, transferring milk). The Hazelbaker Assessment Tool for Lingual Frenulum Function and the simpler Bristol Tongue Assessment Tool can be used to assess the severity of tongue-tie.30-35
When tongue-tie interferes with feeding, a physician who is not trained in treatment can refer the mother and infant to a specialist in the community. Frenotomy has been used for many years as a treatment for tongue-tie; improvement in nipple pain and the mother-reported breastfeeding score have been reported postoperatively in several studies.30-33
Ensure proper vitamin D intake through supplementation
Newborns should consume 400 IU/d of supplemental vitamin D to prevent deficiency and its clinical manifestation, rickets, or other associated abnormalities of calcium metabolism. Deficiency of vitamin D has also been linked to a number of other conditions, including developmental delay and, possibly, type 1 diabetes mellitus in childhood and cardiovascular disease later in life.36
In the first months of life, few infants who are solely formula-fed will consume a full liter daily; for them, supplementation of vitamin D for at least one month should be prescribed.35 For breastfed infants, high-dosage maternal vitamin D supplementation may be effective, precluding infant oral vitamin D supplementation36; however, neither the AAFP nor the AAP has issued guidance promoting maternal supplementation in lieu of direct oral infant supplementation.37
Jaundice prevention—and recognition
An elevated bilirubin level is seen in most newborns in the first days of life because of increased production and decreased clearance of bilirubin—a condition known as physiologic jaundice. Conditions that aggravate physiologic hyperbilirubinemia include inborn errors of metabolism, ABO blood-group incompatibility, hemoglobin variants, and inflammatory states such as sepsis. It is important to distinguish physiologic jaundice from exaggerated physiologic and pathologic forms of hyperbilirubinemia; the latter is a medical emergency. Before we get to that, a word about prevention.
Prevention. Because poor caloric intake and dehydration are associated with hyperbilirubinemia, physicians should advise breastfeeding mothers to feed their newborn at least 8 to 12 times daily during the first week of life. However, routine supplementation of liquids other than breast milk should be discouraged in newborns who are not dehydrated.38
All pregnant women should be tested for ABO and Rh (D) blood types and undergo serum screening for isoimmune antibodies. Randomized trials have demonstrated that the incidence of significant hyperbilirubinemia can be reduced if, for Rh-negative mothers and those who did not undergo prenatal blood-group testing, infant cord blood is tested for 1) ABO and Rh (D) types and 2) direct antibody (Coombs’ test).38,39
Screening and assessment. It is recommended that all newborns be screened for jaundice before discharge by 1) assessment of clinical risk factors or 2) testing of transcutaneous bilirubin (TcB) or total serum bilirubin (TSB). Furthermore, because evidence shows that treating clinical jaundice can improve outcomes and rehospitalization, TSB should be measured in every newborn who has clinical jaundice in the first 24 hours of life. Measurement of TcB or TSB should also be performed on all infants in whom there appears to be clinical jaundice that is excessive for age.38,39
During routine clinical care, TcB measurement provides a reasonable estimate of the TSB level in healthy newborns at levels less than 15 mg/dL,40 although TcB testing might not be available in the outpatient office. An AAP management algorithm can help determine when a newborn should be seen for outpatient follow-up based on risk of hyperbilirubinemia; higher-risk newborns should be reevaluated in 24 hours.9 Outpatient visual assessment of jaundice for cephalocaudal progression—in a well-lit room, with a fully undressed newborn—correlates well with TSB test results. However, visual assessment should not be used alone to screen for hyperbilirubinemia; recent studies have demonstrated that such assessment lacks clinical reliability.40
Laboratory assessment. All bilirubin levels should be interpreted based on the newborn’s age in hours. The need for phototherapy should be based on the zone (low, low-intermediate, high-intermediate, or high, as categorized in the AAP nomogram38 in which the TSB level falls. TABLE 438-40 provides recommendations for laboratory studies based on risk factors. Standard curves for risk stratification have been developed by the AAP.37,38
Treatment. Decisions to initiate treatment should be based on the AAP algorithm.38 When initiating phototherapy, precautions include ensuring adequate fluid intake, patching eyes, and monitoring temperature. Phototherapy can generally be stopped when the TSB level falls by 5 mg/dL or below 14 mg/dL. Home phototherapy, using a fiberoptic blanket, for uncomplicated jaundice (in carefully selected newborns with reliable parents) allows continued breastfeeding and bonding with the family, and can significantly decrease the rate of rehospitalization for infants older than 34 weeks.41
Breastfeeding is often associated with a higher bilirubin level than is seen in infants fed formula exclusively; increasing the frequency of feeding usually reduces the bilirubin level. So-called breast-milk jaundice is a delayed, but common, form of jaundice that is usually diagnosed in the second week of life and peaks by the end of the second week, resolving gradually over one to 4 months. If evaluation reveals no pathologic source, breastfeeding can generally be continued. Temporary discontinuation of breastfeeding to consider a diagnosis of breast-milk jaundice or other reasons for an elevated bilirubin level increases the risk of breastfeeding failure and is usually unnecessary.12,37,39
Fever—a full work-up, thorough history are key
Concern about serious bacterial illness (SBI) makes the evaluation of fever critical for those who care for newborns. Many studies have attempted to identify which newborns might be able to be cared for safely as outpatients to prevent unnecessary testing and antibiotics.5,42 Regrettably, SBI in infants remains difficult to predict, and protocols that have been developed may miss as many as 1 of every 10 newborns who has SBI.43 Initial management of all infants 28 days old or younger with fever must therefore include a full work-up, including lumbar puncture and empiric antibiotics.44
Evaluation. When an infant younger than 28 days has a fever, the physician should first verify that the temperature was taken rectally and how it was documented. In an infant who has a history of prematurity, it is crucial to correct for chronological age when deciding on proper evaluation.
Additional important findings in the history include a significant change in behavior, associated symptoms, and exposure to sick contacts. The maternal and birth history, including prolonged rupture of membranes, colonization with group B Streptococcus, administration of antibiotics at delivery, and genital herpes simplex virus (HSV) infection may suggest a cause for fever.45
The evaluation of fever might include the white blood cell (WBC) count, blood culture, measurement of markers of inflammation, urine studies, lumbar puncture, stool culture, and chest radiograph. Traditionally, the WBC count has been utilized as a standard marker for sepsis, although it has a low sensitivity and specificity for SBI, especially in newborns.46 Blood cultures should be obtained routinely in the newborn with fever, and before antibiotics are administered in older infants.
Procalcitonin (PCT; a calcitonin precursor) and the inflammatory marker C-reactive protein (CRP) have been shown, in several large studies, to have relatively high sensitivity and specificity for SBI; measurement of these constituents may enhance detection of serious illness.46-49 In a large study of 2047 febrile infants older than 30 months, the PCT level was determined to be more accurate than the CRP level, the WBC count, and the absolute neutrophil count in predicting SBI.48,49 PCT shows the most promise for preventing a full fever work-up and empiric antibiotics. It has not yet been widely translated into practice, however, because of a lack of clear guidance on how to combine PCT levels with other laboratory markers and clinical decision-making.48-50
Urinalysis (UA) should be obtained for all newborns who present with fever. Traditionally, it was recommended that urine should be cultured for all newborns with fever; however, more recent data show that the initial urinalysis is much more sensitive than once thought. In a study, UA was positive (defined as pyuria or a positive leukocyte esterase test, or both) in all but 1 of 203 infants who had bacteremic UTI (sensitivity, 99.5%).51
Stool culture is necessary in newborns only when they present with blood or mucus in diarrhea. Lumbar puncture should be performed in all febrile newborns and all newborns for whom empiric antibiotics have been prescribed.43,44 A chest radiograph may be useful in diagnosis when a newborn has any other sign of pulmonary disease: respiratory rate >50/min, retractions, wheezing, grunting, stridor, nasal flaring, cough, and positive findings on lung examination.43,44
Treatment. Management for all newborns who have a rectal temperature ≥38° C includes admission to the hospital and empiric antibiotics; guidance is based primarily on expert consensus. Common pathogens for SBI include group B Strep, Escherichia coli, Enterococcus spp., and Listeria monocytogenes.43,44 Empiric antibiotics, including ampicillin (to cover L monocytogenes) and cefotaxime or gentamicin should be started immediately after sending for blood, urine, and cerebrospinal fluid (CSF) cultures.43-45
All infants who are ill-appearing or have vesicles, seizures, or a maternal history of genital HSV infection should also be started on empiric acyclovir. Vesicles should be cultured and CSF should be sent for HSV DNA polymerase chain reaction before acyclovir is administered.43-45
Sudden infant death syndrome: Steps to take to minimize risk
SIDS is defined as the sudden death of a child younger than 1 year that remains unexplained after a thorough case investigation and comprehensive review of the clinical history. The risk of SIDS in the United States is less than 1 for every 1000 live births; incidence peaks between 2 and 4 months of age.52 In the United States, SIDS and other sleep-related infant deaths, such as strangulation in bed or accidental suffocation, account for more than 4000 deaths a year.53 The incidence of SIDS declined markedly after the “Back to Sleep” campaign was launched in 2003, but has leveled off since 2005.53-55
Numerous risk factors for SIDS have been identified, including maternal factors (young maternal age, maternal smoking during pregnancy, late or no prenatal care) and infant and environmental factors (prematurity, low birth weight, male gender, prone sleeping position, sleeping on a soft surface or with bedding accessories, bed-sharing (ie, sleeping in the parents’ bed), and overheating. In many cases, the risk factors are modifiable; sleeping in the prone position is the most meaningful modifiable risk factor.
To minimize the risk for SIDS, parents should be educated on the risk factors—prenatally as well as at each infant well visit. Home monitors have not been proven to reduce the incidence of SIDS and are not recommended for that purpose.54-57 Although evidence is strongest for supine positioning as a preventive intervention for SIDS, other evidence-based recommendations include use of a firm sleep surface; breastfeeding; use of a pacifier; room-sharing with parents without bed-sharing; routine immunization; avoidance of overheating; avoiding falling asleep with the infant on a chair or couch; and avoiding exposure to tobacco smoke, alcohol, and drugs of abuse.55,56 A recent systematic review showed that large-scale community interventions and education campaigns can play a significant role in parental and community adoption of safe sleep recommendations; however, families and communities rarely exhibit complete adherence to safe sleep practices.57
Other concerns in the first month of life and immediately beyond
In TABLE 5,2 we list additional common newborn problems not reviewed in the text of this article and summarize evidence-based treatment strategies.
CORRESPONDENCE
Scott Hartman, MD, Associate Professor, Department of Family Medicine, University of Rochester Medical Center, 777 South Clinton Avenue, Rochester, NY 14620; [email protected].
Acknowledgement
We thank Nancy Phillips for her assistance in the preparation of this article.
1. Langan RC. Discharge procedures for healthy newborns. Am Fam Physician. 2006;73:849-852.
2. Hartman S, Taylor A. Problems of the newborn and infant. In: Paulman PM, Taylor RB, Paulman AA, et al, eds. Family Medicine: Principles and Practice. 7th ed. Cham, Switzerland: Springer Cham; 2016:217-239.
3. Meara E, Kotagal UR, Atherton HD, et al. Impact of early newborn discharge legislation and early follow-up visits on infant outcomes in a state Medicaid population. Pediatrics. 2004;113:1619-1627.
4. Benitz WE; Committee on Fetus and Newborn, American Academy of Pediatrics. Hospital stay for healthy term newborn infants. Pediatrics. 2015;135:948-953.
5. Escobar GJ, Greene JD, Hulac P, et al. Rehospitalisation after birth hospitalisation: patterns among infants of all gestations. Arch Dis Child. 2005;90:125-131.
6. Escobar GJ, Braveman PA, Ackerson L, et al. A randomized comparison of home visits and hospital-based group follow-up visits after early postpartum discharge. Pediatrics. 2001;108:719-727.
7. Meara E, Kotagal UR, Atherton HD, et al. Impact of early newborn discharge legislation and early follow-up visits on infant outcomes in a state Medicaid population. Pediatrics. 2004;113:1619–1627.
8. Benitz WE; Committee on Fetus and Newborn, American Academy of Pediatrics. Hospital stay for healthy term newborn infants. Pediatrics. 2015;135:948-953.
9. Maisels MJ, Vinod VK, Bhutani D, et al. Hyperbilirubinemia in the newborn infant ≥35 weeks’ gestation: an update with clarifications. Pediatrics. 2009;124:1193-1198.
10. Crossland DS, Richmond S, Hudson M, et al. Weight change in the term baby in the first 2 weeks of life. Acta Paediatrica. 2008;97:425-429.
11. Noel-Weiss J, Courant G, Woodend AK. Physiological weight loss in the breastfed neonate: a systematic review. Open Med. 2008;2:e99-e110.
12. Holmes AV, McLeod AY, Bunik M. ABM Clinical Protocol #5: Peripartum breastfeeding management for the healthy mother and infant at term. Breastfeed Med. 2013;8:469-473.
13. National Library of Medicine. Drugs and Lactation Database (LactMed). Available at: http://toxnet.nlm.nih.gov/newtoxnet/lactmed.htm. Accessed February 1, 2018.
14. World Health Organization. Guideline: Protecting, promoting and supporting breastfeeding in facilities providing maternity and newborn services. Available at: http://www.who.int/nutrition/publications/guidelines/breastfeeding-facilities-maternity-newborn/en/. Accessed March 23, 2018.
15. Chantry CJ, Dewey KG, Peerson JM, et al. In-hospital formula use increases early breastfeeding cessation among first-time mothers intending to exclusively breastfeed. J Pediatr. 2014;164:1339-1345.
16. Patel S, Patel S. The effectiveness of lactation consultants and lactation counselors on breastfeeding outcomes. J Hum Lact. 2015;32:530-541.
17. Position Paper: Breastfeeding, family physicians supporting. American Academy of Family Physicians Breastfeeding Advisory Committee. Available at: www.aafp.org/about/policies/all/breastfeeding-support.html. 2017. Accessed February 1, 2018.
18. Eidelman AI, Schanler RJ; Section on Breastfeeding. Policy Statement: Breastfeeding and the use of human milk. Pediatrics. 2012;129:e827-e841.
19. Ip S, Chung M, Raman G, et al. A summary of the Agency for Healthcare Research and Quality’s evidence report on breastfeeding in developed countries. Breastfeed Med. 2009;4 Suppl 1:S17-S30.
20. Schwarz EB, Ray RM, Stuebe AM, et al. Duration of lactation and risk factors for maternal cardiovascular disease. Obstet Gynecol. 2009;113:974-982.
21. Luan NN, Wu QJ, Gong TT, et al. Breastfeeding and ovarian cancer risk: a meta-analysis of epidemiologic studies. Am J Clin Nutr. 2013;98:1020-1031.
22. Ip S, Chung M, Raman G, et al. Breastfeeding and maternal and infant health outcomes in developed countries. Evid Rep Technol Assess (Full Rep). 2007;(153):1-186.
23. Hartman S, Barnett J, Bonuck KA. Implementing international board-certified lactation consultants intervention into routine care: barriers and recommendations. Clinical Lactation. 2012;3:131-137.
24. Hodnett ED, Gates S, Hofmeyr GJ, et al. Continuous support for women during childbirth. Cochrane Database Syst Rev. 2013;7:CD003766.
25. Lassi ZS, Das JK, Salam RA, et al. Evidence from community-level inputs to improve quality of care for maternal and newborn health: interventions and findings. Reprod Health. 2014;11(Suppl 2):S2.
26. Chapman DJ, Pérez-Escamilla R. Breastfeeding among minority women: moving from risk factors to interventions. Adv Nutr. 2012;3:95-104.
27. Rosen-Carole C, Hartman S; Academy of Breastfeeding Medicine. ABM Clinical Protocol #19: Breastfeeding promotion in the prenatal setting, revision 2015. Breastfeed Med. 2015;10:451-457.
28. Tanner-Smith EE, Steinka-Fry KT, Lipsey MW. Effects of CenteringPregnancy group prenatal care on breastfeeding outcomes. J Midwifery Womens Health. 2013;58:389-395.
29. Singhal A, Kennedy K, Lanigan J, et al. Dietary nucleotides and early growth in formula-fed infants: a randomized controlled trial. Pediatrics. 2010;126:e946-e953.
30. Demirci JR, Bogen DL, Holland C, et al. Characteristics of breastfeeding discussions at the initial prenatal visit. Obstet Gynecol. 2013;122:1263-1270.
31. Ingram J, Johnson D, Copeland M, et al. The development of a tongue assessment tool to assist with tongue tie identification. Arch Dis Child Fetal Neonatal Ed. 2015;100:F344-F348.
32. Power RF, Murphy JF. Tongue tie and frenotomy in infants with breastfeeding difficulties: achieving a balance. Arch Dis Child. 2015;100:489-494.
33. Buryk M, Bloom D, Shope T. Efficacy of neonatal release of ankyloglossia: a randomized trial. Pediatrics. 2011;128:280-288.
34. Francis DO, Krishnaswami S, McPheeters M. Treatment of ankyloglossia and breastfeeding outcomes: a systematic review. Pediatrics. 2015;135:e1458-e1466.
35. Amir LH, James JP, Donath SM. Reliability of the Hazelbaker Assessment Tool for Lingual Frenulum Function. Int Breastfeed J. 2006;1:3.
36. Misra M, Pacaud D, Petryk A, et al; Drug and Therapeutics Committee of the Lawson Wilkins Pediatric Endocrine Society. Vitamin D deficiency in children and its management: review of current knowledge and recommendations. Pediatrics. 2008;122:398-417.
37. Hollis BW, Wagner CL, Howard CR, et al. Maternal versus infant vitamin D supplementation during lactation: a randomized controlled trial. Pediatrics. 2015;136:625-634.
38. American Academy of Pediatrics Subcommittee on Hyperbilirubinemia. Management of hyperbilirubinemia in the newborn infant 35 or more weeks of gestation. Pediatrics. 2004;114;297-316 [erratum: Pediatrics. 2004;114:1138].
39. Ip S, Chung M, Kulig J, et al; American Academy of Pediatrics Subcommittee on Hyperbilirubinemia. An evidence-based review of important issues concerning neonatal hyperbilirubinemia. Pediatrics. 2004;114:e130-e153.
40. Taylor JA, Burgos AE, Flaherman V, et al. Discrepancies between transcutaneous and serum bilirubin measurements. Pediatrics. 2015:135:224-231.
41. Newman TB. Data suggest visual assessment of jaundice in newborns is helpful. J Pediatr. 2009;154:466; author reply 466-467.
42. Roberts KB. Young, febrile infants: a 30-year odyssey ends where it started. JAMA. 2004;291:1261-1262.
43. Bhatti M, Chu A, Hageman JR, et al. Future directions in the evaluation and management of neonatal sepsis. NeoReviews. 2012;13:e103-e110.
44. American College of Emergency Physicians Clinical Policies Committee; American College of Emergency Physicians Clinical Policies Subcommittee on Pediatric Fever. Clinical policy for children younger than three years presenting to the emergency department with fever. Ann Emerg Med. 2003;42:530-545.
45. Schrag SJ, Farley MM, Petit S, et al. Epidemiology of invasive early-onset neonatal sepsis, 2005 to 2014. Pediatrics. 2016;138:pii: e20162013.
46. Bonadio W, Maida G. Urinary tract infection in outpatient febrile infants younger than 30 days of age: a 10-year evaluation. Pediatr Infect Disease J. 2014;33:342-344.
47. Bressan S, Gomez B, Mintegi S, et al. Diagnostic performance of the lab-score in predicting severe and invasive bacterial infections in well-appearing young febrile infants. Pediatr Infect Dis J. 2012;31:1239-1244.
48. Milcent K, Faesch S, Gras-Le Guen C, et al. Use of procalcitonin assays to predict serious bacterial infection in young febrile infants. JAMA Pediatr. 2016;170:62-69.
49. Kuppermann N, Mahajan P. Role of serum procalcitonin in identifying young febrile infants with invasive bacterial infections: one step closer to the Holy Grail? JAMA Pediatr. 2016;170:17-18.
50. England JT, Del Vecchio MT, Aronoff SC. Use of serum procalcitonin in evaluation of febrile infants: a meta-analysis of 2317 patients. J Emerg Med. 2014;47:682-688.
51. Schroeder AR, Chang PW, Shen MW, et al. Diagnostic accuracy of the urinalysis for urinary tract infection in infants <3 months of age. Pediatrics. 2015;135:965-971.
52. Salm Ward TC, Balfour GM. Infant safe sleep interventions, 1990-2015: a review. J Community Health. 2016;41:180-196.
53. Goldstein RD, Trachtenberg FL, Sens MA, et al. Overall postneonatal mortality and rates of SIDS. Pediatrics. 2016;137:e20152298.
54. Task Force on Sudden Infant Death Syndrome, Moon RY. SIDS and other sleep-related infant deaths: expansion of recommendations for a safe infant sleeping environment. Pediatrics. 2011;128:e1341-1367.
55. Smith LA, Geller NL, Kellams AL, et al. Infant sleep location and breastfeeding practices in the United States: 2011-2014. Acad Pediatr. 2016;16:540-549.
56. Task Force on Sudden Infant Death Syndrome. SIDS and other sleep-related infant deaths: updated 2016 recommendations for a safe infant sleeping environment. Pediatrics. 2016;138;e20162938.
57. Corriveau SK, Drake, EE. Kellams AL, et al. Evaluation of an office protocol to increase exclusivity of breastfeeding. Pediatrics. 2013;131:942-950.
1. Langan RC. Discharge procedures for healthy newborns. Am Fam Physician. 2006;73:849-852.
2. Hartman S, Taylor A. Problems of the newborn and infant. In: Paulman PM, Taylor RB, Paulman AA, et al, eds. Family Medicine: Principles and Practice. 7th ed. Cham, Switzerland: Springer Cham; 2016:217-239.
3. Meara E, Kotagal UR, Atherton HD, et al. Impact of early newborn discharge legislation and early follow-up visits on infant outcomes in a state Medicaid population. Pediatrics. 2004;113:1619-1627.
4. Benitz WE; Committee on Fetus and Newborn, American Academy of Pediatrics. Hospital stay for healthy term newborn infants. Pediatrics. 2015;135:948-953.
5. Escobar GJ, Greene JD, Hulac P, et al. Rehospitalisation after birth hospitalisation: patterns among infants of all gestations. Arch Dis Child. 2005;90:125-131.
6. Escobar GJ, Braveman PA, Ackerson L, et al. A randomized comparison of home visits and hospital-based group follow-up visits after early postpartum discharge. Pediatrics. 2001;108:719-727.
7. Meara E, Kotagal UR, Atherton HD, et al. Impact of early newborn discharge legislation and early follow-up visits on infant outcomes in a state Medicaid population. Pediatrics. 2004;113:1619–1627.
8. Benitz WE; Committee on Fetus and Newborn, American Academy of Pediatrics. Hospital stay for healthy term newborn infants. Pediatrics. 2015;135:948-953.
9. Maisels MJ, Vinod VK, Bhutani D, et al. Hyperbilirubinemia in the newborn infant ≥35 weeks’ gestation: an update with clarifications. Pediatrics. 2009;124:1193-1198.
10. Crossland DS, Richmond S, Hudson M, et al. Weight change in the term baby in the first 2 weeks of life. Acta Paediatrica. 2008;97:425-429.
11. Noel-Weiss J, Courant G, Woodend AK. Physiological weight loss in the breastfed neonate: a systematic review. Open Med. 2008;2:e99-e110.
12. Holmes AV, McLeod AY, Bunik M. ABM Clinical Protocol #5: Peripartum breastfeeding management for the healthy mother and infant at term. Breastfeed Med. 2013;8:469-473.
13. National Library of Medicine. Drugs and Lactation Database (LactMed). Available at: http://toxnet.nlm.nih.gov/newtoxnet/lactmed.htm. Accessed February 1, 2018.
14. World Health Organization. Guideline: Protecting, promoting and supporting breastfeeding in facilities providing maternity and newborn services. Available at: http://www.who.int/nutrition/publications/guidelines/breastfeeding-facilities-maternity-newborn/en/. Accessed March 23, 2018.
15. Chantry CJ, Dewey KG, Peerson JM, et al. In-hospital formula use increases early breastfeeding cessation among first-time mothers intending to exclusively breastfeed. J Pediatr. 2014;164:1339-1345.
16. Patel S, Patel S. The effectiveness of lactation consultants and lactation counselors on breastfeeding outcomes. J Hum Lact. 2015;32:530-541.
17. Position Paper: Breastfeeding, family physicians supporting. American Academy of Family Physicians Breastfeeding Advisory Committee. Available at: www.aafp.org/about/policies/all/breastfeeding-support.html. 2017. Accessed February 1, 2018.
18. Eidelman AI, Schanler RJ; Section on Breastfeeding. Policy Statement: Breastfeeding and the use of human milk. Pediatrics. 2012;129:e827-e841.
19. Ip S, Chung M, Raman G, et al. A summary of the Agency for Healthcare Research and Quality’s evidence report on breastfeeding in developed countries. Breastfeed Med. 2009;4 Suppl 1:S17-S30.
20. Schwarz EB, Ray RM, Stuebe AM, et al. Duration of lactation and risk factors for maternal cardiovascular disease. Obstet Gynecol. 2009;113:974-982.
21. Luan NN, Wu QJ, Gong TT, et al. Breastfeeding and ovarian cancer risk: a meta-analysis of epidemiologic studies. Am J Clin Nutr. 2013;98:1020-1031.
22. Ip S, Chung M, Raman G, et al. Breastfeeding and maternal and infant health outcomes in developed countries. Evid Rep Technol Assess (Full Rep). 2007;(153):1-186.
23. Hartman S, Barnett J, Bonuck KA. Implementing international board-certified lactation consultants intervention into routine care: barriers and recommendations. Clinical Lactation. 2012;3:131-137.
24. Hodnett ED, Gates S, Hofmeyr GJ, et al. Continuous support for women during childbirth. Cochrane Database Syst Rev. 2013;7:CD003766.
25. Lassi ZS, Das JK, Salam RA, et al. Evidence from community-level inputs to improve quality of care for maternal and newborn health: interventions and findings. Reprod Health. 2014;11(Suppl 2):S2.
26. Chapman DJ, Pérez-Escamilla R. Breastfeeding among minority women: moving from risk factors to interventions. Adv Nutr. 2012;3:95-104.
27. Rosen-Carole C, Hartman S; Academy of Breastfeeding Medicine. ABM Clinical Protocol #19: Breastfeeding promotion in the prenatal setting, revision 2015. Breastfeed Med. 2015;10:451-457.
28. Tanner-Smith EE, Steinka-Fry KT, Lipsey MW. Effects of CenteringPregnancy group prenatal care on breastfeeding outcomes. J Midwifery Womens Health. 2013;58:389-395.
29. Singhal A, Kennedy K, Lanigan J, et al. Dietary nucleotides and early growth in formula-fed infants: a randomized controlled trial. Pediatrics. 2010;126:e946-e953.
30. Demirci JR, Bogen DL, Holland C, et al. Characteristics of breastfeeding discussions at the initial prenatal visit. Obstet Gynecol. 2013;122:1263-1270.
31. Ingram J, Johnson D, Copeland M, et al. The development of a tongue assessment tool to assist with tongue tie identification. Arch Dis Child Fetal Neonatal Ed. 2015;100:F344-F348.
32. Power RF, Murphy JF. Tongue tie and frenotomy in infants with breastfeeding difficulties: achieving a balance. Arch Dis Child. 2015;100:489-494.
33. Buryk M, Bloom D, Shope T. Efficacy of neonatal release of ankyloglossia: a randomized trial. Pediatrics. 2011;128:280-288.
34. Francis DO, Krishnaswami S, McPheeters M. Treatment of ankyloglossia and breastfeeding outcomes: a systematic review. Pediatrics. 2015;135:e1458-e1466.
35. Amir LH, James JP, Donath SM. Reliability of the Hazelbaker Assessment Tool for Lingual Frenulum Function. Int Breastfeed J. 2006;1:3.
36. Misra M, Pacaud D, Petryk A, et al; Drug and Therapeutics Committee of the Lawson Wilkins Pediatric Endocrine Society. Vitamin D deficiency in children and its management: review of current knowledge and recommendations. Pediatrics. 2008;122:398-417.
37. Hollis BW, Wagner CL, Howard CR, et al. Maternal versus infant vitamin D supplementation during lactation: a randomized controlled trial. Pediatrics. 2015;136:625-634.
38. American Academy of Pediatrics Subcommittee on Hyperbilirubinemia. Management of hyperbilirubinemia in the newborn infant 35 or more weeks of gestation. Pediatrics. 2004;114;297-316 [erratum: Pediatrics. 2004;114:1138].
39. Ip S, Chung M, Kulig J, et al; American Academy of Pediatrics Subcommittee on Hyperbilirubinemia. An evidence-based review of important issues concerning neonatal hyperbilirubinemia. Pediatrics. 2004;114:e130-e153.
40. Taylor JA, Burgos AE, Flaherman V, et al. Discrepancies between transcutaneous and serum bilirubin measurements. Pediatrics. 2015:135:224-231.
41. Newman TB. Data suggest visual assessment of jaundice in newborns is helpful. J Pediatr. 2009;154:466; author reply 466-467.
42. Roberts KB. Young, febrile infants: a 30-year odyssey ends where it started. JAMA. 2004;291:1261-1262.
43. Bhatti M, Chu A, Hageman JR, et al. Future directions in the evaluation and management of neonatal sepsis. NeoReviews. 2012;13:e103-e110.
44. American College of Emergency Physicians Clinical Policies Committee; American College of Emergency Physicians Clinical Policies Subcommittee on Pediatric Fever. Clinical policy for children younger than three years presenting to the emergency department with fever. Ann Emerg Med. 2003;42:530-545.
45. Schrag SJ, Farley MM, Petit S, et al. Epidemiology of invasive early-onset neonatal sepsis, 2005 to 2014. Pediatrics. 2016;138:pii: e20162013.
46. Bonadio W, Maida G. Urinary tract infection in outpatient febrile infants younger than 30 days of age: a 10-year evaluation. Pediatr Infect Disease J. 2014;33:342-344.
47. Bressan S, Gomez B, Mintegi S, et al. Diagnostic performance of the lab-score in predicting severe and invasive bacterial infections in well-appearing young febrile infants. Pediatr Infect Dis J. 2012;31:1239-1244.
48. Milcent K, Faesch S, Gras-Le Guen C, et al. Use of procalcitonin assays to predict serious bacterial infection in young febrile infants. JAMA Pediatr. 2016;170:62-69.
49. Kuppermann N, Mahajan P. Role of serum procalcitonin in identifying young febrile infants with invasive bacterial infections: one step closer to the Holy Grail? JAMA Pediatr. 2016;170:17-18.
50. England JT, Del Vecchio MT, Aronoff SC. Use of serum procalcitonin in evaluation of febrile infants: a meta-analysis of 2317 patients. J Emerg Med. 2014;47:682-688.
51. Schroeder AR, Chang PW, Shen MW, et al. Diagnostic accuracy of the urinalysis for urinary tract infection in infants <3 months of age. Pediatrics. 2015;135:965-971.
52. Salm Ward TC, Balfour GM. Infant safe sleep interventions, 1990-2015: a review. J Community Health. 2016;41:180-196.
53. Goldstein RD, Trachtenberg FL, Sens MA, et al. Overall postneonatal mortality and rates of SIDS. Pediatrics. 2016;137:e20152298.
54. Task Force on Sudden Infant Death Syndrome, Moon RY. SIDS and other sleep-related infant deaths: expansion of recommendations for a safe infant sleeping environment. Pediatrics. 2011;128:e1341-1367.
55. Smith LA, Geller NL, Kellams AL, et al. Infant sleep location and breastfeeding practices in the United States: 2011-2014. Acad Pediatr. 2016;16:540-549.
56. Task Force on Sudden Infant Death Syndrome. SIDS and other sleep-related infant deaths: updated 2016 recommendations for a safe infant sleeping environment. Pediatrics. 2016;138;e20162938.
57. Corriveau SK, Drake, EE. Kellams AL, et al. Evaluation of an office protocol to increase exclusivity of breastfeeding. Pediatrics. 2013;131:942-950.
From The Journal of Family Practice | 2018;67(4):E4-E15.
PRACTICE RECOMMENDATIONS
› Include a full work-up and empiric antibiotics in the initial management of all febrile infants ≤28 days of age. A
› Recommend that newborns breastfeed exclusively (in the absence of contraindications) for 6 months and continue some breastfeeding until the baby is at least 12 to 24 months of age. A
› Screen all newborns for jaundice before discharge by 1) clinical assessment or 2) testing for total serum bilirubin (TSB) or transcutaneous bilirubin (TcB); measurement of TcB provides a reasonable estimate of the TSB level in healthy newborns at levels <15 mg/dL. B
Strength of recommendation (SOR)
A Good-quality patient-oriented evidence
B Inconsistent or limited-quality patient-oriented evidence
C Consensus, usual practice, opinion, disease-oriented evidence, case series
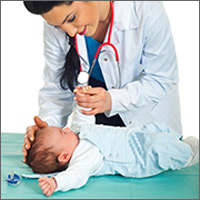
Bilateral thigh and knee pain • leg weakness • no history of trauma • Dx?
THE CASE
A 67-year-old woman presented to our orthopaedic clinic with a 2-year history of bilateral thigh and knee pain and weakness of her legs. She had no history of trauma, and the pain, which was localized to the distal anterior thighs and patellofemoral area, was 7/10 at rest and worse with standing and walking.
Her medical history was significant for osteoporosis (diagnosed in 2004), hypertension, hypothyroidism, gastroesophageal reflux disease, and menopause (age 54). Her original dual-energy x-ray absorptiometry (DEXA) scan did not reveal the presence of any previous fractures. She was started on calcium and vitamin D supplementation and oral alendronate (70 mg once a week). She took alendronate for 4 years until 2008, when it was stopped due to nausea. She was then started on zoledronic acid (5 mg IV annually). She received 5 infusions of zoledronic acid between 2008 and 2013; she did not have an infusion in 2012. Her medication list also included lisinopril, omeprazole, naproxen, cyclobenzaprine, and a multivitamin. She had normal renal function (estimated glomerular filtration rate >60 mL/min/1.73 m2) and she did not drink alcohol or use tobacco.
In the 2 years prior to her visit to our clinic, she had been evaluated by her primary care provider, an orthopedic sports medicine specialist, 2 spinal surgeons, and a physiatrist. She had also undergone 30 physical therapy sessions. Bilateral femur radiographs (FIGURE 1) ordered by her orthopedist 6 months earlier demonstrated no evidence of fracture, but did show an incidental enchondroma in the right distal diaphysis and bilateral thickening of the lateral femoral cortices.
Finally, with no relief in sight, her obstetrician suggested that she might be experiencing myalgias attributable to her zoledronic acid infusions. She was subsequently referred to us.
The physical exam revealed a thin female with a body mass index of 21. She had mild tenderness on palpation of the bilateral anterior thighs and knees. There was no pain with hip or knee range of motion and minimal pain in the bilateral lower extremities with axial loading. The patient had normal sensation, did not have an antalgic gait, and exhibited 5/5 strength bilaterally in all distributions of the lower extremities.
THE DIAGNOSIS
Due to continued pain despite negative x-rays, we obtained a 3-phase bone scan of the pelvis and bilateral femurs. Delayed images showed moderately increased activity in the mid-right and mid-left lateral femoral diaphyses at the cortex and confirmed stress fractures (FIGURE 2).
DISCUSSION
Bisphosphonates are considered first-line therapy for osteoporosis, according to current evidence-based guidelines.1 These medications inhibit osteoclast activity and can bind to the bone for more than 10 years.2,3 (In women with bone mineral density scores ≤ –2.5, the number needed to treat is 21.1,4)
Patients taking bisphosphonates, however, are susceptible to atypical femoral fractures (AFFs), which are stress or insufficiency fractures associated with minimal or no trauma.5 The pathophysiology remains unknown at this time, but AFFs may result from changes in bone remodeling that occur when a bone experiences repetitive microtrauma, leading to lateral cortical thickening of the femur.6,7 Incidence of AFFs in patients taking bisphosphonates is estimated to be between 3.2 and 50 cases per 100,000 person-years; however, this risk increases to approximately 100 per 100,000 person-years with long-term use.5 Other risk factors include low body weight, advancing age, rheumatoid arthritis, long-term glucocorticoid therapy, and excessive alcohol and cigarette use.8
What you’ll see
Symptoms typically include unilateral or bilateral prodromal pain with a sharp or achy character that is localized to the mid-thigh, upper thigh, or groin.9 If an AFF is suspected, we recommend performing a bilateral exam and obtaining radiographs.
If characteristic features are found (eg, signs of focal cortical thickening or beaking) and pain arises in the opposite limb, obtain a radiograph of the contralateral femur. If radiographs are negative but suspicion remains, order magnetic resonance imaging or a bone scan, to identify a cortical fracture line, bone and marrow edema, or hyperemia.5
Begin treatment by discontinuing bisphosphonates
Upon identification of an AFF, discontinue bisphosphonates and initiate calcium and vitamin D supplementation.5 Prophylactic surgical fixation may also be necessary to accelerate healing and prevent fracture propagation and further pain.
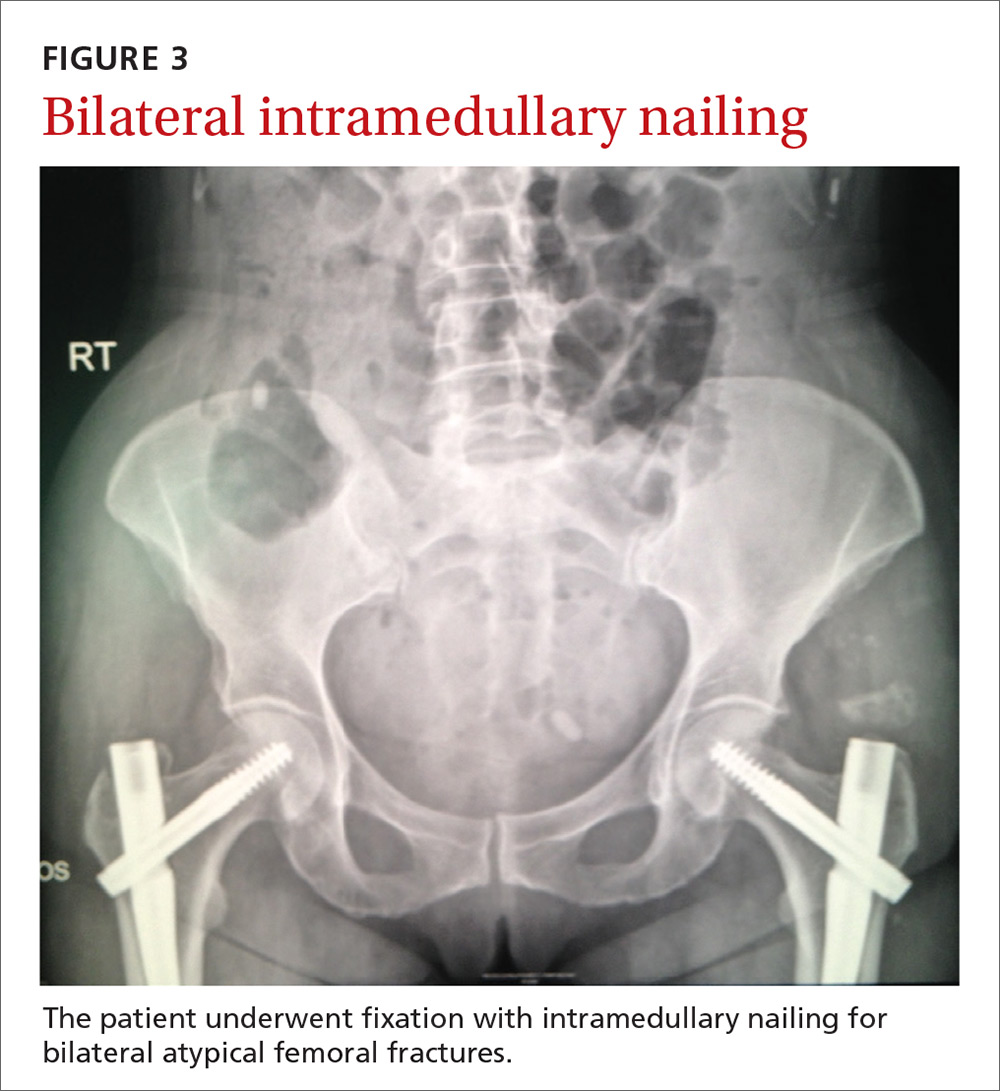
Our patient. Due to the longevity of the symptoms and the bilateral stress fractures noted on the bone scan, our patient chose to proceed with intramedullary nailing of the bilateral femurs (FIGURES 3 and 4). On postop Day 1, she was able to ambulate using a walker and to participate in bilateral weight-bearing (as tolerated). She was discharged to a skilled nursing facility, where she progressed to full weight-bearing without aid. On follow-up (one year postop), the patient reported no residual leg pain and was able to work out 5 days per week. Radiographs of her femurs demonstrated healed fractures and stable position of the intramedullary nails.
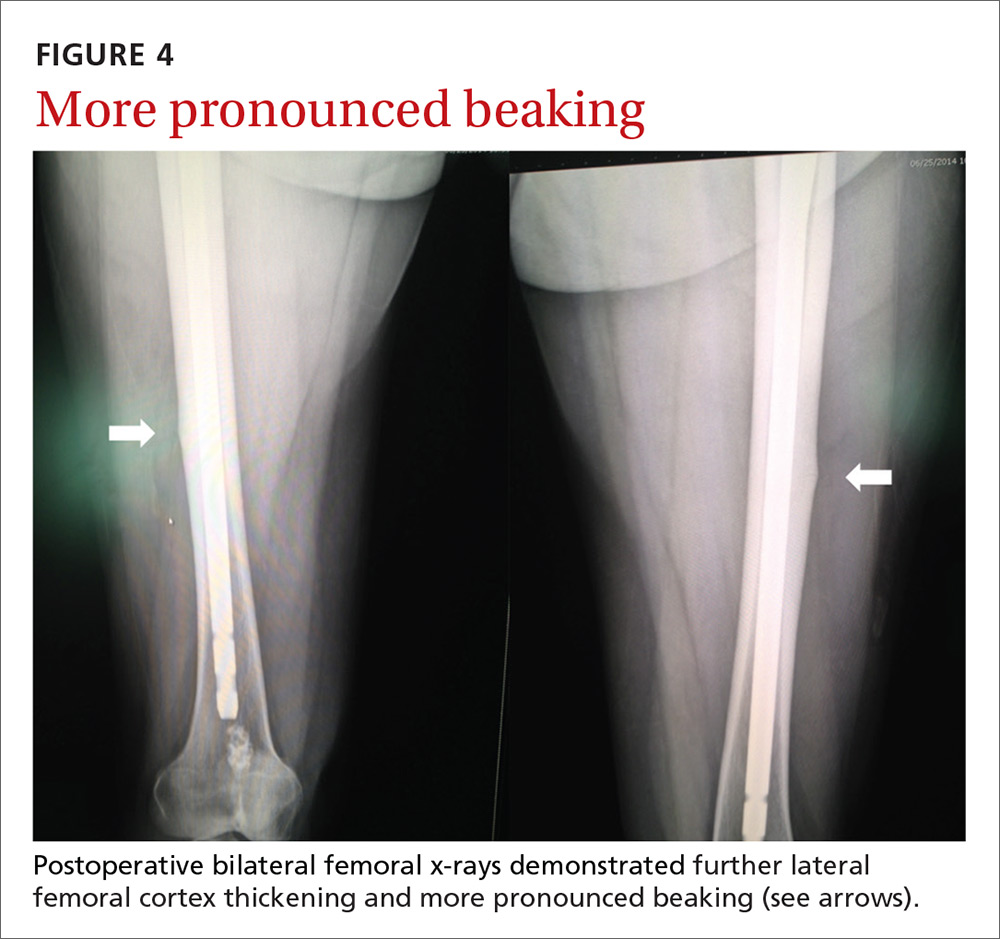
THE TAKEAWAY
An increased suspicion for AFFs due to bisphosphonate use can lead to earlier diagnosis and decreased morbidity for patients. Use of femoral imaging can promote detection and reduce financial burden.
To help prevent AFFs from occurring, we recommend reevaluating the need for continued bisphosphonate therapy after 2 to 5 years of treatment. Continued surveillance is also advisable throughout the duration of their use.
ACKNOWLEDGMENT
The authors wish to acknowledge Dr. Maurice Manring for his help in preparing this manuscript.
1. Watts NB, Bilezikian JP, Camacho PM, et al. American Association of Clinical Endocrinologists Medical Guidelines for Clinical Practice for the diagnosis and treatment of postmenopausal osteoporosis. Endocr Pract. 2010;16 Suppl 3:1-37.
2. Cakmak S, Mahiroğullari M, Keklikci K, et al. Bilateral low-energy sequential femoral shaft fractures in patients on long-term bisphosphonate therapy. Acta Orthop Traumatol Turc. 2013;47:162-172.
3. Drake MT, Clarke BL, Khosla S. Bisphosphonates: mechanism of action and role in clinical practice. Mayo Clin Proc. 2008;83:1032-1045.
4. Black DM, Bauer DC, Schwartz AV, et al. Continuing bisphosphonate treatment for osteoporosis—for whom and for how long? N Engl J Med. 2012;366:2051-2053.
5. Shane E, Burr D, Abrahamsen B, et al. Atypical subtrochanteric and diaphyseal femoral fractures: second report of a task force of the American Society for Bone and Mineral Research. J Bone Miner Res. 2014;29:1-23.
6. Allen MR. Recent advances in understanding bisphosphonate effects on bone mechanical properties. Curr Osteoporos Rep. 2018 Mar 1. [Epub ahead of print]
7. Hagino H, Endo N, Yamamoto T, et al. Treatment status and radiographic features of patients with atypical femoral fractures. J Orthop Sci. 2018;23:316-320.
8. Kanis JA, Borgstrom F, De Laet C, et al. Assessment of fracture risk. Osteoporos Int. 2005;16:581-589.
9. Giusti A, Hamdy NA, Papapoulos SE. Atypical fractures of the femur and bisphosphonate therapy: a systematic review of case/case series studies. Bone. 2010;47:169-180.
THE CASE
A 67-year-old woman presented to our orthopaedic clinic with a 2-year history of bilateral thigh and knee pain and weakness of her legs. She had no history of trauma, and the pain, which was localized to the distal anterior thighs and patellofemoral area, was 7/10 at rest and worse with standing and walking.
Her medical history was significant for osteoporosis (diagnosed in 2004), hypertension, hypothyroidism, gastroesophageal reflux disease, and menopause (age 54). Her original dual-energy x-ray absorptiometry (DEXA) scan did not reveal the presence of any previous fractures. She was started on calcium and vitamin D supplementation and oral alendronate (70 mg once a week). She took alendronate for 4 years until 2008, when it was stopped due to nausea. She was then started on zoledronic acid (5 mg IV annually). She received 5 infusions of zoledronic acid between 2008 and 2013; she did not have an infusion in 2012. Her medication list also included lisinopril, omeprazole, naproxen, cyclobenzaprine, and a multivitamin. She had normal renal function (estimated glomerular filtration rate >60 mL/min/1.73 m2) and she did not drink alcohol or use tobacco.
In the 2 years prior to her visit to our clinic, she had been evaluated by her primary care provider, an orthopedic sports medicine specialist, 2 spinal surgeons, and a physiatrist. She had also undergone 30 physical therapy sessions. Bilateral femur radiographs (FIGURE 1) ordered by her orthopedist 6 months earlier demonstrated no evidence of fracture, but did show an incidental enchondroma in the right distal diaphysis and bilateral thickening of the lateral femoral cortices.
Finally, with no relief in sight, her obstetrician suggested that she might be experiencing myalgias attributable to her zoledronic acid infusions. She was subsequently referred to us.
The physical exam revealed a thin female with a body mass index of 21. She had mild tenderness on palpation of the bilateral anterior thighs and knees. There was no pain with hip or knee range of motion and minimal pain in the bilateral lower extremities with axial loading. The patient had normal sensation, did not have an antalgic gait, and exhibited 5/5 strength bilaterally in all distributions of the lower extremities.
THE DIAGNOSIS
Due to continued pain despite negative x-rays, we obtained a 3-phase bone scan of the pelvis and bilateral femurs. Delayed images showed moderately increased activity in the mid-right and mid-left lateral femoral diaphyses at the cortex and confirmed stress fractures (FIGURE 2).
DISCUSSION
Bisphosphonates are considered first-line therapy for osteoporosis, according to current evidence-based guidelines.1 These medications inhibit osteoclast activity and can bind to the bone for more than 10 years.2,3 (In women with bone mineral density scores ≤ –2.5, the number needed to treat is 21.1,4)
Patients taking bisphosphonates, however, are susceptible to atypical femoral fractures (AFFs), which are stress or insufficiency fractures associated with minimal or no trauma.5 The pathophysiology remains unknown at this time, but AFFs may result from changes in bone remodeling that occur when a bone experiences repetitive microtrauma, leading to lateral cortical thickening of the femur.6,7 Incidence of AFFs in patients taking bisphosphonates is estimated to be between 3.2 and 50 cases per 100,000 person-years; however, this risk increases to approximately 100 per 100,000 person-years with long-term use.5 Other risk factors include low body weight, advancing age, rheumatoid arthritis, long-term glucocorticoid therapy, and excessive alcohol and cigarette use.8
What you’ll see
Symptoms typically include unilateral or bilateral prodromal pain with a sharp or achy character that is localized to the mid-thigh, upper thigh, or groin.9 If an AFF is suspected, we recommend performing a bilateral exam and obtaining radiographs.
If characteristic features are found (eg, signs of focal cortical thickening or beaking) and pain arises in the opposite limb, obtain a radiograph of the contralateral femur. If radiographs are negative but suspicion remains, order magnetic resonance imaging or a bone scan, to identify a cortical fracture line, bone and marrow edema, or hyperemia.5
Begin treatment by discontinuing bisphosphonates
Upon identification of an AFF, discontinue bisphosphonates and initiate calcium and vitamin D supplementation.5 Prophylactic surgical fixation may also be necessary to accelerate healing and prevent fracture propagation and further pain.
Our patient. Due to the longevity of the symptoms and the bilateral stress fractures noted on the bone scan, our patient chose to proceed with intramedullary nailing of the bilateral femurs (FIGURES 3 and 4). On postop Day 1, she was able to ambulate using a walker and to participate in bilateral weight-bearing (as tolerated). She was discharged to a skilled nursing facility, where she progressed to full weight-bearing without aid. On follow-up (one year postop), the patient reported no residual leg pain and was able to work out 5 days per week. Radiographs of her femurs demonstrated healed fractures and stable position of the intramedullary nails.
THE TAKEAWAY
An increased suspicion for AFFs due to bisphosphonate use can lead to earlier diagnosis and decreased morbidity for patients. Use of femoral imaging can promote detection and reduce financial burden.
To help prevent AFFs from occurring, we recommend reevaluating the need for continued bisphosphonate therapy after 2 to 5 years of treatment. Continued surveillance is also advisable throughout the duration of their use.
ACKNOWLEDGMENT
The authors wish to acknowledge Dr. Maurice Manring for his help in preparing this manuscript.
THE CASE
A 67-year-old woman presented to our orthopaedic clinic with a 2-year history of bilateral thigh and knee pain and weakness of her legs. She had no history of trauma, and the pain, which was localized to the distal anterior thighs and patellofemoral area, was 7/10 at rest and worse with standing and walking.
Her medical history was significant for osteoporosis (diagnosed in 2004), hypertension, hypothyroidism, gastroesophageal reflux disease, and menopause (age 54). Her original dual-energy x-ray absorptiometry (DEXA) scan did not reveal the presence of any previous fractures. She was started on calcium and vitamin D supplementation and oral alendronate (70 mg once a week). She took alendronate for 4 years until 2008, when it was stopped due to nausea. She was then started on zoledronic acid (5 mg IV annually). She received 5 infusions of zoledronic acid between 2008 and 2013; she did not have an infusion in 2012. Her medication list also included lisinopril, omeprazole, naproxen, cyclobenzaprine, and a multivitamin. She had normal renal function (estimated glomerular filtration rate >60 mL/min/1.73 m2) and she did not drink alcohol or use tobacco.
In the 2 years prior to her visit to our clinic, she had been evaluated by her primary care provider, an orthopedic sports medicine specialist, 2 spinal surgeons, and a physiatrist. She had also undergone 30 physical therapy sessions. Bilateral femur radiographs (FIGURE 1) ordered by her orthopedist 6 months earlier demonstrated no evidence of fracture, but did show an incidental enchondroma in the right distal diaphysis and bilateral thickening of the lateral femoral cortices.
Finally, with no relief in sight, her obstetrician suggested that she might be experiencing myalgias attributable to her zoledronic acid infusions. She was subsequently referred to us.
The physical exam revealed a thin female with a body mass index of 21. She had mild tenderness on palpation of the bilateral anterior thighs and knees. There was no pain with hip or knee range of motion and minimal pain in the bilateral lower extremities with axial loading. The patient had normal sensation, did not have an antalgic gait, and exhibited 5/5 strength bilaterally in all distributions of the lower extremities.
THE DIAGNOSIS
Due to continued pain despite negative x-rays, we obtained a 3-phase bone scan of the pelvis and bilateral femurs. Delayed images showed moderately increased activity in the mid-right and mid-left lateral femoral diaphyses at the cortex and confirmed stress fractures (FIGURE 2).
DISCUSSION
Bisphosphonates are considered first-line therapy for osteoporosis, according to current evidence-based guidelines.1 These medications inhibit osteoclast activity and can bind to the bone for more than 10 years.2,3 (In women with bone mineral density scores ≤ –2.5, the number needed to treat is 21.1,4)
Patients taking bisphosphonates, however, are susceptible to atypical femoral fractures (AFFs), which are stress or insufficiency fractures associated with minimal or no trauma.5 The pathophysiology remains unknown at this time, but AFFs may result from changes in bone remodeling that occur when a bone experiences repetitive microtrauma, leading to lateral cortical thickening of the femur.6,7 Incidence of AFFs in patients taking bisphosphonates is estimated to be between 3.2 and 50 cases per 100,000 person-years; however, this risk increases to approximately 100 per 100,000 person-years with long-term use.5 Other risk factors include low body weight, advancing age, rheumatoid arthritis, long-term glucocorticoid therapy, and excessive alcohol and cigarette use.8
What you’ll see
Symptoms typically include unilateral or bilateral prodromal pain with a sharp or achy character that is localized to the mid-thigh, upper thigh, or groin.9 If an AFF is suspected, we recommend performing a bilateral exam and obtaining radiographs.
If characteristic features are found (eg, signs of focal cortical thickening or beaking) and pain arises in the opposite limb, obtain a radiograph of the contralateral femur. If radiographs are negative but suspicion remains, order magnetic resonance imaging or a bone scan, to identify a cortical fracture line, bone and marrow edema, or hyperemia.5
Begin treatment by discontinuing bisphosphonates
Upon identification of an AFF, discontinue bisphosphonates and initiate calcium and vitamin D supplementation.5 Prophylactic surgical fixation may also be necessary to accelerate healing and prevent fracture propagation and further pain.
Our patient. Due to the longevity of the symptoms and the bilateral stress fractures noted on the bone scan, our patient chose to proceed with intramedullary nailing of the bilateral femurs (FIGURES 3 and 4). On postop Day 1, she was able to ambulate using a walker and to participate in bilateral weight-bearing (as tolerated). She was discharged to a skilled nursing facility, where she progressed to full weight-bearing without aid. On follow-up (one year postop), the patient reported no residual leg pain and was able to work out 5 days per week. Radiographs of her femurs demonstrated healed fractures and stable position of the intramedullary nails.
THE TAKEAWAY
An increased suspicion for AFFs due to bisphosphonate use can lead to earlier diagnosis and decreased morbidity for patients. Use of femoral imaging can promote detection and reduce financial burden.
To help prevent AFFs from occurring, we recommend reevaluating the need for continued bisphosphonate therapy after 2 to 5 years of treatment. Continued surveillance is also advisable throughout the duration of their use.
ACKNOWLEDGMENT
The authors wish to acknowledge Dr. Maurice Manring for his help in preparing this manuscript.
1. Watts NB, Bilezikian JP, Camacho PM, et al. American Association of Clinical Endocrinologists Medical Guidelines for Clinical Practice for the diagnosis and treatment of postmenopausal osteoporosis. Endocr Pract. 2010;16 Suppl 3:1-37.
2. Cakmak S, Mahiroğullari M, Keklikci K, et al. Bilateral low-energy sequential femoral shaft fractures in patients on long-term bisphosphonate therapy. Acta Orthop Traumatol Turc. 2013;47:162-172.
3. Drake MT, Clarke BL, Khosla S. Bisphosphonates: mechanism of action and role in clinical practice. Mayo Clin Proc. 2008;83:1032-1045.
4. Black DM, Bauer DC, Schwartz AV, et al. Continuing bisphosphonate treatment for osteoporosis—for whom and for how long? N Engl J Med. 2012;366:2051-2053.
5. Shane E, Burr D, Abrahamsen B, et al. Atypical subtrochanteric and diaphyseal femoral fractures: second report of a task force of the American Society for Bone and Mineral Research. J Bone Miner Res. 2014;29:1-23.
6. Allen MR. Recent advances in understanding bisphosphonate effects on bone mechanical properties. Curr Osteoporos Rep. 2018 Mar 1. [Epub ahead of print]
7. Hagino H, Endo N, Yamamoto T, et al. Treatment status and radiographic features of patients with atypical femoral fractures. J Orthop Sci. 2018;23:316-320.
8. Kanis JA, Borgstrom F, De Laet C, et al. Assessment of fracture risk. Osteoporos Int. 2005;16:581-589.
9. Giusti A, Hamdy NA, Papapoulos SE. Atypical fractures of the femur and bisphosphonate therapy: a systematic review of case/case series studies. Bone. 2010;47:169-180.
1. Watts NB, Bilezikian JP, Camacho PM, et al. American Association of Clinical Endocrinologists Medical Guidelines for Clinical Practice for the diagnosis and treatment of postmenopausal osteoporosis. Endocr Pract. 2010;16 Suppl 3:1-37.
2. Cakmak S, Mahiroğullari M, Keklikci K, et al. Bilateral low-energy sequential femoral shaft fractures in patients on long-term bisphosphonate therapy. Acta Orthop Traumatol Turc. 2013;47:162-172.
3. Drake MT, Clarke BL, Khosla S. Bisphosphonates: mechanism of action and role in clinical practice. Mayo Clin Proc. 2008;83:1032-1045.
4. Black DM, Bauer DC, Schwartz AV, et al. Continuing bisphosphonate treatment for osteoporosis—for whom and for how long? N Engl J Med. 2012;366:2051-2053.
5. Shane E, Burr D, Abrahamsen B, et al. Atypical subtrochanteric and diaphyseal femoral fractures: second report of a task force of the American Society for Bone and Mineral Research. J Bone Miner Res. 2014;29:1-23.
6. Allen MR. Recent advances in understanding bisphosphonate effects on bone mechanical properties. Curr Osteoporos Rep. 2018 Mar 1. [Epub ahead of print]
7. Hagino H, Endo N, Yamamoto T, et al. Treatment status and radiographic features of patients with atypical femoral fractures. J Orthop Sci. 2018;23:316-320.
8. Kanis JA, Borgstrom F, De Laet C, et al. Assessment of fracture risk. Osteoporos Int. 2005;16:581-589.
9. Giusti A, Hamdy NA, Papapoulos SE. Atypical fractures of the femur and bisphosphonate therapy: a systematic review of case/case series studies. Bone. 2010;47:169-180.
How well do POLST forms assure that patients get the end-of-life care they requested?
EVIDENCE SUMMARY
The POLST form offers choices within 4 treatment areas: “attempt CPR” or “allow natural death” if the patient is in cardiopulmonary arrest; “comfort,” “limited,” or “full” medical interventions if pulse or breathing is present; choices of additional orders, including intravenous fluids, feeding tubes, and antibiotics; and additional written orders. Most POLST studies used cross-sectional and retrospective cohort designs and assessed whether CPR was attempted. Fewer studies also evaluated adherence to orders in the other treatment areas.
Community settings: Patients with POLST more likely to die out of hospital
The largest study of POLST use in community settings evaluated deaths in Oregon over one year.1 It found that patients who indicated “do not attempt CPR” on a POLST form were 6 times more likely to die a natural, out-of-hospital death than those who had no POLST form (TABLE1-10).

A West Virginia study found that patients with POLST forms had 30% higher out-of-hospital death rates than those with traditional advanced directives and no POLST.2 In a Wisconsin study, no decedents who indicated DNR on their POLST forms received CPR.3

One study that evaluated the consistency of actual medical interventions with POLST orders in all 4 treatment areas found it to be good in most areas (“feeding tubes,” “attempting CPR.” “antibiotics,” and “IV fluids”) except “additional written orders.4
Skilled nursing facilities: Generally high adherence to POLST orders
The largest study to evaluate the consistency of treatments with POLST orders among nursing home residents found high adherence overall (94%).5 Caregivers performed CPR on none of 299 residents who selected “DNR.” However, they did not administer CPR to 6 of 7 who chose “attempt CPR” and administered antibiotics to 32% of patients who specified “no antibiotics” on their POLST forms.5
A second study of nursing home residents who selected “comfort measures only” also found high consistency for attempting CPR, intensive care admission, and ventilator support, although physicians hospitalized 2% of patients to extend life.6 Similarly, treatments matched POLST orders well overall in a Washington state study, although one patient got a feeding tube against orders.7
POLST adherence is good, but can EMS workers find the form?
A study comparing emergency medical services (EMS) management with POLST orders in an Oregon registry found good consistency.8 EMS providers didn’t attempt or halted CPR in most patients with DNR orders who were found in cardiac arrest and initiated CPR in most patients who chose “attempt CPR.” EMS providers initiated CPR in the field on 11 patients (22%) with a DNR order but discontinued resuscitation en route to the hospital.
In a smaller study, EMS providers never located paper POLST forms at the scene in most cases.9
Hospice: POLST orders prevent unwanted Tx, except maybe antibiotics
A study evaluating management in hospice programs in 3 states found that care providers followed POLST orders for limited treatment in 98% of cases.10 No patients received unwanted CPR, intubation, or feeding tubes. POLST orders didn’t predict whether patients were treated with antibiotics, however.
1. Fromme EK, Zive D, Schmidt TA, et al. Association between physician orders for life-sustaining treatment for scope of treatment and in-hospital death in Oregon. J Am Geriatr Soc. 2014;62:1246-1251.
2. Pedraza SL, Culp S, Falkenstine EC, et al. POST forms more than advance directives associated with out-of-hospital death: insights from a state registry. J Pain Symptom Manage. 2016; 51:240-246.
3. Hammes B, Rooney BL, Gundrum JD, et al. The POLST program: a retrospective review of the demographics of use and outcomes in one community where advance directives are prevalent. J Palliative Med. 2012;15:77-85.
4. Lee MA, Brummel-Smith K, Meyer J, et al. Physician orders for life-sustaining treatment (POLST): outcomes in a PACE program. J Am Geriatr Soc. 2000;48:1219-1225.
5. Hickman SE, Nelson CA, Moss AH, et al. The consistency between treatments provided to nursing facility residents and orders on the physician orders for life-sustaining treatment form. J Am Geriatr Soc. 2011;59:2091-2099.
6. Tolle SW, Tilden VP, Nelson CA, et al. A prospective study of the efficacy of the physician order form for life sustaining treatment. J Am Ger Soc.1998;46:1097-1102.
7. Meyers J, Moore C, McGrory A, et al. Physician orders for life-sustaining treatment form: honoring end-of-life directives for nursing home residents. J Geron Nursing. 2004;30:37-46.
8. Richardson DK, Fromme E, Zive D, et al. Concordance of out-of-hospital and emergency department cardiac arrest resuscitation with documented end-of-life choices in Oregon. Ann Emerg Med. 2014;63:375-383.
9. Schmidt T, Olszewski EA, Zive D, et al. The Oregon physician orders for life-sustaining treatment registry: a preliminary study of emergency medical services utilization. J Emerg Med. 2013;44:796-805.
10. Hickman SE, Nelson CA, Moss AH, et al. Use of the physician orders for life-sustaining treatment (POLST) paradigm program in the hospice setting. J Palliat Med. 2009;12:133-141.
EVIDENCE SUMMARY
The POLST form offers choices within 4 treatment areas: “attempt CPR” or “allow natural death” if the patient is in cardiopulmonary arrest; “comfort,” “limited,” or “full” medical interventions if pulse or breathing is present; choices of additional orders, including intravenous fluids, feeding tubes, and antibiotics; and additional written orders. Most POLST studies used cross-sectional and retrospective cohort designs and assessed whether CPR was attempted. Fewer studies also evaluated adherence to orders in the other treatment areas.
Community settings: Patients with POLST more likely to die out of hospital
The largest study of POLST use in community settings evaluated deaths in Oregon over one year.1 It found that patients who indicated “do not attempt CPR” on a POLST form were 6 times more likely to die a natural, out-of-hospital death than those who had no POLST form (TABLE1-10).
A West Virginia study found that patients with POLST forms had 30% higher out-of-hospital death rates than those with traditional advanced directives and no POLST.2 In a Wisconsin study, no decedents who indicated DNR on their POLST forms received CPR.3
One study that evaluated the consistency of actual medical interventions with POLST orders in all 4 treatment areas found it to be good in most areas (“feeding tubes,” “attempting CPR.” “antibiotics,” and “IV fluids”) except “additional written orders.4
Skilled nursing facilities: Generally high adherence to POLST orders
The largest study to evaluate the consistency of treatments with POLST orders among nursing home residents found high adherence overall (94%).5 Caregivers performed CPR on none of 299 residents who selected “DNR.” However, they did not administer CPR to 6 of 7 who chose “attempt CPR” and administered antibiotics to 32% of patients who specified “no antibiotics” on their POLST forms.5
A second study of nursing home residents who selected “comfort measures only” also found high consistency for attempting CPR, intensive care admission, and ventilator support, although physicians hospitalized 2% of patients to extend life.6 Similarly, treatments matched POLST orders well overall in a Washington state study, although one patient got a feeding tube against orders.7
POLST adherence is good, but can EMS workers find the form?
A study comparing emergency medical services (EMS) management with POLST orders in an Oregon registry found good consistency.8 EMS providers didn’t attempt or halted CPR in most patients with DNR orders who were found in cardiac arrest and initiated CPR in most patients who chose “attempt CPR.” EMS providers initiated CPR in the field on 11 patients (22%) with a DNR order but discontinued resuscitation en route to the hospital.
In a smaller study, EMS providers never located paper POLST forms at the scene in most cases.9
Hospice: POLST orders prevent unwanted Tx, except maybe antibiotics
A study evaluating management in hospice programs in 3 states found that care providers followed POLST orders for limited treatment in 98% of cases.10 No patients received unwanted CPR, intubation, or feeding tubes. POLST orders didn’t predict whether patients were treated with antibiotics, however.
EVIDENCE SUMMARY
The POLST form offers choices within 4 treatment areas: “attempt CPR” or “allow natural death” if the patient is in cardiopulmonary arrest; “comfort,” “limited,” or “full” medical interventions if pulse or breathing is present; choices of additional orders, including intravenous fluids, feeding tubes, and antibiotics; and additional written orders. Most POLST studies used cross-sectional and retrospective cohort designs and assessed whether CPR was attempted. Fewer studies also evaluated adherence to orders in the other treatment areas.
Community settings: Patients with POLST more likely to die out of hospital
The largest study of POLST use in community settings evaluated deaths in Oregon over one year.1 It found that patients who indicated “do not attempt CPR” on a POLST form were 6 times more likely to die a natural, out-of-hospital death than those who had no POLST form (TABLE1-10).
A West Virginia study found that patients with POLST forms had 30% higher out-of-hospital death rates than those with traditional advanced directives and no POLST.2 In a Wisconsin study, no decedents who indicated DNR on their POLST forms received CPR.3
One study that evaluated the consistency of actual medical interventions with POLST orders in all 4 treatment areas found it to be good in most areas (“feeding tubes,” “attempting CPR.” “antibiotics,” and “IV fluids”) except “additional written orders.4
Skilled nursing facilities: Generally high adherence to POLST orders
The largest study to evaluate the consistency of treatments with POLST orders among nursing home residents found high adherence overall (94%).5 Caregivers performed CPR on none of 299 residents who selected “DNR.” However, they did not administer CPR to 6 of 7 who chose “attempt CPR” and administered antibiotics to 32% of patients who specified “no antibiotics” on their POLST forms.5
A second study of nursing home residents who selected “comfort measures only” also found high consistency for attempting CPR, intensive care admission, and ventilator support, although physicians hospitalized 2% of patients to extend life.6 Similarly, treatments matched POLST orders well overall in a Washington state study, although one patient got a feeding tube against orders.7
POLST adherence is good, but can EMS workers find the form?
A study comparing emergency medical services (EMS) management with POLST orders in an Oregon registry found good consistency.8 EMS providers didn’t attempt or halted CPR in most patients with DNR orders who were found in cardiac arrest and initiated CPR in most patients who chose “attempt CPR.” EMS providers initiated CPR in the field on 11 patients (22%) with a DNR order but discontinued resuscitation en route to the hospital.
In a smaller study, EMS providers never located paper POLST forms at the scene in most cases.9
Hospice: POLST orders prevent unwanted Tx, except maybe antibiotics
A study evaluating management in hospice programs in 3 states found that care providers followed POLST orders for limited treatment in 98% of cases.10 No patients received unwanted CPR, intubation, or feeding tubes. POLST orders didn’t predict whether patients were treated with antibiotics, however.
1. Fromme EK, Zive D, Schmidt TA, et al. Association between physician orders for life-sustaining treatment for scope of treatment and in-hospital death in Oregon. J Am Geriatr Soc. 2014;62:1246-1251.
2. Pedraza SL, Culp S, Falkenstine EC, et al. POST forms more than advance directives associated with out-of-hospital death: insights from a state registry. J Pain Symptom Manage. 2016; 51:240-246.
3. Hammes B, Rooney BL, Gundrum JD, et al. The POLST program: a retrospective review of the demographics of use and outcomes in one community where advance directives are prevalent. J Palliative Med. 2012;15:77-85.
4. Lee MA, Brummel-Smith K, Meyer J, et al. Physician orders for life-sustaining treatment (POLST): outcomes in a PACE program. J Am Geriatr Soc. 2000;48:1219-1225.
5. Hickman SE, Nelson CA, Moss AH, et al. The consistency between treatments provided to nursing facility residents and orders on the physician orders for life-sustaining treatment form. J Am Geriatr Soc. 2011;59:2091-2099.
6. Tolle SW, Tilden VP, Nelson CA, et al. A prospective study of the efficacy of the physician order form for life sustaining treatment. J Am Ger Soc.1998;46:1097-1102.
7. Meyers J, Moore C, McGrory A, et al. Physician orders for life-sustaining treatment form: honoring end-of-life directives for nursing home residents. J Geron Nursing. 2004;30:37-46.
8. Richardson DK, Fromme E, Zive D, et al. Concordance of out-of-hospital and emergency department cardiac arrest resuscitation with documented end-of-life choices in Oregon. Ann Emerg Med. 2014;63:375-383.
9. Schmidt T, Olszewski EA, Zive D, et al. The Oregon physician orders for life-sustaining treatment registry: a preliminary study of emergency medical services utilization. J Emerg Med. 2013;44:796-805.
10. Hickman SE, Nelson CA, Moss AH, et al. Use of the physician orders for life-sustaining treatment (POLST) paradigm program in the hospice setting. J Palliat Med. 2009;12:133-141.
1. Fromme EK, Zive D, Schmidt TA, et al. Association between physician orders for life-sustaining treatment for scope of treatment and in-hospital death in Oregon. J Am Geriatr Soc. 2014;62:1246-1251.
2. Pedraza SL, Culp S, Falkenstine EC, et al. POST forms more than advance directives associated with out-of-hospital death: insights from a state registry. J Pain Symptom Manage. 2016; 51:240-246.
3. Hammes B, Rooney BL, Gundrum JD, et al. The POLST program: a retrospective review of the demographics of use and outcomes in one community where advance directives are prevalent. J Palliative Med. 2012;15:77-85.
4. Lee MA, Brummel-Smith K, Meyer J, et al. Physician orders for life-sustaining treatment (POLST): outcomes in a PACE program. J Am Geriatr Soc. 2000;48:1219-1225.
5. Hickman SE, Nelson CA, Moss AH, et al. The consistency between treatments provided to nursing facility residents and orders on the physician orders for life-sustaining treatment form. J Am Geriatr Soc. 2011;59:2091-2099.
6. Tolle SW, Tilden VP, Nelson CA, et al. A prospective study of the efficacy of the physician order form for life sustaining treatment. J Am Ger Soc.1998;46:1097-1102.
7. Meyers J, Moore C, McGrory A, et al. Physician orders for life-sustaining treatment form: honoring end-of-life directives for nursing home residents. J Geron Nursing. 2004;30:37-46.
8. Richardson DK, Fromme E, Zive D, et al. Concordance of out-of-hospital and emergency department cardiac arrest resuscitation with documented end-of-life choices in Oregon. Ann Emerg Med. 2014;63:375-383.
9. Schmidt T, Olszewski EA, Zive D, et al. The Oregon physician orders for life-sustaining treatment registry: a preliminary study of emergency medical services utilization. J Emerg Med. 2013;44:796-805.
10. Hickman SE, Nelson CA, Moss AH, et al. Use of the physician orders for life-sustaining treatment (POLST) paradigm program in the hospice setting. J Palliat Med. 2009;12:133-141.
Evidence-based answers from the Family Physicians Inquiries Network
EVIDENCE-BASED ANSWER:
Quite well, for cardiopulmonary resuscitation (CPR). Most patients (91%-100%) who select “do not resuscitate” (DNR) on their physician’s orders for life-sustaining treatment (POLST) forms are allowed a natural death without attempted CPR across a variety of settings (community, skilled nursing facilities, emergency medical services, and hospice). Few patients (6%) who select “comfort measures only” die in the hospital, whereas more (22%) who choose “limited interventions,” and still more (34%) without a POLST form, die in the hospital (strength of recommendation [SOR]: B, large, consistent cross-sectional and cohort studies).
Most patients (84%) who select “attempt resuscitation” receive resuscitation for out-of-hospital cardiac arrest in emergency services settings (SOR: B, small retrospective cohort study).
POLST orders declining other services (intravenous fluids, intensive care, intubation, feeding tubes) are carried out in most (84%-100%) cases. POLST orders regarding antibiotic treatments are less effectively implemented (SOR: B, moderate-sized retrospective chart review).

What are the benefits and risks of daily low-dose aspirin for primary prevention of CV events?
EVIDENCE SUMMARY
A 2013 systematic review of RCTs, systematic reviews, and meta-analyses examined the prophylactic use of low-dose aspirin for the primary prevention of cardiovascular disease (CVD) among adults 18 years and older.1 Twenty-seven papers met inclusion criteria; the total number of patients wasn’t reported.
A composite finding of nonfatal MI, nonfatal stroke, and CVD death indicated a number needed to treat (NNT) of 138 over 10 years of therapy (relative risk [RR]=0.90; 95% confidence interval [CI], 0.85-0.96). CVD death wasn’t disaggregated from this composite, but an analysis of all-cause mortality didn’t reach statistical significance (RR=0.94; 95% CI, 0.88-1.00). RR for nonfatal stroke alone also wasn’t disaggregated.
Risk of gastrointestinal (GI) bleeding was found to be a number needed to harm (NNH) of 108 over 10 years (RR=1.37; 95% CI, 1.15-1.62) whereas risk of hemorrhagic stroke didn’t reach statistical significance (RR=1.32; 95% CI, 1.00-1.74). This population-level review didn’t report disaggregated findings by age or baseline atherosclerotic cardiovascular disease (ASCVD) risk.
Another review finds benefit only for prevention of nonfatal MI
A 2016 systematic review included 2 good-quality and 9 fair-quality RCTs evaluating the benefits of low-dose aspirin compared with placebo or no treatment for primary prevention of CVD events in 118,445 patients ages 40 years and older.2 The review found benefit only for nonfatal MI, with an NNT of 126 over 10 years (RR=0.78; 95% CI, 0.71-0.87). There was no change in RR for nonfatal stroke (RR=0.95; 95% CI, 0.85-1.06); negligible impact on all-cause mortality (RR=0.95; 95% CI, 0.89-0.99); and no statistically significant benefit for CVD-specific mortality (RR=0.94; 95% CI, 0.86-1.03).
Aspirin carries risk of GI hemorrhage, but not hemorrhagic stroke
A companion 2016 systematic review of 16 RCTs, cohort studies, and meta-analyses evaluated the risk of serious bleeding in patients using low-dose aspirin for primary prevention of either CVD or cancer.3 The review (number of patients not reported) found that estimated excess bleeding events differed substantially depending on varying sources for baseline bleeding rates in aspirin nonusers.
The most conservative comparison yielded an NNH of 72 over 10 years of therapy (1.39 excess major GI bleeding events per 1000 person-years, 95% CI, 0.70-2.28). Comparison with other baseline bleeding rates in trial data yielded less risk of harm, with an NNH of 357 over 10 years (0.28 excess major GI bleeding events per 1000 person-years; 95% CI, 0.14-0.46). Excess risk for hemorrhagic stroke was not statistically significant (0.32 excess events per 1000 person-years; 95% CI, −0.05 to 0.82).
RECOMMENDATIONS
The US Preventive Services Task Force gives a Grade B recommendation (recommended, based on moderate to substantial benefit) to the use of aspirin to prevent CVD among adults ages 50 to 59 years with an ASCVD risk ≥10% who don’t have increased bleeding risk and are capable of 10 years of pharmacologic adherence with a similar expected longevity.4 The Task Force assigns a Grade C recommendation (individual and professional choice) to patients 60 to 69 years of age with the same constellation of risk factors and health status. Insufficient evidence was available to make recommendations for other age cohorts.
The American College of Chest Physicians recommends 75 to 100 mg of aspirin daily for adults 50 years or older who have moderate to high CV risk, defined as ≥10%.5
A working group of the European Society of Cardiology (ESC) released a statement in 2014 recommending aspirin for primary prevention in adults with a CV risk ≥20% and no risk factors for bleeding. For patients with a CVD risk between 10% and 20%, the ESC recommends deferring to patient preference.6
1. Sutcliffe P, Connock M, Gurung T, et al. Aspirin in primary prevention of cardiovascular disease and cancer: a systematic review of the balance of evidence from reviews of randomized trials. PLoS One. 2013;8:e81970.
2. Guirguis-Blake JM, Evans CV, Senger CA, et al. Aspirin for the primary prevention of cardiovascular events: a systematic evidence review for the US Preventive Services Task Force. Ann Intern Med. 2016;164:804-813.
3. Whitlock EP, Burda BU, Williams SB, et al. Bleeding risks with aspirin use for primary prevention in adults: a systematic review for the US Preventive Services Task Force. Ann Intern Med. 2016;164:826-835.
4. Bibbins-Domingo K, US Preventive Services Task Force. Aspirin use for the primary prevention of cardiovascular disease and colorectal cancer: US Preventive Services Task Force recommendation statement. Ann Intern Med. 2016;164:836-845.
5. Vandvik PO, Lincoff AM, Gore JM, et al. Primary and secondary prevention of cardiovascular disease: antithrombotic therapy and prevention of thrombosis, 9th ed: American College of Chest Physicians evidence-based clinical practice guidelines. Chest. 2012;141(2 Suppl):e637S-e668S.
6. Halvorsen S, Andreotti F, ten Berg JM, et al. Aspirin therapy in primary cardiovascular disease prevention: a position paper of the European Society of Cardiology Working Group on Thrombosis. J Am Coll Cardiol. 2014;64:319-327.
EVIDENCE SUMMARY
A 2013 systematic review of RCTs, systematic reviews, and meta-analyses examined the prophylactic use of low-dose aspirin for the primary prevention of cardiovascular disease (CVD) among adults 18 years and older.1 Twenty-seven papers met inclusion criteria; the total number of patients wasn’t reported.
A composite finding of nonfatal MI, nonfatal stroke, and CVD death indicated a number needed to treat (NNT) of 138 over 10 years of therapy (relative risk [RR]=0.90; 95% confidence interval [CI], 0.85-0.96). CVD death wasn’t disaggregated from this composite, but an analysis of all-cause mortality didn’t reach statistical significance (RR=0.94; 95% CI, 0.88-1.00). RR for nonfatal stroke alone also wasn’t disaggregated.
Risk of gastrointestinal (GI) bleeding was found to be a number needed to harm (NNH) of 108 over 10 years (RR=1.37; 95% CI, 1.15-1.62) whereas risk of hemorrhagic stroke didn’t reach statistical significance (RR=1.32; 95% CI, 1.00-1.74). This population-level review didn’t report disaggregated findings by age or baseline atherosclerotic cardiovascular disease (ASCVD) risk.
Another review finds benefit only for prevention of nonfatal MI
A 2016 systematic review included 2 good-quality and 9 fair-quality RCTs evaluating the benefits of low-dose aspirin compared with placebo or no treatment for primary prevention of CVD events in 118,445 patients ages 40 years and older.2 The review found benefit only for nonfatal MI, with an NNT of 126 over 10 years (RR=0.78; 95% CI, 0.71-0.87). There was no change in RR for nonfatal stroke (RR=0.95; 95% CI, 0.85-1.06); negligible impact on all-cause mortality (RR=0.95; 95% CI, 0.89-0.99); and no statistically significant benefit for CVD-specific mortality (RR=0.94; 95% CI, 0.86-1.03).
Aspirin carries risk of GI hemorrhage, but not hemorrhagic stroke
A companion 2016 systematic review of 16 RCTs, cohort studies, and meta-analyses evaluated the risk of serious bleeding in patients using low-dose aspirin for primary prevention of either CVD or cancer.3 The review (number of patients not reported) found that estimated excess bleeding events differed substantially depending on varying sources for baseline bleeding rates in aspirin nonusers.
The most conservative comparison yielded an NNH of 72 over 10 years of therapy (1.39 excess major GI bleeding events per 1000 person-years, 95% CI, 0.70-2.28). Comparison with other baseline bleeding rates in trial data yielded less risk of harm, with an NNH of 357 over 10 years (0.28 excess major GI bleeding events per 1000 person-years; 95% CI, 0.14-0.46). Excess risk for hemorrhagic stroke was not statistically significant (0.32 excess events per 1000 person-years; 95% CI, −0.05 to 0.82).
RECOMMENDATIONS
The US Preventive Services Task Force gives a Grade B recommendation (recommended, based on moderate to substantial benefit) to the use of aspirin to prevent CVD among adults ages 50 to 59 years with an ASCVD risk ≥10% who don’t have increased bleeding risk and are capable of 10 years of pharmacologic adherence with a similar expected longevity.4 The Task Force assigns a Grade C recommendation (individual and professional choice) to patients 60 to 69 years of age with the same constellation of risk factors and health status. Insufficient evidence was available to make recommendations for other age cohorts.
The American College of Chest Physicians recommends 75 to 100 mg of aspirin daily for adults 50 years or older who have moderate to high CV risk, defined as ≥10%.5
A working group of the European Society of Cardiology (ESC) released a statement in 2014 recommending aspirin for primary prevention in adults with a CV risk ≥20% and no risk factors for bleeding. For patients with a CVD risk between 10% and 20%, the ESC recommends deferring to patient preference.6
EVIDENCE SUMMARY
A 2013 systematic review of RCTs, systematic reviews, and meta-analyses examined the prophylactic use of low-dose aspirin for the primary prevention of cardiovascular disease (CVD) among adults 18 years and older.1 Twenty-seven papers met inclusion criteria; the total number of patients wasn’t reported.
A composite finding of nonfatal MI, nonfatal stroke, and CVD death indicated a number needed to treat (NNT) of 138 over 10 years of therapy (relative risk [RR]=0.90; 95% confidence interval [CI], 0.85-0.96). CVD death wasn’t disaggregated from this composite, but an analysis of all-cause mortality didn’t reach statistical significance (RR=0.94; 95% CI, 0.88-1.00). RR for nonfatal stroke alone also wasn’t disaggregated.
Risk of gastrointestinal (GI) bleeding was found to be a number needed to harm (NNH) of 108 over 10 years (RR=1.37; 95% CI, 1.15-1.62) whereas risk of hemorrhagic stroke didn’t reach statistical significance (RR=1.32; 95% CI, 1.00-1.74). This population-level review didn’t report disaggregated findings by age or baseline atherosclerotic cardiovascular disease (ASCVD) risk.
Another review finds benefit only for prevention of nonfatal MI
A 2016 systematic review included 2 good-quality and 9 fair-quality RCTs evaluating the benefits of low-dose aspirin compared with placebo or no treatment for primary prevention of CVD events in 118,445 patients ages 40 years and older.2 The review found benefit only for nonfatal MI, with an NNT of 126 over 10 years (RR=0.78; 95% CI, 0.71-0.87). There was no change in RR for nonfatal stroke (RR=0.95; 95% CI, 0.85-1.06); negligible impact on all-cause mortality (RR=0.95; 95% CI, 0.89-0.99); and no statistically significant benefit for CVD-specific mortality (RR=0.94; 95% CI, 0.86-1.03).
Aspirin carries risk of GI hemorrhage, but not hemorrhagic stroke
A companion 2016 systematic review of 16 RCTs, cohort studies, and meta-analyses evaluated the risk of serious bleeding in patients using low-dose aspirin for primary prevention of either CVD or cancer.3 The review (number of patients not reported) found that estimated excess bleeding events differed substantially depending on varying sources for baseline bleeding rates in aspirin nonusers.
The most conservative comparison yielded an NNH of 72 over 10 years of therapy (1.39 excess major GI bleeding events per 1000 person-years, 95% CI, 0.70-2.28). Comparison with other baseline bleeding rates in trial data yielded less risk of harm, with an NNH of 357 over 10 years (0.28 excess major GI bleeding events per 1000 person-years; 95% CI, 0.14-0.46). Excess risk for hemorrhagic stroke was not statistically significant (0.32 excess events per 1000 person-years; 95% CI, −0.05 to 0.82).
RECOMMENDATIONS
The US Preventive Services Task Force gives a Grade B recommendation (recommended, based on moderate to substantial benefit) to the use of aspirin to prevent CVD among adults ages 50 to 59 years with an ASCVD risk ≥10% who don’t have increased bleeding risk and are capable of 10 years of pharmacologic adherence with a similar expected longevity.4 The Task Force assigns a Grade C recommendation (individual and professional choice) to patients 60 to 69 years of age with the same constellation of risk factors and health status. Insufficient evidence was available to make recommendations for other age cohorts.
The American College of Chest Physicians recommends 75 to 100 mg of aspirin daily for adults 50 years or older who have moderate to high CV risk, defined as ≥10%.5
A working group of the European Society of Cardiology (ESC) released a statement in 2014 recommending aspirin for primary prevention in adults with a CV risk ≥20% and no risk factors for bleeding. For patients with a CVD risk between 10% and 20%, the ESC recommends deferring to patient preference.6
1. Sutcliffe P, Connock M, Gurung T, et al. Aspirin in primary prevention of cardiovascular disease and cancer: a systematic review of the balance of evidence from reviews of randomized trials. PLoS One. 2013;8:e81970.
2. Guirguis-Blake JM, Evans CV, Senger CA, et al. Aspirin for the primary prevention of cardiovascular events: a systematic evidence review for the US Preventive Services Task Force. Ann Intern Med. 2016;164:804-813.
3. Whitlock EP, Burda BU, Williams SB, et al. Bleeding risks with aspirin use for primary prevention in adults: a systematic review for the US Preventive Services Task Force. Ann Intern Med. 2016;164:826-835.
4. Bibbins-Domingo K, US Preventive Services Task Force. Aspirin use for the primary prevention of cardiovascular disease and colorectal cancer: US Preventive Services Task Force recommendation statement. Ann Intern Med. 2016;164:836-845.
5. Vandvik PO, Lincoff AM, Gore JM, et al. Primary and secondary prevention of cardiovascular disease: antithrombotic therapy and prevention of thrombosis, 9th ed: American College of Chest Physicians evidence-based clinical practice guidelines. Chest. 2012;141(2 Suppl):e637S-e668S.
6. Halvorsen S, Andreotti F, ten Berg JM, et al. Aspirin therapy in primary cardiovascular disease prevention: a position paper of the European Society of Cardiology Working Group on Thrombosis. J Am Coll Cardiol. 2014;64:319-327.
1. Sutcliffe P, Connock M, Gurung T, et al. Aspirin in primary prevention of cardiovascular disease and cancer: a systematic review of the balance of evidence from reviews of randomized trials. PLoS One. 2013;8:e81970.
2. Guirguis-Blake JM, Evans CV, Senger CA, et al. Aspirin for the primary prevention of cardiovascular events: a systematic evidence review for the US Preventive Services Task Force. Ann Intern Med. 2016;164:804-813.
3. Whitlock EP, Burda BU, Williams SB, et al. Bleeding risks with aspirin use for primary prevention in adults: a systematic review for the US Preventive Services Task Force. Ann Intern Med. 2016;164:826-835.
4. Bibbins-Domingo K, US Preventive Services Task Force. Aspirin use for the primary prevention of cardiovascular disease and colorectal cancer: US Preventive Services Task Force recommendation statement. Ann Intern Med. 2016;164:836-845.
5. Vandvik PO, Lincoff AM, Gore JM, et al. Primary and secondary prevention of cardiovascular disease: antithrombotic therapy and prevention of thrombosis, 9th ed: American College of Chest Physicians evidence-based clinical practice guidelines. Chest. 2012;141(2 Suppl):e637S-e668S.
6. Halvorsen S, Andreotti F, ten Berg JM, et al. Aspirin therapy in primary cardiovascular disease prevention: a position paper of the European Society of Cardiology Working Group on Thrombosis. J Am Coll Cardiol. 2014;64:319-327.
Evidence-based answers from the Family Physicians Inquiries Network
EVIDENCE BASED ANSWER:
One nonfatal myocardial infarction (MI) will be avoided for every 126 to 138 adults who take daily aspirin for 10 years (strength of recommendation [SOR]: A, systematic reviews and meta-analyses of multiple randomized controlled trials [RCTs]).
Taking low-dose aspirin for primary prevention shows no clear mortality benefit. A benefit for primary prevention of stroke is less certain. Although no evidence establishes increased risk of hemorrhagic stroke from daily low-dose aspirin, one gastrointestinal hemorrhage will occur for every 72 to 357 adults who take aspirin for longer than 10 years (SOR: A, systematic reviews and meta-analyses of multiple RCTs and cohort studies).
We need to treat gun violence like an epidemic
In an interesting bit of timing, just one month before the tragic shooting at the Marjory Stoneman Douglas High School in Parkland, Florida, the AMA Journal of Ethics devoted its entire January issue to the role of physicians in preventing violence. Part of the discussion centered on the idea of treating gun violence as an infectious disease epidemic.1
Dr. Gary Slutkin, an infectious disease specialist and former Centers for Disease Control and Prevention epidemiologist, is a proponent of this approach. His research has demonstrated that epidemic disease control measures are effective in reducing violence and violence-related deaths.2-5
Just look at incidence. Violent deaths in the United States are at an epidemic proportion, just like deaths due to narcotic overdoses. In 2015, there were approximately 33,091 deaths due to narcotic overdoses and 36,252 deaths due to gun violence.6,7
Geographic and social factors. Like infectious disease epidemics, violence tends to cluster in certain geographic areas and social networks. The cause of violence is multifactorial, just like other infectious disease epidemics, such as tuberculosis. Poverty, poor education, and inadequate family structure act as modulating factors that increase the rate of violence in those exposed to it.
Enlisting the community. This contagious disease prevention approach uses community health workers to map areas of high transmission, reach out to those exposed, and intervene to reduce risk factors. For example, gang-related deaths are often due to retaliation. A thorough investigation of a patient who arrives in the emergency department (ED) with a gunshot wound can reveal the next likely perpetrators and victims. Then community violence prevention workers can go directly to these people and others in their social networks, such as parents and friends, to attempt to prevent the next shooting. This approach, dubbed “Cure Violence” (CureViolence.org), has resulted in up to a 70% decrease in violence in some areas of Chicago.2 Some neighborhoods of Baltimore and New York have seen similar reductions.3-5
What can family practitioners do? Dr. Slutkin believes his approach could be expanded from EDs to other health care settings, like primary care, where we can identify people at risk and refer them to community violence prevention resources. Imagine it—a day when violence goes the way of polio.
1. Slutkin G, Ransford C, Zvetina D. How the health sector can reduce violence by treating it as a contagion. AMA J Ethics. 2018;20:47-55.
2. Skogan WG, Hartnett SM, Bump N, et al. Evaluation of CeaseFire-Chicago. Evanston, IL: Northwestern University Institute for Policy Research; 2008. Available at: https://www.ncjrs.gov/pdffiles1/nij/grants/227181.pdf. Accessed September 11, 2017.
3. Webster DW, Whitehill JM, Vernick JS, et al. Evaluation of Baltimore’s Safe Streets program: effects on attitudes, participants’ experiences, and gun violence. Baltimore, MD: Johns Hopkins Bloomberg School of Public Health; January 11, 2012. Available at: http://baltimorehealth.org/wp-content/uploads/2016/06/2012_01_10_JHSPH_Safe_Streets_evaluation.pdf. Accessed September 11, 2017.
4. Delgado SA, Alsabahi L, Wolff K, et al. Demoralizing violence: the effects of Cure Violence in the South Bronx and East New York, Brooklyn. John Jay College of Criminal Justice Research and Evaluation Center. Available at: https://johnjayrec.nyc/2017/10/02/cvinsobronxeastny/. Published October 2, 2017. Accessed November 15, 2017.
5. Picard-Fritsche S, Cerniglia L. Testing a public approach to gun violence: an evaluation of Crown Heights Save Our Streets, a replication of the Cure Violence Model. Center for Court Innovation; 2013. Available at: https://www.courtinnovation.org/sites/default/files/documents/SOS_Evaluation.pdf. Accessed November 28, 2017.
6. Murphy SL, Xu J, Kochanek KD, et al. Deaths: Final Data for 2015. Natl Vital Stat Rep. 2017;66:1-75.
7. Rudd RA, Seth P, David F, et al. Increases in drug and opioid-involved overdose deaths — United States, 2010–2015. MMWR Morb Mortal Wkly Rep. 2016;65:1445-1452.
Editor-in-Chief
Editor-in-Chief
Editor-in-Chief
In an interesting bit of timing, just one month before the tragic shooting at the Marjory Stoneman Douglas High School in Parkland, Florida, the AMA Journal of Ethics devoted its entire January issue to the role of physicians in preventing violence. Part of the discussion centered on the idea of treating gun violence as an infectious disease epidemic.1
Dr. Gary Slutkin, an infectious disease specialist and former Centers for Disease Control and Prevention epidemiologist, is a proponent of this approach. His research has demonstrated that epidemic disease control measures are effective in reducing violence and violence-related deaths.2-5
Just look at incidence. Violent deaths in the United States are at an epidemic proportion, just like deaths due to narcotic overdoses. In 2015, there were approximately 33,091 deaths due to narcotic overdoses and 36,252 deaths due to gun violence.6,7
Geographic and social factors. Like infectious disease epidemics, violence tends to cluster in certain geographic areas and social networks. The cause of violence is multifactorial, just like other infectious disease epidemics, such as tuberculosis. Poverty, poor education, and inadequate family structure act as modulating factors that increase the rate of violence in those exposed to it.
Enlisting the community. This contagious disease prevention approach uses community health workers to map areas of high transmission, reach out to those exposed, and intervene to reduce risk factors. For example, gang-related deaths are often due to retaliation. A thorough investigation of a patient who arrives in the emergency department (ED) with a gunshot wound can reveal the next likely perpetrators and victims. Then community violence prevention workers can go directly to these people and others in their social networks, such as parents and friends, to attempt to prevent the next shooting. This approach, dubbed “Cure Violence” (CureViolence.org), has resulted in up to a 70% decrease in violence in some areas of Chicago.2 Some neighborhoods of Baltimore and New York have seen similar reductions.3-5
What can family practitioners do? Dr. Slutkin believes his approach could be expanded from EDs to other health care settings, like primary care, where we can identify people at risk and refer them to community violence prevention resources. Imagine it—a day when violence goes the way of polio.
In an interesting bit of timing, just one month before the tragic shooting at the Marjory Stoneman Douglas High School in Parkland, Florida, the AMA Journal of Ethics devoted its entire January issue to the role of physicians in preventing violence. Part of the discussion centered on the idea of treating gun violence as an infectious disease epidemic.1
Dr. Gary Slutkin, an infectious disease specialist and former Centers for Disease Control and Prevention epidemiologist, is a proponent of this approach. His research has demonstrated that epidemic disease control measures are effective in reducing violence and violence-related deaths.2-5
Just look at incidence. Violent deaths in the United States are at an epidemic proportion, just like deaths due to narcotic overdoses. In 2015, there were approximately 33,091 deaths due to narcotic overdoses and 36,252 deaths due to gun violence.6,7
Geographic and social factors. Like infectious disease epidemics, violence tends to cluster in certain geographic areas and social networks. The cause of violence is multifactorial, just like other infectious disease epidemics, such as tuberculosis. Poverty, poor education, and inadequate family structure act as modulating factors that increase the rate of violence in those exposed to it.
Enlisting the community. This contagious disease prevention approach uses community health workers to map areas of high transmission, reach out to those exposed, and intervene to reduce risk factors. For example, gang-related deaths are often due to retaliation. A thorough investigation of a patient who arrives in the emergency department (ED) with a gunshot wound can reveal the next likely perpetrators and victims. Then community violence prevention workers can go directly to these people and others in their social networks, such as parents and friends, to attempt to prevent the next shooting. This approach, dubbed “Cure Violence” (CureViolence.org), has resulted in up to a 70% decrease in violence in some areas of Chicago.2 Some neighborhoods of Baltimore and New York have seen similar reductions.3-5
What can family practitioners do? Dr. Slutkin believes his approach could be expanded from EDs to other health care settings, like primary care, where we can identify people at risk and refer them to community violence prevention resources. Imagine it—a day when violence goes the way of polio.
1. Slutkin G, Ransford C, Zvetina D. How the health sector can reduce violence by treating it as a contagion. AMA J Ethics. 2018;20:47-55.
2. Skogan WG, Hartnett SM, Bump N, et al. Evaluation of CeaseFire-Chicago. Evanston, IL: Northwestern University Institute for Policy Research; 2008. Available at: https://www.ncjrs.gov/pdffiles1/nij/grants/227181.pdf. Accessed September 11, 2017.
3. Webster DW, Whitehill JM, Vernick JS, et al. Evaluation of Baltimore’s Safe Streets program: effects on attitudes, participants’ experiences, and gun violence. Baltimore, MD: Johns Hopkins Bloomberg School of Public Health; January 11, 2012. Available at: http://baltimorehealth.org/wp-content/uploads/2016/06/2012_01_10_JHSPH_Safe_Streets_evaluation.pdf. Accessed September 11, 2017.
4. Delgado SA, Alsabahi L, Wolff K, et al. Demoralizing violence: the effects of Cure Violence in the South Bronx and East New York, Brooklyn. John Jay College of Criminal Justice Research and Evaluation Center. Available at: https://johnjayrec.nyc/2017/10/02/cvinsobronxeastny/. Published October 2, 2017. Accessed November 15, 2017.
5. Picard-Fritsche S, Cerniglia L. Testing a public approach to gun violence: an evaluation of Crown Heights Save Our Streets, a replication of the Cure Violence Model. Center for Court Innovation; 2013. Available at: https://www.courtinnovation.org/sites/default/files/documents/SOS_Evaluation.pdf. Accessed November 28, 2017.
6. Murphy SL, Xu J, Kochanek KD, et al. Deaths: Final Data for 2015. Natl Vital Stat Rep. 2017;66:1-75.
7. Rudd RA, Seth P, David F, et al. Increases in drug and opioid-involved overdose deaths — United States, 2010–2015. MMWR Morb Mortal Wkly Rep. 2016;65:1445-1452.
1. Slutkin G, Ransford C, Zvetina D. How the health sector can reduce violence by treating it as a contagion. AMA J Ethics. 2018;20:47-55.
2. Skogan WG, Hartnett SM, Bump N, et al. Evaluation of CeaseFire-Chicago. Evanston, IL: Northwestern University Institute for Policy Research; 2008. Available at: https://www.ncjrs.gov/pdffiles1/nij/grants/227181.pdf. Accessed September 11, 2017.
3. Webster DW, Whitehill JM, Vernick JS, et al. Evaluation of Baltimore’s Safe Streets program: effects on attitudes, participants’ experiences, and gun violence. Baltimore, MD: Johns Hopkins Bloomberg School of Public Health; January 11, 2012. Available at: http://baltimorehealth.org/wp-content/uploads/2016/06/2012_01_10_JHSPH_Safe_Streets_evaluation.pdf. Accessed September 11, 2017.
4. Delgado SA, Alsabahi L, Wolff K, et al. Demoralizing violence: the effects of Cure Violence in the South Bronx and East New York, Brooklyn. John Jay College of Criminal Justice Research and Evaluation Center. Available at: https://johnjayrec.nyc/2017/10/02/cvinsobronxeastny/. Published October 2, 2017. Accessed November 15, 2017.
5. Picard-Fritsche S, Cerniglia L. Testing a public approach to gun violence: an evaluation of Crown Heights Save Our Streets, a replication of the Cure Violence Model. Center for Court Innovation; 2013. Available at: https://www.courtinnovation.org/sites/default/files/documents/SOS_Evaluation.pdf. Accessed November 28, 2017.
6. Murphy SL, Xu J, Kochanek KD, et al. Deaths: Final Data for 2015. Natl Vital Stat Rep. 2017;66:1-75.
7. Rudd RA, Seth P, David F, et al. Increases in drug and opioid-involved overdose deaths — United States, 2010–2015. MMWR Morb Mortal Wkly Rep. 2016;65:1445-1452.
Bilateral nonpitting edema and xerotic skin
A 60-year-old African American woman who had congestive heart failure (CHF) with reduced ejection fraction, untreated hepatitis C virus infection, and chronic kidney disease presented to the emergency department (ED) with a 6-month history of bilateral lower extremity edema. Use of diuretics and antibiotic therapy for suspected CHF exacerbation and cellulitis, directed by her primary care physician, had no effect. In the month prior to presenting to the ED, the patient took 2 different antibiotics, each for 10 days: clindamycin 300 mg every 6 hours and doxycycline 100 mg every 12 hours. Additionally, she was taking furosemide 40 mg/d with good urine output, but no appreciable improvement in lower extremity edema.
The physical examination revealed bilateral nonpitting edema. Weeping pearly papules, xerotic skin, and a cobblestone appearance extended from the dorsa of the patient’s feet to her knees (FIGURES 1A and 1B). The patient underwent Doppler ultrasound of the lower extremities and a skin biopsy.
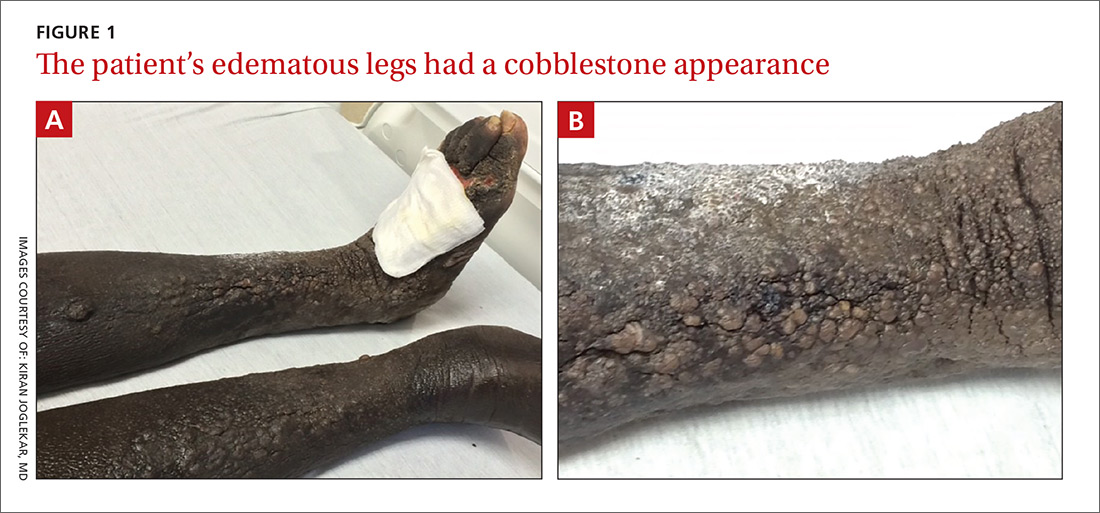
WHAT IS YOUR DIAGNOSIS?
HOW WOULD YOU TREAT THIS PATIENT?
Diagnosis: Elephantiasis nostras verrucosa
The Doppler ultrasound was negative, and the biopsy ruled out malignancy and infection; however, the pathology report was histologically consistent with a diagnosis of elephantiasis nostras verrucosa (ENV).
ENV is a disfiguring, nonfilarial lymphedema that affects the lower extremities and is characterized by progressive cobblestoning and verrucous distortion of gravity-dependent areas.1 The skin changes are caused by lymphatic damage and obstruction from an accumulation of protein-rich fluid in the dermis and subcutaneous tissues.1,2
The term ENV was first coined by Aldo Castellani in 1934 to differentiate the condition from elephantiasis tropica (filariasis), which is caused by parasitic Wuchereria worms.3 ENV is also known as lymphangitis recurrens elephantogenica, elephantiasis verrucosa, elephantiasis nostra, mossy leg, and elephantiasis of the temperate zone.1
ENV is notably uncommon; its exact incidence is unknown. The etiology is multifactorial but can include obesity, chronic lymphedema, CHF, and recurrent cellulitis (the latter 2 were noted in our patient’s history).1
Although the diagnosis can be made based on patient history and physical examination alone, skin biopsy is warranted to rule out underlying malignancy or fungal infection.1,4 Histologic findings suggestive of ENV include pseudoepitheliomatous hyperplasia, lymph channel dilation, widened tissue spaces, and loss of dermal papillae.1 In our patient’s case, the pathology report revealed dermal fibrosis, dilated lymph channels, and a mixed inflammatory infiltrate. Her lab work, which included a complete blood count and basic metabolic panel, was significant for neutrophilic leukocytosis (white blood cell count, 30,000 cells/mcL), chronic kidney disease, and elevated inflammatory markers.
The differential includes other types of edema and infections
Several other diseases must be differentiated from ENV, including:
Venous stasis dermatitis. Unlike ENV, this condition involves pitting edema with erythema and does not have a verrucous appearance.2,4
Lipedema. Histologically, lipedema shows no changes. It typically spares the feet, has an early age of onset, and is associated with a positive family history.1,2,4
Lipodermatosclerosis. This condition is caused by venous stasis with swelling of the proximal lower extremity and fibrosis of the distal parts. The affected leg develops an “inverted wine bottle” appearance.2,4
Pretibial myxedema. Patients with pretibial myxedema will have thyroid function test abnormalities and exhibit other signs of hyperthyroidism. If suspected, the laboratory evaluation should include thyroid-stimulating hormone levels.2,4
Filariasis. Endemic to tropical regions, filariasis is a parasitic infection. A travel history helps to differentiate this from ENV. If suspected, include a Giemsa blood smear in the laboratory evaluation.2
Chromoblastomycosis. This chronic fungal infection is typically contracted in rural tropical or subtropical regions. The causative fungi, which are present in soil, enter the skin through minor wounds (eg, thorns or splinters). The wounds are typically forgotten by the time the patient seeks medical attention. Biopsy can effectively rule out this condition.1,2,5
Treatment centers on preserving function, preventing complications
Currently, no standard treatment exists for ENV.1,4 Therapies are aimed at treating the underlying cause, preserving function in the affected limb, and preventing complications. Conservative therapy includes elevation of the affected limb and use of compression devices for edema. Antibiotics can be administered for associated cellulitis. There have been few case reports of successful treatment with oral retinoids. If medical therapy fails, surgical debridement serves as a last resort.1,4,6
Our patient improved after a week with antibiotic therapy (IV piperacillin/tazobactam 3.375 g every 6 hours) and other conservative measures, such as leg elevation.
CORRESPONDENCE
Kavita Natrajan, MBBS, George Washington University/Medical Faculty Associates, Division of Hematology and Oncology, 2150 Pennsylvania Avenue NW, DC 20037; [email protected].
1. Sisto K, Khachemoune A. Elephantiasis nostras verrucosa: a review. Am J Clin Dermatol. 2008;9:141-146.
2. Liaw FY, Huang CF, Wu YC, et al. Elephantiasis nostras verrucosa: swelling with verrucose appearance of lower limbs. Can Fam Physician. 2012;58:e551-e553.
3. Castellani A. Researches on elephantiasis nostras and elephantiasis tropica with special regard to their initial stage of recurring lymphangitis (lymphangitis recurrens elephantogenica). J Trop Med Hyg. 1969;72:89-97.
4. Baird D, Bode D, Akers T, et al. Elephantiasis nostras verrucosa (ENV): a complication of congestive heart failure and obesity. J Am Board Fam Med. 2010;23:413-417.
5. Queiroz-Telles F, Fahal AH, Falci R, et. al. Neglected endemic mycoses. Lancet Inf Dis. 2017;17:e367-e377.
6. Han HH, Lim SY, Oh DY. Successful surgical treatment for elephantiasis nostras verrucosa using a new designed column flap. Int J Low Extrem Wounds. 2015;14:299-302.
A 60-year-old African American woman who had congestive heart failure (CHF) with reduced ejection fraction, untreated hepatitis C virus infection, and chronic kidney disease presented to the emergency department (ED) with a 6-month history of bilateral lower extremity edema. Use of diuretics and antibiotic therapy for suspected CHF exacerbation and cellulitis, directed by her primary care physician, had no effect. In the month prior to presenting to the ED, the patient took 2 different antibiotics, each for 10 days: clindamycin 300 mg every 6 hours and doxycycline 100 mg every 12 hours. Additionally, she was taking furosemide 40 mg/d with good urine output, but no appreciable improvement in lower extremity edema.
The physical examination revealed bilateral nonpitting edema. Weeping pearly papules, xerotic skin, and a cobblestone appearance extended from the dorsa of the patient’s feet to her knees (FIGURES 1A and 1B). The patient underwent Doppler ultrasound of the lower extremities and a skin biopsy.
WHAT IS YOUR DIAGNOSIS?
HOW WOULD YOU TREAT THIS PATIENT?
Diagnosis: Elephantiasis nostras verrucosa
The Doppler ultrasound was negative, and the biopsy ruled out malignancy and infection; however, the pathology report was histologically consistent with a diagnosis of elephantiasis nostras verrucosa (ENV).
ENV is a disfiguring, nonfilarial lymphedema that affects the lower extremities and is characterized by progressive cobblestoning and verrucous distortion of gravity-dependent areas.1 The skin changes are caused by lymphatic damage and obstruction from an accumulation of protein-rich fluid in the dermis and subcutaneous tissues.1,2
The term ENV was first coined by Aldo Castellani in 1934 to differentiate the condition from elephantiasis tropica (filariasis), which is caused by parasitic Wuchereria worms.3 ENV is also known as lymphangitis recurrens elephantogenica, elephantiasis verrucosa, elephantiasis nostra, mossy leg, and elephantiasis of the temperate zone.1
ENV is notably uncommon; its exact incidence is unknown. The etiology is multifactorial but can include obesity, chronic lymphedema, CHF, and recurrent cellulitis (the latter 2 were noted in our patient’s history).1
Although the diagnosis can be made based on patient history and physical examination alone, skin biopsy is warranted to rule out underlying malignancy or fungal infection.1,4 Histologic findings suggestive of ENV include pseudoepitheliomatous hyperplasia, lymph channel dilation, widened tissue spaces, and loss of dermal papillae.1 In our patient’s case, the pathology report revealed dermal fibrosis, dilated lymph channels, and a mixed inflammatory infiltrate. Her lab work, which included a complete blood count and basic metabolic panel, was significant for neutrophilic leukocytosis (white blood cell count, 30,000 cells/mcL), chronic kidney disease, and elevated inflammatory markers.
The differential includes other types of edema and infections
Several other diseases must be differentiated from ENV, including:
Venous stasis dermatitis. Unlike ENV, this condition involves pitting edema with erythema and does not have a verrucous appearance.2,4
Lipedema. Histologically, lipedema shows no changes. It typically spares the feet, has an early age of onset, and is associated with a positive family history.1,2,4
Lipodermatosclerosis. This condition is caused by venous stasis with swelling of the proximal lower extremity and fibrosis of the distal parts. The affected leg develops an “inverted wine bottle” appearance.2,4
Pretibial myxedema. Patients with pretibial myxedema will have thyroid function test abnormalities and exhibit other signs of hyperthyroidism. If suspected, the laboratory evaluation should include thyroid-stimulating hormone levels.2,4
Filariasis. Endemic to tropical regions, filariasis is a parasitic infection. A travel history helps to differentiate this from ENV. If suspected, include a Giemsa blood smear in the laboratory evaluation.2
Chromoblastomycosis. This chronic fungal infection is typically contracted in rural tropical or subtropical regions. The causative fungi, which are present in soil, enter the skin through minor wounds (eg, thorns or splinters). The wounds are typically forgotten by the time the patient seeks medical attention. Biopsy can effectively rule out this condition.1,2,5
Treatment centers on preserving function, preventing complications
Currently, no standard treatment exists for ENV.1,4 Therapies are aimed at treating the underlying cause, preserving function in the affected limb, and preventing complications. Conservative therapy includes elevation of the affected limb and use of compression devices for edema. Antibiotics can be administered for associated cellulitis. There have been few case reports of successful treatment with oral retinoids. If medical therapy fails, surgical debridement serves as a last resort.1,4,6
Our patient improved after a week with antibiotic therapy (IV piperacillin/tazobactam 3.375 g every 6 hours) and other conservative measures, such as leg elevation.
CORRESPONDENCE
Kavita Natrajan, MBBS, George Washington University/Medical Faculty Associates, Division of Hematology and Oncology, 2150 Pennsylvania Avenue NW, DC 20037; [email protected].
A 60-year-old African American woman who had congestive heart failure (CHF) with reduced ejection fraction, untreated hepatitis C virus infection, and chronic kidney disease presented to the emergency department (ED) with a 6-month history of bilateral lower extremity edema. Use of diuretics and antibiotic therapy for suspected CHF exacerbation and cellulitis, directed by her primary care physician, had no effect. In the month prior to presenting to the ED, the patient took 2 different antibiotics, each for 10 days: clindamycin 300 mg every 6 hours and doxycycline 100 mg every 12 hours. Additionally, she was taking furosemide 40 mg/d with good urine output, but no appreciable improvement in lower extremity edema.
The physical examination revealed bilateral nonpitting edema. Weeping pearly papules, xerotic skin, and a cobblestone appearance extended from the dorsa of the patient’s feet to her knees (FIGURES 1A and 1B). The patient underwent Doppler ultrasound of the lower extremities and a skin biopsy.
WHAT IS YOUR DIAGNOSIS?
HOW WOULD YOU TREAT THIS PATIENT?
Diagnosis: Elephantiasis nostras verrucosa
The Doppler ultrasound was negative, and the biopsy ruled out malignancy and infection; however, the pathology report was histologically consistent with a diagnosis of elephantiasis nostras verrucosa (ENV).
ENV is a disfiguring, nonfilarial lymphedema that affects the lower extremities and is characterized by progressive cobblestoning and verrucous distortion of gravity-dependent areas.1 The skin changes are caused by lymphatic damage and obstruction from an accumulation of protein-rich fluid in the dermis and subcutaneous tissues.1,2
The term ENV was first coined by Aldo Castellani in 1934 to differentiate the condition from elephantiasis tropica (filariasis), which is caused by parasitic Wuchereria worms.3 ENV is also known as lymphangitis recurrens elephantogenica, elephantiasis verrucosa, elephantiasis nostra, mossy leg, and elephantiasis of the temperate zone.1
ENV is notably uncommon; its exact incidence is unknown. The etiology is multifactorial but can include obesity, chronic lymphedema, CHF, and recurrent cellulitis (the latter 2 were noted in our patient’s history).1
Although the diagnosis can be made based on patient history and physical examination alone, skin biopsy is warranted to rule out underlying malignancy or fungal infection.1,4 Histologic findings suggestive of ENV include pseudoepitheliomatous hyperplasia, lymph channel dilation, widened tissue spaces, and loss of dermal papillae.1 In our patient’s case, the pathology report revealed dermal fibrosis, dilated lymph channels, and a mixed inflammatory infiltrate. Her lab work, which included a complete blood count and basic metabolic panel, was significant for neutrophilic leukocytosis (white blood cell count, 30,000 cells/mcL), chronic kidney disease, and elevated inflammatory markers.
The differential includes other types of edema and infections
Several other diseases must be differentiated from ENV, including:
Venous stasis dermatitis. Unlike ENV, this condition involves pitting edema with erythema and does not have a verrucous appearance.2,4
Lipedema. Histologically, lipedema shows no changes. It typically spares the feet, has an early age of onset, and is associated with a positive family history.1,2,4
Lipodermatosclerosis. This condition is caused by venous stasis with swelling of the proximal lower extremity and fibrosis of the distal parts. The affected leg develops an “inverted wine bottle” appearance.2,4
Pretibial myxedema. Patients with pretibial myxedema will have thyroid function test abnormalities and exhibit other signs of hyperthyroidism. If suspected, the laboratory evaluation should include thyroid-stimulating hormone levels.2,4
Filariasis. Endemic to tropical regions, filariasis is a parasitic infection. A travel history helps to differentiate this from ENV. If suspected, include a Giemsa blood smear in the laboratory evaluation.2
Chromoblastomycosis. This chronic fungal infection is typically contracted in rural tropical or subtropical regions. The causative fungi, which are present in soil, enter the skin through minor wounds (eg, thorns or splinters). The wounds are typically forgotten by the time the patient seeks medical attention. Biopsy can effectively rule out this condition.1,2,5
Treatment centers on preserving function, preventing complications
Currently, no standard treatment exists for ENV.1,4 Therapies are aimed at treating the underlying cause, preserving function in the affected limb, and preventing complications. Conservative therapy includes elevation of the affected limb and use of compression devices for edema. Antibiotics can be administered for associated cellulitis. There have been few case reports of successful treatment with oral retinoids. If medical therapy fails, surgical debridement serves as a last resort.1,4,6
Our patient improved after a week with antibiotic therapy (IV piperacillin/tazobactam 3.375 g every 6 hours) and other conservative measures, such as leg elevation.
CORRESPONDENCE
Kavita Natrajan, MBBS, George Washington University/Medical Faculty Associates, Division of Hematology and Oncology, 2150 Pennsylvania Avenue NW, DC 20037; [email protected].
1. Sisto K, Khachemoune A. Elephantiasis nostras verrucosa: a review. Am J Clin Dermatol. 2008;9:141-146.
2. Liaw FY, Huang CF, Wu YC, et al. Elephantiasis nostras verrucosa: swelling with verrucose appearance of lower limbs. Can Fam Physician. 2012;58:e551-e553.
3. Castellani A. Researches on elephantiasis nostras and elephantiasis tropica with special regard to their initial stage of recurring lymphangitis (lymphangitis recurrens elephantogenica). J Trop Med Hyg. 1969;72:89-97.
4. Baird D, Bode D, Akers T, et al. Elephantiasis nostras verrucosa (ENV): a complication of congestive heart failure and obesity. J Am Board Fam Med. 2010;23:413-417.
5. Queiroz-Telles F, Fahal AH, Falci R, et. al. Neglected endemic mycoses. Lancet Inf Dis. 2017;17:e367-e377.
6. Han HH, Lim SY, Oh DY. Successful surgical treatment for elephantiasis nostras verrucosa using a new designed column flap. Int J Low Extrem Wounds. 2015;14:299-302.
1. Sisto K, Khachemoune A. Elephantiasis nostras verrucosa: a review. Am J Clin Dermatol. 2008;9:141-146.
2. Liaw FY, Huang CF, Wu YC, et al. Elephantiasis nostras verrucosa: swelling with verrucose appearance of lower limbs. Can Fam Physician. 2012;58:e551-e553.
3. Castellani A. Researches on elephantiasis nostras and elephantiasis tropica with special regard to their initial stage of recurring lymphangitis (lymphangitis recurrens elephantogenica). J Trop Med Hyg. 1969;72:89-97.
4. Baird D, Bode D, Akers T, et al. Elephantiasis nostras verrucosa (ENV): a complication of congestive heart failure and obesity. J Am Board Fam Med. 2010;23:413-417.
5. Queiroz-Telles F, Fahal AH, Falci R, et. al. Neglected endemic mycoses. Lancet Inf Dis. 2017;17:e367-e377.
6. Han HH, Lim SY, Oh DY. Successful surgical treatment for elephantiasis nostras verrucosa using a new designed column flap. Int J Low Extrem Wounds. 2015;14:299-302.

Treating migraines: It’s different for kids
ILLUSTRATIVE CASE
A 15-year-old girl presents to your clinic with poorly controlled chronic migraines that are preventing her from attending school 3 to 4 days per month. As part of her treatment regimen, you are considering migraine prevention strategies.
Should you prescribe amitriptyline or topiramate for preventive migraine therapy?
Migraine headaches are the most common reason for headache presentation in pediatric neurology outpatient clinics, affecting 5% to 10% of the pediatric population worldwide.2 Current recommendations regarding prophylactic migraine therapy in childhood are based on consensus opinions.3,4 And the US Food and Drug Administration (FDA) has not approved any medications for preventing migraines in children younger than 12 years of age. However, surveys of pediatric headache specialists suggest that amitriptyline and topiramate are among the most commonly prescribed medications for childhood migraine prophylaxis.3,4
There is low-quality evidence from individual randomized controlled trials (RCTs) about the effectiveness of topiramate. A meta-analysis by El-Chammas and colleagues included 3 RCTs comparing topiramate to placebo for the prevention of episodic migraines (migraine headaches that occur <15 times/month) in a combined total of 283 children younger than 18 years of age.5 Topiramate demonstrated a nonclinically significant, but statistically significant, reduction of less than one headache per month (-0.71; 95% confidence interval [CI], -1.19 to -0.24). This is based on moderate quality evidence due to a high placebo response rate and study durations of only 12 weeks.5 The FDA has approved topiramate for migraine prevention in children ages 12 to 17 years.6
Adult guidelines. The findings described above are consistent with the most recent adult guidelines from the American Academy of Neurology and the American Headache Society.7 In a joint publication from 2012, these societies recommended both topiramate and amitriptyline for the prevention of migraines in adults based on high-quality (Level A evidence) and medium-quality evidence (Level B), respectively.7
[polldaddy:9973304]
STUDY SUMMARY
Both drugs are no better than placebo in children
A multicenter, double-blind RCT by Powers and colleagues compared the effectiveness of amitriptyline, topiramate, and placebo in the prevention of pediatric migraines.1 Target dosing for amitriptyline and topiramate was set at 1 mg/kg/d and 2 mg/kg/d, respectively. Titration toward these doses occurred over an 8-week period based on reported adverse effects. Patients then continued their maximum tolerated dose for an additional 16 weeks.
Patients were predominantly white (70%), female (68%), and 8 to 17 years of age. They had at least 4 headache days over a prospective 28-day pre-treatment period and a Pediatric Migraine Disability Assessment Scale (PedMIDAS) score of 11 to 139 (mild to moderate disability=11-50; severe disability >50).1,8 The primary endpoint consisted of at least a 50% relative reduction (RR) in the number of headache days over the 28-day pre-therapy (baseline) period compared with the final 28 days of the trial.1
The authors of the study included 328 patients in the primary efficacy analysis and randomly assigned them in a 2:2:1 ratio to receive either amitriptyline (132 patients), topiramate (130 patients), or placebo (66 patients), respectively. After 24 weeks of therapy, there was no significant difference between the amitriptyline, topiramate, and placebo groups in the primary endpoint (52% amitriptyline, 55% topiramate, 61% placebo; adjusted odds ratio [OR]=0.71; 98% CI, 0.34-1.48; P=.26 between amitriptyline and placebo; OR=0.81; 98% CI, 0.39-1.68; P=.48 between topiramate and placebo; OR=0.88; 98% CI, 0.49-1.59; P=.49 between amitriptyline and topiramate).
There was also no difference in the secondary outcomes of absolute reduction in headache days and headache-related disability as determined by PedMIDAS. The study was stopped early for futility. Compared with placebo, amitriptyline significantly increased fatigue (number needed to harm [NNH]=8) and dry mouth (NNH=9) and was associated with 3 serious adverse events of altered mood. Compared with placebo, topiramate significantly increased paresthesia (NNH=4) and weight loss (NNH=13) and was associated with one serious adverse event—a suicide attempt.1
WHAT’S NEW?
Higher-level evidence demonstrates lack of efficacy
This RCT provides new, higher-level evidence that demonstrates the lack of efficacy of amitriptyline and topiramate in the prevention of pediatric migraines. It also highlights the risk of increased adverse events with topiramate and amitriptyline.
Two of the 3 topiramate trials used in the older meta-analysis by El-Chammas and colleagues5 and this new RCT1 were included in an updated meta-analysis by Le and colleagues (total participants 465) published in 2017.2 This newer meta-analysis found no statistical benefit associated with the use of topiramate over placebo. It demonstrated a nonsignificant decrease in the number of patients with at least a 50% relative reduction in headache frequency (risk ratio = 1.26; 95% CI, 0.94-1.67) and in the overall number of headache days (mean difference = -0.77; 95% CI, -2.31 to 0.76) in patients younger than 18 years of age.2 Both meta-analyses, however, showed an increase in the rate of adverse events in patients using topiramate vs placebo.2,5
CAVEATS
Is there a gender predominance?
El-Chammas and colleagues5 describe male pediatric patients as being the predominant pediatric gender with migraines. However, they do not quote an incidence rate or cite the reference for this statement. No other reference to gender predominance was noted in the literature. The current study,1 in addition to the total population of the meta-analysis by Le and colleagues,2 included women as the predominant patient population. Hopefully, future studies will help to delineate if there is a gender predominance and, if so, whether the current treatment data apply to both genders.
CHALLENGES TO IMPLEMENTATION
None to speak of
There are no barriers to implementing this recommendation immediately in all primary care settings.
ACKNOWLEDGEMENT
The PURLs Surveillance System was supported in part by Grant Number UL1RR024999 from the National Center For Research Resources, a Clinical Translational Science Award to the University of Chicago. The content is solely the responsibility of the authors and does not necessarily represent the official views of the National Center For Research Resources or the National Institutes of Health.
1. Powers SW, Coffey CS, Chamberlin LA, et al; for the CHAMP Investigators. Trial of amitriptyline, topiramate, and placebo for pediatric migraine. N Engl J Med. 2017;376:115-124.
2. Le K, Yu D, Wang J, et al. Is topiramate effective for migraine prevention in patients less than 18 years of age? A meta-analysis of randomized controlled trials. J Headache Pain. 2017;18:69.
3. Lewis D, Ashwal S, Hershey A, et al. Practice parameter: pharmacological treatment of migraine headache in children and adolescents: report of the American Academy of Neurology Quality Standards Subcommittee and the Practice Committee of the Child Neurology Society. Neurology. 2004;63:2215-2224.
4. Hershey AD. Current approaches to the diagnosis and management of paediatric migraine. Lancet Neurology. 2010;9:190-204.
5. El-Chammas K, Keyes J, Thompson N, et al. Pharmacologic treatment of pediatric headaches: a meta-analysis. JAMA Pediatr. 2013;167:250-258.
6. Qudexy XR. Highlights of prescribing information. Available at: https://www.accessdata.fda.gov/drugsatfda_docs/label/2017/205122s003s005lbl.pdf. Accessed March 15, 2018.
7. Silberstein SD, Holland S, Freitag F, et al. Evidence-based guideline update: pharmacologic treatment for episodic migraine prevention in adults: report of the Quality Standards Subcommittee of the American Academy of Neurology and the American Headache Society. Neurology. 2012;78:1337-1345.
8. Hershey AD, Powers SW, Vockell AL, et al. PedMIDAS: development of a questionnaire to assess disability of migraines in children. Neurology. 2001;57:2034-2039.
ILLUSTRATIVE CASE
A 15-year-old girl presents to your clinic with poorly controlled chronic migraines that are preventing her from attending school 3 to 4 days per month. As part of her treatment regimen, you are considering migraine prevention strategies.
Should you prescribe amitriptyline or topiramate for preventive migraine therapy?
Migraine headaches are the most common reason for headache presentation in pediatric neurology outpatient clinics, affecting 5% to 10% of the pediatric population worldwide.2 Current recommendations regarding prophylactic migraine therapy in childhood are based on consensus opinions.3,4 And the US Food and Drug Administration (FDA) has not approved any medications for preventing migraines in children younger than 12 years of age. However, surveys of pediatric headache specialists suggest that amitriptyline and topiramate are among the most commonly prescribed medications for childhood migraine prophylaxis.3,4
There is low-quality evidence from individual randomized controlled trials (RCTs) about the effectiveness of topiramate. A meta-analysis by El-Chammas and colleagues included 3 RCTs comparing topiramate to placebo for the prevention of episodic migraines (migraine headaches that occur <15 times/month) in a combined total of 283 children younger than 18 years of age.5 Topiramate demonstrated a nonclinically significant, but statistically significant, reduction of less than one headache per month (-0.71; 95% confidence interval [CI], -1.19 to -0.24). This is based on moderate quality evidence due to a high placebo response rate and study durations of only 12 weeks.5 The FDA has approved topiramate for migraine prevention in children ages 12 to 17 years.6
Adult guidelines. The findings described above are consistent with the most recent adult guidelines from the American Academy of Neurology and the American Headache Society.7 In a joint publication from 2012, these societies recommended both topiramate and amitriptyline for the prevention of migraines in adults based on high-quality (Level A evidence) and medium-quality evidence (Level B), respectively.7
[polldaddy:9973304]
STUDY SUMMARY
Both drugs are no better than placebo in children
A multicenter, double-blind RCT by Powers and colleagues compared the effectiveness of amitriptyline, topiramate, and placebo in the prevention of pediatric migraines.1 Target dosing for amitriptyline and topiramate was set at 1 mg/kg/d and 2 mg/kg/d, respectively. Titration toward these doses occurred over an 8-week period based on reported adverse effects. Patients then continued their maximum tolerated dose for an additional 16 weeks.
Patients were predominantly white (70%), female (68%), and 8 to 17 years of age. They had at least 4 headache days over a prospective 28-day pre-treatment period and a Pediatric Migraine Disability Assessment Scale (PedMIDAS) score of 11 to 139 (mild to moderate disability=11-50; severe disability >50).1,8 The primary endpoint consisted of at least a 50% relative reduction (RR) in the number of headache days over the 28-day pre-therapy (baseline) period compared with the final 28 days of the trial.1
The authors of the study included 328 patients in the primary efficacy analysis and randomly assigned them in a 2:2:1 ratio to receive either amitriptyline (132 patients), topiramate (130 patients), or placebo (66 patients), respectively. After 24 weeks of therapy, there was no significant difference between the amitriptyline, topiramate, and placebo groups in the primary endpoint (52% amitriptyline, 55% topiramate, 61% placebo; adjusted odds ratio [OR]=0.71; 98% CI, 0.34-1.48; P=.26 between amitriptyline and placebo; OR=0.81; 98% CI, 0.39-1.68; P=.48 between topiramate and placebo; OR=0.88; 98% CI, 0.49-1.59; P=.49 between amitriptyline and topiramate).
There was also no difference in the secondary outcomes of absolute reduction in headache days and headache-related disability as determined by PedMIDAS. The study was stopped early for futility. Compared with placebo, amitriptyline significantly increased fatigue (number needed to harm [NNH]=8) and dry mouth (NNH=9) and was associated with 3 serious adverse events of altered mood. Compared with placebo, topiramate significantly increased paresthesia (NNH=4) and weight loss (NNH=13) and was associated with one serious adverse event—a suicide attempt.1
WHAT’S NEW?
Higher-level evidence demonstrates lack of efficacy
This RCT provides new, higher-level evidence that demonstrates the lack of efficacy of amitriptyline and topiramate in the prevention of pediatric migraines. It also highlights the risk of increased adverse events with topiramate and amitriptyline.
Two of the 3 topiramate trials used in the older meta-analysis by El-Chammas and colleagues5 and this new RCT1 were included in an updated meta-analysis by Le and colleagues (total participants 465) published in 2017.2 This newer meta-analysis found no statistical benefit associated with the use of topiramate over placebo. It demonstrated a nonsignificant decrease in the number of patients with at least a 50% relative reduction in headache frequency (risk ratio = 1.26; 95% CI, 0.94-1.67) and in the overall number of headache days (mean difference = -0.77; 95% CI, -2.31 to 0.76) in patients younger than 18 years of age.2 Both meta-analyses, however, showed an increase in the rate of adverse events in patients using topiramate vs placebo.2,5
CAVEATS
Is there a gender predominance?
El-Chammas and colleagues5 describe male pediatric patients as being the predominant pediatric gender with migraines. However, they do not quote an incidence rate or cite the reference for this statement. No other reference to gender predominance was noted in the literature. The current study,1 in addition to the total population of the meta-analysis by Le and colleagues,2 included women as the predominant patient population. Hopefully, future studies will help to delineate if there is a gender predominance and, if so, whether the current treatment data apply to both genders.
CHALLENGES TO IMPLEMENTATION
None to speak of
There are no barriers to implementing this recommendation immediately in all primary care settings.
ACKNOWLEDGEMENT
The PURLs Surveillance System was supported in part by Grant Number UL1RR024999 from the National Center For Research Resources, a Clinical Translational Science Award to the University of Chicago. The content is solely the responsibility of the authors and does not necessarily represent the official views of the National Center For Research Resources or the National Institutes of Health.
ILLUSTRATIVE CASE
A 15-year-old girl presents to your clinic with poorly controlled chronic migraines that are preventing her from attending school 3 to 4 days per month. As part of her treatment regimen, you are considering migraine prevention strategies.
Should you prescribe amitriptyline or topiramate for preventive migraine therapy?
Migraine headaches are the most common reason for headache presentation in pediatric neurology outpatient clinics, affecting 5% to 10% of the pediatric population worldwide.2 Current recommendations regarding prophylactic migraine therapy in childhood are based on consensus opinions.3,4 And the US Food and Drug Administration (FDA) has not approved any medications for preventing migraines in children younger than 12 years of age. However, surveys of pediatric headache specialists suggest that amitriptyline and topiramate are among the most commonly prescribed medications for childhood migraine prophylaxis.3,4
There is low-quality evidence from individual randomized controlled trials (RCTs) about the effectiveness of topiramate. A meta-analysis by El-Chammas and colleagues included 3 RCTs comparing topiramate to placebo for the prevention of episodic migraines (migraine headaches that occur <15 times/month) in a combined total of 283 children younger than 18 years of age.5 Topiramate demonstrated a nonclinically significant, but statistically significant, reduction of less than one headache per month (-0.71; 95% confidence interval [CI], -1.19 to -0.24). This is based on moderate quality evidence due to a high placebo response rate and study durations of only 12 weeks.5 The FDA has approved topiramate for migraine prevention in children ages 12 to 17 years.6
Adult guidelines. The findings described above are consistent with the most recent adult guidelines from the American Academy of Neurology and the American Headache Society.7 In a joint publication from 2012, these societies recommended both topiramate and amitriptyline for the prevention of migraines in adults based on high-quality (Level A evidence) and medium-quality evidence (Level B), respectively.7
[polldaddy:9973304]
STUDY SUMMARY
Both drugs are no better than placebo in children
A multicenter, double-blind RCT by Powers and colleagues compared the effectiveness of amitriptyline, topiramate, and placebo in the prevention of pediatric migraines.1 Target dosing for amitriptyline and topiramate was set at 1 mg/kg/d and 2 mg/kg/d, respectively. Titration toward these doses occurred over an 8-week period based on reported adverse effects. Patients then continued their maximum tolerated dose for an additional 16 weeks.
Patients were predominantly white (70%), female (68%), and 8 to 17 years of age. They had at least 4 headache days over a prospective 28-day pre-treatment period and a Pediatric Migraine Disability Assessment Scale (PedMIDAS) score of 11 to 139 (mild to moderate disability=11-50; severe disability >50).1,8 The primary endpoint consisted of at least a 50% relative reduction (RR) in the number of headache days over the 28-day pre-therapy (baseline) period compared with the final 28 days of the trial.1
The authors of the study included 328 patients in the primary efficacy analysis and randomly assigned them in a 2:2:1 ratio to receive either amitriptyline (132 patients), topiramate (130 patients), or placebo (66 patients), respectively. After 24 weeks of therapy, there was no significant difference between the amitriptyline, topiramate, and placebo groups in the primary endpoint (52% amitriptyline, 55% topiramate, 61% placebo; adjusted odds ratio [OR]=0.71; 98% CI, 0.34-1.48; P=.26 between amitriptyline and placebo; OR=0.81; 98% CI, 0.39-1.68; P=.48 between topiramate and placebo; OR=0.88; 98% CI, 0.49-1.59; P=.49 between amitriptyline and topiramate).
There was also no difference in the secondary outcomes of absolute reduction in headache days and headache-related disability as determined by PedMIDAS. The study was stopped early for futility. Compared with placebo, amitriptyline significantly increased fatigue (number needed to harm [NNH]=8) and dry mouth (NNH=9) and was associated with 3 serious adverse events of altered mood. Compared with placebo, topiramate significantly increased paresthesia (NNH=4) and weight loss (NNH=13) and was associated with one serious adverse event—a suicide attempt.1
WHAT’S NEW?
Higher-level evidence demonstrates lack of efficacy
This RCT provides new, higher-level evidence that demonstrates the lack of efficacy of amitriptyline and topiramate in the prevention of pediatric migraines. It also highlights the risk of increased adverse events with topiramate and amitriptyline.
Two of the 3 topiramate trials used in the older meta-analysis by El-Chammas and colleagues5 and this new RCT1 were included in an updated meta-analysis by Le and colleagues (total participants 465) published in 2017.2 This newer meta-analysis found no statistical benefit associated with the use of topiramate over placebo. It demonstrated a nonsignificant decrease in the number of patients with at least a 50% relative reduction in headache frequency (risk ratio = 1.26; 95% CI, 0.94-1.67) and in the overall number of headache days (mean difference = -0.77; 95% CI, -2.31 to 0.76) in patients younger than 18 years of age.2 Both meta-analyses, however, showed an increase in the rate of adverse events in patients using topiramate vs placebo.2,5
CAVEATS
Is there a gender predominance?
El-Chammas and colleagues5 describe male pediatric patients as being the predominant pediatric gender with migraines. However, they do not quote an incidence rate or cite the reference for this statement. No other reference to gender predominance was noted in the literature. The current study,1 in addition to the total population of the meta-analysis by Le and colleagues,2 included women as the predominant patient population. Hopefully, future studies will help to delineate if there is a gender predominance and, if so, whether the current treatment data apply to both genders.
CHALLENGES TO IMPLEMENTATION
None to speak of
There are no barriers to implementing this recommendation immediately in all primary care settings.
ACKNOWLEDGEMENT
The PURLs Surveillance System was supported in part by Grant Number UL1RR024999 from the National Center For Research Resources, a Clinical Translational Science Award to the University of Chicago. The content is solely the responsibility of the authors and does not necessarily represent the official views of the National Center For Research Resources or the National Institutes of Health.
1. Powers SW, Coffey CS, Chamberlin LA, et al; for the CHAMP Investigators. Trial of amitriptyline, topiramate, and placebo for pediatric migraine. N Engl J Med. 2017;376:115-124.
2. Le K, Yu D, Wang J, et al. Is topiramate effective for migraine prevention in patients less than 18 years of age? A meta-analysis of randomized controlled trials. J Headache Pain. 2017;18:69.
3. Lewis D, Ashwal S, Hershey A, et al. Practice parameter: pharmacological treatment of migraine headache in children and adolescents: report of the American Academy of Neurology Quality Standards Subcommittee and the Practice Committee of the Child Neurology Society. Neurology. 2004;63:2215-2224.
4. Hershey AD. Current approaches to the diagnosis and management of paediatric migraine. Lancet Neurology. 2010;9:190-204.
5. El-Chammas K, Keyes J, Thompson N, et al. Pharmacologic treatment of pediatric headaches: a meta-analysis. JAMA Pediatr. 2013;167:250-258.
6. Qudexy XR. Highlights of prescribing information. Available at: https://www.accessdata.fda.gov/drugsatfda_docs/label/2017/205122s003s005lbl.pdf. Accessed March 15, 2018.
7. Silberstein SD, Holland S, Freitag F, et al. Evidence-based guideline update: pharmacologic treatment for episodic migraine prevention in adults: report of the Quality Standards Subcommittee of the American Academy of Neurology and the American Headache Society. Neurology. 2012;78:1337-1345.
8. Hershey AD, Powers SW, Vockell AL, et al. PedMIDAS: development of a questionnaire to assess disability of migraines in children. Neurology. 2001;57:2034-2039.
1. Powers SW, Coffey CS, Chamberlin LA, et al; for the CHAMP Investigators. Trial of amitriptyline, topiramate, and placebo for pediatric migraine. N Engl J Med. 2017;376:115-124.
2. Le K, Yu D, Wang J, et al. Is topiramate effective for migraine prevention in patients less than 18 years of age? A meta-analysis of randomized controlled trials. J Headache Pain. 2017;18:69.
3. Lewis D, Ashwal S, Hershey A, et al. Practice parameter: pharmacological treatment of migraine headache in children and adolescents: report of the American Academy of Neurology Quality Standards Subcommittee and the Practice Committee of the Child Neurology Society. Neurology. 2004;63:2215-2224.
4. Hershey AD. Current approaches to the diagnosis and management of paediatric migraine. Lancet Neurology. 2010;9:190-204.
5. El-Chammas K, Keyes J, Thompson N, et al. Pharmacologic treatment of pediatric headaches: a meta-analysis. JAMA Pediatr. 2013;167:250-258.
6. Qudexy XR. Highlights of prescribing information. Available at: https://www.accessdata.fda.gov/drugsatfda_docs/label/2017/205122s003s005lbl.pdf. Accessed March 15, 2018.
7. Silberstein SD, Holland S, Freitag F, et al. Evidence-based guideline update: pharmacologic treatment for episodic migraine prevention in adults: report of the Quality Standards Subcommittee of the American Academy of Neurology and the American Headache Society. Neurology. 2012;78:1337-1345.
8. Hershey AD, Powers SW, Vockell AL, et al. PedMIDAS: development of a questionnaire to assess disability of migraines in children. Neurology. 2001;57:2034-2039.
Copyright © 2018. The Family Physicians Inquiries Network. All rights reserved.
PRACTICE CHANGER
Do not prescribe amitriptyline or topiramate as preventive therapy for migraine in children; both drugs are no better than placebo for this population and are associated with increased rates of adverse events.1,2
STRENGTH OF RECOMMENDATION
A: Based on a single double-blind randomized control trial (RCT) and supported by a meta-analysis of 4 RCTs.
1. Powers SW, Coffey CS, Chamberlin LA, et al; for the CHAMP Investigators. Trial of amitriptyline, topiramate, and placebo for pediatric migraine. N Engl J Med. 2017;376:115-124.
2. Le K, Yu D, Wang J, et al. Is topiramate effective for migraine prevention in patients less than 18 years of age? A meta-analysis of randomized controlled trials. J Headache Pain. 2017;18:69.

Severe right upper chest pain • tender right sternoclavicular joint • Dx?
THE CASE
A 16-year-old hockey player presented to our emergency department with sharp pain in his right upper chest after “checking” another player during a game. The pain did not resolve with rest and was worse with movement and breathing. The patient did not have dysphagia, dyspnea, paresthesias, or hoarseness. The physical examination revealed tenderness over the right sternoclavicular joint (SCJ) without swelling or deformity. A distal neurovascular exam was intact, and a chest x-ray showed no evidence of dislocation or fracture (FIGURE 1A). The patient’s pain was refractory to multiple intravenous (IV) pain medications.
THE DIAGNOSIS
A computed tomography (CT) scan with IV contrast of the chest demonstrated posterior and superior dislocation of the right clavicular head. Despite the close proximity of the dislocated head to the brachiocephalic artery (FIGURE 1B-1D), there was no vascular injury.
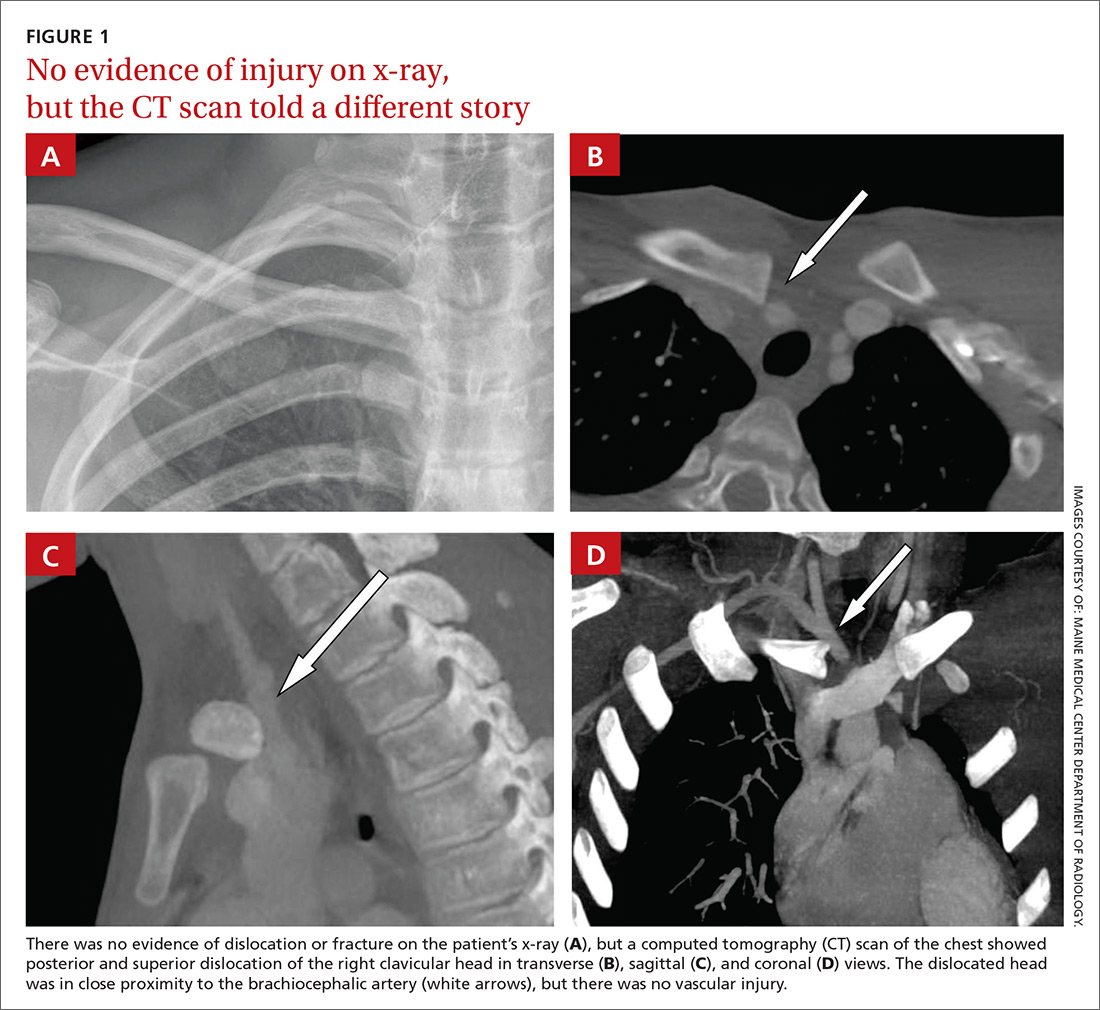
DISCUSSION
Posterior sternoclavicular dislocations (PSCDs) can be difficult to diagnose. Edema can mask the characteristic skin depression that one would expect with a posterior dislocation.1 Chest radiographs are often normal (as was true in this case). Patients may present with an abnormal pulse, paresthesias, hoarseness, dysphagia, and/or dyspnea. However, for more than half of these patients, their only signs and symptoms will be pain, swelling, and limited range of motion.1 As a result, a PSCD may be misdiagnosed as a ligamentous or soft tissue injury.1
An uncommon injury that can result in serious complications
PSCDs represent 3% to 5% of all SCJ dislocations, which comprise <5% of all shoulder girdle injuries.1 Nevertheless, prompt and accurate diagnosis is critical, as these dislocations involve a high risk for injury to the posterior structures, particularly the brachiocephalic vein, right common carotid artery, and aortic arch.
One study found that nearly 75% of patients had a significant structure <1 cm posterior to the SCJ.2 This proximity can result in neurovascular complications—some of which are devastating—in up to 30% of patients with PSCDs.3 A case report from 2011, for example, describes a 19-year-old man who had an undiagnosed PSCD that caused a pseudoaneurysm in his subclavian artery and a subsequent thrombotic cerebrovascular accident.4
Which injuries should raise your suspicions? Injuries in which lateral compression on the shoulder has caused it to roll forward and those in which a posteriorly directed force has been applied to the medial clavicle (as might occur in tackle sports or motor vehicle rollovers) should increase suspicion of a PSCD.1
Proper diagnosis requires CT angiography of the chest to assess the injury and evaluate the underlying structures. If CT is not available, additional chest film views, such as a serendipity view (anteroposterior view with 40° cephalic tilt) or Heinig view (oblique projection perpendicular to SCJ), may be obtained; an ultrasound is also an option.5
PSCD = surgical emergency
Following diagnosis, immediate orthopedic consultation is required. A PSCD is a surgical emergency. Reduction (open or closed) must be performed under general anesthesia with vascular and/or cardiothoracic surgery specialists available, as the reduction itself could injure one of the great vessels. Fortunately, most patients do quite well following surgery, with the majority achieving good-to-excellent results.6
Our patient was admitted to the hospital and underwent orthopedic surgery the following morning. Vascular and cardiothoracic surgeons were consulted and available in the event of a complication. A Salter-Harris type 2 fracture of the medial clavicle was identified intraoperatively, and an open reduction with internal fixation was performed. The patient had an uneventful recovery and resumed his usual activities, including playing hockey.
THE TAKEAWAY
PSCDs, although uncommon, can be life-threatening. Since the physical exam is unreliable and standard radiographs are often normal, accurate diagnosis relies largely on increased clinical suspicion. When there is a history of shoulder trauma, medial clavicle pain, and SCJ edema or tenderness, a PSCD should be suspected.7
Confirm the diagnosis with CT angiogram, and remember that a PSCD is a surgical emergency that requires coordination with orthopedic and vascular/cardiothoracic surgeons.
1. Chaudhry S. Pediatric posterior sternoclavicular joint injuries. J Am Acad Orthop Surg. 2015;23:468-475.
2. Ponce BA, Kundukulam JA, Pflugner R, et al. Sternoclavicular joint surgery: how far does danger lurk below? J Shoulder Elbow Surg. 2013;22:993-999.
3. Daya MR, Bengtzen RR. Shoulder. In: Rosen’s Emergency Medicine: Concepts and Clinical Practice. 8th ed. Philadelphia, PA: Elsevier Saunders; 2014:618-642.
4. Marcus MS, Tan V. Cerebrovascular accident in a 19-year-old patient: a case report of posterior sternoclavicular dislocation. J Shoulder Elbow Surg. 2011;20:e1-e4.
5. Morell DJ, Thyagarajan DS. Sternoclavicular joint dislocation and its management: a review of the literature. World J Orthop. 2016;7:244-250.
6. Boesmueller S, Wech M, Tiefenboeck TM, et al. Incidence, characteristics, and long-term follow-up of sternoclavicular injuries: an epidemiologic analysis of 92 cases. J Trauma Acute Care Surg. 2016;80:289-295.
7. Roepke C, Kleiner M, Jhun P, et al. Chest pain bounce-back: posterior sternoclavicular dislocation. Ann Emerg Med. 2015;66:559-561.
THE CASE
A 16-year-old hockey player presented to our emergency department with sharp pain in his right upper chest after “checking” another player during a game. The pain did not resolve with rest and was worse with movement and breathing. The patient did not have dysphagia, dyspnea, paresthesias, or hoarseness. The physical examination revealed tenderness over the right sternoclavicular joint (SCJ) without swelling or deformity. A distal neurovascular exam was intact, and a chest x-ray showed no evidence of dislocation or fracture (FIGURE 1A). The patient’s pain was refractory to multiple intravenous (IV) pain medications.
THE DIAGNOSIS
A computed tomography (CT) scan with IV contrast of the chest demonstrated posterior and superior dislocation of the right clavicular head. Despite the close proximity of the dislocated head to the brachiocephalic artery (FIGURE 1B-1D), there was no vascular injury.
DISCUSSION
Posterior sternoclavicular dislocations (PSCDs) can be difficult to diagnose. Edema can mask the characteristic skin depression that one would expect with a posterior dislocation.1 Chest radiographs are often normal (as was true in this case). Patients may present with an abnormal pulse, paresthesias, hoarseness, dysphagia, and/or dyspnea. However, for more than half of these patients, their only signs and symptoms will be pain, swelling, and limited range of motion.1 As a result, a PSCD may be misdiagnosed as a ligamentous or soft tissue injury.1
An uncommon injury that can result in serious complications
PSCDs represent 3% to 5% of all SCJ dislocations, which comprise <5% of all shoulder girdle injuries.1 Nevertheless, prompt and accurate diagnosis is critical, as these dislocations involve a high risk for injury to the posterior structures, particularly the brachiocephalic vein, right common carotid artery, and aortic arch.
One study found that nearly 75% of patients had a significant structure <1 cm posterior to the SCJ.2 This proximity can result in neurovascular complications—some of which are devastating—in up to 30% of patients with PSCDs.3 A case report from 2011, for example, describes a 19-year-old man who had an undiagnosed PSCD that caused a pseudoaneurysm in his subclavian artery and a subsequent thrombotic cerebrovascular accident.4
Which injuries should raise your suspicions? Injuries in which lateral compression on the shoulder has caused it to roll forward and those in which a posteriorly directed force has been applied to the medial clavicle (as might occur in tackle sports or motor vehicle rollovers) should increase suspicion of a PSCD.1
Proper diagnosis requires CT angiography of the chest to assess the injury and evaluate the underlying structures. If CT is not available, additional chest film views, such as a serendipity view (anteroposterior view with 40° cephalic tilt) or Heinig view (oblique projection perpendicular to SCJ), may be obtained; an ultrasound is also an option.5
PSCD = surgical emergency
Following diagnosis, immediate orthopedic consultation is required. A PSCD is a surgical emergency. Reduction (open or closed) must be performed under general anesthesia with vascular and/or cardiothoracic surgery specialists available, as the reduction itself could injure one of the great vessels. Fortunately, most patients do quite well following surgery, with the majority achieving good-to-excellent results.6
Our patient was admitted to the hospital and underwent orthopedic surgery the following morning. Vascular and cardiothoracic surgeons were consulted and available in the event of a complication. A Salter-Harris type 2 fracture of the medial clavicle was identified intraoperatively, and an open reduction with internal fixation was performed. The patient had an uneventful recovery and resumed his usual activities, including playing hockey.
THE TAKEAWAY
PSCDs, although uncommon, can be life-threatening. Since the physical exam is unreliable and standard radiographs are often normal, accurate diagnosis relies largely on increased clinical suspicion. When there is a history of shoulder trauma, medial clavicle pain, and SCJ edema or tenderness, a PSCD should be suspected.7
Confirm the diagnosis with CT angiogram, and remember that a PSCD is a surgical emergency that requires coordination with orthopedic and vascular/cardiothoracic surgeons.
THE CASE
A 16-year-old hockey player presented to our emergency department with sharp pain in his right upper chest after “checking” another player during a game. The pain did not resolve with rest and was worse with movement and breathing. The patient did not have dysphagia, dyspnea, paresthesias, or hoarseness. The physical examination revealed tenderness over the right sternoclavicular joint (SCJ) without swelling or deformity. A distal neurovascular exam was intact, and a chest x-ray showed no evidence of dislocation or fracture (FIGURE 1A). The patient’s pain was refractory to multiple intravenous (IV) pain medications.
THE DIAGNOSIS
A computed tomography (CT) scan with IV contrast of the chest demonstrated posterior and superior dislocation of the right clavicular head. Despite the close proximity of the dislocated head to the brachiocephalic artery (FIGURE 1B-1D), there was no vascular injury.
DISCUSSION
Posterior sternoclavicular dislocations (PSCDs) can be difficult to diagnose. Edema can mask the characteristic skin depression that one would expect with a posterior dislocation.1 Chest radiographs are often normal (as was true in this case). Patients may present with an abnormal pulse, paresthesias, hoarseness, dysphagia, and/or dyspnea. However, for more than half of these patients, their only signs and symptoms will be pain, swelling, and limited range of motion.1 As a result, a PSCD may be misdiagnosed as a ligamentous or soft tissue injury.1
An uncommon injury that can result in serious complications
PSCDs represent 3% to 5% of all SCJ dislocations, which comprise <5% of all shoulder girdle injuries.1 Nevertheless, prompt and accurate diagnosis is critical, as these dislocations involve a high risk for injury to the posterior structures, particularly the brachiocephalic vein, right common carotid artery, and aortic arch.
One study found that nearly 75% of patients had a significant structure <1 cm posterior to the SCJ.2 This proximity can result in neurovascular complications—some of which are devastating—in up to 30% of patients with PSCDs.3 A case report from 2011, for example, describes a 19-year-old man who had an undiagnosed PSCD that caused a pseudoaneurysm in his subclavian artery and a subsequent thrombotic cerebrovascular accident.4
Which injuries should raise your suspicions? Injuries in which lateral compression on the shoulder has caused it to roll forward and those in which a posteriorly directed force has been applied to the medial clavicle (as might occur in tackle sports or motor vehicle rollovers) should increase suspicion of a PSCD.1
Proper diagnosis requires CT angiography of the chest to assess the injury and evaluate the underlying structures. If CT is not available, additional chest film views, such as a serendipity view (anteroposterior view with 40° cephalic tilt) or Heinig view (oblique projection perpendicular to SCJ), may be obtained; an ultrasound is also an option.5
PSCD = surgical emergency
Following diagnosis, immediate orthopedic consultation is required. A PSCD is a surgical emergency. Reduction (open or closed) must be performed under general anesthesia with vascular and/or cardiothoracic surgery specialists available, as the reduction itself could injure one of the great vessels. Fortunately, most patients do quite well following surgery, with the majority achieving good-to-excellent results.6
Our patient was admitted to the hospital and underwent orthopedic surgery the following morning. Vascular and cardiothoracic surgeons were consulted and available in the event of a complication. A Salter-Harris type 2 fracture of the medial clavicle was identified intraoperatively, and an open reduction with internal fixation was performed. The patient had an uneventful recovery and resumed his usual activities, including playing hockey.
THE TAKEAWAY
PSCDs, although uncommon, can be life-threatening. Since the physical exam is unreliable and standard radiographs are often normal, accurate diagnosis relies largely on increased clinical suspicion. When there is a history of shoulder trauma, medial clavicle pain, and SCJ edema or tenderness, a PSCD should be suspected.7
Confirm the diagnosis with CT angiogram, and remember that a PSCD is a surgical emergency that requires coordination with orthopedic and vascular/cardiothoracic surgeons.
1. Chaudhry S. Pediatric posterior sternoclavicular joint injuries. J Am Acad Orthop Surg. 2015;23:468-475.
2. Ponce BA, Kundukulam JA, Pflugner R, et al. Sternoclavicular joint surgery: how far does danger lurk below? J Shoulder Elbow Surg. 2013;22:993-999.
3. Daya MR, Bengtzen RR. Shoulder. In: Rosen’s Emergency Medicine: Concepts and Clinical Practice. 8th ed. Philadelphia, PA: Elsevier Saunders; 2014:618-642.
4. Marcus MS, Tan V. Cerebrovascular accident in a 19-year-old patient: a case report of posterior sternoclavicular dislocation. J Shoulder Elbow Surg. 2011;20:e1-e4.
5. Morell DJ, Thyagarajan DS. Sternoclavicular joint dislocation and its management: a review of the literature. World J Orthop. 2016;7:244-250.
6. Boesmueller S, Wech M, Tiefenboeck TM, et al. Incidence, characteristics, and long-term follow-up of sternoclavicular injuries: an epidemiologic analysis of 92 cases. J Trauma Acute Care Surg. 2016;80:289-295.
7. Roepke C, Kleiner M, Jhun P, et al. Chest pain bounce-back: posterior sternoclavicular dislocation. Ann Emerg Med. 2015;66:559-561.
1. Chaudhry S. Pediatric posterior sternoclavicular joint injuries. J Am Acad Orthop Surg. 2015;23:468-475.
2. Ponce BA, Kundukulam JA, Pflugner R, et al. Sternoclavicular joint surgery: how far does danger lurk below? J Shoulder Elbow Surg. 2013;22:993-999.
3. Daya MR, Bengtzen RR. Shoulder. In: Rosen’s Emergency Medicine: Concepts and Clinical Practice. 8th ed. Philadelphia, PA: Elsevier Saunders; 2014:618-642.
4. Marcus MS, Tan V. Cerebrovascular accident in a 19-year-old patient: a case report of posterior sternoclavicular dislocation. J Shoulder Elbow Surg. 2011;20:e1-e4.
5. Morell DJ, Thyagarajan DS. Sternoclavicular joint dislocation and its management: a review of the literature. World J Orthop. 2016;7:244-250.
6. Boesmueller S, Wech M, Tiefenboeck TM, et al. Incidence, characteristics, and long-term follow-up of sternoclavicular injuries: an epidemiologic analysis of 92 cases. J Trauma Acute Care Surg. 2016;80:289-295.
7. Roepke C, Kleiner M, Jhun P, et al. Chest pain bounce-back: posterior sternoclavicular dislocation. Ann Emerg Med. 2015;66:559-561.
Acupuncture for pain: 7 questions answered
An estimated 39.4 million US adults suffer from persistent pain,1 and the National Institutes of Health indicate that pain affects more Americans than diabetes, heart disease, and cancer combined.2
As physicians, we know that conventional options to manage chronic pain leave much to be desired and that more evidence-based treatment options are sorely needed. Patients know this, too, and turn to complementary therapies for pain more than for any other diagnosis.3
Case in point: The use of acupuncture is growing. Its use in the United States tripled between 1997 and 2007.4 In addition, the research base for acupuncture is rapidly expanding. From 1991 to 2009, nearly 4000 acupuncture research studies were published, with studies on pain accounting for 41% of the acupuncture literature.4
But acupuncture is not without controversy. This is due to a lack of a universally accepted biologic mechanism, theories of use and efficacy based in an alternative medical system (traditional Chinese medicine [TCM]), and conflicting views of the evidence.
This article will help make sense of this growing body of knowledge by summarizing the latest evidence and addressing 7 common questions about acupuncture for pain conditions. Applying this information will give you the confidence to counsel patients appropriately and decide if acupuncture fits within their pain management plan.
1. What is acupuncture and how does it work?
Acupuncture, which has a 2000-year history of use, involves inserting needles at various points throughout the body to promote healing and improve function. Although acupuncture represents one piece of TCM (which is a holistic system that also includes herbal medicine, nutrition, meditation, and movement), it is often offered as an independent therapy.
Acupuncture point locations are determined either by using an underlying theoretical framework, such as TCM, or by using anatomic structures, such as muscular trigger points. Providers today often employ a hybrid approach when delivering acupuncture treatment. That is, practitioners may choose point locations based on TCM, but they may combine the practice with local treatments that are based on current knowledge of anatomy. For example, a patient presenting with low back pain may be treated utilizing traditional points located near the ankle and knee, and also by needling active trigger points in the quadratus lumborum muscle.
The mechanism of action. One of the reasons for the continuing controversy surrounding acupuncture is the lack of a clear understanding of its underlying mechanism of action. For centuries the “how” of acupuncture has been explained in poetic terms such as yin, yang, and qi. Only in the past half-century have we begun investigating the potential biologic mechanisms responsible for the physiologic effects seen with acupuncture treatment.
While research has uncovered several interesting theories, how these mechanisms interact to produce therapeutic effects is still unclear. However, looking at various components of the nervous system helps to provide some insight.
Consider the nervous system. One way to conceptualize the mechanisms of acupuncture is to consider the various levels of the nervous system and how each level is affected. In the central nervous system, needling an acupuncture point stimulates the natural endorphin system, altering the pain sensation.5 This effect is reversible with naloxone in animal models, indicating that blocking the endorphin system interferes with the analgesic benefits of acupuncture.5
Serotonergic systems are also involved centrally. Functional magnetic resonance imaging studies have shown that needling specific acupuncture points modulates areas of the brain.
In the spinal cord, the gate control theory is believed to play a role. (The gate control theory puts forth that nonpainful input closes the “gates” to painful input, which prevents pain sensations from traveling to the central nervous system.) Modulation of sensory input occurs at the level of the dorsal horn of the spinal cord during an acupuncture treatment, which can affect the physiologic pain response.6 Opioid receptors are also affected at the spinal cord level.7
Lastly, multiple chemicals released peripherally, including interleukins, substance P, and adenosine, appear to contribute to acupuncture’s analgesia.6 We know this because a local anesthetic injected around a peripheral nerve at an acupoint blocks the analgesic effect of acupuncture.8 Taken together, acupuncture treatment produces physiologic changes in the brain, spinal cord, and at the periphery, making it a truly unique therapeutic modality.
2. Is acupuncture an effective treatment for pain?
Yes, but before we look at the individual studies, it is important to mention some of the shortcomings of the research to date. First, acupuncture trials lack a standard sham control intervention. Some sham treatments involve skin penetration, while others do not. This has led to controversy regarding whether the sham interventions themselves are physiologically active, thus lessening the magnitude of effect for acupuncture. This is a point of contention in the acupuncture literature and a factor to consider when deciding if results have clinical significance.
In addition, the acupuncturist providing treatment in a trial is typically unblinded. This is also true of trials measuring other physical modalities, but it contributes to the debate surrounding the magnitude of placebo response in acupuncture studies.
Finally, many randomized trials involving acupuncture have had low methodologic quality. Fortunately, there are now several high-quality systematic reviews that have attempted to filter out the lower-quality research and provide a better representation of the evidence (TABLE9-14). A discussion of them follows.
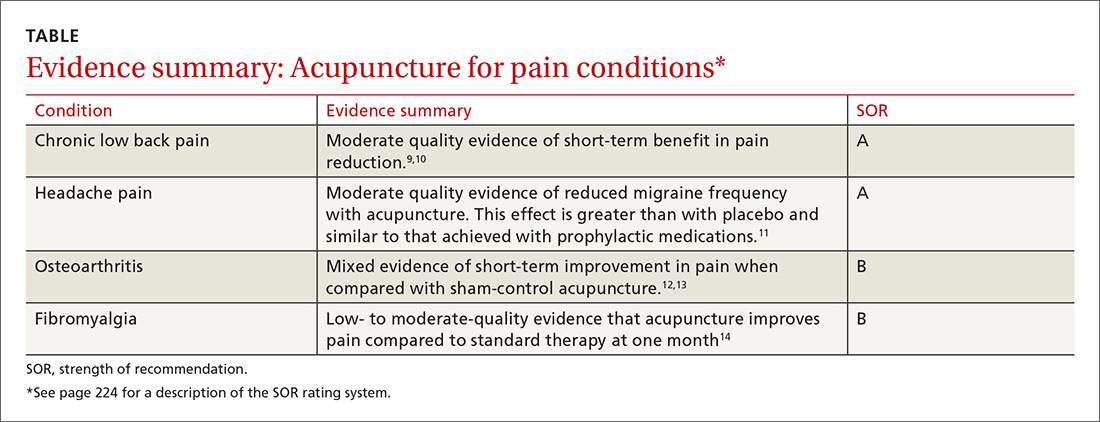
General chronic pain. A 2012 meta-analysis15 evaluated the effectiveness of acupuncture for the treatment of chronic pain with one of 4 etiologies: nonspecific back or neck pain, chronic headache, osteoarthritis, and shoulder pain. This analysis attempted to control for the high variability of study quality in the acupuncture literature by including only studies of high methodologic character. The final analysis included 29 randomized controlled trials (N=17,922). The authors concluded that acupuncture was superior to both no acupuncture and sham (placebo) acupuncture for all pain conditions in the study. The average effect size was 0.5 standard deviations on a 10-point scale. The authors considered this to be clinically relevant, although the magnitude of benefit was modest.15
Low back pain. A 2017 systematic review by Chou et al9 evaluated 32 trials (N=5931) reviewing acupuncture for the treatment of chronic low back pain. This review found acupuncture was associated with lower pain intensity and improved function in the short term when compared with no treatment. And while acupuncture was associated with lower pain intensity when compared with a sham control, there was no difference in function between the 2 groups. Of note, 3 of the included trials compared acupuncture to standard medications used in the treatment of low back pain and found acupuncture to be superior in terms of both pain reduction and improved function.9
The authors of a 2008 systematic review that evaluated 23 trials (N=6359)10 similarly concluded that there is moderate evidence for the use of acupuncture (compared to no treatment) for the treatment of nonspecific low back pain, but did not find evidence that acupuncture was superior to sham controls.10 The 2017 American College of Physicians clinical practice guidelines support the use of acupuncture for the treatment of chronic low back pain.16
In addition to helping with chronic low back pain, acupuncture is also showing promise as a treatment for acute spinal pain. A 2013 systematic review (11 trials, N=1139) showed that acupuncture may be more effective than nonsteroidal anti-inflammatory drugs (NSAIDs) in treating acute low back pain and may cause fewer adverse effects.17
Headache pain. Evidence favoring acupuncture in the management of headache has been fairly consistent over the past decade. An updated Cochrane review on the prevention of migraine headaches was published in 2016.11 Acupuncture was compared with no treatment in 4 trials (n=2199). The authors found moderate quality evidence that acupuncture reduces headache frequency (number needed to treat=4). Acupuncture achieved at least 50% headache reduction in 41% vs 17% in the groups that received no acupuncture. When compared with sham control groups (10 trials, n=1534), acupuncture demonstrated a small but statistically significant improvement in headache frequency. Three trials (n=744) compared acupuncture to medication prophylaxis for migraine headaches and found acupuncture had similar effectiveness with fewer adverse effects.11
Osteoarthritis (OA). Most studies have focused on OA of the knee, and, thus far, have generated conflicting results. A Cochrane review in 2010 included 4 trials (n=884) that had a wait list control and 9 trials (n=1835) that compared acupuncture to a sham control.12 When compared to a wait list control, acupuncture resulted in statistically significant and clinically relevant improvement in pain and function. However, when compared to sham treatment for OA, the review showed statistically significant improvement in pain and function for acupuncture that was unlikely to be clinically relevant.12
A more recent meta-analysis in 2016 evaluated 10 trials (N=2007) investigating acupuncture in the treatment of knee OA.13 The authors found acupuncture improved both pain and functional outcome measures when compared with either no treatment or a sham control.
Fibromyalgia. Systematic reviews in 2007 (5 trials, N=316)18 and 2010 (7 trials, N=385)19 showed that acupuncture did provide short-term pain relief in patients with fibromyalgia, but that the effect was not sustained at follow-up.These reviews were limited by a high risk of bias, which was noted in the studies. The authors of both reviews concluded that acupuncture could not be recommended for the treatment of fibromyalgia.
A more recent Cochrane review published in 2013 (9 trials, N=395) offered low- to moderate-level evidence of benefit for acupuncture compared with no treatment at one month follow-up.14 Of note, there was also evidence of benefit in improved sleep and global well-being, in addition to pain and stiffness measures in this review. The overall magnitude of benefit was small, but clinically significant. Acupuncture also has evidence of benefit in the treatment of conditions commonly seen in conjunction with fibromyalgia, including headaches and low back pain as described earlier.
3. What does a typical acupuncture treatment entail?
In a typical treatment, anywhere from about 5 to 20 needles are inserted into the body. Common areas of needling include the arms and legs, especially below the elbows and knees. Other frequently used areas are the scalp, ears, and structures related to the painful condition.
The needles used are very thin (typically smaller than a 30-gauge needle) and do not have a beveled tip like phlebotomy needles do. Most patients have minimal pain as the needles are inserted. During the treatment, the needles may be left alone or they may be heated or stimulated electrically. An average treatment lasts 30 to 40 minutes; many patients find the sessions relaxing.
4. Are there any adverse effects or complications of treatment?
Acupuncture is generally considered a safe therapy, with most patients experiencing no adverse effects at all. Minor adverse effects can include post-treatment fatigue, minor bruising, or vasovagal reactions from the insertion of the needles. Serious complications, such as pneumothorax, are possible, but are considered rare.20 A 2004 study estimated the incidence of severe complications to be .05 per 10,000 acupuncture treatments.21
Infections are also possible, but most reported cases were due to practitioners reusing needles.22 The standard of care in the United States is to use only sterilized, single-use needles. With this practice, infections due to acupuncture are thought to be rare.
Of note, trials that compare acupuncture to another active therapy often find that acupuncture has fewer adverse effects. This has been the case when acupuncture was compared to NSAIDs for low back pain and to topiramate for headaches.17,23
5. How does acupuncture fit into a patient’s treatment?
The simple answer is that it is often most effectively used as part of a comprehensive management plan for chronic pain.
As our understanding of the complexity of chronic pain deepens, our therapeutic armamentarium for the management of chronic pain needs to broaden. This was summed up well in a 2016 article on the multimodal management of chronic pain when the authors stated, “Many targets need more than one arrow.”24 Effective management of chronic pain involves addressing psychosocial and lifestyle factors in a patient-centered way and finding a combination of treatments that most effectively leads to improved coping and function.
It’s important to note that like medications and injections, acupuncture is a passive therapy. Although there is evidence for efficacy of improved pain with acupuncture in certain conditions, it should be combined with treatments that actively engage patients, such as exercise, behavioral treatments, development of coping skills, sleep hygiene, and educational strategies.
6. To whom do I refer patients for acupuncture treatment?
In the United States, licensed acupuncturists and physicians most commonly perform acupuncture. There are more than 50 schools that train licensed acupuncturists in the United States, and it usually takes 3 years to meet the requirements.25
SIDEBAR
Online resources
American Academy of Medical Acupuncture
www.medicalacupuncture.com
National Center for Complementary and Alternative Medicine
http://nccam.nih.gov/health/acupuncture
National Certification Commission for Acupuncture and Oriental Medicine
www.nccaom.org
Physicians are often trained through continuing medical education (CME) programs that take several months to complete. These programs often combine live lectures, distance learning, and hands-on training and are typically sponsored by a university. Most require 300 hours of CME to complete. Licensure varies by state, but in many states, having an MD or DO degree automatically allows physicians to practice acupuncture. (See “Online resources,” above for links to Web sites that can be useful in finding qualified acupuncturists in your area.)
7. Is acupuncture covered by insurance?
It depends. Insurance coverage of acupuncture is highly variable and based on region and insurance type. Medicare and Medicaid plans do not pay for acupuncture. There are some private insurance plans that do. If covered, there may be limitations regarding diagnosis, number of visits, or provider. It is best for patients to call their insurance plan directly to inquire about coverage and any limitations. If paying out of pocket, patients can expect to pay $75 to $150 per treatment session.
CORRESPONDENCE
Russell Lemmon, DO, 1100 Delaplaine Court, Madison, WI 53715; [email protected].
1. Kennedy J, Roll JM, Schraudner T, et al. Prevalence of persistent pain in the U.S. adult population: new data from the 2010 National Health Interview Survey. J Pain. 2014;15:979-984.
2. U.S. Department of Health and Human Services. NIH Fact Sheet. Pain management. Available at: https://www.report.nih.gov/nihfactsheets/ViewFactSheet.aspx?csid=57. Accessed February 12, 2018.
3. Barnes PM, Bloom B, Nahin RL. Complementary and alternative medicine use among adults and children: United States, 2007. Natl Health Stat Report. 2008;12:1-23.
4. Nahin RL, Barnes PM, Stussman BJ, et al. Costs of complementary and alternative medicine (CAM) and frequency of visits to CAM practitioners: United States, 2007. Natl Health Stat Report. 2009;18:1-14.
5. Mayer DJ, Price DD, Rafii A. Antagonism of acupuncture analgesia in man by the narcotic antagonist naloxone. Brain Res. 1977;121:368-372.
6. Ammendolia C, Furlan AD, Imamura M, et al. Evidence-informed management of chronic low back pain with needle acupuncture. Spine J. 2008;8:160-172.
7. Zhang R, Lao L, Ren K, et al. Mechanisms of acupuncture-electroacupuncture on persistent pain. Anesthesiology. 2014;120:482-503.
8. Han JS. Acupuncture analgesia: areas of consensus and controversy. Pain. 2011;152(3 Suppl):S41-S48.
9. Chou R, Deyo R, Friedly J, et al. Nonpharmacologic therapies for low back pain: a systematic review for an American College of Physicians clinical practice guideline. Ann Intern Med. 2017;166:493-505.
10. Yuan J, Purepong N, Kerr DP, et al. Effectiveness of acupuncture for low back pain: a systematic review. Spine (Phila Pa 1976). 2008;33:E887-E900.
11. Linde K, Allais G, Brinkhaus B, et al. Acupuncture for the prevention of episodic migraine. Cochrane Database Syst Rev. 2016;6:CD001218.
12. Manheimer E, Cheng K, Linde K, et al. Acupuncture for peripheral joint osteoarthritis. Cochrane Database Syst Rev. 2010;1:CD001977.
13. Lin X, Huang K, Zhu G, et al. The effects of acupuncture on chronic knee pain due to osteoarthritis: a meta-analysis. J Bone Joint Surg Am. 2016;98:1578-1585.
14. Deare JC, Zheng Z, Xue CC, et al. Acupuncture for treating fibromyalgia. Cochrane Database Syst Rev. 2013;5:CD007070.
15. Vickers AJ, Cronin AM, Maschino AC, et al. Acupuncture for chronic pain: individual patient data meta-analysis. Arch Intern Med. 2012;172:1444-1453.
16. Qaseem A, Wilt TJ, McLean RM, et al, for the Clinical Guidelines Committee of the American College of Physicians. Noninvasive treatments for acute, subacute, and chronic low back pain: a clinical practice guideline from the American College of Physicians. Ann Intern Med. 2017;166:514-530.
17. Lee JH, Choi TY, Lee MS, et al. Acupuncture for acute low back pain: a systematic review. Clin J Pain. 2013;29:172-185.
18. Mayhew E, Ernst E. Acupuncture for fibromyalgia—a systematic review of randomized clinical trials. Rheumatology (Oxford). 2007;46:801-804.
19. Langhorst J, Klose P, Musial F, et al. Efficacy of acupuncture in fibromyalgia syndrome—a systematic review with a meta-analysis of controlled clinical trials. Rheumatology (Oxford). 2010;49:778-788.
20. Lao L, Hamilton GR, Fu J, et al. Is acupuncture safe? A systematic review of case reports. Altern Ther Health Med. 2003;9:72-83.
21. White A. A cumulative review of the range and incidence of significant adverse events associated with acupuncture. Acupunct Med. 2004;22:122-133.
22. Xu S, Wang L, Cooper E, et al. Adverse events of acupuncture: a systematic review of case reports. Evid Based Complement Alternat Med. 2013:581203.
23. Linde K, Allais G, Brinkhaus B, et al. Acupuncture for migraine prophylaxis. Cochrane Database Syst Rev. 2009;1:CD001218.
24. Dale R, Stacey B. Multimodal treatment of chronic pain. Med Clin North Am. 2016;100:55-64.
25. National Certification Commission for Acupuncture and Oriental Medicine. Available at: www.nccaom.org. Accessed March 20, 2018.
An estimated 39.4 million US adults suffer from persistent pain,1 and the National Institutes of Health indicate that pain affects more Americans than diabetes, heart disease, and cancer combined.2
As physicians, we know that conventional options to manage chronic pain leave much to be desired and that more evidence-based treatment options are sorely needed. Patients know this, too, and turn to complementary therapies for pain more than for any other diagnosis.3
Case in point: The use of acupuncture is growing. Its use in the United States tripled between 1997 and 2007.4 In addition, the research base for acupuncture is rapidly expanding. From 1991 to 2009, nearly 4000 acupuncture research studies were published, with studies on pain accounting for 41% of the acupuncture literature.4
But acupuncture is not without controversy. This is due to a lack of a universally accepted biologic mechanism, theories of use and efficacy based in an alternative medical system (traditional Chinese medicine [TCM]), and conflicting views of the evidence.
This article will help make sense of this growing body of knowledge by summarizing the latest evidence and addressing 7 common questions about acupuncture for pain conditions. Applying this information will give you the confidence to counsel patients appropriately and decide if acupuncture fits within their pain management plan.
1. What is acupuncture and how does it work?
Acupuncture, which has a 2000-year history of use, involves inserting needles at various points throughout the body to promote healing and improve function. Although acupuncture represents one piece of TCM (which is a holistic system that also includes herbal medicine, nutrition, meditation, and movement), it is often offered as an independent therapy.
Acupuncture point locations are determined either by using an underlying theoretical framework, such as TCM, or by using anatomic structures, such as muscular trigger points. Providers today often employ a hybrid approach when delivering acupuncture treatment. That is, practitioners may choose point locations based on TCM, but they may combine the practice with local treatments that are based on current knowledge of anatomy. For example, a patient presenting with low back pain may be treated utilizing traditional points located near the ankle and knee, and also by needling active trigger points in the quadratus lumborum muscle.
The mechanism of action. One of the reasons for the continuing controversy surrounding acupuncture is the lack of a clear understanding of its underlying mechanism of action. For centuries the “how” of acupuncture has been explained in poetic terms such as yin, yang, and qi. Only in the past half-century have we begun investigating the potential biologic mechanisms responsible for the physiologic effects seen with acupuncture treatment.
While research has uncovered several interesting theories, how these mechanisms interact to produce therapeutic effects is still unclear. However, looking at various components of the nervous system helps to provide some insight.
Consider the nervous system. One way to conceptualize the mechanisms of acupuncture is to consider the various levels of the nervous system and how each level is affected. In the central nervous system, needling an acupuncture point stimulates the natural endorphin system, altering the pain sensation.5 This effect is reversible with naloxone in animal models, indicating that blocking the endorphin system interferes with the analgesic benefits of acupuncture.5
Serotonergic systems are also involved centrally. Functional magnetic resonance imaging studies have shown that needling specific acupuncture points modulates areas of the brain.
In the spinal cord, the gate control theory is believed to play a role. (The gate control theory puts forth that nonpainful input closes the “gates” to painful input, which prevents pain sensations from traveling to the central nervous system.) Modulation of sensory input occurs at the level of the dorsal horn of the spinal cord during an acupuncture treatment, which can affect the physiologic pain response.6 Opioid receptors are also affected at the spinal cord level.7
Lastly, multiple chemicals released peripherally, including interleukins, substance P, and adenosine, appear to contribute to acupuncture’s analgesia.6 We know this because a local anesthetic injected around a peripheral nerve at an acupoint blocks the analgesic effect of acupuncture.8 Taken together, acupuncture treatment produces physiologic changes in the brain, spinal cord, and at the periphery, making it a truly unique therapeutic modality.
2. Is acupuncture an effective treatment for pain?
Yes, but before we look at the individual studies, it is important to mention some of the shortcomings of the research to date. First, acupuncture trials lack a standard sham control intervention. Some sham treatments involve skin penetration, while others do not. This has led to controversy regarding whether the sham interventions themselves are physiologically active, thus lessening the magnitude of effect for acupuncture. This is a point of contention in the acupuncture literature and a factor to consider when deciding if results have clinical significance.
In addition, the acupuncturist providing treatment in a trial is typically unblinded. This is also true of trials measuring other physical modalities, but it contributes to the debate surrounding the magnitude of placebo response in acupuncture studies.
Finally, many randomized trials involving acupuncture have had low methodologic quality. Fortunately, there are now several high-quality systematic reviews that have attempted to filter out the lower-quality research and provide a better representation of the evidence (TABLE9-14). A discussion of them follows.
General chronic pain. A 2012 meta-analysis15 evaluated the effectiveness of acupuncture for the treatment of chronic pain with one of 4 etiologies: nonspecific back or neck pain, chronic headache, osteoarthritis, and shoulder pain. This analysis attempted to control for the high variability of study quality in the acupuncture literature by including only studies of high methodologic character. The final analysis included 29 randomized controlled trials (N=17,922). The authors concluded that acupuncture was superior to both no acupuncture and sham (placebo) acupuncture for all pain conditions in the study. The average effect size was 0.5 standard deviations on a 10-point scale. The authors considered this to be clinically relevant, although the magnitude of benefit was modest.15
Low back pain. A 2017 systematic review by Chou et al9 evaluated 32 trials (N=5931) reviewing acupuncture for the treatment of chronic low back pain. This review found acupuncture was associated with lower pain intensity and improved function in the short term when compared with no treatment. And while acupuncture was associated with lower pain intensity when compared with a sham control, there was no difference in function between the 2 groups. Of note, 3 of the included trials compared acupuncture to standard medications used in the treatment of low back pain and found acupuncture to be superior in terms of both pain reduction and improved function.9
The authors of a 2008 systematic review that evaluated 23 trials (N=6359)10 similarly concluded that there is moderate evidence for the use of acupuncture (compared to no treatment) for the treatment of nonspecific low back pain, but did not find evidence that acupuncture was superior to sham controls.10 The 2017 American College of Physicians clinical practice guidelines support the use of acupuncture for the treatment of chronic low back pain.16
In addition to helping with chronic low back pain, acupuncture is also showing promise as a treatment for acute spinal pain. A 2013 systematic review (11 trials, N=1139) showed that acupuncture may be more effective than nonsteroidal anti-inflammatory drugs (NSAIDs) in treating acute low back pain and may cause fewer adverse effects.17
Headache pain. Evidence favoring acupuncture in the management of headache has been fairly consistent over the past decade. An updated Cochrane review on the prevention of migraine headaches was published in 2016.11 Acupuncture was compared with no treatment in 4 trials (n=2199). The authors found moderate quality evidence that acupuncture reduces headache frequency (number needed to treat=4). Acupuncture achieved at least 50% headache reduction in 41% vs 17% in the groups that received no acupuncture. When compared with sham control groups (10 trials, n=1534), acupuncture demonstrated a small but statistically significant improvement in headache frequency. Three trials (n=744) compared acupuncture to medication prophylaxis for migraine headaches and found acupuncture had similar effectiveness with fewer adverse effects.11
Osteoarthritis (OA). Most studies have focused on OA of the knee, and, thus far, have generated conflicting results. A Cochrane review in 2010 included 4 trials (n=884) that had a wait list control and 9 trials (n=1835) that compared acupuncture to a sham control.12 When compared to a wait list control, acupuncture resulted in statistically significant and clinically relevant improvement in pain and function. However, when compared to sham treatment for OA, the review showed statistically significant improvement in pain and function for acupuncture that was unlikely to be clinically relevant.12
A more recent meta-analysis in 2016 evaluated 10 trials (N=2007) investigating acupuncture in the treatment of knee OA.13 The authors found acupuncture improved both pain and functional outcome measures when compared with either no treatment or a sham control.
Fibromyalgia. Systematic reviews in 2007 (5 trials, N=316)18 and 2010 (7 trials, N=385)19 showed that acupuncture did provide short-term pain relief in patients with fibromyalgia, but that the effect was not sustained at follow-up.These reviews were limited by a high risk of bias, which was noted in the studies. The authors of both reviews concluded that acupuncture could not be recommended for the treatment of fibromyalgia.
A more recent Cochrane review published in 2013 (9 trials, N=395) offered low- to moderate-level evidence of benefit for acupuncture compared with no treatment at one month follow-up.14 Of note, there was also evidence of benefit in improved sleep and global well-being, in addition to pain and stiffness measures in this review. The overall magnitude of benefit was small, but clinically significant. Acupuncture also has evidence of benefit in the treatment of conditions commonly seen in conjunction with fibromyalgia, including headaches and low back pain as described earlier.
3. What does a typical acupuncture treatment entail?
In a typical treatment, anywhere from about 5 to 20 needles are inserted into the body. Common areas of needling include the arms and legs, especially below the elbows and knees. Other frequently used areas are the scalp, ears, and structures related to the painful condition.
The needles used are very thin (typically smaller than a 30-gauge needle) and do not have a beveled tip like phlebotomy needles do. Most patients have minimal pain as the needles are inserted. During the treatment, the needles may be left alone or they may be heated or stimulated electrically. An average treatment lasts 30 to 40 minutes; many patients find the sessions relaxing.
4. Are there any adverse effects or complications of treatment?
Acupuncture is generally considered a safe therapy, with most patients experiencing no adverse effects at all. Minor adverse effects can include post-treatment fatigue, minor bruising, or vasovagal reactions from the insertion of the needles. Serious complications, such as pneumothorax, are possible, but are considered rare.20 A 2004 study estimated the incidence of severe complications to be .05 per 10,000 acupuncture treatments.21
Infections are also possible, but most reported cases were due to practitioners reusing needles.22 The standard of care in the United States is to use only sterilized, single-use needles. With this practice, infections due to acupuncture are thought to be rare.
Of note, trials that compare acupuncture to another active therapy often find that acupuncture has fewer adverse effects. This has been the case when acupuncture was compared to NSAIDs for low back pain and to topiramate for headaches.17,23
5. How does acupuncture fit into a patient’s treatment?
The simple answer is that it is often most effectively used as part of a comprehensive management plan for chronic pain.
As our understanding of the complexity of chronic pain deepens, our therapeutic armamentarium for the management of chronic pain needs to broaden. This was summed up well in a 2016 article on the multimodal management of chronic pain when the authors stated, “Many targets need more than one arrow.”24 Effective management of chronic pain involves addressing psychosocial and lifestyle factors in a patient-centered way and finding a combination of treatments that most effectively leads to improved coping and function.
It’s important to note that like medications and injections, acupuncture is a passive therapy. Although there is evidence for efficacy of improved pain with acupuncture in certain conditions, it should be combined with treatments that actively engage patients, such as exercise, behavioral treatments, development of coping skills, sleep hygiene, and educational strategies.
6. To whom do I refer patients for acupuncture treatment?
In the United States, licensed acupuncturists and physicians most commonly perform acupuncture. There are more than 50 schools that train licensed acupuncturists in the United States, and it usually takes 3 years to meet the requirements.25
SIDEBAR
Online resources
American Academy of Medical Acupuncture
www.medicalacupuncture.com
National Center for Complementary and Alternative Medicine
http://nccam.nih.gov/health/acupuncture
National Certification Commission for Acupuncture and Oriental Medicine
www.nccaom.org
Physicians are often trained through continuing medical education (CME) programs that take several months to complete. These programs often combine live lectures, distance learning, and hands-on training and are typically sponsored by a university. Most require 300 hours of CME to complete. Licensure varies by state, but in many states, having an MD or DO degree automatically allows physicians to practice acupuncture. (See “Online resources,” above for links to Web sites that can be useful in finding qualified acupuncturists in your area.)
7. Is acupuncture covered by insurance?
It depends. Insurance coverage of acupuncture is highly variable and based on region and insurance type. Medicare and Medicaid plans do not pay for acupuncture. There are some private insurance plans that do. If covered, there may be limitations regarding diagnosis, number of visits, or provider. It is best for patients to call their insurance plan directly to inquire about coverage and any limitations. If paying out of pocket, patients can expect to pay $75 to $150 per treatment session.
CORRESPONDENCE
Russell Lemmon, DO, 1100 Delaplaine Court, Madison, WI 53715; [email protected].
An estimated 39.4 million US adults suffer from persistent pain,1 and the National Institutes of Health indicate that pain affects more Americans than diabetes, heart disease, and cancer combined.2
As physicians, we know that conventional options to manage chronic pain leave much to be desired and that more evidence-based treatment options are sorely needed. Patients know this, too, and turn to complementary therapies for pain more than for any other diagnosis.3
Case in point: The use of acupuncture is growing. Its use in the United States tripled between 1997 and 2007.4 In addition, the research base for acupuncture is rapidly expanding. From 1991 to 2009, nearly 4000 acupuncture research studies were published, with studies on pain accounting for 41% of the acupuncture literature.4
But acupuncture is not without controversy. This is due to a lack of a universally accepted biologic mechanism, theories of use and efficacy based in an alternative medical system (traditional Chinese medicine [TCM]), and conflicting views of the evidence.
This article will help make sense of this growing body of knowledge by summarizing the latest evidence and addressing 7 common questions about acupuncture for pain conditions. Applying this information will give you the confidence to counsel patients appropriately and decide if acupuncture fits within their pain management plan.
1. What is acupuncture and how does it work?
Acupuncture, which has a 2000-year history of use, involves inserting needles at various points throughout the body to promote healing and improve function. Although acupuncture represents one piece of TCM (which is a holistic system that also includes herbal medicine, nutrition, meditation, and movement), it is often offered as an independent therapy.
Acupuncture point locations are determined either by using an underlying theoretical framework, such as TCM, or by using anatomic structures, such as muscular trigger points. Providers today often employ a hybrid approach when delivering acupuncture treatment. That is, practitioners may choose point locations based on TCM, but they may combine the practice with local treatments that are based on current knowledge of anatomy. For example, a patient presenting with low back pain may be treated utilizing traditional points located near the ankle and knee, and also by needling active trigger points in the quadratus lumborum muscle.
The mechanism of action. One of the reasons for the continuing controversy surrounding acupuncture is the lack of a clear understanding of its underlying mechanism of action. For centuries the “how” of acupuncture has been explained in poetic terms such as yin, yang, and qi. Only in the past half-century have we begun investigating the potential biologic mechanisms responsible for the physiologic effects seen with acupuncture treatment.
While research has uncovered several interesting theories, how these mechanisms interact to produce therapeutic effects is still unclear. However, looking at various components of the nervous system helps to provide some insight.
Consider the nervous system. One way to conceptualize the mechanisms of acupuncture is to consider the various levels of the nervous system and how each level is affected. In the central nervous system, needling an acupuncture point stimulates the natural endorphin system, altering the pain sensation.5 This effect is reversible with naloxone in animal models, indicating that blocking the endorphin system interferes with the analgesic benefits of acupuncture.5
Serotonergic systems are also involved centrally. Functional magnetic resonance imaging studies have shown that needling specific acupuncture points modulates areas of the brain.
In the spinal cord, the gate control theory is believed to play a role. (The gate control theory puts forth that nonpainful input closes the “gates” to painful input, which prevents pain sensations from traveling to the central nervous system.) Modulation of sensory input occurs at the level of the dorsal horn of the spinal cord during an acupuncture treatment, which can affect the physiologic pain response.6 Opioid receptors are also affected at the spinal cord level.7
Lastly, multiple chemicals released peripherally, including interleukins, substance P, and adenosine, appear to contribute to acupuncture’s analgesia.6 We know this because a local anesthetic injected around a peripheral nerve at an acupoint blocks the analgesic effect of acupuncture.8 Taken together, acupuncture treatment produces physiologic changes in the brain, spinal cord, and at the periphery, making it a truly unique therapeutic modality.
2. Is acupuncture an effective treatment for pain?
Yes, but before we look at the individual studies, it is important to mention some of the shortcomings of the research to date. First, acupuncture trials lack a standard sham control intervention. Some sham treatments involve skin penetration, while others do not. This has led to controversy regarding whether the sham interventions themselves are physiologically active, thus lessening the magnitude of effect for acupuncture. This is a point of contention in the acupuncture literature and a factor to consider when deciding if results have clinical significance.
In addition, the acupuncturist providing treatment in a trial is typically unblinded. This is also true of trials measuring other physical modalities, but it contributes to the debate surrounding the magnitude of placebo response in acupuncture studies.
Finally, many randomized trials involving acupuncture have had low methodologic quality. Fortunately, there are now several high-quality systematic reviews that have attempted to filter out the lower-quality research and provide a better representation of the evidence (TABLE9-14). A discussion of them follows.
General chronic pain. A 2012 meta-analysis15 evaluated the effectiveness of acupuncture for the treatment of chronic pain with one of 4 etiologies: nonspecific back or neck pain, chronic headache, osteoarthritis, and shoulder pain. This analysis attempted to control for the high variability of study quality in the acupuncture literature by including only studies of high methodologic character. The final analysis included 29 randomized controlled trials (N=17,922). The authors concluded that acupuncture was superior to both no acupuncture and sham (placebo) acupuncture for all pain conditions in the study. The average effect size was 0.5 standard deviations on a 10-point scale. The authors considered this to be clinically relevant, although the magnitude of benefit was modest.15
Low back pain. A 2017 systematic review by Chou et al9 evaluated 32 trials (N=5931) reviewing acupuncture for the treatment of chronic low back pain. This review found acupuncture was associated with lower pain intensity and improved function in the short term when compared with no treatment. And while acupuncture was associated with lower pain intensity when compared with a sham control, there was no difference in function between the 2 groups. Of note, 3 of the included trials compared acupuncture to standard medications used in the treatment of low back pain and found acupuncture to be superior in terms of both pain reduction and improved function.9
The authors of a 2008 systematic review that evaluated 23 trials (N=6359)10 similarly concluded that there is moderate evidence for the use of acupuncture (compared to no treatment) for the treatment of nonspecific low back pain, but did not find evidence that acupuncture was superior to sham controls.10 The 2017 American College of Physicians clinical practice guidelines support the use of acupuncture for the treatment of chronic low back pain.16
In addition to helping with chronic low back pain, acupuncture is also showing promise as a treatment for acute spinal pain. A 2013 systematic review (11 trials, N=1139) showed that acupuncture may be more effective than nonsteroidal anti-inflammatory drugs (NSAIDs) in treating acute low back pain and may cause fewer adverse effects.17
Headache pain. Evidence favoring acupuncture in the management of headache has been fairly consistent over the past decade. An updated Cochrane review on the prevention of migraine headaches was published in 2016.11 Acupuncture was compared with no treatment in 4 trials (n=2199). The authors found moderate quality evidence that acupuncture reduces headache frequency (number needed to treat=4). Acupuncture achieved at least 50% headache reduction in 41% vs 17% in the groups that received no acupuncture. When compared with sham control groups (10 trials, n=1534), acupuncture demonstrated a small but statistically significant improvement in headache frequency. Three trials (n=744) compared acupuncture to medication prophylaxis for migraine headaches and found acupuncture had similar effectiveness with fewer adverse effects.11
Osteoarthritis (OA). Most studies have focused on OA of the knee, and, thus far, have generated conflicting results. A Cochrane review in 2010 included 4 trials (n=884) that had a wait list control and 9 trials (n=1835) that compared acupuncture to a sham control.12 When compared to a wait list control, acupuncture resulted in statistically significant and clinically relevant improvement in pain and function. However, when compared to sham treatment for OA, the review showed statistically significant improvement in pain and function for acupuncture that was unlikely to be clinically relevant.12
A more recent meta-analysis in 2016 evaluated 10 trials (N=2007) investigating acupuncture in the treatment of knee OA.13 The authors found acupuncture improved both pain and functional outcome measures when compared with either no treatment or a sham control.
Fibromyalgia. Systematic reviews in 2007 (5 trials, N=316)18 and 2010 (7 trials, N=385)19 showed that acupuncture did provide short-term pain relief in patients with fibromyalgia, but that the effect was not sustained at follow-up.These reviews were limited by a high risk of bias, which was noted in the studies. The authors of both reviews concluded that acupuncture could not be recommended for the treatment of fibromyalgia.
A more recent Cochrane review published in 2013 (9 trials, N=395) offered low- to moderate-level evidence of benefit for acupuncture compared with no treatment at one month follow-up.14 Of note, there was also evidence of benefit in improved sleep and global well-being, in addition to pain and stiffness measures in this review. The overall magnitude of benefit was small, but clinically significant. Acupuncture also has evidence of benefit in the treatment of conditions commonly seen in conjunction with fibromyalgia, including headaches and low back pain as described earlier.
3. What does a typical acupuncture treatment entail?
In a typical treatment, anywhere from about 5 to 20 needles are inserted into the body. Common areas of needling include the arms and legs, especially below the elbows and knees. Other frequently used areas are the scalp, ears, and structures related to the painful condition.
The needles used are very thin (typically smaller than a 30-gauge needle) and do not have a beveled tip like phlebotomy needles do. Most patients have minimal pain as the needles are inserted. During the treatment, the needles may be left alone or they may be heated or stimulated electrically. An average treatment lasts 30 to 40 minutes; many patients find the sessions relaxing.
4. Are there any adverse effects or complications of treatment?
Acupuncture is generally considered a safe therapy, with most patients experiencing no adverse effects at all. Minor adverse effects can include post-treatment fatigue, minor bruising, or vasovagal reactions from the insertion of the needles. Serious complications, such as pneumothorax, are possible, but are considered rare.20 A 2004 study estimated the incidence of severe complications to be .05 per 10,000 acupuncture treatments.21
Infections are also possible, but most reported cases were due to practitioners reusing needles.22 The standard of care in the United States is to use only sterilized, single-use needles. With this practice, infections due to acupuncture are thought to be rare.
Of note, trials that compare acupuncture to another active therapy often find that acupuncture has fewer adverse effects. This has been the case when acupuncture was compared to NSAIDs for low back pain and to topiramate for headaches.17,23
5. How does acupuncture fit into a patient’s treatment?
The simple answer is that it is often most effectively used as part of a comprehensive management plan for chronic pain.
As our understanding of the complexity of chronic pain deepens, our therapeutic armamentarium for the management of chronic pain needs to broaden. This was summed up well in a 2016 article on the multimodal management of chronic pain when the authors stated, “Many targets need more than one arrow.”24 Effective management of chronic pain involves addressing psychosocial and lifestyle factors in a patient-centered way and finding a combination of treatments that most effectively leads to improved coping and function.
It’s important to note that like medications and injections, acupuncture is a passive therapy. Although there is evidence for efficacy of improved pain with acupuncture in certain conditions, it should be combined with treatments that actively engage patients, such as exercise, behavioral treatments, development of coping skills, sleep hygiene, and educational strategies.
6. To whom do I refer patients for acupuncture treatment?
In the United States, licensed acupuncturists and physicians most commonly perform acupuncture. There are more than 50 schools that train licensed acupuncturists in the United States, and it usually takes 3 years to meet the requirements.25
SIDEBAR
Online resources
American Academy of Medical Acupuncture
www.medicalacupuncture.com
National Center for Complementary and Alternative Medicine
http://nccam.nih.gov/health/acupuncture
National Certification Commission for Acupuncture and Oriental Medicine
www.nccaom.org
Physicians are often trained through continuing medical education (CME) programs that take several months to complete. These programs often combine live lectures, distance learning, and hands-on training and are typically sponsored by a university. Most require 300 hours of CME to complete. Licensure varies by state, but in many states, having an MD or DO degree automatically allows physicians to practice acupuncture. (See “Online resources,” above for links to Web sites that can be useful in finding qualified acupuncturists in your area.)
7. Is acupuncture covered by insurance?
It depends. Insurance coverage of acupuncture is highly variable and based on region and insurance type. Medicare and Medicaid plans do not pay for acupuncture. There are some private insurance plans that do. If covered, there may be limitations regarding diagnosis, number of visits, or provider. It is best for patients to call their insurance plan directly to inquire about coverage and any limitations. If paying out of pocket, patients can expect to pay $75 to $150 per treatment session.
CORRESPONDENCE
Russell Lemmon, DO, 1100 Delaplaine Court, Madison, WI 53715; [email protected].
1. Kennedy J, Roll JM, Schraudner T, et al. Prevalence of persistent pain in the U.S. adult population: new data from the 2010 National Health Interview Survey. J Pain. 2014;15:979-984.
2. U.S. Department of Health and Human Services. NIH Fact Sheet. Pain management. Available at: https://www.report.nih.gov/nihfactsheets/ViewFactSheet.aspx?csid=57. Accessed February 12, 2018.
3. Barnes PM, Bloom B, Nahin RL. Complementary and alternative medicine use among adults and children: United States, 2007. Natl Health Stat Report. 2008;12:1-23.
4. Nahin RL, Barnes PM, Stussman BJ, et al. Costs of complementary and alternative medicine (CAM) and frequency of visits to CAM practitioners: United States, 2007. Natl Health Stat Report. 2009;18:1-14.
5. Mayer DJ, Price DD, Rafii A. Antagonism of acupuncture analgesia in man by the narcotic antagonist naloxone. Brain Res. 1977;121:368-372.
6. Ammendolia C, Furlan AD, Imamura M, et al. Evidence-informed management of chronic low back pain with needle acupuncture. Spine J. 2008;8:160-172.
7. Zhang R, Lao L, Ren K, et al. Mechanisms of acupuncture-electroacupuncture on persistent pain. Anesthesiology. 2014;120:482-503.
8. Han JS. Acupuncture analgesia: areas of consensus and controversy. Pain. 2011;152(3 Suppl):S41-S48.
9. Chou R, Deyo R, Friedly J, et al. Nonpharmacologic therapies for low back pain: a systematic review for an American College of Physicians clinical practice guideline. Ann Intern Med. 2017;166:493-505.
10. Yuan J, Purepong N, Kerr DP, et al. Effectiveness of acupuncture for low back pain: a systematic review. Spine (Phila Pa 1976). 2008;33:E887-E900.
11. Linde K, Allais G, Brinkhaus B, et al. Acupuncture for the prevention of episodic migraine. Cochrane Database Syst Rev. 2016;6:CD001218.
12. Manheimer E, Cheng K, Linde K, et al. Acupuncture for peripheral joint osteoarthritis. Cochrane Database Syst Rev. 2010;1:CD001977.
13. Lin X, Huang K, Zhu G, et al. The effects of acupuncture on chronic knee pain due to osteoarthritis: a meta-analysis. J Bone Joint Surg Am. 2016;98:1578-1585.
14. Deare JC, Zheng Z, Xue CC, et al. Acupuncture for treating fibromyalgia. Cochrane Database Syst Rev. 2013;5:CD007070.
15. Vickers AJ, Cronin AM, Maschino AC, et al. Acupuncture for chronic pain: individual patient data meta-analysis. Arch Intern Med. 2012;172:1444-1453.
16. Qaseem A, Wilt TJ, McLean RM, et al, for the Clinical Guidelines Committee of the American College of Physicians. Noninvasive treatments for acute, subacute, and chronic low back pain: a clinical practice guideline from the American College of Physicians. Ann Intern Med. 2017;166:514-530.
17. Lee JH, Choi TY, Lee MS, et al. Acupuncture for acute low back pain: a systematic review. Clin J Pain. 2013;29:172-185.
18. Mayhew E, Ernst E. Acupuncture for fibromyalgia—a systematic review of randomized clinical trials. Rheumatology (Oxford). 2007;46:801-804.
19. Langhorst J, Klose P, Musial F, et al. Efficacy of acupuncture in fibromyalgia syndrome—a systematic review with a meta-analysis of controlled clinical trials. Rheumatology (Oxford). 2010;49:778-788.
20. Lao L, Hamilton GR, Fu J, et al. Is acupuncture safe? A systematic review of case reports. Altern Ther Health Med. 2003;9:72-83.
21. White A. A cumulative review of the range and incidence of significant adverse events associated with acupuncture. Acupunct Med. 2004;22:122-133.
22. Xu S, Wang L, Cooper E, et al. Adverse events of acupuncture: a systematic review of case reports. Evid Based Complement Alternat Med. 2013:581203.
23. Linde K, Allais G, Brinkhaus B, et al. Acupuncture for migraine prophylaxis. Cochrane Database Syst Rev. 2009;1:CD001218.
24. Dale R, Stacey B. Multimodal treatment of chronic pain. Med Clin North Am. 2016;100:55-64.
25. National Certification Commission for Acupuncture and Oriental Medicine. Available at: www.nccaom.org. Accessed March 20, 2018.
1. Kennedy J, Roll JM, Schraudner T, et al. Prevalence of persistent pain in the U.S. adult population: new data from the 2010 National Health Interview Survey. J Pain. 2014;15:979-984.
2. U.S. Department of Health and Human Services. NIH Fact Sheet. Pain management. Available at: https://www.report.nih.gov/nihfactsheets/ViewFactSheet.aspx?csid=57. Accessed February 12, 2018.
3. Barnes PM, Bloom B, Nahin RL. Complementary and alternative medicine use among adults and children: United States, 2007. Natl Health Stat Report. 2008;12:1-23.
4. Nahin RL, Barnes PM, Stussman BJ, et al. Costs of complementary and alternative medicine (CAM) and frequency of visits to CAM practitioners: United States, 2007. Natl Health Stat Report. 2009;18:1-14.
5. Mayer DJ, Price DD, Rafii A. Antagonism of acupuncture analgesia in man by the narcotic antagonist naloxone. Brain Res. 1977;121:368-372.
6. Ammendolia C, Furlan AD, Imamura M, et al. Evidence-informed management of chronic low back pain with needle acupuncture. Spine J. 2008;8:160-172.
7. Zhang R, Lao L, Ren K, et al. Mechanisms of acupuncture-electroacupuncture on persistent pain. Anesthesiology. 2014;120:482-503.
8. Han JS. Acupuncture analgesia: areas of consensus and controversy. Pain. 2011;152(3 Suppl):S41-S48.
9. Chou R, Deyo R, Friedly J, et al. Nonpharmacologic therapies for low back pain: a systematic review for an American College of Physicians clinical practice guideline. Ann Intern Med. 2017;166:493-505.
10. Yuan J, Purepong N, Kerr DP, et al. Effectiveness of acupuncture for low back pain: a systematic review. Spine (Phila Pa 1976). 2008;33:E887-E900.
11. Linde K, Allais G, Brinkhaus B, et al. Acupuncture for the prevention of episodic migraine. Cochrane Database Syst Rev. 2016;6:CD001218.
12. Manheimer E, Cheng K, Linde K, et al. Acupuncture for peripheral joint osteoarthritis. Cochrane Database Syst Rev. 2010;1:CD001977.
13. Lin X, Huang K, Zhu G, et al. The effects of acupuncture on chronic knee pain due to osteoarthritis: a meta-analysis. J Bone Joint Surg Am. 2016;98:1578-1585.
14. Deare JC, Zheng Z, Xue CC, et al. Acupuncture for treating fibromyalgia. Cochrane Database Syst Rev. 2013;5:CD007070.
15. Vickers AJ, Cronin AM, Maschino AC, et al. Acupuncture for chronic pain: individual patient data meta-analysis. Arch Intern Med. 2012;172:1444-1453.
16. Qaseem A, Wilt TJ, McLean RM, et al, for the Clinical Guidelines Committee of the American College of Physicians. Noninvasive treatments for acute, subacute, and chronic low back pain: a clinical practice guideline from the American College of Physicians. Ann Intern Med. 2017;166:514-530.
17. Lee JH, Choi TY, Lee MS, et al. Acupuncture for acute low back pain: a systematic review. Clin J Pain. 2013;29:172-185.
18. Mayhew E, Ernst E. Acupuncture for fibromyalgia—a systematic review of randomized clinical trials. Rheumatology (Oxford). 2007;46:801-804.
19. Langhorst J, Klose P, Musial F, et al. Efficacy of acupuncture in fibromyalgia syndrome—a systematic review with a meta-analysis of controlled clinical trials. Rheumatology (Oxford). 2010;49:778-788.
20. Lao L, Hamilton GR, Fu J, et al. Is acupuncture safe? A systematic review of case reports. Altern Ther Health Med. 2003;9:72-83.
21. White A. A cumulative review of the range and incidence of significant adverse events associated with acupuncture. Acupunct Med. 2004;22:122-133.
22. Xu S, Wang L, Cooper E, et al. Adverse events of acupuncture: a systematic review of case reports. Evid Based Complement Alternat Med. 2013:581203.
23. Linde K, Allais G, Brinkhaus B, et al. Acupuncture for migraine prophylaxis. Cochrane Database Syst Rev. 2009;1:CD001218.
24. Dale R, Stacey B. Multimodal treatment of chronic pain. Med Clin North Am. 2016;100:55-64.
25. National Certification Commission for Acupuncture and Oriental Medicine. Available at: www.nccaom.org. Accessed March 20, 2018.
From The Journal of Family Practice | 2018;67(4):224-226,228-230.
PRACTICE RECOMMENDATIONS
› Recommend acupuncture as a prophylactic treatment for migraine headaches. A
› Recommend acupuncture as a treatment option for chronic low back pain. A
› Consider using acupuncture as an adjunctive treatment in the management of fibromyalgia symptoms. B
Strength of recommendation (SOR)
A Good-quality patient-oriented evidence
B Inconsistent or limited-quality patient-oriented evidence
C Consensus, usual practice, opinion, disease-oriented evidence, case series