User login
Could European data privacy rules cost you big?
U.S. health providers who treat foreign patients may want to take a closer look at their privacy policies to make sure they comply with new European Union data protection rules.
May 25 heralds the enforcement of the European Union’s General Data Protection Regulation (GDPR), a set of rules designed to strengthen and harmonize record protection for EU citizens and tighten how their data privacy is managed. The regulations protect various forms of electronic data including basic identity information, health and genetic data, and biometric information.

Treating a vacationing EU patient who needs unplanned treatment in the states is not likely to subject physicians to the GDPR, said Cynthia J. Larose, a privacy and data security attorney based in Boston.
“In general, the GDPR should not impact U.S. doctors who may incidentally treat an EU patient while that patient is here in the U.S.,” Ms. Larose said in an interview … If the EU patient presents at a U.S. health care provider for treatment, then the GDPR does not apply to her personal data in the possession of the U.S. health care provider – HIPAA applies. While the [GDPR] does have extraterritorial reach, you have to be doing something in the EU for the GDPR to apply.”
But other scenarios that could prove problematic, such as U.S. researchers studying patients in the EU, U.S. physicians providing telemedicine care to EU patients, and doctors who continue to monitor EU patients following treatment in the United States once patients return to their home country.
About 200,000 international visitors fly to the United States yearly for health treatment, of whom about 25% are from Europe, according to a 2015 report by the United States International Trade Commission.
Advertising medical services in the European Union is another way that U.S. physicians could be subject to the GDPR. For example, if a practice or hospital markets their specialty care on websites or other materials in the EU, this could fall under the GDPR umbrella, according to security experts.
“If you are advertising services to patients in the EU, and then they decide to obtain such services, that could trigger GDPR because the data subjects are in the EU and you are offering services to them,” said Elaine C. Zacharakis Loumbas, a health and security law attorney based in Chicago. “It becomes very fact specific.”

Like HIPAA, the GDPR requires that health providers disclose information to patients about where and how their data may be used. Mr. Barchie notes that in the United States, patient consent forms may generally include two or three potential uses for patient data such as marketing and medical research. The GDPR specifies that each potential usage of patient data requires its own separate consent form, he said.
“Let’s say you’re a clinic that specializes in diabetes [and] you’re used to taking data and sending it to a general database to [collect information] about diabetes,” Mr. Barchie said. “You can’t do that under GDPR. You would have to have a separate consent form for that. So one consent to provide your diabetes service, one consent form to maybe market to the [patient], and a separate consent form [regarding] the database.”
GDPR also requires the minimizing of personal data copies stored within multiple systems. In the United States, it’s not uncommon for there to be multiple copies of a person’s data in several places, which makes sense from an IT perspective, Mr. Barchie said. The GDPR however requires that data keepers limit the number of copies they maintain to only the most necessary information.
“[Under GDPR], you should send only the data that you need for that particular process,” he said. “For example, [in the case of] address, user name, and patient ID. If you only need the patient ID number, you should not send the patient name and address. You minimize the amount of data that you’re sending to be processed.”
Breach notification also is more stringent under the GDPR, compared with U.S. regulations. Under HIPAA, covered entities must notify the U.S. Department of Health & Human Services and affected patients of a data breach without unreasonable delay no later than 60 days following discovery of a breach. The GDPR requires that effected entities notify the supervisory authority “without undue delay and, where feasible, not later than 72 hours after having become aware of [the breach].” (The GDPR supervisory authority depends on the EU country affected.)
If determined that the personal data breach is “likely to result in a high risk to the rights and freedoms of individuals,” efforts must be made to communicate about the personal data breach with the affected data subjects “without undue delay,” according to the rules.
If unsure of whether your practices may fall under GDPR, experts advise discussing the question with a legal counselor, GDPR expert, or risk management team.
U.S. health providers who treat foreign patients may want to take a closer look at their privacy policies to make sure they comply with new European Union data protection rules.
May 25 heralds the enforcement of the European Union’s General Data Protection Regulation (GDPR), a set of rules designed to strengthen and harmonize record protection for EU citizens and tighten how their data privacy is managed. The regulations protect various forms of electronic data including basic identity information, health and genetic data, and biometric information.
Treating a vacationing EU patient who needs unplanned treatment in the states is not likely to subject physicians to the GDPR, said Cynthia J. Larose, a privacy and data security attorney based in Boston.
“In general, the GDPR should not impact U.S. doctors who may incidentally treat an EU patient while that patient is here in the U.S.,” Ms. Larose said in an interview … If the EU patient presents at a U.S. health care provider for treatment, then the GDPR does not apply to her personal data in the possession of the U.S. health care provider – HIPAA applies. While the [GDPR] does have extraterritorial reach, you have to be doing something in the EU for the GDPR to apply.”
But other scenarios that could prove problematic, such as U.S. researchers studying patients in the EU, U.S. physicians providing telemedicine care to EU patients, and doctors who continue to monitor EU patients following treatment in the United States once patients return to their home country.
About 200,000 international visitors fly to the United States yearly for health treatment, of whom about 25% are from Europe, according to a 2015 report by the United States International Trade Commission.
Advertising medical services in the European Union is another way that U.S. physicians could be subject to the GDPR. For example, if a practice or hospital markets their specialty care on websites or other materials in the EU, this could fall under the GDPR umbrella, according to security experts.
“If you are advertising services to patients in the EU, and then they decide to obtain such services, that could trigger GDPR because the data subjects are in the EU and you are offering services to them,” said Elaine C. Zacharakis Loumbas, a health and security law attorney based in Chicago. “It becomes very fact specific.”
Like HIPAA, the GDPR requires that health providers disclose information to patients about where and how their data may be used. Mr. Barchie notes that in the United States, patient consent forms may generally include two or three potential uses for patient data such as marketing and medical research. The GDPR specifies that each potential usage of patient data requires its own separate consent form, he said.
“Let’s say you’re a clinic that specializes in diabetes [and] you’re used to taking data and sending it to a general database to [collect information] about diabetes,” Mr. Barchie said. “You can’t do that under GDPR. You would have to have a separate consent form for that. So one consent to provide your diabetes service, one consent form to maybe market to the [patient], and a separate consent form [regarding] the database.”
GDPR also requires the minimizing of personal data copies stored within multiple systems. In the United States, it’s not uncommon for there to be multiple copies of a person’s data in several places, which makes sense from an IT perspective, Mr. Barchie said. The GDPR however requires that data keepers limit the number of copies they maintain to only the most necessary information.
“[Under GDPR], you should send only the data that you need for that particular process,” he said. “For example, [in the case of] address, user name, and patient ID. If you only need the patient ID number, you should not send the patient name and address. You minimize the amount of data that you’re sending to be processed.”
Breach notification also is more stringent under the GDPR, compared with U.S. regulations. Under HIPAA, covered entities must notify the U.S. Department of Health & Human Services and affected patients of a data breach without unreasonable delay no later than 60 days following discovery of a breach. The GDPR requires that effected entities notify the supervisory authority “without undue delay and, where feasible, not later than 72 hours after having become aware of [the breach].” (The GDPR supervisory authority depends on the EU country affected.)
If determined that the personal data breach is “likely to result in a high risk to the rights and freedoms of individuals,” efforts must be made to communicate about the personal data breach with the affected data subjects “without undue delay,” according to the rules.
If unsure of whether your practices may fall under GDPR, experts advise discussing the question with a legal counselor, GDPR expert, or risk management team.
Optimal surgical management of stage 3 and 4 pelvic organ prolapse
Effective surgical management of advanced pelvic organ prolapse (POP) depends on prolapse location and stage, presence of urinary incontinence, need for hysterectomy, the patient’s desire to maintain sexual function, type of surgery, and the surgeon’s skill and experience, among other factors. For these reasons, POP repair is not a one-size-fits all procedure.
In this article, experts in minimally invasive prolapse repair offer their perspectives on 3 surgical approaches: use of native tissue (Drs. White, Aguilar, and Rogers), abdominal sacrocolpopexy (Drs. Huber and Culligan), and transvaginal mesh (Drs. Lucente and Ton). They evaluate the evidence on these procedures and provide recommendations based on their experience of best practices for achieving surgical success and minimizing adverse events.
Using native tissue for vaginal anatomy repair
Amanda White, MD; Vivian Aguilar, MD; and Rebecca G. Rogers, MD
Dr. Rogers reports that she receives royalties from UpToDate. Drs. White and Aguilar report no financial relationships relevant to this article.
Surgical therapy is the mainstay of treatment for POP, and 20% of US women will undergo prolapse and/or stress incontinence surgery by age 80.1 Prolapse surgery either restores the vaginal anatomy (reconstructive surgery) or obliterates the vaginal canal (obliterative surgery). Vaginal reconstruction can be performed using the patient's native tissue or mesh. Because of concerns associated with mesh use, native tissue repairs continue to be commonly performed.
Unfortunately, not all prolapse surgeries result in prolapse cure, and recurrent prolapse that necessitates repeat operation is not rare, regardless of whether or not mesh is used.2,3 Native tissue repairs are most commonly performed through the vaginal route, the first minimally invasive approach to prolapse surgery. Restoration of the vaginal apex has been identified as critically important in these surgeries. Apical native tissue repairs include reconstructive procedures, such as sacrospinous ligament suspension (SSLS) or uterosacral ligament suspension (USLS), and obliterative procedures, such as colpocleisis.
In this discussion, we present 2 case vignettes that highlight surgical decision making for repair of stage 3 or 4 pelvic organ prolapse utilizing these techniques.
- Native tissue repair offers a minimally invasive approach to prolapse repair.
- Sacrospinous and uterosacral ligament suspensions have equivalent success rates.
- Prophylactic midurethral slings reduce postoperative incontinence at the time of transvaginal native tissue repair.
- Hysterectomy at the time of colpocleisis should not be performed routinely.
CASE 1 Active woman with prolapse
A 65-year-old woman (G2P2) presents with stage 3 prolapse, with the anterior compartment at +3 and the cervix at the hymen with straining. She is sexually active and desires to retain coital function. A trial of pessary has failed.
What surgical options can be considered for this patient?
Reconstruction procedures for prolapse
This patient presents with a typical configuration of prolapse; the anterior and apical compartments are the most likely to prolapse.4 Importantly, conservative management of her prolapse has failed. While it is not required that women have a trial with pessary prior to undergoing surgery, all women should be offered conservative management of prolapse, according to the American Urogynecologic Society (AUGS) and the American College of Obstetricians and Gynecologists (ACOG).4,5
Apical suspension
Since this patient desires to retain coital function, her gynecologist recommends a reconstructive procedure. The combination of apical and anterior vaginal wall prolapse will require an apical suspension procedure (FIGURES 1 and 2). If suspension of the apex does not correct the anterior wall prolapse, the patient also may require anterior compartment reconstruction.
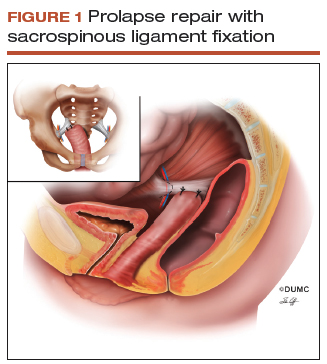
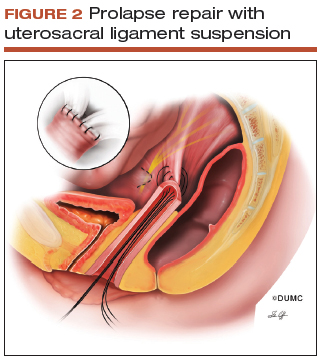
The 2 most commonly performed native tissue apical suspension procedures, SSLS and USLS, have equivalent outcomes at 2 years, according to a multicenter randomized trial.6 Therefore, the choice of procedure is at the surgeon's discretion. USLS is most commonly performed at the time of hysterectomy via an intraperitoneal approach, while SSLS is often selected for posthysterectomy vault prolapse, given its extraperitoneal location.
Suture type. Whether to use permanent suture at the time of SSLS or USLS is controversial. Some data suggest that permanent suture provides greater long-term success compared with delayed absorbable suture.7 However, permanent suture has been reported to be associated with higher rates of suture complications--up to 44% in USLS and 36% in SSLS--compared with a 3.5% complication rate in a USLS cohort treated with absorbable suture.8-10
Hysterectomy versus hysteropexy. Considerable debate exists regarding whether a patient requires hysterectomy at the time of prolapse repair. In a randomized trial at 12 months' follow-up, uterine preservation by sacrospinous hysteropexy was noninferior to vaginal hysterectomy with suspension of the uterosacral ligaments for surgical failure of the apical compartment.11 A recent meta-analysis found that apical failure rates after sacrospinous hysteropexy versus vaginal hysterectomy were not different.12 Repeat surgery rates for prolapse also were not different between groups. The most significant disadvantage of uterine-preservation prolapse surgery, when compared with hysterectomy, is the lack of prevention and diagnosis of uterine malignancy.12 From 2002 to 2012, rates of hysteropexy significantly increased in the United States, although rates remain low.13
Sling procedure pros and cons. This case patient did not report urinary incontinence, but she may develop incontinence with reduction of the anterior wall prolapse. A large randomized controlled trial that included 337 women compared sling with no sling procedures among women with prolapse undergoing transvaginal prolapse repair.14 Management with a prophylactic sling resulted in less incontinence (27.3% and 43.0%, respectively, at 12 months postoperatively) but higher rates of urinary tract infection (31.0% vs 18.3%), major bleeding complications (3.1% vs 0%), and incomplete bladder emptying 6 weeks after surgery (3.7% vs 0%) (P≤.05 for all).14
CASE 1 Recommendations for this patient
For this case, we would offer the patient a transvaginal hysterectomy and USLS. At the time of repair, we would assess whether she needed an anterior repair as well. We would offer a prophylactic sling procedure and also would discuss the risks and benefits of concomitant versus interval incontinence procedures.
CASE 2 Elderly woman with severe prolapse
An 85-year-old woman (G3P3) presents with procidentia, or complete eversion of the vagina, with the cervix 10 cm outside of the hymen. She has difficulty voiding, and the prolapse is uncomfortable when walking. A trial of pessary has failed. The patient denies vaginal bleeding. She is not sexually active and does not desire to retain coital function.
What treatment options would be appropriate for this patient?
Obliterative surgery
This elderly patient presents with advanced pelvic organ prolapse, and conservative management has failed. She is not sexually active and does not desire coital function in the future, so an obliterative procedure is indicated. Colpocleisis is a minimally invasive procedure that has cure rates ranging from 91% to 100%.15 It is likely that this patient's voiding dysfunction will improve after surgery and that she will be highly satisfied with the surgery.16
The question of hysterectomy with colpocleisis
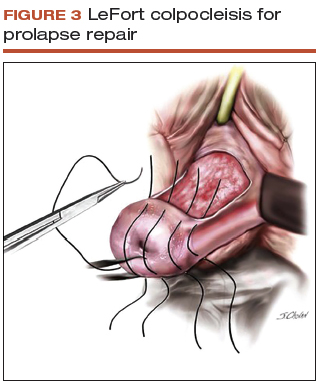
The role of hysterectomy at the time of colpocleisis is controversial. LeFort colpocleisis preserves the uterus, with the anterior and posterior vaginal walls sutured together (FIGURE 3). Hysterectomy at the time of vaginal closure increases the operative time and blood loss.15 On the other hand, closure without hysterectomy prohibits future endometrial or cervical cancer screening.
In a recent review using the American College of Surgeons National Surgical Quality Improvement Program database, investigators compared women who underwent colopocleisis alone with those who underwent colpocleisis with hysterectomy.17 They found that the incidence of major complications was greater among women who underwent concomitant hysterectomy, and they concluded that hysterectomy should not be performed routinely at the time of colpocleisis.17
Among 322 urogynecologists who responded to a web-based survey, only 18% routinely performed hysterectomy at the time of colpocleisis.18 Further, in a decision analysis model, the utility for colpocleisis without hysterectomy was higher in women older than age 40, suggesting that hysterectomy should be performed only in special circumstances.19
Evaluating the endometrium. If the uterus remains in situ, should endometrial evaluation be performed? If so, should ultrasonography or endometrial biopsy be used? Authors of a decision analysis model found that among women at low risk for cancer and without abnormal uterine bleeding, endometrial biopsy was not favored until the probability of cancer reached 64%.20 Specifically, no evaluation or evaluation by transvaginal ultrasonography is adequate in the majority of cases.20 When screened by transvaginal ultrasonography, the high, 99% negative predictive value for endometrial disease, using a cutoff value of 5 mm for endometrial stripe width, will allow most patients to avoid unnecessary tissue sampling.
Stress incontinence. It is likely that this patient's voiding dysfunction will resolve with reduction of the prolapse, and she may develop stress incontinence symptoms. In up to 68% of women, occult stress incontinence will be revealed with reduction of stage 3 or stage 4 prolapse.21 If the patient demonstrates stress incontinence, a midurethral sling is likely to treat her incontinence effectively, with little added risk from the procedure.22 Even among women who have an elevated postvoid residual urine volume, the incidence of sling revision is low.15
CASE 2 Procedure recommendation for this patient
For this case, we would perform a LeFort colpocleisis and discuss whether or not the patient would prefer a midurethral sling if stress incontinence was demonstrated on examination. We would not perform endometrial evaluation in this patient, as she has not been bleeding and her risk for endometrial cancer is low.
Weighing the benefits of native tissue repair
Native tissue repair when performed transvaginally is a minimally invasive approach to prolapse repair. In a multicenter randomized trial, anatomic success was reported to be 64.5% at 2 years.6 Long-term follow up of patients undergoing mesh sacrocolpopexy shows a similar anatomic failure rate, with up to one-third of patients meeting the definition of composite failure.3 Unlike mesh-augmented repairs, however, adverse events, including bowel obstruction, mesh exposure, and thromboembolism, are more likely to occur in the mesh sacrocolpopexy group.23
Obliterative procedures have the highest success rates of all prolapse repairs and carry with them low morbidity. However, women must forego the ability for coitus in the future. For all native tissue vaginal repairs, the surgeon and patient must weigh the risks and benefits of concomitant anti-incontinence procedures.
Read about using abdominal sacrocolpopexy for apical prolapse repair.
Abdominal sacrocolpopexy: A tried-and-true approach for apical prolapse repair
Sarah Huber, MD, and Patrick Culligan, MD
Dr. Culligan reports that he is a shareholder in Oragami Surgical LLC and a consultant and speaker for Coloplast and Intuitive Surgical Inc. Dr. Huber reports no financial relationships relevant to this article.
CASE Woman with advanced prolapse desires surgical repair
A 55-year-old woman (G2P2) presents to her gynecologist's office reporting a vaginal bulge and pressure that has been worsening for the past year. She describes a nontender ball of tissue the size of an orange protruding past the introitus that worsens with ambulating and lifting heavy objects. She reports some urinary urgency and increased frequency and at times feels as though her bladder does not empty completely with voiding. She denies any urinary incontinence. The patient has regular bowel movements but does report some difficulty with stool evacuation. She has a history of 2 vaginal deliveries and is sexually active. She is postmenopausal, with the last menses about 4 years ago. She is active and exercises regularly.
The patient's Pap smears, mammograms, and colonoscopy are up to date and test results have been normal. She has no significant medical or surgical history and no significant family history of cancer. On examination, her body mass index is normal, as is the cardiopulmonary exam. Her pelvic organ prolapse quantification system (POP-Q) score is Aa +3, Ba +3, C +4, GH 3, PB 3, TVL 10, Ap +2, Bp +2, and D +2. The patient is interested in surgical management.
What urodynamic tests would be appropriate for this patient, and what treatment options would you recommend?
- Robot-assisted laparoscopic sacrocolpopexy is a safe, effective, and durable treatment for advanced-stage pelvic organ prolapse.
- This procedure can completely correct stage 3 or 4 prolapse when the dissection of the anterior vaginal wall extends to the bladder neck and the dissection of the posterior vaginal wall extends to the perineal body.
- One can avoid the need for concomitant vaginal prolapse repair by gathering up stretched out vaginal epithelium while suturing to the mesh arms.
- Sacral attachment sutures should be placed in the anterior longitudinal ligament distal to the sacral promontory to avoid the L5-S1 disc.
- Unless contraindicated, lightweight macroporous polypropylene mesh is the current implant of choice.
Additional tests needed
Patients with advanced-stage pelvic organ prolapse are at an increased risk for stress urinary incontinence that may be masked by urethral "kinking" due to anatomic distortion of the periurethral support mechanism. Based on recommendations from the American Urological Association (AUA) and Society of Urodynamics, Female Pelvic Medicine and Urogenital Reconstruction (SUFU), we routinely perform a postvoid residual urine volume measurement, urinalysis, urine culture, and a prolapse reduction stress test.24 If the urinalysis is positive for blood, then a preoperative cystoscopy would be indicated.
If stress incontinence is confirmed by reduction stress testing, the patient should be offered an anti-incontinence procedure, such as a mesh midurethral sling.
This patient's overactive bladder symptoms warrant investigation via complex urodynamic testing to allow for comprehensive counseling about her postoperative expectations.
Counseling the patient on the sacrocolpopexy option
Abdominal sacrocolpopexy initially was described in 1962 by Lane as a technique to affix the vaginal apex to the sacral promontory using a graft. Although the procedure has been modified over the years, the principles of using an implanted strengthening material to permanently attach the apex to the anterior longitudinal ligament at the sacrum has proven to be a highly effective and safe treatment, establishing it as the gold standard for apical prolapse repair.25,26
Compared with other methods of apical prolapse repair, sacrocolpopexy via any approach is superior to vaginal surgery in terms of subjective and objective outcomes. In a recent systematic review comparing apical prolapse repairs, patients who underwent a vaginal approach were more likely to report awareness of their prolapse after surgery, undergo repeat surgery, have objective recurrent prolapse, and were at increased risk for postoperative stress urinary incontinence and dyspareunia.26 Prospective studies within our practice have shown 1-year composite subjective and objective cure rates of 94% to 95%.27,28
Selecting a route for sacrocolpopexy
Although sacrocolpopexy can be approached via laparotomy or conventional laparoscopy, we routinely use a robot-assisted approach, as it has been shown to be especially beneficial for complex situations, such as in patients with prior pelvic surgery, a foreshortened vagina, or obesity.29,30
Potential complications
Sacrocolpopexy complications are rare, especially when a minimally invasive approach is used.31 Reported complications of minimally invasive sacrocolpopexy include gastrointestinal or genitourinary injury, bowel obstruction or ileus, incisional hernia, vascular injury, discitis or osteomyelitis, conversion to open procedure, and mesh exposure.
Vaginal mesh exposure is rare following sacrocolpopexy, but it can occur at any time following surgery.31 Some risk factors include mesh material selection (specifically polytetrafluoroethylene [PTFE] mesh), concurrent total hysterectomy, vaginal atrophy, and smoking.32,33 As a result, recent recommendations have advised the use of polypropylene mesh with uterine preservation or supracervical hysterectomy at the time of sacrocolpopexy.34 In fact, supracervical hysterectomy alone appears to cut down or eliminate the risk of mesh exposure in laparoscopic sacrocolpopexy.35
In our practice, avoiding split-thickness vaginal dissection, employing supracervical hysterectomy techniques, and using ultralightweight mesh has resulted in mesh exposure rates approaching zero.28
For atrophic vaginal tissue, one can consider prescribing preoperative vaginal estrogen for 4 to 6 weeks, but this is not essential and should not routinely delay pelvic reconstructive surgery.
What type of implant material is best?
While various materials have been used as the fixation media in sacrocolpopexy, loosely knitted synthetic type I macroporous polypropylene mesh is the best choice due to its efficacy, availability, and low adverse effect profile. We recommend a lightweight mesh with a maximum weight of 25 g/m2. Two such products currently available are the UPsylon Y-Mesh (Boston Scientific, Marlborough, Massachusetts) and Restorelle Y mesh (Coloplast, Minneapolis, Minnesota). Lightweight mesh has been proven to maintain integrity, guaranteeing a successful outcome, while reducing the "mesh load" on the attached tissue.27,28
Comparative studies with fascia lata or cross-linked porcine dermal grafts demonstrated inferior outcomes versus synthetic mesh, and currently the only biologic material on the market indicated for prolapse repair augmentation, ACell Pelvic Floor Matrix (ACell, Columbia, Maryland), has not been extensively tested in sacrocolpopexy.36-38
Vaginal anatomy restored by sacrocolpopexy
Abdominal sacrocolpopexy, specifically via a minimally invasive approach, is an effective and long-lasting treatment that should be offered to women with advanced-stage prolapse.
Using the surgical techniques described below, including attachment of the mesh along the lengths of the anterior and posterior vaginal walls and gathering up excess tissue with mesh attachment, can provide women with adequate support for the entire vagina with restoration of normal vaginal anatomy and caliber.
Step-by-step tips for surgical efficiency
Robotic port placement
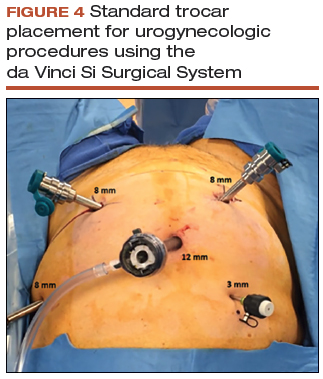
- Place the trocars in a "W" layout for the da Vinci Si Surgical System (FIGURE 4, VIDEO 1) or in a linear layout for the da Vinci Xi Surgical System (Intuitive Surgical, Sunnyvale, California). Both Si and Xi port placement includes a 3- to 5-mm assistant port in the right upper quadrant of the abdomen.
Supracervical hysterectomy, if indicated
- Maneuver the uterus with the robotic tenaculum, which obviates the need for a uterine manipulator during the hysterectomy (VIDEO 2).
- Create the bladder flap just above the upper edge of the bladder to facilitate the upcoming anterior wall dissection. This helps to prevent the development of a split-thickness dissection plane.
- 1.5 to 2 cm of cervix should be left in place, and conization should be avoided.
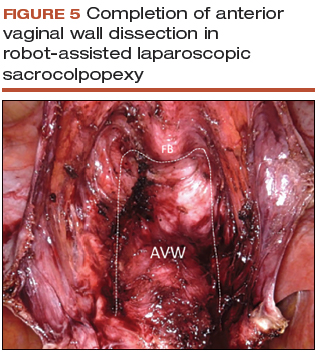
Anterior vaginal wall dissection
- The key to a good full-thickness dissection is sustained tissue traction and countertraction. The bedside assistant pulls the anterior peritoneal cut edge anteriorly for "gross" traction, and further "fine" traction can be created by pulling the areolar tissue with robotic forceps. The cervix is grasped with the tenaculum, which applies a constant midline cephalad countertraction (VIDEO 3).
- Sharp dissection with cold scissors allows for creation of the dissection plane, while cautery is judiciously applied only for hemostasis. If bleeding is encountered, this usually indicates that a split thickness of the vaginal wall has been created, and the surgeon should correct to the proper dissection plane.
- Dissection is made easier by taking down the bladder pillars before advancing down toward the bladder neck.
- The anterior dissection is always carried down to level of the trigone, confirmed by visualization of the Foley bulb (FIGURE 5).
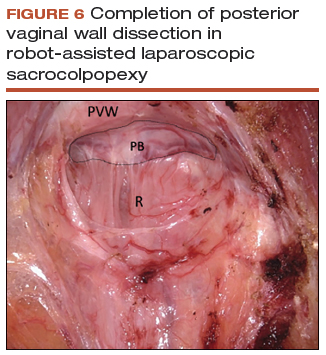
Posterior vaginal wall dissection
- Begin dissection just above the rectal reflection, leaving peritoneum on the posterior cervix (VIDEO 4).
- Extend the incision bilaterally to the uterosacral ligaments only after the correct dissection plane is confirmed by visualization of the areolar tissue.
- Apply cervical traction using the tenaculum in a cephalad midline direction, and place traction on the cut edge of the posterior peritoneum using the bipolar forceps. The tenaculum wrist must be turned away from the working instruments to avoid internal clashing.
- Completely transect the right uterosacral ligament to better facilitate the creation of a contiguous peritoneal opening for burying the mesh. The remainder of the opening will be created later.
- While it is important to avoid split-thickness dissection, the vaginal plane must be "clean" (that is, without fat or adventitia) to allow for robust suturing.
- Dissection at least halfway down the posterior vaginal wall is recommended but proceeding down to the perineal body provides the most optimal support (FIGURE 6).
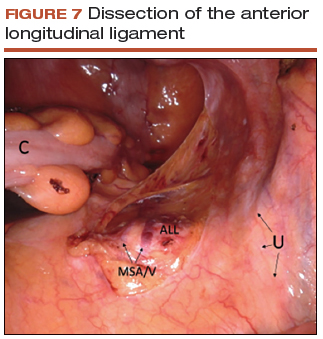
Sacral dissection
- Use a noncrushing instrument to laterally sweep the bowel to the left side, effectively "plastering" the peritoneum over the sacral promontory (FIGURE 7; VIDEO 5).
- Extend the superficial peritoneal incision down the right paracolic gutter halfway between the ureter and colon until it communicates with the incised posterior peritoneal edge created during the posterior dissection.
- Identify the middle sacral artery to avoid vascular injury, but there is no need to prophylactically coagulate it.
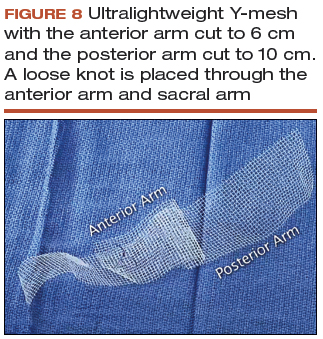
Vaginal mesh attachment
- Cut a lightweight Y-mesh to a length of 6 to 8 cm anteriorly and 8 to 11 cm posteriorly and place it into the surgical field (FIGURE 8; VIDEO 6). The length is determined based on the preoperative office examination and examination under anesthesia prior to starting the procedure.
- Attach the mesh securely and evenly to the anterior and posterior vaginal walls using multiple interrupted monofilament sutures. We aim to place sutures that provide mesh stability without excess vaginal wall incorporation to avoid "through-and-through" suturing.
- The posterior wall suturing is performed first, starting at the perineal body and continuing cephalad (VIDEO 7). We find it easiest to tie the knots between the mesh and the vagina in this space.
- Suture the crotch of the Y-mesh to the cervix so that no gap exists between tissue and mesh.
- For advanced-stage prolapse with significant anterior prolapse, the stretched out vaginal epithelium can be systematically gathered up to reconfigure the tissue to conform to the desired mesh dimensions (VIDEO 8). This tissue remodeling is evident even at the 2- to 4-week postoperative visit.
Peritoneal closure: Step 1
- Reapproximate the cut edges of peritoneum surrounding the vagina and cervix using a continuous purse-string suture of 0 Monocryl (poliglecaprone 25) on an SH needle (Ethicon, Somerville, New Jersey) with a fisherman's knot tied at the end (VIDEO 9). The needle passes are placed close together and close to the incised edge of the cut peritoneum.
- We typically start our peritoneal suture at the 5 o'clock position of the posterior peritoneum, extending in a clockwise direction and ultimately jumping anteriorly around the sacral arm of the mesh.
- Place the mesh within the paracolic peritoneal canal, and secure the needle for later use.
Sacral mesh attachment
- The mesh is tensioned so that a vaginal examination confirms adequate support of all the walls without excess tension or tissue banding. Some laxity of the anterior vaginal wall consistent with a mild cystocele is appropriate.
- Place 2 permanent PTFE sutures along the slope of the sacral promontory into the anterior longitudinal ligament (VIDEO 10). This avoids injury to the disc space that sits at the edge of the promontory. We do not advise the use of bone anchors as they increase the risk for discitis and osteomyelitis.
- Secure the mesh to the anterior longitudinal ligament without any tension. This is facilitated by creating mesh slack via cephalad pressure from a vaginal probe.
Peritoneal closure: Step 2
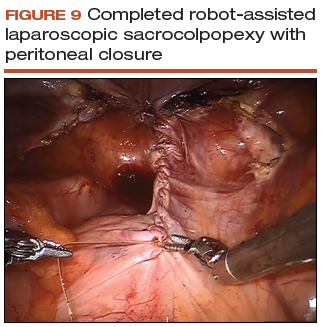
- Close the remaining paracolic peritoneal incision, completely burying the mesh within the created canal (FIGURE 9).
- At the end of the procedure, perform a repeat vaginal exam, rectal exam, and cystoscopy.
Technique with prior total hysterectomy
- In patients with a prior total hysterectomy, place a 13 x 3.5 cm Breisky vaginal retractor and/or coated nonconductive stent (Marina Medical, Sunrise, Florida) into the vagina to delineate the anterior and posterior walls at the vaginal apex during dissection.
- Some surgeons may opt to retrograde fill the bladder to better identify its location.
- We routinely leave a segment of peritoneum attached to the dome of the vaginal apex for added tissue integrity to prevent erosion.
Read about using transvaginal mesh for POP repair.
Transvaginal mesh: An effective, durable option for POP repair
Vincent R. Lucente, MD, MBA, and Jessica B. Ton, MD
Dr. Lucente reports that he has received grant or research support from Advanced Tactile Imaging, Boston Scientific, Coloplast, and Valencia; is a consultant to Coloplast; is a speaker for Allergan, Boston Scientific, Coloplast, and Shionogi; and serves as an expert witness for American Medical Systems and C.R. Bard. Dr. Ton reports no financial relationships relevant to this article.
As baseline health in the elderly population continues to improve, the number of women in the United States with symptomatic POP will increase by approximately 50% by 2050.39 Unfortunately, after native tissue repair (NTR) the rate of prolapse recurrence is extremely high: approximately 40% regardless of approach, as demonstrated in the OPTIMAL (Operations and Pelvic Muscle Training in the Management of Apical Support Loss) trial by Barber and colleagues.6 The authors of that clinical trial recently revealed that at the 5-year follow-up, these failure rates progressed to 70% for sacrospinous ligament fixation and 61% for uterosacral ligament suspension (data presented at the Society of Gynecologic Surgeons Annual Scientific Meeting 2018, Orlando, Florida). This establishes that NTR is not durable enough to meet the increasing physical demands of this age group and that mesh augmentation must be considered.
For patients at increased risk of prolapse recurrence, using transvaginal mesh (TVM) is the most minimally invasive approach and is an excellent option for mesh augmentation. Avoiding adverse events during placement of TVM depends largely on optimal surgical technique.40 (VIDEO: “Demonstration of an anterior vaginal wall dissection into the true vesicovaginal space”)
- Active advanced age requires a durable reconstructive pelvic surgery for pelvic organ prolapse, and native tissue repair does not meet that demand.
- Mesh augmentation reduces the risk of prolapse recurrence, and vaginal placement of mesh is the most minimally invasive approach.
- Rates of exposure with transvaginal mesh would be minimized with use of a full-thickness vaginal wall dissection.
- Optimal surgical technique could be highly reproducible with better surgical training.
The evidence on TVM versus NTR
Several studies have examined whether TVM has a measurable benefit over NTR.
A 2016 Cochrane review by Maher and colleagues included 37 randomized trials (4,023 women) that compared TVM and biologic grafts with NTR.41 Three primary outcomes were defined: awareness of prolapse, recurrence, and repeat surgery. Compared with women treated with NTR, those treated with synthetic nonabsorbable TVM exhibited a greater reduction in awareness of prolapse (risk ratio [RR], 0.66; 95% confidence interval [CI], 0.54-0.81), decreased recurrence in the anterior compartment (RR, 0.33; 95% CI, 0.26-0.40), and decreased reoperation for prolapse (RR, 0.53; 95% CI, 0.31-0.88). The overall calculated exposure rate was 12%, with a range of 3.2% to 20.8%.41 As we will discuss, this wide range most likely is attributed to a suboptimal, split-thickness dissection. There were no differences in other key secondary outcomes, including dyspareunia, operating time, and estimated blood loss.41
Longitudinal studies are emerging as almost 2 decades have passed since TVM was introduced. In a study of 5-year follow-up after TVM placement, Meyer and colleagues reported that patients had continued significant improvements in both subjective and objective outcomes.42 The mesh exposure rate was 6%, attributed to severe vaginal atrophy.42 A 10-year observational study by Weintraub and colleagues demonstrated a recurrence rate of only 2.6% in the anterior compartment, 7.6% in the posterior (nonaugmented) compartment, and no exposures or extrusions after anterior TVM placement.43
In contrast to the Cochrane review, in the 2017 multicenter PROSPECT (Prolapse surgery: Pragmatic evaluation and randomized controlled trials) trial, Glazener and colleagues found no difference in desired outcomes with TVM compared with NTR.44 There was an overall 6% to 7% exposure rate over 2 years.44 To reflect "real-world" practice, however, this study was intentionally designed without rigorous standardization of surgical technique. The authors reported that "appropriately experienced surgeons" performed the procedure, but it is unclear how experience was determined given that 20% of the cases were performed by "registrars," the equivalent of US residents or fellows.45
The PROSPECT study protocol described the TVM procedure as "a standard repair with a nonabsorbable mesh inlay to support the stitches," implying that there was no apical attachment of the mesh to the sacrospinous ligament.45 This is a suboptimal use of TVM because it does not address a detachment-type defect common in advanced prolapse. The PROSPECT study reinforces the need for better surgical training and standardization of the TVM procedure.44
How TVM compares with sacrocolpopexy
When comparing the use of TVM with sacrocolpopexy, our experience has been that TVM yields similar outcomes to sacrocolpopexy with additional benefits. We completed a 1-year retrospective cohort study comparing robot-assisted laparoscopic sacrocolpopexy (RALS) with TVM in a total of 86 patients, with both approaches performed by the same surgeon. Both treatment groups showed statistically significant improvements in nearly all functional and quality-of-life measures, including urinary symptoms, sexual function, and POP-Q scores.40 In particular, points Aa and Ba on the POP-Q score were significantly improved with TVM as compared to RALS. This suggests that TVM can achieve both lateral and apical support, where sacrocolpopexy addresses only the apex.40 This has clinical significance when considering DeLancey and colleagues' dynamic magnetic resonance imaging study, which demonstrated advanced prolapse results from both lateral and apical detachment.46 In addition, TVM placement also was considerably faster than RALS by approximately 96 minutes and could be performed using regional anesthesia. Only 1 mesh exposure in each study arm was reported.40
Finally, as with other vaginal procedures, patients who undergo TVM placement require minimal to no pain medication postoperatively and report faster return to daily activities. Almost none of our patients require narcotics, which is a significant benefit in the face of the ongoing national opioid crisis.
Gutman and colleagues compared laparoscopic mesh hysteropexy with TVM; they demonstrated comparable cure rates and, again, significantly longer operative times for the laparoscopic approach (174 vs 64 minutes; P<.0001).47 This multicenter study reported mesh exposure rates of 2.7% for laparoscopy and 6.6% for TVM,47 again likely due to a split-thickness dissection.
Safety of TVM depends on the surgeon factor
Because of the reported complications associated with TVM, in 2011 the US Food and Drug Administration (FDA) issued an update on the safety and efficacy of TVM augmentation and mandated postmarket studies.48 While we do not dispute that the mesh exposure rates were accurate at the time the FDA document was issued, we recognize that exposure has been erroneously attributed to inherent properties of the mesh.
Mesh exposure rates reported in the literature vary widely, ranging from 0% to 30%, even when surgeons used identical mesh products.49 This clearly establishes that the main contributing variable is surgical technique. It is critically important to recognize the "surgeon factor" as a confounder in trials that compare surgical procedures.50 Studies on TVM have shown that low-volume surgeons had significantly higher reoperation rates, while high-volume surgeons achieved a 41% reduction in reoperations.51,52 When TVM is performed by expert surgeons, the reported mesh exposure rates for TVM are noticeably lower.40,42,43,53,54
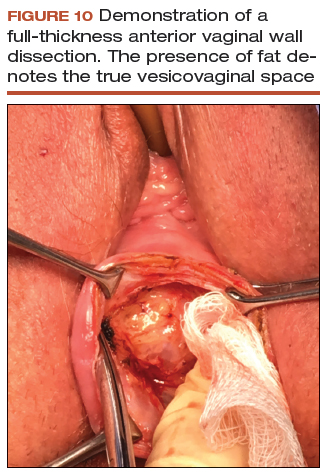
Decreasing mesh exposure rates would reduce the most common adverse event associated with TVM, thus improving its safety. The critical step to successful TVM placement is the initial dissection. Gynecologists traditionally have performed a split-thickness, colporrhaphy-style dissection to place the mesh within the layers of the vaginal wall.55 Placement within these planes, however, is too superficial and increases the risk of exposure. By contrast, by consistently performing a full-thickness vaginal wall dissection (FIGURE 10) and placing the mesh in the true vesicovaginal space,56 we have achieved a TVM exposure rate as low as 0% to 3%.40,54 If we can standardize the dissection component across our subspecialty, the rate of mesh exposure undoubtedly will decrease.
The PROSPECT investigators readily admitted what the study was not: a trial conducted "exclusively by the most experienced surgeons in the highest volume centres¬with a highly protocolised technique."44 In reality, that is the kind of rigorous study on TVM that our subspecialty demands. We must hold ourselves accountable and ensure that only the most qualified surgeons are placing TVM.
Keep the mesh option available
We support the position of the American Urogynecologic Society in opposing an outright ban of TVM because such a restriction would deny our patients access to an effective, durable, and minimally invasive approach for prolapse repair.57
Share your thoughts! Send your Letter to the Editor to [email protected]. Please include your name and the city and state in which you practice.
- Wu JM, Matthews CA, Conover MM, Pate V, Jonsson Funk M. Lifetime risk of stress urinary incontinence or pelvic organ prolapse surgery. Obstet Gynecol. 2014;123(6):1201-1206.
- Olsen AL, Smith VJ, Bergstrom JO, Colling JC, Clark AL. Epidemiology of surgically managed pelvic organ prolapse and urinary incontinence. Obstet Gynecol. 1997;89(4):501-506.
- Nygaard I, Brubaker L, Zyczynski HM, et al. Long-term outcomes following abdominal sacrocolpopexy for pelvic organ prolapse. JAMA. 2013;309(19):2016-2024.
- American College of Obstetricians and Gynecologists, American Urogynecologic Society. Practice Bulletin No. 185 Summary: Pelvic organ prolapse. Obstet Gynecol. 2017;130(5):1170-1172.
- American Urogynecologic Society Best Practice Statement: Evaluation and counseling of patients with pelvic organ prolapse. Female Pelvic Med Reconstr Surg. 2017;23(5):281-287.
- Barber MD, Brubaker L, Burgio KL, et al; Eunice Kennedy Shriver National Institute of Child Health and Human Development Pelvic Floor Disorders Network. Comparison of 2 transvaginal surgical approaches and perioperative behavioral therapy for apical vaginal prolapse: the OPTIMAL randomized trial. JAMA. 2014;311(10):1023-1034.
- Chung CP, Miskimins R, Kuehl TJ, Yandell PM, Shull BL. Permanent suture used in uterosacral ligament suspension offers better anatomical support than delayed absorbable suture. Int Urogynecol J. 2012;23(2):223-227.
- Yazdany T, Yip S, Bhatia NN, Nguyen JN. Suture complications in a teaching institution among patients undergoing uterosacral ligament suspension with permanent braided suture. Int Urogynecol J. 2010;21(7):813-818.
- Toglia MR, Fagan MJ. Suture erosion rates and long-term surgical outcomes in patients undergoing sacrospinous ligament suspension with braided polyester suture. Am J Obstet Gynecol. 2008;198(5):600.e1-e4.
- Wong MJ, Rezvan A, Bhatia NN, Yazdany T. Uterosacral ligament vaginal vault suspension using delayed absorbable monofilament suture. Int Urogynecol J. 2011;22(11):1389-1394.
- Detollenaere RJ, den Boon J, Stekelenburg J, IntHout J, et al. Sacrospinous hysteropexy versus vaginal hysterectomy with suspension of the uterosacral ligaments in women with uterine prolapse stage 2 or higher: multicentre randomised non-inferiority trial. BMJ. 2015;351:h3717.
- Kapoor S, Sivanesan K, Robertson JA, Veerasingham M, Kapoor V. Sacrospinous hysteropexy: review and meta-analysis of outcomes. Int Urogynecol J. 2017;28(9):1285-1294.
- Madsen AM, Raker C, Sung VW. Trends in hysteropexy and apical support for uterovaginal prolapse in the United States from 2002 to 2012. Female Pelvic Med Reconstr Surg. 2017;23(6):365-371.
- Wei JT, Nygaard I, Richter HE, et al; Pelvic Floor Disorders Network. A midurethral sling to reduce incontinence after vaginal prolapse repair. N Engl J Med. 2012;366(25):2358-2367.
- Buchsbaum GM, Lee TG. Vaginal obliterative procedures for pelvic organ prolapse: a systematic review. Obstet Gynecol Surv. 2017;72(3):175-183.
- Zebede S, Smith AL, Plowright LN, Hegde A, Aguilar VC, Davila GW. Obliterative LeFort colpocleisis in a large group of elderly women. Obstet Gynecol. 2013;121(2 pt 1):279-284.
- Bochenska K, Leader-Cramer A, Mueller M, Dave B, Alverdy A, Kenton K. Perioperative complications following colpocleisis with and without concomitant vaginal hysterectomy. Int Urogynecol J. 2017;28(11):1671-1675.
- Jones K, Wang G, Romano R, St Marie P, Harmanli O. Colpocleisis: a survey of current practice patterns. Female Pelvic Med Reconstr Surg. 2017;23(4):276-280.
- Jones KA, Zhuo Y, Solak S, Harmanli O. Hysterectomy at the time of colpocleisis: a decision analysis. Int Urogynecol J. 2016;27(5):805-810.
- Kandadai P, Flynn M, Zweizig S, Patterson D. Cost-utility of routine endometrial evaluation before le fort colpocleisis. Female Pelvic Med Reconstr Surg. 2014;20(3):168-173.
- Reena C, Kekre AN, Kekre N. Occult stress incontinence in women with pelvic organ prolapse. Int J Gynaecol Obstet. 2007;97(1):31-34.
- Oliphant SS, Shepherd JP, Lowder JL. Midurethral sling for treatment of occult stress urinary incontinence at the time of colpocleisis: a decision analysis. Female Pelvic Med Reconstr Surg. 2012;18(4):216-220.
- Siddiqui NY, Grimes CL, Casiano ER, et al; Society of Gynecologic Surgeons Systematic Review Group. Mesh sacrocolpopexy compared with native tissue vaginal repair: a systematic review and meta-analysis. Obstet Gynecol. 2015;125(1):44-55.
- Winters JC, Dmochowski RR, Goldman HB, et al; American Urological Association; Society of Urodynamics, Female Pelvic Medicine and Urogenital Reconstruction. Urodynamic studies in adults: AUA/SUFU guideline. J Urol. 2012;188(6 suppl):2464-2472.
- Barber MD, Maher C. Apical prolapse. Int Urogynecol J. 2013;24(11):1815-1833.
- Maher C, Feiner B, Baessler K, Christmann-Schmid C, Haya N, Brown J. Surgery for women with apical vaginal prolapse. Cochrane Database Syst Rev. 2016;10:CD012376.
- Salamon CG, Lewis C, Priestley J, Gurshumov E, Culligan PJ. Prospective study of an ultra-lightweight polypropylene Y mesh for robotic sacrocolpopexy. Int Urogynecol J. 2013;24(8):1371-1375.
- Culligan PJ, Gurshumov E, Lewis C, et al. Subjective and objective results 1 year after robotic sacrocolpopexy using a lightweight Y-mesh. Int Urogynecol J. 2014;25(6):731-735.
- Eddib A, Danakas A, Hughes S, et al. Influence of morbid obesity on surgical outcomes in robotic-assisted gynecologic surgery. J Gynecol Surg. 2014;30(2):81-86.
- Gallo T, Kashani S, Patel DA, Elsahwi K, Silasi D-A, Azodi M. Robotic-assisted laparoscopic hysterectomy: outcomes in obese and morbidly obese patients. JSLS. 2012;16(3):421-427.
- Serati M, Bogani G, Sorice P, et al. Robot-assisted sacrocolpopexy for pelvic organ prolapse: a systematic review and meta-analysis of comparative studies. Eur Urol. 2014;66(2):303-318.
- Cundiff GW, Varner E, Visco AG, et al; Pelvic Floor Disorders Network. Risk factors for mesh/suture erosion following sacral colpopexy. Am J Obstet Gynecol. 2008;199(6):688.e1-e5.
- Wu JM, Wells EC, Hundley AF, Connolly A, Williams KS, Visco AG. Mesh erosion in abdominal sacral colpopexy with and without concomitant hysterectomy. Am J Obstet Gynecol. 2006;194(5):1418-1422.
- Costantini E, Brubaker L, Cervigni M, et al. Sacrocolpopexy for pelvic organ prolapse: evidence-based review and recommendations. Eur J Obstet Gynecol Reprod Biol. 2016;205:60-65.
- Tan-Kim J, Menefee SA, Luber KM, Nager CW, Lukacz ES. Prevalence and risk factors for mesh erosion after laparoscopic-assisted sacrocolpopexy. Int Urogynecol J. 2011;22:205-212.
- Culligan PJ, Salamon C, Priestley JL, Shariati A. Porcine dermis compared with polypropylene mesh for laparoscopic sacrocolpopexy: a randomized controlled trial. Obstet Gynecol. 2013;121(1):143-151.
- Tate SB, Blackwell L, Lorenz DJ, Steptoe MM, Culligan PJ. Randomized trial of fascia lata and polypropylene mesh for abdominal sacrocolpopexy: 5-year follow-up. Int Urogynecol J. 2011;22(2):137-143.
- Culligan PJ, Blackwell L, Goldsmith LJ, Graham CA, Rogers A, Heit MH. A randomized controlled trial comparing fascia lata and synthetic mesh for sacral colpopexy. Obstet Gynecol. 2005;106(1):29-37.
- ACOG Committee on Practice Bulletins-Gynecology, American Urogynecologic Society. ACOG Practice Bulletin No. 185: Pelvic organ prolapse. Obstet Gynecol. 2017;130(5):e234-e250.
- Jambusaria LH, Murphy M, Lucente VR. One-year functional and anatomic outcomes of robotic sacrocolpopexy versus vaginal extraperitoneal colpopexy with mesh. Female Pelvic Med Reconstr Surg. 2015;21(2):87-92.
- Maher C, Feiner B, Baessler K, Christmann-Schmid C, Haya N, Marjoribanks J. Transvaginal mesh or grafts compared with native tissue repair for vaginal prolapse. Cochrane Database System Rev. 2016:CD012079.
- Meyer I, McGwin G, Swain T, Alvarez MD, Ellington DR, Richter HE. Synthetic graft augmentation in vaginal prolapse surgery: long-term objective and subjective outcomes. J Minim Invasive Gynecol. 2016;23(4):614-621.
- Weintraub AY, Friedman T, Baumfeld Y, Neymeyer J, Neuman M, Krissi H. Long‐term functional outcomes following mesh‐augmented posterior vaginal prolapse repair. Int J Gynecol Obstet. 2016;135(1):107-111.
- Glazener CM, Breeman S, Elders A, et al; PROSPECT Study Group. Mesh, graft, or standard repair for women having primary transvaginal anterior or posterior compartment prolapse surgery: two parallel-group, multicentre, randomised, controlled trials (PROSPECT). Lancet. 2017;389(10067):381-392.
- Clinical and cost-effectiveness of surgical options for the management of anterior and/or posterior vaginal wall prolapse: two randomized controlled trials within Comprehensive Cohort Study. PROSPECT study protocol. The National Institute for Health Research. https://www.journalslibrary.nihr.ac.uk/programmes/hta/076018. Accessed January 17, 2018.
- Chen L, Lisse S, Larson K, Berger MB, Ashton-Miller JA, DeLancey JO. Structural failure sites in anterior vaginal wall prolapse: identification of a collinear triad. Obstet Gynecol. 2016;128(4):853-862.
- Gutman RE, Rardin CR, Sokol ER, et al. Vaginal and laparoscopic mesh hysteropexy for uterovaginal prolapse: a parallel cohort study. Am J Obstet Gynecol. 2017;216(1):38.e1-e11.
- US Food and Drug Administration. Urogynecologic surgical mesh: update on the safety and effectiveness of transvaginal placement for pelvic organ prolapse. https://www.fda.gov/downloads/medicaldevices/safety/alertsandnotices/ucm262760.pdf. Published July 2011. Accessed January 9, 2017.
- Murphy M, Holzberg A, van Raalte H, et al; Pelvic Surgeons Network. Time to rethink: an evidence-based response from pelvic surgeons to the FDA Safety Communication: "Update on serious complications associated with transvaginal placement of surgical mesh for pelvic organ prolapse." Int Urogynecol J. 2012;23(1):5-9.
- Roman H, Marpeau L, Hulsey TC. Surgeons' experience and interaction effect in randomized controlled trials regarding new surgical procedures. Am J Obstet Gynecol. 2008;199(2):108.e1-e6.
- Eilber KS, Alperin M, Khan A, et al. The role of the surgeon on outcomes of vaginal prolapse surgery with mesh. Female Pelvic Med Reconstr Surg. 2017;23 (5):293-296.
- Kelly EC, Winick-Ng J, Welk B. Surgeon experience and complications of transvaginal prolapse mesh. Obstet Gynecol. 2016;128(1):65-72.
- Altman D, Vayrynen T, Engh ME, Axelsen S, Falconer C; Nordic Transvaginal Mesh Group. Anterior colporrhaphy versus transvaginal mesh for pelvic-organ prolapse. N Engl J Med 2011;364(19):1826-1836.
- van Raalte HM, Lucente VR, Molden SM, Haff R, Murphy M. One-year anatomic and quality-of-life outcomes after the Prolift procedure for treatment of posthysterectomy prolapse. Am J Obstet Gynecol. 2008:199(6):694.e1-e6.
- Iyer S, Botros SM. Transvaginal mesh: a historical review and update of the current state of affairs in the United States. Int Urogynecol J. 2017;28(4):527-535.
- Ting M, Gonzalez A, Ephraim S, Murphy M, Lucente V. The importance of a full thickness vaginal wall dissection. Comment on "Transvaginal mesh: a historical review and update of the current state of affairs in the United States." Int Urogynecol J. 2017;28(10):1609-1610.
- American Urogynecologic Society. Position statement on restriction of surgical options for pelvic floor disorders. https://www.augs.org/assets/1/6/Position_Statement_Surgical_Options_for_PFDs.pdf. Published March 26, 2013. Accessed January 9, 2017.
Effective surgical management of advanced pelvic organ prolapse (POP) depends on prolapse location and stage, presence of urinary incontinence, need for hysterectomy, the patient’s desire to maintain sexual function, type of surgery, and the surgeon’s skill and experience, among other factors. For these reasons, POP repair is not a one-size-fits all procedure.
In this article, experts in minimally invasive prolapse repair offer their perspectives on 3 surgical approaches: use of native tissue (Drs. White, Aguilar, and Rogers), abdominal sacrocolpopexy (Drs. Huber and Culligan), and transvaginal mesh (Drs. Lucente and Ton). They evaluate the evidence on these procedures and provide recommendations based on their experience of best practices for achieving surgical success and minimizing adverse events.
Using native tissue for vaginal anatomy repair
Amanda White, MD; Vivian Aguilar, MD; and Rebecca G. Rogers, MD
Dr. Rogers reports that she receives royalties from UpToDate. Drs. White and Aguilar report no financial relationships relevant to this article.
Surgical therapy is the mainstay of treatment for POP, and 20% of US women will undergo prolapse and/or stress incontinence surgery by age 80.1 Prolapse surgery either restores the vaginal anatomy (reconstructive surgery) or obliterates the vaginal canal (obliterative surgery). Vaginal reconstruction can be performed using the patient's native tissue or mesh. Because of concerns associated with mesh use, native tissue repairs continue to be commonly performed.
Unfortunately, not all prolapse surgeries result in prolapse cure, and recurrent prolapse that necessitates repeat operation is not rare, regardless of whether or not mesh is used.2,3 Native tissue repairs are most commonly performed through the vaginal route, the first minimally invasive approach to prolapse surgery. Restoration of the vaginal apex has been identified as critically important in these surgeries. Apical native tissue repairs include reconstructive procedures, such as sacrospinous ligament suspension (SSLS) or uterosacral ligament suspension (USLS), and obliterative procedures, such as colpocleisis.
In this discussion, we present 2 case vignettes that highlight surgical decision making for repair of stage 3 or 4 pelvic organ prolapse utilizing these techniques.
- Native tissue repair offers a minimally invasive approach to prolapse repair.
- Sacrospinous and uterosacral ligament suspensions have equivalent success rates.
- Prophylactic midurethral slings reduce postoperative incontinence at the time of transvaginal native tissue repair.
- Hysterectomy at the time of colpocleisis should not be performed routinely.
CASE 1 Active woman with prolapse
A 65-year-old woman (G2P2) presents with stage 3 prolapse, with the anterior compartment at +3 and the cervix at the hymen with straining. She is sexually active and desires to retain coital function. A trial of pessary has failed.
What surgical options can be considered for this patient?
Reconstruction procedures for prolapse
This patient presents with a typical configuration of prolapse; the anterior and apical compartments are the most likely to prolapse.4 Importantly, conservative management of her prolapse has failed. While it is not required that women have a trial with pessary prior to undergoing surgery, all women should be offered conservative management of prolapse, according to the American Urogynecologic Society (AUGS) and the American College of Obstetricians and Gynecologists (ACOG).4,5
Apical suspension
Since this patient desires to retain coital function, her gynecologist recommends a reconstructive procedure. The combination of apical and anterior vaginal wall prolapse will require an apical suspension procedure (FIGURES 1 and 2). If suspension of the apex does not correct the anterior wall prolapse, the patient also may require anterior compartment reconstruction.
The 2 most commonly performed native tissue apical suspension procedures, SSLS and USLS, have equivalent outcomes at 2 years, according to a multicenter randomized trial.6 Therefore, the choice of procedure is at the surgeon's discretion. USLS is most commonly performed at the time of hysterectomy via an intraperitoneal approach, while SSLS is often selected for posthysterectomy vault prolapse, given its extraperitoneal location.
Suture type. Whether to use permanent suture at the time of SSLS or USLS is controversial. Some data suggest that permanent suture provides greater long-term success compared with delayed absorbable suture.7 However, permanent suture has been reported to be associated with higher rates of suture complications--up to 44% in USLS and 36% in SSLS--compared with a 3.5% complication rate in a USLS cohort treated with absorbable suture.8-10
Hysterectomy versus hysteropexy. Considerable debate exists regarding whether a patient requires hysterectomy at the time of prolapse repair. In a randomized trial at 12 months' follow-up, uterine preservation by sacrospinous hysteropexy was noninferior to vaginal hysterectomy with suspension of the uterosacral ligaments for surgical failure of the apical compartment.11 A recent meta-analysis found that apical failure rates after sacrospinous hysteropexy versus vaginal hysterectomy were not different.12 Repeat surgery rates for prolapse also were not different between groups. The most significant disadvantage of uterine-preservation prolapse surgery, when compared with hysterectomy, is the lack of prevention and diagnosis of uterine malignancy.12 From 2002 to 2012, rates of hysteropexy significantly increased in the United States, although rates remain low.13
Sling procedure pros and cons. This case patient did not report urinary incontinence, but she may develop incontinence with reduction of the anterior wall prolapse. A large randomized controlled trial that included 337 women compared sling with no sling procedures among women with prolapse undergoing transvaginal prolapse repair.14 Management with a prophylactic sling resulted in less incontinence (27.3% and 43.0%, respectively, at 12 months postoperatively) but higher rates of urinary tract infection (31.0% vs 18.3%), major bleeding complications (3.1% vs 0%), and incomplete bladder emptying 6 weeks after surgery (3.7% vs 0%) (P≤.05 for all).14
CASE 1 Recommendations for this patient
For this case, we would offer the patient a transvaginal hysterectomy and USLS. At the time of repair, we would assess whether she needed an anterior repair as well. We would offer a prophylactic sling procedure and also would discuss the risks and benefits of concomitant versus interval incontinence procedures.
CASE 2 Elderly woman with severe prolapse
An 85-year-old woman (G3P3) presents with procidentia, or complete eversion of the vagina, with the cervix 10 cm outside of the hymen. She has difficulty voiding, and the prolapse is uncomfortable when walking. A trial of pessary has failed. The patient denies vaginal bleeding. She is not sexually active and does not desire to retain coital function.
What treatment options would be appropriate for this patient?
Obliterative surgery
This elderly patient presents with advanced pelvic organ prolapse, and conservative management has failed. She is not sexually active and does not desire coital function in the future, so an obliterative procedure is indicated. Colpocleisis is a minimally invasive procedure that has cure rates ranging from 91% to 100%.15 It is likely that this patient's voiding dysfunction will improve after surgery and that she will be highly satisfied with the surgery.16
The question of hysterectomy with colpocleisis
The role of hysterectomy at the time of colpocleisis is controversial. LeFort colpocleisis preserves the uterus, with the anterior and posterior vaginal walls sutured together (FIGURE 3). Hysterectomy at the time of vaginal closure increases the operative time and blood loss.15 On the other hand, closure without hysterectomy prohibits future endometrial or cervical cancer screening.
In a recent review using the American College of Surgeons National Surgical Quality Improvement Program database, investigators compared women who underwent colopocleisis alone with those who underwent colpocleisis with hysterectomy.17 They found that the incidence of major complications was greater among women who underwent concomitant hysterectomy, and they concluded that hysterectomy should not be performed routinely at the time of colpocleisis.17
Among 322 urogynecologists who responded to a web-based survey, only 18% routinely performed hysterectomy at the time of colpocleisis.18 Further, in a decision analysis model, the utility for colpocleisis without hysterectomy was higher in women older than age 40, suggesting that hysterectomy should be performed only in special circumstances.19
Evaluating the endometrium. If the uterus remains in situ, should endometrial evaluation be performed? If so, should ultrasonography or endometrial biopsy be used? Authors of a decision analysis model found that among women at low risk for cancer and without abnormal uterine bleeding, endometrial biopsy was not favored until the probability of cancer reached 64%.20 Specifically, no evaluation or evaluation by transvaginal ultrasonography is adequate in the majority of cases.20 When screened by transvaginal ultrasonography, the high, 99% negative predictive value for endometrial disease, using a cutoff value of 5 mm for endometrial stripe width, will allow most patients to avoid unnecessary tissue sampling.
Stress incontinence. It is likely that this patient's voiding dysfunction will resolve with reduction of the prolapse, and she may develop stress incontinence symptoms. In up to 68% of women, occult stress incontinence will be revealed with reduction of stage 3 or stage 4 prolapse.21 If the patient demonstrates stress incontinence, a midurethral sling is likely to treat her incontinence effectively, with little added risk from the procedure.22 Even among women who have an elevated postvoid residual urine volume, the incidence of sling revision is low.15
CASE 2 Procedure recommendation for this patient
For this case, we would perform a LeFort colpocleisis and discuss whether or not the patient would prefer a midurethral sling if stress incontinence was demonstrated on examination. We would not perform endometrial evaluation in this patient, as she has not been bleeding and her risk for endometrial cancer is low.
Weighing the benefits of native tissue repair
Native tissue repair when performed transvaginally is a minimally invasive approach to prolapse repair. In a multicenter randomized trial, anatomic success was reported to be 64.5% at 2 years.6 Long-term follow up of patients undergoing mesh sacrocolpopexy shows a similar anatomic failure rate, with up to one-third of patients meeting the definition of composite failure.3 Unlike mesh-augmented repairs, however, adverse events, including bowel obstruction, mesh exposure, and thromboembolism, are more likely to occur in the mesh sacrocolpopexy group.23
Obliterative procedures have the highest success rates of all prolapse repairs and carry with them low morbidity. However, women must forego the ability for coitus in the future. For all native tissue vaginal repairs, the surgeon and patient must weigh the risks and benefits of concomitant anti-incontinence procedures.
Read about using abdominal sacrocolpopexy for apical prolapse repair.
Abdominal sacrocolpopexy: A tried-and-true approach for apical prolapse repair
Sarah Huber, MD, and Patrick Culligan, MD
Dr. Culligan reports that he is a shareholder in Oragami Surgical LLC and a consultant and speaker for Coloplast and Intuitive Surgical Inc. Dr. Huber reports no financial relationships relevant to this article.
CASE Woman with advanced prolapse desires surgical repair
A 55-year-old woman (G2P2) presents to her gynecologist's office reporting a vaginal bulge and pressure that has been worsening for the past year. She describes a nontender ball of tissue the size of an orange protruding past the introitus that worsens with ambulating and lifting heavy objects. She reports some urinary urgency and increased frequency and at times feels as though her bladder does not empty completely with voiding. She denies any urinary incontinence. The patient has regular bowel movements but does report some difficulty with stool evacuation. She has a history of 2 vaginal deliveries and is sexually active. She is postmenopausal, with the last menses about 4 years ago. She is active and exercises regularly.
The patient's Pap smears, mammograms, and colonoscopy are up to date and test results have been normal. She has no significant medical or surgical history and no significant family history of cancer. On examination, her body mass index is normal, as is the cardiopulmonary exam. Her pelvic organ prolapse quantification system (POP-Q) score is Aa +3, Ba +3, C +4, GH 3, PB 3, TVL 10, Ap +2, Bp +2, and D +2. The patient is interested in surgical management.
What urodynamic tests would be appropriate for this patient, and what treatment options would you recommend?
- Robot-assisted laparoscopic sacrocolpopexy is a safe, effective, and durable treatment for advanced-stage pelvic organ prolapse.
- This procedure can completely correct stage 3 or 4 prolapse when the dissection of the anterior vaginal wall extends to the bladder neck and the dissection of the posterior vaginal wall extends to the perineal body.
- One can avoid the need for concomitant vaginal prolapse repair by gathering up stretched out vaginal epithelium while suturing to the mesh arms.
- Sacral attachment sutures should be placed in the anterior longitudinal ligament distal to the sacral promontory to avoid the L5-S1 disc.
- Unless contraindicated, lightweight macroporous polypropylene mesh is the current implant of choice.
Additional tests needed
Patients with advanced-stage pelvic organ prolapse are at an increased risk for stress urinary incontinence that may be masked by urethral "kinking" due to anatomic distortion of the periurethral support mechanism. Based on recommendations from the American Urological Association (AUA) and Society of Urodynamics, Female Pelvic Medicine and Urogenital Reconstruction (SUFU), we routinely perform a postvoid residual urine volume measurement, urinalysis, urine culture, and a prolapse reduction stress test.24 If the urinalysis is positive for blood, then a preoperative cystoscopy would be indicated.
If stress incontinence is confirmed by reduction stress testing, the patient should be offered an anti-incontinence procedure, such as a mesh midurethral sling.
This patient's overactive bladder symptoms warrant investigation via complex urodynamic testing to allow for comprehensive counseling about her postoperative expectations.
Counseling the patient on the sacrocolpopexy option
Abdominal sacrocolpopexy initially was described in 1962 by Lane as a technique to affix the vaginal apex to the sacral promontory using a graft. Although the procedure has been modified over the years, the principles of using an implanted strengthening material to permanently attach the apex to the anterior longitudinal ligament at the sacrum has proven to be a highly effective and safe treatment, establishing it as the gold standard for apical prolapse repair.25,26
Compared with other methods of apical prolapse repair, sacrocolpopexy via any approach is superior to vaginal surgery in terms of subjective and objective outcomes. In a recent systematic review comparing apical prolapse repairs, patients who underwent a vaginal approach were more likely to report awareness of their prolapse after surgery, undergo repeat surgery, have objective recurrent prolapse, and were at increased risk for postoperative stress urinary incontinence and dyspareunia.26 Prospective studies within our practice have shown 1-year composite subjective and objective cure rates of 94% to 95%.27,28
Selecting a route for sacrocolpopexy
Although sacrocolpopexy can be approached via laparotomy or conventional laparoscopy, we routinely use a robot-assisted approach, as it has been shown to be especially beneficial for complex situations, such as in patients with prior pelvic surgery, a foreshortened vagina, or obesity.29,30
Potential complications
Sacrocolpopexy complications are rare, especially when a minimally invasive approach is used.31 Reported complications of minimally invasive sacrocolpopexy include gastrointestinal or genitourinary injury, bowel obstruction or ileus, incisional hernia, vascular injury, discitis or osteomyelitis, conversion to open procedure, and mesh exposure.
Vaginal mesh exposure is rare following sacrocolpopexy, but it can occur at any time following surgery.31 Some risk factors include mesh material selection (specifically polytetrafluoroethylene [PTFE] mesh), concurrent total hysterectomy, vaginal atrophy, and smoking.32,33 As a result, recent recommendations have advised the use of polypropylene mesh with uterine preservation or supracervical hysterectomy at the time of sacrocolpopexy.34 In fact, supracervical hysterectomy alone appears to cut down or eliminate the risk of mesh exposure in laparoscopic sacrocolpopexy.35
In our practice, avoiding split-thickness vaginal dissection, employing supracervical hysterectomy techniques, and using ultralightweight mesh has resulted in mesh exposure rates approaching zero.28
For atrophic vaginal tissue, one can consider prescribing preoperative vaginal estrogen for 4 to 6 weeks, but this is not essential and should not routinely delay pelvic reconstructive surgery.
What type of implant material is best?
While various materials have been used as the fixation media in sacrocolpopexy, loosely knitted synthetic type I macroporous polypropylene mesh is the best choice due to its efficacy, availability, and low adverse effect profile. We recommend a lightweight mesh with a maximum weight of 25 g/m2. Two such products currently available are the UPsylon Y-Mesh (Boston Scientific, Marlborough, Massachusetts) and Restorelle Y mesh (Coloplast, Minneapolis, Minnesota). Lightweight mesh has been proven to maintain integrity, guaranteeing a successful outcome, while reducing the "mesh load" on the attached tissue.27,28
Comparative studies with fascia lata or cross-linked porcine dermal grafts demonstrated inferior outcomes versus synthetic mesh, and currently the only biologic material on the market indicated for prolapse repair augmentation, ACell Pelvic Floor Matrix (ACell, Columbia, Maryland), has not been extensively tested in sacrocolpopexy.36-38
Vaginal anatomy restored by sacrocolpopexy
Abdominal sacrocolpopexy, specifically via a minimally invasive approach, is an effective and long-lasting treatment that should be offered to women with advanced-stage prolapse.
Using the surgical techniques described below, including attachment of the mesh along the lengths of the anterior and posterior vaginal walls and gathering up excess tissue with mesh attachment, can provide women with adequate support for the entire vagina with restoration of normal vaginal anatomy and caliber.
Step-by-step tips for surgical efficiency
Robotic port placement
- Place the trocars in a "W" layout for the da Vinci Si Surgical System (FIGURE 4, VIDEO 1) or in a linear layout for the da Vinci Xi Surgical System (Intuitive Surgical, Sunnyvale, California). Both Si and Xi port placement includes a 3- to 5-mm assistant port in the right upper quadrant of the abdomen.
Supracervical hysterectomy, if indicated
- Maneuver the uterus with the robotic tenaculum, which obviates the need for a uterine manipulator during the hysterectomy (VIDEO 2).
- Create the bladder flap just above the upper edge of the bladder to facilitate the upcoming anterior wall dissection. This helps to prevent the development of a split-thickness dissection plane.
- 1.5 to 2 cm of cervix should be left in place, and conization should be avoided.
Anterior vaginal wall dissection
- The key to a good full-thickness dissection is sustained tissue traction and countertraction. The bedside assistant pulls the anterior peritoneal cut edge anteriorly for "gross" traction, and further "fine" traction can be created by pulling the areolar tissue with robotic forceps. The cervix is grasped with the tenaculum, which applies a constant midline cephalad countertraction (VIDEO 3).
- Sharp dissection with cold scissors allows for creation of the dissection plane, while cautery is judiciously applied only for hemostasis. If bleeding is encountered, this usually indicates that a split thickness of the vaginal wall has been created, and the surgeon should correct to the proper dissection plane.
- Dissection is made easier by taking down the bladder pillars before advancing down toward the bladder neck.
- The anterior dissection is always carried down to level of the trigone, confirmed by visualization of the Foley bulb (FIGURE 5).
Posterior vaginal wall dissection
- Begin dissection just above the rectal reflection, leaving peritoneum on the posterior cervix (VIDEO 4).
- Extend the incision bilaterally to the uterosacral ligaments only after the correct dissection plane is confirmed by visualization of the areolar tissue.
- Apply cervical traction using the tenaculum in a cephalad midline direction, and place traction on the cut edge of the posterior peritoneum using the bipolar forceps. The tenaculum wrist must be turned away from the working instruments to avoid internal clashing.
- Completely transect the right uterosacral ligament to better facilitate the creation of a contiguous peritoneal opening for burying the mesh. The remainder of the opening will be created later.
- While it is important to avoid split-thickness dissection, the vaginal plane must be "clean" (that is, without fat or adventitia) to allow for robust suturing.
- Dissection at least halfway down the posterior vaginal wall is recommended but proceeding down to the perineal body provides the most optimal support (FIGURE 6).
Sacral dissection
- Use a noncrushing instrument to laterally sweep the bowel to the left side, effectively "plastering" the peritoneum over the sacral promontory (FIGURE 7; VIDEO 5).
- Extend the superficial peritoneal incision down the right paracolic gutter halfway between the ureter and colon until it communicates with the incised posterior peritoneal edge created during the posterior dissection.
- Identify the middle sacral artery to avoid vascular injury, but there is no need to prophylactically coagulate it.
Vaginal mesh attachment
- Cut a lightweight Y-mesh to a length of 6 to 8 cm anteriorly and 8 to 11 cm posteriorly and place it into the surgical field (FIGURE 8; VIDEO 6). The length is determined based on the preoperative office examination and examination under anesthesia prior to starting the procedure.
- Attach the mesh securely and evenly to the anterior and posterior vaginal walls using multiple interrupted monofilament sutures. We aim to place sutures that provide mesh stability without excess vaginal wall incorporation to avoid "through-and-through" suturing.
- The posterior wall suturing is performed first, starting at the perineal body and continuing cephalad (VIDEO 7). We find it easiest to tie the knots between the mesh and the vagina in this space.
- Suture the crotch of the Y-mesh to the cervix so that no gap exists between tissue and mesh.
- For advanced-stage prolapse with significant anterior prolapse, the stretched out vaginal epithelium can be systematically gathered up to reconfigure the tissue to conform to the desired mesh dimensions (VIDEO 8). This tissue remodeling is evident even at the 2- to 4-week postoperative visit.
Peritoneal closure: Step 1
- Reapproximate the cut edges of peritoneum surrounding the vagina and cervix using a continuous purse-string suture of 0 Monocryl (poliglecaprone 25) on an SH needle (Ethicon, Somerville, New Jersey) with a fisherman's knot tied at the end (VIDEO 9). The needle passes are placed close together and close to the incised edge of the cut peritoneum.
- We typically start our peritoneal suture at the 5 o'clock position of the posterior peritoneum, extending in a clockwise direction and ultimately jumping anteriorly around the sacral arm of the mesh.
- Place the mesh within the paracolic peritoneal canal, and secure the needle for later use.
Sacral mesh attachment
- The mesh is tensioned so that a vaginal examination confirms adequate support of all the walls without excess tension or tissue banding. Some laxity of the anterior vaginal wall consistent with a mild cystocele is appropriate.
- Place 2 permanent PTFE sutures along the slope of the sacral promontory into the anterior longitudinal ligament (VIDEO 10). This avoids injury to the disc space that sits at the edge of the promontory. We do not advise the use of bone anchors as they increase the risk for discitis and osteomyelitis.
- Secure the mesh to the anterior longitudinal ligament without any tension. This is facilitated by creating mesh slack via cephalad pressure from a vaginal probe.
Peritoneal closure: Step 2
- Close the remaining paracolic peritoneal incision, completely burying the mesh within the created canal (FIGURE 9).
- At the end of the procedure, perform a repeat vaginal exam, rectal exam, and cystoscopy.
Technique with prior total hysterectomy
- In patients with a prior total hysterectomy, place a 13 x 3.5 cm Breisky vaginal retractor and/or coated nonconductive stent (Marina Medical, Sunrise, Florida) into the vagina to delineate the anterior and posterior walls at the vaginal apex during dissection.
- Some surgeons may opt to retrograde fill the bladder to better identify its location.
- We routinely leave a segment of peritoneum attached to the dome of the vaginal apex for added tissue integrity to prevent erosion.
Read about using transvaginal mesh for POP repair.
Transvaginal mesh: An effective, durable option for POP repair
Vincent R. Lucente, MD, MBA, and Jessica B. Ton, MD
Dr. Lucente reports that he has received grant or research support from Advanced Tactile Imaging, Boston Scientific, Coloplast, and Valencia; is a consultant to Coloplast; is a speaker for Allergan, Boston Scientific, Coloplast, and Shionogi; and serves as an expert witness for American Medical Systems and C.R. Bard. Dr. Ton reports no financial relationships relevant to this article.
As baseline health in the elderly population continues to improve, the number of women in the United States with symptomatic POP will increase by approximately 50% by 2050.39 Unfortunately, after native tissue repair (NTR) the rate of prolapse recurrence is extremely high: approximately 40% regardless of approach, as demonstrated in the OPTIMAL (Operations and Pelvic Muscle Training in the Management of Apical Support Loss) trial by Barber and colleagues.6 The authors of that clinical trial recently revealed that at the 5-year follow-up, these failure rates progressed to 70% for sacrospinous ligament fixation and 61% for uterosacral ligament suspension (data presented at the Society of Gynecologic Surgeons Annual Scientific Meeting 2018, Orlando, Florida). This establishes that NTR is not durable enough to meet the increasing physical demands of this age group and that mesh augmentation must be considered.
For patients at increased risk of prolapse recurrence, using transvaginal mesh (TVM) is the most minimally invasive approach and is an excellent option for mesh augmentation. Avoiding adverse events during placement of TVM depends largely on optimal surgical technique.40 (VIDEO: “Demonstration of an anterior vaginal wall dissection into the true vesicovaginal space”)
- Active advanced age requires a durable reconstructive pelvic surgery for pelvic organ prolapse, and native tissue repair does not meet that demand.
- Mesh augmentation reduces the risk of prolapse recurrence, and vaginal placement of mesh is the most minimally invasive approach.
- Rates of exposure with transvaginal mesh would be minimized with use of a full-thickness vaginal wall dissection.
- Optimal surgical technique could be highly reproducible with better surgical training.
The evidence on TVM versus NTR
Several studies have examined whether TVM has a measurable benefit over NTR.
A 2016 Cochrane review by Maher and colleagues included 37 randomized trials (4,023 women) that compared TVM and biologic grafts with NTR.41 Three primary outcomes were defined: awareness of prolapse, recurrence, and repeat surgery. Compared with women treated with NTR, those treated with synthetic nonabsorbable TVM exhibited a greater reduction in awareness of prolapse (risk ratio [RR], 0.66; 95% confidence interval [CI], 0.54-0.81), decreased recurrence in the anterior compartment (RR, 0.33; 95% CI, 0.26-0.40), and decreased reoperation for prolapse (RR, 0.53; 95% CI, 0.31-0.88). The overall calculated exposure rate was 12%, with a range of 3.2% to 20.8%.41 As we will discuss, this wide range most likely is attributed to a suboptimal, split-thickness dissection. There were no differences in other key secondary outcomes, including dyspareunia, operating time, and estimated blood loss.41
Longitudinal studies are emerging as almost 2 decades have passed since TVM was introduced. In a study of 5-year follow-up after TVM placement, Meyer and colleagues reported that patients had continued significant improvements in both subjective and objective outcomes.42 The mesh exposure rate was 6%, attributed to severe vaginal atrophy.42 A 10-year observational study by Weintraub and colleagues demonstrated a recurrence rate of only 2.6% in the anterior compartment, 7.6% in the posterior (nonaugmented) compartment, and no exposures or extrusions after anterior TVM placement.43
In contrast to the Cochrane review, in the 2017 multicenter PROSPECT (Prolapse surgery: Pragmatic evaluation and randomized controlled trials) trial, Glazener and colleagues found no difference in desired outcomes with TVM compared with NTR.44 There was an overall 6% to 7% exposure rate over 2 years.44 To reflect "real-world" practice, however, this study was intentionally designed without rigorous standardization of surgical technique. The authors reported that "appropriately experienced surgeons" performed the procedure, but it is unclear how experience was determined given that 20% of the cases were performed by "registrars," the equivalent of US residents or fellows.45
The PROSPECT study protocol described the TVM procedure as "a standard repair with a nonabsorbable mesh inlay to support the stitches," implying that there was no apical attachment of the mesh to the sacrospinous ligament.45 This is a suboptimal use of TVM because it does not address a detachment-type defect common in advanced prolapse. The PROSPECT study reinforces the need for better surgical training and standardization of the TVM procedure.44
How TVM compares with sacrocolpopexy
When comparing the use of TVM with sacrocolpopexy, our experience has been that TVM yields similar outcomes to sacrocolpopexy with additional benefits. We completed a 1-year retrospective cohort study comparing robot-assisted laparoscopic sacrocolpopexy (RALS) with TVM in a total of 86 patients, with both approaches performed by the same surgeon. Both treatment groups showed statistically significant improvements in nearly all functional and quality-of-life measures, including urinary symptoms, sexual function, and POP-Q scores.40 In particular, points Aa and Ba on the POP-Q score were significantly improved with TVM as compared to RALS. This suggests that TVM can achieve both lateral and apical support, where sacrocolpopexy addresses only the apex.40 This has clinical significance when considering DeLancey and colleagues' dynamic magnetic resonance imaging study, which demonstrated advanced prolapse results from both lateral and apical detachment.46 In addition, TVM placement also was considerably faster than RALS by approximately 96 minutes and could be performed using regional anesthesia. Only 1 mesh exposure in each study arm was reported.40
Finally, as with other vaginal procedures, patients who undergo TVM placement require minimal to no pain medication postoperatively and report faster return to daily activities. Almost none of our patients require narcotics, which is a significant benefit in the face of the ongoing national opioid crisis.
Gutman and colleagues compared laparoscopic mesh hysteropexy with TVM; they demonstrated comparable cure rates and, again, significantly longer operative times for the laparoscopic approach (174 vs 64 minutes; P<.0001).47 This multicenter study reported mesh exposure rates of 2.7% for laparoscopy and 6.6% for TVM,47 again likely due to a split-thickness dissection.
Safety of TVM depends on the surgeon factor
Because of the reported complications associated with TVM, in 2011 the US Food and Drug Administration (FDA) issued an update on the safety and efficacy of TVM augmentation and mandated postmarket studies.48 While we do not dispute that the mesh exposure rates were accurate at the time the FDA document was issued, we recognize that exposure has been erroneously attributed to inherent properties of the mesh.
Mesh exposure rates reported in the literature vary widely, ranging from 0% to 30%, even when surgeons used identical mesh products.49 This clearly establishes that the main contributing variable is surgical technique. It is critically important to recognize the "surgeon factor" as a confounder in trials that compare surgical procedures.50 Studies on TVM have shown that low-volume surgeons had significantly higher reoperation rates, while high-volume surgeons achieved a 41% reduction in reoperations.51,52 When TVM is performed by expert surgeons, the reported mesh exposure rates for TVM are noticeably lower.40,42,43,53,54
Decreasing mesh exposure rates would reduce the most common adverse event associated with TVM, thus improving its safety. The critical step to successful TVM placement is the initial dissection. Gynecologists traditionally have performed a split-thickness, colporrhaphy-style dissection to place the mesh within the layers of the vaginal wall.55 Placement within these planes, however, is too superficial and increases the risk of exposure. By contrast, by consistently performing a full-thickness vaginal wall dissection (FIGURE 10) and placing the mesh in the true vesicovaginal space,56 we have achieved a TVM exposure rate as low as 0% to 3%.40,54 If we can standardize the dissection component across our subspecialty, the rate of mesh exposure undoubtedly will decrease.
The PROSPECT investigators readily admitted what the study was not: a trial conducted "exclusively by the most experienced surgeons in the highest volume centres¬with a highly protocolised technique."44 In reality, that is the kind of rigorous study on TVM that our subspecialty demands. We must hold ourselves accountable and ensure that only the most qualified surgeons are placing TVM.
Keep the mesh option available
We support the position of the American Urogynecologic Society in opposing an outright ban of TVM because such a restriction would deny our patients access to an effective, durable, and minimally invasive approach for prolapse repair.57
Share your thoughts! Send your Letter to the Editor to [email protected]. Please include your name and the city and state in which you practice.
- Wu JM, Matthews CA, Conover MM, Pate V, Jonsson Funk M. Lifetime risk of stress urinary incontinence or pelvic organ prolapse surgery. Obstet Gynecol. 2014;123(6):1201-1206.
- Olsen AL, Smith VJ, Bergstrom JO, Colling JC, Clark AL. Epidemiology of surgically managed pelvic organ prolapse and urinary incontinence. Obstet Gynecol. 1997;89(4):501-506.
- Nygaard I, Brubaker L, Zyczynski HM, et al. Long-term outcomes following abdominal sacrocolpopexy for pelvic organ prolapse. JAMA. 2013;309(19):2016-2024.
- American College of Obstetricians and Gynecologists, American Urogynecologic Society. Practice Bulletin No. 185 Summary: Pelvic organ prolapse. Obstet Gynecol. 2017;130(5):1170-1172.
- American Urogynecologic Society Best Practice Statement: Evaluation and counseling of patients with pelvic organ prolapse. Female Pelvic Med Reconstr Surg. 2017;23(5):281-287.
- Barber MD, Brubaker L, Burgio KL, et al; Eunice Kennedy Shriver National Institute of Child Health and Human Development Pelvic Floor Disorders Network. Comparison of 2 transvaginal surgical approaches and perioperative behavioral therapy for apical vaginal prolapse: the OPTIMAL randomized trial. JAMA. 2014;311(10):1023-1034.
- Chung CP, Miskimins R, Kuehl TJ, Yandell PM, Shull BL. Permanent suture used in uterosacral ligament suspension offers better anatomical support than delayed absorbable suture. Int Urogynecol J. 2012;23(2):223-227.
- Yazdany T, Yip S, Bhatia NN, Nguyen JN. Suture complications in a teaching institution among patients undergoing uterosacral ligament suspension with permanent braided suture. Int Urogynecol J. 2010;21(7):813-818.
- Toglia MR, Fagan MJ. Suture erosion rates and long-term surgical outcomes in patients undergoing sacrospinous ligament suspension with braided polyester suture. Am J Obstet Gynecol. 2008;198(5):600.e1-e4.
- Wong MJ, Rezvan A, Bhatia NN, Yazdany T. Uterosacral ligament vaginal vault suspension using delayed absorbable monofilament suture. Int Urogynecol J. 2011;22(11):1389-1394.
- Detollenaere RJ, den Boon J, Stekelenburg J, IntHout J, et al. Sacrospinous hysteropexy versus vaginal hysterectomy with suspension of the uterosacral ligaments in women with uterine prolapse stage 2 or higher: multicentre randomised non-inferiority trial. BMJ. 2015;351:h3717.
- Kapoor S, Sivanesan K, Robertson JA, Veerasingham M, Kapoor V. Sacrospinous hysteropexy: review and meta-analysis of outcomes. Int Urogynecol J. 2017;28(9):1285-1294.
- Madsen AM, Raker C, Sung VW. Trends in hysteropexy and apical support for uterovaginal prolapse in the United States from 2002 to 2012. Female Pelvic Med Reconstr Surg. 2017;23(6):365-371.
- Wei JT, Nygaard I, Richter HE, et al; Pelvic Floor Disorders Network. A midurethral sling to reduce incontinence after vaginal prolapse repair. N Engl J Med. 2012;366(25):2358-2367.
- Buchsbaum GM, Lee TG. Vaginal obliterative procedures for pelvic organ prolapse: a systematic review. Obstet Gynecol Surv. 2017;72(3):175-183.
- Zebede S, Smith AL, Plowright LN, Hegde A, Aguilar VC, Davila GW. Obliterative LeFort colpocleisis in a large group of elderly women. Obstet Gynecol. 2013;121(2 pt 1):279-284.
- Bochenska K, Leader-Cramer A, Mueller M, Dave B, Alverdy A, Kenton K. Perioperative complications following colpocleisis with and without concomitant vaginal hysterectomy. Int Urogynecol J. 2017;28(11):1671-1675.
- Jones K, Wang G, Romano R, St Marie P, Harmanli O. Colpocleisis: a survey of current practice patterns. Female Pelvic Med Reconstr Surg. 2017;23(4):276-280.
- Jones KA, Zhuo Y, Solak S, Harmanli O. Hysterectomy at the time of colpocleisis: a decision analysis. Int Urogynecol J. 2016;27(5):805-810.
- Kandadai P, Flynn M, Zweizig S, Patterson D. Cost-utility of routine endometrial evaluation before le fort colpocleisis. Female Pelvic Med Reconstr Surg. 2014;20(3):168-173.
- Reena C, Kekre AN, Kekre N. Occult stress incontinence in women with pelvic organ prolapse. Int J Gynaecol Obstet. 2007;97(1):31-34.
- Oliphant SS, Shepherd JP, Lowder JL. Midurethral sling for treatment of occult stress urinary incontinence at the time of colpocleisis: a decision analysis. Female Pelvic Med Reconstr Surg. 2012;18(4):216-220.
- Siddiqui NY, Grimes CL, Casiano ER, et al; Society of Gynecologic Surgeons Systematic Review Group. Mesh sacrocolpopexy compared with native tissue vaginal repair: a systematic review and meta-analysis. Obstet Gynecol. 2015;125(1):44-55.
- Winters JC, Dmochowski RR, Goldman HB, et al; American Urological Association; Society of Urodynamics, Female Pelvic Medicine and Urogenital Reconstruction. Urodynamic studies in adults: AUA/SUFU guideline. J Urol. 2012;188(6 suppl):2464-2472.
- Barber MD, Maher C. Apical prolapse. Int Urogynecol J. 2013;24(11):1815-1833.
- Maher C, Feiner B, Baessler K, Christmann-Schmid C, Haya N, Brown J. Surgery for women with apical vaginal prolapse. Cochrane Database Syst Rev. 2016;10:CD012376.
- Salamon CG, Lewis C, Priestley J, Gurshumov E, Culligan PJ. Prospective study of an ultra-lightweight polypropylene Y mesh for robotic sacrocolpopexy. Int Urogynecol J. 2013;24(8):1371-1375.
- Culligan PJ, Gurshumov E, Lewis C, et al. Subjective and objective results 1 year after robotic sacrocolpopexy using a lightweight Y-mesh. Int Urogynecol J. 2014;25(6):731-735.
- Eddib A, Danakas A, Hughes S, et al. Influence of morbid obesity on surgical outcomes in robotic-assisted gynecologic surgery. J Gynecol Surg. 2014;30(2):81-86.
- Gallo T, Kashani S, Patel DA, Elsahwi K, Silasi D-A, Azodi M. Robotic-assisted laparoscopic hysterectomy: outcomes in obese and morbidly obese patients. JSLS. 2012;16(3):421-427.
- Serati M, Bogani G, Sorice P, et al. Robot-assisted sacrocolpopexy for pelvic organ prolapse: a systematic review and meta-analysis of comparative studies. Eur Urol. 2014;66(2):303-318.
- Cundiff GW, Varner E, Visco AG, et al; Pelvic Floor Disorders Network. Risk factors for mesh/suture erosion following sacral colpopexy. Am J Obstet Gynecol. 2008;199(6):688.e1-e5.
- Wu JM, Wells EC, Hundley AF, Connolly A, Williams KS, Visco AG. Mesh erosion in abdominal sacral colpopexy with and without concomitant hysterectomy. Am J Obstet Gynecol. 2006;194(5):1418-1422.
- Costantini E, Brubaker L, Cervigni M, et al. Sacrocolpopexy for pelvic organ prolapse: evidence-based review and recommendations. Eur J Obstet Gynecol Reprod Biol. 2016;205:60-65.
- Tan-Kim J, Menefee SA, Luber KM, Nager CW, Lukacz ES. Prevalence and risk factors for mesh erosion after laparoscopic-assisted sacrocolpopexy. Int Urogynecol J. 2011;22:205-212.
- Culligan PJ, Salamon C, Priestley JL, Shariati A. Porcine dermis compared with polypropylene mesh for laparoscopic sacrocolpopexy: a randomized controlled trial. Obstet Gynecol. 2013;121(1):143-151.
- Tate SB, Blackwell L, Lorenz DJ, Steptoe MM, Culligan PJ. Randomized trial of fascia lata and polypropylene mesh for abdominal sacrocolpopexy: 5-year follow-up. Int Urogynecol J. 2011;22(2):137-143.
- Culligan PJ, Blackwell L, Goldsmith LJ, Graham CA, Rogers A, Heit MH. A randomized controlled trial comparing fascia lata and synthetic mesh for sacral colpopexy. Obstet Gynecol. 2005;106(1):29-37.
- ACOG Committee on Practice Bulletins-Gynecology, American Urogynecologic Society. ACOG Practice Bulletin No. 185: Pelvic organ prolapse. Obstet Gynecol. 2017;130(5):e234-e250.
- Jambusaria LH, Murphy M, Lucente VR. One-year functional and anatomic outcomes of robotic sacrocolpopexy versus vaginal extraperitoneal colpopexy with mesh. Female Pelvic Med Reconstr Surg. 2015;21(2):87-92.
- Maher C, Feiner B, Baessler K, Christmann-Schmid C, Haya N, Marjoribanks J. Transvaginal mesh or grafts compared with native tissue repair for vaginal prolapse. Cochrane Database System Rev. 2016:CD012079.
- Meyer I, McGwin G, Swain T, Alvarez MD, Ellington DR, Richter HE. Synthetic graft augmentation in vaginal prolapse surgery: long-term objective and subjective outcomes. J Minim Invasive Gynecol. 2016;23(4):614-621.
- Weintraub AY, Friedman T, Baumfeld Y, Neymeyer J, Neuman M, Krissi H. Long‐term functional outcomes following mesh‐augmented posterior vaginal prolapse repair. Int J Gynecol Obstet. 2016;135(1):107-111.
- Glazener CM, Breeman S, Elders A, et al; PROSPECT Study Group. Mesh, graft, or standard repair for women having primary transvaginal anterior or posterior compartment prolapse surgery: two parallel-group, multicentre, randomised, controlled trials (PROSPECT). Lancet. 2017;389(10067):381-392.
- Clinical and cost-effectiveness of surgical options for the management of anterior and/or posterior vaginal wall prolapse: two randomized controlled trials within Comprehensive Cohort Study. PROSPECT study protocol. The National Institute for Health Research. https://www.journalslibrary.nihr.ac.uk/programmes/hta/076018. Accessed January 17, 2018.
- Chen L, Lisse S, Larson K, Berger MB, Ashton-Miller JA, DeLancey JO. Structural failure sites in anterior vaginal wall prolapse: identification of a collinear triad. Obstet Gynecol. 2016;128(4):853-862.
- Gutman RE, Rardin CR, Sokol ER, et al. Vaginal and laparoscopic mesh hysteropexy for uterovaginal prolapse: a parallel cohort study. Am J Obstet Gynecol. 2017;216(1):38.e1-e11.
- US Food and Drug Administration. Urogynecologic surgical mesh: update on the safety and effectiveness of transvaginal placement for pelvic organ prolapse. https://www.fda.gov/downloads/medicaldevices/safety/alertsandnotices/ucm262760.pdf. Published July 2011. Accessed January 9, 2017.
- Murphy M, Holzberg A, van Raalte H, et al; Pelvic Surgeons Network. Time to rethink: an evidence-based response from pelvic surgeons to the FDA Safety Communication: "Update on serious complications associated with transvaginal placement of surgical mesh for pelvic organ prolapse." Int Urogynecol J. 2012;23(1):5-9.
- Roman H, Marpeau L, Hulsey TC. Surgeons' experience and interaction effect in randomized controlled trials regarding new surgical procedures. Am J Obstet Gynecol. 2008;199(2):108.e1-e6.
- Eilber KS, Alperin M, Khan A, et al. The role of the surgeon on outcomes of vaginal prolapse surgery with mesh. Female Pelvic Med Reconstr Surg. 2017;23 (5):293-296.
- Kelly EC, Winick-Ng J, Welk B. Surgeon experience and complications of transvaginal prolapse mesh. Obstet Gynecol. 2016;128(1):65-72.
- Altman D, Vayrynen T, Engh ME, Axelsen S, Falconer C; Nordic Transvaginal Mesh Group. Anterior colporrhaphy versus transvaginal mesh for pelvic-organ prolapse. N Engl J Med 2011;364(19):1826-1836.
- van Raalte HM, Lucente VR, Molden SM, Haff R, Murphy M. One-year anatomic and quality-of-life outcomes after the Prolift procedure for treatment of posthysterectomy prolapse. Am J Obstet Gynecol. 2008:199(6):694.e1-e6.
- Iyer S, Botros SM. Transvaginal mesh: a historical review and update of the current state of affairs in the United States. Int Urogynecol J. 2017;28(4):527-535.
- Ting M, Gonzalez A, Ephraim S, Murphy M, Lucente V. The importance of a full thickness vaginal wall dissection. Comment on "Transvaginal mesh: a historical review and update of the current state of affairs in the United States." Int Urogynecol J. 2017;28(10):1609-1610.
- American Urogynecologic Society. Position statement on restriction of surgical options for pelvic floor disorders. https://www.augs.org/assets/1/6/Position_Statement_Surgical_Options_for_PFDs.pdf. Published March 26, 2013. Accessed January 9, 2017.
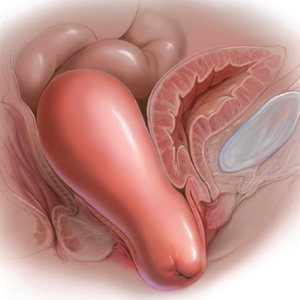
QI initiative reduces antibiotic use in chorioamnionitis-exposed newborns
A hospital quality improvement initiative reduced antibiotic use by more than half when well-appearing newborns exposed to chorioamnionitis were initially monitored for symptoms instead of routinely given antibiotics, found a study in Pediatrics.
“The reduction in both antibiotic use and laboratory testing occurred without clinically relevant delays in care or poor outcomes,” wrote Neha S. Joshi, MD, of Stanford (Calif.) University and her associates.
At Lucile Packard Children’s Hospital Stanford, about half of all antibiotic use for late-preterm or term infants went to newborns exposed to chorioamnionitis. The hospital developed a quality improvement initiative to safely reduce unnecessary antibiotic use in these patients and to decrease unnecessary lab testing given the weak clinical relevance of CBC counts and C-reactive protein labs for determining whether to give a well-appearing child antibiotics, the study authors explained.
Before the initiative began, standard practice included admitting all infants to the neonatal ICU who were at least 34 weeks’ gestation and exposed to chorioamnionitis. They were treated with ampicillin and gentamicin until early-onset sepsis was excluded. Lab evaluations included a CBC count, blood culture, and multiple C-reactive protein labs.
Under the new protocol, symptomatic newborns still had the same labs and received empirical antibiotics. Well-appearing, late-preterm or term infants exposed to chorioamnionitis first spent 2 hours of skin-to-skin contact with their mothers and then were monitored clinically in a level II nursery for at least 24 hours. Unless clinical symptoms developed in that time, the infants then were returned to their mothers until discharge without labs or antibiotics. Those who did develop potentially septic signs/symptoms, as determined by the treating physician, were evaluated and then received antibiotics if deemed appropriate.
During the first 15 months of the quality improvement initiative, 310 infants (5.7% of the 5,425 total births with at least 34 weeks’ gestation) were exposed to chorioamnionitis. Of these, 23 (7.4%) were symptomatic and began antibiotics; another 10 (3.2%) were admitted to the neonatal ICU for a congenital anomaly.
The researchers collected data on antibiotic use, lab tests, cultures, and clinical outcomes from the remaining 277 well-appearing newborns; 88% did not receive antibiotics during their hospital stay, and 83% underwent no laboratory testing. Only 17% of infants had lab testing for sepsis; none had culture result–positive, early-onset sepsis.
Only 12% of infants who initially appeared well developed signs/symptoms of sepsis, underwent laboratory testing, and received antibiotics. Nearly half of these (5% of all infants) received antibiotic treatment for at least 5 days despite negative cultures, while the other 7% received antibiotics for less than 48 hours, Dr. Joshi and her colleagues reported.
Infants with at least 34 weeks’ gestation receiving antibiotics at the hospital dropped from 12.3% before the initiative to 5.5% afterward, a 55% decrease (95% confidence interval, 40%-60%), the researchers said. Study limitations included a lack of postdischarge follow-up, the variability in physician decisions about which infants were symptomatic and which ones needed antibiotics, and an inability to generalize findings to institutions without 24/7 availability of neonatal hospitalists.
Past studies have found that all newborns with positive cultures showed symptoms at birth and needed resuscitation, continuous positive airway pressure, or intubation.
“An infant who is well-appearing at birth likely has an even lower risk of early-onset sepsis even in the setting of chorioamnionitis, and an empirical antibiotic treatment strategy for chorioamnionitis-exposed infants will result in a large number of uninfected infants being treated,” Dr. Joshi and her associates said. “Updated treatment approaches are needed to reduce unnecessary antibiotic exposure and provide higher-value care in this population.”
The study did not use external funding. The authors had no disclosures.
SOURCE: Joshi NS et al. Pediatrics. 2018;141(4):e20172056.
FROM PEDIATRICS
Key clinical point:
Major finding: After a quality improvement initiative was implemented, 55% fewer late-preterm and term, chorioamnionitis-exposed infants received antibiotics without an increase in negative outcomes.
Data source: A study of 310 chorioamnionitis-exposed newborns who were late preterm or term at a California hospital.
Disclosures: The study did not use external funding. The authors had no relevant financial disclosures.
Source: Joshi NS et al. Pediatrics. 2018;141(4):e20172056.
VIDEO: Ultrasound with Doppler
The video associated with this article is no longer available on this site. Please view all of our videos on the MDedge YouTube channel
The video associated with this article is no longer available on this site. Please view all of our videos on the MDedge YouTube channel
The video associated with this article is no longer available on this site. Please view all of our videos on the MDedge YouTube channel
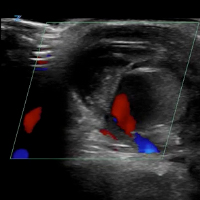
Leading best gynecologic surgical care into the next decade
With today’s rapid health care transformation from fee for service to fee for value, it is imperative that gynecologic surgeons understand, engage in, and lead this transformation. The value equation is defined as patient experience times clinical outcome divided by cost. This 2-part special issue highlights some of the key content shared at the 2018 SGS annual meeting, held in Orlando, Florida, to help you engage and lead.
The keynote address was “Patient Experience: It is not about making people happy” and was presented by James Merlino, MD (author of Service Fanatics: How to Build Superior Patient Experience the Cleveland Clinic Way), who is former Chief Experience Officer and colorectal surgeon at the Cleveland Clinic and currently President and Chief Medical Officer, Strategic Consulting at Press Ganey. Dr. Merlino clearly defines that the patient experience is really about patient safety and quality. He shares practical tips to help physicians improve communication with patients, which not only increases patient satisfaction but also physician satisfaction. His wife Amy Merlino, MD, an ObGyn, coauthored the piece with him and shares their journey to implement programs that were impactful and designed to create greater personal appreciation and mindfulness of physicians’ clinical work.
Optimal surgical outcomes delivered at lowest cost are the other key components of value health care. Endometriosis and the management of stage 3 and 4 pelvic organ prolapse remain challenging clinical scenarios that we face often. Rosanne Kho, MD, and colleagues taught a postgraduate course on contemporary management of deep infiltrating endometriosis and, in part 2 of this special section, share key highlights and pearls from that course. A highpoint of the meeting was a debate on the optimal management of stage 3 and 4 pelvic organ prolapse. Peter Rosenblatt, MD, moderated a lively discussion involving Rebecca Rogers, MD, who advocated for native tissue repair; Patrick Culligan, MD, who promoted abdominal sacrocolpopexy; and Vincent Lucente, MD, backing transvaginal mesh. They summarize their arguments beginning on page SS4 for you to decide.
Lastly, with increasing demand for minimally invasive hysterectomy, many surgeons could benefit from simulation training to enhance their practice, hone up on skills, and provide warm-up to sharpen technical skills prior to the day in the operating room. Simulation training improves patient safety and outcomes and lowers cost. Simulation training is also key in training residents and fellows. Christine Vaccaro, MD, and colleagues taught a postgraduate course on what is new in simulation training for hysterectomy and summarize important technologies in part 2 of this special section.
I hope you enjoy the content of this special section and find it impactful to your practice and future.
FDA expands indication for blinatumomab in treating ALL
The Food and Drug Administration has granted accelerated who are in remission but still have minimal residual disease (MRD).
This is the first FDA-approved treatment for those with MRD, the FDA said in a statement.
The current approval was based on a single-arm clinical trial of 86 patients in first or second complete remission who had detectable MRD in at least 1 out of 1,000 cells in their bone marrow. Undetectable MRD was achieved by 70 patients after one cycle of blinatumomab treatment. More than half of the patients remained alive and in remission for at least 22.3 months, the FDA said.
Common side effects include bacterial and pathogen-unspecified infections, pyrexia, headache, infusion-related reactions, neutropenia, anemia, febrile neutropenia, and thrombocytopenia. The drug carries a boxed warning about cytokine release syndrome at the start of the first treatment. The FDA also warns that children weighing less than 22 kg should receive the drug prepared with preservative-free saline because of the risk of serious adverse reactions in pediatric patients from a benzyl alcohol preservative.
Blinatumomab is marketed as Blincyto by Amgen.
VIDEO: Initial Bedside Ultrasound of Pulsatile Hand Mass

Tactics for reducing the rate of surgical site infection following cesarean delivery
The 25-year-old patient (G1P0) is at 41 weeks’ gestation. She has been fully dilated and pushing for 3.5 hours, at station 0, with regular strong contractions, no descent and a Category II fetal heart-rate tracing. The estimated fetal weight is 8 lb. Membranes have been ruptured for 10 hours. Maternal temperature is 99° F and her prepregnancy body mass index (BMI) was 32 kg/m2. After examining the patient and reviewing the labor progress, you recommend a cesarean delivery. As you prepare for the delivery, you identify the patient as high risk for surgical site infection and begin to recall all the interventions that might reduce postoperative infection for a patient at high risk for infection.
Halsted’s surgical principles
Dr. William Steward Halsted, the first chief of surgery at Johns Hopkins Hospital, articulated a set of surgical principles that included strict aseptic technique, gentle tissue handling, meticulous hemostasis, minimum tension on tissue, accurate tissue apposition, preservation of blood supply, and obliteration of dead space where appropriate. These principles of “safe surgery” are believed to improve surgical outcomes and reduce the risk of surgical site infection.1
Preoperative antibiotics
All obstetricians who perform cesarean delivery know the importance of administering a narrow-spectrum antibiotic, such as cefazolin or ampicillin, prior to the skin incision, but not more than 60 minutes before the incision, to help reduce the risk of wound infection and endometritis. In a meta-analysis of 82 studies involving more than 13,000 women the administration of a preoperative antibiotic compared with placebo reduced the risk of wound infection (relative risk [RR], 0.40; 95% confidence interval [CI], 0.35–0.46) and endometritis (RR, 0.38; 95% CI, 0.34–0.42).2
Cefazolin 3 g versus 2 g for obese patients
There are no data from randomized trials of cesarean delivery that directly compare the efficacy of preoperative cefazolin at doses of 2 g and 3 g to reduce the risk of infection. However, based on the observation that, for any given dose of cefazolin, circulating levels are reduced in obese patients, many authorities recommend that if the patient weighs ≥120 kg that 3 g of cefazolin should be administered.3
Extended-spectrum preoperative antibiotics
Some experts recommend that, for women in labor and for women with more than 4 hours of ruptured membranes, IV azithromycin 500 mg be added to the standard narrow-spectrum cefazolin regimen to reduce the rate of postoperative infection. In one trial, 2,013 women who were in labor or had more than 4 hours of ruptured membranes were randomly assigned to IV cefazolin alone or IV cefazolin plus azithromycin 500 mg prior to cesarean delivery.4 The cefazolin dose was reported to be weight-based utilizing the BMI at the time of delivery. The rates of endometritis (3.8% vs 6.1%) and wound infection (2.4% vs 6.6%) were lower in the women receiving extended-spectrum antibiotics versus cefazolin monotherapy.
Concerns have been raised about the impact of extended-spectrum antibiotics on the newborn microbiome and risk of accelerating the emergence of bacteria resistant to available antibiotics. Limiting the use of azithromycin to those cesarean delivery cases in which the patient is immunosuppressed, diabetic, obese, in labor and/or with prolonged ruptured membranes would reduce the number of women and newborns exposed to the drug and achieve the immediate health goal of reducing surgical infection.
Preoperative vaginal preparation
Many authorities recommend the use of a preoperative povidone- iodine vaginal scrub for 30 seconds prior to cesarean delivery for women in labor and women with ruptured membranes. In a meta-analysis of 16 trials involving 4,837 women, the women who received vaginal cleansing before cesarean delivery had a significantly lower incidence of endometritis (4.5% vs 8.8%) and postoperative fever (9.4% vs 14.9%) compared with those who did not have vaginal cleansing.5 Most of the benefit in reducing the risk of endometritis was confined to women in labor before the cesarean delivery (8.1% vs 13.8%) and women with ruptured membranes (4.3% vs 20.1%).5
Metronidazole gel 5 g also has been reported to be effective in reducing the rate of endometritis associated with cesarean delivery. In one study, 224 women having a cesarean delivery for various indications were randomly assigned to preoperative treatment with vaginally administered metronidazole gel 5 g or placebo gel. All women also received one dose of preoperative intravenous antibiotics. The rates of endometritis were 7% and 17% in the metronidazole and placebo groups, respectively.6
Povidone-iodine is approved for vaginal surgical site cleansing. For women with allergies to iodine or povidone-iodine, the options for vaginal cleansing are limited. The American College of Obstetricians and Gynecologists has noted the chlorhexidine gluconate solutions with a high concentration of alcohol should not be used for vaginal cleansing because the alcohol can irritate the mucosal epithelium. However, although not US Food and Drug Administration–approved for vaginal cleansing, solutions of chlorhexidine with a low alcohol content (Hibiclens, chlorhexidine with 4% alcohol concentration) are thought to be safe and may be considered for off-label use in vaginal cleansing.7
Preoperative abdominal preparation with chlorhexidine
Some authorities recommend skin preparation with chlorhexidine rather than povidone-iodine prior to cesarean delivery. Two recent randomized trials in women undergoing cesarean delivery8,9 and one trial in patients undergoing general surgery operations10 reported a reduction in surgical site infection with chlorhexidine. However, other trials have reported no difference in the rate of surgical site infection with these two skin preparation methods.11,12
Changing gloves and equipment after delivery of the newborn
Currently there is no high-quality evidence that changing gloves after delivery of the newborn or using new surgical instruments for closure reduces the risk of postcesarean infection. Two small clinical trials reported that changing gloves after delivery of the newborn did not reduce the rate of postcesarean infection.13,14
Postoperative antibiotics (a heretical challenge to the central dogma of antibiotic prophylaxis in surgery)
The central dogma of antibiotic prevention of postoperative infection is that antibiotics administered just before skin incision are effective, and postoperative antibiotics to prevent surgical infection generally are not useful. For the case of cesarean delivery, where the rate of postcesarean infection is very high, that dogma is being questioned. In a recent clinical trial, 403 women with a prepregnancy BMI ≥30 kg/m2 were randomly assigned to postcesarean treatment with oral cephalexin plus metronidazole (500 mg of each medication every 8 hours for 6 doses) or placebo pills.15 All women received preoperative IV cefazolin 2 g, indicating that the dosing was probably not weight-based. The surgical site infection rates in the cephalexin plus metronidazole and placebo groups were 6.4% and 15.4%, respectively (RR, 0.41; 95% CI, 0.22–0.77; P = .01). In a subgroup analysis based on the presence or absence of ruptured membranes, postoperative oral cephalexin plus metronidazole was most beneficial for the women with ruptured membranes. Among women with ruptured membranes the surgical site infection rates in the cephalexin plus metronidazole and placebo groups were 9.5% and 30.2%, respectively. Among women with intact membranes the surgical site infection rates in the cephalexin plus metronidazole and placebo groups were 5% and 8.7%, respectively.
Given that these findings are not consistent with current dogma, clinicians should be cautious about using postcesarean antibiotics and await confirmation in additional trials. Of relevance, a randomized study of women with chorioamnionitis who were treated precesarean delivery with ampicillin, gentamicin, and clindamycin did not benefit from the administration of additional postoperative antibiotics (one additional dose of gentamicin and clindamycin) compared with no postdelivery antibiotics.16
Does suture selection matter?
In one randomized trial comparing two suture types, 550 women undergoing nonemergent cesarean delivery were randomly assigned to subcuticular skin closure with polyglactin 910 (Vicryl) or poliglecaprone 25 (Monocryl) suture. The poliglecaprone 25 suture was associated with a lower rate of wound complications (8.8% vs 14.4%; 95% CI, 0.37–99; P = .04).17 However, a post-hoc analysis of a randomized trial of skin preparation did not observe a difference in wound complications between the use of polyglactinor poliglecaprone suture for skin closure.18
Prophylactic negative-pressure wound therapy: An evolving best practice?
A meta-analysis of 6 randomized trials and 3 cohort studies reported that in high-risk obese women the use of prophylactic negative-pressure wound therapy compared with standard wound dressing resulted in a decrease in surgical site infection (RR, 0.45; 95% CI, 0.31–0.66).19 The number needed to treat was 17. In one recent study, the wound outcomes following cesarean delivery among women with a BMI ≥40 kg/m2 were compared in 234 women who received and 233 women who did not receive negative-pressure wound therapy.20 Wound infection was observed in 5.6% and 9.9% of the treated and untreated women, respectively.20 However, another meta-analysis of prophylactic negative-pressure wound therapy for obese women undergoing cesarean delivery did not report any benefit.21
Let’s work on continuous improvement
Cesarean delivery is a common major operation and is associated with wound infections and endometritis at rates much greater than those observed after vaginal delivery or other major intra-abdominal operations. As obstetricians, we can do more to guide practice toward continuous improvement in surgical outcomes. Systematically using a bundle of evidence-based interventions, including proper antibiotic selection, timing, and dosing; use of hair removal with clippers; use of chlorhexidine abdominal prep; removal of the placenta with gentle traction; and closure of the subcutaneous layer if tissue depth is ≥2 cm, will reduce the rate of postcesarean infection.22 Although aspirational, we may, someday, achieve a post‑cesarean infection rate less than 1%!
CASE Conclusion
The patient was noted to be at high risk for postcesarean infection because she had both an elevated BMI and ruptured membranes. The surgeon astutely decided to administer cefazolin 3 g and azithromycin 500 mg, cleanse the vagina with povidone-iodine, use chlorhexidine for the abdominal prep, use poliglecaprone 25 subcuticular skin closure, and did not use postoperative antibiotics or prophylactic wound vacuum. Following an uneventful cesarean delivery, the patient was discharged without an infection on postoperative day 4.

Share your thoughts! Send your Letter to the Editor to [email protected]. Please include your name and the city and state in which you practice.
- Cameron JL. William Steward Halsted: our surgical heritage. Ann Surg. 1997;225(5):445–458.
- Smaill FM, Grivell RM. Antibiotic prophylaxis versus no prophylaxis for preventing infection after cesarean section. Cochrane Database Syst Rev. 2014;(10):CD007482.
- Bratzler DW, Dellinger EP, Olsen KM, et al. Clinical practice guidelines for antimicrobial prophylaxis in surgery. Am J Health Syst Pharm. 2013;70(3):195–283.
- Tita AT, Szychowski JM, Boggess K, et al; C/SOAP Trial Consortium. Adjunctive azithromycin prophylaxis for cesarean delivery. N Engl J Med. 2016;375(13):1231–1241.
- Caissutti C, Saccone G, Zullo F, et al. Vaginal cleansing before cesarean delivery: a systemic review and meta-analysis. Obstet Gynecol. 2017;130(3):527–538.
- Pitt C, Sanchez-Ramos L, Kaunitz AM. Adjunctive intravaginal metronidazole for the prevention of postcesarean endometritis: a randomized controlled trial. Obstet Gynecol. 2001;98(5 pt 1):745–750.
- American College of Obstetricians and Gynecologists; Committee on Gynecologic Practice. Committee Opinion No. 571: solutions for surgicalpreparation of the vagina. Obstet Gynecol. 2013;122(3):718–720.
- Tuuli MG, Liu J, Stout MJ, et al. A randomized trial comparing skin antiseptic agents at cesarean delivery. N Engl J Med. 2016;374(7):647–655.
- Kunkle CM, Marchan J, Safadi S, Whitman S, Chmait RH. Chlorhexidine gluconate versus povidone iodine at cesarean delivery: a randomized controlled trial. J Matern Fetal Neonatal Med. 2015;28(5):573–577.
- Darouiche RO, Wall MJ Jr, Itani KM, et al. Chlorhexidine-alcohol versus povidone-iodine for surgical-site antisepsis. N Engl J Med. 2010;362(1):18–26.
- Ngai IM, Van Arsdale A, Govindappagari S, et al. Skin preparation for prevention of surgical site infection after cesarean delivery: a randomized controlled trial. Obstet Gynecol. 2015;126(6):1251–1257.
- Springel EH, Wang XY, Sarfoh VM, Stetzer BP, Weight SA, Mercer BM. A randomized open-label controlled trial of chlorhexidine-alcohol vs povidone-iodine for cesarean antisepsis: the CAPICA trial. Am J Obstet Gynecol. 2017;217(4):463.e1–e8.
- Turrentine MA, Banks TA. Effect of changing gloves before placental extraction on incidence of postcesarean endometritis. Infect Dis Obstet Gynecol. 1996;4(1):16–19.
- Cernadas M, Smulian JC, Giannina G, Ananth CV. Effects of placental delivery method and intraoperative glove changing on postcesareanfebrile morbidity. J Matern Fetal Med. 1998;7(2):100–104.
- Valent AM, DeArmond C, Houston JM, et al. Effect of post-cesarean delivery oral cephalexin and metronidazole on surgical site infection among obese women: a randomized clinical trial. JAMA. 2017;318(11):1026–1034.
- Shanks AL, Mehra S, Gross G, Colvin R, Harper LM, Tuuli MG. Treatment utility of postpartum antibiotics in chorioamnionitis study. Am J Perinatol. 2016;33(8):732–737.
- Buresch AM, Van Arsdale A, Ferzli M, et al. Comparison of subcuticular suture type for skin closure after cesarean delivery: a randomized controlled trial. Obstet Gynecol. 2017;130(3): 521–526.
- Tuuli MG, Stout MJ, Martin S, Rampersad RM, Cahill AG, Macones GA. Comparison of suture materials for subcuticular skin closure at cesarean delivery. Am J Obstet Gynecol. 2016;215(4): 490.e1–e5.
- Yu L, Kronen RJ, Simon LE, Stoll CR, Colditz GA, Tuuli MG. Prophylactic negative-pressure wound therapy after cesarean is associated with reduced risk of surgical site infection: a systematic review and meta-analysis. Am J Obstet Gynecol. 2018;218(2):200–210.e1.
- Looby MA, Vogel RI, Bangdiwala A, Hyer B, Das K. Prophylactic negative pressure wound therapy in obese patients following cesarean delivery. Surg Innov. 2018;25(1):43–49.
- Smid MD, Dotters-Katz SK, Grace M, et al. Prophylactic negative pressure wound therapy for obese women after cesarean delivery: a systematic review and meta-analysis. Obstet Gynecol. 2017;130(5):969–978.
- Carter EB, Temming LA, Fowler S, et al. Evidence-based bundles and cesarean delivery surgical site infections: a systematic review and meta-analysis. Obstet Gynecol. 2017;130(4):735–746.

Dr. Barbieri is Editor in Chief, OBG Management, and Chair, Department of Obstetrics and Gynecology, Brigham and Women's Hospital, and Kate Macy Ladd Professor of Obstetrics, Gynecology and Reproductive Biology, Harvard Medical School.
Dr. Barbieri reports no financial relationships relevant to this article.
The 25-year-old patient (G1P0) is at 41 weeks’ gestation. She has been fully dilated and pushing for 3.5 hours, at station 0, with regular strong contractions, no descent and a Category II fetal heart-rate tracing. The estimated fetal weight is 8 lb. Membranes have been ruptured for 10 hours. Maternal temperature is 99° F and her prepregnancy body mass index (BMI) was 32 kg/m2. After examining the patient and reviewing the labor progress, you recommend a cesarean delivery. As you prepare for the delivery, you identify the patient as high risk for surgical site infection and begin to recall all the interventions that might reduce postoperative infection for a patient at high risk for infection.
Halsted’s surgical principles
Dr. William Steward Halsted, the first chief of surgery at Johns Hopkins Hospital, articulated a set of surgical principles that included strict aseptic technique, gentle tissue handling, meticulous hemostasis, minimum tension on tissue, accurate tissue apposition, preservation of blood supply, and obliteration of dead space where appropriate. These principles of “safe surgery” are believed to improve surgical outcomes and reduce the risk of surgical site infection.1
Preoperative antibiotics
All obstetricians who perform cesarean delivery know the importance of administering a narrow-spectrum antibiotic, such as cefazolin or ampicillin, prior to the skin incision, but not more than 60 minutes before the incision, to help reduce the risk of wound infection and endometritis. In a meta-analysis of 82 studies involving more than 13,000 women the administration of a preoperative antibiotic compared with placebo reduced the risk of wound infection (relative risk [RR], 0.40; 95% confidence interval [CI], 0.35–0.46) and endometritis (RR, 0.38; 95% CI, 0.34–0.42).2
Cefazolin 3 g versus 2 g for obese patients
There are no data from randomized trials of cesarean delivery that directly compare the efficacy of preoperative cefazolin at doses of 2 g and 3 g to reduce the risk of infection. However, based on the observation that, for any given dose of cefazolin, circulating levels are reduced in obese patients, many authorities recommend that if the patient weighs ≥120 kg that 3 g of cefazolin should be administered.3
Extended-spectrum preoperative antibiotics
Some experts recommend that, for women in labor and for women with more than 4 hours of ruptured membranes, IV azithromycin 500 mg be added to the standard narrow-spectrum cefazolin regimen to reduce the rate of postoperative infection. In one trial, 2,013 women who were in labor or had more than 4 hours of ruptured membranes were randomly assigned to IV cefazolin alone or IV cefazolin plus azithromycin 500 mg prior to cesarean delivery.4 The cefazolin dose was reported to be weight-based utilizing the BMI at the time of delivery. The rates of endometritis (3.8% vs 6.1%) and wound infection (2.4% vs 6.6%) were lower in the women receiving extended-spectrum antibiotics versus cefazolin monotherapy.
Concerns have been raised about the impact of extended-spectrum antibiotics on the newborn microbiome and risk of accelerating the emergence of bacteria resistant to available antibiotics. Limiting the use of azithromycin to those cesarean delivery cases in which the patient is immunosuppressed, diabetic, obese, in labor and/or with prolonged ruptured membranes would reduce the number of women and newborns exposed to the drug and achieve the immediate health goal of reducing surgical infection.
Preoperative vaginal preparation
Many authorities recommend the use of a preoperative povidone- iodine vaginal scrub for 30 seconds prior to cesarean delivery for women in labor and women with ruptured membranes. In a meta-analysis of 16 trials involving 4,837 women, the women who received vaginal cleansing before cesarean delivery had a significantly lower incidence of endometritis (4.5% vs 8.8%) and postoperative fever (9.4% vs 14.9%) compared with those who did not have vaginal cleansing.5 Most of the benefit in reducing the risk of endometritis was confined to women in labor before the cesarean delivery (8.1% vs 13.8%) and women with ruptured membranes (4.3% vs 20.1%).5
Metronidazole gel 5 g also has been reported to be effective in reducing the rate of endometritis associated with cesarean delivery. In one study, 224 women having a cesarean delivery for various indications were randomly assigned to preoperative treatment with vaginally administered metronidazole gel 5 g or placebo gel. All women also received one dose of preoperative intravenous antibiotics. The rates of endometritis were 7% and 17% in the metronidazole and placebo groups, respectively.6
Povidone-iodine is approved for vaginal surgical site cleansing. For women with allergies to iodine or povidone-iodine, the options for vaginal cleansing are limited. The American College of Obstetricians and Gynecologists has noted the chlorhexidine gluconate solutions with a high concentration of alcohol should not be used for vaginal cleansing because the alcohol can irritate the mucosal epithelium. However, although not US Food and Drug Administration–approved for vaginal cleansing, solutions of chlorhexidine with a low alcohol content (Hibiclens, chlorhexidine with 4% alcohol concentration) are thought to be safe and may be considered for off-label use in vaginal cleansing.7
Preoperative abdominal preparation with chlorhexidine
Some authorities recommend skin preparation with chlorhexidine rather than povidone-iodine prior to cesarean delivery. Two recent randomized trials in women undergoing cesarean delivery8,9 and one trial in patients undergoing general surgery operations10 reported a reduction in surgical site infection with chlorhexidine. However, other trials have reported no difference in the rate of surgical site infection with these two skin preparation methods.11,12
Changing gloves and equipment after delivery of the newborn
Currently there is no high-quality evidence that changing gloves after delivery of the newborn or using new surgical instruments for closure reduces the risk of postcesarean infection. Two small clinical trials reported that changing gloves after delivery of the newborn did not reduce the rate of postcesarean infection.13,14
Postoperative antibiotics (a heretical challenge to the central dogma of antibiotic prophylaxis in surgery)
The central dogma of antibiotic prevention of postoperative infection is that antibiotics administered just before skin incision are effective, and postoperative antibiotics to prevent surgical infection generally are not useful. For the case of cesarean delivery, where the rate of postcesarean infection is very high, that dogma is being questioned. In a recent clinical trial, 403 women with a prepregnancy BMI ≥30 kg/m2 were randomly assigned to postcesarean treatment with oral cephalexin plus metronidazole (500 mg of each medication every 8 hours for 6 doses) or placebo pills.15 All women received preoperative IV cefazolin 2 g, indicating that the dosing was probably not weight-based. The surgical site infection rates in the cephalexin plus metronidazole and placebo groups were 6.4% and 15.4%, respectively (RR, 0.41; 95% CI, 0.22–0.77; P = .01). In a subgroup analysis based on the presence or absence of ruptured membranes, postoperative oral cephalexin plus metronidazole was most beneficial for the women with ruptured membranes. Among women with ruptured membranes the surgical site infection rates in the cephalexin plus metronidazole and placebo groups were 9.5% and 30.2%, respectively. Among women with intact membranes the surgical site infection rates in the cephalexin plus metronidazole and placebo groups were 5% and 8.7%, respectively.
Given that these findings are not consistent with current dogma, clinicians should be cautious about using postcesarean antibiotics and await confirmation in additional trials. Of relevance, a randomized study of women with chorioamnionitis who were treated precesarean delivery with ampicillin, gentamicin, and clindamycin did not benefit from the administration of additional postoperative antibiotics (one additional dose of gentamicin and clindamycin) compared with no postdelivery antibiotics.16
Does suture selection matter?
In one randomized trial comparing two suture types, 550 women undergoing nonemergent cesarean delivery were randomly assigned to subcuticular skin closure with polyglactin 910 (Vicryl) or poliglecaprone 25 (Monocryl) suture. The poliglecaprone 25 suture was associated with a lower rate of wound complications (8.8% vs 14.4%; 95% CI, 0.37–99; P = .04).17 However, a post-hoc analysis of a randomized trial of skin preparation did not observe a difference in wound complications between the use of polyglactinor poliglecaprone suture for skin closure.18
Prophylactic negative-pressure wound therapy: An evolving best practice?
A meta-analysis of 6 randomized trials and 3 cohort studies reported that in high-risk obese women the use of prophylactic negative-pressure wound therapy compared with standard wound dressing resulted in a decrease in surgical site infection (RR, 0.45; 95% CI, 0.31–0.66).19 The number needed to treat was 17. In one recent study, the wound outcomes following cesarean delivery among women with a BMI ≥40 kg/m2 were compared in 234 women who received and 233 women who did not receive negative-pressure wound therapy.20 Wound infection was observed in 5.6% and 9.9% of the treated and untreated women, respectively.20 However, another meta-analysis of prophylactic negative-pressure wound therapy for obese women undergoing cesarean delivery did not report any benefit.21
Let’s work on continuous improvement
Cesarean delivery is a common major operation and is associated with wound infections and endometritis at rates much greater than those observed after vaginal delivery or other major intra-abdominal operations. As obstetricians, we can do more to guide practice toward continuous improvement in surgical outcomes. Systematically using a bundle of evidence-based interventions, including proper antibiotic selection, timing, and dosing; use of hair removal with clippers; use of chlorhexidine abdominal prep; removal of the placenta with gentle traction; and closure of the subcutaneous layer if tissue depth is ≥2 cm, will reduce the rate of postcesarean infection.22 Although aspirational, we may, someday, achieve a post‑cesarean infection rate less than 1%!
CASE Conclusion
The patient was noted to be at high risk for postcesarean infection because she had both an elevated BMI and ruptured membranes. The surgeon astutely decided to administer cefazolin 3 g and azithromycin 500 mg, cleanse the vagina with povidone-iodine, use chlorhexidine for the abdominal prep, use poliglecaprone 25 subcuticular skin closure, and did not use postoperative antibiotics or prophylactic wound vacuum. Following an uneventful cesarean delivery, the patient was discharged without an infection on postoperative day 4.
Share your thoughts! Send your Letter to the Editor to [email protected]. Please include your name and the city and state in which you practice.
- Cameron JL. William Steward Halsted: our surgical heritage. Ann Surg. 1997;225(5):445–458.
- Smaill FM, Grivell RM. Antibiotic prophylaxis versus no prophylaxis for preventing infection after cesarean section. Cochrane Database Syst Rev. 2014;(10):CD007482.
- Bratzler DW, Dellinger EP, Olsen KM, et al. Clinical practice guidelines for antimicrobial prophylaxis in surgery. Am J Health Syst Pharm. 2013;70(3):195–283.
- Tita AT, Szychowski JM, Boggess K, et al; C/SOAP Trial Consortium. Adjunctive azithromycin prophylaxis for cesarean delivery. N Engl J Med. 2016;375(13):1231–1241.
- Caissutti C, Saccone G, Zullo F, et al. Vaginal cleansing before cesarean delivery: a systemic review and meta-analysis. Obstet Gynecol. 2017;130(3):527–538.
- Pitt C, Sanchez-Ramos L, Kaunitz AM. Adjunctive intravaginal metronidazole for the prevention of postcesarean endometritis: a randomized controlled trial. Obstet Gynecol. 2001;98(5 pt 1):745–750.
- American College of Obstetricians and Gynecologists; Committee on Gynecologic Practice. Committee Opinion No. 571: solutions for surgicalpreparation of the vagina. Obstet Gynecol. 2013;122(3):718–720.
- Tuuli MG, Liu J, Stout MJ, et al. A randomized trial comparing skin antiseptic agents at cesarean delivery. N Engl J Med. 2016;374(7):647–655.
- Kunkle CM, Marchan J, Safadi S, Whitman S, Chmait RH. Chlorhexidine gluconate versus povidone iodine at cesarean delivery: a randomized controlled trial. J Matern Fetal Neonatal Med. 2015;28(5):573–577.
- Darouiche RO, Wall MJ Jr, Itani KM, et al. Chlorhexidine-alcohol versus povidone-iodine for surgical-site antisepsis. N Engl J Med. 2010;362(1):18–26.
- Ngai IM, Van Arsdale A, Govindappagari S, et al. Skin preparation for prevention of surgical site infection after cesarean delivery: a randomized controlled trial. Obstet Gynecol. 2015;126(6):1251–1257.
- Springel EH, Wang XY, Sarfoh VM, Stetzer BP, Weight SA, Mercer BM. A randomized open-label controlled trial of chlorhexidine-alcohol vs povidone-iodine for cesarean antisepsis: the CAPICA trial. Am J Obstet Gynecol. 2017;217(4):463.e1–e8.
- Turrentine MA, Banks TA. Effect of changing gloves before placental extraction on incidence of postcesarean endometritis. Infect Dis Obstet Gynecol. 1996;4(1):16–19.
- Cernadas M, Smulian JC, Giannina G, Ananth CV. Effects of placental delivery method and intraoperative glove changing on postcesareanfebrile morbidity. J Matern Fetal Med. 1998;7(2):100–104.
- Valent AM, DeArmond C, Houston JM, et al. Effect of post-cesarean delivery oral cephalexin and metronidazole on surgical site infection among obese women: a randomized clinical trial. JAMA. 2017;318(11):1026–1034.
- Shanks AL, Mehra S, Gross G, Colvin R, Harper LM, Tuuli MG. Treatment utility of postpartum antibiotics in chorioamnionitis study. Am J Perinatol. 2016;33(8):732–737.
- Buresch AM, Van Arsdale A, Ferzli M, et al. Comparison of subcuticular suture type for skin closure after cesarean delivery: a randomized controlled trial. Obstet Gynecol. 2017;130(3): 521–526.
- Tuuli MG, Stout MJ, Martin S, Rampersad RM, Cahill AG, Macones GA. Comparison of suture materials for subcuticular skin closure at cesarean delivery. Am J Obstet Gynecol. 2016;215(4): 490.e1–e5.
- Yu L, Kronen RJ, Simon LE, Stoll CR, Colditz GA, Tuuli MG. Prophylactic negative-pressure wound therapy after cesarean is associated with reduced risk of surgical site infection: a systematic review and meta-analysis. Am J Obstet Gynecol. 2018;218(2):200–210.e1.
- Looby MA, Vogel RI, Bangdiwala A, Hyer B, Das K. Prophylactic negative pressure wound therapy in obese patients following cesarean delivery. Surg Innov. 2018;25(1):43–49.
- Smid MD, Dotters-Katz SK, Grace M, et al. Prophylactic negative pressure wound therapy for obese women after cesarean delivery: a systematic review and meta-analysis. Obstet Gynecol. 2017;130(5):969–978.
- Carter EB, Temming LA, Fowler S, et al. Evidence-based bundles and cesarean delivery surgical site infections: a systematic review and meta-analysis. Obstet Gynecol. 2017;130(4):735–746.

Synthetic opioids drive increase in overdose deaths
Opioid-related drug overdose deaths jumped 28% from 2015 to 2016, with the largest increase coming from synthetic opioids, such as illicitly manufactured fentanyl, according to the Centers for Disease Control and Prevention.
The age-adjusted death rate for opioid overdoses increased from 10.4 per 100,000 population in 2015 to 13.3 per 100,000 in 2016, and the 42,249 opioid deaths in 2016 represented more than 66% of all overdose deaths that year, Puja Seth, PhD, and her associates at the CDC reported in the Morbidity and Mortality Weekly Report.
Illegally manufactured fentanyl “is now being mixed into counterfeit opioid and benzodiazepine pills, heroin, and cocaine, likely contributing to increases in overdose death rates involving other substances,” they wrote. To illustrate that point, they reported that cocaine overdose deaths increased 52.4% from 2.1 per 100,000 in 2015 to 3.2 in 2016. The death rate for the other drug category covered in the report – psychostimulants with abuse potential – climbed from 1.8 per 100,000 in 2015 to 2.4 in 2016, for an increase of 33.3%, Dr. Seth and her associates noted.
Data presented from 31 states and the District of Columbia show that
CDC Principal Deputy Director Anne Schuchat, MD, said in a written statement.
Death rates from overdoses involving synthetic opioids increased in 21 states, with 10 states doubling their rates from 2015 to 2016, and 14 states had significant increases in death rates involving heroin. In D.C., for example, the death rate increased 392% (3.9 per 100,000 to 19.2) from synthetic opioid overdoses and 75% (9.9 per 100,000 to 17.3) for deaths related to heroin, the report showed.
“Effective, synchronized programs to prevent drug overdoses will require coordination of law enforcement, first responders, mental health/substance-abuse providers, public health agencies, and community partners,” Dr. Seth and her associates said.
SOURCE: Seth P et al. MMWR. 2018 Mar 30;67(12):349-58.
FROM MMWR
Dual Radial Styloid and Volar Plating for Unstable Fractures of the Distal Radius
ABSTRACT
As the operative management of displaced distal radius fractures evolves, intraoperative techniques and fixation strategies evolve as well. Achieving and maintaining an acceptable reduction is paramount but can be difficult with particular fracture patterns. In this article, we describe the use of a radial column plate as a reduction tool in the management of unstable distal radius fractures, along with clinical and radiographic clinical outcomes. This technique can be useful in situations where multiplanar instability exists, or simply when intraoperative assistance is limited. Surgeons can expect acceptable radiographic and clinical outcomes when using this technique, although effects on scar formation and wrist range of motion are currently not known.
Continue to: Distal radius fractures...
Distal radius fractures are among the most common orthopedic injuries encountered; their reported incidence is >640,000 annually and is estimated to increase.1-4 The management of these injuries has evolved from closed reduction and casting to percutaneous pinning and internal fixation, as the importance of achieving and maintaining an anatomic reduction has become more apparent.5-7 More recently, volar locking plates have emerged as a way to prevent complications associated with dorsal plating. Most authors agree that volar locked plating achieves stable fixation and allows for early postoperative wrist range of motion (ROM).5,8-11 However, a volar approach to a dorsally unstable fracture creates difficulty with regard to reduction at the time of surgery and several reports have noted mechanical failure with utilization of locked volar plating alone.12-15
Dual plating of unstable distal radius fractures with a volar locking plate and a radial column plate has been described in the past in the setting of severely comminuted fractures or in patterns with a large radial styloid fragment that was not addressed with a volar locking plate alone.16-19 The purpose of this study is to present the use of the radial column plate as a tool that allows a surgeon to achieve and maintain reduction during open reduction and internal fixation (ORIF) of an unstable distal radius fracture.
OPERATIVE TECHNIQUE
Patients for whom ORIF is indicated include those with unstable distal radius fractures, with or without intra-articular extension and involvement of both the intermediate and lateral columns.
The patient is positioned supine on the operating table with the operative hand placed palm-up on a radiolucent hand table. A volar approach to the distal radius is undertaken, utilizing the interval between the flexor carpi radialis (FCR) tendon and the radial artery. The floor of the FCR sheath is incised, and a self-retaining retractor with blunt tips can be placed to permit visualization. The pronator quadratus (PQ) is sharply reflected off the radial boarder of the distal radius and approximately 1 mm to 2 mm proximal to the radiocarpal joint with an L-shaped incision for fracture site exposure. The brachioradialis is then identified and tenotomized with a scalpel (Figure 1).

A preliminary reduction is then performed using a combination of axial traction and palmar translation of the carpus. The surgeon should not be concerned with radial height or inclination at this point; however, volar tilt should be established as best as possible. A rolled towel is placed dorsal to the metacarpals, holding the wrist in a flexed position as it is placed back onto the radiolucent hand table.
Continue to: A 7 to 8 hole...
A 7 to 8 hole 2.0-mm reconstruction plate (DePuy Synthes) is bent to the shape of the radial boarder of the distal radius. Undercontouring of the plate is necessary to allow for its use as a reduction tool. The plate is then applied to the radial column ensuring that the distal aspect of the plate engages the distal fracture fragment(s) (Figure 2). A single 2.4-mm fully threaded cortical screw in the radial to ulnar direction is then placed bicortically in the proximal fragment in the hole nearest the fracture site. As the screw is tightened, the plate will push the distal fragment(s) due to its undercontoured shape, and in doing so, will restore radial height and inclination (Figure 3). As this screw is being used as a “working screw,” it will be longer than needed after final tightening. A second screw is then placed proximally to prevent rotation of the plate, and the initial screw can be replaced if its length is of concern. If it is the intention of the surgeon to remove the plate prior to wound closure, the second screw is typically not necessary, and there is no indication for exchanging the first screw if it is long.

At this point, final changes to the reduction can still be performed, as the distal fragment(s) has no fixation except for a buttress plate on its radial border. However, the pressure applied by this plate is still typically adequate to maintain a reduction without the use of percutaneous pins or an assistant holding the reduction. Volar fixation is then applied and positioned under both direct visualization and fluoroscopic aid, and cortical and locking screws are inserted as needed (Figure 4). The radial styloid plate can then be removed; however, it is our preference to leave it in place, as we have not seen any postoperative issues that we can attribute to this technique. The PQ is then repaired over the volar locking plate directly to the radial column plate.

At our institution, patients are maintained in a plaster volar-based wrist splint for a period of 2 weeks postoperatively. After splint and suture removal, active and passive ROM exercises of the wrist and hand are initiated, and a custom thermoplast volar wrist splint is manufactured. This splint is to be worn at all times except during physical therapy. At the 6-week postoperative visit, all restrictions are lifted, assuming there are no complications or unexpected issues. Patients are then seen for follow-up at 3 and 6 months postoperatively. Continued follow-up is indicated if patients are following an abnormal clinical or radiographic course.

MATERIALS AND METHODS
After Institutional Review Board approval was obtained, a clinical outcomes registry was queried to identify all patients treated operatively by the senior author (DGL) for a distal radius fracture at our Level 1 trauma center between August 2002 and December 2013. Adult (age >18 years) patients with isolated distal radius fractures treated with a radial styloid plate were included for initial review (N = 261). Patients for whom 6-month clinical or radiographic outcomes were unknown were then excluded (n = 225).
Patient demographics were recorded from the existing database along with visual analog scale, Quick Disabilities of the Arm, Shoulder and Hand (DASH), and short form 36 (SF-36) physical component scores (PCS) and mental component scores (MCS) from the final follow-up visit. Injury and intraoperative and final radiographs were assessed by a single reviewer (MRG) using calibrated radiographs on our institution’s picture archiving and communication system. Radial height, radial inclination, and volar tilt were documented for each time point except for radial height, which was not recorded for intraoperative fluoroscopy images due to lack of calibration. Intra-articular extension was noted on injury films. Wound complications, the presence of a deep or superficial infection, and removal of implants after union were recorded.
Continue to: RESULTS
RESULTS
Thirty-six patients met the inclusion criteria and were therefore included in the study. The average age at the time of surgery was 60.6 years (range, 25-87 years), 27 patients (75%) were female, and 21 (58%) had left-sided injuries. Patient comorbidities can be seen in Table 1. Twenty-six fractures (72.2%) had intra-articular extension. Average follow-up was 15.6 months (range, 6-53.9 months).
Table 1. Comorbidities of Patients Treated with Radial Column Plating
| Total No. of patients | 36 | |
| Diabetes mellitus | 2 | 5.6% |
| Hyperlipidemia | 7 | 19.4% |
| Hypertension | 11 | 30.6% |
| Current smoker | 4 | 11.1% |
| Current alcohol abuse | 1 | 2.8% |
| Peripheral vascular disease | 0 | 0.0% |
| Mean body mass index | 27.0 | Range: 19-34.5 |
Radiographic measurements at the time of injury, surgery, and final follow-up can be seen in Table 2. As previously noted, radial height could not be recorded on intraoperative films due to the use of fluoroscopy, which is not calibrated at our institution. The average changes in radial inclination and volar tilt from the time of surgery (intraoperative fluoroscopy) to final follow-up were 0.46° (range, −4.4°-4.3°) and 0.24° (range, −10.6°-9.6°), respectively. All patients had acceptable radial height, radial inclination, and volar tilt at final follow-up. Clinical outcomes were obtained at a mean of 15.6 months (range, 6-54 months) and were generally good, with a mean DASH score of 20.7 (range, 0-57.5), SF-36 PCS of 45.4 (range, 22.7-68.0), and SF-36 MCS of 50.5 (range, 22.3-64.1) (Table 3). Of the 36 patients with 6-month outcome scores, 13 (36.1%) elected for implant removal after fracture union at a mean of 7.6 months after index surgery (range, 3.2-49.8 months). No infections or wound complications were noted.
Table 2. Radiographic Measurements for Patients Treated with Radial Column Plating
| Mean Measurement | Range | |
| Injury radiographs | ||
| Radial inclination (degrees) | 7.3 | −22.9-22 |
| Radial height (mm) | 3.3 | −14.9-11.5 |
| Volar tilt (degrees) | −10.4 | −49.2-33.9 |
| Intraoperative fluoroscopy | ||
| Radial inclination (degrees) | 21.1 | 13.1-26.6 |
| Volar tilt (degrees) | 6.2 | −3.6-12.2 |
| Final radiographs | ||
| Radial inclination (degrees) | 21.5 | 14.5-29.2 |
| Radial height (mm) | 11.0 | 7.6-14.6 |
| Volar tilt (degrees) | 6.8 | −12.4-18.8 |
DISCUSSION
In this article, we described the use of a radial column plate as a tool to achieve and maintain a reduction during the surgical fixation of an unstable distal radius fracture with a volar locking plate. We have further presented a series of 36 patients treated in this manner and their clinical and radiographic outcomes. This technique permits the maintenance of coronal alignment, thereby limiting the use of percutaneous techniques or the need to manually hold fracture fragments in a reduced position, which may be valuable to the surgeon who is operating without a surgical assistant.
Table 3. Clinical Outcome Scores at Final Follow-Up for Patients Treated with Radial Column Plating
| Outcome Score | Mean Score | Range |
| VAS | 1.4 | 0-7.5 |
| DASH | 20.7 | 0-57.5 |
| PCS | 45.4 | 22.7-68 |
| MCS | 50.5 | 22.3-64.1 |
Abbreviations: DASH, Quick Disabilities of the Arm, Shoulder and Hand; MCS, mental component scores; PCS, physical component scores; VAS, visual analog scale.
In addition to its value as a reduction tool, unlike traditional temporary k-wire fixation, we believe that the utilization of a radial styloid plate allows for increased stability until fracture union is achieved. Biomechanical studies have demonstrated favorable results with the use of a radial column plate. Grindel and colleagues20 evaluated dual radial styloid and volar radius plating vs volar plating alone in their biomechanical comparison of 8 cadaveric matched hand and forearm pairs. Specimens were fixated with a volar locking plate, and a 1-cm wedge osteotomy was created dorsally approximately 2 cm from the articular margin. The distal fragment was then osteotomized longitudinally between the 2 ulnar and 2 radial distal locking screws to create a fracture pattern that mimics a dorsally unstable injury with intra-articular extension. Half of the specimens then underwent radial styloid plating with 2 screws securing the construct proximally, and load-to-failure testing was performed. The authors found that utilization of both the volar and radial styloid plates resulted in 50% increased stiffness and 76% increased force-to-failure as compared with radial styloid plating alone. Similar, although not statistically significant, results were found by Blythe and colleagues.21 In their cadaveric study, dorsal and volar plating with an additional radial column plate resulted in improved stiffness with axial loading compared to volar or dorsal plating alone 21.
Two prior studies have presented outcome data after fixation of distal radius fractures with radial column and volar radius dual plating. Tang and colleagues16 described this technique and presented postoperative outcomes in 8 patients followed for an average of 35 weeks. They reported a 100% union rate, no loss of reduction, and a mean DASH score of 19.9. Jacobi and colleagues17 also described this technique in their 2010 report. In their cohort of 10 patients treated by multiple surgeons, they found a mean of 39° of flexion, 49° of extension, 75° of pronation, and 75° of supination at 24 months postoperatively. Eight patients were rated as “excellent,” 1 as “good,” and 1 as “fair” according to the Gartland and Werley score, with all 10 cases achieving bony union. No cases demonstrated loss of volar tilt, radial length, or radial inclination. In both studies, however, the use of the radial column plate was advocated as a fragment-specific fixation tool and not as a reduction tool.
Continue to: Although 1-year DASH scores...
Although 1-year DASH scores for volar plating alone have been shown in the literature to be consistently within 6 and 13, 3-month and 6-month scores have historically been >18.22-27 Our short-term clinical results (Table 3) are comparable to these historic controls. Further, within our cohort there were no cases of nonunion, postoperative infection, or wound complications, and radiographic measures show maintenance of reduction at final follow-up (Table 2).
We do recognize that 36.1% (13/36) of our cohort had their distal radius implants removed. Although this incidence is high, it stems from the fact that patients who elect for implant removal are more likely to have had an atypical postoperative course and are therefore followed for longer than 6 months. Those who do not elect for removal are typically discharged from care after their 3-month postoperative visit, and were therefore not eligible for inclusion in this study. Overall, a total of 261 patients have been treated with this technique by the senior surgeon. Of those patients, only 28 (10.7%) underwent removal of surgical implants. If the remaining patients had been followed for the full 6 months, it is likely that outcome scores would have been skewed in a more favorable direction.
Surgeons electing to utilize radial styloid plating for displaced distal radius fractures should recognize that the required increased surgical dissection might lead to increased scar formation and postoperative stiffness. A limitation of this study is the lack of quantitative wrist ROM data. Future studies may compare final clinical outcomes and ROM for patients treated with and without radial column fixation.
CONCLUSION
We advocate for the use of a radial column plate as a tool to help achieve and maintain fracture reduction in the setting of an unstable distal radius fracture being treated with ORIF. This technique may be particularly useful when a surgical assistant is not available. Surgeons can expect clinical and radiographic results that are similar to those of volar locked plating alone.
1. Larsen CF, Lauritsen J. Epidemiology of acute wrist trauma. Int J Epidemiol. 1993;22(5):911-916.
2. Chung KC, Spilson SV. The frequency and epidemiology of hand and forearm fractures in the United States. J Hand Surg Am. 2001;26(5):908-915. doi:10.1053/jhsu.2001.26322.
3. Melton LJ 3rd, Amadio PC, Crowson CS, O'Fallon WM. Long-term trends in the incidence of distal forearm fractures. Osteoporos Int. 1998;8(4):341-348.
4. Hagino H, Yamamoto K, Ohshiro H, Nakamura T, Kishimoto H, Nose T. Changing incidence of hip, distal radius, and proximal humerus fractures in Tottori Prefecture, Japan. Bone. 1999;24(3):265-270.
5. Diaz-Garcia RJ, Chung KC. The evolution of distal radius fracture management: A historical treatise. Hand Clin. 2012;28(2):105-111. doi:10.1016/j.hcl.2012.02.007.
6. McQueen M, Caspers J. Colles fracture: Does the anatomical result affect the final function? J Bone Joint Surg Br. 1988;70(4):649-651.
7. Stewart HD, Innes AR, Burke FD. Factors affecting the outcome of Colles' fracture: an anatomical and functional study. Injury. 1985;16(5):289-295.
8. Knight D, Hajducka C, Will E, McQueen M. Locked volar plating for unstable distal radial fractures: Clinical and radiological outcomes. Injury. 2010;41(2):184-189. doi:10.1016/j.injury.2009.08.024.
9. Anakwe R, Khan L, Cook R, McEachan J. Locked volar plating for complex distal radius fractures: patient reported outcomes and satisfaction. J Orthop Surg Res. 2010;5:51. doi:10.1186/1749799X-5-51.
10. Gruber G, Gruber K, Giessauf C, et al. Volar plate fixation of AO type C2 and C3 distal radius fractures, a single-center study of 55 patients. J Orthop Trauma. 2008;22(7):467-472. doi:10.1097/BOT.0b013e318180db09.
11. Koval KJ, Harrast JJ, Anglen JO, Weinstein JN. Fractures of the distal part of the radius. The evolution of practice over time. Where’s the evidence? J Bone Joint Surg Am. 2008;90(9):1855-1861. doi:10.2106/JBJS.G.01569.
12. Foo TL, Gan AW, Soh T, Chew WY. Mechanical failure of the distal radius volar locking plate. J Orthop Surg (Hong Kong). 2013;21(3):332-336. doi:10.11777/230949901302100314.
13. Ward CM, Kuhl TL, Adams BD. Early complications of volar plating of distal radius fractures and their relationship to surgeon experience. Hand (N Y). 2011;6(2):185-189. doi:10.1007/s11552-010-9313-5.
14. Min W, Kaplan K, Miyamoto R, Tejwani NC. A unique failure mechanism of a distal radius fracture fixed with volar plating--a case report. Bull NYU Hosp Jt Dis. 2010;68(4):304-306.
15. Cao J, Ozer K. Failure of volar locking plate fixation of an extraarticular distal radius fracture: A case report. Patient Saf Surg. 2010;4(1):19. doi:10.1186/1754-9493-4-19.
16. Tang P, Ding A, Uzumcugil A. Radial column and volar plating (RCVP) for distal radius fractures with a radial styloid component or severe comminution. Tech Hand Up Extrem Surg. 2010;14(3):143-149. doi:10.1097/BTH.0b013e3181cae14d.
17. Jacobi M, Wahl P, Kohut G. Repositioning and stabilization of the radial styloid process in comminuted fractures of the distal radius using a single approach: The radio-volar double plating technique. J Orthop Surg Res. 2010;5:55. doi:10.1186/1749-799X-5-55.
18. Rikli DA, Regazzoni P. The double plating technique for distal radius fractures. Tech Hand Up Extrem Surg. 2000;4(2):107-114.
19. Rikli DA, Regazzoni P. Fractures of the distal end of the radius treated by internal fixation and early function. A preliminary report of 20 cases. J Bone Joint Surg Br. 1996;78(4):588-592.
20. Grindel SI, Wang M, Gerlach M, McGrady LM, Brown S. Biomechanical comparison of fixed-angle volar plate versus fixed-angle volar plate plus fragment-specific fixation in a cadaveric distal radius fracture model. J Hand Surg Am. 2007;32(2):194-199. doi:10.1016/j.jhsa.2006.12.003.
21. Blythe M, Stoffel K, Jarrett P, Kuster M. Volar versus dorsal locking plates with and without radial styloid locking plates for the fixation of dorsally comminuted distal radius fractures: A biomechanical study in cadavers. J Hand Surg Am. 2006;31(10):1587-1593. doi:10.1016/j.jhsa.2006.09.011.
22. Loveridge J, Ahearn N, Gee C, Pearson D, Sivaloganathan S, Bhatia R. Treatment of distal radial fractures with the DVR-A plate--the early bristol experience. Hand Surg. 2013;18(2):159-167. doi:10.1142/S0218810413500184.
23. Karantana A, Downing ND, Forward DP, et al. Surgical treatment of distal radial fractures with a volar locking plate versus conventional percutaneous methods: a randomized controlled trial. J Bone Joint Surg Am. 2013;95(19):1737-1744. doi:10.2106/JBJS.L.00232.
24. Egol K, Walsh M, Tejwani N, McLaurin T, Wynn C, Paksima N. Bridging external fixation and supplementary kirschner-wire fixation versus volar locked plating for unstable fractures of the distal radius: A randomised, prospective trial. J Bone Joint Surg Br. 2008;90(9):1214-1221. doi:10.1302/0301-620X.90B9.20521.
25. von Recum J, Matschke S, Jupiter JB, et al. Characteristics of two different locking compression plates in the volar fixation of complex articular distal radius fractures. Bone Joint Res. 2012;1(6):111-117. doi:10.1302/2046-3758.16.2000008.
26. Safi A, Hart R, Těknědžjan B, Kozák T. Treatment of extra-articular and simple articular distal radial fractures with intramedullary nail versus volar locking plate. J Hand Surg Eur Vol. 2013;38(7):774-779. doi:10.1177/1753193413478715.
27. Kim JK, Park SD. Outcomes after volar plate fixation of low-grade open and closed distal radius fractures are similar. Clin Orthop Relat Res. 2013;471(6):2030-2035. doi:10.1007/s11999-013-2798-9.
ABSTRACT
As the operative management of displaced distal radius fractures evolves, intraoperative techniques and fixation strategies evolve as well. Achieving and maintaining an acceptable reduction is paramount but can be difficult with particular fracture patterns. In this article, we describe the use of a radial column plate as a reduction tool in the management of unstable distal radius fractures, along with clinical and radiographic clinical outcomes. This technique can be useful in situations where multiplanar instability exists, or simply when intraoperative assistance is limited. Surgeons can expect acceptable radiographic and clinical outcomes when using this technique, although effects on scar formation and wrist range of motion are currently not known.
Continue to: Distal radius fractures...
Distal radius fractures are among the most common orthopedic injuries encountered; their reported incidence is >640,000 annually and is estimated to increase.1-4 The management of these injuries has evolved from closed reduction and casting to percutaneous pinning and internal fixation, as the importance of achieving and maintaining an anatomic reduction has become more apparent.5-7 More recently, volar locking plates have emerged as a way to prevent complications associated with dorsal plating. Most authors agree that volar locked plating achieves stable fixation and allows for early postoperative wrist range of motion (ROM).5,8-11 However, a volar approach to a dorsally unstable fracture creates difficulty with regard to reduction at the time of surgery and several reports have noted mechanical failure with utilization of locked volar plating alone.12-15
Dual plating of unstable distal radius fractures with a volar locking plate and a radial column plate has been described in the past in the setting of severely comminuted fractures or in patterns with a large radial styloid fragment that was not addressed with a volar locking plate alone.16-19 The purpose of this study is to present the use of the radial column plate as a tool that allows a surgeon to achieve and maintain reduction during open reduction and internal fixation (ORIF) of an unstable distal radius fracture.
OPERATIVE TECHNIQUE
Patients for whom ORIF is indicated include those with unstable distal radius fractures, with or without intra-articular extension and involvement of both the intermediate and lateral columns.
The patient is positioned supine on the operating table with the operative hand placed palm-up on a radiolucent hand table. A volar approach to the distal radius is undertaken, utilizing the interval between the flexor carpi radialis (FCR) tendon and the radial artery. The floor of the FCR sheath is incised, and a self-retaining retractor with blunt tips can be placed to permit visualization. The pronator quadratus (PQ) is sharply reflected off the radial boarder of the distal radius and approximately 1 mm to 2 mm proximal to the radiocarpal joint with an L-shaped incision for fracture site exposure. The brachioradialis is then identified and tenotomized with a scalpel (Figure 1).
A preliminary reduction is then performed using a combination of axial traction and palmar translation of the carpus. The surgeon should not be concerned with radial height or inclination at this point; however, volar tilt should be established as best as possible. A rolled towel is placed dorsal to the metacarpals, holding the wrist in a flexed position as it is placed back onto the radiolucent hand table.
Continue to: A 7 to 8 hole...
A 7 to 8 hole 2.0-mm reconstruction plate (DePuy Synthes) is bent to the shape of the radial boarder of the distal radius. Undercontouring of the plate is necessary to allow for its use as a reduction tool. The plate is then applied to the radial column ensuring that the distal aspect of the plate engages the distal fracture fragment(s) (Figure 2). A single 2.4-mm fully threaded cortical screw in the radial to ulnar direction is then placed bicortically in the proximal fragment in the hole nearest the fracture site. As the screw is tightened, the plate will push the distal fragment(s) due to its undercontoured shape, and in doing so, will restore radial height and inclination (Figure 3). As this screw is being used as a “working screw,” it will be longer than needed after final tightening. A second screw is then placed proximally to prevent rotation of the plate, and the initial screw can be replaced if its length is of concern. If it is the intention of the surgeon to remove the plate prior to wound closure, the second screw is typically not necessary, and there is no indication for exchanging the first screw if it is long.
At this point, final changes to the reduction can still be performed, as the distal fragment(s) has no fixation except for a buttress plate on its radial border. However, the pressure applied by this plate is still typically adequate to maintain a reduction without the use of percutaneous pins or an assistant holding the reduction. Volar fixation is then applied and positioned under both direct visualization and fluoroscopic aid, and cortical and locking screws are inserted as needed (Figure 4). The radial styloid plate can then be removed; however, it is our preference to leave it in place, as we have not seen any postoperative issues that we can attribute to this technique. The PQ is then repaired over the volar locking plate directly to the radial column plate.
At our institution, patients are maintained in a plaster volar-based wrist splint for a period of 2 weeks postoperatively. After splint and suture removal, active and passive ROM exercises of the wrist and hand are initiated, and a custom thermoplast volar wrist splint is manufactured. This splint is to be worn at all times except during physical therapy. At the 6-week postoperative visit, all restrictions are lifted, assuming there are no complications or unexpected issues. Patients are then seen for follow-up at 3 and 6 months postoperatively. Continued follow-up is indicated if patients are following an abnormal clinical or radiographic course.
MATERIALS AND METHODS
After Institutional Review Board approval was obtained, a clinical outcomes registry was queried to identify all patients treated operatively by the senior author (DGL) for a distal radius fracture at our Level 1 trauma center between August 2002 and December 2013. Adult (age >18 years) patients with isolated distal radius fractures treated with a radial styloid plate were included for initial review (N = 261). Patients for whom 6-month clinical or radiographic outcomes were unknown were then excluded (n = 225).
Patient demographics were recorded from the existing database along with visual analog scale, Quick Disabilities of the Arm, Shoulder and Hand (DASH), and short form 36 (SF-36) physical component scores (PCS) and mental component scores (MCS) from the final follow-up visit. Injury and intraoperative and final radiographs were assessed by a single reviewer (MRG) using calibrated radiographs on our institution’s picture archiving and communication system. Radial height, radial inclination, and volar tilt were documented for each time point except for radial height, which was not recorded for intraoperative fluoroscopy images due to lack of calibration. Intra-articular extension was noted on injury films. Wound complications, the presence of a deep or superficial infection, and removal of implants after union were recorded.
Continue to: RESULTS
RESULTS
Thirty-six patients met the inclusion criteria and were therefore included in the study. The average age at the time of surgery was 60.6 years (range, 25-87 years), 27 patients (75%) were female, and 21 (58%) had left-sided injuries. Patient comorbidities can be seen in Table 1. Twenty-six fractures (72.2%) had intra-articular extension. Average follow-up was 15.6 months (range, 6-53.9 months).
Table 1. Comorbidities of Patients Treated with Radial Column Plating
| Total No. of patients | 36 | |
| Diabetes mellitus | 2 | 5.6% |
| Hyperlipidemia | 7 | 19.4% |
| Hypertension | 11 | 30.6% |
| Current smoker | 4 | 11.1% |
| Current alcohol abuse | 1 | 2.8% |
| Peripheral vascular disease | 0 | 0.0% |
| Mean body mass index | 27.0 | Range: 19-34.5 |
Radiographic measurements at the time of injury, surgery, and final follow-up can be seen in Table 2. As previously noted, radial height could not be recorded on intraoperative films due to the use of fluoroscopy, which is not calibrated at our institution. The average changes in radial inclination and volar tilt from the time of surgery (intraoperative fluoroscopy) to final follow-up were 0.46° (range, −4.4°-4.3°) and 0.24° (range, −10.6°-9.6°), respectively. All patients had acceptable radial height, radial inclination, and volar tilt at final follow-up. Clinical outcomes were obtained at a mean of 15.6 months (range, 6-54 months) and were generally good, with a mean DASH score of 20.7 (range, 0-57.5), SF-36 PCS of 45.4 (range, 22.7-68.0), and SF-36 MCS of 50.5 (range, 22.3-64.1) (Table 3). Of the 36 patients with 6-month outcome scores, 13 (36.1%) elected for implant removal after fracture union at a mean of 7.6 months after index surgery (range, 3.2-49.8 months). No infections or wound complications were noted.
Table 2. Radiographic Measurements for Patients Treated with Radial Column Plating
| Mean Measurement | Range | |
| Injury radiographs | ||
| Radial inclination (degrees) | 7.3 | −22.9-22 |
| Radial height (mm) | 3.3 | −14.9-11.5 |
| Volar tilt (degrees) | −10.4 | −49.2-33.9 |
| Intraoperative fluoroscopy | ||
| Radial inclination (degrees) | 21.1 | 13.1-26.6 |
| Volar tilt (degrees) | 6.2 | −3.6-12.2 |
| Final radiographs | ||
| Radial inclination (degrees) | 21.5 | 14.5-29.2 |
| Radial height (mm) | 11.0 | 7.6-14.6 |
| Volar tilt (degrees) | 6.8 | −12.4-18.8 |
DISCUSSION
In this article, we described the use of a radial column plate as a tool to achieve and maintain a reduction during the surgical fixation of an unstable distal radius fracture with a volar locking plate. We have further presented a series of 36 patients treated in this manner and their clinical and radiographic outcomes. This technique permits the maintenance of coronal alignment, thereby limiting the use of percutaneous techniques or the need to manually hold fracture fragments in a reduced position, which may be valuable to the surgeon who is operating without a surgical assistant.
Table 3. Clinical Outcome Scores at Final Follow-Up for Patients Treated with Radial Column Plating
| Outcome Score | Mean Score | Range |
| VAS | 1.4 | 0-7.5 |
| DASH | 20.7 | 0-57.5 |
| PCS | 45.4 | 22.7-68 |
| MCS | 50.5 | 22.3-64.1 |
Abbreviations: DASH, Quick Disabilities of the Arm, Shoulder and Hand; MCS, mental component scores; PCS, physical component scores; VAS, visual analog scale.
In addition to its value as a reduction tool, unlike traditional temporary k-wire fixation, we believe that the utilization of a radial styloid plate allows for increased stability until fracture union is achieved. Biomechanical studies have demonstrated favorable results with the use of a radial column plate. Grindel and colleagues20 evaluated dual radial styloid and volar radius plating vs volar plating alone in their biomechanical comparison of 8 cadaveric matched hand and forearm pairs. Specimens were fixated with a volar locking plate, and a 1-cm wedge osteotomy was created dorsally approximately 2 cm from the articular margin. The distal fragment was then osteotomized longitudinally between the 2 ulnar and 2 radial distal locking screws to create a fracture pattern that mimics a dorsally unstable injury with intra-articular extension. Half of the specimens then underwent radial styloid plating with 2 screws securing the construct proximally, and load-to-failure testing was performed. The authors found that utilization of both the volar and radial styloid plates resulted in 50% increased stiffness and 76% increased force-to-failure as compared with radial styloid plating alone. Similar, although not statistically significant, results were found by Blythe and colleagues.21 In their cadaveric study, dorsal and volar plating with an additional radial column plate resulted in improved stiffness with axial loading compared to volar or dorsal plating alone 21.
Two prior studies have presented outcome data after fixation of distal radius fractures with radial column and volar radius dual plating. Tang and colleagues16 described this technique and presented postoperative outcomes in 8 patients followed for an average of 35 weeks. They reported a 100% union rate, no loss of reduction, and a mean DASH score of 19.9. Jacobi and colleagues17 also described this technique in their 2010 report. In their cohort of 10 patients treated by multiple surgeons, they found a mean of 39° of flexion, 49° of extension, 75° of pronation, and 75° of supination at 24 months postoperatively. Eight patients were rated as “excellent,” 1 as “good,” and 1 as “fair” according to the Gartland and Werley score, with all 10 cases achieving bony union. No cases demonstrated loss of volar tilt, radial length, or radial inclination. In both studies, however, the use of the radial column plate was advocated as a fragment-specific fixation tool and not as a reduction tool.
Continue to: Although 1-year DASH scores...
Although 1-year DASH scores for volar plating alone have been shown in the literature to be consistently within 6 and 13, 3-month and 6-month scores have historically been >18.22-27 Our short-term clinical results (Table 3) are comparable to these historic controls. Further, within our cohort there were no cases of nonunion, postoperative infection, or wound complications, and radiographic measures show maintenance of reduction at final follow-up (Table 2).
We do recognize that 36.1% (13/36) of our cohort had their distal radius implants removed. Although this incidence is high, it stems from the fact that patients who elect for implant removal are more likely to have had an atypical postoperative course and are therefore followed for longer than 6 months. Those who do not elect for removal are typically discharged from care after their 3-month postoperative visit, and were therefore not eligible for inclusion in this study. Overall, a total of 261 patients have been treated with this technique by the senior surgeon. Of those patients, only 28 (10.7%) underwent removal of surgical implants. If the remaining patients had been followed for the full 6 months, it is likely that outcome scores would have been skewed in a more favorable direction.
Surgeons electing to utilize radial styloid plating for displaced distal radius fractures should recognize that the required increased surgical dissection might lead to increased scar formation and postoperative stiffness. A limitation of this study is the lack of quantitative wrist ROM data. Future studies may compare final clinical outcomes and ROM for patients treated with and without radial column fixation.
CONCLUSION
We advocate for the use of a radial column plate as a tool to help achieve and maintain fracture reduction in the setting of an unstable distal radius fracture being treated with ORIF. This technique may be particularly useful when a surgical assistant is not available. Surgeons can expect clinical and radiographic results that are similar to those of volar locked plating alone.
1. Larsen CF, Lauritsen J. Epidemiology of acute wrist trauma. Int J Epidemiol. 1993;22(5):911-916.
2. Chung KC, Spilson SV. The frequency and epidemiology of hand and forearm fractures in the United States. J Hand Surg Am. 2001;26(5):908-915. doi:10.1053/jhsu.2001.26322.
3. Melton LJ 3rd, Amadio PC, Crowson CS, O'Fallon WM. Long-term trends in the incidence of distal forearm fractures. Osteoporos Int. 1998;8(4):341-348.
4. Hagino H, Yamamoto K, Ohshiro H, Nakamura T, Kishimoto H, Nose T. Changing incidence of hip, distal radius, and proximal humerus fractures in Tottori Prefecture, Japan. Bone. 1999;24(3):265-270.
5. Diaz-Garcia RJ, Chung KC. The evolution of distal radius fracture management: A historical treatise. Hand Clin. 2012;28(2):105-111. doi:10.1016/j.hcl.2012.02.007.
6. McQueen M, Caspers J. Colles fracture: Does the anatomical result affect the final function? J Bone Joint Surg Br. 1988;70(4):649-651.
7. Stewart HD, Innes AR, Burke FD. Factors affecting the outcome of Colles' fracture: an anatomical and functional study. Injury. 1985;16(5):289-295.
8. Knight D, Hajducka C, Will E, McQueen M. Locked volar plating for unstable distal radial fractures: Clinical and radiological outcomes. Injury. 2010;41(2):184-189. doi:10.1016/j.injury.2009.08.024.
9. Anakwe R, Khan L, Cook R, McEachan J. Locked volar plating for complex distal radius fractures: patient reported outcomes and satisfaction. J Orthop Surg Res. 2010;5:51. doi:10.1186/1749799X-5-51.
10. Gruber G, Gruber K, Giessauf C, et al. Volar plate fixation of AO type C2 and C3 distal radius fractures, a single-center study of 55 patients. J Orthop Trauma. 2008;22(7):467-472. doi:10.1097/BOT.0b013e318180db09.
11. Koval KJ, Harrast JJ, Anglen JO, Weinstein JN. Fractures of the distal part of the radius. The evolution of practice over time. Where’s the evidence? J Bone Joint Surg Am. 2008;90(9):1855-1861. doi:10.2106/JBJS.G.01569.
12. Foo TL, Gan AW, Soh T, Chew WY. Mechanical failure of the distal radius volar locking plate. J Orthop Surg (Hong Kong). 2013;21(3):332-336. doi:10.11777/230949901302100314.
13. Ward CM, Kuhl TL, Adams BD. Early complications of volar plating of distal radius fractures and their relationship to surgeon experience. Hand (N Y). 2011;6(2):185-189. doi:10.1007/s11552-010-9313-5.
14. Min W, Kaplan K, Miyamoto R, Tejwani NC. A unique failure mechanism of a distal radius fracture fixed with volar plating--a case report. Bull NYU Hosp Jt Dis. 2010;68(4):304-306.
15. Cao J, Ozer K. Failure of volar locking plate fixation of an extraarticular distal radius fracture: A case report. Patient Saf Surg. 2010;4(1):19. doi:10.1186/1754-9493-4-19.
16. Tang P, Ding A, Uzumcugil A. Radial column and volar plating (RCVP) for distal radius fractures with a radial styloid component or severe comminution. Tech Hand Up Extrem Surg. 2010;14(3):143-149. doi:10.1097/BTH.0b013e3181cae14d.
17. Jacobi M, Wahl P, Kohut G. Repositioning and stabilization of the radial styloid process in comminuted fractures of the distal radius using a single approach: The radio-volar double plating technique. J Orthop Surg Res. 2010;5:55. doi:10.1186/1749-799X-5-55.
18. Rikli DA, Regazzoni P. The double plating technique for distal radius fractures. Tech Hand Up Extrem Surg. 2000;4(2):107-114.
19. Rikli DA, Regazzoni P. Fractures of the distal end of the radius treated by internal fixation and early function. A preliminary report of 20 cases. J Bone Joint Surg Br. 1996;78(4):588-592.
20. Grindel SI, Wang M, Gerlach M, McGrady LM, Brown S. Biomechanical comparison of fixed-angle volar plate versus fixed-angle volar plate plus fragment-specific fixation in a cadaveric distal radius fracture model. J Hand Surg Am. 2007;32(2):194-199. doi:10.1016/j.jhsa.2006.12.003.
21. Blythe M, Stoffel K, Jarrett P, Kuster M. Volar versus dorsal locking plates with and without radial styloid locking plates for the fixation of dorsally comminuted distal radius fractures: A biomechanical study in cadavers. J Hand Surg Am. 2006;31(10):1587-1593. doi:10.1016/j.jhsa.2006.09.011.
22. Loveridge J, Ahearn N, Gee C, Pearson D, Sivaloganathan S, Bhatia R. Treatment of distal radial fractures with the DVR-A plate--the early bristol experience. Hand Surg. 2013;18(2):159-167. doi:10.1142/S0218810413500184.
23. Karantana A, Downing ND, Forward DP, et al. Surgical treatment of distal radial fractures with a volar locking plate versus conventional percutaneous methods: a randomized controlled trial. J Bone Joint Surg Am. 2013;95(19):1737-1744. doi:10.2106/JBJS.L.00232.
24. Egol K, Walsh M, Tejwani N, McLaurin T, Wynn C, Paksima N. Bridging external fixation and supplementary kirschner-wire fixation versus volar locked plating for unstable fractures of the distal radius: A randomised, prospective trial. J Bone Joint Surg Br. 2008;90(9):1214-1221. doi:10.1302/0301-620X.90B9.20521.
25. von Recum J, Matschke S, Jupiter JB, et al. Characteristics of two different locking compression plates in the volar fixation of complex articular distal radius fractures. Bone Joint Res. 2012;1(6):111-117. doi:10.1302/2046-3758.16.2000008.
26. Safi A, Hart R, Těknědžjan B, Kozák T. Treatment of extra-articular and simple articular distal radial fractures with intramedullary nail versus volar locking plate. J Hand Surg Eur Vol. 2013;38(7):774-779. doi:10.1177/1753193413478715.
27. Kim JK, Park SD. Outcomes after volar plate fixation of low-grade open and closed distal radius fractures are similar. Clin Orthop Relat Res. 2013;471(6):2030-2035. doi:10.1007/s11999-013-2798-9.
TAKE-HOME POINTS
- Radial column fixation can be used as a reduction tool in unstable distal radius fractures.
- Radial column fixation can help maintain reduction until union in unstable distal radius fractures when combined with volar plating.
- When operating without an assistant, radial column plating can assist in reduction maintenance when other techniques are not successful and holding a reduction manually is not possible.
- Acceptable clinical and radiographic outcomes can be achieved with the use of dual radial styloid and volar plating for unstable distal radius fractures.
- The effects of increased dissection during radial column fixation in distal radius fractures with regard to scar formation and wrist ROM is currently not known.
