User login
Vaccine exemptions more common in western states
For the 2016-2017 school year, 2% of American kindergarten students had an exemption from one or more vaccines, said Ranee Seither and associates at the National Center of Immunization and Respiratory Disease, Centers for Disease Control and Prevention, Atlanta.
Among the 46 states – including the District of Columbia – that reported data, nine times as many exemptions were granted on religious or philosophical grounds (1.8%) as were granted for medical reasons (0.2%), they said.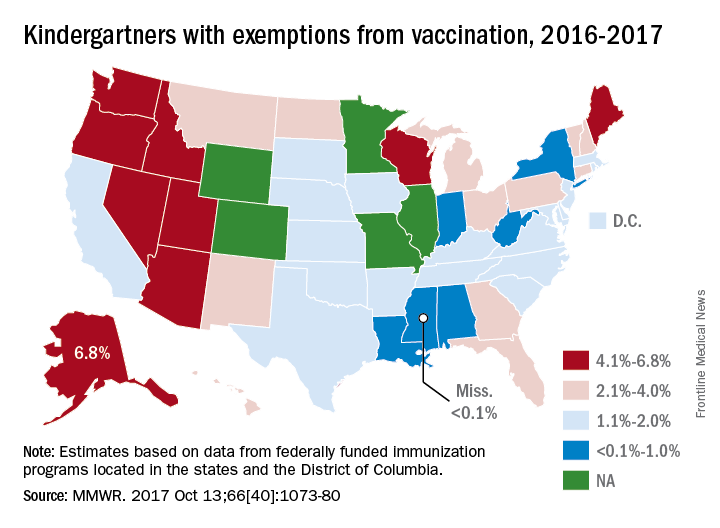
Alaska had the highest rate of medical exemptions at 1.5% and Oregon had the highest rate of religious/philosophical exemptions at 6.5%. Thirty states do not allow philosophical exemptions, Arizona and Mississippi do not allow religious exemptions, and West Virginia does not allow either, they noted.
Exemption data were reported for 3,666,870 kindergartners for the 2016-2017 school year and collected by federally funded immunization programs in the 50 states and D.C.
FROM MMWR
National Academy of Medicine should revisit issue of fetal alcohol exposure
More than 20 years ago the Institute of Medicine (recently renamed the National Academy of Medicine, or NAM) issued its landmark report on fetal alcohol syndrome. Since then, there has been an explosion of research on the issue of fetal alcohol exposure – and NAM needs to revisit the issue and release another report.

Unfortunately, too few physicians and not enough people in the larger society understand public health and that the health status of the unfortunate among us affects the health status of the most fortunate of us. In short, low-income people are the proverbial “canary in the coal mine.”
Accordingly, solving the health care problems of low-income people would solve the health care problems of the middle and upper class. Consider where the United States would be had we paid attention to the opioid epidemic in low-income communities instead of waiting until it spread into everyone’s “safe” communities. We would have tried and tested solutions to the problem as it currently exists.
Another reason NAM needs to revisit FASD – currently proposed to be called neurobehavioral disorders associated with prenatal alcohol exposure in the DSM-5 – are the new findings that link FASD to seizure disorders and other neurodevelopmental disorders of childhood, such as intellectual disability, attention-deficit/hyperactivity disorder, speech and language disorders, motor disorders, specific learning disorders, and autism. In fact, new research is emerging from Robert Freedman, MD, and his team at the University of Colorado Denver, to suggest that preventing choline deficiency in pregnancy (the mechanism producing neurodevelopmental defects in FASD) may not only prevent neurodevelopmental disorders of childhood but also schizophrenia. Further, it has become abundantly clear that choline deficiency (often generated by FASD), is responsible for affect dysregulation, which is a common thread in various forms of violence and suicide.
A recent report highlighted the findings that inmates incarcerated in Mexican prisons have high rates of intellectual disability, and we know that FASD is one of the leading causes of this problem, but we are not screening for it in our juvenile detention centers, jails, or prisons. Consequently, we need to look for the prevalence of FASD in special education as well as in foster care, because these services often feed our correctional institutions. There also is some recent animal evidence suggesting that sufficient prenatal choline during pregnancy may be protective against Alzheimer’s disease – soon to be an even greater public problem in the United States. Lastly, the neuroscience findings regarding FASD also are emerging.
Hence, there is substantial information growing in various, different but overlapping areas of our systems addressing the nation’s public health and well-being. One of the most respected sources of credible science in America is the National Academy Science. The NAM should convene a meeting of the experts to examine the current state of FASD knowledge. If there is sufficient new information, the NAM needs to develop a new report on FASD. It has been 21 years since the first FAS report from the Institute of Medicine and it needs to be revisited. But it appears that the correctional, child protective services, special education, and mental health fields are not aware of the breadth of available research and its importance to the nation’s public health. Determining how fetal alcohol exposure/choline deficiency affects children and adults in special education, foster care, juvenile and adult corrections systems – along with such other social issues as prematurity, disability, unemployment, homelessness, suicide, violence, and mental health – is critical to our nation’s future.
Dr. Bell is a staff psychiatrist at Jackson Park Hospital Family Medicine Clinic in Chicago, clinical psychiatrist emeritus in the department of psychiatry at the University of Illinois at Chicago, former president/CEO of Community Mental Health Council, and former director of the Institute for Juvenile Research (birthplace of child psychiatry), also in Chicago.
More than 20 years ago the Institute of Medicine (recently renamed the National Academy of Medicine, or NAM) issued its landmark report on fetal alcohol syndrome. Since then, there has been an explosion of research on the issue of fetal alcohol exposure – and NAM needs to revisit the issue and release another report.
Unfortunately, too few physicians and not enough people in the larger society understand public health and that the health status of the unfortunate among us affects the health status of the most fortunate of us. In short, low-income people are the proverbial “canary in the coal mine.”
Accordingly, solving the health care problems of low-income people would solve the health care problems of the middle and upper class. Consider where the United States would be had we paid attention to the opioid epidemic in low-income communities instead of waiting until it spread into everyone’s “safe” communities. We would have tried and tested solutions to the problem as it currently exists.
Another reason NAM needs to revisit FASD – currently proposed to be called neurobehavioral disorders associated with prenatal alcohol exposure in the DSM-5 – are the new findings that link FASD to seizure disorders and other neurodevelopmental disorders of childhood, such as intellectual disability, attention-deficit/hyperactivity disorder, speech and language disorders, motor disorders, specific learning disorders, and autism. In fact, new research is emerging from Robert Freedman, MD, and his team at the University of Colorado Denver, to suggest that preventing choline deficiency in pregnancy (the mechanism producing neurodevelopmental defects in FASD) may not only prevent neurodevelopmental disorders of childhood but also schizophrenia. Further, it has become abundantly clear that choline deficiency (often generated by FASD), is responsible for affect dysregulation, which is a common thread in various forms of violence and suicide.
A recent report highlighted the findings that inmates incarcerated in Mexican prisons have high rates of intellectual disability, and we know that FASD is one of the leading causes of this problem, but we are not screening for it in our juvenile detention centers, jails, or prisons. Consequently, we need to look for the prevalence of FASD in special education as well as in foster care, because these services often feed our correctional institutions. There also is some recent animal evidence suggesting that sufficient prenatal choline during pregnancy may be protective against Alzheimer’s disease – soon to be an even greater public problem in the United States. Lastly, the neuroscience findings regarding FASD also are emerging.
Hence, there is substantial information growing in various, different but overlapping areas of our systems addressing the nation’s public health and well-being. One of the most respected sources of credible science in America is the National Academy Science. The NAM should convene a meeting of the experts to examine the current state of FASD knowledge. If there is sufficient new information, the NAM needs to develop a new report on FASD. It has been 21 years since the first FAS report from the Institute of Medicine and it needs to be revisited. But it appears that the correctional, child protective services, special education, and mental health fields are not aware of the breadth of available research and its importance to the nation’s public health. Determining how fetal alcohol exposure/choline deficiency affects children and adults in special education, foster care, juvenile and adult corrections systems – along with such other social issues as prematurity, disability, unemployment, homelessness, suicide, violence, and mental health – is critical to our nation’s future.
Dr. Bell is a staff psychiatrist at Jackson Park Hospital Family Medicine Clinic in Chicago, clinical psychiatrist emeritus in the department of psychiatry at the University of Illinois at Chicago, former president/CEO of Community Mental Health Council, and former director of the Institute for Juvenile Research (birthplace of child psychiatry), also in Chicago.
Adjuvant trastuzumab for 1 year remains standard of care for early HER2+ breast cancer
SAN ANTONIO – The phase 3 SOLD trial failed to show a 9-week course of trastuzumab as noninferior to the standard 12-month course when combined with chemotherapy for women with early-stage HER2-positive breast cancer.
Disease-free survival (DFS) with a 9-week course of adjuvant trastuzumab (Herceptin)did not pass muster as noninferior to the standard 12 months, reported Dr. Heikki Joensuu, professor in the department of oncology at the Helsinki University Hospital and University of Helsinki.
“The non-inferiority of 9 week administration of trastuzumab plus docetaxel could not be demonstrated in terms of disease free survival, as compared to chemotherapy and one year duration of adjuvant trastuzumab.”
Based on these findings, he noted that chemotherapy plus one year of anti-HER2 therapy should remain the standard of care.
However, the dose of docetaxel administered along with trastuzumab could influence survival outcomes. Patients who received a higher dose of docetaxel in the 9 week cohort had similar DFS as those who received 12 months of trastuzumab.
Dr. Joensuu explained that the regimen of giving trastuzumab for one year is an arbitrary one and is not based on research data. In the four large randomized trials that established the current standard treatment for this population of breast cancer patients, trastuzumab was administered for one year and that eventually became the standard of care, he said at the San Antonio Breast Cancer Symposium.
But in two randomized trials that had relatively limited statistical power, a statistically significant difference in DFS or overall survival was not observed between patients who received only nine weeks of trastuzumab compared with those who received the one year regimen.
In addition, the one year treatment course is costly and has been associated with cardiac-related adverse events, although it is relatively uncommon (less than 3% of patients).
The phase 3 SOLD (Synergism or Long Duration) clinical trial was conducted by Dr. Joensuu and his colleagues to compare DFS between women treated with 9 weeks of concomitant trastuzumab plus docetaxel followed by 5-FU, epirubicin, and cyclophosphamide (FEC) to that of women treated with the same regimen followed by single-agent trastuzumab for a one year duration.
The cohort included 2,176 patients with early-stage HER2-positive breast cancer who were randomized to either the 9-week or the 12-month trastuzumab arm. In addition, cardiac function among women enrolled in the trial had to be normal, Dr. Joensuu said, as determined by left ventricular ejection fraction of 50% or greater.
Patients in both groups received three cycles of docetaxel (80 mg/m2 or 100 mg/m2) and trastuzumab three times a week, followed by three cycles of FEC. The dose of docetaxel was determined by the individual center. Patients in the 12-month arm continued to receive trastuzumab every 3 weeks for 14 cycles and in both groups, those with estrogen receptor–positive cancer received appropriate endocrine treatment per guidelines.
“SOLD was initially designed as a superiority trial,” he said, “But, we redesigned the study and the size during the study because we noticed that the assumptions we made for 5-year disease-free survival were too low.”
“We also realized that the shorter arm cannot be better than the longer arm because less drug is given,” said Dr. Joensuu. “So we changed it from a superiority trial to a noninferiority design, where the shorter arm would be at least equal to the longer arm.”
When looking at results, the DFS favored the longer arm: 90.5% in the 12-month arm vs. 88% in the 9-week arm (hazard ratio, 1.39; 90% confidence interval, 1.12-1.72). However, there were no substantial differences in secondary endpoints. Five-year distant DFS was 93.2% in the 9-week arm vs. 94.2% in the 12-month arm (HR, 1.24; 90% CI, 0.93-1.65), and similarly, 5-year overall survival was 94.7% vs. 95.9% (HR, 1.39; 90% CI, 0.98-1.89).
There was an interaction between the dose of docetaxel given concomitantly with trastuzumab. For patients who received 100 mg/m2 docetaxel, DFS was similar in both groups: 92.2% (long arm) vs. 87.8% (short arm) (HR 0.71, 90% CI 0,44-1.14). But among those who received 80 mg/m2 docetaxel, DFS was superior in the group who received 12 months of trastuzumab, compared with the 9-week group (91.3% vs. 86.8%; HR, 1.66; 90% CI, 1.30-2.11).
Less cardiac toxicity was observed in the 9-week group, for any protocol-defined cardiac adverse event (n = 22 [2%] vs. n = 42 [3.9%]; P = .012) and for heart failure (n = 21 [1.9%] vs. n = 36 [3.3%]; P = .046).
“Docetaxel dosing with trastuzumab requires further study,” Dr. Joensuu said.
SOURCE: Joensuu H et al., Abstract GS3-04
REPORTING FROM SABCS 2017
Key clinical point: Disease-free survival with a 9-week course of adjuvant trastuzumab did not pass muster as noninferior to the standard 12 months.
Major finding: DFS favored the longer arm: 90.5% in the 12 month arm vs. 88% in the 9-week arm (HR, 1.39; 90% CI 1.12-1.72), but no substantial differences were observed in secondary endpoints.
Data source: Randomized phase 3 trial that included 2,176 patients with early-stage HER2-positive breast cancer
Disclosures:. The study was funded by Pharmac, Sanofi, Novartis, the Academy of Finland, the Cancer Society of Finland, Helsinki University Hospital research funds, Sigrid Juselius Foundation, and Jane and Aatos Erkko Foundation. Dr. Joensuu is a scientific adviser for Neutron Therapeutics, has received consultation fees from Orion Pharma, and has stock ownership interest in Orion, Faron Pharmaceuticals, and Sartar Therapeutics.
Source: Joensuu H et al., GS3-04
Poststroke depression raises risk of cerebrovascular death 35-fold
As many as one in three stroke survivors have depression. To find out how such depression relates to all-cause and stroke mortality, a team lead by Ali Razmara, MD, conducted a study published in the Journal of Stroke and Cerebrovascular Disorders that used data from the nearly 10,000 participants in the National Health and Nutrition Examination Survey I Epidemiologic Follow-Up Study that was conducted during 1982-1992.
Specifically, they stratified the 9,919 participants who were interviewed in 1982-1984 into four groups on the basis of their self-reported stroke and depression, defined as Center for Epidemiologic Studies Depression (CES-D) scale score of 16 or higher. The groups either had no stroke and no depression (reference group), stroke and no depression, no stroke and depression, or both stroke and depression. A total of 121 (1.2%) reported prior stroke.
The youngest participants, aged 25-64 years, showed no significant association between stroke or depression, or both, and all-cause mortality. In those aged 65-74 years, however, all-cause mortality was significantly affected by not only depression alone and stroke alone, with adjusted hazard ratios 1.24 and 1.64, respectively, but also by the combination of depression and stroke (adjusted HR, 2.28), “consistent with an additive relationship,” said Dr. Razmara, a neurologist at Kaiser Permanente in Irvine, Calif.
Furthermore, in that same age group, having depression after a stroke boosted stroke mortality by a factor of 35, compared with stroke survivors without depression (adjusted HR, 35.33). This striking difference highlights “the importance of identifying and treating depression among stroke survivors,” the investigators concluded.
The Roxanna Todd Hodges Foundation sponsored the study. No competing interests were reported.
SOURCE: Razmara A, et al., Stroke Cerebrovasc Dis. 2017 Dec;26(12):2870-9.
FROM THE JOURNAL OF STROKE AND CEREBROVASCULAR DISEASES
Key clinical point: Depression after a stroke is deadly, and should be monitored and treated.
Major finding: Having depression after a stroke boosted stroke mortality by a factor of 35.
Study details: An analysis of the National Health and Nutrition Examination Survey I Epidemiologic Follow-up Study.
Disclosures: The Roxanna Todd Hodges Foundation sponsored the study. No competing interests were reported.
Source: Razmara A et al., Stroke Cerebrovasc Dis. 2017 Dec;26(12):2870-9.
2 = 5 for additional AI therapy for postmenopausal HR+ breast cancer
SAN ANTONIO – Five years of additional therapy with anastrozole (Arimidex) was no more effective than 2 additional years following the standard 5 years of initial endocrine therapy in postmenopausal women with hormone receptor–positive (HR+) breast cancer, Austrian investigators reported.
In fact, the only thing that the additional years of the aromatase inhibitor (AI) anastrozole seemed to add was increased risk for fracture, said Michael Gnant, MD, from the Medical University of Vienna, on behalf of colleagues in the ABCSG-16 trial.

Previous trials have convincingly demonstrated the benefit of giving patients an AI for 5 years after 5 years of tamoxifen, but the optimal duration of extended adjuvant AI therapy is not known, Dr. Gnant said.
The ABCSG trialists recruited 3,484 postmenopausal women from with HR+, stage T1-3, node-negative or -positive, nonmetastatic breast cancer who had completed 4-6 years of endocrine therapy with either tamoxifen, an AI, or tamoxifen followed by an AI. The patients were randomly assigned at the end of initial endocrine therapy to either 2 years or 5 years of anastrozole.
As noted before, disease-free survival (DFS), the primary endpoint, was virtually identical between the treatment arms. The DFS rate at a median of 8.75 years after randomization – that is, approximately 14 years after diagnosis – was 71.1% among patients treated for 2 additional years, vs. 70.3% for patients treated for 5 extra years, translating into a hazard ratio of 1.007 and making the contest a statistical dead heat.
Similarly, there was no difference by anastrozole duration in the secondary endpoint of overall survival at 10 years, with respective rates of 85.3% vs. 84.9%, with a hazard ratio identical to that in the DFS analysis.
Where the 5-year schedule surpassed the 2-year schedule, however, was in apparent risk for fractures, which was 6.3% after 5 years of additional therapy, compared with 4.7% at 5 years among patients who received just 2 additional years of anastrozole. The hazard ratio associated with the difference was 1.353, but because the lower end of the 95% confidence interval was 1.00, the finding was of borderline significance (P = .053), Dr. Gnant acknowledged.
There are several ongoing translational studies that may help to identify specific molecular characteristics that could predict benefit from prolonged extended therapy in a given patient, “but for now we can conclude that 7 years are good enough for almost every patient with luminal breast cancer,” Dr. Gnant said at a briefing prior to his presentation of the study in an oral session.
“I do believe that for us as clinical scientists a negative trial is always disappointing, but I think the clinical take-home message can actually help to avoid unnecessary side effects for many, many women,” he added.
Asked at the briefing whether, given the identical survival curves between the two trial arms, additional therapy beyond 5 years was needed, Dr. Gnant replied “that was addressed by other trials. I think that the trials after tamoxifen are very clear: We have hazard ratios around 0.6 after tamoxifen, so some type of extension for adding aromatase inhibitors should be the standard of care.”
He noted that the optimal duration of additional therapy with an AI has not been known, because the trial that could have answered that question, the MA-17 trial, was halted and unblinded after just 2.5 years when an interim analysis showed superior survival with letrozole (Femara), compared with placebo.
More than 60% of patients in the placebo group in that trial were crossed over to letrozole, further muddying long-term follow-up results.
Carlos Arteaga, MD, director of the Harold C. Simmons Comprehensive Cancer Center at University of Texas Southwestern Medical Center in Dallas, who moderated the briefing, agreed with Dr. Gnant that this ostensibly negative trial had good results for patients.
“I hope that we continue to see more de-escalation studies. I hope that as we combine AIs with CDK4/6 inhibitors, we may make therapy even shorter. I think we should do better than just extending and extending and extending. We have to come up with better ideas,” he said in an interview.
The ABCSG-16 study was supported by AstraZeneca. Dr. Gnant disclosed research funding, honoraria, and travel funding from that company and others. Dr. Arteaga disclosed consulting fees from AstraZeneca and other companies.
SOURCE: Gnant et al. SABCS 2017 Abstract GS3-01
SAN ANTONIO – Five years of additional therapy with anastrozole (Arimidex) was no more effective than 2 additional years following the standard 5 years of initial endocrine therapy in postmenopausal women with hormone receptor–positive (HR+) breast cancer, Austrian investigators reported.
In fact, the only thing that the additional years of the aromatase inhibitor (AI) anastrozole seemed to add was increased risk for fracture, said Michael Gnant, MD, from the Medical University of Vienna, on behalf of colleagues in the ABCSG-16 trial.
Previous trials have convincingly demonstrated the benefit of giving patients an AI for 5 years after 5 years of tamoxifen, but the optimal duration of extended adjuvant AI therapy is not known, Dr. Gnant said.
The ABCSG trialists recruited 3,484 postmenopausal women from with HR+, stage T1-3, node-negative or -positive, nonmetastatic breast cancer who had completed 4-6 years of endocrine therapy with either tamoxifen, an AI, or tamoxifen followed by an AI. The patients were randomly assigned at the end of initial endocrine therapy to either 2 years or 5 years of anastrozole.
As noted before, disease-free survival (DFS), the primary endpoint, was virtually identical between the treatment arms. The DFS rate at a median of 8.75 years after randomization – that is, approximately 14 years after diagnosis – was 71.1% among patients treated for 2 additional years, vs. 70.3% for patients treated for 5 extra years, translating into a hazard ratio of 1.007 and making the contest a statistical dead heat.
Similarly, there was no difference by anastrozole duration in the secondary endpoint of overall survival at 10 years, with respective rates of 85.3% vs. 84.9%, with a hazard ratio identical to that in the DFS analysis.
Where the 5-year schedule surpassed the 2-year schedule, however, was in apparent risk for fractures, which was 6.3% after 5 years of additional therapy, compared with 4.7% at 5 years among patients who received just 2 additional years of anastrozole. The hazard ratio associated with the difference was 1.353, but because the lower end of the 95% confidence interval was 1.00, the finding was of borderline significance (P = .053), Dr. Gnant acknowledged.
There are several ongoing translational studies that may help to identify specific molecular characteristics that could predict benefit from prolonged extended therapy in a given patient, “but for now we can conclude that 7 years are good enough for almost every patient with luminal breast cancer,” Dr. Gnant said at a briefing prior to his presentation of the study in an oral session.
“I do believe that for us as clinical scientists a negative trial is always disappointing, but I think the clinical take-home message can actually help to avoid unnecessary side effects for many, many women,” he added.
Asked at the briefing whether, given the identical survival curves between the two trial arms, additional therapy beyond 5 years was needed, Dr. Gnant replied “that was addressed by other trials. I think that the trials after tamoxifen are very clear: We have hazard ratios around 0.6 after tamoxifen, so some type of extension for adding aromatase inhibitors should be the standard of care.”
He noted that the optimal duration of additional therapy with an AI has not been known, because the trial that could have answered that question, the MA-17 trial, was halted and unblinded after just 2.5 years when an interim analysis showed superior survival with letrozole (Femara), compared with placebo.
More than 60% of patients in the placebo group in that trial were crossed over to letrozole, further muddying long-term follow-up results.
Carlos Arteaga, MD, director of the Harold C. Simmons Comprehensive Cancer Center at University of Texas Southwestern Medical Center in Dallas, who moderated the briefing, agreed with Dr. Gnant that this ostensibly negative trial had good results for patients.
“I hope that we continue to see more de-escalation studies. I hope that as we combine AIs with CDK4/6 inhibitors, we may make therapy even shorter. I think we should do better than just extending and extending and extending. We have to come up with better ideas,” he said in an interview.
The ABCSG-16 study was supported by AstraZeneca. Dr. Gnant disclosed research funding, honoraria, and travel funding from that company and others. Dr. Arteaga disclosed consulting fees from AstraZeneca and other companies.
SOURCE: Gnant et al. SABCS 2017 Abstract GS3-01
REPORTING FROM SABCS 2017
Key clinical point: Disease-free and overall survival were no different for women treated with 2 or 5 additional years of aromatase inhibitor therapy following 4-6 years of initial endocrine therapy.
Major finding: The hazard ratio for both DFS and OS with 5 additional years of anastrozole, compared with 2 years, was 1.007 and was not statistically significant.
Data source: Randomized phase 3 trial in 3,484 postmenopausal women with hormone receptor–positive breast cancer.
Disclosures: The ABCSG-16 study was supported by AstraZeneca. Dr. Gnant disclosed research funding, honoraria, and travel funding from that company and others. Dr. Arteaga disclosed consulting fees from AstraZeneca and other companies.
Source: Gnant et al. SABCS 2017 Abstract GS3-01
Health disparities in rural America: Chronic conditions
Among rural adults, multiple chronic health conditions are most common in non-Hispanic blacks and American Indians/Alaska Natives (AI/ANs) and least common among Asians and Native Hawaiians/other Pacific Islanders (NHOPIs), according to the Centers for Disease Control and Prevention.
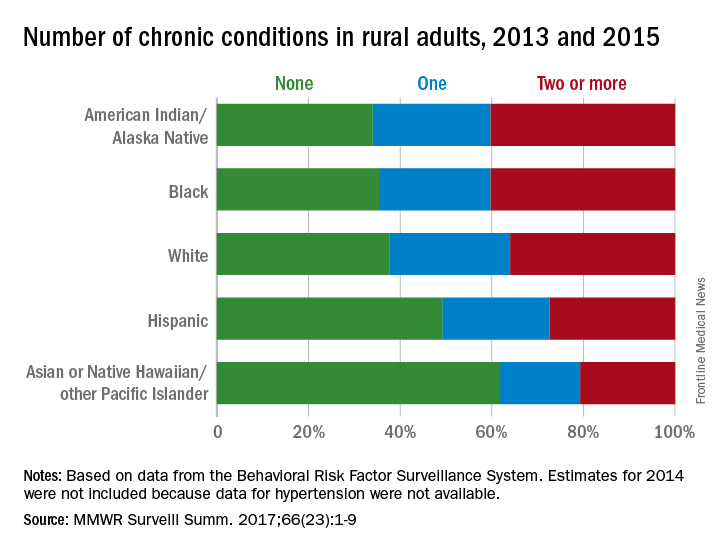
The order was reversed for adults reporting no chronic conditions: Asians and NHOPIs at 61.8%, Hispanics at 49.2%, whites at 37.8%, blacks at 35.4%, and AI/ANs at 34.0%, the researchers said.
For the chronic health conditions included separately in the report, blacks had the highest rate (45.9%) and Asians and NHOPIs had the lowest rate (15.5%) of obesity; AI/ANs were most likely (23.2%) and Asians and NHOPIs were least likely (5.8%) to report depressive disorder. Other conditions considered in the estimates were myocardial infarction; coronary heart disease; stroke; hypertension; asthma; skin cancer; other types of cancer; chronic obstructive pulmonary disease; kidney disease; some form of arthritis, rheumatoid arthritis, gout, lupus, or fibromyalgia; and diabetes. Estimates for 2014 were not included because data for hypertension were not available, the investigators noted.
Of the 3,143 counties categorized by the National Center for Health Statistics’ Urban-Rural Classification Scheme for Counties, a total of 1,325 were considered rural and included 6.1% of the U.S. population, they said.
Among rural adults, multiple chronic health conditions are most common in non-Hispanic blacks and American Indians/Alaska Natives (AI/ANs) and least common among Asians and Native Hawaiians/other Pacific Islanders (NHOPIs), according to the Centers for Disease Control and Prevention.
The order was reversed for adults reporting no chronic conditions: Asians and NHOPIs at 61.8%, Hispanics at 49.2%, whites at 37.8%, blacks at 35.4%, and AI/ANs at 34.0%, the researchers said.
For the chronic health conditions included separately in the report, blacks had the highest rate (45.9%) and Asians and NHOPIs had the lowest rate (15.5%) of obesity; AI/ANs were most likely (23.2%) and Asians and NHOPIs were least likely (5.8%) to report depressive disorder. Other conditions considered in the estimates were myocardial infarction; coronary heart disease; stroke; hypertension; asthma; skin cancer; other types of cancer; chronic obstructive pulmonary disease; kidney disease; some form of arthritis, rheumatoid arthritis, gout, lupus, or fibromyalgia; and diabetes. Estimates for 2014 were not included because data for hypertension were not available, the investigators noted.
Of the 3,143 counties categorized by the National Center for Health Statistics’ Urban-Rural Classification Scheme for Counties, a total of 1,325 were considered rural and included 6.1% of the U.S. population, they said.
FROM MMWR SURVEILLANCE SUMMARIES
Shaping practice: Z1071 continues to redefine axillary management
SAN DIEGO – A 2013 breast cancer trial is changing the way lymph nodes are managed in women with node-positive disease who have an axillary pathologic complete response to neoadjuvant chemotherapy.
Emerging additional data support the initial theory of the American College of Surgeons Oncology Group (ACOSOG) Z1071 trial, said Judy C. Boughey, MD, FACS, at the American College of Surgeons Clinical Congress: Performing sentinel lymph node surgery after chemotherapy is an acceptable alternative for some women. This change in practice could bestow a profound long-term benefit on the approximately 40% of patients, who have an axillary pathologic complete response after neoadjuvant chemotherapy (NAC) – patients who otherwise might undergo an unnecessary axillary node exploration, which can lead to higher risk of lymphedema, said Dr. Boughey, head of surgical research at the Mayo Clinic, Rochester, Minn.
“About 20% of patients who are treated with chemotherapy for their breast cancer receive the chemotherapy prior to surgery. Of those who do receive neoadjuvant chemotherapy, probably half could benefit from this approach,” she said. “Lymphedema after axillary dissection is one of the situations patients are most concerned about. This approach is a great one when patients have a good chemotherapy response, and we want to reliably reassure ourselves that there’s no disease left in the axilla without automatically removing all the nodes. Of course, if there is any remaining disease in any of the lymph nodes, the current standard is still to remove all the nodes. This approach, however, optimizes management for patients who have the best response to chemotherapy.”
Neoadjuvant therapy success
Prechemotherapy nodal exploration was routine a decade or so ago and is what many surgeons were most comfortable with, Dr. Boughey said. “We know the false-negative rate, and chemotherapy doesn’t interfere with axillary staging. However, it means patients have to go through two surgeries, and, although the chemotherapy does not interfere with the procedure, if any of the sentinel nodes are positive and an axillary dissection is performed at the same setting, then systemic therapy will be delayed. However, most importantly, when the sentinel node is removed prior to chemotherapy, we lose the ability to assess axillary response to chemotherapy – which correlates with survival.”
The biggest drawback of axillary dissection is its potential for lifelong morbidity from lymphedema. “Women know about this. They worry about this, and they want to avoid it if at all possible,” Dr. Boughey said.
More effective, targeted chemotherapeutic agents have resulted in higher rates of eradication of disease with neoadjuvant treatment. So this leads to the question: Why not reassess nodes after treatment, when these drugs have had a chance to work? Doing so reduces the one-size-fits-all prescription of axillary dissection and, thus, the number of women with lasting adverse events.
Some early data supported this theory
In 2009, researchers at the MD Anderson Center reported that sentinel node surgery after chemotherapy in patients with node-negative breast cancer resulted in fewer positive sentinel nodes and decreased unnecessary axillary dissections. Node identification rates were about 98% whether the surgery came before or after treatment. The false-negative rate hovered around 5%. And there were significantly fewer axillary dissections with posttreatment surgery: 20% vs. 36% in women with T2 disease and 30% vs. 51% in those with T3 disease. Importantly, holding off on the surgery didn’t lead to higher local-regional failure rates or survival among the 3,746 women treated during 1994-2007.
The American College of Surgeons Oncology Group Z1071 trial was designed to explore this question in patients with node-positive breast cancer. The Z1071 trial enrolled 756 women who had clinical T0-T4, N1-N2, M0 breast cancer and received neoadjuvant chemotherapy. Patients underwent both sentinel lymph node surgery and axillary lymph node dissection following chemotherapy. The primary endpoint was the false-negative rate of sentinel lymph node surgery after chemotherapy in women who presented with cN1 disease and had at least two sentinel nodes resected; a rate of 10% lower was considered acceptable and would justify the approach.
Of the entire cohort, 40% had a complete pathologic nodal response rate. The sentinel node identification rate was nearly 93%. The false-negative rate among 525 women with two or more positive sentinel nodes, however, was 12.6% – short of the 10% rate investigators needed to deem the study a success, Dr. Boughey said.
But there were some positive findings in subgroup analyses. Among women who had nodes identified with a dual tracer (both dye and radioactive clipping), the false-negative rate dipped to 10.8%. It was just 9% in those who had more than two sentinel nodes identified.
A recent subanalysis of the Z1071 trial further refined these data. It looked at 170 of the patients with cN1 disease (32%) who had had a clip placed in the positive lymph node at the time of percutaneous biopsy and compared false-negative rates among them with rates in the 355 patients who were not clipped.
“When we looked at them, if the clipped node came out during the sentinel node surgery, then the false-negative rate dropped down to about 7%,” Dr. Boughey said. The comparator group pointed out the value of using a clip. The false-negative rate was 13% in patients who didn’t have a clip placed and 19% in the patients whose clip wasn’t retrieved until axillary dissection.
The results of Z1071 and its subanalyses have popularized nodal clipping, Dr. Boughey said. “When we ran Z1071, clipping wasn’t commonly being performed, but there has been a huge uptake in it now.”
Confirmatory data
Other recent studies confirm the feasibility of this approach in women who have clinically negative nodes after NAC.
In 2013, the German study SENTINA (sentinel-lymph-node biopsy in patients with breast cancer before and after neoadjuvant chemotherapy) explored the false-negative rate in women who had sentinel node biopsy before or after neoadjuvant chemotherapy. Overall, it found an unacceptably high false-negative rate of 14% in women with node positive disease who converted to clinically negative nodal status. However, when the analysis was limited to those cases with at least two sentinel nodes, the false-negative rate was less than 10%, once more suggesting a potential role for sentinel node surgery after neoadjuvant chemotherapy.
In 2015, the Sentinel Node Biopsy Following Neoadjuvant Chemotherapy (SN FNAC) study highlighted the potential effect of sentinel node surgery after NAC. The prospective study showed not only that the strategy was safe, with a false-negative rate around 8%, but also that it could have eliminated complete axillary dissection in about 30% of the cohort.
The study enrolled 153 women with biopsy-proven node-positive breast cancer (T0-3, N1-2) who underwent both sentinel node surgery and complete nodal dissection. Immunohistochemistry of the retrieved sentinel nodes was mandatory, and the presence of any tumor cells in the sentinel node rendered it positive.
The sentinel node retrieval rate was 88%, and the false-negative rate, 8.4%. The study also employed dual tracers of isotope and blue dye in a majority of patients; this was associated with a threefold decrease in the false-negative rate in those patients, dropping it to around 5%. “By using sentinel node biopsy after NAC, axillary node dissection could potentially be avoided in at least 30% of patients who present with node-positive breast cancer,” the study’s team concluded.
Long-term consequences?
It’s increasingly clear that for carefully selected patients, with robust NAC response, a postchemotherapy assessment can accurately assess nodal disease – especially if dual tracers are employed, several sentinel nodes examined, and the biopsy-proven positive node is resected. What isn’t clear yet is the long-term effect of this strategy, Dr. Boughey said.
“Five years ago, when Z1071 was first being reported, I would discuss it in terms of the controversy, and give the pros and cons,” she said. “But now that we have more information about this strategy under our belts, I feel much more confident. However, we still do not have information on patients with node-positive disease who have been treated with sentinel node only after neoadjuvant chemotherapy and followed for 5 or 10 years. That’s the piece we just can’t have, without time.”
Dr. Boughey had no relevant financial disclosures.
SOURCE: Boughey JC. Session PS108.
EXPERT ANALYSIS FROM THE ACS CLINICAL CONGRESS
VIDEO: CDK4/6, ET, LHRH combo improves PFS in premenopausal breast cancer
SAN ANTONIO – For premenopausal women with advanced hormone receptor–positive, HER2-negative breast cancer, the addition of the cyclin-dependent kinase (CDK) 4/6 inhibitor ribociclib (Kisqali) to endocrine therapy and goserelin was associated with a near doubling in progression-free survival (PFS), improvement in pain scores and a longer time to deterioration of quality of life scores.
Previous clinical trials have shown the advantage of adding a CDK4/6 inhibitor to standard aromatase inhibitor therapy in postmenopausal women, but the randomized phase 3 MONALEESA-7 trial is the first phase 3 study of an agent in this class in premenopausal women with breast cancer, and is the first randomized trial in this population in nearly 2 decades, notes Debu Tripathy, MD, from the University of Texas MD Anderson Cancer Center in Houston.
The median PFS for women treated with ribociclib plus endocrine therapy with either an aromatase inhibitor or tamoxifen plus the lutenizing hormone-releasing hormone agonist goserelin was 23.8 months, compared with 13 months for women treated with the same combination except for a ribociclib placebo.
In this video interview at the San Antonio Breast Cancer Symposium, Dr. Tripathy discusses the therapeutic benefits and quality of life improvements associated with adding ribociclib to endocrine therapy and ovarian suppression in this population.
The MONALEESA 7 trial was supported by Novartis. Dr. Tripathy disclosed steering committee consulting fees and institutional funding from the company.
The video associated with this article is no longer available on this site. Please view all of our videos on the MDedge YouTube channel
REPORTING FROM SABCS 2017

Acupuncture significantly reduces AI-associated arthralgias
SAN ANTONIO – Acupuncture significantly reduced joint pain that was associated with the use of aromatase inhibitors (AIs) in women with early breast cancer, according to new findings reported at the San Antonio Breast Cancer Symposium.
The randomized, phase 3 SWOG S1200 clinical trial found that, compared with sham acupuncture and a control group receiving no therapy, women receiving acupuncture reported significantly lower scores on the Brief Pain Inventory–Short Form (BPI).
“We have shown consistently, with multiple measures assessing pain and stiffness, that true acupuncture generated better outcomes than either control group in a large multicenter trial,” said lead author Dawn L. Hershman, MD, leader of the Breast Cancer Program at the Herbert Irving Comprehensive Cancer Center at NewYork-Presbyterian/Columbia University Medical Center. “Acupuncture provides a nonpharmacologic option that can improve symptoms and possibly increase AI adherence and subsequent breast cancer outcomes.”
AIs can reduce both early breast cancer recurrence and mortality. Dr. Hershman noted that these agents are effective in the adjuvant setting and for prevention “but we know that it doesn’t work if you don’t take it. Noncompliance is a major problem among women taking hormonal therapy.”
Noncompliance is multifactorial and one of the main reasons women discontinue their therapy early is because of arthralgias or joint discomfort. “We were interested in a nonpharmacologic intervention, to assess whether or not we could control these symptoms.”
Dr. Hershman pointed out acupuncture provides a safe and effective alternative for patients reluctant to take a prescription medication that can result in other side effects. “Identification of nonopioid options for pain control is a public health priority,” she said.
Acupuncture is a popular nonpharmacologic modality and widely used for a number of indications. Several single-institution studies have suggested that it may be useful for controlling AI-associated arthralgias, while other studies have not demonstrated a benefit.
In this trial, the authors evaluated the efficacy of acupuncture, compared with sham acupuncture or waitlist control, in the treatment of AI associated arthralgia in a large population of patients. The study was conducted at 11 centers.
The cohort comprised 226 postmenopausal women diagnosed with early-stage, hormone receptor–positive breast cancer who were receiving treatment with AIs. The primary endpoint was the decline in joint pain as measured by BPI-SF at 6 weeks, and to assess the duration of the effect, the women were followed for an additional 12 weeks.
Within this group, 110 were randomized to true acupuncture; 59 to sham acupuncture, and 57 to waitlist control (no treatment). Patients receiving true or sham acupuncture had sessions three times a week for 6 weeks followed by one session per week for 6 more weeks. Pain status was reported at baseline, during treatment, and then afterwards, using a variety of measurement tools including the BPI-SF, which is a self-administered 14-item questionnaire that evaluates pain severity on a 0-10 scale, and the impact of pain on activities of daily living.
At 6 weeks, the true acupuncture treatment arm reported significantly lower BPI worst pain scores than those in the sham acupuncture and the waitlist control arms. The mean BPI worst pain for the true acupuncture arm was 0.92 points lower than the sham acupuncture arm (P = .01) and 0.96 points lower than the waitlist control arm (P = .01). The proportion of patients experiencing a large reduction in BPI worst pain (greater than 2) was significantly greater in the true acupuncture arm, compared with the other groups: 58% versus 33% percent and 31%, respectively. The differences continued to remain statistically significant at 24 weeks, even though the treatment only continued for 12 weeks.
Associated adverse effects were minimal with true and sham acupuncture and limited to grade 1 bruising.
The cost of the 12-week intervention was about $1,250 or $65-$75 a session. “We feel that there is now sufficient evidence to support insurance coverage of acupuncture of AI arthralgia.”
In a discussion of the paper, Dr. Anne Partridge, from the Dana Farber Cancer Center, noted that it is imperative to seek new ways to improve outcomes in breast cancer, and AIs are contributing to that. However, she echoed the concern that nonadherence to treatment is a “tremendous problem” and hampers the clinical effectiveness of AI therapy.
The rate of discontinuation during the first year of therapy is 20% within the first year and up to 40% of patients do not take them daily. Both early discontinuation and nonadherence contribute to mortality.
Based on these results from the largest randomized controlled trial looking at acupuncture in this setting, should physicians be recommending acupuncture to patients prescribed AI therapy?
“The short answer is, why not?” said Dr. Partridge, “And that we should be recommending it for some of our patients.”
However, there are a number of issues that need to be addressed, she added. The duration of treatment is not known, and the need for follow-up treatment or the frequency of it is not known. The generalizability of it is also unclear when looking at a larger population, and acupuncture is highly operator dependent.
“There are cost and access issues, and insurance right now offers very limited coverage,” she said.
Importantly, Dr. Partridge emphasized, “We know that it will help symptoms, but will it improve adherence to AI?”
It may improve adherence for some patients, but “side effects are only one factor,” she said. “Adherence behavior is complicated. We need to figure out how to optimize these therapies in our patients.”
This study was supported by the National Institutes of Health National Center for Complementary and Integrative Health and the Office of Research on Women’s Health, and grants from the NIH/National Cancer Institute Division of Cancer Prevention. Dr. Hershman declared no conflicts of interest. Dr. Partridge had no disclosures.
SOURCE: Hershman et al. Abstract GS4-04
REPORTING FROM SABCS 2017
Key clinical point: Acupuncture significantly reduced joint pain associated with the use of aromatase inhibitors, compared with sham acupuncture and untreated controls.
Major finding: The proportion of patients who experienced a large reduction in BPI worst pain (less than 2) was significantly greater in the true acupuncture arm, compared with the other groups: 58% versus 33% percent and 31%, respectively.
Data source: Three-arm randomized phase 3 trial that included 226 patients with early-stage hormone receptor–positive breast cancer who were receiving treatment with AIs.
Disclosures: This study was supported by the National Institutes of Health National Center for Complementary and Integrative Health and the Office of Research on Women’s Health, and grants from the NIH/National Cancer Institute Division of Cancer Prevention. Dr. Hershman declared no conflicts of interest. Dr. Partridge had no disclosures.
Source: Hershman et al. Abstract GS4-04
CME: Current Treatment Strategies for Advanced Prostate Cancer
Click here to read the supplement.

This activity is supported by an educational grant from Astellas and Medivation, Inc. a Pfizer company, Janssen Biotech, Inc., administered byJanssen Scientific Affairs, LLC. and Sanofi Genzyme.
In this CME supplement, you will learn to:
- Identify best practices for integrating currently available treatment options for advanced prostate cancer, including immunologic therapies, new secondary hormonal agents, chemotherapy, and radiopharmaceuticals
- Describe new management options for metastatic hormonesensitive prostate cancer (mHSPC)
- Outline considerations for current and emerging therapies in the management of patients with metastatic castration-resistant prostate cancer (mCSPC)
- Understand how the molecular and biochemical underpinnings of mCRPC can impact treatment course and selection
Click here to read the supplement.
After reading, take the posttest evaluation at https://www.surveymonkey.com/r/WMMYNHP
Click here to read the supplement.
This activity is supported by an educational grant from Astellas and Medivation, Inc. a Pfizer company, Janssen Biotech, Inc., administered byJanssen Scientific Affairs, LLC. and Sanofi Genzyme.
In this CME supplement, you will learn to:
- Identify best practices for integrating currently available treatment options for advanced prostate cancer, including immunologic therapies, new secondary hormonal agents, chemotherapy, and radiopharmaceuticals
- Describe new management options for metastatic hormonesensitive prostate cancer (mHSPC)
- Outline considerations for current and emerging therapies in the management of patients with metastatic castration-resistant prostate cancer (mCSPC)
- Understand how the molecular and biochemical underpinnings of mCRPC can impact treatment course and selection
Click here to read the supplement.
After reading, take the posttest evaluation at https://www.surveymonkey.com/r/WMMYNHP
