User login
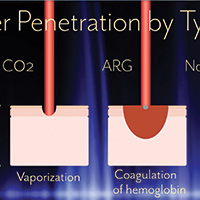
Advances in ablative and non-ablative lasers in gynecology: A clinician’s guide

Visit the Society of Gynecologic Surgeons online: sgsonline.org
Additional videos from SGS are available here, including these recent offerings:
Visit the Society of Gynecologic Surgeons online: sgsonline.org
Additional videos from SGS are available here, including these recent offerings:
Visit the Society of Gynecologic Surgeons online: sgsonline.org
Additional videos from SGS are available here, including these recent offerings:
This video is brought to you by![]()
Adding T-vec might help surmount PD-1 resistance in melanoma
Almost two-thirds of patients with advanced melanoma responded to combination therapy with pembrolizumab and talimogene laherparepvec (T-vec) in a small phase 1b trial, investigators reported.
A third of patients achieved a complete response and median progression-free and overall survival were not reached after typically 18.6 (range, 17.7 to 20.8) months of follow-up, said Antoni Ribas, MD, of the University of California, Los Angeles, and his coinvestigators. In contrast to single-agent pembrolizumab therapy, responders to the combination regimen included patients with very low levels of CD8+ T cell infiltrates or negative interferon-gamma (IFN-gamma) gene signatures in baseline tumor biopsies, suggesting that oncolytic virotherapy might make anti-PD-1 therapy more effective by altering the tumor microenvironment, the researchers concluded. Serious adverse events were uncommon in this study, and there were no dose-limiting toxicities, they wrote (Cell. 2017 Sept. 7 doi: 10.1016/j.cell.2017.08.027).

To see if attracting CD8+ T cells into tumors helped surmount this obstacle, the researchers treated 21 patients with advanced melanoma with pembrolizumab and T-vec, an intratumorally administered, genetically modified clinical herpes simplex virus-1 strain approved for treating melanoma. Patients first received up to 4 mL T-vec (106 plaque-forming units [pfu] per mL) to induce a protective immune response. Three weeks later, they started receiving to 4 mL (108 pfu/mL) T-vec plus 200 mg intravenous pembrolizumab every 2 weeks.
Thirteen patients (62%) showed at least a partial response, and seven (33%) had a complete response based on immune criteria. Notably, 9 of 13 (69%) patients with baseline tumor CD8+ densities below 1,000 cells/mm2 responded to combination treatment, as did three of five patients with low baseline IFN-gamma signatures.
“There was only one baseline biopsy that was scored as PD-L1 negative, but that patient went on to have a complete response to the combined therapy,” the researchers wrote. “Patients who responded to combination therapy had increased CD8+ T cells, elevated PD-L1 protein expression, [and] IFN-gamma gene expression on several cell subsets in tumors after [T-vec] treatment. Response to combination therapy did not appear to be associated with baseline CD8+ T cell infiltration or baseline IFN-gamma signature.” Increased levels of circulating immune cells and shrinkage of untreated tumors both suggested that intratumoral T-vec injections led to systemic effects, they added.

Amgen and Merck provided funding. Dr. Ribas disclosed consulting fees from both companies.
Almost two-thirds of patients with advanced melanoma responded to combination therapy with pembrolizumab and talimogene laherparepvec (T-vec) in a small phase 1b trial, investigators reported.
A third of patients achieved a complete response and median progression-free and overall survival were not reached after typically 18.6 (range, 17.7 to 20.8) months of follow-up, said Antoni Ribas, MD, of the University of California, Los Angeles, and his coinvestigators. In contrast to single-agent pembrolizumab therapy, responders to the combination regimen included patients with very low levels of CD8+ T cell infiltrates or negative interferon-gamma (IFN-gamma) gene signatures in baseline tumor biopsies, suggesting that oncolytic virotherapy might make anti-PD-1 therapy more effective by altering the tumor microenvironment, the researchers concluded. Serious adverse events were uncommon in this study, and there were no dose-limiting toxicities, they wrote (Cell. 2017 Sept. 7 doi: 10.1016/j.cell.2017.08.027).
To see if attracting CD8+ T cells into tumors helped surmount this obstacle, the researchers treated 21 patients with advanced melanoma with pembrolizumab and T-vec, an intratumorally administered, genetically modified clinical herpes simplex virus-1 strain approved for treating melanoma. Patients first received up to 4 mL T-vec (106 plaque-forming units [pfu] per mL) to induce a protective immune response. Three weeks later, they started receiving to 4 mL (108 pfu/mL) T-vec plus 200 mg intravenous pembrolizumab every 2 weeks.
Thirteen patients (62%) showed at least a partial response, and seven (33%) had a complete response based on immune criteria. Notably, 9 of 13 (69%) patients with baseline tumor CD8+ densities below 1,000 cells/mm2 responded to combination treatment, as did three of five patients with low baseline IFN-gamma signatures.
“There was only one baseline biopsy that was scored as PD-L1 negative, but that patient went on to have a complete response to the combined therapy,” the researchers wrote. “Patients who responded to combination therapy had increased CD8+ T cells, elevated PD-L1 protein expression, [and] IFN-gamma gene expression on several cell subsets in tumors after [T-vec] treatment. Response to combination therapy did not appear to be associated with baseline CD8+ T cell infiltration or baseline IFN-gamma signature.” Increased levels of circulating immune cells and shrinkage of untreated tumors both suggested that intratumoral T-vec injections led to systemic effects, they added.
Amgen and Merck provided funding. Dr. Ribas disclosed consulting fees from both companies.
FROM CELL
Key clinical point: Adding talimogene laherparepvec (T-vec) might help overcome resistance to anti-PD-1 antibodies in patients with advanced melanoma.
Major finding: In all, 62% of patients had at least a partial response and 33% had a complete response. Median progression-free and overall survival were not reached after a median of 18.6 weeks of follow-up.
Data source: A phase 1b clinical trial of 21 adults with advanced melanoma who received T-vec and pembrolizumab.
Disclosures: Amgen and Merck provided funding. Dr. Ribas disclosed consulting fees from both companies.
FDA approves biosimilar to bevacizumab
The Food and Drug Administration has approved a biosimilar to bevacizumab (Avastin) for the treatment of certain colorectal, lung, brain, kidney, and cervical cancers.
Bevacizumab-awwb is the first biosimilar approved in the United States for the treatment of cancer, the FDA said in a press release.
Approval is based on structural and functional characterization, animal study data, human pharmacokinetic and pharmacodynamics data, clinical immunogenicity data, and other clinical safety and effectiveness data that demonstrate bevacizumab-awwb is biosimilar to bevacizumab, the FDA said.
• Metastatic colorectal cancer, in combination with intravenous 5-fluorouracil-based chemotherapy for first- or second-line treatment.
• Metastatic colorectal cancer, in combination with fluoropyrimidine-irinotecan–based or fluoropyrimidine-oxaliplatin–based chemotherapy for the second-line treatment of patients who have progressed on a first-line bevacizumab product–containing regimen.
• Non-squamous non–small cell lung cancer, in combination with carboplatin and paclitaxel for first line treatment of unresectable, locally advanced, recurrent, or metastatic disease.
• Glioblastoma with progressive disease following prior therapy, based on improvement in objective response rate.
• Metastatic renal cell carcinoma, in combination with interferon alfa.
• Cervical cancer that is persistent, recurrent, or metastatic, in combination with paclitaxel and cisplatin or paclitaxel and topotecan.
Common expected side effects of the biosimilar include epistaxis, headache, hypertension, rhinitis, proteinuria, taste alteration, dry skin, hemorrhage, lacrimation disorder, back pain, and exfoliative dermatitis.
Serious expected side effects include perforation or fistula, arterial and venous thromboembolic events, hypertension, posterior reversible encephalopathy syndrome, proteinuria, infusion-related reactions, and ovarian failure. Women who are pregnant should not take bevacizumab-awwb.
The biosimilar to bevacizumab carries a similar boxed warning regarding the increased risk of gastrointestinal perforations; surgery and wound healing complications; and severe or fatal pulmonary, gastrointestinal, central nervous system, and vaginal hemorrhage.
The biosimilar approval was granted to Amgen, which will market the drug under the trade name Mvasi.
New data prompt update to ACC guidance on nonstatin LDL lowering
The American College of Cardiology Task Force on Expert Consensus Decision Pathways has released a “focused update” for the 2016 ACC Expert Consensus Decision Pathway (ECDP) on the role of nonstatin therapies for LDL-cholesterol lowering in the management of atherosclerotic cardiovascular disease (ASCVD) risk.
The update was deemed by the ECDP writing committee to be desirable given the additional evidence and perspectives that have emerged since the publication of the 2016 version, particularly with respect to the efficacy and safety of proprotein convertase subtilisin/kexin 9 (PCSK9) inhibitors for the secondary prevention of ASCVD, as well as the best use of ezetimibe in addition to statin therapy after acute coronary syndrome.

The ECDP algorithms endorse the four evidence-based statin benefit groups identified in the 2013 guidelines (adults aged 21 and older with clinical ASCVD, adults aged 21 and older with LDL-C of 190 mg/dL or greater, adults aged 40-75 years without ASCVD but with diabetes and with LDL-C of 70-189 mg/dL, and adults aged 40-75 without ASCVD or diabetes but with LDL-C of 70-189 mg/dL and an estimated 10-year risk for ASCVD of 7.5% or greater) and assume that the patient is currently taking or has attempted to take a statin, they noted.
Among the changes in the 2017 focused update are:
- Consideration of new randomized clinical trial data for the PCSK9 inhibitors evolocumab and bococizumab. Namely, they included results from the cardiovascular outcomes trials FOURIER (Further Cardiovascular Outcomes Research with PCSK9 Inhibition in Subjects with Elevated Risk) and SPIRE-1 and SPIRE-2 (Studies of PCSK9 Inhibition and the Reduction of Vascular Events), which were published in early 2017.
- An adjustment in the ECDP algorithms with respect to thresholds for consideration of net ASCVD risk reduction. The 2016 ECDP thresholds for risk reduction benefit were percent reduction in LDL-C with consideration of absolute LDL-C level in patients with clinical ASCVD, baseline LDL-C of 190 mg/dL or greater, and primary prevention. In patients with diabetes with or without clinical ASCVD, clinicians were allowed to consider absolute LDL-C and/or non-HDL-cholesterol levels. In the 2017 ECDP update, the thresholds are percent reduction in LDL-C with consideration of absolute LDL-C or non-HDL-C levels for patients in each of the four statin benefit groups. This change was based on the inclusion criteria of the FOURIER trial, the ongoing ODYSSEY Outcomes trial (Evaluation of Cardiovascular Outcomes after an Acute Coronary Syndrome During Treatment with Alirocumab), and the SPIRE-2 trial, all of which included non-HDL-C thresholds. “In alignment with these inclusion criteria, the 2017 Focused Update includes both LDL-C and non-HDL-C thresholds for evaluation of net ASCVD risk-reduction benefit when considering the addition of nonstatin therapies for patients in each of the four statin benefit groups” the update explained.
- An expansion of the threshold for consideration of net ASCVD risk-reduction benefit from a reduction of LDL C of at least 50%, as well as consideration of LDL-C less than 70 mg/dL or non-HDL-C less than 100 mg/dL for all patients (that is, both those with and those without comorbidities) who have clinical ASCVD and baseline LDL-C of 70-189 mg/dL. The 2016 ECDP had different thresholds for those with versus those without comorbidities. This change was based on findings from the FOURIER trial and the IMPROVE-IT (Improved Reduction of Outcomes: Vytorin Efficacy International Trial).“Based on consideration of all available evidence, the consensus of the writing committee members is that lower LDL-C levels are safe and optimal in patients with clinical ASCVD due to [their] increased risk of recurrent events,” they said.
- An expanded recommendation on the use of ezetimibe and PCSK9 inhibition. The 2016 ECDP stated that “if a decision is made to proceed with the addition of nonstatin therapy to maximally tolerated statin therapy, it is reasonable to consider the addition of ezetimibe as the initial agent and a PCSK9 inhibitor as the second agent.” However, based on the FOURIER findings, the ongoing ODYSSEY Outcomes trial, and the IMPROVE-IT trial, the 2017 Focused Update states that, if such a decision is made in patients with clinical ASCVD with comorbidities and baseline LDL-C of 70-189 mg/dL, it is reasonable to weigh the addition of either ezetimibe or a PCSK9 inhibitor in light of “considerations of the additional percent LDL-C reduction desired, patient preferences, costs, route of administration, and other factors.” The update also spells out considerations that may favor the initial choice of ezetimibe versus a PCSK9 inhibitor (such as requiring less than 25% additional lowering of LDL-C, an age of over 75 years, cost, and other patient factors and preferences) .
- Additional factors, based on the FOURIER trial results and inclusion criteria, that may be considered for the identification of higher-risk patients with clinical ASCVD. The 2016 ECDP included on this list diabetes, a recent ASCVD event, an ASCVD event while already taking a statin, poorly controlled other major ASCVD risk factors, elevated lipoprotein, chronic kidney disease, symptomatic heart failure, maintenance hemodialysis, and baseline LDL-C of at least 190 mg/dL not due to secondary causes. The 2017 update added being 65 years or older, prior MI or nonhemorrhagic stroke, current daily cigarette smoking, symptomatic peripheral artery disease with prior MI or stroke, history of non-MI related coronary revascularization, residual coronary artery disease with at least 40% stenosis in at least two large vessels, HDL-C less than 40 mg/dL for men and less than 50 mg/dL for women, high-sensitivity C-reactive protein greater than 2 mg/L, and metabolic syndrome.
The content of the full ECDP has been changed in accordance with these updates and now includes more extensive and detailed guidance for decision making – both in the text and in treatment algorithms.
Aspects that remain unchanged include the decision pathways and algorithms for the use of ezetimibe or PCSK9 inhibitors in primary prevention patients with LDL-C less than 190 mg/dL or in those without ASCVD and LDL-C of 190 mg/dL or greater unattributable to secondary causes.
In addition to other changes made for the purpose of clarification and consistency, recommendations regarding bile acid–sequestrant use were downgraded; these are now only recommended as optional secondary agents for consideration in patients who cannot tolerate ezetimibe.
“[These] recommendations attempt to provide practical guidance for clinicians and patients regarding the use of nonstatin therapies to further reduce ASCVD risk in situations not covered by the guideline until such time as the scientific evidence base expands and cardiovascular outcomes trials are completed with new agents for ASCVD risk reduction,” the committee concluded.
Dr. Lloyd-Jones reported having no disclosures.
The American College of Cardiology Task Force on Expert Consensus Decision Pathways has released a “focused update” for the 2016 ACC Expert Consensus Decision Pathway (ECDP) on the role of nonstatin therapies for LDL-cholesterol lowering in the management of atherosclerotic cardiovascular disease (ASCVD) risk.
The update was deemed by the ECDP writing committee to be desirable given the additional evidence and perspectives that have emerged since the publication of the 2016 version, particularly with respect to the efficacy and safety of proprotein convertase subtilisin/kexin 9 (PCSK9) inhibitors for the secondary prevention of ASCVD, as well as the best use of ezetimibe in addition to statin therapy after acute coronary syndrome.
The ECDP algorithms endorse the four evidence-based statin benefit groups identified in the 2013 guidelines (adults aged 21 and older with clinical ASCVD, adults aged 21 and older with LDL-C of 190 mg/dL or greater, adults aged 40-75 years without ASCVD but with diabetes and with LDL-C of 70-189 mg/dL, and adults aged 40-75 without ASCVD or diabetes but with LDL-C of 70-189 mg/dL and an estimated 10-year risk for ASCVD of 7.5% or greater) and assume that the patient is currently taking or has attempted to take a statin, they noted.
Among the changes in the 2017 focused update are:
- Consideration of new randomized clinical trial data for the PCSK9 inhibitors evolocumab and bococizumab. Namely, they included results from the cardiovascular outcomes trials FOURIER (Further Cardiovascular Outcomes Research with PCSK9 Inhibition in Subjects with Elevated Risk) and SPIRE-1 and SPIRE-2 (Studies of PCSK9 Inhibition and the Reduction of Vascular Events), which were published in early 2017.
- An adjustment in the ECDP algorithms with respect to thresholds for consideration of net ASCVD risk reduction. The 2016 ECDP thresholds for risk reduction benefit were percent reduction in LDL-C with consideration of absolute LDL-C level in patients with clinical ASCVD, baseline LDL-C of 190 mg/dL or greater, and primary prevention. In patients with diabetes with or without clinical ASCVD, clinicians were allowed to consider absolute LDL-C and/or non-HDL-cholesterol levels. In the 2017 ECDP update, the thresholds are percent reduction in LDL-C with consideration of absolute LDL-C or non-HDL-C levels for patients in each of the four statin benefit groups. This change was based on the inclusion criteria of the FOURIER trial, the ongoing ODYSSEY Outcomes trial (Evaluation of Cardiovascular Outcomes after an Acute Coronary Syndrome During Treatment with Alirocumab), and the SPIRE-2 trial, all of which included non-HDL-C thresholds. “In alignment with these inclusion criteria, the 2017 Focused Update includes both LDL-C and non-HDL-C thresholds for evaluation of net ASCVD risk-reduction benefit when considering the addition of nonstatin therapies for patients in each of the four statin benefit groups” the update explained.
- An expansion of the threshold for consideration of net ASCVD risk-reduction benefit from a reduction of LDL C of at least 50%, as well as consideration of LDL-C less than 70 mg/dL or non-HDL-C less than 100 mg/dL for all patients (that is, both those with and those without comorbidities) who have clinical ASCVD and baseline LDL-C of 70-189 mg/dL. The 2016 ECDP had different thresholds for those with versus those without comorbidities. This change was based on findings from the FOURIER trial and the IMPROVE-IT (Improved Reduction of Outcomes: Vytorin Efficacy International Trial).“Based on consideration of all available evidence, the consensus of the writing committee members is that lower LDL-C levels are safe and optimal in patients with clinical ASCVD due to [their] increased risk of recurrent events,” they said.
- An expanded recommendation on the use of ezetimibe and PCSK9 inhibition. The 2016 ECDP stated that “if a decision is made to proceed with the addition of nonstatin therapy to maximally tolerated statin therapy, it is reasonable to consider the addition of ezetimibe as the initial agent and a PCSK9 inhibitor as the second agent.” However, based on the FOURIER findings, the ongoing ODYSSEY Outcomes trial, and the IMPROVE-IT trial, the 2017 Focused Update states that, if such a decision is made in patients with clinical ASCVD with comorbidities and baseline LDL-C of 70-189 mg/dL, it is reasonable to weigh the addition of either ezetimibe or a PCSK9 inhibitor in light of “considerations of the additional percent LDL-C reduction desired, patient preferences, costs, route of administration, and other factors.” The update also spells out considerations that may favor the initial choice of ezetimibe versus a PCSK9 inhibitor (such as requiring less than 25% additional lowering of LDL-C, an age of over 75 years, cost, and other patient factors and preferences) .
- Additional factors, based on the FOURIER trial results and inclusion criteria, that may be considered for the identification of higher-risk patients with clinical ASCVD. The 2016 ECDP included on this list diabetes, a recent ASCVD event, an ASCVD event while already taking a statin, poorly controlled other major ASCVD risk factors, elevated lipoprotein, chronic kidney disease, symptomatic heart failure, maintenance hemodialysis, and baseline LDL-C of at least 190 mg/dL not due to secondary causes. The 2017 update added being 65 years or older, prior MI or nonhemorrhagic stroke, current daily cigarette smoking, symptomatic peripheral artery disease with prior MI or stroke, history of non-MI related coronary revascularization, residual coronary artery disease with at least 40% stenosis in at least two large vessels, HDL-C less than 40 mg/dL for men and less than 50 mg/dL for women, high-sensitivity C-reactive protein greater than 2 mg/L, and metabolic syndrome.
The content of the full ECDP has been changed in accordance with these updates and now includes more extensive and detailed guidance for decision making – both in the text and in treatment algorithms.
Aspects that remain unchanged include the decision pathways and algorithms for the use of ezetimibe or PCSK9 inhibitors in primary prevention patients with LDL-C less than 190 mg/dL or in those without ASCVD and LDL-C of 190 mg/dL or greater unattributable to secondary causes.
In addition to other changes made for the purpose of clarification and consistency, recommendations regarding bile acid–sequestrant use were downgraded; these are now only recommended as optional secondary agents for consideration in patients who cannot tolerate ezetimibe.
“[These] recommendations attempt to provide practical guidance for clinicians and patients regarding the use of nonstatin therapies to further reduce ASCVD risk in situations not covered by the guideline until such time as the scientific evidence base expands and cardiovascular outcomes trials are completed with new agents for ASCVD risk reduction,” the committee concluded.
Dr. Lloyd-Jones reported having no disclosures.
FROM JOURNAL OF THE AMERICAN COLLEGE OF CARDIOLOGY
Postpartum sepsis risk persists after 6 weeks
PARK CITY, UTAH – The risk of sepsis after delivery persists beyond 6 weeks, the traditional point at which women are thought to be in the clear, according to investigators from Stanford (Calif.) University.
The team analyzed 506 sepsis hospitalizations following delivery, culled from almost 2 million live births in California from 2008-2012; 199 (39%) were at or before 6 weeks postpartum, and 310 (61%) were after 6 weeks, out to a year.
“Going into this, our view was that sepsis cases before 6 weeks would be due to obstetrical causes, and cases after 6 weeks would be due to [nonobstetrical causes],” said senior investigator Ronald Gibbs, MD, clinical professor of obstetrics and gynecology at Stanford. But that’s not what the team found.
In both the early and late admission groups, early preterm delivery was one of the leading risks for postpartum sepsis and other risk factors were largely the same. Pyelonephritis and pneumonia were by far the most common diagnoses in both groups, accounting for more than 70% of cases. The rank order of causative organisms was the same whether women presented before 6 weeks or after: gram-negative bacteria, staphylococcus, and streptococcus.
“In view of this, we think the risk for sepsis goes beyond 6 weeks,” Dr. Gibbs said at the annual scientific meeting of the Infectious Diseases Society for Obstetrics and Gynecology. Although women were admitted largely for nonuterine infections, “the reservoir of infection could be in the uterus,” with later seeding to the urinary tract or lungs. “I think there’s a chronic intrauterine infection that sets women up for” both early preterm birth and later sepsis, he added.
“These late admissions would probably go to a nonobstetrical service, but we are thinking that there may be a pelvic origin related to something that went on at delivery. I can’t really say that we ought to change our practice, but it sets the stage for looking at that. Finding that late [admissions for sepsis] have a lot in common with the early admissions and are probably related to the pregnancy really reorders the thinking,” Dr. Gibbs said.
The team found that among women who were delivered at 24-28 weeks, the adjusted odds ratio was 8.6 (95% confidence interval[CI], 4.4-17.1) for early and 4.2 (95% CI, 1.9-9.0) for late postpartum sepsis admission, even after delivery mode, maternal comorbidities, maternal age, “and everything else we could think of” were controlled for, said lead investigator Megan Foeller, MD, a maternal-fetal medicine fellow at Stanford.

A body mass index above 35 kg/m2 also increased the risk for sepsis admission, as did government-provided insurance, primary cesarean delivery, a failed trial of labor after a previous cesarean, and four or more previous deliveries.
Postoperative infection, acute hepatic failure, acute renal failure, acute respiratory failure, and heart failure during the delivery hospitalization greatly increased the risk of subsequent sepsis, as well.
The findings help define a group of women who likely need especially close follow-up after delivery to prevent sepsis, Dr. Foeller said.
Sepsis was defined in the study by ICD-9 codes for septicemia plus acute organ dysfunction.
There was no industry funding for the work and the investigators reported having no relevant financial disclosures.
PARK CITY, UTAH – The risk of sepsis after delivery persists beyond 6 weeks, the traditional point at which women are thought to be in the clear, according to investigators from Stanford (Calif.) University.
The team analyzed 506 sepsis hospitalizations following delivery, culled from almost 2 million live births in California from 2008-2012; 199 (39%) were at or before 6 weeks postpartum, and 310 (61%) were after 6 weeks, out to a year.
“Going into this, our view was that sepsis cases before 6 weeks would be due to obstetrical causes, and cases after 6 weeks would be due to [nonobstetrical causes],” said senior investigator Ronald Gibbs, MD, clinical professor of obstetrics and gynecology at Stanford. But that’s not what the team found.
In both the early and late admission groups, early preterm delivery was one of the leading risks for postpartum sepsis and other risk factors were largely the same. Pyelonephritis and pneumonia were by far the most common diagnoses in both groups, accounting for more than 70% of cases. The rank order of causative organisms was the same whether women presented before 6 weeks or after: gram-negative bacteria, staphylococcus, and streptococcus.
“In view of this, we think the risk for sepsis goes beyond 6 weeks,” Dr. Gibbs said at the annual scientific meeting of the Infectious Diseases Society for Obstetrics and Gynecology. Although women were admitted largely for nonuterine infections, “the reservoir of infection could be in the uterus,” with later seeding to the urinary tract or lungs. “I think there’s a chronic intrauterine infection that sets women up for” both early preterm birth and later sepsis, he added.
“These late admissions would probably go to a nonobstetrical service, but we are thinking that there may be a pelvic origin related to something that went on at delivery. I can’t really say that we ought to change our practice, but it sets the stage for looking at that. Finding that late [admissions for sepsis] have a lot in common with the early admissions and are probably related to the pregnancy really reorders the thinking,” Dr. Gibbs said.
The team found that among women who were delivered at 24-28 weeks, the adjusted odds ratio was 8.6 (95% confidence interval[CI], 4.4-17.1) for early and 4.2 (95% CI, 1.9-9.0) for late postpartum sepsis admission, even after delivery mode, maternal comorbidities, maternal age, “and everything else we could think of” were controlled for, said lead investigator Megan Foeller, MD, a maternal-fetal medicine fellow at Stanford.
A body mass index above 35 kg/m2 also increased the risk for sepsis admission, as did government-provided insurance, primary cesarean delivery, a failed trial of labor after a previous cesarean, and four or more previous deliveries.
Postoperative infection, acute hepatic failure, acute renal failure, acute respiratory failure, and heart failure during the delivery hospitalization greatly increased the risk of subsequent sepsis, as well.
The findings help define a group of women who likely need especially close follow-up after delivery to prevent sepsis, Dr. Foeller said.
Sepsis was defined in the study by ICD-9 codes for septicemia plus acute organ dysfunction.
There was no industry funding for the work and the investigators reported having no relevant financial disclosures.
AT IDSOG
Key clinical point:
Major finding: Of 506 cases of sepsis hospitalization following delivery, 199 (39%) cases were at or before postpartum week 6, and 310 (61%) were after week 6.
Data source: A database review of 506 sepsis hospitalizations following delivery, culled from almost 2 million live births in California from the period of 2008-2012.
Disclosures: There was no industry funding for the work and the investigators reported having no relevant financial disclosures.
PROTECT trial: No DFS benefit with adjuvant pazopanib for high-risk RCC
Adjuvant pazopanib provided no disease-free survival benefit compared with placebo in the randomized phase 3 PROTECT trial of patients with locally advanced renal cell carcinoma at high risk for relapse after nephrectomy.
In the primary analysis for disease-free survival among 571 patients treated for 1 year with 600 mg of pazopanib and 564 who received placebo, no significant improvement was seen with pazopanib (hazard ratio, 0.86). In a follow-up analysis 12 months later, the hazard ratio was 0.94. Secondary analysis in 403 additional patients who were treated with 800 mg of pazopanib before the dose was lowered to 600 mg due to intolerance and toxicity attrition showed a benefit with pazopanib (HR, 0.69), but this group represented only a third of the study population, reported Robert J. Motzer, MD, of Memorial Sloan Kettering Cancer Center, New York, and his colleagues. The study results were published online in the Journal of Clinical Oncology.

Common adverse events leading to treatment discontinuation included increased alanine transaminase and aspartate transaminase levels, which occurred in 16% and 5% of patients treated with 600 mg, respectively, and in 18% and 7% of patients treated with 800 mg, respectively. Four grade 5 adverse events occurred in the pazopanib groups (vs. 2 in the placebo group), and one of the deaths (in a patient who received 800 mg dosing) involved cardiomyopathy that was considered to be related to treatment, the investigators said (J Clin Oncol. 2017 Sep 13. doi: 10.1200/JCO.2017.73.5324).
The study comprised adults with resected pT2 or pT3 and greater disease, including N1, clear cell renal cell carcinoma, who were enrolled between Dec. 9, 2010, and Sept. 10, 2013, from 263 centers in 26 countries. Primary analysis was done after 350 disease-free events occurred in the intent-to-treat population receiving 600 mg.
The difference in treatment effect between those receiving 600 mg and 800 mg of pazopanib could be explained by the different starting dose, or by better performance of the placebo arm in the 600 mg group, the investigators noted.
As for overall survival, the results are inconclusive, because the data are not mature, they said.
Novartis supported the study. Dr. Mercer reported consulting or advisory roles with Pfizer, Novartis, Eisai, and Exelixis, and research funding to his institution from Pfizer, GlaxoSmithKline, Bristol-Myers Squibb, Eisai, Novartis, and Genentech. Numerous coauthors also reported financial relationships with pharmaceutical companies.
Adjuvant pazopanib provided no disease-free survival benefit compared with placebo in the randomized phase 3 PROTECT trial of patients with locally advanced renal cell carcinoma at high risk for relapse after nephrectomy.
In the primary analysis for disease-free survival among 571 patients treated for 1 year with 600 mg of pazopanib and 564 who received placebo, no significant improvement was seen with pazopanib (hazard ratio, 0.86). In a follow-up analysis 12 months later, the hazard ratio was 0.94. Secondary analysis in 403 additional patients who were treated with 800 mg of pazopanib before the dose was lowered to 600 mg due to intolerance and toxicity attrition showed a benefit with pazopanib (HR, 0.69), but this group represented only a third of the study population, reported Robert J. Motzer, MD, of Memorial Sloan Kettering Cancer Center, New York, and his colleagues. The study results were published online in the Journal of Clinical Oncology.
Common adverse events leading to treatment discontinuation included increased alanine transaminase and aspartate transaminase levels, which occurred in 16% and 5% of patients treated with 600 mg, respectively, and in 18% and 7% of patients treated with 800 mg, respectively. Four grade 5 adverse events occurred in the pazopanib groups (vs. 2 in the placebo group), and one of the deaths (in a patient who received 800 mg dosing) involved cardiomyopathy that was considered to be related to treatment, the investigators said (J Clin Oncol. 2017 Sep 13. doi: 10.1200/JCO.2017.73.5324).
The study comprised adults with resected pT2 or pT3 and greater disease, including N1, clear cell renal cell carcinoma, who were enrolled between Dec. 9, 2010, and Sept. 10, 2013, from 263 centers in 26 countries. Primary analysis was done after 350 disease-free events occurred in the intent-to-treat population receiving 600 mg.
The difference in treatment effect between those receiving 600 mg and 800 mg of pazopanib could be explained by the different starting dose, or by better performance of the placebo arm in the 600 mg group, the investigators noted.
As for overall survival, the results are inconclusive, because the data are not mature, they said.
Novartis supported the study. Dr. Mercer reported consulting or advisory roles with Pfizer, Novartis, Eisai, and Exelixis, and research funding to his institution from Pfizer, GlaxoSmithKline, Bristol-Myers Squibb, Eisai, Novartis, and Genentech. Numerous coauthors also reported financial relationships with pharmaceutical companies.
FROM JOURNAL OF CLINICAL ONCOLOGY
Key clinical point:
Major finding: In the primary analysis for disease-free survival, no significant improvement was seen with pazopanib vs. placebo (hazard ratio, 0.86).
Data source: The phase 3 PROTECT study of 1,538 patients.
Disclosures: Novartis supported the study. Dr. Mercer reported consulting or advisory roles with Pfizer, Novartis, Eisai, and Exelixis, and research funding to his institution from Pfizer, GlaxoSmithKline, Bristol-Myers Squibb, Eisai, Novartis, and Genentech. Numerous coauthors also reported financial relationships with pharmaceutical companies.
No increased overall cardiovascular risk seen with exenatide use
“We did not observe any specific safety issues during our trial; there was no adverse signal with respect to heart failure, despite the higher mean heart rate in the exenatide group than in the placebo group, and events of acute pancreatitis and pancreatic cancer were rare, with similar rates in the two groups,” according to researchers led by Rury R. Holman, F.Med.Sci. Their study was published online Sept. 14 in the New England Journal of Medicine, and was presented at the annual meeting of the European Association for the Study of Diabetes.
For the trial, which was funded by Amylin Pharmaceuticals and known as the Exenatide Study of Cardiovascular Event Lowering (EXSCEL), the researchers randomly assigned 14,752 patients with type 2 diabetes at 687 sites in 35 countries to receive subcutaneous injections of extended-released exenatide at a dose of 2 mg, or matching placebo once per week, from June 18, 2010, through Sept. 16, 2015. The patients were followed for a median of 3.2 years and the main outcome of interest was the first occurrence of death from cardiovascular causes, nonfatal myocardial infarction, or stroke.

In the meantime, the intention-to-treat analysis revealed that exenatide was noninferior to placebo with respect to safety (P less than .001) but was not superior to placebo with respect to safety (P = .06). The researchers observed no significant differences between the two groups in the rates of death from cardiovascular causes, fatal or nonfatal MI, or stroke, hospitalization for heart failure or for acute coronary syndrome, or in the incidence of cute pancreatitis, pancreatic cancer, medullary thyroid carcinoma, and serious adverse events.
“The pragmatic design of the trial included integration with usual care and wide-ranging eligibility criteria,” the researchers wrote. “For example, patients with any degree of cardiovascular risk who were at least 18 years of age (with no upper age limit) were eligible. To further augment the potential generalizability of any findings, we evaluated the cardiovascular effect of once-weekly extended-release exenatide in the usual-care setting by maintaining the focus of management of diabetes and cardiovascular risk with the usual-care provider.”
The researchers acknowledged certain limitations of the study, including the rate of premature discontinuation of the trial regimen, “which was driven by patient decision. We speculate that probable factors for discontinuation were the complexity of the first-generation injection device that was used and the fact that our trial had no run-in period.”
The trial was conducted jointly by the Duke Clinical Research Institute and the University of Oxford Diabetes Trial Unit, in collaboration with Amylin Pharmaceuticals. Dr. Holman and his coauthors reported having numerous financial ties to the pharmaceutical industry.
PRIMARY SOURCE: N Engl J Med 2017 Sept. 14. doi: 10.1056/NEJMoa1612917
“We did not observe any specific safety issues during our trial; there was no adverse signal with respect to heart failure, despite the higher mean heart rate in the exenatide group than in the placebo group, and events of acute pancreatitis and pancreatic cancer were rare, with similar rates in the two groups,” according to researchers led by Rury R. Holman, F.Med.Sci. Their study was published online Sept. 14 in the New England Journal of Medicine, and was presented at the annual meeting of the European Association for the Study of Diabetes.
For the trial, which was funded by Amylin Pharmaceuticals and known as the Exenatide Study of Cardiovascular Event Lowering (EXSCEL), the researchers randomly assigned 14,752 patients with type 2 diabetes at 687 sites in 35 countries to receive subcutaneous injections of extended-released exenatide at a dose of 2 mg, or matching placebo once per week, from June 18, 2010, through Sept. 16, 2015. The patients were followed for a median of 3.2 years and the main outcome of interest was the first occurrence of death from cardiovascular causes, nonfatal myocardial infarction, or stroke.
In the meantime, the intention-to-treat analysis revealed that exenatide was noninferior to placebo with respect to safety (P less than .001) but was not superior to placebo with respect to safety (P = .06). The researchers observed no significant differences between the two groups in the rates of death from cardiovascular causes, fatal or nonfatal MI, or stroke, hospitalization for heart failure or for acute coronary syndrome, or in the incidence of cute pancreatitis, pancreatic cancer, medullary thyroid carcinoma, and serious adverse events.
“The pragmatic design of the trial included integration with usual care and wide-ranging eligibility criteria,” the researchers wrote. “For example, patients with any degree of cardiovascular risk who were at least 18 years of age (with no upper age limit) were eligible. To further augment the potential generalizability of any findings, we evaluated the cardiovascular effect of once-weekly extended-release exenatide in the usual-care setting by maintaining the focus of management of diabetes and cardiovascular risk with the usual-care provider.”
The researchers acknowledged certain limitations of the study, including the rate of premature discontinuation of the trial regimen, “which was driven by patient decision. We speculate that probable factors for discontinuation were the complexity of the first-generation injection device that was used and the fact that our trial had no run-in period.”
The trial was conducted jointly by the Duke Clinical Research Institute and the University of Oxford Diabetes Trial Unit, in collaboration with Amylin Pharmaceuticals. Dr. Holman and his coauthors reported having numerous financial ties to the pharmaceutical industry.
PRIMARY SOURCE: N Engl J Med 2017 Sept. 14. doi: 10.1056/NEJMoa1612917
FROM EASD 2017
Key clinical point: Exenatide was noninferior to placebo with respect to cardiovascular safety but was not superior with respect to efficacy.
Major finding: Among patients with type 2 diabetes with and without previous cardiovascular disease, once-weekly administration of exenatide does not appear to cause an increase in their overall cardiovascular risk.
Study details: A randomized, placebo-controlled trial of 14,752 diabetic patients with or without previous cardiovascular disease.
Disclosures: The trial was conducted jointly by the Duke Clinical Research Institute and the University of Oxford Diabetes Trial Unit, in collaboration with Amylin Pharmaceuticals. Dr. Holman and his coauthors reported having numerous financial ties to the pharmaceutical industry.
Source: Rury R. Holman, et al. Effects of once-weekly exenatide on cardiovascular outcomes in type 2 diabetes. N Engl J Med 2017 Sept 14. doi: 10.1056/NEJMoa1612917.
Here’s what’s trending at SHM - Sept. 2017
Early decision for Fellows applications is Sept. 15. Apply now!
SHM’s Fellows designation is a prestigious way to differentiate yourself among your peers in hospital medicine. There are currently over 2,000 hospitalists who have earned the Fellow in Hospital Medicine (FHM) or Senior Fellow in Hospital Medicine (SFHM) designation by demonstrating core values of leadership, teamwork, and quality improvement.
“I was encouraged to consider SHM’s Fellow designation by other members of an SHM committee that I belonged to. Although reluctant at first, I realized that this was an opportunity to really confirm that I was a career hospitalist. The application process itself allowed me to objectively evaluate the work I had done to date and how it fit into my overall career plan. I believe that this FHM designation has fostered connections in the HM community and within my own institution that may not have been open to me before.” – Dr. Patricia Seymour, MD, FAAFP, FHM![]()
Got research? Get noticed at HM18!
Don’t miss your chance to present your research to a national audience. SHM’s scientific abstract and poster competition, known as Research, Innovations, and Clinical Vignettes (RIV), is one of the most popular events at SHM’s annual meeting, enabling hospitalists from across the country to discuss emerging scientific and clinical cases, share feedback, and make valuable professional connections.
Hospital Medicine 2018 (HM18) will be held April 8-11, 2018 at the Orlando World Center Marriott. Many cutting-edge abstracts first presented at SHM’s RIV sessions go on to be published in respected medical journals. Yours could be next.
For more details, visit hospitalmedicine2018.org.
Know someone with exceptional achievements in Hospital Medicine?
SHM’s prestigious Awards of Excellence recognize exceptional achievements in the field of hospital medicine in the following categories:
• Excellence in Research.
• Management Excellence in Hospital Medicine.
• Outstanding Service in Hospital Medicine.
• Excellence in Teaching.
• Clinical Excellence for Physicians.
• Clinical Excellence for Nurse Practitioners and Physician Assistants.
• Excellence in Humanitarian Services.
• Excellence in Teamwork.
Awards of Excellence nominations are due on Oct. 2, 2017. Nominate yourself or a colleague today at hospitalmedicine.org/awards.
Invest in your career with SPARK ONE
SPARK ONE, SHM’s premier online self-assessment created specifically for hospital medicine professionals, is the perfect tool to help you reach your goals. The activity contains 450+ vignette-style multiple-choice questions covering 100% of the American Board of Internal Medicine’s Focused Practice in Hospital Medicine (FPHM) exam blueprint.
This online tool is your complete resource for successfully preparing for the FPHM exam or assessing your general knowledge in hospital medicine. Used as a self-paced study guide, it engages learners through an open-book format, allowing users to review detailed learning objectives and discussion points, and define individual areas of strengths and weaknesses. Earn up to 23 AMA PRA Category 1 Credit™ and 23 MOC points.
Learn more at hospitalmedicine.org/sparkone.
Strengthen your knowledge & skills in practice administration
Get involved in the SHM Practice Administrators’ Committee 2018 Mentor/Mentee Program.
This program helps you create relationships and serves as an outlet for you to pose questions or ideas to a seasoned hospital medicine group administrator. There are two different ways you can participate: as a less experienced administrator looking for a mentor or as a more experienced administrator looking to be paired with a peer. This program is free to members only. Not a member? Join today at hospitalmedicine.org/join.
Learn more about the program and submit your application at hospitalmedicine.org/pamentor.
Obtain an extensive insight into Hospital Medicine groups configuration and operation
SHM’s State of Hospital Medicine Report includes data collected from 600 hospital medicine groups (HMGs) representing 9,000 providers to keep you current on hospitalist compensation and production, in addition to cutting-edge knowledge covering practice demographics, staffing levels, turnover, staff growth, compensation methods, and financial support for solid, evidence-based management decisions.
The 2016 State of Hospital Medicine Report is not only in print but also available in an enhanced, fully searchable digital version. Order your copy at hospitalmedicine.org/sohm.
Mr. Radler is marketing communications manager at the Society of Hospital Medicine.
Pityriasis Rubra Pilaris and Severe Hypereosinophilia
To the Editor:
A 63-year-old man presented with a prior diagnosis of severe psoriasis affecting the extremities, neck, face, and scalp of 1 year’s duration. He reported pain, itching, and swelling in the affected areas. He felt the rash was worst on the hands and feet, and pain made performing activities of daily living difficult. His treatment regimen at presentation included triamcinolone cream 0.1% and azathioprine 150 mg daily as prescribed by an outside dermatologist without any response. Physical examination revealed diffuse erythema with lichenification and thick, white, flaking scale on the arms and legs (Figure 1A), face, neck, palms, and soles with islands of sparing. Multiple salmon-colored, follicular-based papules topped with central hyperkeratosis were scattered on these same areas. The palms and soles had severe confluent keratoderma (Figure 2A). Histologic examination of a follicular-based papule showed foci of parakeratosis and hypergranulosis consistent with the patient’s clinical picture of pityriasis rubra pilaris (PRP).
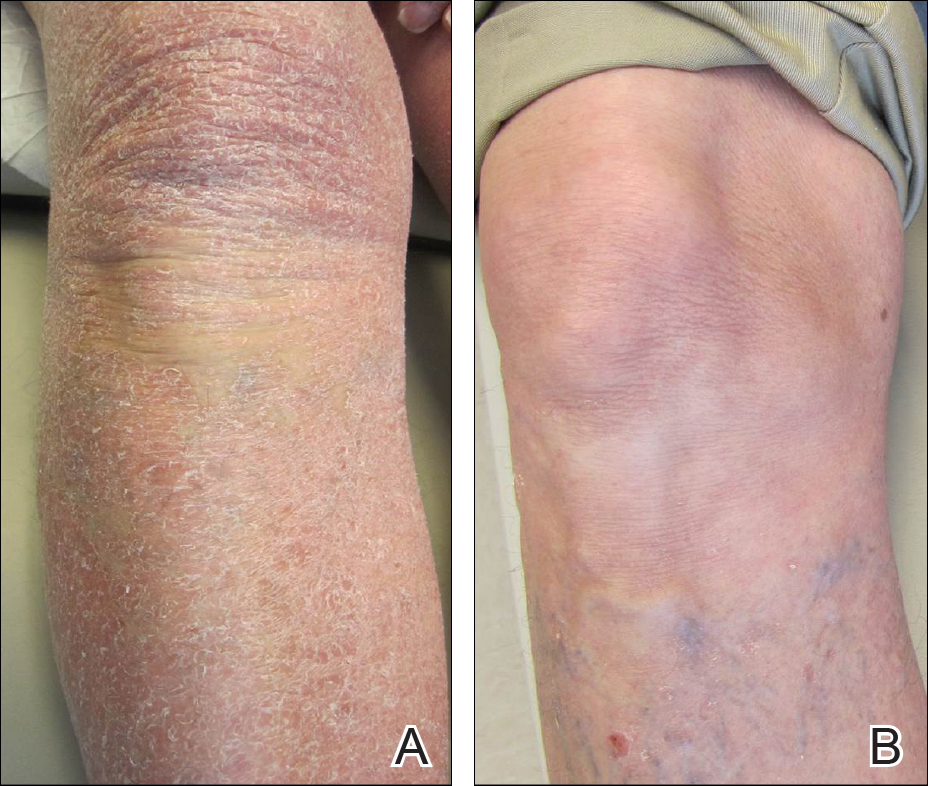
Baseline laboratory tests at the time of PRP diagnosis revealed 20.8% eosinophils (reference range, 0%–7%) and an absolute eosinophil count of 2.17×10⁹/L (reference range, 0–0.7×10⁹/L). Laboratory test results from an outside dermatologist conducted 10 to 12 months prior to the current presentation showed 12% eosinophils with a white blood cell count of 8.9×10⁹/L (reference range, 4.5–11.0×10⁹/L) around the time of rash onset and before treatment with azathioprine, making a drug reaction an unlikely cause of the eosinophilia.
After consulting with the hematology department, a hypereosinophilia workup including erythrocyte sedimentation rate, lactate dehydrogenase, serum protein electrophoresis, urine protein electrophoresis, tryptase, double-stranded DNA antibody, human T-lymphotrophic virus I/II, stool ova, and parasites, as well as a Strongyloides antibody titer, were performed; all were within reference range. His antinuclear antibody level was mildly elevated at 1:160, but the patient had no clinical manifestations of lupus. Given this negative workup, the most likely explanation for the hypereosinophilia was a reactive process secondary to the extreme inflammatory state.

The patient was started on isotretinoin 40 mg daily in addition to urea cream 40% mixed with clobetasol ointment at least once daily to the extremities. Hydrocortisone ointment 2.5% and petrolatum-based ointment were applied to the face, and hydroxyzine was used as needed for pruritus. One month after initiating isotretinoin, erythema had decreased and a repeat complete blood cell count with differential showed a decrease of eosinophils to 14.7% and an absolute eosinophil count of 1.56×10⁹/L. After 2 months of therapy, the patient showed remarkable improvement. After 3.5 months of therapy, the keratoderma on the palms and soles was almost completely resolved, the follicular-based papules disappeared, and the patient had no areas of lichenification (Figures 1B and 2B). After 5 months of therapy, the patient experienced resolution of the PRP, except for residual facial erythema. His eosinophil count continued to trend downward during these 5 months, reaching 7.6% with an absolute eosinophil count of 0.93×10⁹/L. Three years after the initial onset of the rash and 2 years after completing isotretinoin, his eosinophil level was normal at 5.3% with an absolute eosinophil count of 0.7×10⁹/L.
We present a case of PRP and severe eosinophilia. We initially considered a second disease process to explain the extremely elevated eosinophil count; however, a negative eosinophilia workup and simultaneous resolution of these problems suggest that the eosinophilia was related to the severity of the PRP.
To the Editor:
A 63-year-old man presented with a prior diagnosis of severe psoriasis affecting the extremities, neck, face, and scalp of 1 year’s duration. He reported pain, itching, and swelling in the affected areas. He felt the rash was worst on the hands and feet, and pain made performing activities of daily living difficult. His treatment regimen at presentation included triamcinolone cream 0.1% and azathioprine 150 mg daily as prescribed by an outside dermatologist without any response. Physical examination revealed diffuse erythema with lichenification and thick, white, flaking scale on the arms and legs (Figure 1A), face, neck, palms, and soles with islands of sparing. Multiple salmon-colored, follicular-based papules topped with central hyperkeratosis were scattered on these same areas. The palms and soles had severe confluent keratoderma (Figure 2A). Histologic examination of a follicular-based papule showed foci of parakeratosis and hypergranulosis consistent with the patient’s clinical picture of pityriasis rubra pilaris (PRP).
Baseline laboratory tests at the time of PRP diagnosis revealed 20.8% eosinophils (reference range, 0%–7%) and an absolute eosinophil count of 2.17×10⁹/L (reference range, 0–0.7×10⁹/L). Laboratory test results from an outside dermatologist conducted 10 to 12 months prior to the current presentation showed 12% eosinophils with a white blood cell count of 8.9×10⁹/L (reference range, 4.5–11.0×10⁹/L) around the time of rash onset and before treatment with azathioprine, making a drug reaction an unlikely cause of the eosinophilia.
After consulting with the hematology department, a hypereosinophilia workup including erythrocyte sedimentation rate, lactate dehydrogenase, serum protein electrophoresis, urine protein electrophoresis, tryptase, double-stranded DNA antibody, human T-lymphotrophic virus I/II, stool ova, and parasites, as well as a Strongyloides antibody titer, were performed; all were within reference range. His antinuclear antibody level was mildly elevated at 1:160, but the patient had no clinical manifestations of lupus. Given this negative workup, the most likely explanation for the hypereosinophilia was a reactive process secondary to the extreme inflammatory state.
The patient was started on isotretinoin 40 mg daily in addition to urea cream 40% mixed with clobetasol ointment at least once daily to the extremities. Hydrocortisone ointment 2.5% and petrolatum-based ointment were applied to the face, and hydroxyzine was used as needed for pruritus. One month after initiating isotretinoin, erythema had decreased and a repeat complete blood cell count with differential showed a decrease of eosinophils to 14.7% and an absolute eosinophil count of 1.56×10⁹/L. After 2 months of therapy, the patient showed remarkable improvement. After 3.5 months of therapy, the keratoderma on the palms and soles was almost completely resolved, the follicular-based papules disappeared, and the patient had no areas of lichenification (Figures 1B and 2B). After 5 months of therapy, the patient experienced resolution of the PRP, except for residual facial erythema. His eosinophil count continued to trend downward during these 5 months, reaching 7.6% with an absolute eosinophil count of 0.93×10⁹/L. Three years after the initial onset of the rash and 2 years after completing isotretinoin, his eosinophil level was normal at 5.3% with an absolute eosinophil count of 0.7×10⁹/L.
We present a case of PRP and severe eosinophilia. We initially considered a second disease process to explain the extremely elevated eosinophil count; however, a negative eosinophilia workup and simultaneous resolution of these problems suggest that the eosinophilia was related to the severity of the PRP.
Practice Points
- Pityriasis rubra pilaris (PRP) can clinically mimic psoriasis. Look for islands of sparing and palmar and plantar hyperkeratosis to help diagnose PRP. A biopsy may be useful to help with this differentiation.
- Pityriasis rubra pilaris may be associated with eosinophilia, but one should rule out other causes of eosinophilia first.

Sporotrichoid Pattern of Mycobacterium chelonae-abscessus Infection
To the Editor:
We present a case of Mycobacterium chelonae-abscessus cutaneous infection in a sporotrichoid pattern, a rare presentation most often found in immunocompromised patients. A 34-year-old man with lupus nephritis who was taking oral prednisone, mycophenolate mofetil, and hydroxychloroquine presented with multiple erythematous fluctuant nodules and plaques on the left volar forearm in a sporotrichoid pattern of 3 months’ duration (Figure, A). He denied recent travel, exposure to fish or fish tanks, and penetrating wounds. Punch biopsy showed granulomatous inflammation and scarring with negative tissue cultures. Repeat biopsies and cultures were obtained when the lesions increased in number over 2 months.
Final biopsy showed upper dermal granulomatous inflammation with karyorrhectic debris, suggesting infection, and acid-fast bacilli. Culture grew M chelonae-abscessus on Löwenstein-Jensen agar at 37°C and blood culture media from which the complex was identified using high-performance liquid chromatography. Empiric therapy with renal dosing based on the Infectious Diseases Society of America statement of susceptibilities1 was initiated with clarithromycin, doxycycline, and ciprofloxacin for 4 months. Furthermore, the prednisone dose was tapered to 7.5 mg daily. Two months later, the lesions regressed and ciprofloxacin was discontinued (Figure, B).
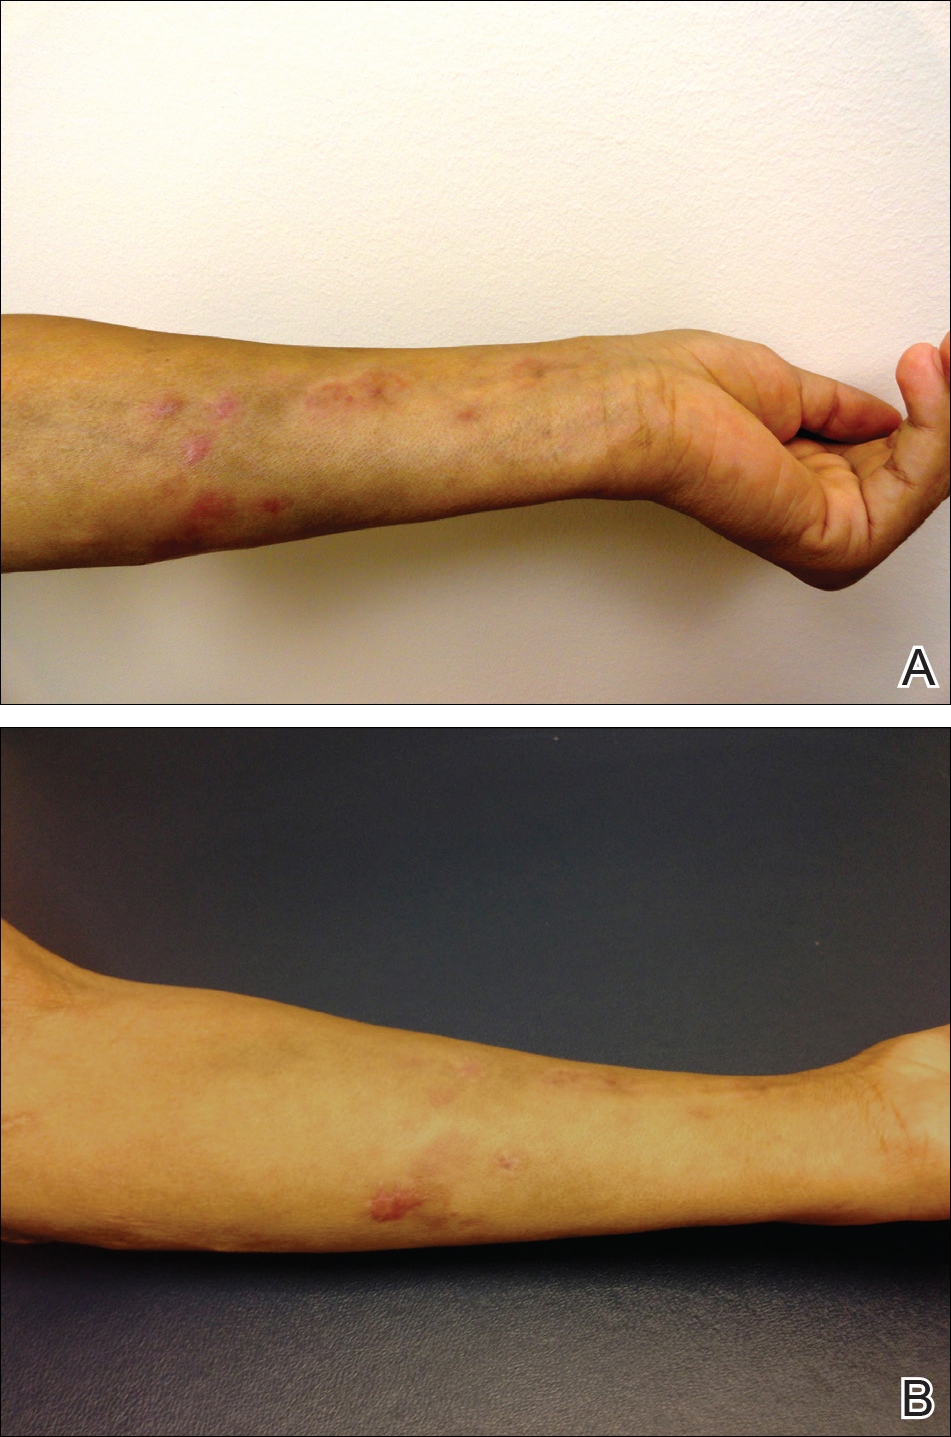
The sporotrichoid spread of nodules suggests infection with mycobacteria, Sporothrix schenckii, Leishmania, Francisella tularensis, or Nocardia. Most cultures for nontuberculous mycobacteria will grow on Löwenstein-Jensen agar between 28°C and 37°C. Runyon rapidly growing (group IV) mycobacteria are defined by their ubiquitous presence in the environment and ability to develop colonies in 7 days.2 Cutaneous infections are increasing in prevalence, as reported in a retrospective study spanning nearly 30 years.3 The presentation is variable but often includes the distal extremities and usually is a nodule, ulcer, or abscess at a single site; a sporotrichoid pattern is more rare. Preceding skin trauma is the major risk factor for immunocompetent hosts, and the infection can spontaneously resolve in 8 to 12 months.1 In contrast, immunosuppressed patients may have no known source of infection and often have a progressive course with an increasing number of lesions and increased time until clearance.4
It is difficult to differentiate M chelonae and M abscessus based on growth characteristics, and they share the same 16S ribosomal RNA sequence commonly used to differentiate other mycobacterial species.2 Mycobacterium abscessus can be more difficult to treat, thus distinction via polymerase chain reaction of the heat-shock protein 65 gene, hsp65, can be valuable in cases recalcitrant to initial therapy.1
The likelihood of M chelonae and M abscessus isolates to be initially sensitive to clarithromycin is 100%,1 and this antibiotic remains the cornerstone of therapy. A clinical trial of treatments for M chelonae-abscessus found that clarithromycin monotherapy can be successful or complicated by resistance5; therefore, multidrug therapy is recommended. The antibiotic regimen for our patient was chosen to limit renal toxicity.
In summary, we report a case of M chelonae-abscessus cutaneous infection in a sporotrichoid pattern in a patient with lupus nephritis on immunosuppressive drugs. As the incidence of rapidly growing mycobacterial cutaneous infections rises, dermatologists must be aware of this pattern of infection.
- Griffith DE, Aksamit T, Brown-Elliot BA, et al. An official ATS/IDSA statement: diagnosis, treatment, and prevention of nontuberculous mycobacterial diseases. Am J Respir Crit Care Med. 2007;175:367-416.
- De Groote MA, Huitt G. Infections due to rapidly-growing Mycobacteria. Clin Infect Dis. 2006;42:1756-1763.
- Wentworth AB, Drage LA, Wengenack NL, et al. Increased incidence of cutaneous nontuberculous mycobacterial infection, 1980 to 2009: a population-based study. Mayo Clin Proc. 2013;88:38-45.
- Lee WJ, Kang SM, Sung H, et al. Non-tuberculous mycobacterial infections of the skin: a retrospective study of 29 cases. J Dermatol. 2010:37:965-972.
- Wallace RJ, Tanner D, Brennan PJ, et al. Clinical trial of clarithromycin for cutaneous (disseminated) infection due to Mycobacterium chelonae. Ann Intern Med. 1993;119:482-486.
To the Editor:
We present a case of Mycobacterium chelonae-abscessus cutaneous infection in a sporotrichoid pattern, a rare presentation most often found in immunocompromised patients. A 34-year-old man with lupus nephritis who was taking oral prednisone, mycophenolate mofetil, and hydroxychloroquine presented with multiple erythematous fluctuant nodules and plaques on the left volar forearm in a sporotrichoid pattern of 3 months’ duration (Figure, A). He denied recent travel, exposure to fish or fish tanks, and penetrating wounds. Punch biopsy showed granulomatous inflammation and scarring with negative tissue cultures. Repeat biopsies and cultures were obtained when the lesions increased in number over 2 months.
Final biopsy showed upper dermal granulomatous inflammation with karyorrhectic debris, suggesting infection, and acid-fast bacilli. Culture grew M chelonae-abscessus on Löwenstein-Jensen agar at 37°C and blood culture media from which the complex was identified using high-performance liquid chromatography. Empiric therapy with renal dosing based on the Infectious Diseases Society of America statement of susceptibilities1 was initiated with clarithromycin, doxycycline, and ciprofloxacin for 4 months. Furthermore, the prednisone dose was tapered to 7.5 mg daily. Two months later, the lesions regressed and ciprofloxacin was discontinued (Figure, B).
The sporotrichoid spread of nodules suggests infection with mycobacteria, Sporothrix schenckii, Leishmania, Francisella tularensis, or Nocardia. Most cultures for nontuberculous mycobacteria will grow on Löwenstein-Jensen agar between 28°C and 37°C. Runyon rapidly growing (group IV) mycobacteria are defined by their ubiquitous presence in the environment and ability to develop colonies in 7 days.2 Cutaneous infections are increasing in prevalence, as reported in a retrospective study spanning nearly 30 years.3 The presentation is variable but often includes the distal extremities and usually is a nodule, ulcer, or abscess at a single site; a sporotrichoid pattern is more rare. Preceding skin trauma is the major risk factor for immunocompetent hosts, and the infection can spontaneously resolve in 8 to 12 months.1 In contrast, immunosuppressed patients may have no known source of infection and often have a progressive course with an increasing number of lesions and increased time until clearance.4
It is difficult to differentiate M chelonae and M abscessus based on growth characteristics, and they share the same 16S ribosomal RNA sequence commonly used to differentiate other mycobacterial species.2 Mycobacterium abscessus can be more difficult to treat, thus distinction via polymerase chain reaction of the heat-shock protein 65 gene, hsp65, can be valuable in cases recalcitrant to initial therapy.1
The likelihood of M chelonae and M abscessus isolates to be initially sensitive to clarithromycin is 100%,1 and this antibiotic remains the cornerstone of therapy. A clinical trial of treatments for M chelonae-abscessus found that clarithromycin monotherapy can be successful or complicated by resistance5; therefore, multidrug therapy is recommended. The antibiotic regimen for our patient was chosen to limit renal toxicity.
In summary, we report a case of M chelonae-abscessus cutaneous infection in a sporotrichoid pattern in a patient with lupus nephritis on immunosuppressive drugs. As the incidence of rapidly growing mycobacterial cutaneous infections rises, dermatologists must be aware of this pattern of infection.
- Griffith DE, Aksamit T, Brown-Elliot BA, et al. An official ATS/IDSA statement: diagnosis, treatment, and prevention of nontuberculous mycobacterial diseases. Am J Respir Crit Care Med. 2007;175:367-416.
- De Groote MA, Huitt G. Infections due to rapidly-growing Mycobacteria. Clin Infect Dis. 2006;42:1756-1763.
- Wentworth AB, Drage LA, Wengenack NL, et al. Increased incidence of cutaneous nontuberculous mycobacterial infection, 1980 to 2009: a population-based study. Mayo Clin Proc. 2013;88:38-45.
- Lee WJ, Kang SM, Sung H, et al. Non-tuberculous mycobacterial infections of the skin: a retrospective study of 29 cases. J Dermatol. 2010:37:965-972.
- Wallace RJ, Tanner D, Brennan PJ, et al. Clinical trial of clarithromycin for cutaneous (disseminated) infection due to Mycobacterium chelonae. Ann Intern Med. 1993;119:482-486.
Practice Points
- Dermatologists should consider atypical mycobacterial infections, including rapidly growing mycobacteria, in the differential diagnosis for lesions with sporotrichoid-pattern spread.
- Multidrug therapy often is required for treatment of infection caused by Mycobacteria chelonae-abscessus complex.