User login
In Vivo Reflectance Confocal Microscopy
Reflectance confocal microscopy (RCM) imaging received Category I Current Procedural Terminology (CPT) codes by the Centers for Medicare & Medicaid Services in January 2016 and can now be submitted to insurance companies with reimbursement comparable to a skin biopsy or a global skin pathology service.1 This fairly new technology is a US Food and Drug Administration–cleared noninvasive imaging modality that provides high-resolution in vivo cellular images of the skin. It has been shown to be efficacious in differentiating benign and malignant skin lesions, increasing diagnostic accuracy, and reducing the number of unnecessary skin biopsies that are performed. In addition to skin cancer diagnosis, RCM imaging also can help guide management of malignant lesions by detecting lateral margins prior to surgery as well as monitoring the lesion over time for treatment efficacy or recurrence. The potential impact of RCM imaging is tremendous, and reimbursement may lead to increased use in clinical practice to the benefit of our patients. Herein, we present a brief review of RCM imaging and reimbursement as well as the benefits and limitations of this new technology for dermatologists.
Reflectance Confocal Microscopy
In vivo RCM allows us to visualize the epidermis in real time on a cellular level down to the papillary dermis at a high resolution (×30) comparable to histologic examination. With optical sections 3- to 5-µm thick and a lateral resolution of 0.5 to 1.0 µm, RCM produces a stack of 500×500-µm2 images up to a depth of approximately 200 µm.2,3 At any chosen depth, these smaller images are stitched together with sophisticated software into a block, or mosaic, increasing the field of view to up to 8×8 mm2. Imaging is performed in en face planes oriented parallel to the skin surface, similar to dermoscopy.
Current CPT Guidelines and Reimbursement
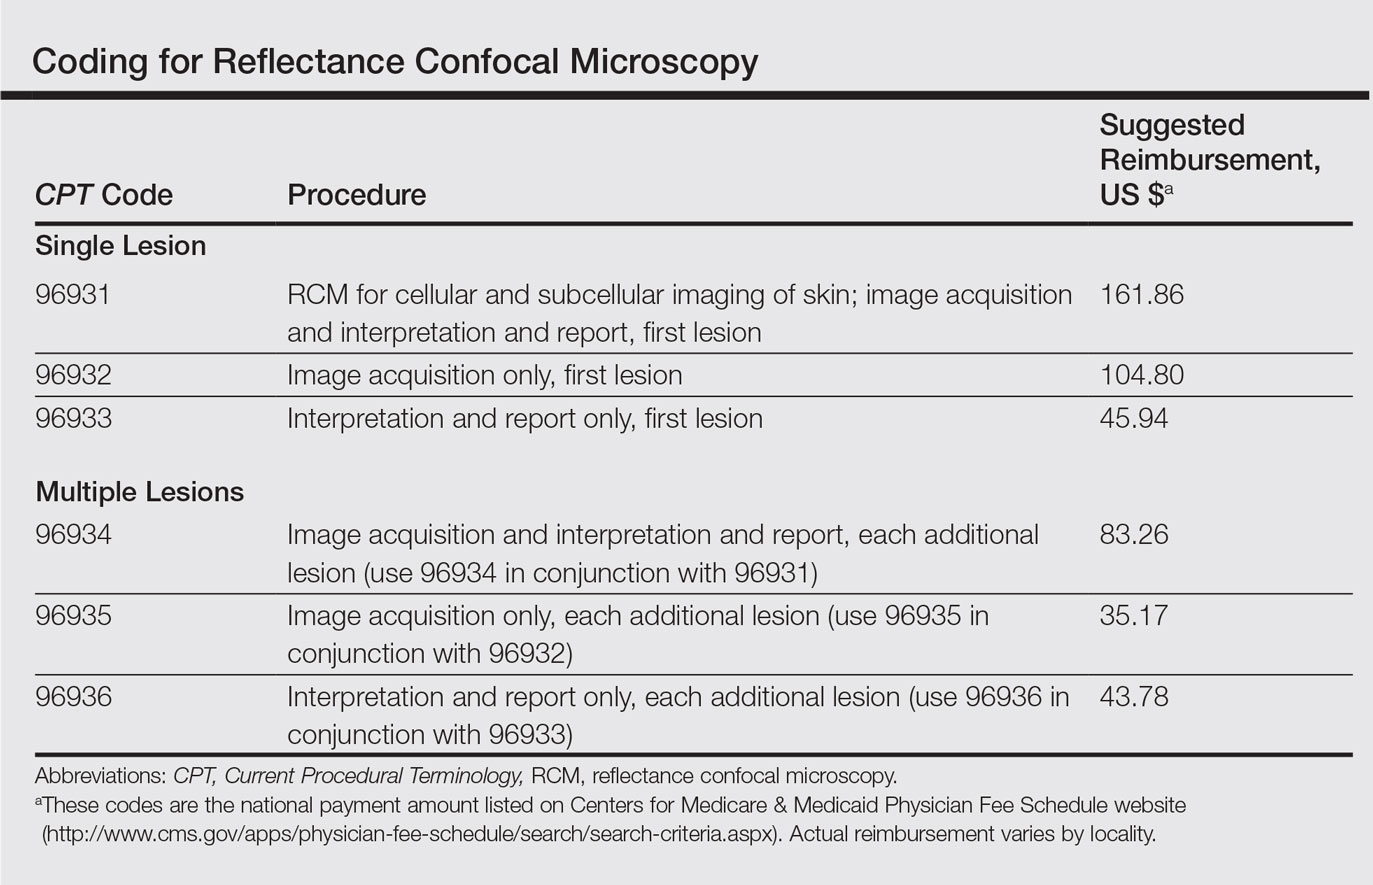
The CPT codes for RCM imaging provide reimbursement on a per-lesion basis and are similar to those used for skin biopsy and pathology (Table).1 Codes 96931 through 96933 are used for imaging of a single lesion on a patient. The first code—96931—is used when image acquisition, interpretation, and report creation are carried out by a single clinician. The next 2 codes are used when one clinician acquires the image—96932—comparable to the technical component of a pathology code, while another reads it and creates the report—96933—similar to a dermatopathologist billing for the professional component of a pathology report. For patients presenting with multiple lesions, the next 3 codes—96934, 96935, and 96936—are used in conjunction with the applicable first code for each additional lesion with similar global, technical, and professional components. Because these codes are not in the radiology or pathology sections of CPT, a single code cannot be used with modifier -TC (technical component) and modifier -26, as they are in those sections.
The wide-probe VivaScope 1500 (Caliber I.D., Inc) currently is the only confocal device that can be reported with a CPT code and routinely reimbursed. The handheld VivaScope 3000 (Caliber I.D., Inc) can only view a small stack and does not have the ability to acquire a full mosaic image; it is not covered by these codes.
Images can be viewed as a stack captured at the same horizontal position but at sequential depths or as a mosaic, which has a larger field of view but is limited to a single plane. To appropriately assess a lesion, clinicians must obtain a mosaic that needs to be assessed at multiple layers for a diagnosis to be made because it is a cross-section view.
Diagnosis
Studies have demonstrated the usefulness of RCM imaging in the diagnosis of a wide range of skin diseases, including melanoma and nonmelanoma skin cancers, infectious diseases, and inflammatory and autoimmune conditions, as well as wound healing and skin aging. Reflectance confocal microscopy imaging is not limited to the skin; it can be used to evaluate the hair, nails, oral mucosa, and other organs.
According to several studies, RCM imaging notably increases the diagnostic accuracy and detection rate of skin cancers over clinical and dermoscopic examination alone and therefore can act as an aid in differentiating lesions that are benign versus those that are suspicious and should be biopsied.
Reflectance confocal microscopy has been shown to have a mean sensitivity of 94% (range, 92%–96%) and specificity of 83% (range, 81%–84%) for all types of skin cancer when used with dermoscopy.4 In particular, for melanocytic lesions that are ambiguous on dermoscopy, RCM used in addition to dermoscopy increases the mean sensitivity and specificity for melanoma diagnosis to 93% (range, 89%–96%) and 76% (range, 68%–83%), respectively.5 Although these reported sensitivities are comparable to dermoscopy, the specificity is superior, especially for detecting hypomelanotic and amelanotic melanomas, which often lack specific features on dermoscopy.6-8
The combination of RCM with dermoscopy has reduced the number of unnecessary excisions of benign nevi by more than 50% when compared to dermoscopy alone.9 One study showed that the number needed to treat (ie, excise) a melanoma decreased from 14.6 with dermoscopy alone to 6.8 when guided by dermoscopy and RCM imaging.9 In a similar study, the number needed to treat dropped from 19.41 with dermoscopy alone to 6.25 with dermoscopy and RCM.10
These studies were not looking to evaluate RCM as a replacement test but rather as an add-on test to dermoscopy. Reflectance confocal microscopy imaging takes longer than dermoscopy for each lesion; therefore, RCM should only be used as an adjunctive tool to dermoscopy and not as an initial screening test. Consequentially, a dermatologist skilled in dermoscopy is essential in deciding which lesions would be appropriate for subsequent RCM imaging.
In Vivo Margin Mapping as an Adjunct to Surgery
Oftentimes, tumor margins are poorly defined and can be difficult to map clinically and dermoscopically. Studies have demonstrated the use of RCM in delineation of surgical margins prior to surgery or excisional biopsies.11,12 Alternatively, when complete removal at biopsy would be impractical (eg, for extremely large lesions or lesions located in cosmetically sensitive areas such as the face), RCM can be used to pick the best site for an appropriate biopsy, which decreases the chance of sampling error due to skip lesions and increases histologic accuracy.
Nonsurgical Treatment Monitoring
One advantage of RCM over conventional histology is that RCM imaging leaves the tissue intact, allowing dynamic changes to be studied over time, which is useful for monitoring nonmelanoma skin cancers and lentigo maligna being treated with noninvasive therapeutic modalities.13 If not as a definitive treatment, RCM can act as an adjunct for surgery by monitoring reduction in lesion size prior to Mohs micrographic surgery, thereby decreasing the resulting surgical defect.14
Limitations
Imaging Depth
Although RCM is a revolutionary device in the field of dermatology, it has several limitations. With a maximal imaging depth of 350 µm, the imaging resolution decreases substantially with depth, limiting accurate interpretation to 200 µm. Reflectance confocal microscopy can only image the superficial portion of a lesion; therefore, deep tumor margins cannot be assessed. Hypertrophic or hyperkeratotic lesions, including lesions on the palms and soles, also are unable to be imaged with RCM. This limitation in depth penetration makes treatment monitoring impossible for invasive lesions that extend into the dermal layer.
Difficult-to-Reach Areas
Another limitation is the difficulty imaging areas such as the ocular canthi, nasal alae, or helices of the ear due to the wide probe size on the VivaScope 1500. The advent of the smaller handheld VivaScope 3000 device allows for improved imaging of concave services and difficult lesions at the risk of less accurate imaging, low field of view, and no reimbursement at present.
False-Positive Results
Although RCM has been shown to be helpful in reducing unnecessary biopsies, there still is the issue of false-positives on imaging. False-positives most commonly occur in nevi with severe atypia or when Langerhans cells are present that cannot always be differentiated from melanocytic cells.3,15,16 One prospective study found 7 false-positive results from 63 sites using RCM for the diagnosis of lentigo malignas.16 False-negatives can occur in the presence of inflammatory infiltrates and scar tissue that can hide cellular morphology or in sampling errors due to skip lesions.3,16
Time Efficiency
The time required for acquisition of RCM mosaics and stacks followed by reading and interpretation can be substantial depending on the size and complexity of the lesion, which is a major limitation for use of RCM in busy dermatology practices; therefore, RCM should be reserved for lesions selected to undergo biopsy that are clinically equivocal for malignancy prior to RCM examination.17 It would not be cost-effective or time effective to evaluate lesions that either clinically or dermoscopically have a high probability of malignancy; however, patients and physicians may opt for increased specificity at the expense of time, particularly when a lesion is located on a cosmetically sensitive area, as patients can avoid initial histologic biopsy and gain the cosmetic benefit of going straight to surgery versus obtaining an initial diagnostic biopsy.
Cost
Lastly, the high cost involved in purchasing an RCM device and the training involved to use and interpret RCM images currently limits RCM to large academic centers. Reimbursement may make more widespread use feasible. In any event, RCM imaging should be part of the curriculum for both dermatology and pathology trainees.
Future Directions
In vivo RCM is a noninvasive imaging modality that allows for real-time evaluation of the skin. Used in conjunction with dermoscopy, RCM can substantially improve diagnostic accuracy and reduce the number of unnecessary biopsies. Now that RCM has finally gained foundational CPT codes and insurance reimbursement, there may be a growing demand for clinicians to incorporate this technology into their clinical practice.
- Current Procedural Terminology 2017, Professional Edition. Chicago IL: American Medical Association; 2016.
- Que SK, Fraga-Braghiroli N, Grant-Kels JM, et al. Through the looking glass: basics and principles of reflectance confocal microscopy [published online June 4, 2015]. J Am Acad Dermatol. 2015;73:276-284.
- Rajadhyaksha M, Marghoob A, Rossi A, et al. Reflectance confocal microscopy of skin in vivo: from bench to bedside [published online October 27, 2016]. Lasers Surg Med. 2017;49:7-19.
- Xiong YD, Ma S, Li X, et al. A meta-analysis of reflectance confocal microscopy for the diagnosis of malignant skin tumours. J Eur Acad Dermatol Venereol. 2016;30:1295-1302.
- Stevenson AD, Mickan S, Mallett S, et al. Systematic review of diagnostic accuracy of reflectance confocal microscopy for melanoma diagnosis in patients with clinically equivocal skin lesions. Dermatol Pract Concept. 2013;3:19-27.
- Busam KJ, Hester K, Charles C, et al. Detection of clinically amelanotic malignant melanoma and assessment of its margins by in vivo confocal scanning laser microscopy. Arch Dermatol. 2001;137:923-929.
- Losi A, Longo C, Cesinaro AM, et al. Hyporeflective pagetoid cells: a new clue for amelanotic melanoma diagnosis by reflectance confocal microscopy. Br J Dermatol. 2014;171:48-54.
- Guitera P, Menzies SQ, Argenziano G, et al. Dermoscopy and in vivo confocal microscopy are complementary techniques for the diagnosis of difficult amelanotic and light-coloured skin lesions [published online October 12, 2016]. Br J Dermatol. 2016;175:1311-1319.
- Pellacani G, Pepe P, Casari A, et al. Reflectance confocal microscopy as a second-level examination in skin oncology improves diagnostic accuracy and saves unnecessary excisions: a longitudinal prospective study. Br J Dermatol. 2014;171:1044-1051.
- Pellacani G, Witkowski A, Cesinaro AM, et al. Cost-benefit of reflectance confocal microscopy in the diagnostic performance of melanoma. J Eur Acad Dermatol Venereol. 2016;30:413-419.
- Champin J, Perrot JL, Cinotti E, et al. In vivo reflectance confocal microscopy to optimize the spaghetti technique for defining surgical margins of lentigo maligna. Dermatol Surg. 2014;40:247-256.
- Hibler BP, Cordova M, Wong RJ, et al. Intraoperative real-time reflectance confocal microscopy for guiding surgical margins of lentigo maligna melanoma. Dermatol Surg. 2015;41:980-983.
- Ulrich M, Lange-Asschenfeldt S, Gonzalez S. The use of reflectance confocal microscopy for monitoring response to therapy of skin malignancies. Dermatol Pract Concept. 2012;2:202a10.
- Torres A, Niemeyer A, Berkes B, et al. 5% imiquimod cream and reflectance-mode confocal microscopy as adjunct modalities to Mohs micrographic surgery for treatment of basal cell carcinoma. Dermatol Surg. 2004;30(12, pt 1):1462-1469.
- Hashemi P, Pulitzer MP, Scope A, et al. Langerhans cells and melanocytes share similar morphologic features under in vivo reflectance confocal microscopy: a challenge for melanoma diagnosis. J Am Acad Dermatol. 2012;66:452-462.
- Menge TD, Hibler BP, Cordova MA, et al. Concordance of handheld reflectance confocal microscopy (RCM) with histopathology in the diagnosis of lentigo maligna (LM): a prospective study. J Am Acad Dermatol. 2016;74:1114-1120.
- Borsari S, Pampena R, Lallas A, et al. Clinical indications for use of reflectance confocal microscopy for skin cancer diagnosis. JAMA Dermatol. 2016;152:1093-1098.
Reflectance confocal microscopy (RCM) imaging received Category I Current Procedural Terminology (CPT) codes by the Centers for Medicare & Medicaid Services in January 2016 and can now be submitted to insurance companies with reimbursement comparable to a skin biopsy or a global skin pathology service.1 This fairly new technology is a US Food and Drug Administration–cleared noninvasive imaging modality that provides high-resolution in vivo cellular images of the skin. It has been shown to be efficacious in differentiating benign and malignant skin lesions, increasing diagnostic accuracy, and reducing the number of unnecessary skin biopsies that are performed. In addition to skin cancer diagnosis, RCM imaging also can help guide management of malignant lesions by detecting lateral margins prior to surgery as well as monitoring the lesion over time for treatment efficacy or recurrence. The potential impact of RCM imaging is tremendous, and reimbursement may lead to increased use in clinical practice to the benefit of our patients. Herein, we present a brief review of RCM imaging and reimbursement as well as the benefits and limitations of this new technology for dermatologists.
Reflectance Confocal Microscopy
In vivo RCM allows us to visualize the epidermis in real time on a cellular level down to the papillary dermis at a high resolution (×30) comparable to histologic examination. With optical sections 3- to 5-µm thick and a lateral resolution of 0.5 to 1.0 µm, RCM produces a stack of 500×500-µm2 images up to a depth of approximately 200 µm.2,3 At any chosen depth, these smaller images are stitched together with sophisticated software into a block, or mosaic, increasing the field of view to up to 8×8 mm2. Imaging is performed in en face planes oriented parallel to the skin surface, similar to dermoscopy.
Current CPT Guidelines and Reimbursement
The CPT codes for RCM imaging provide reimbursement on a per-lesion basis and are similar to those used for skin biopsy and pathology (Table).1 Codes 96931 through 96933 are used for imaging of a single lesion on a patient. The first code—96931—is used when image acquisition, interpretation, and report creation are carried out by a single clinician. The next 2 codes are used when one clinician acquires the image—96932—comparable to the technical component of a pathology code, while another reads it and creates the report—96933—similar to a dermatopathologist billing for the professional component of a pathology report. For patients presenting with multiple lesions, the next 3 codes—96934, 96935, and 96936—are used in conjunction with the applicable first code for each additional lesion with similar global, technical, and professional components. Because these codes are not in the radiology or pathology sections of CPT, a single code cannot be used with modifier -TC (technical component) and modifier -26, as they are in those sections.
The wide-probe VivaScope 1500 (Caliber I.D., Inc) currently is the only confocal device that can be reported with a CPT code and routinely reimbursed. The handheld VivaScope 3000 (Caliber I.D., Inc) can only view a small stack and does not have the ability to acquire a full mosaic image; it is not covered by these codes.
Images can be viewed as a stack captured at the same horizontal position but at sequential depths or as a mosaic, which has a larger field of view but is limited to a single plane. To appropriately assess a lesion, clinicians must obtain a mosaic that needs to be assessed at multiple layers for a diagnosis to be made because it is a cross-section view.
Diagnosis
Studies have demonstrated the usefulness of RCM imaging in the diagnosis of a wide range of skin diseases, including melanoma and nonmelanoma skin cancers, infectious diseases, and inflammatory and autoimmune conditions, as well as wound healing and skin aging. Reflectance confocal microscopy imaging is not limited to the skin; it can be used to evaluate the hair, nails, oral mucosa, and other organs.
According to several studies, RCM imaging notably increases the diagnostic accuracy and detection rate of skin cancers over clinical and dermoscopic examination alone and therefore can act as an aid in differentiating lesions that are benign versus those that are suspicious and should be biopsied.
Reflectance confocal microscopy has been shown to have a mean sensitivity of 94% (range, 92%–96%) and specificity of 83% (range, 81%–84%) for all types of skin cancer when used with dermoscopy.4 In particular, for melanocytic lesions that are ambiguous on dermoscopy, RCM used in addition to dermoscopy increases the mean sensitivity and specificity for melanoma diagnosis to 93% (range, 89%–96%) and 76% (range, 68%–83%), respectively.5 Although these reported sensitivities are comparable to dermoscopy, the specificity is superior, especially for detecting hypomelanotic and amelanotic melanomas, which often lack specific features on dermoscopy.6-8
The combination of RCM with dermoscopy has reduced the number of unnecessary excisions of benign nevi by more than 50% when compared to dermoscopy alone.9 One study showed that the number needed to treat (ie, excise) a melanoma decreased from 14.6 with dermoscopy alone to 6.8 when guided by dermoscopy and RCM imaging.9 In a similar study, the number needed to treat dropped from 19.41 with dermoscopy alone to 6.25 with dermoscopy and RCM.10
These studies were not looking to evaluate RCM as a replacement test but rather as an add-on test to dermoscopy. Reflectance confocal microscopy imaging takes longer than dermoscopy for each lesion; therefore, RCM should only be used as an adjunctive tool to dermoscopy and not as an initial screening test. Consequentially, a dermatologist skilled in dermoscopy is essential in deciding which lesions would be appropriate for subsequent RCM imaging.
In Vivo Margin Mapping as an Adjunct to Surgery
Oftentimes, tumor margins are poorly defined and can be difficult to map clinically and dermoscopically. Studies have demonstrated the use of RCM in delineation of surgical margins prior to surgery or excisional biopsies.11,12 Alternatively, when complete removal at biopsy would be impractical (eg, for extremely large lesions or lesions located in cosmetically sensitive areas such as the face), RCM can be used to pick the best site for an appropriate biopsy, which decreases the chance of sampling error due to skip lesions and increases histologic accuracy.
Nonsurgical Treatment Monitoring
One advantage of RCM over conventional histology is that RCM imaging leaves the tissue intact, allowing dynamic changes to be studied over time, which is useful for monitoring nonmelanoma skin cancers and lentigo maligna being treated with noninvasive therapeutic modalities.13 If not as a definitive treatment, RCM can act as an adjunct for surgery by monitoring reduction in lesion size prior to Mohs micrographic surgery, thereby decreasing the resulting surgical defect.14
Limitations
Imaging Depth
Although RCM is a revolutionary device in the field of dermatology, it has several limitations. With a maximal imaging depth of 350 µm, the imaging resolution decreases substantially with depth, limiting accurate interpretation to 200 µm. Reflectance confocal microscopy can only image the superficial portion of a lesion; therefore, deep tumor margins cannot be assessed. Hypertrophic or hyperkeratotic lesions, including lesions on the palms and soles, also are unable to be imaged with RCM. This limitation in depth penetration makes treatment monitoring impossible for invasive lesions that extend into the dermal layer.
Difficult-to-Reach Areas
Another limitation is the difficulty imaging areas such as the ocular canthi, nasal alae, or helices of the ear due to the wide probe size on the VivaScope 1500. The advent of the smaller handheld VivaScope 3000 device allows for improved imaging of concave services and difficult lesions at the risk of less accurate imaging, low field of view, and no reimbursement at present.
False-Positive Results
Although RCM has been shown to be helpful in reducing unnecessary biopsies, there still is the issue of false-positives on imaging. False-positives most commonly occur in nevi with severe atypia or when Langerhans cells are present that cannot always be differentiated from melanocytic cells.3,15,16 One prospective study found 7 false-positive results from 63 sites using RCM for the diagnosis of lentigo malignas.16 False-negatives can occur in the presence of inflammatory infiltrates and scar tissue that can hide cellular morphology or in sampling errors due to skip lesions.3,16
Time Efficiency
The time required for acquisition of RCM mosaics and stacks followed by reading and interpretation can be substantial depending on the size and complexity of the lesion, which is a major limitation for use of RCM in busy dermatology practices; therefore, RCM should be reserved for lesions selected to undergo biopsy that are clinically equivocal for malignancy prior to RCM examination.17 It would not be cost-effective or time effective to evaluate lesions that either clinically or dermoscopically have a high probability of malignancy; however, patients and physicians may opt for increased specificity at the expense of time, particularly when a lesion is located on a cosmetically sensitive area, as patients can avoid initial histologic biopsy and gain the cosmetic benefit of going straight to surgery versus obtaining an initial diagnostic biopsy.
Cost
Lastly, the high cost involved in purchasing an RCM device and the training involved to use and interpret RCM images currently limits RCM to large academic centers. Reimbursement may make more widespread use feasible. In any event, RCM imaging should be part of the curriculum for both dermatology and pathology trainees.
Future Directions
In vivo RCM is a noninvasive imaging modality that allows for real-time evaluation of the skin. Used in conjunction with dermoscopy, RCM can substantially improve diagnostic accuracy and reduce the number of unnecessary biopsies. Now that RCM has finally gained foundational CPT codes and insurance reimbursement, there may be a growing demand for clinicians to incorporate this technology into their clinical practice.
- Current Procedural Terminology 2017, Professional Edition. Chicago IL: American Medical Association; 2016.
- Que SK, Fraga-Braghiroli N, Grant-Kels JM, et al. Through the looking glass: basics and principles of reflectance confocal microscopy [published online June 4, 2015]. J Am Acad Dermatol. 2015;73:276-284.
- Rajadhyaksha M, Marghoob A, Rossi A, et al. Reflectance confocal microscopy of skin in vivo: from bench to bedside [published online October 27, 2016]. Lasers Surg Med. 2017;49:7-19.
- Xiong YD, Ma S, Li X, et al. A meta-analysis of reflectance confocal microscopy for the diagnosis of malignant skin tumours. J Eur Acad Dermatol Venereol. 2016;30:1295-1302.
- Stevenson AD, Mickan S, Mallett S, et al. Systematic review of diagnostic accuracy of reflectance confocal microscopy for melanoma diagnosis in patients with clinically equivocal skin lesions. Dermatol Pract Concept. 2013;3:19-27.
- Busam KJ, Hester K, Charles C, et al. Detection of clinically amelanotic malignant melanoma and assessment of its margins by in vivo confocal scanning laser microscopy. Arch Dermatol. 2001;137:923-929.
- Losi A, Longo C, Cesinaro AM, et al. Hyporeflective pagetoid cells: a new clue for amelanotic melanoma diagnosis by reflectance confocal microscopy. Br J Dermatol. 2014;171:48-54.
- Guitera P, Menzies SQ, Argenziano G, et al. Dermoscopy and in vivo confocal microscopy are complementary techniques for the diagnosis of difficult amelanotic and light-coloured skin lesions [published online October 12, 2016]. Br J Dermatol. 2016;175:1311-1319.
- Pellacani G, Pepe P, Casari A, et al. Reflectance confocal microscopy as a second-level examination in skin oncology improves diagnostic accuracy and saves unnecessary excisions: a longitudinal prospective study. Br J Dermatol. 2014;171:1044-1051.
- Pellacani G, Witkowski A, Cesinaro AM, et al. Cost-benefit of reflectance confocal microscopy in the diagnostic performance of melanoma. J Eur Acad Dermatol Venereol. 2016;30:413-419.
- Champin J, Perrot JL, Cinotti E, et al. In vivo reflectance confocal microscopy to optimize the spaghetti technique for defining surgical margins of lentigo maligna. Dermatol Surg. 2014;40:247-256.
- Hibler BP, Cordova M, Wong RJ, et al. Intraoperative real-time reflectance confocal microscopy for guiding surgical margins of lentigo maligna melanoma. Dermatol Surg. 2015;41:980-983.
- Ulrich M, Lange-Asschenfeldt S, Gonzalez S. The use of reflectance confocal microscopy for monitoring response to therapy of skin malignancies. Dermatol Pract Concept. 2012;2:202a10.
- Torres A, Niemeyer A, Berkes B, et al. 5% imiquimod cream and reflectance-mode confocal microscopy as adjunct modalities to Mohs micrographic surgery for treatment of basal cell carcinoma. Dermatol Surg. 2004;30(12, pt 1):1462-1469.
- Hashemi P, Pulitzer MP, Scope A, et al. Langerhans cells and melanocytes share similar morphologic features under in vivo reflectance confocal microscopy: a challenge for melanoma diagnosis. J Am Acad Dermatol. 2012;66:452-462.
- Menge TD, Hibler BP, Cordova MA, et al. Concordance of handheld reflectance confocal microscopy (RCM) with histopathology in the diagnosis of lentigo maligna (LM): a prospective study. J Am Acad Dermatol. 2016;74:1114-1120.
- Borsari S, Pampena R, Lallas A, et al. Clinical indications for use of reflectance confocal microscopy for skin cancer diagnosis. JAMA Dermatol. 2016;152:1093-1098.
Practice Points
- Reflectance confocal microscopy (RCM) recently received Category I Current Procedural Terminology codes for reimbursement comparable to a skin biopsy.
- When used in combination with dermoscopy, RCM has been shown to increase diagnostic accuracy of skin cancer.
- Reflectance confocal microscopy also is useful in surgical treatment planning and monitoring nonsurgical treatments over time.
- Limitations of RCM imaging include low imaging depth, difficulty in imaging certain areas of the skin, learning curve for interpreting these images, and the cost of equipment.

Mitigating Burnout - Part 3
It is easy to look at the changes required to mitigate burnout and improve compassionate care and see the burden being placed mainly on the physician. Many of the proposed modifications seem to require the one commodity surgeons lack most, time. Any widespread effort to mitigate the burnout crisis must involve decreasing the barriers to patient care and reducing the physicians’ time constraints.
This may seem daunting, but broad changes in our healthcare system have been implemented in the name of quality, reducing errors, and alleviating trainee fatigue. Burnout can be a similar force for change. Much like the resident’s 80-hour workweek, however, in what manner this change is applied will be the ultimate determinant of the movement’s success.
This series of articles dealt with the adverse consequences of surgeon burnout on both clinicians and their patients, and then presented a conceptual framework to promote workforce well-being. Strategies that the SVS might adopt have been suggested. The central proposal is that helping physicians to deliver compassionate, collaborative care will not only mitigate burnout but also will enhance provider engagement, patient experience, and clinical outcomes, as well as improve the quality and safety of healthcare delivery. It seems reasonable to question if such broad strategic proposals are scalable to individual clinical settings.
The characteristics of compassionate care have been well described by patients, and, not surprisingly, only 53% reported that their last encounter with the health care system was compassionate. In 2014, a multidisciplinary consortium published recommendations for advancing compassionate person- and family-centered care. They detailed the attributes, values, and behaviors of such care, including focusing one’s attention, recognizing nonverbal clues, active listening, demonstrating nonjudgmental interest in the whole person, understanding the context of a person’s disease, and asking about the patient’s chief concerns in addition to their chief complaints. Most significantly, the authors outlined how these attributes could be integrated into existing competency documents such as those provided by the Association of American Medical Colleges (AAMC) Entrustable Professional Activities, or the milestones programs of the Accreditation Council of Graduate Medical Education (ACGME) and the American Board of Internal Medicine (ABIM).
It is but a small step to enhance current criteria for certification, clinical appointment, and privileging by including these professional attributes. Bear in mind that these skills are teachable and easily incorporated into health professional education and clinical care. As for metrics, the Schwartz Compassionate Care Scale is a validated patient-rated questionnaire that reliably measures physicians’ compassion and overall patient satisfaction and is available in the public domain. It also provides a metric that is important to clinicians and, when placed on the hospital dashboard, highlights that compassion is an organizational priority. Such priorities become the fabric of the workforce when organizational leadership installs programs such as values-based recruitment, retention, and promotion as Vivian Lee describes at the University of Utah Health System. Mitigating burnout requires changing the culture in which clinicians work and with whom they work.
Vascular surgeons and their professional surgical societies have a leadership opportunity to design high performing teams. Most patient care models have been structured around traditional medical and surgical departments. This paradigm overlooks the fact that patients do not “get sick” within traditional teaching disciplines but do so across varied medical and surgical specialties. Changes in organizational hierarchy are needed so that team-based care is supported. In addition to physician and nurse clinicians, the new teams would do well to expand to all “caregivers,” i.e. everyone who touches the patient (technologists, interpreters, pharmacists, transport workers, support staff, and administrators).
On the front line
On April 15, 2013, at 2:49 pm, two homemade bombs detonated near the finish line of the Boston Marathon killing three people at the scene and injuring 264 others; the most severe sustaining mutilating lower extremity injuries. Much has been written about the preparedness, the emergency response, and the fact that all those who made it to the hospital survived. Jeffrey Kalish, MD, a vascular surgeon at Boston Medical Center and SVS member, was on the front line that day. We asked him to share his personal experience of caring for the victims through the lens of compassionate collaborative care.
“It has been over four years since I went from being a spectator near the Boston Marathon finish line to rushing directly to the operating rooms at Boston Medical Center to help our teams perform lifesaving procedures on critically ill patients, including amputations and complex vascular repairs. While I have learned a tremendous amount since that experience with regard to limb salvage and amputation, reconstructive techniques, and prosthetics, I will focus here on the care the patients and their families received, the lessons our hospital learned from the weeks and months that followed, and how we modeled this care going forward for all amputation patients at Boston Medical Center.
"Based on lessons from the Boston Marathon bombings, I aligned a multidisciplinary team of health care providers in order to formalize and standardize best practices to benefit our amputation patients. STRONG (Surgery To Rehab Ongoing Needs Group) continues to strive toward the ultimate goal of improving and coordinating care for amputation patients and their families as they transition from the hospital setting to rehabilitation. Some of our guiding principles, along with their positive impacts on patient care and physician well-being, are highlighted below:
1. Sustaining hope with a new mindset: Although surgeons have historically considered amputation as a treatment failure, a more appropriate mindset is that amputation can often be a reconstructive procedure in the surgical armamentarium designed to restore a patient back to full function.
2. Seeing the patient in context: Shared decision making can occur more readily once a surgeon and the care team seek to understand the whole person and their family, including what that person does for work and leisure.
3. Communication with colleagues, patients, and families: Patient and family fear and confusion can often be reduced after establishment of a multi-disciplinary team with daily care coordination and consistent messaging. Breaking down traditional hospital silos to allow for improved coordination of care benefits both the patients and the practitioners.
4. Managing emotional and physical suffering: Introducing social workers, mental health professionals, or pastoral care advocates into the care team as soon as a patient is ready can help manage the emotional and psychosocial needs of patients and their families.
5. Sustaining long term surgeon/patient relationships: As clinicians, we can feel rewarded after restoring functional performance in our patients and by meeting the needs of our patients and families. This can occur both in the short-term during the acute hospital stay and in the long-term as we follow our patients’ progress towards achievement of their ultimate goals.
6. Attend to one’s own well-being and foster resilience. There will never be a substitute in our profession for the human connection between our patients and ourselves as their caregivers, and this connection should be one of the most treasured aspects of our work life. We should seek daily reminders of these positive interactions to nurture our ability to cope with a grueling and challenging field, where the outcomes are not always as ideal as we hope.
For me, STRONG is now a consistent and powerful reminder of why I originally became a doctor in the first place, and I strive to propagate this model of compassionate care to benefit future patients as we move forward together.”
We are at an inflexion point in health care. No amount of individual resilience can withstand a toxic or nonsupportive environment. It is unreasonable to think that simply by taking better care of ourselves we are going to resolve the issue of burnout. We need to rethink our current systems of care and focus our energy on developing those that support our ability to deliver the kind of care we know our patients need and deserve. We have an opportunity to alleviate the suffering many providers are experiencing as they strive to heal their patients. We have an opportunity to improve both physician and patient engagement, develop care delivery systems we know our patients deserve, and restore the deep sense of satisfaction that comes from practicing medicine and surgery. There is abundant expertise within our professional medical and surgical societies. The SVS has the courage and the duty to lead.
Drs. Colman, Kalish, and Sheahan extend their thanks and appreciation for the guidance, resources and support of Michael Goldberg, M.D., Scholar in Residence, Schwartz Center for Compassionate Care, Boston, Mass., and Clinical Professor of Orthopedics at Seattle Children’s Hospital.
Bibliography
1. Acad Med (2016) 91:338-344
2. Health Aff (2011) 30:1772-1778
3. Patient Educ Couns (2015) 98:1005-10
4. Acad Med (2016) 91:310-316
5. http://www.theschwartzcenter.org/media/Triple-C-Conference-Framework-Tables_FINAL.pdf
6. http://www.theschwartzcenter.org/media/Triple-C-Conference-Recommendations-Report_FINAL1.pdf
7. JAMA (2017) 317: 901-2
8. Clin Orthop Relat Res. (2017) 475:1309-14.
Cutaneous laser surgery: Basic caution isn’t enough to prevent lawsuits
SAN DIEGO – Injuries and lawsuits related to laser cosmetic surgery are increasing and potential legal threats are not always easy to predict, according to two dermatologists who spoke at the annual meeting of the American Society for Laser Medicine and Surgery (ASLMS).
A laser procedure could go smoothly, for example, but the patient might be able to successfully sue if he or she is allowed to drive home after receiving a sedative. Or a physician might get sued because his or her nurse set a laser at the wrong setting and singed a patient.
The risk of a lawsuit is high, H. Ray Jalian, MD, a dermatologist in Los Angeles, said at the meeting. “The reality is that we’re all at some point going to face this.”

The most common procedure litigated was laser hair removal, making up almost 40% of the cases, which is not an indication that this particular procedure is dangerous, Dr. Jalian said. “It’s quite safe, and the complication rate is quite low,” but more of these procedures are being done, he noted. Rejuvenation procedures followed, accounting for 25% of cases.
The alleged injuries sustained from laser surgery included burns (47%), scars (39%), and pigmentation problems (24%). Deaths occurred in just over 2% of the cases. In the study, almost a third of plaintiffs alleged that they were not provided informed consent. Plaintiffs also alleged fraud (9%) and assault/battery (5%), and a family member occasionally sued for loss of consortium (8% of cases). The specialty with the largest percentage of the cases was plastic surgery (26%), followed by dermatology (21%).
Dr. Jalian and his copresenter, Mathew Avram, MD, JD, director of the Dermatology Laser & Cosmetic Center, and director of dermatologic surgery at Massachusetts General Hospital, Boston, offered these lessons about the legal risks associated with laser procedures:
• You may have a duty to protect your patient from bad choices.
Physicians aren’t expected to keep patients from making certain bad decisions such as sunbathing after a traditional resurfacing procedure, said Dr. Avram, of the department of dermatology, Harvard Medical School, Boston, and the ASLMS president. But in some cases, he said, the law may expect the physician to step in to prevent harm. For example, he said, a patient who has undergone a fractional ablative laser procedure and has received a sedative should not be allowed to drive home.
• You may get sued even if your employee is at fault.
The 2013 study found physicians were often sued even when they did not perform the laser procedure in question. Nonphysicians such as physician assistants and nurses often perform laser operations, and many states allow them to do so. “Nonphysicians were less likely to be sued even if they were the operators,” Dr. Jalian said. In the study, almost 38% of the 174 analyzed cases involved nonphysician operators, but they were sued in just 26% of the cases. In 33 of the 174 cases in the study, plaintiffs alleged failure to properly hire, train, or supervise staff.
He recommended looking at state laws, which differ greatly in their regulations – or lack of them – regarding the operation of medical lasers. In some cases, physicians must supervise laser use, he said. “But what are the requirements? Can you be available by phone down the street or in the Caribbean?”
Dr. Jalian, Dr. Avram, and a colleague followed up the 2013 study with another study that tracked 175 legal cases from 1999 to 2012 involving alleged injuries from cutaneous laser surgery. During this time period, 75 (43%) involved a nonphysician operating a laser, increasing from 36% in 2008 to 78% in 2012.
In almost two-thirds of cases, the procedures in question were done by nonphysicians outside a “traditional medical setting” such as a salon or spa (JAMA Dermatol. 2014 Apr;150[4]:407-11).
• Delayed side effects could mean delayed lawsuits.
According to Dr. Avram, statutes of limitations – the length of time in which a patient can file a lawsuit – typically last for 2-3 years in malpractice cases. But he said that the period begins when the physician is alleged to have made a mistake or when the patient becomes aware of – or should reasonably be aware of – an injury. Therefore, physicians could face legal trouble over delayed hypopigmentation that appears 6 months after a laser resurfacing treatment, or granulomas that appear years after a filler treatment, he said.
• A signed form is not a cure-all.
It is wise to make patients sign an extensive informed consent form, but this will not protect a physician against a claim of negligence, Dr. Avram said. And the reverse is also true: If a patient did not sign a proper consent form, he or she could still sue even if the procedure went perfectly, he noted.
• Your instincts are worth trusting.
When it comes to lawsuit prevention, Dr. Avram said, “by far the most important thing you can do happens within a minute of when you see the patient. Assess and trust your own intuition and your staff’s intuition. For elective, cosmetic treatments, don’t be afraid to say no. There’s no legal obligation to perform a cosmetic treatment on a patient.”
If you do choose to treat a patient, he advised, be open about the procedure and “maybe even tell them some of the tougher, worse-case scenarios.” If a procedure goes poorly, he said, consider how to fix it. “Many complications can be significantly improved or cleared with timely and appropriate intervention,” he said.
In some cases, refunding the patient’s money can be considered, with the patient signing a release, he said. “Document that you are refunding the money in order to preserve the doctor-patient relationship, not to avoid negligence.”
Dr. Jalian and Dr. Avram reported no relevant disclosures.
SAN DIEGO – Injuries and lawsuits related to laser cosmetic surgery are increasing and potential legal threats are not always easy to predict, according to two dermatologists who spoke at the annual meeting of the American Society for Laser Medicine and Surgery (ASLMS).
A laser procedure could go smoothly, for example, but the patient might be able to successfully sue if he or she is allowed to drive home after receiving a sedative. Or a physician might get sued because his or her nurse set a laser at the wrong setting and singed a patient.
The risk of a lawsuit is high, H. Ray Jalian, MD, a dermatologist in Los Angeles, said at the meeting. “The reality is that we’re all at some point going to face this.”
The most common procedure litigated was laser hair removal, making up almost 40% of the cases, which is not an indication that this particular procedure is dangerous, Dr. Jalian said. “It’s quite safe, and the complication rate is quite low,” but more of these procedures are being done, he noted. Rejuvenation procedures followed, accounting for 25% of cases.
The alleged injuries sustained from laser surgery included burns (47%), scars (39%), and pigmentation problems (24%). Deaths occurred in just over 2% of the cases. In the study, almost a third of plaintiffs alleged that they were not provided informed consent. Plaintiffs also alleged fraud (9%) and assault/battery (5%), and a family member occasionally sued for loss of consortium (8% of cases). The specialty with the largest percentage of the cases was plastic surgery (26%), followed by dermatology (21%).
Dr. Jalian and his copresenter, Mathew Avram, MD, JD, director of the Dermatology Laser & Cosmetic Center, and director of dermatologic surgery at Massachusetts General Hospital, Boston, offered these lessons about the legal risks associated with laser procedures:
• You may have a duty to protect your patient from bad choices.
Physicians aren’t expected to keep patients from making certain bad decisions such as sunbathing after a traditional resurfacing procedure, said Dr. Avram, of the department of dermatology, Harvard Medical School, Boston, and the ASLMS president. But in some cases, he said, the law may expect the physician to step in to prevent harm. For example, he said, a patient who has undergone a fractional ablative laser procedure and has received a sedative should not be allowed to drive home.
• You may get sued even if your employee is at fault.
The 2013 study found physicians were often sued even when they did not perform the laser procedure in question. Nonphysicians such as physician assistants and nurses often perform laser operations, and many states allow them to do so. “Nonphysicians were less likely to be sued even if they were the operators,” Dr. Jalian said. In the study, almost 38% of the 174 analyzed cases involved nonphysician operators, but they were sued in just 26% of the cases. In 33 of the 174 cases in the study, plaintiffs alleged failure to properly hire, train, or supervise staff.
He recommended looking at state laws, which differ greatly in their regulations – or lack of them – regarding the operation of medical lasers. In some cases, physicians must supervise laser use, he said. “But what are the requirements? Can you be available by phone down the street or in the Caribbean?”
Dr. Jalian, Dr. Avram, and a colleague followed up the 2013 study with another study that tracked 175 legal cases from 1999 to 2012 involving alleged injuries from cutaneous laser surgery. During this time period, 75 (43%) involved a nonphysician operating a laser, increasing from 36% in 2008 to 78% in 2012.
In almost two-thirds of cases, the procedures in question were done by nonphysicians outside a “traditional medical setting” such as a salon or spa (JAMA Dermatol. 2014 Apr;150[4]:407-11).
• Delayed side effects could mean delayed lawsuits.
According to Dr. Avram, statutes of limitations – the length of time in which a patient can file a lawsuit – typically last for 2-3 years in malpractice cases. But he said that the period begins when the physician is alleged to have made a mistake or when the patient becomes aware of – or should reasonably be aware of – an injury. Therefore, physicians could face legal trouble over delayed hypopigmentation that appears 6 months after a laser resurfacing treatment, or granulomas that appear years after a filler treatment, he said.
• A signed form is not a cure-all.
It is wise to make patients sign an extensive informed consent form, but this will not protect a physician against a claim of negligence, Dr. Avram said. And the reverse is also true: If a patient did not sign a proper consent form, he or she could still sue even if the procedure went perfectly, he noted.
• Your instincts are worth trusting.
When it comes to lawsuit prevention, Dr. Avram said, “by far the most important thing you can do happens within a minute of when you see the patient. Assess and trust your own intuition and your staff’s intuition. For elective, cosmetic treatments, don’t be afraid to say no. There’s no legal obligation to perform a cosmetic treatment on a patient.”
If you do choose to treat a patient, he advised, be open about the procedure and “maybe even tell them some of the tougher, worse-case scenarios.” If a procedure goes poorly, he said, consider how to fix it. “Many complications can be significantly improved or cleared with timely and appropriate intervention,” he said.
In some cases, refunding the patient’s money can be considered, with the patient signing a release, he said. “Document that you are refunding the money in order to preserve the doctor-patient relationship, not to avoid negligence.”
Dr. Jalian and Dr. Avram reported no relevant disclosures.
AT LASER 2017
Biomarker predicts prolonged depression in breast cancer patients
SAN FRANCISCO – Nearly 40% of breast cancer patients experience prolonged depression lasting for at least 16 months after diagnosis of their malignancy; those at increased risk may be identifiable in a timely way by their exaggerated cortisol awakening response when measured after surgery but before adjuvant therapy, according to Kate R. Kuhlman, PhD.
“There are several psychological interventions that mitigate depressive symptoms and psychologic distress in women with breast cancer. This time period immediately following cancer diagnosis and surgery may be the optimal time to intervene,” said Dr. Kuhlman, a psychologist at the University of California, Los Angeles.
She presented a prospective study of 135 women with breast cancer who collected saliva samples for analysis of hypothalamic-pituitary-adrenal axis functioning on 3 consecutive days after their primary surgery but prior to starting adjuvant therapy. Samples were obtained on each of the 3 days upon awakening, 30 minutes later, 8 hours later, and at bedtime. The women also completed the Center for Epidemiologic Studies Depression Scale (CES-D) then and again 6 months after completing their breast cancer treatment.
At baseline, 45 of the 135 women scored 16 points or higher out of a possible 60 on the 20-question CES-D, indicative of clinically significant depression. Hypothalamic-pituitary-adrenal axis functioning wasn’t associated with depressive symptoms at that time. Importantly, however, one measure of baseline HPA axis functioning – the cortisol awakening response – proved to be associated with an increase in depressive symptoms over time, Dr. Kuhlman reported.
In a multivariate analysis adjusted for age, breast cancer stage, type of surgery, and forms of adjuvant therapy, a 1-standard-deviation increase above the mean in baseline cortisol awakening response was associated with a 6-point increase in CES-D score at follow-up 6 months after completion of breast cancer therapy. This association was seen only in the 90 women without significant depressive symptoms at baseline. And that’s exactly the population where a predictive biologic marker for future depression is most needed, Dr. Kuhlman said at the annual conference of the Anxiety and Depression Association of America.
“The people at highest risk of depressive symptoms in the future are the ones who have the most symptoms now. They’re easy to identify. We have good reliable measures. But then there are also people at risk whom we would miss by using those measures because they don’t have high symptoms right now,” the psychologist explained.
She and her coinvestigators zeroed in on cortisol awakening response as a potential biomarker of increased future risk of depression because it reflects the adrenal gland’s sensitivity to adrenocorticotropic hormone and the gland’s ability to signal the pituitary to produce cortisol. This action is triggered when people go from sleep to awakening.
The next steps in this research are to confirm these novel findings and hunt for an alternative marker of adrenal sensitivity to adrenocorticotropic hormone that’s simpler than sending a waking saliva sample off to a laboratory.
This ongoing longitudinal study is funded by the National Cancer Institute. Dr. Kuhlman reported having no relevant financial conflicts.
AT ANXIETY AND DEPRESSION CONFERENCE 2017
Key clinical point:
Major finding: Nondepressed breast cancer patients whose saliva samples show an exaggerated cortisol awakening response when measured after surgery but before adjuvant therapy are at increased risk for developing prolonged depression as treatment progresses.
Data source: A prospective longitudinal study of 135 women with breast cancer.
Disclosures: This ongoing study is funded by the National Cancer Institute. The presenter reported having no relevant financial conflicts.
Muckle-Wells Syndrome in the Setting of Basal Cell Nevus Syndrome
Muckle-Wells syndrome (MWS) was first described in 1962 and is part of a broad category of hereditary periodic fever syndromes that include the autoinflammatory syndromes and the cryopyrin-associated periodic syndromes (CAPSs). Unlike autoimmune diseases, autoinflammatory syndromes are not associated with antigen-specific T-cell responses or high titers of autoantibodies but are related to disorders of the innate immune system. Basal cell nevus syndrome (BCNS), or Gorlin syndrome, is a rare genodermatosis inherited in an autosomal-dominant fashion that is characterized by a broad range of anomalies. Most notable is the early and strong predisposition to develop several to hundreds of basal cell carcinomas (BCCs). Classic clinical features of MWS and a thorough history and physical examination can assist in the diagnosis of this rare entity.
Case Report
A 35-year-old woman with a history of BCNS, which had been diagnosed at 24 years of age based on the presence of more than 2 BCCs and a family history of BCNS in her mother, presented with intermittent pruritic urticaria on the chest and back, episodic fevers, associated joint pain and swelling that worsened several hours after exercise, headache, conjunctivitis, blurred vision, and severe debilitating fatigue that had been present since childhood. The symptoms had progressively worsened with age and symptom-free intervals became shorter. She was diagnosed by her rheumatologist with biopsy-proven MWS and a positive NLRP3 (NLR family pyrin domain containing 3) gene mutation at 29 years of age. She was treated unsuccessfully with prednisone and antihistamines and entered a trial with anakinra. She showed improvement for 2 weeks but developed severe swelling and erythema at the injection sites at week 3, along with large leathery patches on the legs and difficulty ambulating.
The patient subsequently underwent excision of her BCCs and reported each site became erythematous, edematous, warm, and painful 6 hours after excision, which lasted for hours to days (Figures 1–3). After the first excision on the right forearm, she was seen in the emergency department, started on intravenous antibiotics and prednisone, and kept overnight in the hospital. She was discharged the following day and the edema in the right forearm subsided over several days. Bacterial culture and laboratory evaluation for infection were negative after the first excision on the right forearm. Because of the symptoms she experienced following this excision, she was referred to the plastic surgery department for excision followed by postoperative monitoring in the hospital. The patient continued to undergo excisions for BCCs and developed more severe symptoms including erythema, edema, warmth, and tenderness at the surrounding sites. Once again, the excision sites were cultured and laboratory work to rule out infection was ordered with a negative result. After several excisions and subsequent clinical findings, the patients’ symptoms were deemed consistent with MWS and not a result of infectious etiology. A diagnosis of MWS and BCNS with exacerbation of MWS with surgical procedures was made.

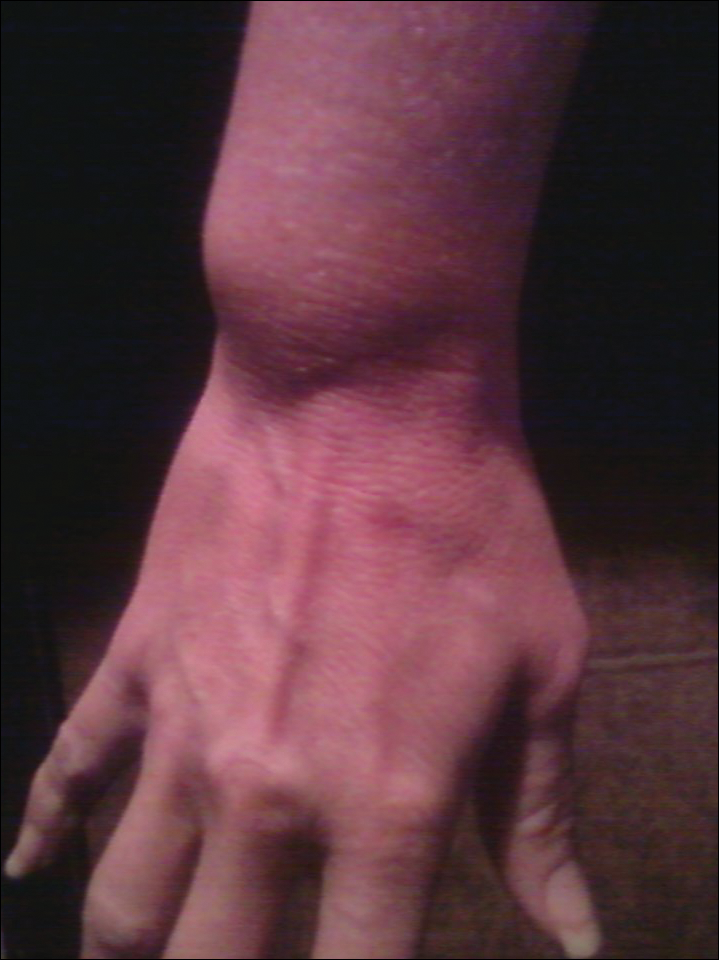
The patient has continued therapy with rilonacept for MWS, which is managed by her rheumatologist. She has tolerated rilonacept without adverse effects and has experienced a reduction in symptoms that has enhanced her quality of life and allows for further treatment of her BCNS. Her dermatologist (J.W.L.) has been treating her BCCs with vismodegib, but treatment has been sporadic due to muscle cramping after 7 days of therapy. She reported subjective improvement to her dermatologist and has tried alternating 7 days on and 7 days off vismodegib. The muscle cramping still has limited her treatment with this regimen, and she is currently on a trial of 3 days on, 4 days off per week.
Comment
Classification and Clinical Presentation
The hereditary periodic fever syndromes include the autoinflammatory syndromes and the CAPSs. The autoinflammatory syndromes include familial Mediterranean fever, hyperimmunoglobulinemia D with periodic fever syndrome, and tumor necrosis factor receptor–associated periodic syndrome. The CAPSs are similar but distinct and include familial cold autoinflammatory syndrome, neonatal-onset multisystem inflammatory disease (also known as chronic infantile neurologic cutaneous and articular syndrome, or cutaneous articular syndrome) and MWS.1,2
Cryopyrin-associated periodic syndromes are rare inherited diseases that result from mutations in the NLRP3 gene. There is a gain-of-function mutation on the NLRP3 gene located on the long arm of chromosome 1 at position 44, which codes for cryopyrin. An NLRP3 gene mutation causes cryopyrin to become hyperactive, leading to the formation of an inflammasome, which is a group of cryopyrin molecules. Inflammasomes, along with other proteins, activate caspase 1 to produce excess IL-1β, leading to persistent inflammatory symptoms.3 IL-1β is one of the key mediators of the body’s response to microbial invasion, inflammation, immunologic reactions, and tissue injury. It affects a large range of cells and organs. Although IL-1β production is critical for the control of pathogenic infections, excessive cytokine production is harmful to the host and can even be fatal.3,4
Cryopyrin-associated periodic syndromes encompass a disease continuum. The 3 distinct entities share many overlapping features as well as unique and distinguishing characteristics. Familial cold autoinflammatory syndrome is the mildest phenotype and is inherited in an autosomal-dominant fashion. It is characterized by a chronic urticarial eruption that starts early in infancy or childhood. The distribution of the cutaneous eruption is widespread and favors the arms and legs over the face and trunk. A low-grade fever often is seen along with musculoskeletal concerns of arthralgia and pain. Other commonly reported symptoms include conjunctivitis, myalgia, fatigue, and headache. Neurologic symptoms can include headaches. Symptoms usually begin 1 to 2 hours after cold exposure and last less than 24 hours.5-8
Neonatal-onset multisystem inflammatory disease is the most severe phenotype and occurs sporadically. Continuous symptoms and flares are characteristic and the length of the flare can vary from minutes to days. The cutaneous eruption favors the face, trunk, arms, and legs, and varies in intensity, beginning in infancy or childhood. Fever may be intermittent, mild, or absent. Rheumatologic manifestations include arthralgia and swelling, with approximately one-third of patients experiencing severe disabling arthropathy that causes gross joint deformity. Ocular findings include conjunctivitis, uveitis, papilledema, and even blindness. Neurologic sequelae include headaches, sensorineural hearing loss, and aseptic meningitis. Amyloidosis has been seen as a late complication.5,8
Muckle-Wells syndrome is a rare hereditary inflammatory disorder. It has no ethnic predisposition and is mostly inherited in an autosomal-dominant fashion. Classically, the condition is characterized by recurrent urticaria beginning at birth with intermittent episodic fever and malaise. The eruption has a predilection for the face, trunk, arms, and legs, which is similar to neonatal-onset multisystem inflammatory disease. Associated myalgia and arthralgia are common as well as ocular findings of conjunctivitis and episcleritis. Neurologic manifestations include headache and progressive sensorineural hearing loss in 60% to 70% of patients.6 Abdominal pain may be seen along with rare serositis in MWS but is rare in the other CAPSs. Amyloidosis caused by chronic inflammation is the most serious complication of MWS and is seen in approximately one-third of patients, manifesting as proteinuria followed by renal impairment. Symptoms of MWS may occur daily but vary individually, are broad in intensity and duration, and can last 1 to 2 days before resolving spontaneously. The symptoms can result from metabolic stressors including cold, stress, and exercise, as well as microbial pathogens. Leukocytosis and increased acute-phase reactants are observed during episodes of inflammation.4,6,8
Histopathology
Mild phenotypic variability exists between individuals, and many of the symptoms overlap in CAPSs. Although CAPSs display several distinguishing clinical characteristics, interestingly they share the same histopathological features regardless of the syndrome. The typical histopathological finding is a dermal neutrophilic infiltrate that tends to be perivascular and also may be perieccrine. Vasodilation and dermal edema also may be seen. These histopathological findings contrast with the typical lymphocytic and eosinophilic infiltrate seen in classic urticaria. Similar histopathologic findings have been seen in other neutrophilic urticarial dermatoses such as Schnitzler syndrome.4,6
Differential
The differential diagnoses for CAPSs include Schnitzler syndrome, cold urticaria, systemic-onset juvenile idiopathic arthritis/adult-onset Still disease, and deficiency in IL-1ra. It is important to consider these differential diagnoses for management and treatment options.
Management
The discovery of the NLRP3 gene mutation as well as an understanding of IL-1 biology has led to targeted therapy for these syndromes. Cryopyrin-associated periodic syndromes are mediated by IL-1β with an in vivo rate 5 times higher than in healthy patients.4 The blockade of IL-1β results in complete resolution of symptoms.
In the last several years, anakinra, rilonacept, and canakinumab have shown efficacy in targeting IL-1β as receptor antagonists. Anakinra is a short-acting recombinant IL-1ra with a half-life of 4 to 6 hours. This short half-life requires daily injections and the most common adverse events included injection-site reaction and upper respiratory tract infection.2,4 Rilonacept is a dimeric fusion protein that contains binding regions for the type 1 receptor and the IL-1 receptor accessory protein and is fused to the fragment, crystallizable (Fc) portion of human IgG1. Rilonacept is long acting with a circulating half-life of 8.6 days and offers patients ease of dosing with weekly subcutaneous injections. Rilonacept generally is well tolerated, with the most frequent adverse effects being injection-site reaction, upper respiratory tract infection, headache, arthralgia, and diarrhea.2,7
The newest of the treatments for patients with CAPS is canakinumab. It is a fully human IL-1β monoclonal antibody that is specific for IL-1β and not other members of the IL-1 family. It has a mean half-life of 26 days and is dosed subcutaneously once every 8 weeks. The most common adverse effects include nasopharyngitis, rhinitis, nausea, diarrhea, and vertigo.4 In one study, most patients did not report injection-site reactions.7 Studies also are underway on VX-765, a caspace-1 targeted therapy that acts upstream in the IL-1β pathway. Treatment with anakinra, rilonacept, and canakinumab generally offers rapid and sustained remission in the majority of MWS patients and helps prevent the development of systemic amyloidosis and lessens the potential for end organ damage.2,7
MWS and BCNS
Our patient had an unusual presentation of MWS complicated by BCNS, another rare autosomal-dominant inherited genodermatosis. In an extensive review of PubMed articles indexed for MEDLINE using the search terms Muckle-Wells syndrome and basal cell nevus syndrome, no association was identified between MWS and BCNS. Basal cell nevus syndrome is linked to PTCH1 (patched 1) gene mutation with an incidence of 1:150,000 in the United States and Europe and is characterized by a broad range of anomalies including skeletal abnormalities, ectopic calcification, odontogenic keratocysts, facial dysmorphism with macrocephaly, palmoplantar pits, and numerous tumors. Most notable is the early and strong predisposition to develop several to hundreds of BCCs.9
Conclusion
Muckle-Wells syndrome may go undiagnosed for many years or may be misdiagnosed as refractory urticaria, as in our patient. It is important to include periodic fever syndromes in the differential diagnosis of refractory urticaria with episodic fever to diagnose these cases of MWS earlier.
- Kagami S, Saeki H, Kuwano Y, et al. A probable case of Muckle-Wells syndrome. J Dermatol. 2006;2:118-121.
- Kanazawa N, Furukawa F. Autoinflammatory syndromes with a dermatological perspective. J Dermatol. 2007;34:601-618.
- Martinon F, Tschopp J. Inflammatory caspases: linking an intracellular innate immune system to autoinflammatory diseases. Cell. 2004;117:561-574.
- Mueller SM, Itin P, Haeusermann P. Muckle-Wells syndrome effectively treated with canakinumab: is the recommended dosing schedule mandatory? Dermatology. 2011;223:113-118.
- Neven B, Prieur A, Quartier dit Maire P. Cryopyrinopathies: update on pathogenesis and treatment. Nat Clin Pract Rheumatol. 2008;4:481-489.
- Newell L, August S, Foria V, et al. Lifelong urticaria and multiple unexplained systemic symptoms. Clin Exp Dermatol. 2011;36:431-433.
- Yu JR, Kieron KS. Cryopyrin-associated periodic syndrome: an update on diagnosis and treatment response. Curr Allergy Asthma Rep. 2011;11:12-20.
- Bolognia JL, Jorizzo JL, Rapini RP, et al, eds. Dermatology. 2nd ed. Barcelona, Spain: Mosby Elsevier; 2008. 9. Göppner D, Leverkus M. Basal cell carcinoma: from the molecular understanding of the pathogenesis to targeted therapy of progressive disease. J Skin Cancer. 2011;2011:650258.
Muckle-Wells syndrome (MWS) was first described in 1962 and is part of a broad category of hereditary periodic fever syndromes that include the autoinflammatory syndromes and the cryopyrin-associated periodic syndromes (CAPSs). Unlike autoimmune diseases, autoinflammatory syndromes are not associated with antigen-specific T-cell responses or high titers of autoantibodies but are related to disorders of the innate immune system. Basal cell nevus syndrome (BCNS), or Gorlin syndrome, is a rare genodermatosis inherited in an autosomal-dominant fashion that is characterized by a broad range of anomalies. Most notable is the early and strong predisposition to develop several to hundreds of basal cell carcinomas (BCCs). Classic clinical features of MWS and a thorough history and physical examination can assist in the diagnosis of this rare entity.
Case Report
A 35-year-old woman with a history of BCNS, which had been diagnosed at 24 years of age based on the presence of more than 2 BCCs and a family history of BCNS in her mother, presented with intermittent pruritic urticaria on the chest and back, episodic fevers, associated joint pain and swelling that worsened several hours after exercise, headache, conjunctivitis, blurred vision, and severe debilitating fatigue that had been present since childhood. The symptoms had progressively worsened with age and symptom-free intervals became shorter. She was diagnosed by her rheumatologist with biopsy-proven MWS and a positive NLRP3 (NLR family pyrin domain containing 3) gene mutation at 29 years of age. She was treated unsuccessfully with prednisone and antihistamines and entered a trial with anakinra. She showed improvement for 2 weeks but developed severe swelling and erythema at the injection sites at week 3, along with large leathery patches on the legs and difficulty ambulating.
The patient subsequently underwent excision of her BCCs and reported each site became erythematous, edematous, warm, and painful 6 hours after excision, which lasted for hours to days (Figures 1–3). After the first excision on the right forearm, she was seen in the emergency department, started on intravenous antibiotics and prednisone, and kept overnight in the hospital. She was discharged the following day and the edema in the right forearm subsided over several days. Bacterial culture and laboratory evaluation for infection were negative after the first excision on the right forearm. Because of the symptoms she experienced following this excision, she was referred to the plastic surgery department for excision followed by postoperative monitoring in the hospital. The patient continued to undergo excisions for BCCs and developed more severe symptoms including erythema, edema, warmth, and tenderness at the surrounding sites. Once again, the excision sites were cultured and laboratory work to rule out infection was ordered with a negative result. After several excisions and subsequent clinical findings, the patients’ symptoms were deemed consistent with MWS and not a result of infectious etiology. A diagnosis of MWS and BCNS with exacerbation of MWS with surgical procedures was made.
The patient has continued therapy with rilonacept for MWS, which is managed by her rheumatologist. She has tolerated rilonacept without adverse effects and has experienced a reduction in symptoms that has enhanced her quality of life and allows for further treatment of her BCNS. Her dermatologist (J.W.L.) has been treating her BCCs with vismodegib, but treatment has been sporadic due to muscle cramping after 7 days of therapy. She reported subjective improvement to her dermatologist and has tried alternating 7 days on and 7 days off vismodegib. The muscle cramping still has limited her treatment with this regimen, and she is currently on a trial of 3 days on, 4 days off per week.
Comment
Classification and Clinical Presentation
The hereditary periodic fever syndromes include the autoinflammatory syndromes and the CAPSs. The autoinflammatory syndromes include familial Mediterranean fever, hyperimmunoglobulinemia D with periodic fever syndrome, and tumor necrosis factor receptor–associated periodic syndrome. The CAPSs are similar but distinct and include familial cold autoinflammatory syndrome, neonatal-onset multisystem inflammatory disease (also known as chronic infantile neurologic cutaneous and articular syndrome, or cutaneous articular syndrome) and MWS.1,2
Cryopyrin-associated periodic syndromes are rare inherited diseases that result from mutations in the NLRP3 gene. There is a gain-of-function mutation on the NLRP3 gene located on the long arm of chromosome 1 at position 44, which codes for cryopyrin. An NLRP3 gene mutation causes cryopyrin to become hyperactive, leading to the formation of an inflammasome, which is a group of cryopyrin molecules. Inflammasomes, along with other proteins, activate caspase 1 to produce excess IL-1β, leading to persistent inflammatory symptoms.3 IL-1β is one of the key mediators of the body’s response to microbial invasion, inflammation, immunologic reactions, and tissue injury. It affects a large range of cells and organs. Although IL-1β production is critical for the control of pathogenic infections, excessive cytokine production is harmful to the host and can even be fatal.3,4
Cryopyrin-associated periodic syndromes encompass a disease continuum. The 3 distinct entities share many overlapping features as well as unique and distinguishing characteristics. Familial cold autoinflammatory syndrome is the mildest phenotype and is inherited in an autosomal-dominant fashion. It is characterized by a chronic urticarial eruption that starts early in infancy or childhood. The distribution of the cutaneous eruption is widespread and favors the arms and legs over the face and trunk. A low-grade fever often is seen along with musculoskeletal concerns of arthralgia and pain. Other commonly reported symptoms include conjunctivitis, myalgia, fatigue, and headache. Neurologic symptoms can include headaches. Symptoms usually begin 1 to 2 hours after cold exposure and last less than 24 hours.5-8
Neonatal-onset multisystem inflammatory disease is the most severe phenotype and occurs sporadically. Continuous symptoms and flares are characteristic and the length of the flare can vary from minutes to days. The cutaneous eruption favors the face, trunk, arms, and legs, and varies in intensity, beginning in infancy or childhood. Fever may be intermittent, mild, or absent. Rheumatologic manifestations include arthralgia and swelling, with approximately one-third of patients experiencing severe disabling arthropathy that causes gross joint deformity. Ocular findings include conjunctivitis, uveitis, papilledema, and even blindness. Neurologic sequelae include headaches, sensorineural hearing loss, and aseptic meningitis. Amyloidosis has been seen as a late complication.5,8
Muckle-Wells syndrome is a rare hereditary inflammatory disorder. It has no ethnic predisposition and is mostly inherited in an autosomal-dominant fashion. Classically, the condition is characterized by recurrent urticaria beginning at birth with intermittent episodic fever and malaise. The eruption has a predilection for the face, trunk, arms, and legs, which is similar to neonatal-onset multisystem inflammatory disease. Associated myalgia and arthralgia are common as well as ocular findings of conjunctivitis and episcleritis. Neurologic manifestations include headache and progressive sensorineural hearing loss in 60% to 70% of patients.6 Abdominal pain may be seen along with rare serositis in MWS but is rare in the other CAPSs. Amyloidosis caused by chronic inflammation is the most serious complication of MWS and is seen in approximately one-third of patients, manifesting as proteinuria followed by renal impairment. Symptoms of MWS may occur daily but vary individually, are broad in intensity and duration, and can last 1 to 2 days before resolving spontaneously. The symptoms can result from metabolic stressors including cold, stress, and exercise, as well as microbial pathogens. Leukocytosis and increased acute-phase reactants are observed during episodes of inflammation.4,6,8
Histopathology
Mild phenotypic variability exists between individuals, and many of the symptoms overlap in CAPSs. Although CAPSs display several distinguishing clinical characteristics, interestingly they share the same histopathological features regardless of the syndrome. The typical histopathological finding is a dermal neutrophilic infiltrate that tends to be perivascular and also may be perieccrine. Vasodilation and dermal edema also may be seen. These histopathological findings contrast with the typical lymphocytic and eosinophilic infiltrate seen in classic urticaria. Similar histopathologic findings have been seen in other neutrophilic urticarial dermatoses such as Schnitzler syndrome.4,6
Differential
The differential diagnoses for CAPSs include Schnitzler syndrome, cold urticaria, systemic-onset juvenile idiopathic arthritis/adult-onset Still disease, and deficiency in IL-1ra. It is important to consider these differential diagnoses for management and treatment options.
Management
The discovery of the NLRP3 gene mutation as well as an understanding of IL-1 biology has led to targeted therapy for these syndromes. Cryopyrin-associated periodic syndromes are mediated by IL-1β with an in vivo rate 5 times higher than in healthy patients.4 The blockade of IL-1β results in complete resolution of symptoms.
In the last several years, anakinra, rilonacept, and canakinumab have shown efficacy in targeting IL-1β as receptor antagonists. Anakinra is a short-acting recombinant IL-1ra with a half-life of 4 to 6 hours. This short half-life requires daily injections and the most common adverse events included injection-site reaction and upper respiratory tract infection.2,4 Rilonacept is a dimeric fusion protein that contains binding regions for the type 1 receptor and the IL-1 receptor accessory protein and is fused to the fragment, crystallizable (Fc) portion of human IgG1. Rilonacept is long acting with a circulating half-life of 8.6 days and offers patients ease of dosing with weekly subcutaneous injections. Rilonacept generally is well tolerated, with the most frequent adverse effects being injection-site reaction, upper respiratory tract infection, headache, arthralgia, and diarrhea.2,7
The newest of the treatments for patients with CAPS is canakinumab. It is a fully human IL-1β monoclonal antibody that is specific for IL-1β and not other members of the IL-1 family. It has a mean half-life of 26 days and is dosed subcutaneously once every 8 weeks. The most common adverse effects include nasopharyngitis, rhinitis, nausea, diarrhea, and vertigo.4 In one study, most patients did not report injection-site reactions.7 Studies also are underway on VX-765, a caspace-1 targeted therapy that acts upstream in the IL-1β pathway. Treatment with anakinra, rilonacept, and canakinumab generally offers rapid and sustained remission in the majority of MWS patients and helps prevent the development of systemic amyloidosis and lessens the potential for end organ damage.2,7
MWS and BCNS
Our patient had an unusual presentation of MWS complicated by BCNS, another rare autosomal-dominant inherited genodermatosis. In an extensive review of PubMed articles indexed for MEDLINE using the search terms Muckle-Wells syndrome and basal cell nevus syndrome, no association was identified between MWS and BCNS. Basal cell nevus syndrome is linked to PTCH1 (patched 1) gene mutation with an incidence of 1:150,000 in the United States and Europe and is characterized by a broad range of anomalies including skeletal abnormalities, ectopic calcification, odontogenic keratocysts, facial dysmorphism with macrocephaly, palmoplantar pits, and numerous tumors. Most notable is the early and strong predisposition to develop several to hundreds of BCCs.9
Conclusion
Muckle-Wells syndrome may go undiagnosed for many years or may be misdiagnosed as refractory urticaria, as in our patient. It is important to include periodic fever syndromes in the differential diagnosis of refractory urticaria with episodic fever to diagnose these cases of MWS earlier.
- Kagami S, Saeki H, Kuwano Y, et al. A probable case of Muckle-Wells syndrome. J Dermatol. 2006;2:118-121.
- Kanazawa N, Furukawa F. Autoinflammatory syndromes with a dermatological perspective. J Dermatol. 2007;34:601-618.
- Martinon F, Tschopp J. Inflammatory caspases: linking an intracellular innate immune system to autoinflammatory diseases. Cell. 2004;117:561-574.
- Mueller SM, Itin P, Haeusermann P. Muckle-Wells syndrome effectively treated with canakinumab: is the recommended dosing schedule mandatory? Dermatology. 2011;223:113-118.
- Neven B, Prieur A, Quartier dit Maire P. Cryopyrinopathies: update on pathogenesis and treatment. Nat Clin Pract Rheumatol. 2008;4:481-489.
- Newell L, August S, Foria V, et al. Lifelong urticaria and multiple unexplained systemic symptoms. Clin Exp Dermatol. 2011;36:431-433.
- Yu JR, Kieron KS. Cryopyrin-associated periodic syndrome: an update on diagnosis and treatment response. Curr Allergy Asthma Rep. 2011;11:12-20.
- Bolognia JL, Jorizzo JL, Rapini RP, et al, eds. Dermatology. 2nd ed. Barcelona, Spain: Mosby Elsevier; 2008. 9. Göppner D, Leverkus M. Basal cell carcinoma: from the molecular understanding of the pathogenesis to targeted therapy of progressive disease. J Skin Cancer. 2011;2011:650258.
Practice Points
- An urticarial rash occurring in childhood with symptoms of fever, joint pain, and swelling along with visual symptoms should prompt consideration of a cryopyrin-associated periodic syndrome.
- Histopathology shows a dermal neutrophilic infiltrate that tends to be perivascular and also may be perieccrine. This atypical urticaria contrasts with the typical lymphocytic and eosinophilic infiltrate seen in classic urticaria.
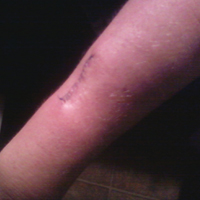
Magnification for the Dermatologic Surgeon
Dermatologic surgeons are susceptible to work-related ailments given the nature of their working posture, the most common of which are pain and stiffness in the neck, shoulders, and lower back, as well as headaches.1,2 Awkward posture and positioning, for the sake of getting a better view of the task at hand, puts the surgeon in ergonomically disagreeable positions. Because the prime working years for a dermatologic surgeon tend to coincide with the age of presbyopia onset, magnification may help reduce and thwart musculoskeletal problems and eye strain. Indeed, a multitude of surgical specialties and dentists use intraoperative magnification.3 Knowledge and use of available magnification options can be a key addition to the dermatologic surgeon’s armamentarium. We discuss the need for magnification and review magnification devices that are readily available to the dermatologic surgeon. Table 1 presents a summary of all magnification options discussed.
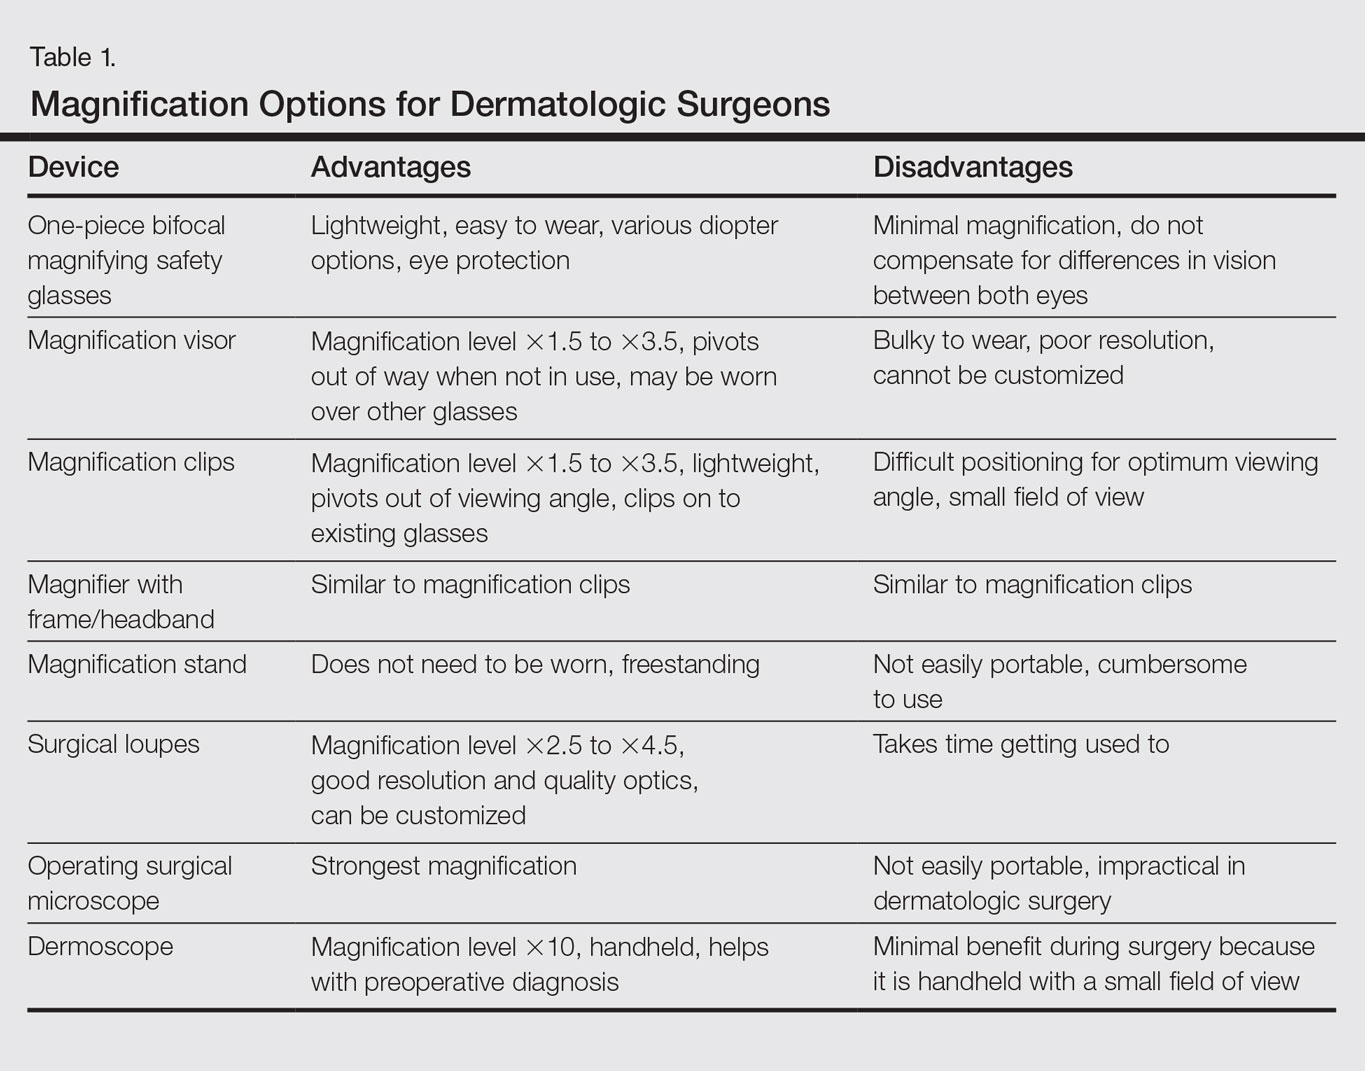
Need for Magnification
Presbyopia is a condition of aging in which one loses the ability to accommodate and focus at near distances. The estimated prevalence of presbyopia in North America is 83%, typically with onset by 45 years of age.4 Individuals with presbyopia often hold objects farther away from their eyes to bring them into focus, causing eye strain, headaches, and musculoskeletal injury.
Use of intraoperative magnification allows for enhanced visualization of fine anatomic details and precise suture placement for the surgeon with or without presbyopia. Higher magnification produces a larger image; however, it also reduces field of view and depth of field (ie, the amount of depth that stays in focus without repositioning). The resolution and quality of the image are dependent on the optical properties of the lens system. The ideal optic system is surgeon dependent and involves a combination of magnification level that will not result in dramatic loss of view and depth of field, while maintaining crispness and quality of image.
Intraoperative magnification yields ergonomic benefits by promoting a safer neck flexion angle by increasing the working distance to a more ideal position (Figure). In doing so, it improves posture and minimizes eye and musculoskeletal strain secondary to awkward positioning and presbyopia.1,5 Stationary working position and neck flexion and rotation with precise and repetitive tasks are risk factors for strain and injuries that dermatologic surgeons often encounter.1 Magnification devices are tools that the dermatologic surgeon can utilize for a more ergonomically sound practice. Indeed, magnification has been shown to improve posture in the dental literature, a specialty with similar occupational risk factors to dermatologic surgery.6-8 Ergonomic practice reduces occupational injuries and improves work quality and productivity, thereby having a favorable effect on both the patient and the physician.
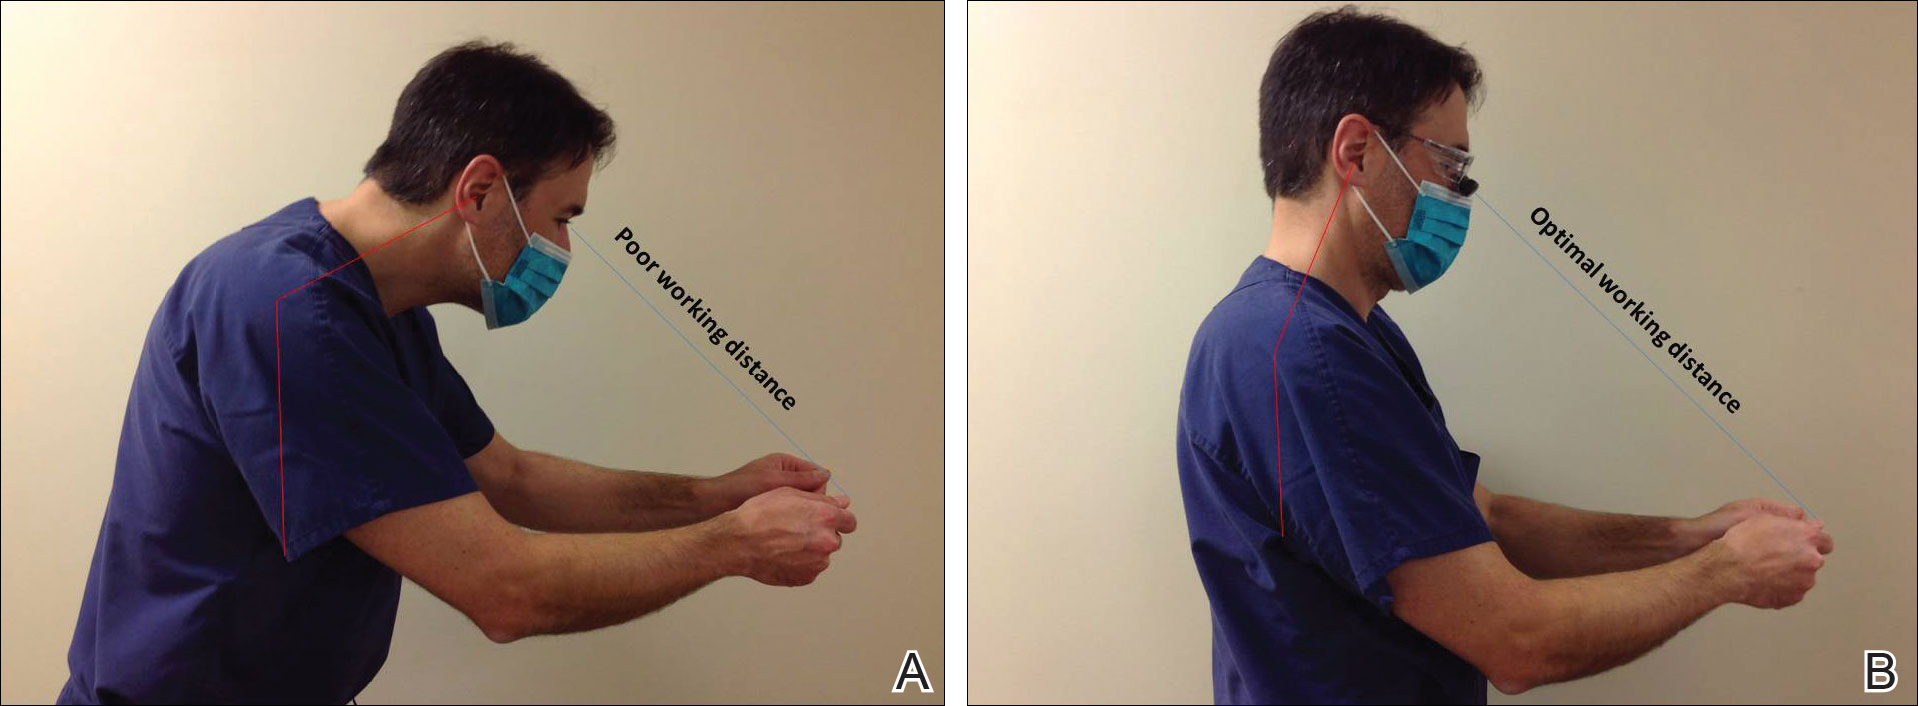
Improved Outcomes With Magnification
There are many examples of improved surgical quality and outcomes with magnification in other specialties. Hart and Hall5 illustrated the advantage of magnification in laceration repairs in the emergency department. In one study, increased magnification resulted in a substantial decrease in positive surgical margin rates in open radical retropubic prostatectomy.9 Schoeffl et al10 demonstrated that the microsurgical success of fine surgical procedures was directly related to optical magnification strength when comparing the unaided eye, surgical loupes, and the operating microscope. The dental literature also has numerous examples of magnification producing improved quality dentistry.11-13 Although magnification is not a novel concept to dermatologic surgery, little has been written about its use in the dermatologic surgery literature.
Magnification Options
One-Piece Bifocal Magnifying Safety Glasses
Bifocal magnifying safety glasses are polycarbonate safety glasses made with lenses in which the lower half is a magnifying lens. They are available in +1.5, +2.0, +2.5, and +3.0 diopter strengths. The total magnification power is calculated as follows: (diopter/4) + 1. The glasses are lightweight, easy to wear, inexpensive, and protect the eyes; however, they provide minimal magnification and do not compensate for differences in vision between both eyes.
Magnification Visor
The magnification visor is a headband visor with magnification lenses. It comes in various levels of magnification ranging from ×1.5 to ×3.5. It can be worn over prescription or safety glasses, may be pivoted out of the way when not in use, and is inexpensive. Conversely, it may be bulky to wear, cannot be customized, and does not offer the best resolution.
Magnification Clips
Magnification clips are hard-coated magnifying lens plates that fasten to eyeglass frames and range in level of magnification from ×1.5 to ×3.5. They can be pivoted out of the viewing angle, are lightweight, and are inexpensive; however, positioning may be difficult for ideal working distance and viewing angle.
Magnifier With Frame/Headband
The magnifier with frame is similar to magnification clips, but the magnification lens plate comes with a frame. It can be used with or without glasses and comes in magnification levels of ×1.5 to ×3.5. It is light, inexpensive, and may be pivoted out of sight, but similar to magnification clips, positioning for the right viewing angle and working distance may be difficult.
The magnifier with headband is essentially the same as the magnifier with frame. The only difference is the magnification plate is attached to a headband as opposed to a frame. It has similar benefits and limitations as the magnifier with frame.
Magnification Stand
The magnification stand comes as a large magnification lens with a flexible arm attached to a stand. It is a basic magnification tool and does not need to be worn; however, the stand is not easily portable and may be cumbersome to use.
Surgical Loupes
Surgical loupes are a robust magnification choice and the mainstay in magnification for the dermatologic surgeon. Loupes have proven to have comparable results in some procedures to the powerful operating surgical microscope.14-17 Factors to consider with loupes include brand, design, lens, magnification, resolution, optimal working distance, field depth, and declination angle.18
The 2 surgical loupe designs—flip-up loupes and through-the-lens loupes—differ in the mounting of the optic lenses on safety glasses. Flip-up loupes have the optics mounted to the bridge of the frame, whereas through-the-lens loupes are fixed in the lenses.
There are 3 different optical systems for surgical loupe magnification: simple, compound, and prismatic. Simple lenses consist of one pair of positive meniscus lenses similar to reading glasses. Compound lenses are made of 2 magnification lenses. Prismatic lenses magnify using a prism that folds and lengthens the light path.19,20
Loupes range in magnification level from ×2.5 to ×4.5. Compared to other magnification modalities, they can be customized and offer better resolution with quality magnification. Additionally, loupes can be fitted with a light source; however, they are expensive and surgeons need time to get used to the increased magnification as well as wearing the loupes.
There are advantages and disadvantages to the different loupe designs (Table 2). Flip-up loupes are more versatile, allowing for use on various safety glasses. They can be flipped out of view, and the declination angle may be altered; however, flip-up loupes have a narrower field of view and are heavier and bulkier than through-the-lens loupes. Through-the-lens loupes are lighter and have a larger field of view, as the optics are closer to the eye. They are customized to the declination angle and working distance of the surgeon. Conversely, through-the-lens loupes are more expensive and cannot be adjusted or moved from the line of vision.
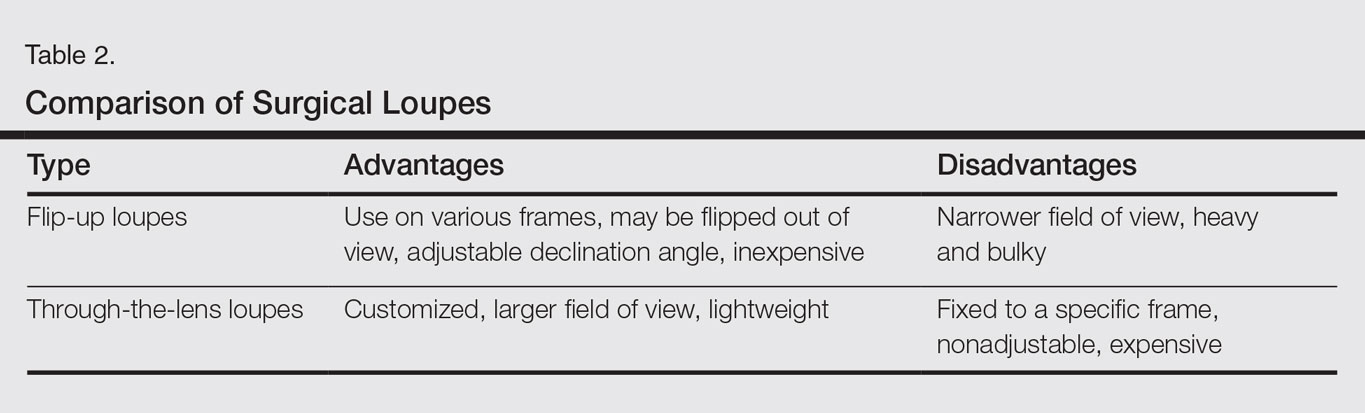
Operating Surgical Microscope
The operating surgical microscope is not practical in the dermatologic surgeon’s practice. It is expensive and provides unnecessarily powerful magnification for dermatologic surgery. This tool usually is used in the operating room for suturing nerves and vessels with sutures sized 8-0 and smaller. Most skin procedures require size 6-0 and larger sutures.
Dermoscope
Dermoscopy, also known as epiluminescence microscopy, is a technique utilizing a handheld device made up of polarized light and a ×10 magnifying lens to evaluate skin lesions. In skilled hands, dermoscopy allows for the examination of characteristic patterns and morphologic features of skin lesions to enhance the clinician’s diagnostic accuracy.21 It may aid the dermatologic surgeon in identifying the surgical margins of difficult-to-define skin cancers. It is small and mobile; however, it has minimal benefit to the dermatologic surgeon during surgery because it is handheld and has a small field of view.
Conclusion
Good ergonomic practices facilitate a healthier and prolonged career for the dermatologic surgeon. When used properly, magnification devices can be a beneficial adjunct to the dermatologic surgeon by promoting better posture, preventing eyestrain, and providing enhanced visualization of the operating field and instruments. Use of magnification devices has been demonstrated to improve patient outcomes in other specialties. There are opportunities for further research specific to magnification improving dermatologic surgery outcomes given the high level of precision and accuracy needed for Mohs micrographic surgery, wound reconstruction, nail surgery, and hair transplantation.
- Liang CA, Levine VJ, Dusza SW, et al. Musculoskeletal disorders and ergonomics in dermatologic surgery: a survey of Mohs surgeons in 2010. Dermatol Surg. 2012;38:240-248.
- Esser AC, Koshy JG, Randle HW. Ergonomics in office-based surgery: a survey-guided observational study. Dermatol Surg. 2007;33:1304-1313; discussion, 1313-1314.
- Jarrett PM. Intraoperative magnification: who uses it? Microsurgery. 2004;24:420-422.
- Holden BA, Fricke TR, Ho SM, et al. Global vision impairment due to uncorrected presbyopia. Arch Ophthalmol. 2008;126:1731-1739.
- Hart RG, Hall J. The value of loupe magnification: an underused tool in emergency medicine. Am J Emerg Med. 2007;25:704-707.
- Branson BG, Bray KK, Gadbury-Amyot C, et al. Effect of magnification lenses on student operator posture. J Dent Educ. 2004;68:384-389.
- Maillet JP, Millar AM, Burke JM, et al. Effect of magnification loupes on dental hygiene student posture. J Dent Educ. 2008;72:33-44.
- Branson BG, Black MA, Simmer-Beck M. Changes in posture: a case study of a dental hygienist’s use of magnification loupes. Work. 2010;35:467-476.
- Magera JS Jr, Inman BA, Slezak JM, et al. Increased optical magnification from 2.5× to 4.3× with technical modification lowers the positive margin rate in open radical retropubic prostatectomy [published online November 13, 2007].J Urol. 2008;179:130-135.
- Schoeffl H, Lazzeri D, Schnelzer R, et al. Optical magnification should be mandatory for microsurgery: scientific basis and clinical data contributing to quality assurance. Arch Plast Surg. 2013;40:104-108.
- Taschieri S, Del Fabbro M, Testori T, et al. Endodontic surgery using 2 different magnification devices: preliminary results of a randomized controlled study. J Oral Maxillofac Surg. 2006;64:235-242.
- Christensen GJ. Magnification in dentistry: useful tool or another gimmick? J Am Dent Assoc. 2003;134:1647-1650.
- Syme SE, Fried JL, Strassler HE. Enhanced visualization using magnification systems. J Dent Hyg. 1997;71:202-206.
- Pieptu D, Luchian S. Loupes-only microsurgery. Microsurgery. 2003;23:181-188.
- Shenaq SM, Klebuc MJ, Vargo D. Free-tissue transfer with the aid of loupe magnification: experience with 251 procedures. Plast Reconstr Surg. 1995;95:261-269.
- Serletti JM, Deuber MA, Guidera PM, et al. Comparison of the operating microscope and loupes for free microvascular tissue transfer. Plast Reconstr Surg. 1995;95:270-276.
- Ross DA, Ariyan S, Restifo R, et al. Use of the operating microscope and loupes for head and neck free microvascular tissue transfer: a retrospective comparison. Arch Otolaryngol Head Neck Surg. 2003;129:189-193.
- Mungadi IA. Refinement on surgical technique: role of magnification. J Surg Tech Case Rep. 2010;2:1-2.
- Stanbury SJ, Elfar J. The use of surgical loupes in microsurgery. J Hand Surg Am. 2011;36:154-156.
- Baker JM, Meals RA. A practical guide to surgical loupes. J Hand Surg Am. 1997;22:967-974.
- Campos-do-Carmo G, Ramos-e-Silva M. Dermoscopy: basic concepts. Int J Dermatol. 2008;47:712-719.
Dermatologic surgeons are susceptible to work-related ailments given the nature of their working posture, the most common of which are pain and stiffness in the neck, shoulders, and lower back, as well as headaches.1,2 Awkward posture and positioning, for the sake of getting a better view of the task at hand, puts the surgeon in ergonomically disagreeable positions. Because the prime working years for a dermatologic surgeon tend to coincide with the age of presbyopia onset, magnification may help reduce and thwart musculoskeletal problems and eye strain. Indeed, a multitude of surgical specialties and dentists use intraoperative magnification.3 Knowledge and use of available magnification options can be a key addition to the dermatologic surgeon’s armamentarium. We discuss the need for magnification and review magnification devices that are readily available to the dermatologic surgeon. Table 1 presents a summary of all magnification options discussed.
Need for Magnification
Presbyopia is a condition of aging in which one loses the ability to accommodate and focus at near distances. The estimated prevalence of presbyopia in North America is 83%, typically with onset by 45 years of age.4 Individuals with presbyopia often hold objects farther away from their eyes to bring them into focus, causing eye strain, headaches, and musculoskeletal injury.
Use of intraoperative magnification allows for enhanced visualization of fine anatomic details and precise suture placement for the surgeon with or without presbyopia. Higher magnification produces a larger image; however, it also reduces field of view and depth of field (ie, the amount of depth that stays in focus without repositioning). The resolution and quality of the image are dependent on the optical properties of the lens system. The ideal optic system is surgeon dependent and involves a combination of magnification level that will not result in dramatic loss of view and depth of field, while maintaining crispness and quality of image.
Intraoperative magnification yields ergonomic benefits by promoting a safer neck flexion angle by increasing the working distance to a more ideal position (Figure). In doing so, it improves posture and minimizes eye and musculoskeletal strain secondary to awkward positioning and presbyopia.1,5 Stationary working position and neck flexion and rotation with precise and repetitive tasks are risk factors for strain and injuries that dermatologic surgeons often encounter.1 Magnification devices are tools that the dermatologic surgeon can utilize for a more ergonomically sound practice. Indeed, magnification has been shown to improve posture in the dental literature, a specialty with similar occupational risk factors to dermatologic surgery.6-8 Ergonomic practice reduces occupational injuries and improves work quality and productivity, thereby having a favorable effect on both the patient and the physician.
Improved Outcomes With Magnification
There are many examples of improved surgical quality and outcomes with magnification in other specialties. Hart and Hall5 illustrated the advantage of magnification in laceration repairs in the emergency department. In one study, increased magnification resulted in a substantial decrease in positive surgical margin rates in open radical retropubic prostatectomy.9 Schoeffl et al10 demonstrated that the microsurgical success of fine surgical procedures was directly related to optical magnification strength when comparing the unaided eye, surgical loupes, and the operating microscope. The dental literature also has numerous examples of magnification producing improved quality dentistry.11-13 Although magnification is not a novel concept to dermatologic surgery, little has been written about its use in the dermatologic surgery literature.
Magnification Options
One-Piece Bifocal Magnifying Safety Glasses
Bifocal magnifying safety glasses are polycarbonate safety glasses made with lenses in which the lower half is a magnifying lens. They are available in +1.5, +2.0, +2.5, and +3.0 diopter strengths. The total magnification power is calculated as follows: (diopter/4) + 1. The glasses are lightweight, easy to wear, inexpensive, and protect the eyes; however, they provide minimal magnification and do not compensate for differences in vision between both eyes.
Magnification Visor
The magnification visor is a headband visor with magnification lenses. It comes in various levels of magnification ranging from ×1.5 to ×3.5. It can be worn over prescription or safety glasses, may be pivoted out of the way when not in use, and is inexpensive. Conversely, it may be bulky to wear, cannot be customized, and does not offer the best resolution.
Magnification Clips
Magnification clips are hard-coated magnifying lens plates that fasten to eyeglass frames and range in level of magnification from ×1.5 to ×3.5. They can be pivoted out of the viewing angle, are lightweight, and are inexpensive; however, positioning may be difficult for ideal working distance and viewing angle.
Magnifier With Frame/Headband
The magnifier with frame is similar to magnification clips, but the magnification lens plate comes with a frame. It can be used with or without glasses and comes in magnification levels of ×1.5 to ×3.5. It is light, inexpensive, and may be pivoted out of sight, but similar to magnification clips, positioning for the right viewing angle and working distance may be difficult.
The magnifier with headband is essentially the same as the magnifier with frame. The only difference is the magnification plate is attached to a headband as opposed to a frame. It has similar benefits and limitations as the magnifier with frame.
Magnification Stand
The magnification stand comes as a large magnification lens with a flexible arm attached to a stand. It is a basic magnification tool and does not need to be worn; however, the stand is not easily portable and may be cumbersome to use.
Surgical Loupes
Surgical loupes are a robust magnification choice and the mainstay in magnification for the dermatologic surgeon. Loupes have proven to have comparable results in some procedures to the powerful operating surgical microscope.14-17 Factors to consider with loupes include brand, design, lens, magnification, resolution, optimal working distance, field depth, and declination angle.18
The 2 surgical loupe designs—flip-up loupes and through-the-lens loupes—differ in the mounting of the optic lenses on safety glasses. Flip-up loupes have the optics mounted to the bridge of the frame, whereas through-the-lens loupes are fixed in the lenses.
There are 3 different optical systems for surgical loupe magnification: simple, compound, and prismatic. Simple lenses consist of one pair of positive meniscus lenses similar to reading glasses. Compound lenses are made of 2 magnification lenses. Prismatic lenses magnify using a prism that folds and lengthens the light path.19,20
Loupes range in magnification level from ×2.5 to ×4.5. Compared to other magnification modalities, they can be customized and offer better resolution with quality magnification. Additionally, loupes can be fitted with a light source; however, they are expensive and surgeons need time to get used to the increased magnification as well as wearing the loupes.
There are advantages and disadvantages to the different loupe designs (Table 2). Flip-up loupes are more versatile, allowing for use on various safety glasses. They can be flipped out of view, and the declination angle may be altered; however, flip-up loupes have a narrower field of view and are heavier and bulkier than through-the-lens loupes. Through-the-lens loupes are lighter and have a larger field of view, as the optics are closer to the eye. They are customized to the declination angle and working distance of the surgeon. Conversely, through-the-lens loupes are more expensive and cannot be adjusted or moved from the line of vision.
Operating Surgical Microscope
The operating surgical microscope is not practical in the dermatologic surgeon’s practice. It is expensive and provides unnecessarily powerful magnification for dermatologic surgery. This tool usually is used in the operating room for suturing nerves and vessels with sutures sized 8-0 and smaller. Most skin procedures require size 6-0 and larger sutures.
Dermoscope
Dermoscopy, also known as epiluminescence microscopy, is a technique utilizing a handheld device made up of polarized light and a ×10 magnifying lens to evaluate skin lesions. In skilled hands, dermoscopy allows for the examination of characteristic patterns and morphologic features of skin lesions to enhance the clinician’s diagnostic accuracy.21 It may aid the dermatologic surgeon in identifying the surgical margins of difficult-to-define skin cancers. It is small and mobile; however, it has minimal benefit to the dermatologic surgeon during surgery because it is handheld and has a small field of view.
Conclusion
Good ergonomic practices facilitate a healthier and prolonged career for the dermatologic surgeon. When used properly, magnification devices can be a beneficial adjunct to the dermatologic surgeon by promoting better posture, preventing eyestrain, and providing enhanced visualization of the operating field and instruments. Use of magnification devices has been demonstrated to improve patient outcomes in other specialties. There are opportunities for further research specific to magnification improving dermatologic surgery outcomes given the high level of precision and accuracy needed for Mohs micrographic surgery, wound reconstruction, nail surgery, and hair transplantation.
- Liang CA, Levine VJ, Dusza SW, et al. Musculoskeletal disorders and ergonomics in dermatologic surgery: a survey of Mohs surgeons in 2010. Dermatol Surg. 2012;38:240-248.
- Esser AC, Koshy JG, Randle HW. Ergonomics in office-based surgery: a survey-guided observational study. Dermatol Surg. 2007;33:1304-1313; discussion, 1313-1314.
- Jarrett PM. Intraoperative magnification: who uses it? Microsurgery. 2004;24:420-422.
- Holden BA, Fricke TR, Ho SM, et al. Global vision impairment due to uncorrected presbyopia. Arch Ophthalmol. 2008;126:1731-1739.
- Hart RG, Hall J. The value of loupe magnification: an underused tool in emergency medicine. Am J Emerg Med. 2007;25:704-707.
- Branson BG, Bray KK, Gadbury-Amyot C, et al. Effect of magnification lenses on student operator posture. J Dent Educ. 2004;68:384-389.
- Maillet JP, Millar AM, Burke JM, et al. Effect of magnification loupes on dental hygiene student posture. J Dent Educ. 2008;72:33-44.
- Branson BG, Black MA, Simmer-Beck M. Changes in posture: a case study of a dental hygienist’s use of magnification loupes. Work. 2010;35:467-476.
- Magera JS Jr, Inman BA, Slezak JM, et al. Increased optical magnification from 2.5× to 4.3× with technical modification lowers the positive margin rate in open radical retropubic prostatectomy [published online November 13, 2007].J Urol. 2008;179:130-135.
- Schoeffl H, Lazzeri D, Schnelzer R, et al. Optical magnification should be mandatory for microsurgery: scientific basis and clinical data contributing to quality assurance. Arch Plast Surg. 2013;40:104-108.
- Taschieri S, Del Fabbro M, Testori T, et al. Endodontic surgery using 2 different magnification devices: preliminary results of a randomized controlled study. J Oral Maxillofac Surg. 2006;64:235-242.
- Christensen GJ. Magnification in dentistry: useful tool or another gimmick? J Am Dent Assoc. 2003;134:1647-1650.
- Syme SE, Fried JL, Strassler HE. Enhanced visualization using magnification systems. J Dent Hyg. 1997;71:202-206.
- Pieptu D, Luchian S. Loupes-only microsurgery. Microsurgery. 2003;23:181-188.
- Shenaq SM, Klebuc MJ, Vargo D. Free-tissue transfer with the aid of loupe magnification: experience with 251 procedures. Plast Reconstr Surg. 1995;95:261-269.
- Serletti JM, Deuber MA, Guidera PM, et al. Comparison of the operating microscope and loupes for free microvascular tissue transfer. Plast Reconstr Surg. 1995;95:270-276.
- Ross DA, Ariyan S, Restifo R, et al. Use of the operating microscope and loupes for head and neck free microvascular tissue transfer: a retrospective comparison. Arch Otolaryngol Head Neck Surg. 2003;129:189-193.
- Mungadi IA. Refinement on surgical technique: role of magnification. J Surg Tech Case Rep. 2010;2:1-2.
- Stanbury SJ, Elfar J. The use of surgical loupes in microsurgery. J Hand Surg Am. 2011;36:154-156.
- Baker JM, Meals RA. A practical guide to surgical loupes. J Hand Surg Am. 1997;22:967-974.
- Campos-do-Carmo G, Ramos-e-Silva M. Dermoscopy: basic concepts. Int J Dermatol. 2008;47:712-719.
Practice Points
- Ergonomic practice is paramount in preserving the longevity and productivity of the dermatologic surgeon.
- A magnification device may be a helpful addition for a dermatologic surgeon to achieve a healthier and more productive practice.
Will artificial intelligence make us better doctors?
Given the amount of time physicians spend entering data, clicking through screens, navigating pages, and logging in to computers, one would have hoped that substantial near-term payback for such efforts would have materialized.
Many of us believed this would take the form of health information exchange – the ability to easily access clinical information from hospitals or clinics other than our own, creating a more complete picture of the patient before us. To our disappointment, true information exchange has yet to materialize. (We won’t debate here whether politics or technology is culpable.) We are left to look elsewhere for the benefits of the digitization of the medical records and other sources of health care knowledge.
Lately, there has been a lot of talk about the promise of machine learning and artificial intelligence (AI) in health care. Much of the resurgence of interest in AI can be traced to IBM Watson’s appearance as a contestant on Jeopardy in 2011. Watson, a natural language supercomputer with enough power to process the equivalent of a million books per second, had access to 200 million pages of content, including the full text of Wikipedia, for Jeopardy.1 Watson handily outperformed its human opponents – two Jeopardy savants who were also the most successful contestants in game show history – taking the $1 million first prize but struggling in categories with clues containing only a few words.
MD Anderson and Watson: Dashed hopes follow initial promise
As a result of growing recognition of AI’s potential in health care, IBM began collaborations with a number of health care organizations to deploy Watson.
In 2013, MD Anderson Cancer Center and IBM began a pilot to develop an oncology clinical decision support technology tool powered by Watson to aid MD Anderson “in its mission to eradicate cancer.” Recently, it was announced that the project – which cost the cancer center $62 million – has been put on hold, and MD Anderson is looking for other contractors to replace IBM.
While administrative problems are at least partly responsible for the project’s challenges, the undertaking has raised issues with the quality and quantity of data in health care that call into question the ability of AI to work as well in health care as it did on Jeopardy, at least in the short term.
Health care: Not as data rich as you might think
“We are not ‘Big Data’ in health care, yet.” – Dale Sanders, Health Catalyst.2
In its quest for Jeopardy victory, Watson accessed a massive data storehouse subsuming a vast array of knowledge assembled over the course of human history. Conversely, for health care, Watson is limited to a few decades of scientific journals (that may not contribute to diagnosis and treatment as much as one might think), claims data geared to billing without much clinical information like outcomes, and clinical data from progress notes (plagued by inaccuracies, serial “copy and paste,” and nonstandardized language and numeric representations), and variable-format reports from lab, radiology, pathology, and other disciplines.
To articulate how data-poor health care is, Dale Sanders, executive vice president for software at Health Catalyst, notes that a Boeing 787 generates 500GB of data in a six hour flight while one patient may generate just 100MB of data in an entire year.2 He pointed out that, in the near term, AI platforms like Watson simply do not have enough data substrate to impact health care as many hoped it would. Over the longer term, he says, if health care can develop a coherent, standard approach to data content, AI may fulfill its promise. 
What can AI and related technologies achieve in the near-term?
“AI seems to have replaced Uber as the most overused word or phrase in digital health.” – Reporter Stephanie Baum, paraphrasing from an interview with Bob Kocher, Venrock Partners.3
My observations tell me that we have already made some progress and are likely to make more strides in the coming years, thanks to AI, machine learning, and natural language processing. A few areas of potential gain are:
Clinical documentation
Technology that can derive meaning from words or groups of words can help with more accurate clinical documentation. For example, if a patient has a documented UTI but also has in the record an 11 on the Glasgow Coma Scale, a systolic BP of 90, and a respiratory rate of 24, technology can alert the physician to document sepsis.
Quality measurement and reporting
Similarly, if technology can recognize words and numbers, it may be able to extract and report quality measures (for example, an ejection fraction of 35% in a heart failure patient) from progress notes without having a nurse-abstractor manually enter such data into structured fields for reporting, as is currently the case.
Predicting readmissions, mortality, other events
While machine learning has had mixed results in predicting future clinical events, this is likely to change as data integrity and algorithms improve. Best-of-breed technology will probably use both clinical and machine learning tools for predictive purposes in the future.
In 2015, I had the privilege of meeting Vinod Khosla, cofounder of SUN Microsystems and venture capitalist, who predicts that computers will largely supplant physicians in the future, at least in domains relying on access to data. As he puts it, “the core functions necessary for complex diagnoses, treatments, and monitoring will be driven by machine judgment instead of human judgment.”4
While the benefits of technology, especially in health care, are often oversold, I believe AI and related technologies will some day play a large role alongside physicians in the care of patients. However, for AI to deliver, we must first figure out how to collect and organize health care data so that computers are able to ingest, digest and use it in a purposeful way.
Note: Dr. Whitcomb is founder and advisor to Zato Health, which uses natural language processing and discovery technology in health care.
He is chief medical officer at Remedy Partners in Darien, Conn., and a cofounder and past president of SHM.
References
1. Zimmer, Ben. Is It Time to Welcome Our New Computer Overlords?. The Atlantic. https://www.theatlantic.com/technology/archive/2011/02/is-it-time-to-welcome-our-new-computer-overlords/71388/. Accessed 23 Apr 2017.
2. Sanders, Dale. The MD Anderson / IBM Watson Announcement: What does it mean for machine learning in healthcare? Webinar. https://www.slideshare.net/healthcatalyst1/the-md-anderson-ibm-watson-announcement-what-does-it-mean-for-machine-learning-in-healthcare. Accessed 23 Apr 2017.
3. Baum, Stephanie. Venrock survey predicts a flight to quality for digital health investments. MedCity News. 12 Apr 2017. http://medcitynews.com/2017/04/venrock-survey-predicts-flight-quality-digital-health-investment/. Accessed 22 Apr 2017.
4. Khosla, Vinod. The Reinvention Of Medicine: Dr. Algorithm V0-7 And Beyond. TechCrunch. 22 Sept 2014. https://techcrunch.com/2014/09/22/the-reinvention-of-medicine-dr-algorithm-version-0-7-and-beyond/. Accessed 22 Apr 2017.
Given the amount of time physicians spend entering data, clicking through screens, navigating pages, and logging in to computers, one would have hoped that substantial near-term payback for such efforts would have materialized.
Many of us believed this would take the form of health information exchange – the ability to easily access clinical information from hospitals or clinics other than our own, creating a more complete picture of the patient before us. To our disappointment, true information exchange has yet to materialize. (We won’t debate here whether politics or technology is culpable.) We are left to look elsewhere for the benefits of the digitization of the medical records and other sources of health care knowledge.
Lately, there has been a lot of talk about the promise of machine learning and artificial intelligence (AI) in health care. Much of the resurgence of interest in AI can be traced to IBM Watson’s appearance as a contestant on Jeopardy in 2011. Watson, a natural language supercomputer with enough power to process the equivalent of a million books per second, had access to 200 million pages of content, including the full text of Wikipedia, for Jeopardy.1 Watson handily outperformed its human opponents – two Jeopardy savants who were also the most successful contestants in game show history – taking the $1 million first prize but struggling in categories with clues containing only a few words.
MD Anderson and Watson: Dashed hopes follow initial promise
As a result of growing recognition of AI’s potential in health care, IBM began collaborations with a number of health care organizations to deploy Watson.
In 2013, MD Anderson Cancer Center and IBM began a pilot to develop an oncology clinical decision support technology tool powered by Watson to aid MD Anderson “in its mission to eradicate cancer.” Recently, it was announced that the project – which cost the cancer center $62 million – has been put on hold, and MD Anderson is looking for other contractors to replace IBM.
While administrative problems are at least partly responsible for the project’s challenges, the undertaking has raised issues with the quality and quantity of data in health care that call into question the ability of AI to work as well in health care as it did on Jeopardy, at least in the short term.
Health care: Not as data rich as you might think
“We are not ‘Big Data’ in health care, yet.” – Dale Sanders, Health Catalyst.2
In its quest for Jeopardy victory, Watson accessed a massive data storehouse subsuming a vast array of knowledge assembled over the course of human history. Conversely, for health care, Watson is limited to a few decades of scientific journals (that may not contribute to diagnosis and treatment as much as one might think), claims data geared to billing without much clinical information like outcomes, and clinical data from progress notes (plagued by inaccuracies, serial “copy and paste,” and nonstandardized language and numeric representations), and variable-format reports from lab, radiology, pathology, and other disciplines.
To articulate how data-poor health care is, Dale Sanders, executive vice president for software at Health Catalyst, notes that a Boeing 787 generates 500GB of data in a six hour flight while one patient may generate just 100MB of data in an entire year.2 He pointed out that, in the near term, AI platforms like Watson simply do not have enough data substrate to impact health care as many hoped it would. Over the longer term, he says, if health care can develop a coherent, standard approach to data content, AI may fulfill its promise.
What can AI and related technologies achieve in the near-term?
“AI seems to have replaced Uber as the most overused word or phrase in digital health.” – Reporter Stephanie Baum, paraphrasing from an interview with Bob Kocher, Venrock Partners.3
My observations tell me that we have already made some progress and are likely to make more strides in the coming years, thanks to AI, machine learning, and natural language processing. A few areas of potential gain are:
Clinical documentation
Technology that can derive meaning from words or groups of words can help with more accurate clinical documentation. For example, if a patient has a documented UTI but also has in the record an 11 on the Glasgow Coma Scale, a systolic BP of 90, and a respiratory rate of 24, technology can alert the physician to document sepsis.
Quality measurement and reporting
Similarly, if technology can recognize words and numbers, it may be able to extract and report quality measures (for example, an ejection fraction of 35% in a heart failure patient) from progress notes without having a nurse-abstractor manually enter such data into structured fields for reporting, as is currently the case.
Predicting readmissions, mortality, other events
While machine learning has had mixed results in predicting future clinical events, this is likely to change as data integrity and algorithms improve. Best-of-breed technology will probably use both clinical and machine learning tools for predictive purposes in the future.
In 2015, I had the privilege of meeting Vinod Khosla, cofounder of SUN Microsystems and venture capitalist, who predicts that computers will largely supplant physicians in the future, at least in domains relying on access to data. As he puts it, “the core functions necessary for complex diagnoses, treatments, and monitoring will be driven by machine judgment instead of human judgment.”4
While the benefits of technology, especially in health care, are often oversold, I believe AI and related technologies will some day play a large role alongside physicians in the care of patients. However, for AI to deliver, we must first figure out how to collect and organize health care data so that computers are able to ingest, digest and use it in a purposeful way.
Note: Dr. Whitcomb is founder and advisor to Zato Health, which uses natural language processing and discovery technology in health care.
He is chief medical officer at Remedy Partners in Darien, Conn., and a cofounder and past president of SHM.
References
1. Zimmer, Ben. Is It Time to Welcome Our New Computer Overlords?. The Atlantic. https://www.theatlantic.com/technology/archive/2011/02/is-it-time-to-welcome-our-new-computer-overlords/71388/. Accessed 23 Apr 2017.
2. Sanders, Dale. The MD Anderson / IBM Watson Announcement: What does it mean for machine learning in healthcare? Webinar. https://www.slideshare.net/healthcatalyst1/the-md-anderson-ibm-watson-announcement-what-does-it-mean-for-machine-learning-in-healthcare. Accessed 23 Apr 2017.
3. Baum, Stephanie. Venrock survey predicts a flight to quality for digital health investments. MedCity News. 12 Apr 2017. http://medcitynews.com/2017/04/venrock-survey-predicts-flight-quality-digital-health-investment/. Accessed 22 Apr 2017.
4. Khosla, Vinod. The Reinvention Of Medicine: Dr. Algorithm V0-7 And Beyond. TechCrunch. 22 Sept 2014. https://techcrunch.com/2014/09/22/the-reinvention-of-medicine-dr-algorithm-version-0-7-and-beyond/. Accessed 22 Apr 2017.
Health inequities take a societal toll
Arguably one of the most important public health issues in our nation is the gap between high-quality care and the people who need it most. The passage of the Affordable Care Act was meant, in part, to reduce this gap and increase health equity in terms of both eligibility for, and access to, care. However, lower-income residents, especially those from minority groups, are more likely to be hospitalized for asthma, hypertension, heart disease, and diabetes, and to experience infertility, preterm birth, and fetal death.
Health disparities, or inequities, translate not only into greater suffering for certain segments of the population, but also to significantly greater health care costs for everyone. Racial health disparities are associated with an estimated $35 billion annually in excess expenditures, $10 billion in lost productivity, and nearly $200 billion in premature deaths, according to an article in the Harvard Business Review. A 2013 study estimated that reducing racial disparities in adverse pregnancy outcomes – preeclampsia, preterm birth, gestational diabetes mellitus, and fetal death/stillbirth – could generate health care cost savings of up to $214 million per year (Matern Child Health J. 2013 Oct;17[8]:1518-25).
Several years ago, the State of Maryland took a unique approach to reducing health disparities by passing the Maryland Health Improvement and Disparities Reduction Act. One of the major components of this legislation was the creation of Health Enterprise Zones (HEZs), distinct geographical areas across the state dedicated to addressing health disparities and improving access to high-quality care. This incentive-based program provides state-funded resources to primary care providers and community-based health organizations specifically to help the neighborhoods they serve. I was deeply honored to serve as chairman of the task force that recommended the establishment of the HEZs.

For this Master Class, I have invited Melissa A. Simon, MD, the George H. Gardner, MD, Professor of Clinical Gynecology and professor of obstetrics and gynecology at Northwestern University, Chicago, to provide some practical advice on how to create greater health equity.
Dr. Reece, who specializes in maternal-fetal medicine, is vice president for medical affairs at the University of Maryland, Baltimore, as well as the John Z. and Akiko K. Bowers Distinguished Professor and dean of the school of medicine. Dr. Reece said he had no relevant financial disclosures. He is the medical editor of this column. Contact him at [email protected].
Arguably one of the most important public health issues in our nation is the gap between high-quality care and the people who need it most. The passage of the Affordable Care Act was meant, in part, to reduce this gap and increase health equity in terms of both eligibility for, and access to, care. However, lower-income residents, especially those from minority groups, are more likely to be hospitalized for asthma, hypertension, heart disease, and diabetes, and to experience infertility, preterm birth, and fetal death.
Health disparities, or inequities, translate not only into greater suffering for certain segments of the population, but also to significantly greater health care costs for everyone. Racial health disparities are associated with an estimated $35 billion annually in excess expenditures, $10 billion in lost productivity, and nearly $200 billion in premature deaths, according to an article in the Harvard Business Review. A 2013 study estimated that reducing racial disparities in adverse pregnancy outcomes – preeclampsia, preterm birth, gestational diabetes mellitus, and fetal death/stillbirth – could generate health care cost savings of up to $214 million per year (Matern Child Health J. 2013 Oct;17[8]:1518-25).
Several years ago, the State of Maryland took a unique approach to reducing health disparities by passing the Maryland Health Improvement and Disparities Reduction Act. One of the major components of this legislation was the creation of Health Enterprise Zones (HEZs), distinct geographical areas across the state dedicated to addressing health disparities and improving access to high-quality care. This incentive-based program provides state-funded resources to primary care providers and community-based health organizations specifically to help the neighborhoods they serve. I was deeply honored to serve as chairman of the task force that recommended the establishment of the HEZs.
For this Master Class, I have invited Melissa A. Simon, MD, the George H. Gardner, MD, Professor of Clinical Gynecology and professor of obstetrics and gynecology at Northwestern University, Chicago, to provide some practical advice on how to create greater health equity.
Dr. Reece, who specializes in maternal-fetal medicine, is vice president for medical affairs at the University of Maryland, Baltimore, as well as the John Z. and Akiko K. Bowers Distinguished Professor and dean of the school of medicine. Dr. Reece said he had no relevant financial disclosures. He is the medical editor of this column. Contact him at [email protected].
Moving toward health equity in practice
Of all the medical professions, obstetrics and gynecology should be the strongest champion for equity in women’s health in this country and globally. The question is, what does this mean in the reality of 2017 and moving forward in the 21st century? What does it mean in the context of our own practices and in the landscape of current policy and politics?
Finding answers to these questions requires both a deep understanding of the meaning of health equity and a willingness to rethink the architecture and engineering of how we currently provide care.
The terms equity and equality are sometimes used interchangeably, but they actually have quite different meanings. Imagine three women of different heights standing underneath the lowest branch of a tall apple tree. None of the three women are tall enough to pick an apple from the branch.
If we think about equality, we would assist each woman by giving her a box to stand on, and all three boxes would be the same size. This means that while the tallest woman will now be able to pick an apple, the medium-height woman may be able to touch but not pick the apple, and the shortest woman still may not be able to reach the apple at all.
However, if we think about equity, we’d acknowledge that each woman needs her own personalized box to be able to pick the apple. For instance, the shortest woman may need a box that is three times the height of the box used by the tallest woman.
Achieving true population health for all women requires that we similarly eliminate inequities by providing each patient with her own personalized care plan to help her reach and maintain her health.
Women from minority groups have higher rates of low birth weight, preterm birth, stillbirth, gestational diabetes and its complications, HIV, breast cancer mortality and cervical cancer incidence and mortality, infertility and response to fertility treatment, and maternal mortality.
Yet inequity runs deeper than racial/ethnic labels; disparities also are created by a host of other factors, from cognitive or physical disabilities to gender or sexual identity or orientation, one’s ZIP code, working environment, language, and health literacy.
More than ever, the art of medicine involves understanding how to meet every patient where she is – given her own context and beliefs and levels of support – so that every woman has the opportunity to stand on the right-sized box and pick the apple and thrive.
Our practices
Provider bias and stereotyping can impact health care and health outcomes, and it is important that we work to prevent this in ourselves and in our staff. This means not making assumptions. It means really listening to our patients in ways that we may not have before.
Women who have experienced health inequity may have unique barriers to success. Therefore, we must listen for cues and inquire about our patients’ environment and circumstances, as well as their partnerships and support – or lack thereof. We should then acknowledge and communicate that certain social and environmental factors may impact our ability to achieve a desired outcome.
How can we impact the diet of a patient with gestational diabetes, for instance, if we have not adequately communicated what medical nutritional therapy means in the context of her own culture and ability to access food? If she lives in a food desert or has food insecurity or lives in a violence-ridden neighborhood that keeps her from going to a grocery store regularly, we must think outside the box. Ob.gyns. and their clinical care teams can work with women who have less access to nutritious foods, or who have certain cultural food staples, to suggest recipes and grocery lists that make sense with respect to the types of stores they shop in or their cultural preferences.
When it comes to cancer prevention and treatment, how can we expect a woman to be compliant with screening if we cannot help her understand that she can get screening services for free with her health insurance? How can we help a woman who has coverage for, or access to, free screening but then no funding or coverage for a diagnostic test or cancer treatment? How can we support a patient with abnormal cancer screening results who hasn’t followed up for months because she is afraid to leave home without her partner’s permission?
Such questions and circumstances often involve what we call “social determinants of health,” and they force us to rethink how we can better deliver and optimize care. Re-engineering our practices for health equity may involve employing a more diverse practice staff, linking patients with community resources, modifying our practice hours to align better with working women’s schedules, or finding creative ways to discern patients’ motivating factors and then piggyback on these factors.
We may also need to modify how we approach the number of return visits that we request of women so that follow-up care aligns better with their ability to leave work or find childcare. Simply put, we should strive to set up our patients for success, not failure.
We can pointedly ask patients about the kinds of information and support they want and need. We might ask, for instance: What do you need, and how can I work with you, so that you can effectively monitor and control your glucose levels? How can I work with you to help you get onto a trajectory to stop smoking? How can I help you better understand what tests and procedures are covered under your insurance plan, or whether you qualify for free services?
Patients with lower health literacy may need teach-back methods to validate understanding, or messaging that is more focused and limited at any one time. Self-efficacy through patient-centered education and support should be our goal.
Practices and clinics may also be able to adapt elements of the National Cancer Institute’s multicenter Patient Navigation Research Program, in which community health workers or other “patient navigators” address women’s personal barriers to the timely follow-up of abnormal breast and cervical cancer screening results. Patient navigation through this program and similar projects, including programs that we’ve adapted for different racial and ethnic communities in and around Chicago, has reduced or eliminated delays in diagnostic resolution of gynecologic cancer (Cancer. 2015 Nov 15;121[22]:4025-34, Breast Cancer Res Treat. 2016 Aug;158[3]:523-34, Am J Public Health. 2015 May;105[5]:e87-94).
The patient navigation model is increasingly being adapted and used in a variety of contexts outside of cancer care as well. In a postpartum patient navigation program that we tested at Northwestern University’s Medicaid-based outpatient clinic, a navigator was hired to communicate with patients and support them between delivery and completion of their postpartum care. Patients were reminded through calls and/or texts of their postpartum visits and of the benefits of breastfeeding, effective contraception, and other postpartum practices.
The demonstration project was impactful: Women who were enrolled in the program were more likely to return for postpartum care, to receive World Health Organization Tier 1 or 2 contraception, and to have postpartum screening and vaccinations, compared with women who received care before the program began (Obstet Gynecol. 2017 May;129[5]:925-33).
Connections to our patients will help us to achieve health equity. This includes connections between the primary care we provide and the specialty care our patients sometimes require, both inside and outside of our field. We may refer a patient to an oncology team, for instance, and in the process, unwittingly transfer her care such that other conditions that we’ve been managing – hypertension, depression, or diabetes – fall by the wayside.
Instead, we have to re-engineer our processes so that we maintain personalized connections back to these patients. For example, the referring ob.gyn. could develop and send to the oncologist or gynecologic-oncologist a care plan that includes the patient’s comorbid conditions and how they could be managed. This would allow for clearer communication.
Our communities
As ob.gyns., we have a common goal of championing health equity and true population health for every woman, regardless of whether she lives in rural, urban, or suburban America and regardless of whether she has conservative or liberal values. To do so, we must extend ourselves beyond our own practices.
In a committee opinion on Racial and Ethnic Disparities in Obstetrics and Gynecology, the American College of Obstetricians and Gynecologists advises that ob.gyns. take a number of actions to increase health equity. These include raising awareness about inequity and its effects on health outcomes, promoting quality improvement projects that target disparities, working with public health leadership, and helping recruit ob.gyns. and other health care providers from racial and ethnic minority groups (Obstet Gynecol 2015;126:e130-4).
In Chicago, where 1 out of 5 people lives in poverty and 1 out of 10 lives in deep poverty, we are still in our infancy in combating health inequities. However, with partnerships between academic institutions, departments of health, and other organizations across various sectors, we are beginning to move the needle on these entrenched health inequities.
For example, in 2007, there was a 60% difference in breast cancer mortality between black and white women in Chicago. This disparity sparked the development of the Metropolitan Chicago Breast Cancer Task Force and a series of on-the-ground patient navigator programs, along with several key policy changes and new state laws.
State actions included requiring quality reporting on mammography and increasing the Medicaid reimbursement rate for mammography to the Medicare rate. Nationally, beneficial changes were made to Medicare’s quality metrics and to the National Breast and Cervical Cancer Early Detection Program. All told, through a combination of studies and initiatives focused on improving knowledge, trust, access to care, and quality of care, we have been able to decrease the breast cancer mortality gap by 20%.
We also have a role to play in nurturing and developing a workforce that better aligns with our evolving demographics. This involves redesigning how we plant seeds of opportunity among high school students, undergraduates, and young medical students, and how we seek job applicants. Moreover, when we help people get to the next step in their careers, we need to make sure there is continuous support to retain them and help propel them to the next level.
We should think creatively to establish programs or launch initiatives that can help level the playing field for all women. For example, I created a Massive Open Online Course called “Career 911: Your Future Job in Medicine and Healthcare” as a free workforce development pipeline program. It is accessible on a global platform (https://www.coursera.org/learn/healthcarejobs) and is one example of how we as ob.gyns. can leverage our skills and resources.
Along the way, we also need to train our students and residents – and ourselves – to be more familiar with, and articulate about, health care policy. We need to understand how policy is made and modified and how we can be good communicators and thought leaders.
Right now, our ability to articulate our patients’ stories to policy makers and to the public seems underdeveloped and undertapped. The onus is on us to write and speak about how all women must have the opportunity to not only access care but to access high-quality care and preventive services that are important for full health. Providing health equity isn’t about giving someone a handout, but about giving her a helping hand to take control of her health.
Achieving health equity will involve changing our approach to research. If medical research on women’s health continues to be dominated by studies in which participants are homogeneous and from mainly white or well-resourced populations, we will never have output that is generalizable. As practicing ob.gyns., we can look for opportunities to advocate for diversity in research. We can also acknowledge that, for some women, there is historically-rooted distrust of the health care system that serves as a barrier both to obtaining care and enrolling in trials.
By meeting women where they are, and by tailoring their individual boxes as best we can – in research, in workforce development, and in clinical care delivery – we can work toward solutions.
Strategies for achieving women’s health equity
• Modify office hours/dates to allow flexibility for women who have challenges scheduling childcare and time off from work.
• Ensure handouts, educational materials, and all communications are at appropriate health literacy levels.
• Acknowledge and understand an individual woman’s barriers to care, including social determinants of health, and create a care plan that is achievable for her.
• Learn about and refer women to local community resources needed to overcome barriers to care, such as childcare, social services support, support services for intimate partner violence, and substance abuse counseling.
• Examine office processes to optimize the number of visits women have to attend for a particular health issue. Are there ways to explain results and next steps in a care plan without having to make her come back for an office visit?
Dr. Simon is the George H. Gardner Professor of Clinical Gynecology at Northwestern University, Chicago, and director of the Chicago Cancer Health Equity Collaborative. She is a member of the U.S. Preventive Services Task Force, but the views expressed in this piece are her own.
Consider neurodevelopmental impacts of hyperemesis gravidarum
Hyperemesis gravidarum (HG) affects just 1%-2% of pregnant women, but it’s clinical consequences are significant, with excess vomiting and dehydration, hospitalization, and the need for intravenous fluids being common in that group. In extreme cases, repeated vomiting has led to tears in the esophagus and severe dehydration has caused acute renal failure. All of that leaves aside the obvious suffering and distress it causes for women with the condition.
While studies continue to support the long-held theory that mild-to-moderate nausea and vomiting has a protective effect in pregnancy, that does not appear to be true for HG. Rather, the medical literature shows that HG is associated with small-for-gestational-age neonates, low birth weight, higher rates of preterm birth, and lower Apgar scores at 5 minutes.

I was one of the investigators on a study that prospectively followed more than 200 women with nausea and vomiting in pregnancy from 2006 to 2012. We found that children whose mothers were hospitalized for their symptoms – 22 in all – had significantly lower IQ scores at 3.5 years to 7 years, compared with children whose mothers were not hospitalized. Verbal IQ scores were 107.2 points vs. 112.7 (P = .04), performance IQ scores were 105.6 vs. 112.3 (P = .03), and full scale IQ was 108.7 vs. 114.2 (P = .05).
The study cohort included three groups: women treated with more than four tablets per day of doxylamine/pyridoxine (Diclegis); women treated with up to four tablets per day of the drug; and women who did not receive pharmacotherapy (Obstet Gynecol. 2015. doi: 10.1097/01.AOG.0000463229.81803.1a).
Hospitalized women in the study received antiemetics about a week later, experienced more severe symptoms, and were more likely to report depression. Overall, we found that duration of hospitalization, maternal depression, and maternal IQ all were significant predictors for these outcomes. However, daily antiemetic therapy was not associated with adverse outcomes.

Another study, published the same year, found that children exposed to HG had a more than three times increased risk for a neurodevelopmental diagnosis, including attention disorders, speech and language delays, and sensory disorders. The changes were more prevalent when women experienced symptoms early in pregnancy – prior to 5 weeks of gestation (Eur J Obstet Gynecol Reprod Biol. 2015 Jun;189:79-84).
The study compared neurodevelopmental outcomes for 312 children from 203 women with HG, with 169 children from 89 unaffected mothers. The findings are similar to those of our study, despite the differences in methodologies. Both studies found that the antiemetics were not associated with adverse outcomes, but the symptoms of HG appear to be the culprit.
While more research is needed to confirm these findings, it makes sense that the nutritional deficiencies created by excess vomiting and inability to eat are having an impact on the fetus.
It also raises an important question for the ob.gyn. about when to intervene in these women. Often, clinicians take a wait-and-see approach to nausea and vomiting in pregnancy, but the developing research suggests that earlier intervention would lead to better outcomes for mother and baby. One guide to determining that preventive antiemetics are necessary is to consider whether your patient has had HG in a previous pregnancy or if her mother or sister has experienced HG.
Another consideration is treating the nutritional deficiency that develops in women whose HG symptoms persist. These women are not simply in need of fluids and electrolytes but are missing essential vitamins and proteins. This is an area where much more research is needed, but clinicians can take a proactive approach by providing team care that includes consultation with a dietitians or nutritionist.
Finally, we cannot forget that maternal depression also appears to be significant predictor of poor fetal outcomes, so providing appropriate psychiatric treatment is essential.
Dr. Koren is professor of physiology/pharmacology and pediatrics at Western University in Ontario. He is the founder of the Motherisk Program. Dr. Koren was a principal investigator in the U.S. study that resulted in the approval of Diclegis, marketed by Duchesnay USA, and has served as a consultant to Duchesnay.
Hyperemesis gravidarum (HG) affects just 1%-2% of pregnant women, but it’s clinical consequences are significant, with excess vomiting and dehydration, hospitalization, and the need for intravenous fluids being common in that group. In extreme cases, repeated vomiting has led to tears in the esophagus and severe dehydration has caused acute renal failure. All of that leaves aside the obvious suffering and distress it causes for women with the condition.
While studies continue to support the long-held theory that mild-to-moderate nausea and vomiting has a protective effect in pregnancy, that does not appear to be true for HG. Rather, the medical literature shows that HG is associated with small-for-gestational-age neonates, low birth weight, higher rates of preterm birth, and lower Apgar scores at 5 minutes.
I was one of the investigators on a study that prospectively followed more than 200 women with nausea and vomiting in pregnancy from 2006 to 2012. We found that children whose mothers were hospitalized for their symptoms – 22 in all – had significantly lower IQ scores at 3.5 years to 7 years, compared with children whose mothers were not hospitalized. Verbal IQ scores were 107.2 points vs. 112.7 (P = .04), performance IQ scores were 105.6 vs. 112.3 (P = .03), and full scale IQ was 108.7 vs. 114.2 (P = .05).
The study cohort included three groups: women treated with more than four tablets per day of doxylamine/pyridoxine (Diclegis); women treated with up to four tablets per day of the drug; and women who did not receive pharmacotherapy (Obstet Gynecol. 2015. doi: 10.1097/01.AOG.0000463229.81803.1a).
Hospitalized women in the study received antiemetics about a week later, experienced more severe symptoms, and were more likely to report depression. Overall, we found that duration of hospitalization, maternal depression, and maternal IQ all were significant predictors for these outcomes. However, daily antiemetic therapy was not associated with adverse outcomes.
Another study, published the same year, found that children exposed to HG had a more than three times increased risk for a neurodevelopmental diagnosis, including attention disorders, speech and language delays, and sensory disorders. The changes were more prevalent when women experienced symptoms early in pregnancy – prior to 5 weeks of gestation (Eur J Obstet Gynecol Reprod Biol. 2015 Jun;189:79-84).
The study compared neurodevelopmental outcomes for 312 children from 203 women with HG, with 169 children from 89 unaffected mothers. The findings are similar to those of our study, despite the differences in methodologies. Both studies found that the antiemetics were not associated with adverse outcomes, but the symptoms of HG appear to be the culprit.
While more research is needed to confirm these findings, it makes sense that the nutritional deficiencies created by excess vomiting and inability to eat are having an impact on the fetus.
It also raises an important question for the ob.gyn. about when to intervene in these women. Often, clinicians take a wait-and-see approach to nausea and vomiting in pregnancy, but the developing research suggests that earlier intervention would lead to better outcomes for mother and baby. One guide to determining that preventive antiemetics are necessary is to consider whether your patient has had HG in a previous pregnancy or if her mother or sister has experienced HG.
Another consideration is treating the nutritional deficiency that develops in women whose HG symptoms persist. These women are not simply in need of fluids and electrolytes but are missing essential vitamins and proteins. This is an area where much more research is needed, but clinicians can take a proactive approach by providing team care that includes consultation with a dietitians or nutritionist.
Finally, we cannot forget that maternal depression also appears to be significant predictor of poor fetal outcomes, so providing appropriate psychiatric treatment is essential.
Dr. Koren is professor of physiology/pharmacology and pediatrics at Western University in Ontario. He is the founder of the Motherisk Program. Dr. Koren was a principal investigator in the U.S. study that resulted in the approval of Diclegis, marketed by Duchesnay USA, and has served as a consultant to Duchesnay.