User login
Redness and Painful Ulcerations in the Perineal Area
The Diagnosis: PELVIS Syndrome
Infantile hemangiomas (IHs) are present in up to 10% of infants by 1 year of age and are most commonly located on the face and upper extremities. Less than 10% of IHs develop in the perineum.1 Perineal IHs are benign tumors of the vascular endothelium that present as plaques and commonly are accompanied by painful ulcerations. Ulceration is more common in the diaper area secondary to irritation from urine, stool, and friction.2 Although most IHs are benign isolated findings, facial IHs have been associated with several syndromes including Sturge-Weber and PHACE (posterior fossa brain malformations, hemangiomas, arterial anomalies, cardiac anomalies and coarctation of the aorta, and eye and endocrine abnormalities) syndromes.3 Researchers also have identified an association between lumbosacral IHs and spinal dysraphism (tethered spinal cord).4
A smaller number of studies have investigated congenital anomalies related to perineal IH,1,5 specifically PELVIS syndrome. The acronym PELVIS has been used to describe a syndrome of congenital malformations including perineal hemangioma, external genital malformations, lipomyelomeningocele, vesicorenal abnormalities, imperforate anus, and skin tag.1 An alternative description of similar findings is LUMBAR (lower body hemangioma and other cutaneous defects; urogenital anomalies, ulceration; myelopathy; bony deformities; anorectal malformations, arterial anomalies; and renal anomalies).5 Researchers have suggested that both of these acronyms describe the same syndrome, and it is common for the syndrome to be incomplete.6 One study (N=11) found that perineal hemangiomas are most commonly associated with anal malformations (8 patients), followed by urinary tract abnormalities (7 patients) and malformation of the external genitalia (7 patients). A skin tag was present in 5 patients.1 The pathogenesis of PELVIS syndrome is unknown.
When an infant presents with a perineal hemangioma and physical examination suggests PELVIS syndrome, imaging should be performed to evaluate for other anomalies. Before 4 months of age, ultrasound should be utilized to investigate the presence of reno-genitourinary or spinal malformations. Magnetic resonance imaging is the preferred imaging modality in children older than 4 months.7 Management of PELVIS syndrome requires a multidisciplinary approach and early recognition of the full extent of congenital malformations. Pediatric dermatologists, urologists, endocrinologists, and neonatologists have a role in its diagnosis and treatment.
- Girard C, Bigorre M, Guillot B, et al. PELVIS syndrome. Arch Dermatol. 2006;142:884-888.
- Bruckner AL, Frieden IJ. Hemangiomas of infancy. J Am Acad Dermatol. 2003;48:477-496.
- Frieden IJ, Reese V, Cohen D. PHACE syndrome: the association of posterior fossa brain malformations, hemangiomas, arterial anomalies, coarctation of the aorta and cardiac defects, and eye abnormalities. Arch Dermatol. 1996;132:307-311.
- Albright AL, Gartner JC, Wiener ES. Lumbar cutaneous hemangiomas as indicators of tethered spinal cords. Pediatrics. 1989;83:977-980.
- Iacobas I, Burrows PE, Frieden IJ, et al. LUMBAR: association between cutaneous infantile hemangiomas of the lower body and regional congenital anomalies. J Pediatr. 2010;157:795-801.
- Frade FN, Kadlub V, Soupre S, et al. PELVIS or LUMBAR syndrome: the same entity. two case reports. Arch Pediatr. 2012;19:55-58.
- Berk DR, Bayliss SJ, Merritt DF. Management quandary: extensive perineal infantile hemangioma with associated congenital anomalies: an example of the PELVIS syndrome. J Pediatr Adolesc Gynecol. 2007;20:105-108.
The Diagnosis: PELVIS Syndrome
Infantile hemangiomas (IHs) are present in up to 10% of infants by 1 year of age and are most commonly located on the face and upper extremities. Less than 10% of IHs develop in the perineum.1 Perineal IHs are benign tumors of the vascular endothelium that present as plaques and commonly are accompanied by painful ulcerations. Ulceration is more common in the diaper area secondary to irritation from urine, stool, and friction.2 Although most IHs are benign isolated findings, facial IHs have been associated with several syndromes including Sturge-Weber and PHACE (posterior fossa brain malformations, hemangiomas, arterial anomalies, cardiac anomalies and coarctation of the aorta, and eye and endocrine abnormalities) syndromes.3 Researchers also have identified an association between lumbosacral IHs and spinal dysraphism (tethered spinal cord).4
A smaller number of studies have investigated congenital anomalies related to perineal IH,1,5 specifically PELVIS syndrome. The acronym PELVIS has been used to describe a syndrome of congenital malformations including perineal hemangioma, external genital malformations, lipomyelomeningocele, vesicorenal abnormalities, imperforate anus, and skin tag.1 An alternative description of similar findings is LUMBAR (lower body hemangioma and other cutaneous defects; urogenital anomalies, ulceration; myelopathy; bony deformities; anorectal malformations, arterial anomalies; and renal anomalies).5 Researchers have suggested that both of these acronyms describe the same syndrome, and it is common for the syndrome to be incomplete.6 One study (N=11) found that perineal hemangiomas are most commonly associated with anal malformations (8 patients), followed by urinary tract abnormalities (7 patients) and malformation of the external genitalia (7 patients). A skin tag was present in 5 patients.1 The pathogenesis of PELVIS syndrome is unknown.
When an infant presents with a perineal hemangioma and physical examination suggests PELVIS syndrome, imaging should be performed to evaluate for other anomalies. Before 4 months of age, ultrasound should be utilized to investigate the presence of reno-genitourinary or spinal malformations. Magnetic resonance imaging is the preferred imaging modality in children older than 4 months.7 Management of PELVIS syndrome requires a multidisciplinary approach and early recognition of the full extent of congenital malformations. Pediatric dermatologists, urologists, endocrinologists, and neonatologists have a role in its diagnosis and treatment.
- Girard C, Bigorre M, Guillot B, et al. PELVIS syndrome. Arch Dermatol. 2006;142:884-888.
- Bruckner AL, Frieden IJ. Hemangiomas of infancy. J Am Acad Dermatol. 2003;48:477-496.
- Frieden IJ, Reese V, Cohen D. PHACE syndrome: the association of posterior fossa brain malformations, hemangiomas, arterial anomalies, coarctation of the aorta and cardiac defects, and eye abnormalities. Arch Dermatol. 1996;132:307-311.
- Albright AL, Gartner JC, Wiener ES. Lumbar cutaneous hemangiomas as indicators of tethered spinal cords. Pediatrics. 1989;83:977-980.
- Iacobas I, Burrows PE, Frieden IJ, et al. LUMBAR: association between cutaneous infantile hemangiomas of the lower body and regional congenital anomalies. J Pediatr. 2010;157:795-801.
- Frade FN, Kadlub V, Soupre S, et al. PELVIS or LUMBAR syndrome: the same entity. two case reports. Arch Pediatr. 2012;19:55-58.
- Berk DR, Bayliss SJ, Merritt DF. Management quandary: extensive perineal infantile hemangioma with associated congenital anomalies: an example of the PELVIS syndrome. J Pediatr Adolesc Gynecol. 2007;20:105-108.

A 7-week-old boy with ambiguous genitalia presented for evaluation of what the parents described as progressively worsening diaper rash. The patient was born at full-term after an uncomplicated gestation via normal spontaneous vaginal delivery. Examination of the external genitalia revealed microphallus with phimosis and a bifid scrotum. Two weeks after birth, the patient developed redness and painful ulcerations in the diaper area. At the time of presentation, the patient had bright red plaques along the suprapubic lines, inguinal creases, and in the perineal region. Physical examination also was notable for tender ulcerations of the inguinal creases and perineum and a perineal skin tag.

Disseminated Superficial Actinic Porokeratosis Treated With Ingenol Mebutate Gel 0.05%
Disseminated superficial actinic porokeratosis (DSAP) is a chronic condition characterized by numerous atrophic papules and patches with a distinctive peripheral keratotic ridge, typically found on sun-exposed areas.1,2 Treatment of DSAP is warranted not only for cosmetic and symptomatic benefits but also to prevent malignant transformation.3,4 Successful treatment of DSAP often is difficult and frequently requires the use of multiple modalities. Ingenol mebutate gel 0.05% is a topical medication primarily used for the treatment of actinic keratosis (AK) by inducing cell death.5 We report a case of DSAP treated effectively with ingenol mebutate gel 0.05%.
Case Report
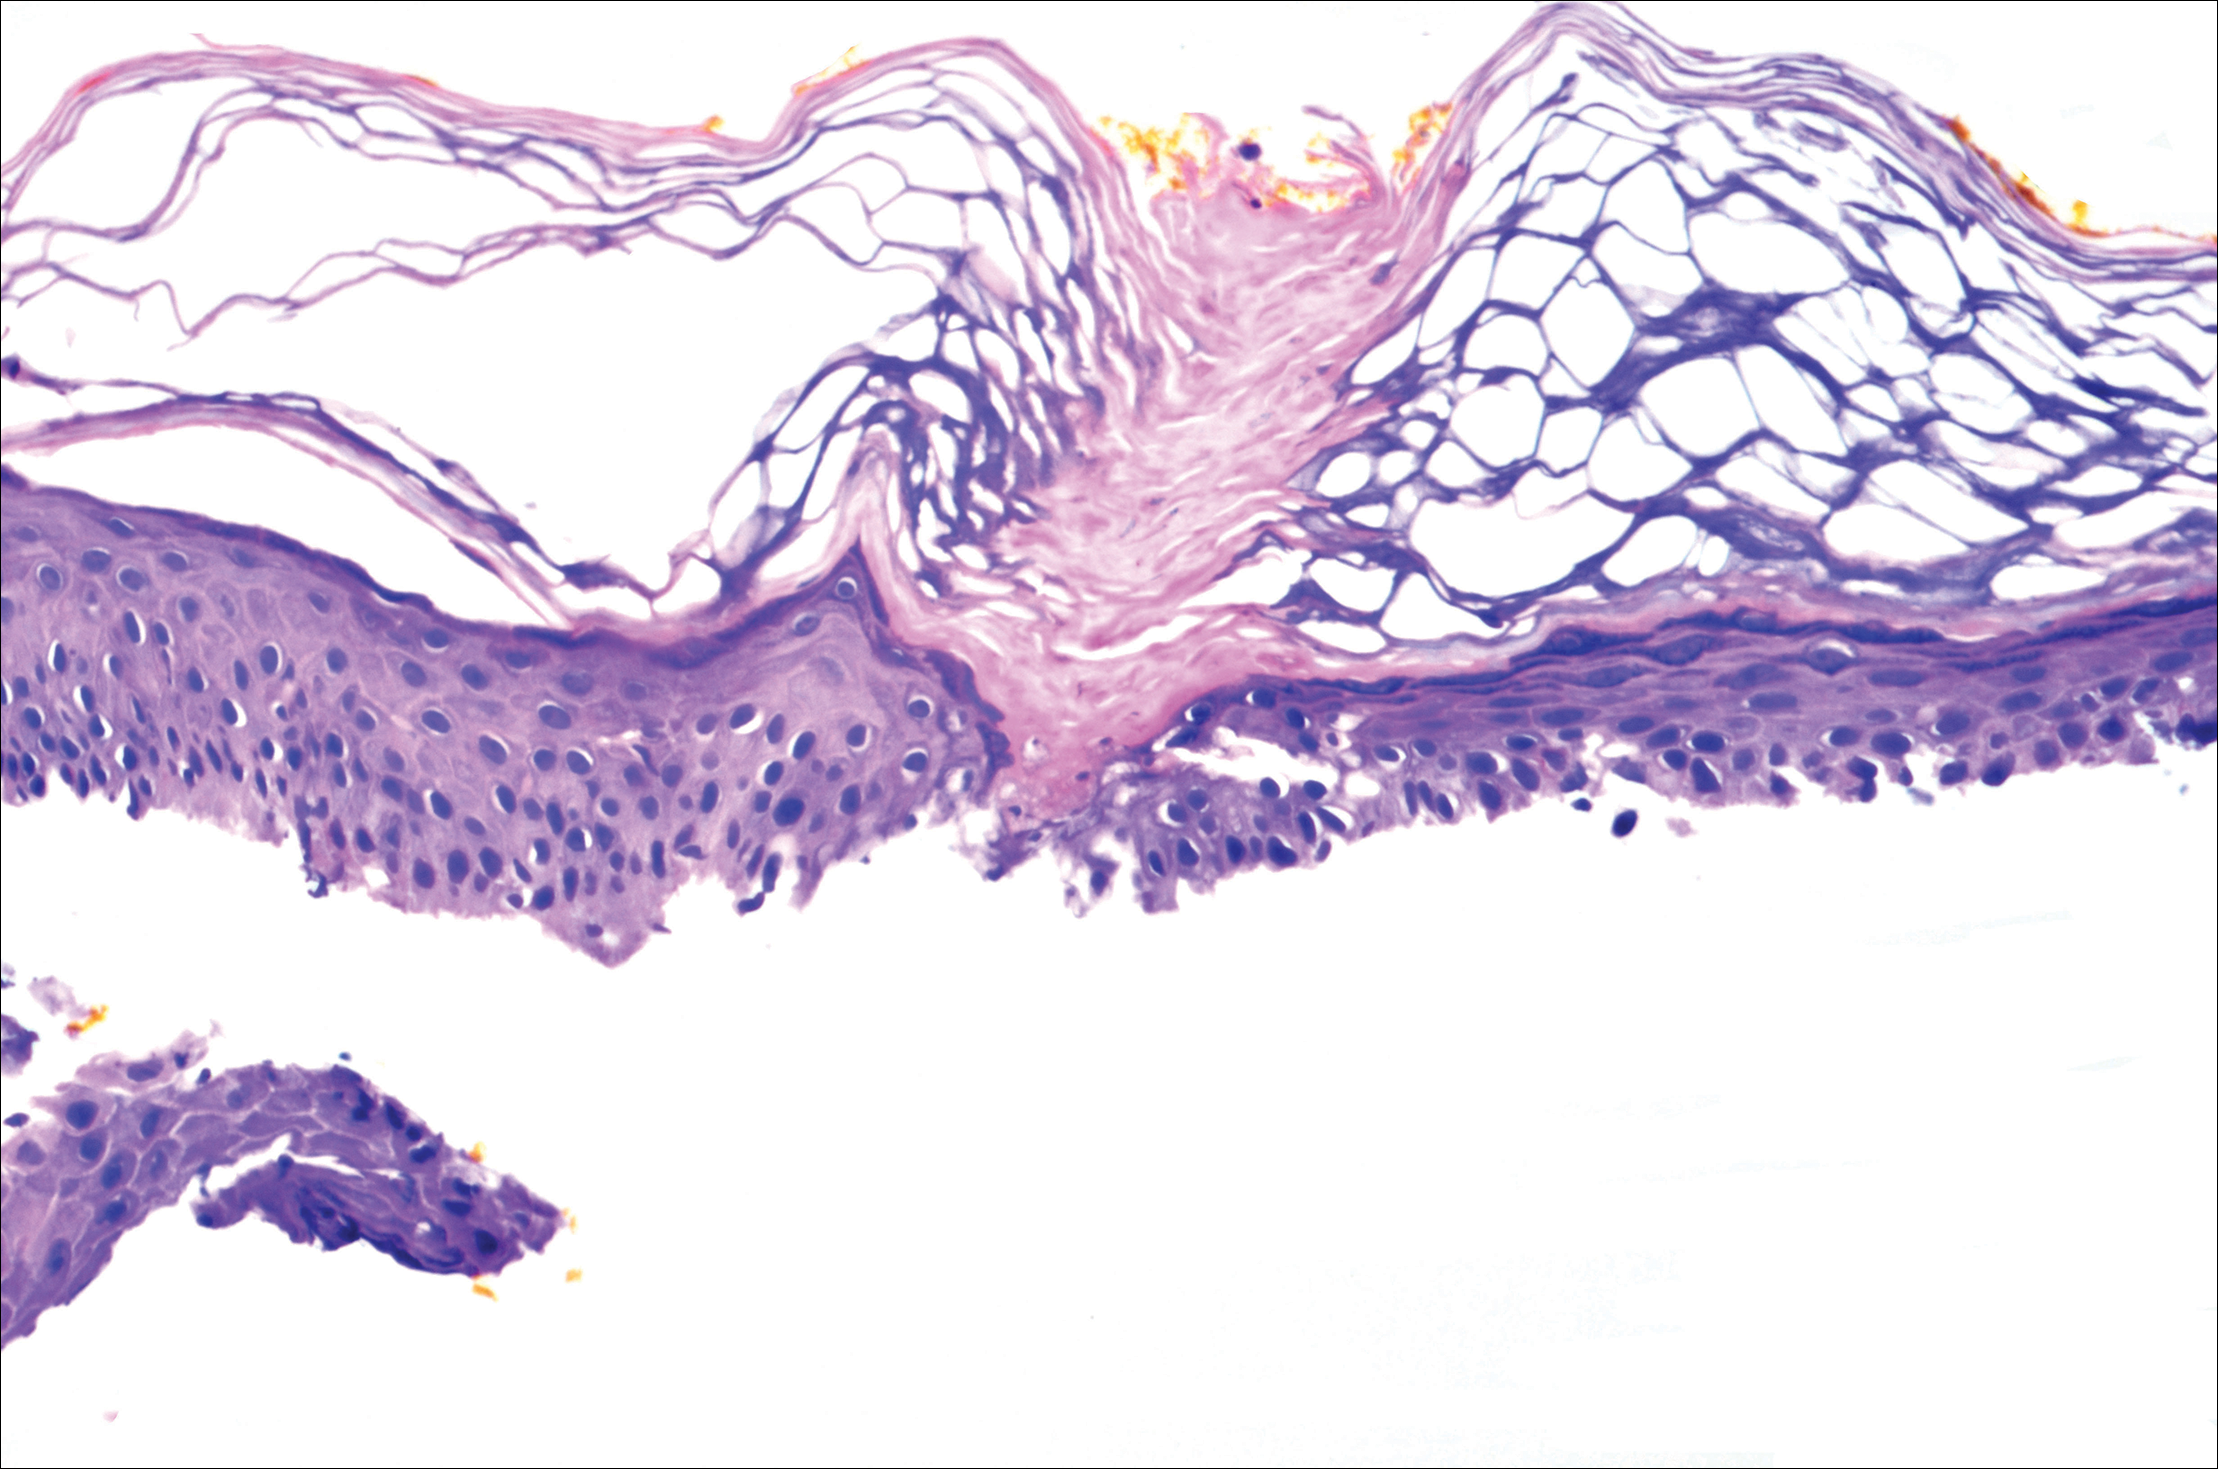
A 37-year-old woman was referred to the dermatology department for counseling for pseudoxanthoma elasticum (PXE), which had been proven on biopsy by an outside dermatologist 2 years prior. Physical examination revealed yellow papules on the neck that were characteristic of PXE, but no lesions were noted on the arms or legs. The only other cutaneous finding was a soft nodule on the right hip consistent with a lipoma. The patient returned to our institution 6 years later with lesions on both lower legs. She reported that these lesions had been present for 3 years and were exacerbated by sun exposure. On physical examination, multiple scattered, erythematous, annular, scaling papules and plaques were noted on the bilateral legs. A biopsy showed the histopathologic findings of DSAP (Figure 1). The patient had no family history of DSAP or PXE.
To determine the best treatment modality, we treated 4 test areas on both upper and lower legs: one with trichloroacetic acid (TCA), one with cryotherapy, one with imiquimod cream 5%, and one with tretinoin cream 0.1%. The patient returned 4 weeks later and showed modest response to TCA, cryotherapy, and tretinoin cream. Because cryotherapy was determined to be most effective, 20 more lesions were frozen at that visit. Over the next 2 years, the patient was treated with TCA, imiquimod cream 5%, and tretinoin cream 0.1%, but all ultimately proved ineffective for DSAP.
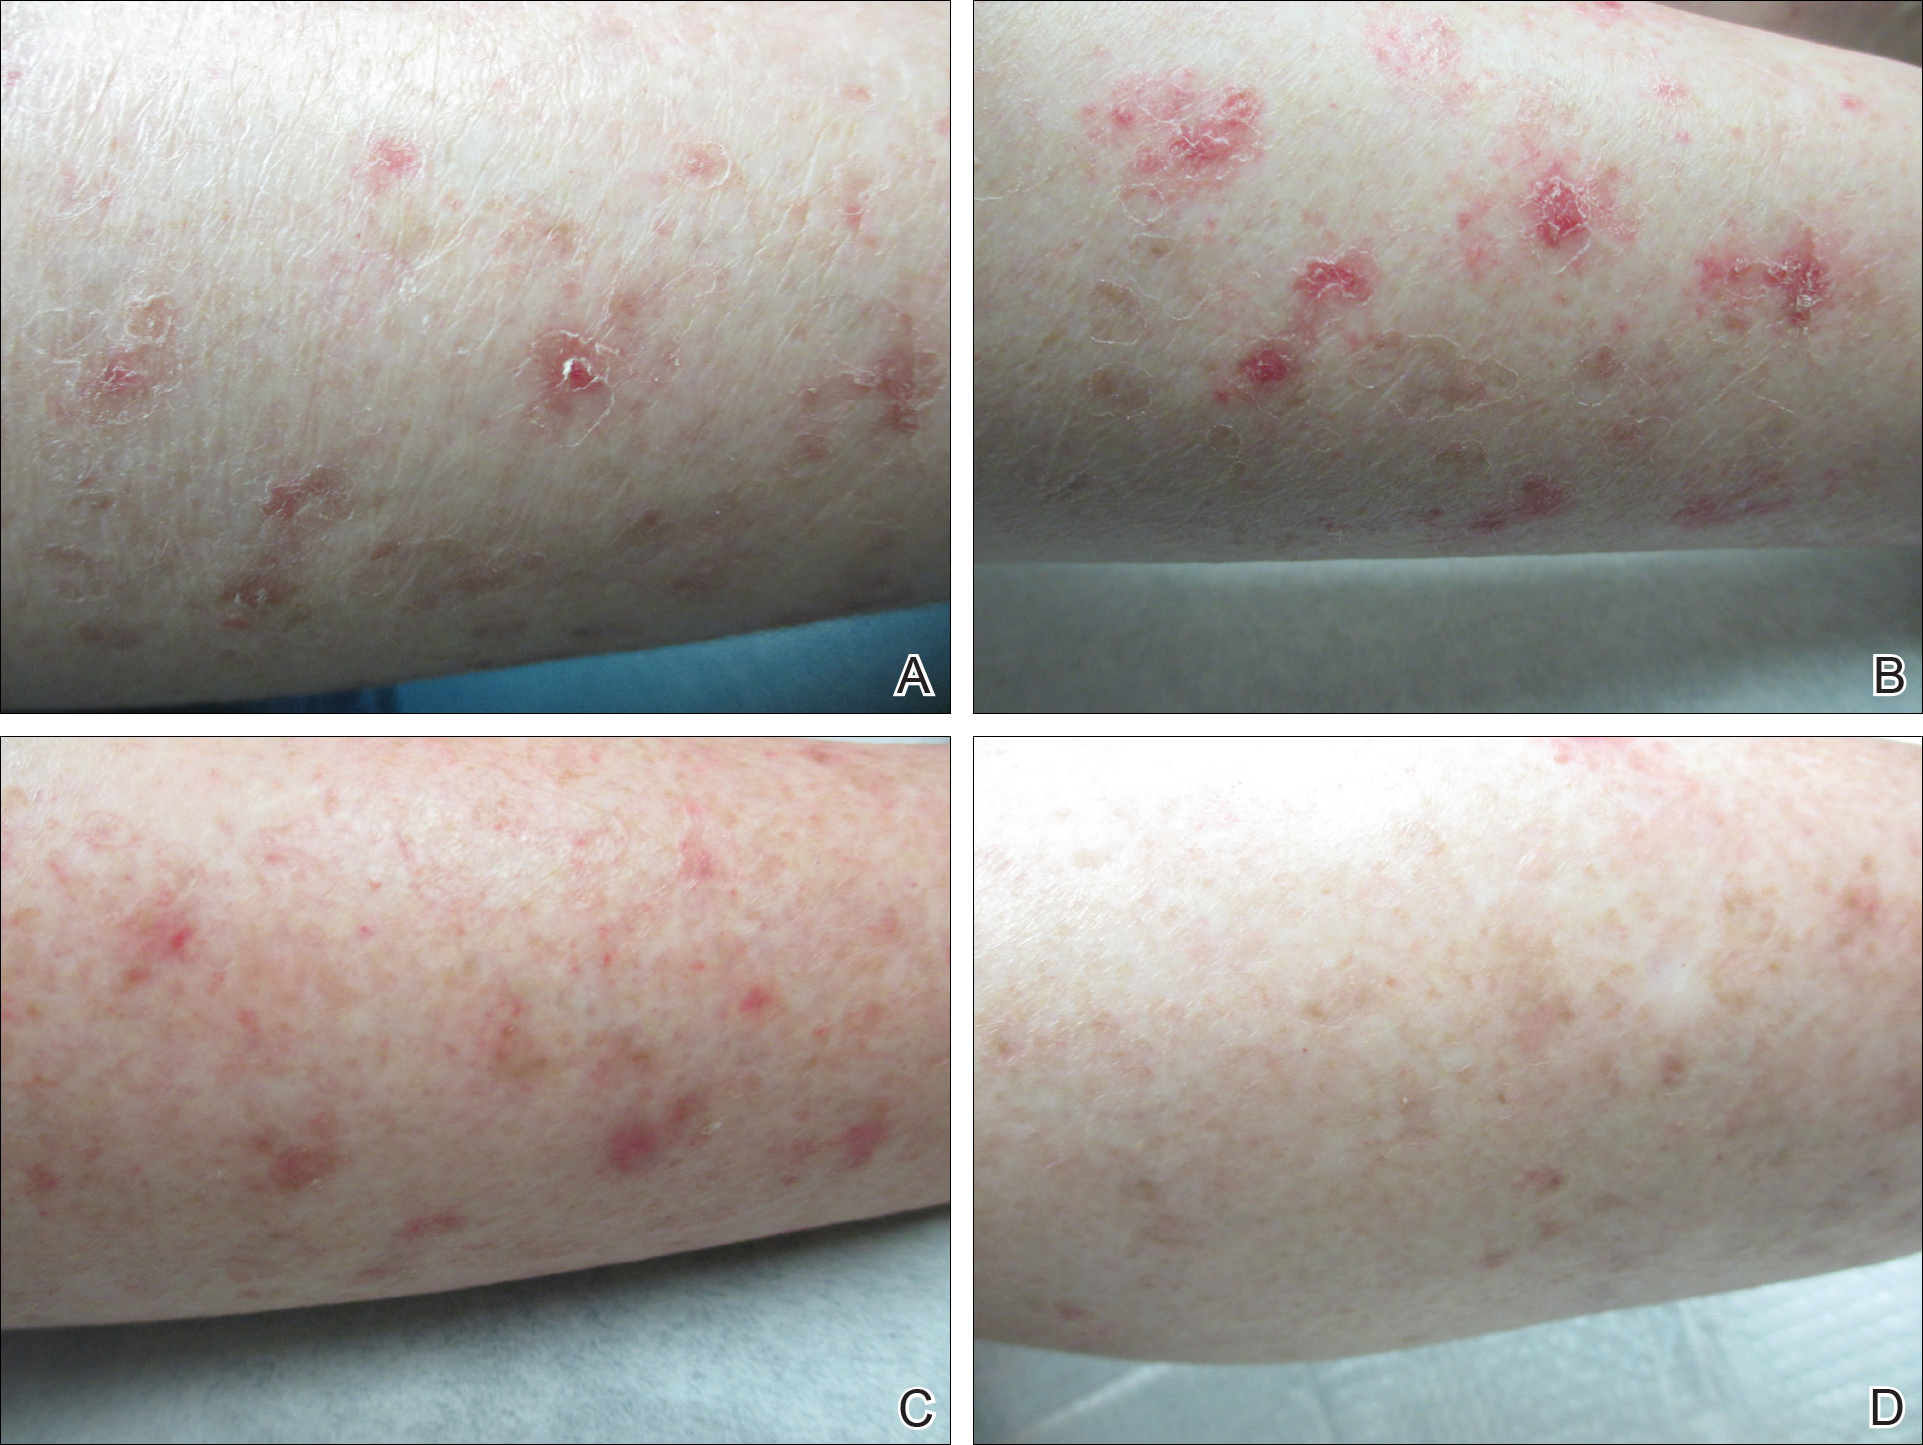
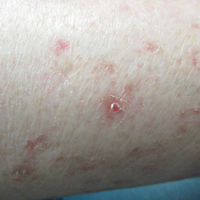
The patient returned 2 years after treatment failure (age 47 years) and was prescribed ingenol mebutate gel 0.05% for 2 days over an area of 25 cm2 on the right lower leg (Figure 2A). She returned for follow-up at days 3, 15, 30, and 60. At day 3, the patient developed an inflammatory response to the medication with moderate erythema and scaling of individual lesions. No vesiculation, pustulation, edema, or ulceration was exhibited (Figure 2B). At day 30, there was a marked reduction in scaling with some postinflammatory erythema (Figure 2C). At day 60, much of the erythema had faded and the scale remained notably reduced (Figure 2D).
Comment
Disseminated superficial actinic porokeratosis is the most common subtype of porokeratosis, a keratinization disorder. There are 6 subtypes of porokeratosis identified in the literature: DSAP, disseminated superficial porokeratosis, classic porokeratosis of Mibelli, porokeratosis plantaris palmaris et disseminata, linear porokeratosis, and punctate porokeratosis.6 Disseminated superficial actinic porokeratosis has a female predominance (1.8:1 ratio)7 and generally appears in the third or fourth decades of life. Clonal proliferations of atypical keratinocytes have been implicated in the etiology of DSAP; however, the exact pathogenesis is unclear. Risk factors for DSAP include genetic susceptibility (eg, autosomal-dominant inheritance pattern), exposure to UV radiation, and drug-related immunosuppression or immunodeficiency.7 Other proposed etiologic risk factors include trauma and infection.8 Clinical diagnosis of DSAP is confirmed by the histological presence of a cornoid lamella (a thin column ofparakeratotic cells), a thinning epidermis, an absent or thinned granular cell layer, and a prominent dermal lymphocytic infiltrate.9,10
Disseminated superficial actinic porokeratosis clinically presents as small atrophic scaly papules and/or patches with raised peripheral ridges symmetrically dispersed on sun-exposed areas of the arms, legs, back, and shoulders. Although these lesions are extensive, they typically spare the mucous membranes, palms, and soles11; only a small percentage of cases report facial lesions,12 which often are asymptomatic but cosmetically bothersome. Additionally, approximately half of patients report symptoms of pruritus and/or stinging,13 thus treatment of DSAP is mainly indicated for symptomatic relief and cosmetic purposes. Malignant degeneration14,15 occurs in approximately 7.5% to 11% of porokeratosis cases,10,16 warranting treatment for preventative measures.
Management of DSAP is dependent on the extent of the disease and the level of concern for malignant transformation. Localized disease can be treated with cryotherapy, CO2 laser, and/or ablative techniques (eg, excision, curettage, dermabrasion) with variable degrees of success but high risk for scarring.1 More extensive disease requires treatment with topical retinoids, topical 5-fluorouracil, imiquimod cream 5%, diclofenac gel 3%, topical vitamin D3 analogues, and photodynamic therapy.1 Several other therapies have been reported in the literature with partial and/or complete success, including systemic retinoids (eg, acitretin), Q-switched ruby laser, Nd:YAG laser, fractional photothermolysis, Grenz rays, pulsed dye laser, fractional photothermolysis, topical corticosteroids, and fluor-hydroxy pulse peel.6 Although there is an extensive array of therapies for DSAP, treatment results are variable with mostly limited success. Successful treatment of DSAP is difficult and often requires the use of multiple modalities.
Ingenol mebutate is the active compound found in the sap of Euphorbia peplus used for the topical treatment of various skin conditions, including AKs.17 Ingenol mebutate gel 0.05% once daily for 2 days has been approved by the US Food and Drug Administration for the topical treatment of AKs. The mechanism of action of ingenol mebutate in AK therapy is not yet fully understood. In vivo and in vitro models have demonstrated both an induction of local lesion cell death and promotion of lesion-specific inflammatory response.18 When used in the treatment of AKs, ingenol mebutate gel 0.05% may cause a mild to moderate localized inflammatory response (eg, erythema, flaking/scaling, crusting, vesiculation/pustulation, erosion/ulceration, edema).
Our case is a rare report of successful treatment of DSAP with ingenol mebutate gel 0.05%. We found that treatment with ingenol mebutate gel 0.05% resulted in clinical improvement of DSAP lesions with minimal discomfort and good cosmetic response. This 2-day regimen is easy to use and patient friendly, improving medication compliance in such a cumbersome disease. We hope this case suggests that ingenol mebutate gel 0.05% could be a useful treatment alternative for DSAP, but future clinical studies should be conducted.
- Martin-Clavijo A, Kanelleas A, Vlachou C, et al. Porokeratoses. In: Lebwohl M, Heymann WR, Berth-Jones J, et al, eds. Treatment of Skin Disease Comprehensive Therapeutic Strategies. 3rd ed. China: Elsevier Limited; 2010:584-586.
- Rouhani P, Fischer M, Meehan S, et al. Disseminated superficial actinic porokeratosis. Dermatology Online J. 2012;18:24.
- Sasson M, Krain AD. Porokeratosis and cutaneous malignancy. a review. Dermatol Surg. 1996;22:339-342.
- Lee HR, Han TY, Son SJ, et al. Squamous cell carcinoma developing within lesions of disseminated superficial actinic porokeratosis. Ann Dermatol. 2011;23:536-538.
- Lebwohl M, Swanson N, Anderson LL, et al. Ingenol mebutate gel for actinic keratosis. N Engl J Med. 2012;366:1010-1019.
- O’Regan GM, Irvine AD. Porokeratosis. In: Goldsmith LA, Katz SI, Gilchrest BA, et al, eds. Fitzpatrick’s Dermatology in General Medicine. 8th ed. New York, NY: McGraw-Hill Professional; 2012:442-446.
- Sertznig P, von Felbert V, Megahed M. Porokeratosis: present concepts. J Eur Acad Dermatol Venereol. 2012;26:404-412.
- Brauer JA, Mandal R, Walters R, et al. Disseminated superficial porokeratosis. Dermatology Online J. 2010;16:20.
- Tallon B. Porokeratosis pathology. DermNet New Zealand website. http://www.dermnet.org.nz/pathology/porokeratosis-path.html. Updated December 2016. Accessed January 12, 2017.
- Skupsky H, Skupsky J, Goldenberg G. Disseminated superficial actinic porokeratosis: a treatment review [published online October 22, 2010]. J Dermatolog Treat. 2012;23:52-56.
- Spencer LV. Porokeratosis. UpToDate web site. https://eresources.library.mssm.edu:3285/contents/porokeratosis?source=search_result&search=porokeratosis&selectedTitle=1~22. Updated September 1, 2016. Accessed April 3, 2017.
- Sawyer R, Picou KA. Facial presentation of disseminated superficial actinic porokeratosis. Ear Nose Throat J. 1989;68:57-59.
- Schwarz T, Seiser A, Gschnait F. Disseminated superficial “actinic” porokeratosis. J Am Acad Dermatol. 1984;11(4, pt 2):724-730.
- Maubec E, Duvillard P, Margulis A, et al. Common skin cancers in porokeratosis. Br J Dermatol. 2005;152:1389-1391.
- Lee HR, Han TY, Son SJ, et al. Squamous cell carcinoma developing within lesions of disseminated superficial actinic porokeratosis [published online November 3, 2011]. Ann Dermatol. 2011;23:536-538.
- Kumari S, Mathur M. Disseminated superficial actinic porokeratosis. Nepal J Dermatol Venereol Leprol. 2010;9:22-24.
- Lebwohl M, Shumack S, Stein Gold L, et al. Long-term follow-up study of ingenol mebutate gel for the treatment of actinic keratosis. JAMA Dermatol. 2013;149:666-670.
- Stahlhut M, Bertelsen M, Hoyer-Hansen M, et al. Ingenol mebutate: induced cell death patterns in normal and cancer epithelial cells. J Drugs Dermatol. 2012;11:1181-1192.
Disseminated superficial actinic porokeratosis (DSAP) is a chronic condition characterized by numerous atrophic papules and patches with a distinctive peripheral keratotic ridge, typically found on sun-exposed areas.1,2 Treatment of DSAP is warranted not only for cosmetic and symptomatic benefits but also to prevent malignant transformation.3,4 Successful treatment of DSAP often is difficult and frequently requires the use of multiple modalities. Ingenol mebutate gel 0.05% is a topical medication primarily used for the treatment of actinic keratosis (AK) by inducing cell death.5 We report a case of DSAP treated effectively with ingenol mebutate gel 0.05%.
Case Report
A 37-year-old woman was referred to the dermatology department for counseling for pseudoxanthoma elasticum (PXE), which had been proven on biopsy by an outside dermatologist 2 years prior. Physical examination revealed yellow papules on the neck that were characteristic of PXE, but no lesions were noted on the arms or legs. The only other cutaneous finding was a soft nodule on the right hip consistent with a lipoma. The patient returned to our institution 6 years later with lesions on both lower legs. She reported that these lesions had been present for 3 years and were exacerbated by sun exposure. On physical examination, multiple scattered, erythematous, annular, scaling papules and plaques were noted on the bilateral legs. A biopsy showed the histopathologic findings of DSAP (Figure 1). The patient had no family history of DSAP or PXE.
To determine the best treatment modality, we treated 4 test areas on both upper and lower legs: one with trichloroacetic acid (TCA), one with cryotherapy, one with imiquimod cream 5%, and one with tretinoin cream 0.1%. The patient returned 4 weeks later and showed modest response to TCA, cryotherapy, and tretinoin cream. Because cryotherapy was determined to be most effective, 20 more lesions were frozen at that visit. Over the next 2 years, the patient was treated with TCA, imiquimod cream 5%, and tretinoin cream 0.1%, but all ultimately proved ineffective for DSAP.
The patient returned 2 years after treatment failure (age 47 years) and was prescribed ingenol mebutate gel 0.05% for 2 days over an area of 25 cm2 on the right lower leg (Figure 2A). She returned for follow-up at days 3, 15, 30, and 60. At day 3, the patient developed an inflammatory response to the medication with moderate erythema and scaling of individual lesions. No vesiculation, pustulation, edema, or ulceration was exhibited (Figure 2B). At day 30, there was a marked reduction in scaling with some postinflammatory erythema (Figure 2C). At day 60, much of the erythema had faded and the scale remained notably reduced (Figure 2D).
Comment
Disseminated superficial actinic porokeratosis is the most common subtype of porokeratosis, a keratinization disorder. There are 6 subtypes of porokeratosis identified in the literature: DSAP, disseminated superficial porokeratosis, classic porokeratosis of Mibelli, porokeratosis plantaris palmaris et disseminata, linear porokeratosis, and punctate porokeratosis.6 Disseminated superficial actinic porokeratosis has a female predominance (1.8:1 ratio)7 and generally appears in the third or fourth decades of life. Clonal proliferations of atypical keratinocytes have been implicated in the etiology of DSAP; however, the exact pathogenesis is unclear. Risk factors for DSAP include genetic susceptibility (eg, autosomal-dominant inheritance pattern), exposure to UV radiation, and drug-related immunosuppression or immunodeficiency.7 Other proposed etiologic risk factors include trauma and infection.8 Clinical diagnosis of DSAP is confirmed by the histological presence of a cornoid lamella (a thin column ofparakeratotic cells), a thinning epidermis, an absent or thinned granular cell layer, and a prominent dermal lymphocytic infiltrate.9,10
Disseminated superficial actinic porokeratosis clinically presents as small atrophic scaly papules and/or patches with raised peripheral ridges symmetrically dispersed on sun-exposed areas of the arms, legs, back, and shoulders. Although these lesions are extensive, they typically spare the mucous membranes, palms, and soles11; only a small percentage of cases report facial lesions,12 which often are asymptomatic but cosmetically bothersome. Additionally, approximately half of patients report symptoms of pruritus and/or stinging,13 thus treatment of DSAP is mainly indicated for symptomatic relief and cosmetic purposes. Malignant degeneration14,15 occurs in approximately 7.5% to 11% of porokeratosis cases,10,16 warranting treatment for preventative measures.
Management of DSAP is dependent on the extent of the disease and the level of concern for malignant transformation. Localized disease can be treated with cryotherapy, CO2 laser, and/or ablative techniques (eg, excision, curettage, dermabrasion) with variable degrees of success but high risk for scarring.1 More extensive disease requires treatment with topical retinoids, topical 5-fluorouracil, imiquimod cream 5%, diclofenac gel 3%, topical vitamin D3 analogues, and photodynamic therapy.1 Several other therapies have been reported in the literature with partial and/or complete success, including systemic retinoids (eg, acitretin), Q-switched ruby laser, Nd:YAG laser, fractional photothermolysis, Grenz rays, pulsed dye laser, fractional photothermolysis, topical corticosteroids, and fluor-hydroxy pulse peel.6 Although there is an extensive array of therapies for DSAP, treatment results are variable with mostly limited success. Successful treatment of DSAP is difficult and often requires the use of multiple modalities.
Ingenol mebutate is the active compound found in the sap of Euphorbia peplus used for the topical treatment of various skin conditions, including AKs.17 Ingenol mebutate gel 0.05% once daily for 2 days has been approved by the US Food and Drug Administration for the topical treatment of AKs. The mechanism of action of ingenol mebutate in AK therapy is not yet fully understood. In vivo and in vitro models have demonstrated both an induction of local lesion cell death and promotion of lesion-specific inflammatory response.18 When used in the treatment of AKs, ingenol mebutate gel 0.05% may cause a mild to moderate localized inflammatory response (eg, erythema, flaking/scaling, crusting, vesiculation/pustulation, erosion/ulceration, edema).
Our case is a rare report of successful treatment of DSAP with ingenol mebutate gel 0.05%. We found that treatment with ingenol mebutate gel 0.05% resulted in clinical improvement of DSAP lesions with minimal discomfort and good cosmetic response. This 2-day regimen is easy to use and patient friendly, improving medication compliance in such a cumbersome disease. We hope this case suggests that ingenol mebutate gel 0.05% could be a useful treatment alternative for DSAP, but future clinical studies should be conducted.
- Martin-Clavijo A, Kanelleas A, Vlachou C, et al. Porokeratoses. In: Lebwohl M, Heymann WR, Berth-Jones J, et al, eds. Treatment of Skin Disease Comprehensive Therapeutic Strategies. 3rd ed. China: Elsevier Limited; 2010:584-586.
- Rouhani P, Fischer M, Meehan S, et al. Disseminated superficial actinic porokeratosis. Dermatology Online J. 2012;18:24.
- Sasson M, Krain AD. Porokeratosis and cutaneous malignancy. a review. Dermatol Surg. 1996;22:339-342.
- Lee HR, Han TY, Son SJ, et al. Squamous cell carcinoma developing within lesions of disseminated superficial actinic porokeratosis. Ann Dermatol. 2011;23:536-538.
- Lebwohl M, Swanson N, Anderson LL, et al. Ingenol mebutate gel for actinic keratosis. N Engl J Med. 2012;366:1010-1019.
- O’Regan GM, Irvine AD. Porokeratosis. In: Goldsmith LA, Katz SI, Gilchrest BA, et al, eds. Fitzpatrick’s Dermatology in General Medicine. 8th ed. New York, NY: McGraw-Hill Professional; 2012:442-446.
- Sertznig P, von Felbert V, Megahed M. Porokeratosis: present concepts. J Eur Acad Dermatol Venereol. 2012;26:404-412.
- Brauer JA, Mandal R, Walters R, et al. Disseminated superficial porokeratosis. Dermatology Online J. 2010;16:20.
- Tallon B. Porokeratosis pathology. DermNet New Zealand website. http://www.dermnet.org.nz/pathology/porokeratosis-path.html. Updated December 2016. Accessed January 12, 2017.
- Skupsky H, Skupsky J, Goldenberg G. Disseminated superficial actinic porokeratosis: a treatment review [published online October 22, 2010]. J Dermatolog Treat. 2012;23:52-56.
- Spencer LV. Porokeratosis. UpToDate web site. https://eresources.library.mssm.edu:3285/contents/porokeratosis?source=search_result&search=porokeratosis&selectedTitle=1~22. Updated September 1, 2016. Accessed April 3, 2017.
- Sawyer R, Picou KA. Facial presentation of disseminated superficial actinic porokeratosis. Ear Nose Throat J. 1989;68:57-59.
- Schwarz T, Seiser A, Gschnait F. Disseminated superficial “actinic” porokeratosis. J Am Acad Dermatol. 1984;11(4, pt 2):724-730.
- Maubec E, Duvillard P, Margulis A, et al. Common skin cancers in porokeratosis. Br J Dermatol. 2005;152:1389-1391.
- Lee HR, Han TY, Son SJ, et al. Squamous cell carcinoma developing within lesions of disseminated superficial actinic porokeratosis [published online November 3, 2011]. Ann Dermatol. 2011;23:536-538.
- Kumari S, Mathur M. Disseminated superficial actinic porokeratosis. Nepal J Dermatol Venereol Leprol. 2010;9:22-24.
- Lebwohl M, Shumack S, Stein Gold L, et al. Long-term follow-up study of ingenol mebutate gel for the treatment of actinic keratosis. JAMA Dermatol. 2013;149:666-670.
- Stahlhut M, Bertelsen M, Hoyer-Hansen M, et al. Ingenol mebutate: induced cell death patterns in normal and cancer epithelial cells. J Drugs Dermatol. 2012;11:1181-1192.
Practice Points
- Disseminated superficial actinic porokeratosis (DSAP) is an uncommon skin condition consisting of multiple annular hyperkeratotic lesions on sun-exposed areas.
- Treatment of DSAP is necessary due to its potential for progression to malignancy.
- Consider ingenol mebutate gel 0.05% for the treatment of DSAP on the arms and legs.
MAGNIFY in relapsed/refractory mantle cell lymphoma
MAGNIFY is a phase IIIB randomized trial actively recruiting patients with relapsed/refractory mantle cell lymphoma, based on studies posted at ClinicalTrials.gov.
MAGNIFY (NCT01996865) is a study of lenalidomide (CC-5013) plus rituximab maintenance therapy, followed by lenalidomide single-agent maintenance therapy, versus rituximab. Sponsored by Celgene, the maker of lenalidomide (Revlimid), the trial’s primary outcome measure is progression-free survival at up to 8 years.
The MAGNIFY trial includes patients with grades 1-3b or transformed follicular lymphoma, marginal zone lymphoma, or mantle cell lymphoma who had received at least one prior therapy and had stage I-IV measurable disease. About 500 patients are planned to enroll in 12 cycles of R2 induction, and slightly more than 300 patients are projected to be randomized after induction to the two maintenance arms. Induction includes oral lenalidomide 20 mg/day, days 1-21 per 28-day cycle; plus intravenous rituximab 375 mg/m2 on days 1, 8, 15, and 22 of cycle 1 and day 1 of cycles 3, 5, 7, 9, and 11 (28-day cycles).
Patients will then be randomized to maintenance lenalidomide 10 mg/day, given on days 1-21 per 28-day cycle for cycles 13-30; plus rituximab 375 mg/m2, given on day 1 of cycles 13, 15, 17, 19, 21, 23, 25, 27, and 29 (R2, Arm A), or rituximab alone (same schedule, Arm B). Patients receiving R2 maintenance after 18 cycles may continue maintenance lenalidomide monotherapy at 10 mg/day, days 1-21 per 28-day cycle, at the discretion of the patient and/or investigator, until disease progression as tolerated.
The primary endpoint is progression-free survival. Secondary endpoints include safety, overall survival, response rates, duration of response, and quality of life. Patients will be followed for at least 5 years after the last patient-initiated induction therapy. Enrollment in MAGNIFY began in March 2014; as of January 2016, 133 patients are enrolled, according to the study page at ClinicalTrials.gov.
Neoadjuvant chemoradiation may give transplant the edge over resection in biliary cancer
MIAMI BEACH – Survival for patients with hilar cholangiocarcinoma was similar between those who underwent transplantation and those who underwent resection, but neoadjuvant therapy may give transplant strategy the edge, findings of a study and meta-analysis suggest.
“Neoadjuvant chemoradiation therapy is clearly a factor that affects patient survival, and may be the only reason the patients who received transplantation had better overall survival than [did those who had] resection,” Michele Gage, MD, a general surgeon at Johns Hopkins Medicine in Baltimore, said at the annual meeting of the Americas Hepato-Pancreato-Biliary Association.
“We found survival in the group that received neoadjuvant chemoradiation therapy and transplant had a statistically significantly better outcome compared to a control group of resection,” Dr. Gage said. More importantly, patients who received a transplant without neoadjuvant therapy had a statistically significant worse outcome than patients who got resection alone.”
The investigators noted that patient selection for neoadjuvant therapy might also be a factor contributing to superior overall survival. In a multicenter study of 147 patients undergoing liver transplantation for hilar cholangiocarcinoma, a subgroup of patients who met the selection criteria of the Mayo Clinic protocol but had not undergone neoadjuvant therapy had a 59% 5-year survival rate (PLoS One. 2016:11:e0156127).
Study discussant Maria B. Majella Doyle, MD, a general surgeon at Washington University in St. Louis, agreed that patient selection for transplantation is a likely factor.
Dr. Doyle then asked Dr. Gage how she accounts for the heterogeneity among studies performed over a 20-year period.
“That is why we did subgroup analysis of neoadjuvant versus no neoadjuvant therapy,” Dr. Gage replied.
In the future, an intent-to-treat analysis might be more accurate, Dr. Majella Doyle said, because more patients are placed on a liver transplant list than typically have the procedure.
Dr. Gage noted that 28%-48% of patients started on neoadjuvant therapy in the two studies that offered both neoadjuvant therapy and a transplant in the meta-analysis never made it to transplantation. When they were included, overall survival dropped to approximately 35% in one study and 44% in the other.
In the primary meta-analysis (before the subanalysis looking at neoadjuvant therapy), 398 patients underwent resection and another 200 underwent liver transplantation between 1996 and 2106. Patient demographics were similar between groups, including more men than women, except the average age in the resection group was older, Dr. Gage said.
Overall survival favored the transplant group at each time point: 78% versus 70% with resection at 1 year; 56% versus 42% at 3 years; and 46% versus 29% at 5 years. The odds ratios, respectively, were 1.27, 1.49 and 1.83, but the findings were not statistically significant at a 95% confidence interval.
Margin involvement was 9% in the transplant patients versus 32% in the resection patients, Dr. Gage said. The best chance of cure is R0 resection, but half of patients with hilar cholangiocarcinoma, the most common cancer of the biliary tract, are unresectable, she added.
Six of the nine studies in the meta-analysis reported margin status. Of the 344 patients in these studies, 79% achieved R0 status overall.
“The goal of treatment is R0 resection,” Dr. Gage said in response to a question about when neoadjuvant therapy is warranted. “In the patients who are resectable, I think the correct answer would be to proceed with resection. However, for those patients who are borderline resectable, it would be reasonable to consider neoadjuvant therapy.”
“One of the major things that is undervalued is neoadjuvant therapy allows better patient selection,” said session moderator Eric Jensen, MD, FACS, of University of Minnesota Health in Minneapolis. “When you say an obviously resectable tumor, when you look at the data – we’re wrong 30% of the time. So I’m in favor of neoadjuvant therapy for everybody, but that is just my bias.”
The small number of studies is a limitation of the study, Dr. Gage said. Also, all the studies were nonrandomized and retrospective, and some research spanned many years, which could introduce bias because of changes in practice over time, she added.
Based on their findings, the investigators proposed that future studies explore routine administration of neoadjuvant therapy prior to resection.
Dr. Gage and Dr. Majella Doyle had no relevant financial disclosures.
AT AHPBA 2017
Predicting extraction of an intact uterus in robotic-assisted laparoscopic hysterectomy
SAN ANTONIO – Investigators at the University of Tennessee, Chattanooga, have come up with a simple scoring system to predict if an intact uterus can be delivered vaginally during laparoscopic hysterectomy.
Age greater than 50 years counts as 1 point and uterine length greater than 11 cm, height greater than 8 cm, and width greater than 6.9 cm each count for 3 points. A score of 4 or higher suggests the need for an alternative to vaginal extraction, they reported at the annual scientific meeting of the Society of Gynecologic Surgeons.

The team reviewed 367 robotic-assisted total laparoscopic hysterectomies. An intact uterus was able to be extracted vaginally in 265 cases (72%); minilaparotomy was used for the rest. Uterine length, height, and width were documented from pathology reports. The scoring system correctly classified 94.6% of the cases. Sensitivity was 85.3%, specificity was 98.1%, positive predictive value was 94.57%, and negative predictive value was 94.55%.
Factoring in parity, uterine weight, body mass index, procedure indications, tobacco use, and comorbidities did not statistically influence the predictive power.
Gynecologic surgeons “are trying to get specimens out intact” and want to know ahead of time if it’s possible, Dr. Mohling said. “I wanted to create a model that was very reproducible.”
The general benchmark for vaginal delivery of an intact uterus is size below 12 weeks pregnancy, but the University of Tennessee model is more precise, according to Dr. Mohling. “I’ve added this to my counseling,” she said.
There was no external funding for the work and the investigators reported having no relevant financial disclosures.
* The meeting sponsor information was updated 6/9/2017.
SAN ANTONIO – Investigators at the University of Tennessee, Chattanooga, have come up with a simple scoring system to predict if an intact uterus can be delivered vaginally during laparoscopic hysterectomy.
Age greater than 50 years counts as 1 point and uterine length greater than 11 cm, height greater than 8 cm, and width greater than 6.9 cm each count for 3 points. A score of 4 or higher suggests the need for an alternative to vaginal extraction, they reported at the annual scientific meeting of the Society of Gynecologic Surgeons.
The team reviewed 367 robotic-assisted total laparoscopic hysterectomies. An intact uterus was able to be extracted vaginally in 265 cases (72%); minilaparotomy was used for the rest. Uterine length, height, and width were documented from pathology reports. The scoring system correctly classified 94.6% of the cases. Sensitivity was 85.3%, specificity was 98.1%, positive predictive value was 94.57%, and negative predictive value was 94.55%.
Factoring in parity, uterine weight, body mass index, procedure indications, tobacco use, and comorbidities did not statistically influence the predictive power.
Gynecologic surgeons “are trying to get specimens out intact” and want to know ahead of time if it’s possible, Dr. Mohling said. “I wanted to create a model that was very reproducible.”
The general benchmark for vaginal delivery of an intact uterus is size below 12 weeks pregnancy, but the University of Tennessee model is more precise, according to Dr. Mohling. “I’ve added this to my counseling,” she said.
There was no external funding for the work and the investigators reported having no relevant financial disclosures.
* The meeting sponsor information was updated 6/9/2017.
AT SGS 2017
Key clinical point:
Major finding: The sensitivity of the scoring system was 85.3%, specificity was 98.1%, positive predictive value was 94.57%, and negative predictive value was 94.55%.
Data source: Single-center review of 367 robotic total laparoscopic hysterectomies during 2012-2015.
Disclosures: There was no external funding for the work, and the investigators reported having no relevant financial disclosures.
Don’t ask
You walk into an examining room and discover a 3-year-old in his underpants wearing a fireman’s hat and what must be his older sister’s rubber boots. You have to ask: “Are you going to be a firefighter when you grow up?” If he is a sensitive kid he will resist answering, “What do you think, Dr. Obvious?” and instead he politely replies, “Yes, and an EMT [emergency medical technician] too.”
Adults, even ones who have devoted their professional lives to the care of children, can’t seem to stifle the urge ask every young person they meet about his or her career plans. It is a strange sort of obsession, and may simply reflect the fact that most adults are at a loss for conversation starters when it comes to talking with young people. Children don’t seem to have much concern about the weather. And most of them don’t have opinions about the current political situation. They don’t have stories about their grandchildren they would love to bore you with. You could ask if the child has a pet, but that may be picking the scab of an unresolved family issue.

Most adults realize that their career plans prior to adolescence have no relationship to their present situation. Thinking back on this disconnect in their own lives may provide them with a good chuckle. But they also may hope to store away the child’s naive answer as ammunition for a future embarrassing challenge. “Do you remember that you once told me you were going to be a forest ranger?”
It may be that the child’s answer will give the adults an opportunity to share their “wisdom” based on their own career decisions. How lucky for the child who has stumbled on an unsolicited life coach.
For the most part, these interrogations about career planning are just idle banter. But as children get older, reality begins shining its harsh light on choices and decisions. What was once a seemingly harmless question about the distant future may no longer be so innocuous. I try to sound apologetic when I say to high school juniors and seniors, “I’m sure everyone is asking you, but what about college?” However, after reading a story in The Wall Street Journal, I now wonder whether I should be skipping the apology and just simply not raising the subject of college (“What’s Worse Than Waiting to Hear From Colleges? Getting Interrogated About It,” by Sue Shellenbarger, March 8, 2017).
In communities where most high school graduates have been on a college track since middle school, tension and anxiety hangs over the older adolescents like a cloud that darkens as application deadlines herald the long and painful wait for acceptance/rejection letters and emails. High school seniors are tired of thinking about the process and certainly don’t want to talk about. They consider questions about their future an invasion of their privacy. Redbubble, an online marketplace based in Australia, is seeing rising sales of T-shirts that read “Don’t ask me about college. Thanks.”
The unwelcome interrogations don’t stop with college acceptance. Adults want to know, “Have you chosen a major?” And as college graduation nears they can’t resist asking, “Do you have any job offers?”
Most adolescents and many 20-somethings don’t seem to have a career goal. It may be that they are afraid that the process of setting a goal will make them more vulnerable to failure. It also may be that revealing, “I’ve always wanted to be a ...” will label them as being a bit childish and weird.
Where does all this adolescent discomfort with the near future leave us pediatricians? The complete evaluation of a high school–age patient should include a question or questions about how our patient is weathering the college and career planning process. The challenge is how to present those questions in a manner that makes it clear that we aren’t just another one of those career-obsessed nosy adults.
Dr. Wilkoff practiced primary care pediatrics in Brunswick, Maine for nearly 40 years. He has authored several books on behavioral pediatrics, including “How to Say No to Your Toddler.” Email him at [email protected].
You walk into an examining room and discover a 3-year-old in his underpants wearing a fireman’s hat and what must be his older sister’s rubber boots. You have to ask: “Are you going to be a firefighter when you grow up?” If he is a sensitive kid he will resist answering, “What do you think, Dr. Obvious?” and instead he politely replies, “Yes, and an EMT [emergency medical technician] too.”
Adults, even ones who have devoted their professional lives to the care of children, can’t seem to stifle the urge ask every young person they meet about his or her career plans. It is a strange sort of obsession, and may simply reflect the fact that most adults are at a loss for conversation starters when it comes to talking with young people. Children don’t seem to have much concern about the weather. And most of them don’t have opinions about the current political situation. They don’t have stories about their grandchildren they would love to bore you with. You could ask if the child has a pet, but that may be picking the scab of an unresolved family issue.
Most adults realize that their career plans prior to adolescence have no relationship to their present situation. Thinking back on this disconnect in their own lives may provide them with a good chuckle. But they also may hope to store away the child’s naive answer as ammunition for a future embarrassing challenge. “Do you remember that you once told me you were going to be a forest ranger?”
It may be that the child’s answer will give the adults an opportunity to share their “wisdom” based on their own career decisions. How lucky for the child who has stumbled on an unsolicited life coach.
For the most part, these interrogations about career planning are just idle banter. But as children get older, reality begins shining its harsh light on choices and decisions. What was once a seemingly harmless question about the distant future may no longer be so innocuous. I try to sound apologetic when I say to high school juniors and seniors, “I’m sure everyone is asking you, but what about college?” However, after reading a story in The Wall Street Journal, I now wonder whether I should be skipping the apology and just simply not raising the subject of college (“What’s Worse Than Waiting to Hear From Colleges? Getting Interrogated About It,” by Sue Shellenbarger, March 8, 2017).
In communities where most high school graduates have been on a college track since middle school, tension and anxiety hangs over the older adolescents like a cloud that darkens as application deadlines herald the long and painful wait for acceptance/rejection letters and emails. High school seniors are tired of thinking about the process and certainly don’t want to talk about. They consider questions about their future an invasion of their privacy. Redbubble, an online marketplace based in Australia, is seeing rising sales of T-shirts that read “Don’t ask me about college. Thanks.”
The unwelcome interrogations don’t stop with college acceptance. Adults want to know, “Have you chosen a major?” And as college graduation nears they can’t resist asking, “Do you have any job offers?”
Most adolescents and many 20-somethings don’t seem to have a career goal. It may be that they are afraid that the process of setting a goal will make them more vulnerable to failure. It also may be that revealing, “I’ve always wanted to be a ...” will label them as being a bit childish and weird.
Where does all this adolescent discomfort with the near future leave us pediatricians? The complete evaluation of a high school–age patient should include a question or questions about how our patient is weathering the college and career planning process. The challenge is how to present those questions in a manner that makes it clear that we aren’t just another one of those career-obsessed nosy adults.
Dr. Wilkoff practiced primary care pediatrics in Brunswick, Maine for nearly 40 years. He has authored several books on behavioral pediatrics, including “How to Say No to Your Toddler.” Email him at [email protected].
Number of U.S. Zika-infected pregnancies tops 5,100
Almost 200 cases of pregnant women with Zika virus infection were reported in the United States during the 2 weeks ending March 28, with the number split evenly between the territories and the 50 states and Washington, D.C., according to the Centers for Disease Control and Prevention.
These latest 197 cases – 98 in the territories and 99 in the states/D.C. – bring the U.S. total since the beginning of 2016 to 5,177 pregnant women with laboratory evidence of Zika virus infection: 3,461 in the U.S. territories and 1,716 in the states/D.C., the CDC reported on April 6.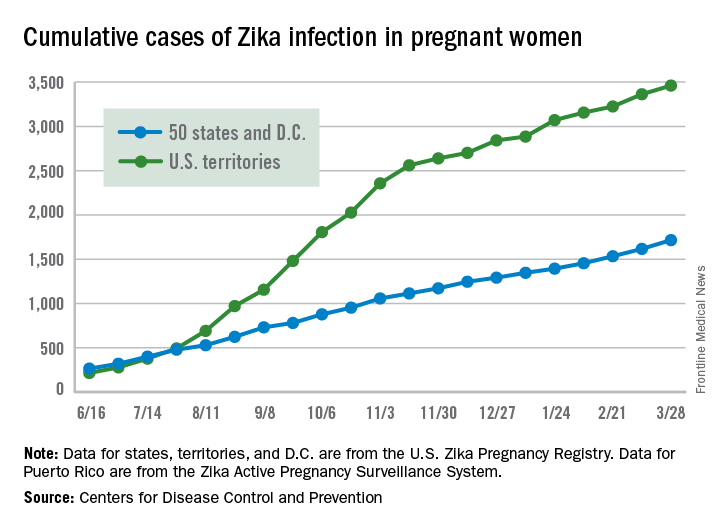
Since Jan. 1, 2015, a total of 41,701 cases of Zika virus infection have been reported among all Americans: 5,197 in the states/D.C. and 36,504 in the territories. Almost all of the territorial cases (97%) have occurred in Puerto Rico, while Florida (21%), New York (20%), and California (9%) together have accounted for half of the cases in the states/D.C., the CDC said.
These are not real-time data and reflect only pregnancy outcomes for women with any laboratory evidence of possible Zika virus infection, although it is not known if Zika virus was the cause of the poor outcomes. Zika-related birth defects recorded by the CDC could include microcephaly, calcium deposits in the brain indicating possible brain damage, excess fluid in the brain cavities and surrounding the brain, absent or poorly formed brain structures, abnormal eye development, or other problems resulting from brain damage that affect nerves, muscles, and bones. The pregnancy losses encompass any miscarriage, stillbirth, or termination with evidence of birth defects.
Evidence for medical marijuana largely up in smoke
SAN DIEGO – Despite the popularity of medical marijuana, robust evidence for its use is limited or nonexistent for most medical conditions.
“This is a tough subject to study,” Ellie Grossman, MD, said at the annual meeting of the American College of Physicians. “There is federal money that can only be used in very limited ways to study it. Our science is way behind the times in terms of what our patients are doing and using.”
Typical limitations of marijuana studies include self-report of quantity/duration used and the fact that biochemical/quantifiable measures are lacking. “For inhaled marijuana, there is variability in how much is inhaled and how deeply it’s being inhaled,” said Dr. Grossman, an internist who practices in Somerville, Mass.

Then there’s the issue of recall bias and the question as to whether oral cannabinoids equate to the plant-derived forms of medical marijuana that patients obtain from their local dispensaries.
That matters, because the majority of published studies on the topic have evaluated oral cannabinoids, not the plant form. “So, what we’re studying is vastly different from what our patients are using,” she said.
The most solid indication clinicians have for recommending medical marijuana is for chronic pain, and the most common condition studied has been neuropathy.
“Most evidence compares cannabinoid to placebo,” said Dr. Grossman, primary care lead for behavioral health integration at Cambridge (Mass.) Health Alliance. “There’s almost nothing out there comparing cannabinoid to any other pain-relieving agent that a patient might choose to use.
“A lot of the literature comes from oral synthesized agents,” she continued. “There’s a little bit of science about inhaled forms, but a lot of this is very different from what my patient got last week in a medical marijuana dispensary in Massachusetts.”
Results from a systematic review of 79 studies of cannabinoids for medical use in 6,462 study participants showed that, compared with placebo, cannabinoids were associated with a greater average number of patients showing a complete nausea and vomiting response (47% vs. 20%; odds ratio, 3.82), reduction in pain (37% vs. 31%; OR, 1.41), a greater average reduction in numerical rating scale pain assessment (on a 0- to 10-point scale; weighted mean difference of –0.46), and average reduction in the Ashworth spasticity scale (–0.36) (JAMA 2015 Jun 23-30;313[24]:2456-73).
A separate meta-analysis of studies compared inhaled cannabis sativa to placebo for chronic painful neuropathy. The researchers found that those patients who used inhaled cannabis sativa were 3.2 times more likely to achieve a 30% or greater reduction in pain, compared with those in the placebo group (J. Pain 2015 Dec;16[12]:1221-32).
However, Dr. Grossman cautioned that the number of patients studied was fewer than 200, “so, you could argue that this is a body of knowledge where the jury is still out.”
According to a 2017 report from the National Academy of Sciences titled, “The Health Effects of Cannabis and Cannabinoids,” another area in which the knowledge base is less solid is the use of oral cannabinoids for chemotherapy-induced nausea and vomiting.
“There’s a reasonable amount of evidence showing that some of these are better than placebo for relief of these symptoms,” Dr. Grossman said. “That said, the jury’s out as to whether they are any better than our other antiemetic agents. And there are no studies comparing them to neurokinin-1 inhibitors, which are the newest class of drug often used by oncologists for this indication. There is also no good evidence about inhaled plant cannabis.”
Studies of oral cannabinoids for multiple-sclerosis–related spasticity have demonstrated a small improvement on patient-reported spasticity (less than 1 point on a 10-point scale), but there was no improvement in clinician-reported outcomes. At the same time, their use for weight loss/anorexia in HIV “is very limited, and there are no studies of plant-derived cannabis,” Dr. Grossman said.
According to the National Academy of Sciences report, some evidence supports the use of oral cannabinoids for short-term sleep outcomes in patients with chronic diseases such as fibromyalgia and MS. One small study of oral cannabinoid for anxiety found that it improved social anxiety symptoms on the public speaking test, but there have been no studies using inhaled cannabinoids/marijuana.
The health risks of medical marijuana are largely unknown, Dr. Grossman said, noting that most evidence on longer‐term health risks comes from epidemiologic studies of recreational cannabis users.
“Medical marijuana users tend to be older and tend to be sicker,” she said. “We don’t know anything about the long-term effects in that sicker population.”
Among healthier people, Dr. Grossman continued, cannabis use is associated with increased risk of cough, wheeze, and sputum/phlegm. “There’s also an increased risk of motor vehicle accidents,” she said. “That is certainly a concern in places where they’re legalizing marijuana.”
Cannabis use is associated with lower neonatal birth weight, case reports/series of unintentional pediatric ingestions, and a possible increase in suicidal ideation, suicide attempts, and completed suicides.
“The evidence is very limited regarding associations with myocardial infarction, stroke, COPD, and mortality,” she added. “We don’t really know.”
Dr. Grossman reported having no financial disclosures.
SAN DIEGO – Despite the popularity of medical marijuana, robust evidence for its use is limited or nonexistent for most medical conditions.
“This is a tough subject to study,” Ellie Grossman, MD, said at the annual meeting of the American College of Physicians. “There is federal money that can only be used in very limited ways to study it. Our science is way behind the times in terms of what our patients are doing and using.”
Typical limitations of marijuana studies include self-report of quantity/duration used and the fact that biochemical/quantifiable measures are lacking. “For inhaled marijuana, there is variability in how much is inhaled and how deeply it’s being inhaled,” said Dr. Grossman, an internist who practices in Somerville, Mass.
Then there’s the issue of recall bias and the question as to whether oral cannabinoids equate to the plant-derived forms of medical marijuana that patients obtain from their local dispensaries.
That matters, because the majority of published studies on the topic have evaluated oral cannabinoids, not the plant form. “So, what we’re studying is vastly different from what our patients are using,” she said.
The most solid indication clinicians have for recommending medical marijuana is for chronic pain, and the most common condition studied has been neuropathy.
“Most evidence compares cannabinoid to placebo,” said Dr. Grossman, primary care lead for behavioral health integration at Cambridge (Mass.) Health Alliance. “There’s almost nothing out there comparing cannabinoid to any other pain-relieving agent that a patient might choose to use.
“A lot of the literature comes from oral synthesized agents,” she continued. “There’s a little bit of science about inhaled forms, but a lot of this is very different from what my patient got last week in a medical marijuana dispensary in Massachusetts.”
Results from a systematic review of 79 studies of cannabinoids for medical use in 6,462 study participants showed that, compared with placebo, cannabinoids were associated with a greater average number of patients showing a complete nausea and vomiting response (47% vs. 20%; odds ratio, 3.82), reduction in pain (37% vs. 31%; OR, 1.41), a greater average reduction in numerical rating scale pain assessment (on a 0- to 10-point scale; weighted mean difference of –0.46), and average reduction in the Ashworth spasticity scale (–0.36) (JAMA 2015 Jun 23-30;313[24]:2456-73).
A separate meta-analysis of studies compared inhaled cannabis sativa to placebo for chronic painful neuropathy. The researchers found that those patients who used inhaled cannabis sativa were 3.2 times more likely to achieve a 30% or greater reduction in pain, compared with those in the placebo group (J. Pain 2015 Dec;16[12]:1221-32).
However, Dr. Grossman cautioned that the number of patients studied was fewer than 200, “so, you could argue that this is a body of knowledge where the jury is still out.”
According to a 2017 report from the National Academy of Sciences titled, “The Health Effects of Cannabis and Cannabinoids,” another area in which the knowledge base is less solid is the use of oral cannabinoids for chemotherapy-induced nausea and vomiting.
“There’s a reasonable amount of evidence showing that some of these are better than placebo for relief of these symptoms,” Dr. Grossman said. “That said, the jury’s out as to whether they are any better than our other antiemetic agents. And there are no studies comparing them to neurokinin-1 inhibitors, which are the newest class of drug often used by oncologists for this indication. There is also no good evidence about inhaled plant cannabis.”
Studies of oral cannabinoids for multiple-sclerosis–related spasticity have demonstrated a small improvement on patient-reported spasticity (less than 1 point on a 10-point scale), but there was no improvement in clinician-reported outcomes. At the same time, their use for weight loss/anorexia in HIV “is very limited, and there are no studies of plant-derived cannabis,” Dr. Grossman said.
According to the National Academy of Sciences report, some evidence supports the use of oral cannabinoids for short-term sleep outcomes in patients with chronic diseases such as fibromyalgia and MS. One small study of oral cannabinoid for anxiety found that it improved social anxiety symptoms on the public speaking test, but there have been no studies using inhaled cannabinoids/marijuana.
The health risks of medical marijuana are largely unknown, Dr. Grossman said, noting that most evidence on longer‐term health risks comes from epidemiologic studies of recreational cannabis users.
“Medical marijuana users tend to be older and tend to be sicker,” she said. “We don’t know anything about the long-term effects in that sicker population.”
Among healthier people, Dr. Grossman continued, cannabis use is associated with increased risk of cough, wheeze, and sputum/phlegm. “There’s also an increased risk of motor vehicle accidents,” she said. “That is certainly a concern in places where they’re legalizing marijuana.”
Cannabis use is associated with lower neonatal birth weight, case reports/series of unintentional pediatric ingestions, and a possible increase in suicidal ideation, suicide attempts, and completed suicides.
“The evidence is very limited regarding associations with myocardial infarction, stroke, COPD, and mortality,” she added. “We don’t really know.”
Dr. Grossman reported having no financial disclosures.
EXPERT ANALYSIS AT ACP INTERNAL MEDICINE
Rumors about the death of tPA are exaggerated
Where do we go from here?
More than 20 years after IV tissue plasminogen activator was officially approved for use in acute ischemic stroke, now data suggest mechanical thrombectomy is superior, regardless of whether tPA is given.
Granted, these are preliminary trials, and a lot more research needs to be done: randomized studies, determinations of which patients are the best candidates, which devices are most useful, etc.

Of course, it’s not that simple. The data thus far suggest thrombectomy is best when used in anterior circulation strokes, with a National Institutes of Health Stroke Scale score of greater than 6, so obviously we shouldn’t be calling them in on every case.
You have to balance that against legal issues. It certainly isn’t too far-fetched to imagine being sued because you didn’t call an interventionalist, or another neurologist testifying that you fell below the standard of care by not doing so. The right person will say that about anything, regardless of clinical data.
This is still up in the air right now, as I doubt the interventionalists want to take acute ischemic stroke off our hands, nor do we want to give it up, either. It’s a disorder of the brain, and that is what we deal with, isn’t it?
The bottom line is that rumors about the death of tPA in acute ischemic stroke are greatly exaggerated. Only time will tell.
Medicine, for better or worse, is an inexact science. No one can predict outcomes, adverse reactions, or complications with 100% certainty. Which treatment will work best for which patient is never known. That’s why we need controlled trials to know which odds are best overall, and take it from there. Preliminary trials can be very helpful at pointing us in the right directions, but are for from definitive. As with so many other things, your mileage may vary.
Dr. Block has a solo neurology practice in Scottsdale, Ariz.
Where do we go from here?
More than 20 years after IV tissue plasminogen activator was officially approved for use in acute ischemic stroke, now data suggest mechanical thrombectomy is superior, regardless of whether tPA is given.
Granted, these are preliminary trials, and a lot more research needs to be done: randomized studies, determinations of which patients are the best candidates, which devices are most useful, etc.
Of course, it’s not that simple. The data thus far suggest thrombectomy is best when used in anterior circulation strokes, with a National Institutes of Health Stroke Scale score of greater than 6, so obviously we shouldn’t be calling them in on every case.
You have to balance that against legal issues. It certainly isn’t too far-fetched to imagine being sued because you didn’t call an interventionalist, or another neurologist testifying that you fell below the standard of care by not doing so. The right person will say that about anything, regardless of clinical data.
This is still up in the air right now, as I doubt the interventionalists want to take acute ischemic stroke off our hands, nor do we want to give it up, either. It’s a disorder of the brain, and that is what we deal with, isn’t it?
The bottom line is that rumors about the death of tPA in acute ischemic stroke are greatly exaggerated. Only time will tell.
Medicine, for better or worse, is an inexact science. No one can predict outcomes, adverse reactions, or complications with 100% certainty. Which treatment will work best for which patient is never known. That’s why we need controlled trials to know which odds are best overall, and take it from there. Preliminary trials can be very helpful at pointing us in the right directions, but are for from definitive. As with so many other things, your mileage may vary.
Dr. Block has a solo neurology practice in Scottsdale, Ariz.
Pardon the interruption?
Your first patient of the afternoon is a 9-year-old boy who moved to town several months ago. Mercifully, the second patient of the afternoon has canceled, giving you a few more minutes to get acquainted with this young man whose chief complaint is listed as “behavior problem.” You learn quickly that this family has relocated from a town just 20 miles away because they are seeking a school that is a “better fit” for your new patient.
Due to some miscommunications, the child’s old records have not arrived at your office. The mother says that her son is not taking any medication, and she isn’t sure if he has ever been given a diagnosis. You learn that he likes to argue and is prone to violent temper tantrums. Your initial brief exam does not suggest any cognitive deficits, but he exudes an aura of anger and discontent. You tell his mother that you will be glad to try to help, but you will need his old records and another longer visit before you can make any recommendations.
Two days later you see a fourth-grader you have known since birth. He rarely comes to the office with problems, but you understand that he is a good student, a competent athlete, and socially engaged. His chief complaint for this visit is “hair loss,” but you soon discover that he has trichotillomania and has recently begun having nightmares and experiencing enuresis. All of these symptoms began a month ago with arrival of a new student in his class whose violent outbursts have become increasingly more physical. I have borrowed this child’s scenario from a similar case study in a recent supplement to the Journal of Developmental & Behavioral Pediatrics titled, “Behavioral Changes Associated with a Disruptive New Student in the Classroom,” (J Dev Behav Pediatr. Feb/Mar 2017. doi: 10.1097/DBP.0000000000000175).
The afternoon following your visit with the hair-pulling fourth-grader, you receive the new patient’s records for which you have been waiting. The circle is completed as you read that this is his third school in 18 months, and the reports of his behavior make it clear that your two patients are classmates. This scenario of coincidence could easily have occurred in a small town like Brunswick, Maine, where I practiced, but I have manufactured it to raise several questions about social priorities and professional ethics.
Forty years ago, institutions housing individuals with Down syndrome started closing and the process of integrating children with a variety of cognitive and physical disabilities into traditional classrooms began. To the surprise of some people, this mainstreaming has generally gone well. Unfortunately, funding hasn’t always caught up with the demand for services. For the most part, children readily accept their challenged classmates who look, move, and sound different. The flailing and grunting of the child with spastic choreoathetosis using a wheelchair isn’t considered an interruption because “that’s just the way she is.”
However, there seems to be an invisible line that separates those children who seem to be incapable of stopping their potentially disruptive behavior from those children we assume “ought to know better” or whose parents we believe have failed at instilling even the most basic discipline. You can certainly question the validity of those assumptions. But it is clear that your new patient’s disruptive behavior is interfering with his classmates’ education, and in some cases threatening their health. Your patient with trichotillomania is probably the canary in a very unsettled mine.
Your dilemma as the pediatrician for these two boys is the same we face as a society. How do you effectively advocate for a positive educational atmosphere for children with a variety of special needs, some of which seem to be in direct conflict? You can ask the school system to be patient as you help the disruptive child get connected with the services he needs. But you know that could take several months at a minimum. Meanwhile your hair-pulling patient and his classmates are losing valuable educational opportunities by the day.
I don’t have the answer, but I suspect that somehow it is going to come down to affordability. Counseling, psychiatrists, and one on one classroom aids don’t come cheap, nor does the tuition for a special school in another school district. But we can’t discount the value of an education free of disruption.
Dr. Wilkoff practiced primary care pediatrics in Brunswick, Maine for nearly 40 years. He has authored several books on behavioral pediatrics, including “How to Say No to Your Toddler.” Email him at [email protected]