User login
In Memoriam
Sandra K. Willsie, DO, FCCP, died on March 26, 2017, after a courageous battle with brain cancer. As an osteopathic physician with board certification in internal medicine, pulmonary diseases, and critical care medicine, Sandra worked diligently for over 30 years to further scientific discovery and health-care education.
An NIH-funded career academic awardee, a Macy Institute scholar, and an invited faculty member on health-care leadership at Harvard University, Sandra was very involved in academic medicine. She served as professor of medicine, interim chair of medicine and docent at the University of Missouri–Kansas City School of Medicine; and as provost, dean, vice-dean, and department chair at Kansas City University of Osteopathic Medicine. Sandra earned a master’s degree in bioethics and health policy focusing on research ethics from Loyola University of Chicago Stritch School of Medicine. She made countless scholarly presentations and published regularly.
Sandra made eight pro bono trips to provide physicians in Honduras, Panama, Costa Rica, and the Dominican Republic the latest research updates on asthma and COPD research. She was honored to serve as president of Women Executives in Science and Healthcare and as board president of the American Heart Association’s Midwest Affiliate. She had been volunteering for over 30 years at the KC CARE Clinic in downtown Kansas City, Missouri, and was a committee member of the FDA advisory panel on respiratory and anesthesiology devices.
Sandra devoted many years of active participation to the American College of Chest Physicians and will be missed by so many colleagues and friends. She served on the Board of Regents and on the US and Canadian Council of Governors, was a member of numerous committees, including Education, Ethics, Marketing, Nominating, and Chair of the Scientific Presentations and Awards Committee. A staunch supporter of the CHEST Foundation, she was instrumental in its creation and served as a board and committee member. We extend our heartfelt condolences to her husband, Tom, and her family and many friends.
Being a Teenager Is Rough Enough
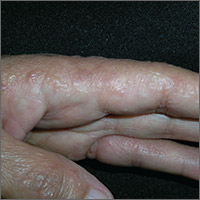
Since she was about 2 years old, this now 14-year-old girl has had asymptomatic bumps on her arms and face. They are most noticeable in the wintertime and a bit less conspicuous during humid months. Besides the appearance of the lesions, the patient is annoyed by the rough feel of them, which is unaffected by her use of OTC moisturizers and lotions.
Her mother recalls having the same problem as a child but says it improved with time. The patient’s immediate family members are all atopic, with seasonal allergies and eczema.
EXAMINATION
The patient is Hispanic with type IV skin. Dense patches of brown, tiny, rough, papulofollicular lesions cover the surface of both posterior triceps. They are also visible on the patient’s anterior thighs and the posterior two-thirds of her face.

What is the diagnosis?
DISCUSSION
Keratosis pilaris (KP) is an inherited condition that affects 30% to 50% of all children without respect to race or gender. It can be a problem unto itself, or it can be part of the atopic diathesis in patients with seasonal allergies, dry skin, and eczema.
KP is caused by an excessive production of keratin that plugs the follicles, often trapping tiny fine hairs inside and resulting in a firm follicular papule. The distribution exhibited in this case is quite typical, as is the brown color on the patient’s arms (common in those with darker skin). KP can also affect the skin on other convex areas (eg, buttocks, deltoids, and thighs). It spares glabrous skin completely. A common variant is rubra facei, characterized by redness and bumps on the posterior two-thirds of the face.
Though it cannot be cured, the condition can be controlled with keratolytics containing salicylic acid, urea, or glycolic acid, or with pure emollients, which trap moisture in the skin. For the occasional itch, topical steroid creams or ointments can be helpful.
Patient education is a key aspect of treatment. Patients can be reassured of the condition’s benignancy, and they may be relieved to know that most KP patients see major improvement as they reach their third decade of life (and beyond).
TAKE-HOME LEARNING POINTS
- Keratosis pilaris (KP) is an extremely common condition inherited by autosomal dominant mode that affects more than 30% of children.
- Excessive keratin production is the cause of KP; it plugs follicular orifices, trapping fine hairs inside and causing crops of firm scaly papules to develop on triceps, deltoids, anterior thighs, and other areas (eg, the face).
- KP is considered part of the minor diagnostic criteria for atopy, but it can also be a standalone condition.
- Treatment of KP is far from perfect, but improvement is seen with the use of either keratolytics or emollients. Anything that dries it out more (eg, long, hot showers) or irritates individual lesions (eg, picking) is to be avoided.
- Most KP patients report improvement after the third decade of life.
Since she was about 2 years old, this now 14-year-old girl has had asymptomatic bumps on her arms and face. They are most noticeable in the wintertime and a bit less conspicuous during humid months. Besides the appearance of the lesions, the patient is annoyed by the rough feel of them, which is unaffected by her use of OTC moisturizers and lotions.
Her mother recalls having the same problem as a child but says it improved with time. The patient’s immediate family members are all atopic, with seasonal allergies and eczema.
EXAMINATION
The patient is Hispanic with type IV skin. Dense patches of brown, tiny, rough, papulofollicular lesions cover the surface of both posterior triceps. They are also visible on the patient’s anterior thighs and the posterior two-thirds of her face.
What is the diagnosis?
DISCUSSION
Keratosis pilaris (KP) is an inherited condition that affects 30% to 50% of all children without respect to race or gender. It can be a problem unto itself, or it can be part of the atopic diathesis in patients with seasonal allergies, dry skin, and eczema.
KP is caused by an excessive production of keratin that plugs the follicles, often trapping tiny fine hairs inside and resulting in a firm follicular papule. The distribution exhibited in this case is quite typical, as is the brown color on the patient’s arms (common in those with darker skin). KP can also affect the skin on other convex areas (eg, buttocks, deltoids, and thighs). It spares glabrous skin completely. A common variant is rubra facei, characterized by redness and bumps on the posterior two-thirds of the face.
Though it cannot be cured, the condition can be controlled with keratolytics containing salicylic acid, urea, or glycolic acid, or with pure emollients, which trap moisture in the skin. For the occasional itch, topical steroid creams or ointments can be helpful.
Patient education is a key aspect of treatment. Patients can be reassured of the condition’s benignancy, and they may be relieved to know that most KP patients see major improvement as they reach their third decade of life (and beyond).
TAKE-HOME LEARNING POINTS
- Keratosis pilaris (KP) is an extremely common condition inherited by autosomal dominant mode that affects more than 30% of children.
- Excessive keratin production is the cause of KP; it plugs follicular orifices, trapping fine hairs inside and causing crops of firm scaly papules to develop on triceps, deltoids, anterior thighs, and other areas (eg, the face).
- KP is considered part of the minor diagnostic criteria for atopy, but it can also be a standalone condition.
- Treatment of KP is far from perfect, but improvement is seen with the use of either keratolytics or emollients. Anything that dries it out more (eg, long, hot showers) or irritates individual lesions (eg, picking) is to be avoided.
- Most KP patients report improvement after the third decade of life.

Critical Care Commentary: Sepsis resuscitation in a post-EGDT age
We must admit that we are all imperfect beings and, as such, we are all incorrect from time to time. In order to evolve to proverbial ‘higher planes of enlightenment,’ we must accept our cognitive errors – sometimes as individuals and other times as a collective entity. Within this framework of improvement through critical reflection, evidence-based medicine has been born. In this commentary, the authors address an area of smoldering contention and conflicting evidence—the role of EGDT in managing sepsis. If their call for an individualized approach to therapy is ultimately the ideal strategy, it may vindicate us all by simultaneously proving us all wrong.
Lee E. Morrow, MD, FCCP
The approach to sepsis resuscitation is emblematic of the challenges and opportunities of the evolution in this transition. There was no standardized approach to early sepsis resuscitation in the 20th century, and mortality from the disease approached 50% in many studies. This changed in 2001 with the publication of the landmark early-goal-directed therapy (EGDT) trial (Rivers et al. N Engl J Med. 2001;345[19]:1368). This single center trial demonstrated a dramatic 16% absolute decrease in mortality secondary to usage of an aggressive protocol for sepsis resuscitation within the first 6 hours after presentation to the ED. In addition to early cultures and antibiotic therapy in patients randomized to both EGDT and “usual care,” EGDT involved a number of mandatory elements, including placing both an arterial catheter and a central venous catheter capable of measuring continuous central venous oxygen saturation (ScvO2). Patients received crystalloid or colloid until a predetermined central venous pressure was obtained, and if their mean arterial pressure was still below 65 mm Hg, therapy with pressors was initiated. If their ScvO2 was not 70% or greater, patients were transfused until their hematocrit was greater than 30%, and, if this still did not bring their ScvO2 up, patients were started on a regimen of dobutamine. Multiple trials of varying design subsequently demonstrated efficacy in this approach, which was rapidly adopted worldwide in many centers managing patients with sepsis.
However, many questions remained. All patients were managed the same in EGDT, with no capacity to individualize care, regardless of clinical situation (comorbidities, age, origin of sepsis). In addition, it was never clear which specific elements of the EGDT protocol were responsible for its success, as a bundled protocol could potentially simultaneously include beneficial, harmful, and neutral components. Further, many of the elements of EGDT have not been demonstrated to be beneficial in isolation. For example, multiple studies demonstrate that patients not receiving transfusions until their hemoglobin value reaches 7 g/dL is at least as effective as receiving transfusions to a hemoglobin value of 10 g/dL. Also, there is a wealth of data suggesting that central venous pressure is not an accurate surrogate for intravascular volume.
The difference between the original Rivers trial (demonstrating a huge benefit of EGDT) and the three subsequent trials leads (showing no benefit) was striking and leads to the obvious questions of (a) why were the results so disparate and (b) what should we do for our patients moving forward? Perhaps the most obvious difference in the trials is the baseline mortality in the “usual care” groups between the studies. In the original Rivers study, in-hospital mortality was 46.5% for the “usual care” group. For ARISE, ProCESS, and ProMISe, 60- to 90-day mortality ranged from 18.8% to 29.2% in the “usual care” group. This means either that the patients in the original EGDT trial were significantly sicker or that something fundamental has changed over time. A closer review of the papers reveals it is likely the latter as, in actuality, the “usual care” group in the three NEJM trials looked a lot like the EGDT group in the original trial. Most patients received significant volume resuscitation in these studies prior to enrollment, and the original ScvO2 was 71% in ProCESS (as opposed to 49% in the original Rivers trial). This suggested that increasing awareness of sepsis that occurred during the 15 years between the EGDT trial and the subsequent three trials – likely due to the Surviving Sepsis Campaign, as well as other efforts from both advocacy groups as well as medical organizations – led to better sepsis care on patient presentation. In essence, what was “usual care” in the time of the original EGDT study had become inappropriate care in the modern era, and much of what was protocolized in EGDT had been transformed into “usual care,” even if a specific protocol was not being used. In the setting in which “usual care” had dramatically improved, the original EGDT protocol was not helpful if implemented on all comers. One key reason is that many patients simply improved with volume and antibiotics (which had become “usual care”) and did not need additional interventions. Another reason is that some of the interventions in EGDT (blood transfusion, continuous ScvO2 monitoring) are likely not beneficial in the majority of cases.
These studies have led to significant changes in recommendations in sepsis management guidelines. The 2016 Surviving Sepsis Campaign guidelines – published after ARISE, ProCESS and ProMISe trials – still recommend antibiotics, cultures, adequate volume resuscitation (without specifying how to do so), targeting an initial mean arterial pressure of 65 mm Hg, and vasopressors if a patient remains hypotensive despite adequate fluids (Rhodes et al. Crit Care Med. 2017; 45). However, no recommendations are made regarding mandatory placement of a central venous catheter, measuring central venous pressure, transfusing to higher hemoglobin, etc.
In many ways, the last 15 years of fluid resuscitation in sepsis represents the triumph of evidence-based medicine over opinion-based medicine and the challenges of moving toward precision medicine. When “usual care” was highly variable without a consistent scientific rationale, EGDT markedly improved outcomes – a clear victory of evidence-based medicine that likely saved thousands of lives. However, when EGDT effectively became “usual care,” each individual element of EGDT bundled together failed to further improve outcome. The new evidence suggested that for all comers, EGDT is no better than the new normal, and, thus, newer guidelines do not recommend most of its components.
Moving forward, what is the best way to resuscitate newly identified patients with sepsis? A big fear in eliminating EGDT in its entirety is that practitioners will not have any guidance on how to manage resuscitation in sepsis and so will revert to less rigorous practice patterns. While we acknowledge that concern, we are optimistic that the future will continue to yield decreases in sepsis mortality. Optimally, volume status will be assessed on an individual basis. Rather than resuscitating every patient with a one-size-fits-all parameter that is fairly crude at best and inaccurate at worst (central venous pressure), bedside caregivers should use whatever tools are most appropriate to their individual patient and expertise. This could include bedside ultrasound, stroke volume variation, esophageal Doppler, passive leg raise, etc, depending on the clinical situation. The concept of appropriate volume resuscitation raised in EGDT continues to be 100% valid, but the implementation is now patient-specific and will vary upon available technology, provider skill, and bedside factors that might make one method superior to the other. Similarly, the failure of EGDT to improve survival in the ARISE, ProCESS, and ProMISe trials does not mean there is never a role for checking venous blood gases and measuring ScvO2. From our point of view, this would be a gross misinterpretation of the trials, as the finding that all elements of EGDT combined fail to benefit all patients with sepsis on arrival should assuredly not be interpreted as none of the elements of EGDT can ever be beneficial in any patients with sepsis. While we can – and should – learn from the data as they pertain to “all comers,” we equally can – and should – look at each individual patient and determine where they align with what is known (and unknown) in the literature and simultaneously attempt to both personalize and optimize their care utilizing our general knowledge of physiology and individual information that is unique to the patient.
In the future, we hope that sepsis resuscitation will be performed in an analogous fashion to cancer therapy. Understanding a patient’s response at the organ level and cellular and subcellular levels will allow us to individualize initial therapy. For instance, an “omics” evaluation of a patient’s immune system may be helpful for guiding treatment. Distinct patterns of gene and protein expression could potentially demonstrate in advance how different patients will respond differently to the same therapy and, in a dynamic manner, determine whether they are responding according to the expected trajectory. Unfortunately, since this is impractical today, the best we can do is to follow recommendations that are applicable to large populations (the Surviving Sepsis bundles) while simultaneously individualizing therapy when no clear data are available. Further, it is critical to assess and reassess the response at the bedside to optimize outcomes. While it is frustrating that no clear guidance can be given on the best way to measure volume status or fluid responsiveness or when there is utility in measuring ScvO2, there is comfort in knowing that best practice has evolved over the past 15 years such that the majority of EGDT is now “usual care.” Moving forward, the challenges in transitioning sepsis resuscitation from population-based evidence-based medicine to individualized therapy are real, but the opportunities for improved outcomes in this deadly disease are enormous.
Dr. Head is with the Department of Anesthesiology, and Dr. Coopersmith is with the Department of Surgery, Emory Critical Care Center, Emory University School of Medicine, Atlanta, GA.
Pilot Program Will Integrate Trauma-Informed Care for Native Children
Ten IHS sites will take part in a new year-long pilot project to integrate trauma-informed care for children through a partnership between IHS, Johns Hopkins Center for Mental Health Services in Pediatric Primary Care, and Johns Hopkins Center for American Indian Health. “The quality of care for our youngest patients is important…” said Rear Admiral Chris Buchanan, acting director of the IHS. The collaboration is designed to reduce the effects of childhood traumatic stress due to poverty, physical or sexual abuse, community and school violence, and neglect.
The IHS and tribal pilot sites will receive virtual technical assistance through webinars, virtual learning communities, technical assistance calls, and metrics collection and analysis. IHS is working with the Pediatric Integrated Care Collaborative (PICC), part of the Johns Hopkins Center for Mental Health Services in Pediatric Primary Care. PICC works with national faculty, pediatric primary care providers, mental health professionals, and families to integrate behavioral and physical health services in Native communities.
The project uses a “learning collaborative” method in which newly learned processes are implemented and then evaluated to find out what works well and what does not and what changes might be needed. Staff are encouraged to test practical, sustainable approaches of integrating trauma/chronic stress prevention, detection, and early intervention into primary care for young children. Identified approaches may include providing primary and secondary prevention, screening for trauma-related problems, or treating trauma-related problems, the IHS says.
“We are honored to be able to work with a group of tribal communities and the IHS on trauma-informed integrated care,” said Lawrence Wissow, MD, professor, Division of Child and Adolescent Psychiatry at Johns Hopkins School of Medicine. “[W]e know that the larger integrated care world will learn from solutions that incorporate Native American traditions of healing and collaboration.”
When Are Patients With Head and Neck Cancer at Risk for Aspiration Pneumonia?
Aspiration pneumonia (AP) is a common late adverse effect of chemoradiotherapy (CRT) and bioradiotherapy for head and neck cancer (HNC). Evaluating the long-term risk factors of AP is difficult because patients’ characteristics vary according to the multimodal therapies they receive, say researchers from Shizuoka Cancer Center in Japan. They conducted a study (the first to their knowledge) to identify specific factors that might help predict which patients have the highest risk of infection.
Related: Lean Six Sigma Applied to Tracking Head/Neck Cancer Patients
The researchers’ retrospective analysis covered nearly 9 years of data. Of the 305 patients in the study, 65 (21%) developed AP after CRT or bioradiotherapy. The median time from end of treatment to AP was 161 days. Nearly all (95%) the patients had Eastern Cooperative Oncology Group performance status of 0 to 1. Most had received standard chemotherapeutic regimens with platinum or cetuximab with supportive care.
The researchers found 5 independent risk factors: habitual alcoholic consumption, poor oral hygiene, coexisting malignancies, hypoalbuminemia before treatment, and use of sleeping pills at the end of treatment. Of those, only hypoalbuminemia was a familiar factor consistent with previous reports.
The finding that oral hygiene predicted AP was unexpected, because at the study hospital, HNC patients who undergo radiotherapy are routinely referred to dentists and receive systematic oral care during the treatment. Of 193 patients with poor oral hygiene before treatment, 135 had been followed up by dentists 3 months after the treatment. Of the 135 patients, 87 whose oral hygiene had improved had a significantly lower frequency of AP than did the 48 patients who had poor oral hygiene (18% vs 54%). The researchers say this suggests that continuous oral management is required in high-risk patients even after treatment.
The researchers also say unnecessary posttreatment administration of sleeping pills might increase the risk of AP. “Notably,” they say, of the 94 patients who used sleeping pills at the end of treatment, 83 continued to use them after the treatment. However, the researchers point to a study that found 31% of patients who had received radiotherapy or CRT had insomnia during the treatment, but about half of them recovered after the treatment.
Seven of 11 patients who had multiple HNCs or coexisting cervical esophageal cancers developed AP. So did 6 of 18 patients who underwent surgical or endoscopic resection for esophageal and gastric cancer. Three of those 6 developed AP within 1 week postresection. The researchers suggest that postsurgical immunosuppression and anesthesia or sedation before endoscopy might impair swallowing function. They also suggest that clinicians may want to consider swallowing exercises for high- or moderate-risk patients to improve swallowing function.
Related: Faster Triage of Veterans With Head and Neck Cancer
The researchers note that AP has been found to be a “significant prognostic factor,” citing a study that found that AP accounted for 19% of noncancer-related deaths of patients with HNC who received CRT. Therefore, they expected AP to be strongly associated with patient survival in their study. However, it wasn’t—perhaps because of the relatively low number of deaths during the follow-up period. Nonetheless, AP “tended to be associated” with increased risk of death.
Source:
Kawai S, Yokota T, Onozawa Y, et al. BMC Cancer. 2017;17:59.
doi: 10.1186/s12885-017-3052-8.
Drug may be new option for difficult-to-treat DLBCL, doc says
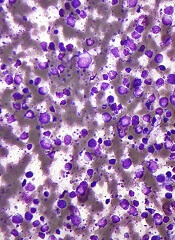
WASHINGTON, DC—Selinexor has demonstrated the potential to become a new oral treatment option for patients with difficult-to-treat diffuse large B-cell lymphoma (DLBCL), according to a presenter at the AACR Annual Meeting 2017.
Interim results from the phase 2b SADAL study showed that selinexor produced a 28.6% overall response rate (ORR), with an 11.1% complete response (CR) rate, in a heavily pretreated, older DLBCL population.
Responses were observed in GCB and non-GCB subtypes, and the median duration of response exceeded 7 months.
The most common adverse events (AEs) were fatigue, thrombocytopenia, nausea, anorexia, and vomiting.
Marie Maerevoet, MD, of the Institute Jules Bordet in Brussels, Belgium, presented data from the SADAL study as abstract CT132/13.*
The trial is sponsored by Karyopharm Therapeutics, the company developing selinexor.
Patients and treatment
The study enrolled 72 patients with relapsed or refractory DLBCL. At least 14 weeks had elapsed since their most recent systemic anti-DLBCL therapy.
The patients received selinexor—an oral selective inhibitor of nuclear export (SINE™) compound—at 60 mg or 100 mg twice weekly (days 1 and 3 each week) of each 28-day cycle.
60 mg arm
There were 37 patients in the 60 mg arm. Their median age was 71 (range, 38-87), and most (n=24) were male. Forty-nine percent of these patients (n=18) had GCB DLBCL.
Fourteen percent of patients had high-risk disease (according to the revised international prognostic index). Forty-three percent had high-intermediate-risk, 30% had low-intermediate-risk, and 14% had low-risk disease.
The patients had received a median of 3 prior treatment regimens (range, 2-5). Twenty-seven percent had received a prior transplant.
100 mg arm
There were 35 patients in the 100 mg arm. Their median age was 68 (range, 32-82), and most (n=23) were male. Fifty-one percent of patients (n=18) had GCB DLBCL.
Eleven percent of patients had high-risk, 40% had high-intermediate-risk, 37% had low-intermediate-risk, and 6% had low-risk disease. For 6% of patients, their risk group was unknown.
The patients had received a median of 3 prior treatment regimens (range, 2-5). Forty-six percent had received a prior transplant.
Safety
All 72 patients were evaluable for safety. The most common AEs across both dosing groups were fatigue (65%), thrombocytopenia (54%), nausea (51%), anorexia (49%), vomiting (35%), and anemia (32%).
These events were primarily grades 1 and 2 and were managed with dose modifications and/or standard supportive care.
The 60 mg dose was better tolerated than the 100 mg dose, with fewer dose interruptions and modifications required in the 60 mg arm.
Grade 3/4 AEs that were more common in the 100 mg arm than the 60 mg arm were fatigue (26% vs 11%), thrombocytopenia (46% vs 32%), and anorexia (11% vs 3%).
Efficacy
Sixty-three patients were analyzed for response. The ORR was 28.6% (18/63), with a CR rate of 11.1% (n=7) and a partial response (PR) rate of 17.5% (n=11).
The rate of stable disease (SD) was 14.3% (n=9), and the rate of progressive disease (PD) was 46% (n=29). Seven patients (11.1%) were not evaluable (NE).
The best responses as of March 1, 2017, according to subtype and selinexor dose, were as follows:
| Category | N | ORR | CR | PR | SD | PD | NE |
| 60 mg | 32 | 9 (28.1%) | 4 (12.5%) | 5 (15.6%) | 3 (9.4%) | 17 (53.1%) | 3 (9.4%) |
| 100 mg | 31 | 9 (29.0%) | 3 (9.7%) | 6 (19.4%) | 6 (19.4%) | 12 (38.7%) | 4 (12.9%) |
| GCB subtype | 32 | 8 (25.0%) | 3 (9.4%) | 5 (15.6%) | 6 (18.8%) | 13 (40.6%) | 5 (15.6%) |
| Non-GCB subtype | 31 | 10 (32.3%) | 4 (12.9%) | 6 (19.4%) | 3 (9.7%) | 16 (51.6%) | 2 (6.5%) |
The median duration of response was greater than 7 months. The median time to response was 2 months.
Among responders, the median time on treatment was 9 months, with a median follow-up of 13 months. As of the data cutoff date, 9 responders remained on treatment, including 6 patients with a CR.
The median overall survival was 8 months for all patients. As of the cutoff date, the median survival for the responders had not been reached.
“With the impressive and durable responses observed to date, including in both the GCB and non-GCB subtypes of DLBCL, single-agent selinexor is demonstrating the potential to become a new oral option for this difficult-to-treat patient population who are not candidates for transplantation and whose disease is unlikely to respond to further chemotherapy or targeted agents,” Dr Maerevoet said.
Trial update
As a result of the interim data from SADAL, and in consultation with the US Food and Drug Administration (FDA), Karyopharm is amending the study protocol.
SADAL will become a single-arm study focusing solely on single-agent selinexor dosed at 60 mg twice weekly.
The study is also being amended to reduce the 14-week treatment-free period to 8 weeks in patients who achieved at least a PR on their most recent therapy. Patients who were refractory to or did not achieve at least a PR on their prior therapy will continue with the 14-week treatment-free period.
Karyopharm plans to enroll up to an additional 90 patients to the new 60 mg single-arm cohort and expects to report top-line results from the SADAL study in mid-2018.
The FDA recently lifted a partial clinical hold placed on the SADAL trial and other trials of selinexor.
The FDA had placed the hold due to a lack of information in the investigator’s brochure, including an incomplete list of serious adverse events associated with selinexor. ![]()
*Data in the abstract differ from the presentation.
Extremely short and long telomeres linked to risk of leukemia
WASHINGTON, DC—Telomere length may predict cancer risk and could be a target for future therapies, according to research presented at the AACR Annual Meeting 2017.
The study suggests that, overall, longer-than-expected telomeres are associated with an increased risk of cancer.
However, investigators also found an increased risk of certain cancers, including leukemia, among patients who had very short or very long telomeres.
“Telomeres and cancer clearly have a complex relationship,” said study investigator Jian-Min Yuan, MD, PhD, of the University of Pittsburgh Cancer Institute in Pennsylvania.
“Our hope is that by understanding this relationship, we may be able to predict which people are most likely to develop certain cancers so they can take preventive measures and perhaps be screened more often, as well as develop therapies to help our DNA keep or return its telomeres to a healthy length.”
Dr Yuan and his colleagues presented their research as abstract 2267/21.*
The team analyzed blood samples and health data on 26,540 individuals enrolled in the Singapore Chinese Health Study, which has followed the health outcomes of participants since 1993. As of the end of 2015, 4060 participants had developed cancer (77 with leukemia).
The investigators divided participants into 5 groups, based on the length of their telomeres.
The group with the longest telomeres (quartile 5) had a significantly higher risk of developing any cancer than the group with the shortest telomeres (quartile 1), after taking into account the effects of age, sex, education, body mass index, smoking habits, and alcohol consumption. The hazard ratio (HR) was 1.33 (P<0.0001).
In particular, the group with the longest telomeres had a significantly increased risk of colorectal cancer (HR=1.37, P=0.010), breast cancer (HR=1.39, P=0.007), prostate cancer (HR=1.55, P=0.011), and pancreatic cancer (HR=2.58, P=0.009).
On the other hand, the risk of liver cancer decreased as telomere length increased. The HR was 0.72 for patients in quartile 5 compared to those in quartile 1 (Plinear=0.056).
The risk of 3 cancers was greatest for both the groups with extremely short and extremely long telomeres—quartiles 1 and 5, respectively.
For leukemia, the HR was 2.15 for quartile 1 and 1.68 for quartile 5, when compared to quartile 3 (Pnon-linear=0.015).
For bladder cancer, the HRs were 1.72 and 2.17, respectively (Pnon-linear=0.01). And for stomach cancer, the HRs were 1.63 and 1.55, respectively (Pnon-linear=0.020).
“We had the idea for this study more than 7 years ago, but it took the laboratory 3 months to finish quantifying telomere length for just 100 samples, which was not enough to draw any meaningful conclusions,” Dr Yuan said.
“Not even a decade later, we’ve been able to run nearly 30,000 samples in a year and draw these really robust insights, showing how far technology has come. Even more complicated will be linking telomere length to genome-wide analyses, which is on the horizon. We’re on the cusp of gaining a truly remarkable understanding of the complicated biological phenomena that lead to cancer.” ![]()
*The presentation differed from the abstract.
Method may help MM patients avoid bone marrow biopsies
Engineers say they have devised a microfluidic technique to capture and count circulating plasma cells from small samples of blood.
They believe the technique, described in Scientific Reports, may allow patients with multiple myeloma (MM) to avoid bone marrow biopsies in favor of conventional blood draws.
“Procedures of the traditional tissue biopsy are painful, associated with complications such as potential infections, and often available only in central hospitals, which require patients to travel long distances,” said Mohammad Qasaimeh, PhD, of New York University Abu Dhabi in United Arab Emirates.
“Capturing plasma cells from blood samples can serve as a liquid biopsy, which can be performed in clinics as often as required, and serve as a diagnostic and prognostic test during and after chemotherapy treatment. Moreover, captured cells can be used for drug testing and, thus, serve as a tool for personalized medicine.”
About the technique
The current microfluidic technique builds on a design that was developed by George Whitesides, PhD, of Harvard University in Cambridge, Massachusetts.
Dr Whitesides and his colleagues fabricated a microchip, the channel of which they etched with repeating, V-shaped grooves, similar to a herringbone pattern.
The grooves cause any fluid flowing through the microchip to swirl about in eddies, rather passing straight through. The cells within the fluid therefore have a higher chance of making contact with the floor of the device.
Researchers have since reproduced this microfluidic design, coating the microchip’s floor with certain molecules to attract cells of interest.
Qasaimeh and colleagues used the microfluidic herringbone design to capture circulating plasma cells. They coated the channels of a microchip with CD138, an antibody expressed on the membranes of plasma cells.
The team then flowed 1 mL samples of blood through the device. The herringbone grooves circulated the blood in the microfluidic channels, where the antibodies grabbed onto any passing plasma cells and let the rest of the blood flow out of the device.
Once the cells were isolated in the microchip, the researchers could count the cells, as well as determine the kinds of antibodies each cell secretes.
Capturing cells
The researchers tested the device using blood samples from healthy donors as well as MM patients.
The team observed very low numbers of circulating plasma cells in healthy samples—2 to 5 cells per mL of blood—and substantially higher counts in MM patients—45 to 184 cells per mL.
The researchers noted that MM patients in remission also exhibited higher counts of circulating plasma cells—20 to 24 cells per mL—than healthy donors.
Rahit Karnik, PhD, of Massachusetts Institute of Technology in Cambridge, said this device may reveal more subtle information about a patient’s state, even in remission.
“When patients go into remission, their antibody levels can look normal,” Dr Karnik said. “But we detect a level of circulating plasma cells that is above the baseline. It’s hard to tell whether these cells are cancerous, but at least this technique is giving us more information. With the ease of a blood draw, this may enable us to track cancer in a much better way.”
Analyzing antibodies
The researchers also looked at antibodies produced by the plasma cells captured in the device.
The team determined the ratio of plasma cells producing kappa- and lambda-type antibodies and compared them to conventional blood tests for the same antibodies, for both healthy subjects and MM patients.
Both sets of results matched, which validates the microfluidic device’s accuracy.
Next steps
Dr Karnik said, in the future, researchers may use this design to perform genetic tests on the captured cells or look for mutations in the cells that may further characterize MM.
“We can capture and stain these cells in the device, which opens the possibility of studying whether there are new mutations in the cells,” Dr Karnik said.
“With cancers like multiple myeloma, even for patients in remission, cancer can recur. Detecting the level or mutation of plasma cells in blood might provide an early detection method for these patients.” ![]()
FDA approves drugs more quickly than EMA

The US Food and Drug Administration (FDA) reviews and approves new medicines in a shorter timeframe than the European Medicines Agency (EMA), according to an analysis published in NEJM.
The FDA has faced pressure from the public, politicians, and industry to accelerate review and approval of new medicines.
The FDA’s review process is currently being considered and reexamined as part of negotiations to reauthorize the law that directs funds to the agency—the Prescription Drug User Fee Act—which is due for reauthorization by October 2017.
To inform this debate, a group of researchers compared review times for new drugs approved by the FDA and the EMA between 2011 and 2015.
The results showed that the FDA approved more new drugs than the EMA—170 versus 144—during this time period.
The median review time was 306 days for FDA-approved drugs and 383 days for EMA-approved drugs (P<0.001).
Over the study period, the FDA approved 53 drugs intended to treat cancer/hematologic diseases, and the EMA approved 50. The median review times were 206 days and 379 days, respectively (P<0.001).
The FDA approved 74 orphan drugs, and the EMA approved 36. The median review times were 294 days and 403 days, respectively (P<0.001).
The current analysis is an update to a prior analysis, published in 2012, which showed the FDA approved new medicines more quickly than the EMA and Health Canada.
“The gap we had identified, where the FDA was 2 to 3 months faster, now it’s about 3 to 4 months faster,” said Joseph Ross, MD, of the Yale School of Medicine in New Haven, Connecticut, an author of both studies.
“This is more information that should inform upcoming debates. The FDA is already making decisions quickly, and increasing its regulatory speed shouldn’t be our number-one priority.” ![]()
Itchy rash on sides of fingers
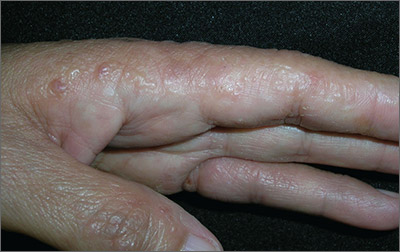
The FP recognized the multiple tapioca-like vesicles on the sides of the patient’s fingers as pompholyx, also known as dyshidrotic eczema. One of the classic findings of dyshidrotic eczema is the vesicles that resemble the small spheres in tapioca pudding. (The FP considered scabies, but ruled it out because no one in the family had a similar rash and there were no signs of any burrows.)
The term “pompholyx” means bubble, while the term “dyshidrotic” means “difficult sweating,” as problems with sweating were once believed to be the cause of this condition. Some dermatologists prefer the name “vesicular hand dermatitis.” Regardless of the terminology, this can be a very mild condition that is a minor nuisance or a very severe chronic condition that impairs the patient’s quality of life.
The FP explained that dyshidrotic eczema is not curable and may be worsened by stress and substances that come into contact with the hands. He discussed the possibility of avoiding washing the dishes and other “wet work,” but the patient said that wasn’t possible, so he told her to use nitrile gloves with cotton liners. (Using gloves without cotton liners often leads to sweating in the gloves that can worsen dyshidrotic eczema.)
The FP prescribed 0.1% triamcinolone cream to be applied twice daily. During a follow-up visit one month later, the patient’s rash had improved considerably. She was still working on lifestyle changes to minimize her contact with water and other substances. If the patient’s condition hadn’t improved with basic treatment, she would have been referred to a dermatologist for patch testing to rule out contact dermatitis.
Photos and text for Photo Rounds Friday courtesy of Richard P. Usatine, MD. This case was adapted from: Usatine R. Hand eczema. In: Usatine R, Smith M, Mayeaux EJ, et al, eds. Color Atlas of Family Medicine. 2nd ed. New York, NY: McGraw-Hill;2013:597-602.
To learn more about the Color Atlas of Family Medicine, see: www.amazon.com/Color-Family-Medicine-Richard-Usatine/dp/0071769641/
You can now get the second edition of the Color Atlas of Family Medicine as an app by clicking on this link: usatinemedia.com