User login
A little rivaroxaban goes a long way
In patients with venous thromboembolism at equipoise for further anticoagulation therapy, treatment with a 10-mg dose of rivaroxaban (Xarelto) had comparable efficacy to a 20-mg dose, with both leading to fewer recurrences than treatment with aspirin. There were no statistically significant differences in clinically relevant nonmajor bleeding between the three groups.
The study’s conclusions are limited to relatively healthy patients such as the ones who were selected for the study.
The findings were presented at the annual meeting of the American College of Cardiology and published simultaneously in the New England Journal of Medicine (N Engl J Med 2017 March 18. doi: 10.1056/NEJMoa1700518).
Anticoagulants are the primary treatment for prevention of venous thromboembolism recurrences, but the medications are often stopped after 6-12 months because of concerns about bleeding. To counter that issue, physicians may prescribe lower doses of anticoagulants such as rivaroxaban, or substitute aspirin.
The work follows another recent study of apixaban (Eliquis), which showed that a 2.5-mg twice-daily dose performed the same as did a 5.0-mg twice-daily dose in the prevention of venous thromboembolism recurrence (N Engl J Med. 2013;368[8]:699-708).
“I think the story is kind of the same here,” said David Garcia, MD, professor of hematology at the University of Washington, Seattle, who was one of the principal investigators in the trial.
Patients with unprompted venous thromboembolism are increasingly being offered anticoagulant therapy to prevent recurrences. Those drugs have inherent bleeding risks, but the newer drugs and even warfarin are becoming safer. Even so, “as we embark on that, one has to remember that the risk of anticoagulants is cumulative. It may only carry a risk of 1% per year of major hemorrhage, but if the patient has to take it for 10 or 20 or 30 years, it’s a nontrivial risk of major bleeding over that time,” said Dr. Garcia.
The researchers conducted the Reduced-Dose Rivaroxaban in the Long-Term Prevention of Recurrent Symptomatic Venous Thromboembolism (EINSTEIN CHOICE) trial, in which 3,365 patients from 24 sites were randomized to receive 20 mg rivaroxaban, 10 mg rivaroxaban, or 100 mg aspirin for up to 1 year following an initial 6-12 months of treatment with anticoagulation therapy.
During a median follow-up of 1 year, 4.4% of patients on aspirin experienced a recurrence, compared with 1.5% of patients in the 20-mg rivaroxaban group (hazard ratio versus aspirin, 0.34; 95% confidence interval, 0.20-0.59; P less than .001), and 1.2% in the 10-mg rivaroxaban group (HR versus aspirin, 0.26; 95% CI, 0.14-0.47; P less than .001). There was no statistical significance between the two doses of rivaroxaban.
The rates of fatal thromboembolism were similar, at 0.2% in the 20-mg rivaroxaban group, 0% in the 10-mg group, and 0.2% in the aspirin group.
Major bleeding occurred in 0.5% of patients in the 20-mg rivaroxaban group, in 0.4% of the 10-mg rivaroxaban group, and 0.3% in the aspirin group. Nonmajor, clinically relevant bleeding was also similar between groups, at 2.7% in the 20-mg group, 2.0% in the 10-mg group, and 1.8% in the aspirin group. These differences were not statistically significant.
The study is good news for clinicians as they help patients decide whether to undergo preventive therapy. “Even before the newer agents arrived on the market, we had moved the needle a lot in terms of maximizing the safety of warfarin. I think these drugs take it to yet another level,” said Dr. Garcia.
Bayer Pharmaceuticals funded the study. Dr. Garcia has received honoraria from Bristol-Meyers Squibb, Pfizer, and Boehringer Ingelheim.
“Given the protection from recurrent venous thromboembolism afforded by reduced-dose rivaroxaban, extending treatment beyond 3 months could be considered in patients with provoked venous thromboembolism who are at average risk for bleeding and who are strongly averse to having another episode of venous thromboembolism. In light of the safety profile of low-dose rivaroxaban, the benefit of this strategy does not need to be large in order to justify the extension of therapy.
“This trial suggests that it would be helpful to evaluate the effects of reduced doses of rivaroxaban within 6 months after an episode of venous thromboembolism.
“For patients without cancer, the use of direct oral anticoagulant agents might be considered as first-line treatment for those with acute venous thromboembolism. Full-dose treatment could be continued for a minimum of 3-6 months. In patients in whom there is equipoise with respect to continuing anticoagulant therapy beyond this period, the use of a reduced-intensity direct oral anticoagulant agent might be considered. Clinicians who choose this strategy can be confident of excellent efficacy and low bleeding risk similar to that observed with aspirin or placebo” (N Engl J Med 2017 March 18. doi: 10.1056/NEJMe1701628).
Mark Crowther, MD, is professor of medicine at McMaster University, Hamilton, Ont. Adam Cuker is assistant professor of medicine at the hospital of the University of Pennsylvania, Philadelphia.
In patients with venous thromboembolism at equipoise for further anticoagulation therapy, treatment with a 10-mg dose of rivaroxaban (Xarelto) had comparable efficacy to a 20-mg dose, with both leading to fewer recurrences than treatment with aspirin. There were no statistically significant differences in clinically relevant nonmajor bleeding between the three groups.
The study’s conclusions are limited to relatively healthy patients such as the ones who were selected for the study.
The findings were presented at the annual meeting of the American College of Cardiology and published simultaneously in the New England Journal of Medicine (N Engl J Med 2017 March 18. doi: 10.1056/NEJMoa1700518).
Anticoagulants are the primary treatment for prevention of venous thromboembolism recurrences, but the medications are often stopped after 6-12 months because of concerns about bleeding. To counter that issue, physicians may prescribe lower doses of anticoagulants such as rivaroxaban, or substitute aspirin.
The work follows another recent study of apixaban (Eliquis), which showed that a 2.5-mg twice-daily dose performed the same as did a 5.0-mg twice-daily dose in the prevention of venous thromboembolism recurrence (N Engl J Med. 2013;368[8]:699-708).
“I think the story is kind of the same here,” said David Garcia, MD, professor of hematology at the University of Washington, Seattle, who was one of the principal investigators in the trial.
Patients with unprompted venous thromboembolism are increasingly being offered anticoagulant therapy to prevent recurrences. Those drugs have inherent bleeding risks, but the newer drugs and even warfarin are becoming safer. Even so, “as we embark on that, one has to remember that the risk of anticoagulants is cumulative. It may only carry a risk of 1% per year of major hemorrhage, but if the patient has to take it for 10 or 20 or 30 years, it’s a nontrivial risk of major bleeding over that time,” said Dr. Garcia.
The researchers conducted the Reduced-Dose Rivaroxaban in the Long-Term Prevention of Recurrent Symptomatic Venous Thromboembolism (EINSTEIN CHOICE) trial, in which 3,365 patients from 24 sites were randomized to receive 20 mg rivaroxaban, 10 mg rivaroxaban, or 100 mg aspirin for up to 1 year following an initial 6-12 months of treatment with anticoagulation therapy.
During a median follow-up of 1 year, 4.4% of patients on aspirin experienced a recurrence, compared with 1.5% of patients in the 20-mg rivaroxaban group (hazard ratio versus aspirin, 0.34; 95% confidence interval, 0.20-0.59; P less than .001), and 1.2% in the 10-mg rivaroxaban group (HR versus aspirin, 0.26; 95% CI, 0.14-0.47; P less than .001). There was no statistical significance between the two doses of rivaroxaban.
The rates of fatal thromboembolism were similar, at 0.2% in the 20-mg rivaroxaban group, 0% in the 10-mg group, and 0.2% in the aspirin group.
Major bleeding occurred in 0.5% of patients in the 20-mg rivaroxaban group, in 0.4% of the 10-mg rivaroxaban group, and 0.3% in the aspirin group. Nonmajor, clinically relevant bleeding was also similar between groups, at 2.7% in the 20-mg group, 2.0% in the 10-mg group, and 1.8% in the aspirin group. These differences were not statistically significant.
The study is good news for clinicians as they help patients decide whether to undergo preventive therapy. “Even before the newer agents arrived on the market, we had moved the needle a lot in terms of maximizing the safety of warfarin. I think these drugs take it to yet another level,” said Dr. Garcia.
Bayer Pharmaceuticals funded the study. Dr. Garcia has received honoraria from Bristol-Meyers Squibb, Pfizer, and Boehringer Ingelheim.
FROM ACC 17
Key clinical point: In venous thromboembolism prevention, a 10-mg dose matched 20 mg.
Major finding: The recurrence rates were 1.2% at 10 mg versus 4.4% with aspirin.
Data source: Randomized comparison trial of 3,365 patients.
Disclosures: Bayer Pharmaceuticals funded the study. Dr. Garcia has received honoraria from Bristol-Meyers Squibb, Pfizer, and Boehringer Ingelheim.
VIDEO: SURTAVI results ‘tremendously important’ for decision making
Washington – Heart teams will have more options when making treatment decisions for patients with severe aortic stenosis who are at intermediate risk, now that the results of the SURTAVI (Surgical Replacement and Transcatheter Aortic Valve Implantation) trial have been presented.
Those results showed that transcatheter aortic valve replacement (TAVR) in patients with severe aortic stenosis at intermediate risk was not only noninferior to surgical replacement, “but in my mind superior, because you don’t get your chest cracked, you get home earlier, and you have fewer strokes [in this trial], Roxana Mehran, MD, professor and director of interventional cardiovascular research at Mount Sinai Hospital in New York, said in a video interview at the annual meeting of the American College of Cardiology.
In SURTAVI, which used Medtronic’s self-expanding CoreValve and Evolut-R bioprostheses in 863 patients randomized to TAVR, 12.6% met the study’s primary endpoint – death from any cause or disabling stroke at 24 months – versus 14% of the 796 patients randomized to surgery, a statistically nonsignificant difference. Notably, the risk of any type of stroke at 30 days was statistically superior for TAVR, 3.4%, compared with 5.6% for surgical replacement.
“It’s tremendously important to see the change in how we’re going to be evaluating patients with aortic stenosis,” Dr. Mehran said.
The video associated with this article is no longer available on this site. Please view all of our videos on the MDedge YouTube channel
AT ACC 17
HIV research update: Late February 2017
A great volume of HIV and AIDS research enters the medical literature every month. It can be difficult to monitor everything, so here’s a quick look at some notable news items and journal articles published over the past few weeks.
Targeted recruitment of hospitalized populations is a feasible and productive approach for finding and engaging people who live with HIV and who are newly diagnosed or out of routine care, according to a study in HIV Clinical Trials.
A recent study highlighted the need to enhance the immunogenicity of the seasonal trivalent inactivated influenza vaccine for the HIV-positive population, potentially through harnessing the innate immunity with an external adjuvant.
Greater attention is needed to build a more comprehensive understanding of the rural HIV epidemic in the United States and Canada, including research efforts, innovative approaches to care delivery, and greater community engagement in prevention and care, a recent study revealed.
Recent U.S. research supports prioritizing in-person partner services for HIV and suggests that in-person partner services for syphilis may not have major public health benefit, according to a study in Sexually Transmitted Diseases.
A multinational study of HIV/TB coinfected children highlighted the importance of early antiretroviral therapy for children with HIV/TB coinfection, and reinforced the need for implementation research to improve pediatric TB management.
Placentas of HIV-infected pregnant women under combined antiretroviral therapy containing zidovudine showed evidence of mitochondrial DNA depletion, increased oxidative stress levels, and apoptosis suggestive of secondary mitochondrial failure, all potential bases of associated adverse perinatal outcomes.
U.S. investigators observed no evidence that reporting depressive symptoms increased the likelihood of all-cause mortality in a large cohort of HIV-infected adults in care, controlling for a range of time-varying factors.
The second-generation maturation inhibitor GSK3532795 maintains potent antiviral activity toward HIV protease inhibitor-resistant clinical isolates, according to a study in JAIDS.
Pregnant adolescents must be a priority for primary HIV prevention services and expanded HIV treatment services among pregnant women to achieve an AIDS-free generation in Zimbabwe and similar high HIV burden countries, a recent study revealed.
[email protected]
On Twitter @richpizzi
VIDEO: FOURIER and SPIRE show lower LDL is better for longer
WASHINGTON – With the results of two blockbuster trials in lipid-lowering PCSK9 inhibitors, the long-awaited verdict on LDL cholesterol’s effect on cardiovascular outcomes is in: Lower is better.
In a video interview at the annual meeting of the American College of Cardiology, Paul M. Ridker, MD, added that “lower is better for longer.”
Dr. Ridker presented results of the SPIRE (Studies of PCSK9 Inhibition and the Reduction of Vascular Events) program in bococizumab. Bococizumab was revealed to spur antibody responses in some patients, leading Pfizer to discontinue the SPIRE program and any further development. However, the combined endpoint for all six SPIRE trials was reduced by 25%, a trend that continued with longer treatment.
The FOURIER (Further Cardiovascular Outcomes Research with PCSK9 Inhibition in Subjects with Elevated Risk) trial, presented by Marc S. Sabatine, MD, of Brigham and Women’s Hospital in Boston, showed a reduction of 15% in the cardiovascular events.
Both the SPIRE and the FOURIER program have now provided evidence saying “lower is better for longer,” Dr. Ridker said in a video interview. The challenge is, “who do we want to get these drugs into first?”
For his part, Dr. Ridker, director of the Center for Cardiovascular Disease Prevention at Brigham and Women’s Hospital and professor of medicine at Harvard Medical School, Boston, will focus on his very-high-risk patients who are receiving the most aggressive therapy possible.
The video associated with this article is no longer available on this site. Please view all of our videos on the MDedge YouTube channel
AT ACC 17
Racial differences in skin cancer risk after organ transplantation
Nonwhite organ transplant recipients (OTRs) are more likely to present with inflammatory or infectious conditions after transplantation, while white organ recipients more commonly present with malignant disease, new research suggests.
While the high incidence of skin cancers has been well described in patients who undergo solid organ transplants, little is known about the risk factors, incidence, locations, and types of skin disease that occur in nonwhite OTRs, wrote Christina Lee Chung, MD, from Drexel University, Philadelphia, and her coauthors in JAMA Dermatology.
In a retrospective review, the investigators examined the medical records of 412 organ transplant recipients treated at an academic referral center during 2011-2016, of whom 154 were white, 35 were Asian, 33 were Hispanic, and 190 were black (JAMA Dermatology. 2017 Mar 8. doi: 10.1001/jamadermatol.2017.0045).
Among the white patients, malignant or premalignant disease was the most common diagnostic category (67.8%), followed by inflammatory (20.7%) and infectious processes (11.6%). However, among nonwhite organ transplant recipients, inflammatory processes were present in 48.8% of patients, infectious processes in 37.5% and the remaining 13.7% presented with malignant or premalignant lesions.
Black and Hispanic patients were more likely to present with inflammatory or infectious disease; only 8.6% presented with malignant conditions and 16% presented with premalignant disease.
Among the Asian patient population, one-third presented with malignant or premalignant, one-third presented with infectious, and one-third presented with inflammatory conditions.
“Although early detection and treatment of cancer is vital, nonwhite OTRs would also benefit from addressing nonmalignant processes that are exacerbated by immunosuppression,” the authors wrote.
Overall, 389 skin cancers were diagnosed, with squamous cell carcinoma in situ (SCC) the most common type of skin cancer diagnosed in each racial or ethnic group. The mean time between transplant and first skin cancer lesion was 12.67 years in black patients, 6.5 years in Hispanic patients, 6.13 years among white patients, and 3.75 years in Asian patients.
The vast majority of skin cancers (95.1%) were found in white patients. While the majority of lesions in white and Asian patients were found in sun-exposed areas, the few skin cancers seen in black patients were more likely to be found in sun-protected areas, particularly the genitals.
Four of the six genital SCCs tested positive for high-risk human papillomavirus strains – in one Asian patient and three black patients – while the two SCCs found on lower extremities in Hispanic patients tested negative for HPV.
Researchers also looked at skin cancer awareness among the organ transplant recipients using data from initial visit questionnaires. They found that more than 17 of the 22 (77.3%) white organ transplant recipients surveyed were aware their skin cancer risk was increased, compared with 30 of the 44 (68.2%) nonwhite patients.
Similarly, 72.7% of white patients surveyed were aware that sunscreen decreased the risk of cancer, compared with 59.1% of nonwhite patients; 27.3% of white patients reported using a daily sunscreen, compared with 13.6% of nonwhite patients.
“Based on our findings, we suggest that optimal posttransplant dermatologic care be determined based on the race or ethnicity of the patients; however, regardless of skin type or race or ethnicity, a baseline full-skin assessment should be performed in all patients,” the authors wrote.
They proposed that skin cancer follow-up screenings should be given to Asian and Hispanic patients immediately after transplant, but that black organ transplant recipients could delay yearly screenings.
However, they said routine skin checks should begin earlier after transplantation for all nonwhite transplant recipients with a history of, or clinically evident HPV infection.
No conflicts of interest were declared.
FROM JAMA DERMATOLOGY
Key clinical point: Nonwhite organ transplant recipients are more likely than are white recipients to present with inflammatory or infectious conditions than with skin cancer after transplantation.
Major finding: Malignant or premalignant disease was seen in 67.8% of white organ transplant recipients but just 13.7% of nonwhite recipients.
Data source: A retrospective review of medical records from 412 organ transplant recipients.
Disclosures: No conflicts of interest were declared.
Primary Cutaneous Cryptococcosis Presenting as an Extensive Eroded Plaque
To the Editor:
Primary cutaneous cryptococcal infection is rare. Cryptococcal skin infections, either primary or disseminated, can be highly pleomorphic and mimic entities such as basal cell carcinoma or even severe dermatitis, as in our case.
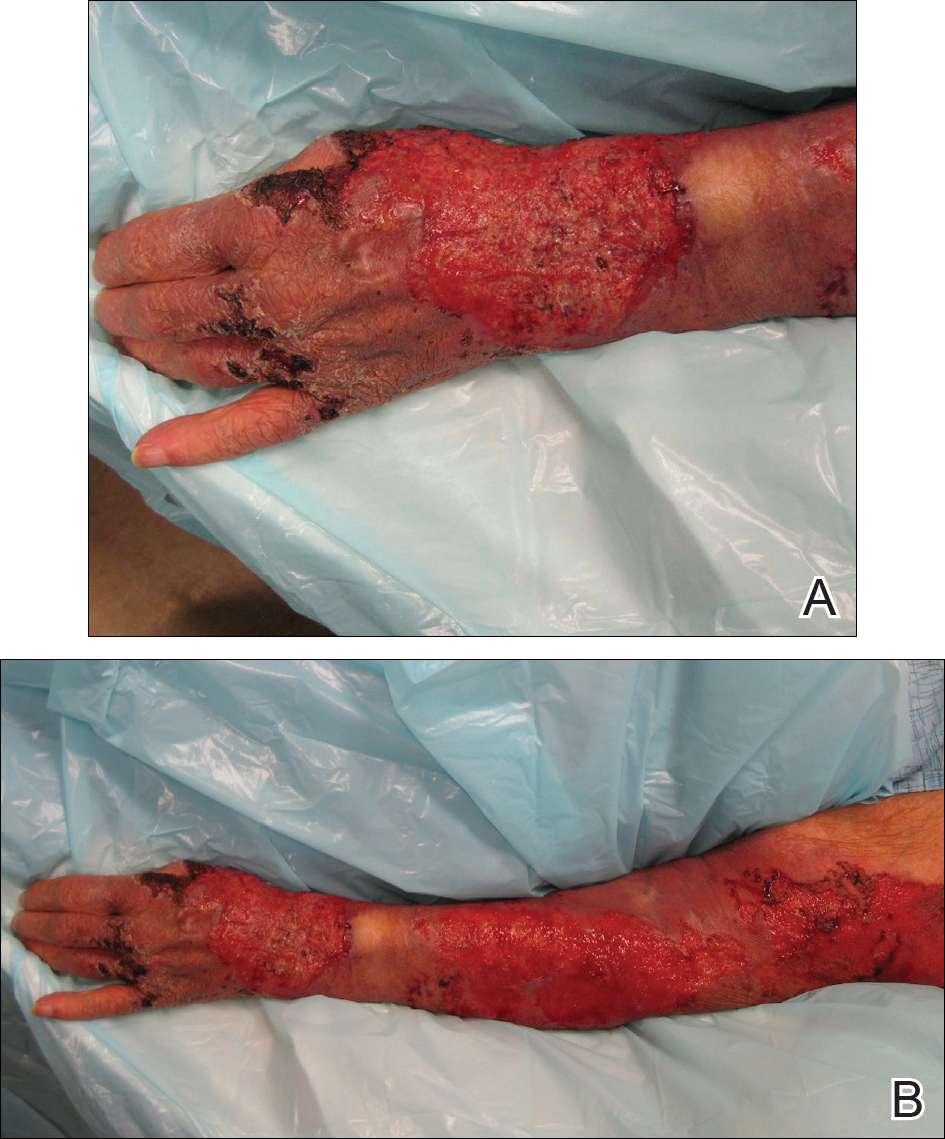
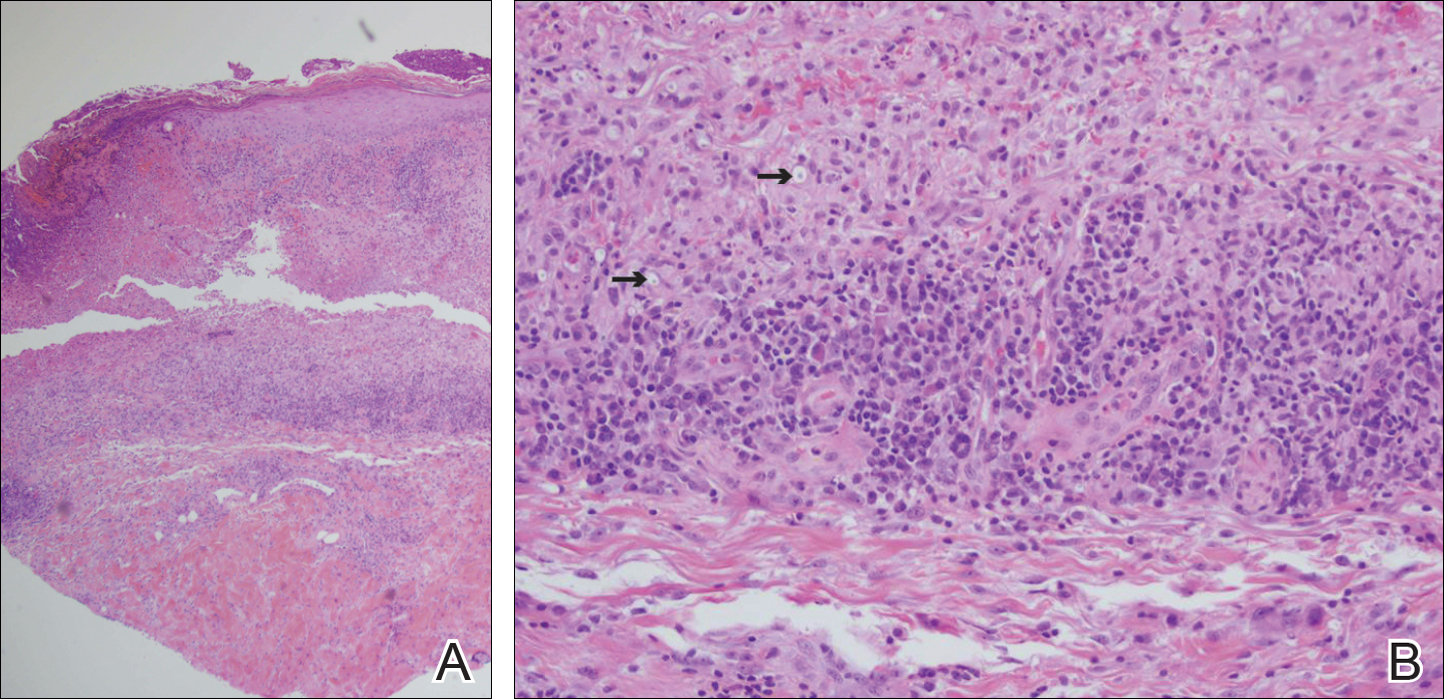
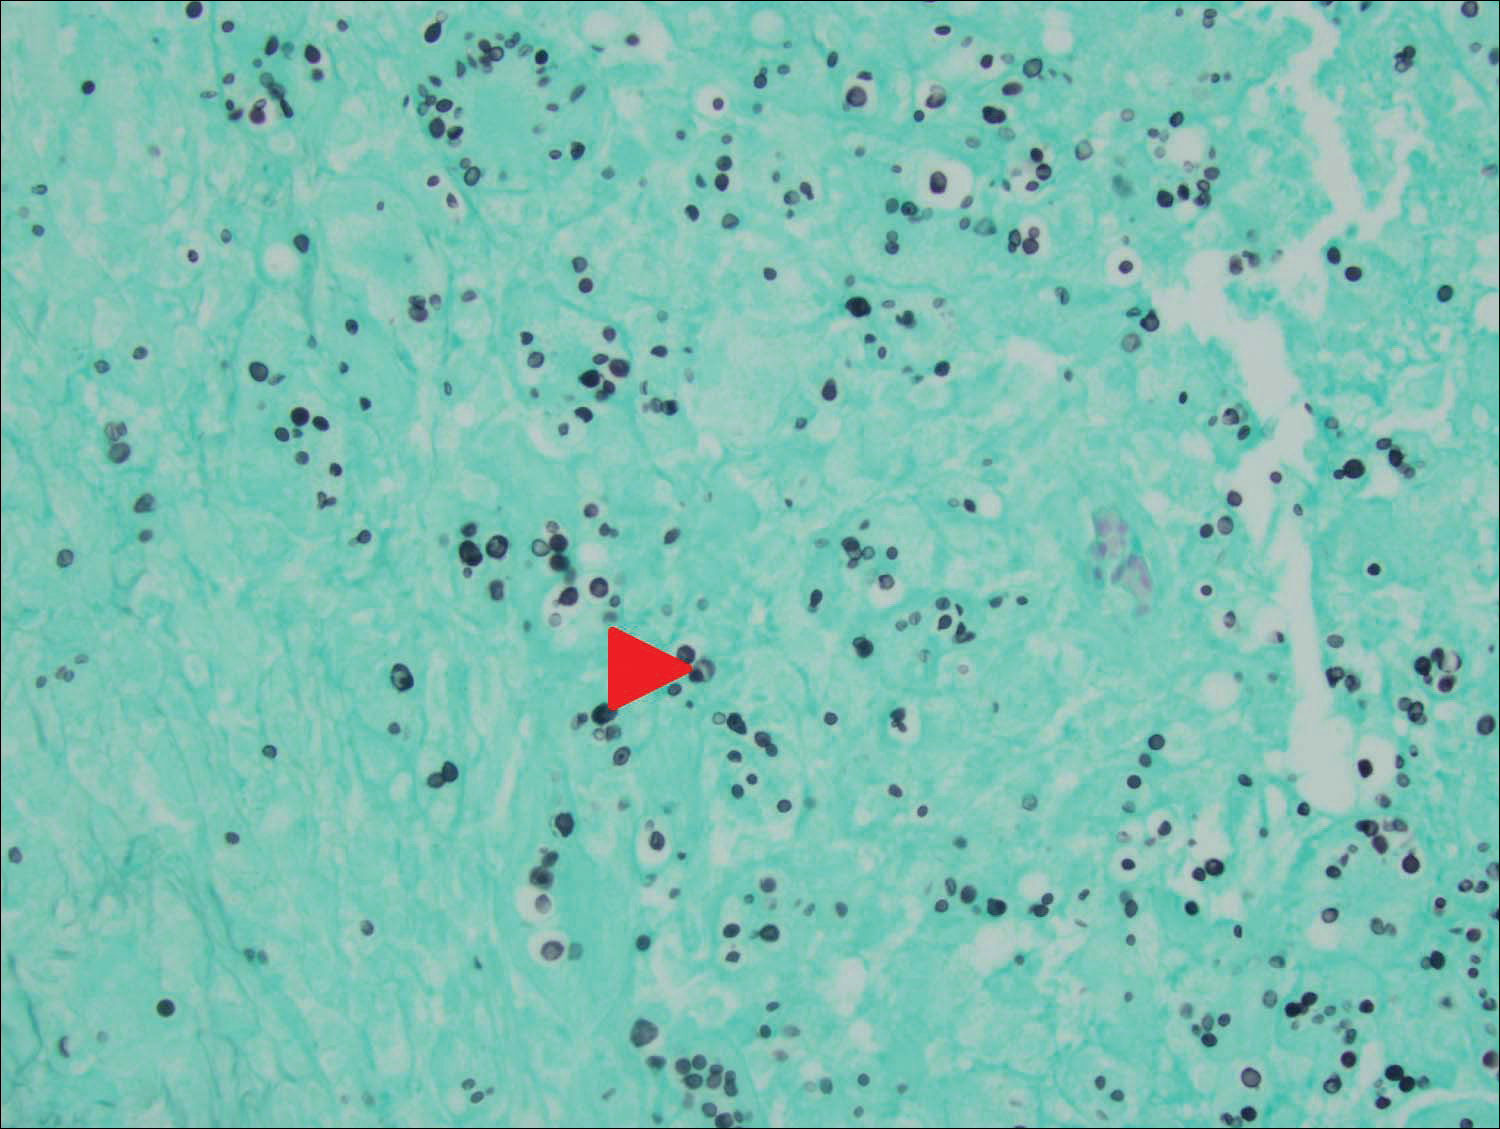
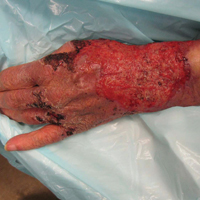
An 80-year-old woman who was residing in a nursing facility presented to the emergency department with an itchy nontender rash on the left arm of 2 to 3 weeks' duration that gradually spread. The patient had not started any new topical or oral medications and was otherwise healthy. A review of symptoms was negative for fever, weight loss, or new cough. Her medical history was notable for congestive heart failure, chronic obstructive pulmonary disease requiring chronic low-dose prednisone, hypothyroidism, atrial fibrillation, hypertension, and dementia. On physical examination the patient had a large, well-demarcated, pink, scaly plaque with areas of ulceration extending from the dorsal aspect of the hand and fingers to the mid upper arm. There was minimal overlying yellow-brown crust (Figure 1). A potassium hydroxide preparation from a superficial scraping was negative. A punch biopsy specimen was obtained from the lesion and microscopic examination revealed histiocytes with innumerable intracytoplasmic yeast forms demonstrating small buds (Figure 2). The organisms were highlighted by periodic acid-Schiff and Grocott-Gomori methenamine-silver stains (Figure 3), while acid-fast bacillus and Fite stains were negative. The presumptive diagnosis of cutaneous cryptococcosis was made, and subsequent culture and latex agglutination test was positive for Cryptococcus neoformans. A chest radiograph showed no evidence of active disease. Infectious disease specialists were consulted and ordered additional laboratory studies, which were negative for human immunodeficiency virus, hepatitis, and fungemia. The patient had a low CD4 count of 119 cells/μL (reference range, 496-2186 cells/μL). Workup for systemic Cryptococcus, including head computed tomography, cerebral spinal fluid analysis, and bone marrow biopsy were all negative. Epstein-Barr virus and human T lymphotropic virus tests were both negative. The source of the patient's low CD4 count was never discovered. She gradually began to improve with diligent wound care and continued fluconazole 400 mg daily. The patient's history did reveal working on a chicken farm as an adult many years ago.
Cryptococcus is a yeast that causes infection primarily through airborne spores that lead to pulmonary infection. Cryptococcus neoformans is the most common pathogenic strain, though infection with other strains such as Cryptococcus albidus1 and Cryptococcus laurentii2 have been reported. Primary cutaneous cryptococcosis is an exceedingly rare entity, with the majority of cases of cutaneous cryptococcosis originating from primary pulmonary infection with hematogenous dissemination to the skin. Primary cutaneous cryptococcosis rarely can be caused by inoculation in nonimmunosuppressed hosts and infection of nonimmunosuppressed hosts is more common in men than in women.3 Manifestations of cutaneous cryptococcosis can be incredibly varied and diagnosis requires a high index of suspicion along with appropriate histological and serological confirmation. Cutaneous cryptococcosis can present in various clinical ways, including molluscumlike lesions, which are more common in patients with AIDS; acneform lesions; vesicles; dermal plaques or nodules; and rarely cellulitis with ulcerations, as in our patient. Cryptococcosis also can imitate basal cell carcinoma, nummular and follicular eczema, and Kaposi sarcoma.4
Histologic examination reveals either a gelatinous or granulomatous pattern based on the number of organisms present. The gelatinous pattern is characterized by little inflammation and a large number of phagocytosed organisms floating in mucin. The granulomatous pattern shows prominent inflammation with lymphocytes, histiocytes, and giant cells, as well as associated necrosis.
Treatment depends on the type of infection and host immunological status. Immunocompetent hosts with cutaneous infection may spontaneously heal. Treatment consists of surgical excision, if possible, followed by fluconazole or itraconazole. For disseminated cryptococcal infections in immunosuppressed hosts, the standard of care is amphotericin B with or without flucytosine.3
- Hoang JK, Burruss J. Localized cutaneous Cryptococcus albidus infection in a 14-year-old boy on etanercept therapy [published online June 5, 2007]. Pediatr Dermatol. 2007;24:285-288. doi:10.1111/j.1525-1470.2007.00404.x.
- Vlchkova-Lashkoska M, Kamberova S, Starova A, et al. Cutaneous Cryptococcus laurentii infection in a human immunodeficiency virus-negative subject. J Eur Acad Dermatol Venereol. 2004;18:99-100.
- Antony SA, Antony SJ. Primary cutaneous Cryptococcus in nonimmunocompromised patients. Cutis. 1995;56:96-98.
- Murakawa GJ, Kerschmann R, Berger T. Cutaneous Cryptococcus infection and AIDS. report of 12 cases and review of the literature. Arch Dermatol. 1996;132:545-548.
To the Editor:
Primary cutaneous cryptococcal infection is rare. Cryptococcal skin infections, either primary or disseminated, can be highly pleomorphic and mimic entities such as basal cell carcinoma or even severe dermatitis, as in our case.
An 80-year-old woman who was residing in a nursing facility presented to the emergency department with an itchy nontender rash on the left arm of 2 to 3 weeks' duration that gradually spread. The patient had not started any new topical or oral medications and was otherwise healthy. A review of symptoms was negative for fever, weight loss, or new cough. Her medical history was notable for congestive heart failure, chronic obstructive pulmonary disease requiring chronic low-dose prednisone, hypothyroidism, atrial fibrillation, hypertension, and dementia. On physical examination the patient had a large, well-demarcated, pink, scaly plaque with areas of ulceration extending from the dorsal aspect of the hand and fingers to the mid upper arm. There was minimal overlying yellow-brown crust (Figure 1). A potassium hydroxide preparation from a superficial scraping was negative. A punch biopsy specimen was obtained from the lesion and microscopic examination revealed histiocytes with innumerable intracytoplasmic yeast forms demonstrating small buds (Figure 2). The organisms were highlighted by periodic acid-Schiff and Grocott-Gomori methenamine-silver stains (Figure 3), while acid-fast bacillus and Fite stains were negative. The presumptive diagnosis of cutaneous cryptococcosis was made, and subsequent culture and latex agglutination test was positive for Cryptococcus neoformans. A chest radiograph showed no evidence of active disease. Infectious disease specialists were consulted and ordered additional laboratory studies, which were negative for human immunodeficiency virus, hepatitis, and fungemia. The patient had a low CD4 count of 119 cells/μL (reference range, 496-2186 cells/μL). Workup for systemic Cryptococcus, including head computed tomography, cerebral spinal fluid analysis, and bone marrow biopsy were all negative. Epstein-Barr virus and human T lymphotropic virus tests were both negative. The source of the patient's low CD4 count was never discovered. She gradually began to improve with diligent wound care and continued fluconazole 400 mg daily. The patient's history did reveal working on a chicken farm as an adult many years ago.
Cryptococcus is a yeast that causes infection primarily through airborne spores that lead to pulmonary infection. Cryptococcus neoformans is the most common pathogenic strain, though infection with other strains such as Cryptococcus albidus1 and Cryptococcus laurentii2 have been reported. Primary cutaneous cryptococcosis is an exceedingly rare entity, with the majority of cases of cutaneous cryptococcosis originating from primary pulmonary infection with hematogenous dissemination to the skin. Primary cutaneous cryptococcosis rarely can be caused by inoculation in nonimmunosuppressed hosts and infection of nonimmunosuppressed hosts is more common in men than in women.3 Manifestations of cutaneous cryptococcosis can be incredibly varied and diagnosis requires a high index of suspicion along with appropriate histological and serological confirmation. Cutaneous cryptococcosis can present in various clinical ways, including molluscumlike lesions, which are more common in patients with AIDS; acneform lesions; vesicles; dermal plaques or nodules; and rarely cellulitis with ulcerations, as in our patient. Cryptococcosis also can imitate basal cell carcinoma, nummular and follicular eczema, and Kaposi sarcoma.4
Histologic examination reveals either a gelatinous or granulomatous pattern based on the number of organisms present. The gelatinous pattern is characterized by little inflammation and a large number of phagocytosed organisms floating in mucin. The granulomatous pattern shows prominent inflammation with lymphocytes, histiocytes, and giant cells, as well as associated necrosis.
Treatment depends on the type of infection and host immunological status. Immunocompetent hosts with cutaneous infection may spontaneously heal. Treatment consists of surgical excision, if possible, followed by fluconazole or itraconazole. For disseminated cryptococcal infections in immunosuppressed hosts, the standard of care is amphotericin B with or without flucytosine.3
- Hoang JK, Burruss J. Localized cutaneous Cryptococcus albidus infection in a 14-year-old boy on etanercept therapy [published online June 5, 2007]. Pediatr Dermatol. 2007;24:285-288. doi:10.1111/j.1525-1470.2007.00404.x.
- Vlchkova-Lashkoska M, Kamberova S, Starova A, et al. Cutaneous Cryptococcus laurentii infection in a human immunodeficiency virus-negative subject. J Eur Acad Dermatol Venereol. 2004;18:99-100.
- Antony SA, Antony SJ. Primary cutaneous Cryptococcus in nonimmunocompromised patients. Cutis. 1995;56:96-98.
- Murakawa GJ, Kerschmann R, Berger T. Cutaneous Cryptococcus infection and AIDS. report of 12 cases and review of the literature. Arch Dermatol. 1996;132:545-548.
Practice Points
- Primary cutaneous cryptococcosis is rare in nonimmunosuppressed patients.
- Primary cutaneous cryptococcosis secondary to inoculation can have a clinical presentation similar to more common conditions, such as molluscum, acne, and dermatitis.
How will crisaborole for atopic dermatitis fit into clinical practice?
WAILEA, HAWAII – With the recent approval of crisaborole ointment 2% for the treatment of atopic dermatitis, the question of how to best utilize this novel drug in daily clinical practice was put to two atopic dermatitis experts at the Hawaii Dermatology Seminar sponsored by the Global Academy for Medical Education/Skin Disease Research Foundation.
Two of these experts, Lawrence F. Eichenfield, MD, and Wynnis L. Tom, MD, have garnered extensive clinical trials experience with crisaborole (Eucrisa), which, in December 2016, became the first prescription drug approved by the Food and Drug Administration for atopic dermatitis (AD) in more than 10 years. The topical phosphodiesterase-4 inhibitor is indicated for twice-daily treatment of patients aged 2 years and older with mild to moderate AD.

“Topical steroids are the most cost-effective medicine for the management of acute flares of atopic dermatitis. And if I can then take patients down to only intermittent use of topical corticosteroids of mid-strength or lower, depending on patient age, I’ll probably hang in and do just that,” said Dr. Eichenfield, professor of dermatology and pediatrics at the University of California, San Diego, and chief of pediatric and adolescent dermatology at Rady Children’s Hospital-San Diego.
“But, when I have patients with more persistent disease, frequent flaring where I can’t get by with just twice-a-week topical steroids, or ... sensitive areas where I need to avoid steroid atrophy, that’s when I’m likely to incorporate a nonsteroidal agent into regimens of care. Traditionally, over the past 15-18 years, that’s been either with topical tacrolimus [Protopic] or pimecrolimus [Elidel]. And now crisaborole will fit right in there,” he continued.
As for how long to keep patients on crisaborole, Dr. Eichenfield noted that the package labeling “is pretty open.” It doesn’t address the question of treatment duration, and the patient handout that accompanies the tube of ointment simply states, “Use [crisaborole] Eucrisa exactly as your health care provider tells you to use it.”
“In a no-data situation such as this, I’ll probably try to see if use a few times a week or in a mix/match between corticosteroids, a topical calcineurin inhibitor, and crisaborole will provide decent long-term disease control,” Dr. Eichenfield said.
The important, remaining questions regarding crisaborole include, Is it comparatively efficient? – a question that will require head-to-head clinical trials. Is it cost effective? Will it be effective and safe in children younger than 2 years of age? Is it safe beyond 1 year of use? – a particularly important question, given that the phase III clinical trials were only a month long, the dermatologist added.
Dr. Eichenfield emphasized that he was offering only his personal opinion on the use of crisaborole in response to audience questions. Eventually, guidelines committees will formally address how to incorporate the new drug into a sound treatment strategy.
Dr. Tom, like Dr. Eichenfield, was a coauthor of the two pivotal phase III randomized trials of crisaborole, which found infrequent and minimal side effects along with significant improvement of formal quality of life measures (J Am Acad Dermatol. 2016 Sep;75[3]:494-503.e4).
She said that one way she’ll immediately put the new topical agent to work is in treating disease on the face and other sensitive skin areas. The drug’s steroid-sparing ability is also a major asset, given how many parents of children with AD are steroid phobic.
“I’m certainly not going to give up on topical steroids, but anything that enables me to lessen their use is a comfort for parents. That’s really important,” observed Dr. Tom of the University of California, San Diego, and Rady Children’s Hospital.
Both pediatric dermatologists reported having received research grants from or serving as consultants to roughly half-a-dozen pharmaceutical companies, including Anacor/Pfizer, which markets crisaborole.
SDEF and this news organization are owned by the same parent company.
WAILEA, HAWAII – With the recent approval of crisaborole ointment 2% for the treatment of atopic dermatitis, the question of how to best utilize this novel drug in daily clinical practice was put to two atopic dermatitis experts at the Hawaii Dermatology Seminar sponsored by the Global Academy for Medical Education/Skin Disease Research Foundation.
Two of these experts, Lawrence F. Eichenfield, MD, and Wynnis L. Tom, MD, have garnered extensive clinical trials experience with crisaborole (Eucrisa), which, in December 2016, became the first prescription drug approved by the Food and Drug Administration for atopic dermatitis (AD) in more than 10 years. The topical phosphodiesterase-4 inhibitor is indicated for twice-daily treatment of patients aged 2 years and older with mild to moderate AD.
“Topical steroids are the most cost-effective medicine for the management of acute flares of atopic dermatitis. And if I can then take patients down to only intermittent use of topical corticosteroids of mid-strength or lower, depending on patient age, I’ll probably hang in and do just that,” said Dr. Eichenfield, professor of dermatology and pediatrics at the University of California, San Diego, and chief of pediatric and adolescent dermatology at Rady Children’s Hospital-San Diego.
“But, when I have patients with more persistent disease, frequent flaring where I can’t get by with just twice-a-week topical steroids, or ... sensitive areas where I need to avoid steroid atrophy, that’s when I’m likely to incorporate a nonsteroidal agent into regimens of care. Traditionally, over the past 15-18 years, that’s been either with topical tacrolimus [Protopic] or pimecrolimus [Elidel]. And now crisaborole will fit right in there,” he continued.
As for how long to keep patients on crisaborole, Dr. Eichenfield noted that the package labeling “is pretty open.” It doesn’t address the question of treatment duration, and the patient handout that accompanies the tube of ointment simply states, “Use [crisaborole] Eucrisa exactly as your health care provider tells you to use it.”
“In a no-data situation such as this, I’ll probably try to see if use a few times a week or in a mix/match between corticosteroids, a topical calcineurin inhibitor, and crisaborole will provide decent long-term disease control,” Dr. Eichenfield said.
The important, remaining questions regarding crisaborole include, Is it comparatively efficient? – a question that will require head-to-head clinical trials. Is it cost effective? Will it be effective and safe in children younger than 2 years of age? Is it safe beyond 1 year of use? – a particularly important question, given that the phase III clinical trials were only a month long, the dermatologist added.
Dr. Eichenfield emphasized that he was offering only his personal opinion on the use of crisaborole in response to audience questions. Eventually, guidelines committees will formally address how to incorporate the new drug into a sound treatment strategy.
Dr. Tom, like Dr. Eichenfield, was a coauthor of the two pivotal phase III randomized trials of crisaborole, which found infrequent and minimal side effects along with significant improvement of formal quality of life measures (J Am Acad Dermatol. 2016 Sep;75[3]:494-503.e4).
She said that one way she’ll immediately put the new topical agent to work is in treating disease on the face and other sensitive skin areas. The drug’s steroid-sparing ability is also a major asset, given how many parents of children with AD are steroid phobic.
“I’m certainly not going to give up on topical steroids, but anything that enables me to lessen their use is a comfort for parents. That’s really important,” observed Dr. Tom of the University of California, San Diego, and Rady Children’s Hospital.
Both pediatric dermatologists reported having received research grants from or serving as consultants to roughly half-a-dozen pharmaceutical companies, including Anacor/Pfizer, which markets crisaborole.
SDEF and this news organization are owned by the same parent company.
EXPERT ANALYSIS FROM THE SDEF HAWAII DERMATOLOGY SEMINAR
Resident Match Day 2017: Record number of applicants and matches
Once again, a record was set for both the number of slots available for residency programs and the number of positions filled during the 2017 Main Residency Match.
This is the fifth straight year the National Resident Matching Program (NRMP) has reported growth, with 35,969 applicants submitting their program choices, up 1.4% from the previous year, and 27,688 positions matched to postgraduate year 1 (PGY-1) applicants, up 3.2% from 2016.
One factor driving the increase is the “all-in” policy that required programs registering for the Match to offer all their available positions in the Match or another national matching program. The policy, which began with the 2013 Match, has resulted in significant increases for internal medicine, family medicine, and pediatrics.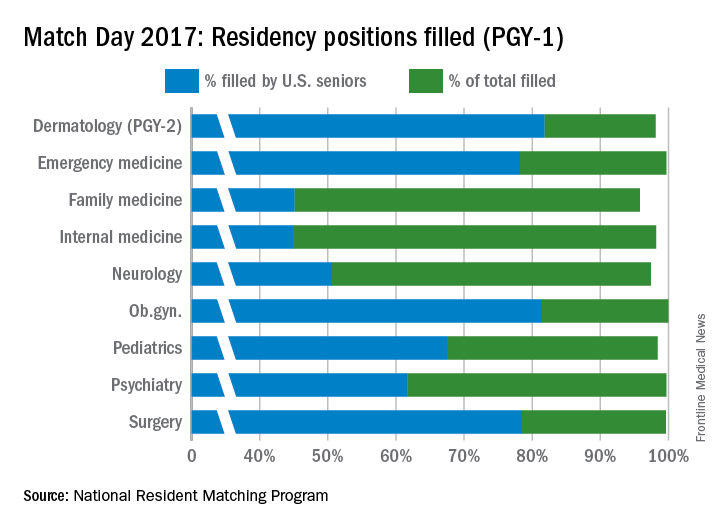
The year-over-year increase in internal medicine was tracking similar to the increase in overall positions, something seen as a good thing by the American College of Physicians (ACP).

Family medicine, the next largest offering, accounted for 11.6% of all positions. In 2017, there 3,356 residency slots offered, up from 3,238 in 2016. U.S. graduates accounted for 45.1% of the 3,215 positions filled this year, roughly the same rate as last year.

Pediatrics ranked third in positions offered (2,738, or 9.5% of all positions offered) and had 98.4% of those slots fill this year. Of the 2,693 spots that were filled, 67.5% were filled by U.S. medical school graduates, about the same rate as in 2016.
Other specialties that made up a smaller percentage of the overall Match positions but boasted high total fill rates for PGY-1 positions in 2017 were emergency medicine (99.7%), neurology (97.4%), ob.gyn. (100%), psychiatry (99.7%), and surgery (99.6%).
A record-high 18,539 allopathic medical school seniors submitted program choices and 17,480 (94.3%) were matched to first-year resident programs, a rate that has been consistent for a number of years according to NRMP data.
Of the 1,279 unfilled slots, 1,177 were offered in the Match Week Supplemental Offer and Acceptance Program, the results of which will be available in May.

“I was surprised that the number of U.S.-citizen and non-U.S.-citizen IMGs declined this year, but on the other hand, the good news is their match rates went up,” Ms. Signer said in an interview.
U.S.-citizen IMGs declined by 254 to 5,069, but 54.8% were matched to first-year residency positions, the highest match rate since 2004. The number of non-U.S.-citizen IMGs declined by 176 to 7,284, but 52.4% were matched to first-year positions, the highest match rate since 2005.
Ms. Signer declined to speculate what caused the decline, noting that NRMP does not collect demographic data.
Dr. Masters of the ACP noted that IMGs are filling a significant portion of internal medicine positions, now at around 45%.

Dr. Masters noted that this trend is important in light of the White House’s continued attempts to curb immigration from certain parts of the world.
“That really accentuates the concerns that ACP has with the executive orders that could potentially disrupt the movement of international medical graduates here for training,” he said.
Once again, a record was set for both the number of slots available for residency programs and the number of positions filled during the 2017 Main Residency Match.
This is the fifth straight year the National Resident Matching Program (NRMP) has reported growth, with 35,969 applicants submitting their program choices, up 1.4% from the previous year, and 27,688 positions matched to postgraduate year 1 (PGY-1) applicants, up 3.2% from 2016.
One factor driving the increase is the “all-in” policy that required programs registering for the Match to offer all their available positions in the Match or another national matching program. The policy, which began with the 2013 Match, has resulted in significant increases for internal medicine, family medicine, and pediatrics.
The year-over-year increase in internal medicine was tracking similar to the increase in overall positions, something seen as a good thing by the American College of Physicians (ACP).
Family medicine, the next largest offering, accounted for 11.6% of all positions. In 2017, there 3,356 residency slots offered, up from 3,238 in 2016. U.S. graduates accounted for 45.1% of the 3,215 positions filled this year, roughly the same rate as last year.
Pediatrics ranked third in positions offered (2,738, or 9.5% of all positions offered) and had 98.4% of those slots fill this year. Of the 2,693 spots that were filled, 67.5% were filled by U.S. medical school graduates, about the same rate as in 2016.
Other specialties that made up a smaller percentage of the overall Match positions but boasted high total fill rates for PGY-1 positions in 2017 were emergency medicine (99.7%), neurology (97.4%), ob.gyn. (100%), psychiatry (99.7%), and surgery (99.6%).
A record-high 18,539 allopathic medical school seniors submitted program choices and 17,480 (94.3%) were matched to first-year resident programs, a rate that has been consistent for a number of years according to NRMP data.
Of the 1,279 unfilled slots, 1,177 were offered in the Match Week Supplemental Offer and Acceptance Program, the results of which will be available in May.
“I was surprised that the number of U.S.-citizen and non-U.S.-citizen IMGs declined this year, but on the other hand, the good news is their match rates went up,” Ms. Signer said in an interview.
U.S.-citizen IMGs declined by 254 to 5,069, but 54.8% were matched to first-year residency positions, the highest match rate since 2004. The number of non-U.S.-citizen IMGs declined by 176 to 7,284, but 52.4% were matched to first-year positions, the highest match rate since 2005.
Ms. Signer declined to speculate what caused the decline, noting that NRMP does not collect demographic data.
Dr. Masters of the ACP noted that IMGs are filling a significant portion of internal medicine positions, now at around 45%.
Dr. Masters noted that this trend is important in light of the White House’s continued attempts to curb immigration from certain parts of the world.
“That really accentuates the concerns that ACP has with the executive orders that could potentially disrupt the movement of international medical graduates here for training,” he said.
New approach for monitoring minimum residual disease in multiple myeloma
Next-generation sequencing might be useful to monitor for minimum residual disease in multiple myeloma, based on the results of a pilot study of 27 patients.
Of study participants whose multiple myeloma at least partially remitted on therapy, 41% showed evidence of persistent circulating myeloma cells or cell-free myeloma DNA based on next-generation sequencing of the clonotypic V(D)J rearrangement, compared with 91% of nonresponders or progressors (P less than .001), reported Anna Oberle of University Medical Center Hamburg-Eppendorf, Hamburg, Germany, and her associates. The findings were published in Haematologica.
“Taken together, our pilot study gives valuable biological insights into the circulating cellular and cell-free compartments explorable by ‘liquid biopsy’ in multiple myeloma,” the investigators wrote. Levels of V(D)J-positive circulating myeloma cells and cell-free DNA might decline faster in response to effective therapy than the “relatively inert M-protein,” and might therefore be a better way to immediately estimate treatment efficacy or predict minimum residual disease negativity, they added (Haematologica. 2017 Feb 9. doi: 10.3324/haematol.2016.161414).
Novel multiple myeloma therapies are inducing deeper, longer responses, which highlights the need for minimum residual disease monitoring, the researchers said. Next-generation sequencing of the clonotypic V(D)J immunoglobulin rearrangement has shown promise but requires painful bone marrow sampling. A minimally invasive alternative is to monitor for circulating myeloma cells (cmc) or cell-free myeloma (cfm). To investigate the feasibility of this technique, the researchers used next-generation sequencing to define the myeloma V(D)J rearrangement in bone marrow and to track sequential peripheral blood samples from multiple myeloma patients before and during treatment. Next-generation sequencing was performed with an Illumina MiSeq sequencer with 500 or 600 cycle single-indexed, paired-end runs.
After treatment initiation, 47% of follow-up peripheral blood samples were positive for cmc-V(D)J, cfm-V(D)J, or both, the researchers said. They found a clear link between poor remission status assessed by M-protein based IMWG criteria and positive cmc-V(D)J sampling, with a regression coefficient of 1.60 (95% CI, 0.68 to 2.50; P = .002). Poor remission status was also associated with evidence of cfm-V(D)J (regression coefficient 1.49; 95% CI, 0.70 to 2.27; P = .001).
“About half of partial responders showed complete clearance of circulating myeloma cells-/cell-free myeloma DNA -V(D)J despite persistent M-protein, suggesting that these markers are less inert than the M-protein, rely more on cell turnover, and therefore decline more rapidly after initiation of effective treatment,” the researchers emphasized. Also, in 30% of cases, patients were positive for only one of the two V(D)J measures, suggesting that cfm-V(D)J might reflect overall tumor burden, not just circulating tumor cells, they added. “Prospective studies need to define the predictive potential of high-sensitivity determination of circulating myeloma cells and DNA in the monitoring of multiple myeloma,” they concluded.
Eppendorfer Krebs- und Leukämiehilfe e.V. and the Deutsche Krebshilfe funded the study. The researchers disclosed no conflicts of interest.
Key clinical point: Next-generation sequencing might be useful to monitor for minimum residual disease in multiple myeloma.
Major finding: Of patients who at least partially remitted on therapy, 41% showed evidence of persistent circulating myeloma cells or cell-free myeloma DNA based on next-generation sequencing of the clonotypic V(D)J rearrangement, compared with 91% of nonresponders or progressors (P less than .001).
Data source: A pilot study of 27 patients with multiple myeloma.
Disclosures: Eppendorfer Krebs- und Leukämiehilfe e.V. and the Deutsche Krebshilfe funded the study. The researchers disclosed no conflicts of interest.
Inclisiran shows sustained and significant declines in LDL-C
The small interfering RNA molecule inclisiran has achieved significant reductions in LDL-cholesterol levels in patients at high cardiovascular risk, according to data presented at the annual meeting of the American College of Cardiology and published simultaneously in the New England Journal of Medicine.
Inclisiran is an investigational, chemically synthesized, small interfering RNA molecule that targets the liver-derived serine protease proprotein convertase subtilisin-kexin type 9 (PCSK9), which promotes degradation of the LDL-receptor.
An earlier phase I trial of inclisiran in healthy volunteers showed sustained reductions in LDL-C levels. In this phase II randomized, placebo-controlled trial, researchers tested a single dose (200, 300, or 500 mg) or double dose (100, 200, or 300 mg on day 1 and day 90) subcutaneous injection, compared with placebo in 501 patients with elevated LDL-C who were at high risk for cardiovascular disease.
By day 30 after the first injection, mean reductions in LDL-C ranged from 44.5% to 50.5% below baseline levels across all dosages of inclisiran (N Engl J Med. 2017 Mar 17. doi: 10.1056/NEJMoa1615758).
By day 180, the mean reductions in LDL-C were 27.9%-41.9% in patients who received a single dose and 35.5%-52.6% in those who received a double dose. By comparison, patients who received placebo showed a 2.1% mean increase in LDL-C.
All patients who received two 300-mg doses of inclisiran showed reductions in LDL-C by day 180, with a mean absolute change of –64.2 ± 20.7 mg/dL. More than half of this group (54%) achieved LDL-C reductions of 50% or more below baseline.
In this same dosage group, 5% of patients achieved LDL-C levels below 25 mg/dL, 48% achieved levels below 50 mg/dL, and 66% achieved levels below 70 mg/dL by day 180 after the first dose.
Researchers observed a nadir in patients’ response at around day 60 for the single-dose group and day 140 for the double-dose group.
“Maintaining consistent and effective reductions in LDL-cholesterol levels in the long term through the use of statins is, in part, hindered by adherence,” wrote Kausik K. Ray, MD, of Imperial College London, and his coauthors. “Hence, approaches that not only lower LDL-cholesterol levels safely but also can maintain reduction consistently over time, when applied either in lieu of or simultaneously with statin therapy, are being sought.”
However, they also clarified that it was still unknown as to whether these LDL-C reductions would translate into reductions in cardiovascular events.
Researchers also saw significant declines in PCSK9 levels from baseline in all patients who received inclisiran. Among those who received a single dose, mean reductions in PCSK9 at 180 days ranged from 47.9% to 59.3%, while those who received a double dose showed mean reductions ranging from 53.2% to 69.1%.
The overall rate of adverse events was similar between the inclisiran and placebo groups (76% vs. 79%, respectively), while the rate of serious adverse events was 11% in the inclisiran group and 8% in the placebo group.
One patient in the inclisiran group and one in the placebo group showed increased levels of hepatic aspartate aminotransferase, and three patients in the inclisiran group had elevated alanine aminotransferase. No increases in bilirubin levels were observed.
“Symptoms of immune activation, which is often a concern with therapies targeting RNA, were rare in association with inclisiran: There were few instances of flu-like symptoms and no observed elevations in C-reactive protein,” the authors wrote.
Injection-site reactions were also relatively uncommon, occurring in 4% of patients treated with one dose of inclisiran, 7% of those treated with two doses, and none of the placebo group.
The authors, however, said that, given the small size and relatively short duration of the trial, they could not rule out the possibility of other infrequent serious side effects. A long-term open-label study also is being conducted.
The study was funded by the Medicines Company. Several authors declared receiving personal fees from pharmaceutical companies outside the submitted work and 10 also declared receiving personal fees from the Medicines Company, 6 involving the submitted work. One author was an employee of the Medicines Company with stock options.
FROM ACC 17
Key clinical point: Investigational small interfering RNA molecule inclisiran has shown significant reductions in LDL-cholesterol levels in patients at high cardiovascular risk.
Major finding: A double dose of inclisiran was associated with a 35.5%-52.6% decline in LDL-cholesterol levels from baseline by day 180 after the first injection.
Data source: The phase II ORION-1 trial in 501 patients with elevated LDL-C and high risk for cardiovascular disease.
Disclosures: The study was funded by the Medicines Company. Several authors declared receiving personal fees from pharmaceutical companies outside the submitted work and 10 also declared personal fees from the Medicines Company, 6 involving the submitted work. One author was an employee of the Medicines Company with stock options.