User login
Prevalence of Low Vitamin D Levels in Patients With Orthopedic Trauma
The role of vitamin D in general health maintenance is a topic of increasing interest and importance in the medical community. Not only has vitamin D deficiency been linked to a myriad of nonorthopedic maladies, including cancer, diabetes, and cardiovascular disease, but it has demonstrated an adverse effect on musculoskeletal health.1 Authors have found a correlation between vitamin D deficiency and muscle weakness, fragility fractures, and, most recently, fracture nonunion.1 Despite the detrimental effects of vitamin D deficiency on musculoskeletal and general health, evidence exists that vitamin D deficiency is surprisingly prevalent.2 This deficiency is known to be associated with increasing age, but recent studies have also found alarming rates of deficiency in younger populations.3,4
Although there has been some discussion regarding optimal serum levels of 25-hydroxyvitamin D, most experts have defined vitamin D deficiency as a 25-hydroxyvitamin D level of 20 ng/mL or less and insufficiency as 21 to 32 ng/mL.5 Hollis and Wagner5 found increased serum parathyroid hormone and bone resorption and impaired dietary absorption of calcium when 25-hydroxyvitamin D levels were under 32 ng/mL. Given these data, a 25-hydroxyvitamin D level of 21 to 32 ng/mL (52-72 nmol/L) can be considered as indicating a relative insufficiency of vitamin D, and a level of 20 ng/mL or less can be considered as indicating vitamin D deficiency.
Vitamin D plays a vital role in bone metabolism and has been implicated in increased fracture risk and in fracture healing ability. Therefore, documenting the prevalence of vitamin D deficiency in patients with trauma is the first step in raising awareness among orthopedic traumatologists and further developing a screening-and-treatment strategy for vitamin D deficiency in these patients. Steele and colleagues6 retrospectively studied 44 patients with high- and low-energy fractures and found an almost 60% prevalence of vitamin D insufficiency. If vitamin D insufficiency is this prevalent, treatment protocols for patients with fractures may require modifications that include routine screening and treatment for low vitamin D levels.
After noting a regular occurrence of hypovitaminosis D in our patient population (independent of age, sex, or medical comorbidities), we conducted a study to determine the prevalence of vitamin D deficiency in a large orthopedic trauma population.
Patients and Methods
After obtaining Institutional Review Board approval for this study, we retrospectively reviewed the charts of all patients with a fracture treated by 1 of 4 orthopedic traumatologists within a 21-month period (January 1, 2009 to September 30, 2010). Acute fracture and recorded 25-hydroxyvitamin D level were the primary criteria for study inclusion. Given the concern about vitamin D deficiency, it became common protocol to check the serum 25-hydroxyvitamin D levels of patients with acute fractures during the review period. Exclusion criteria were age under 18 years and presence of vitamin D deficiency risk factors, including renal insufficiency (creatinine level, ≥2 mg/dL), malabsorption, gastrectomy, active liver disease, acute myocardial infarction, alcoholism, anorexia nervosa, and steroid dependency.
During the period studied, 1830 patients over age 18 years were treated by 4 fellowship-trained orthopedic traumatologists. Of these patients, 889 (487 female, 402 male) met the inclusion criteria. Mean age was 53.8 years. Demographic data (age, sex, race, independent living status, comorbid medical conditions, medications) were collected from the patients’ medical records. Clinical data collected were mechanism of injury, fracture location and type, injury date, surgery date and surgical procedure performed (when applicable), and serum 25-hydroxyvitamin D levels.
Statistical Methods
Descriptive statistics (mean, median, mode) were calculated. The χ2 test was used when all cell frequencies were more than 5, and the Fisher exact probability test was used when any cell frequency was 5 or less. Prevalence of vitamin D deficiency and insufficiency was calculated in multiple patient populations. Patients were analyzed according to age and sex subgroups.
Definitions
Vitamin D deficiency was defined as a serum 25-hydroxyvitamin D level of 20 ng/mL or less and insufficiency as 21 to 32 ng/mL.2 As the serum test was performed independent of the investigators and with use of standard medical laboratory protocols and techniques, there should be no bias in the results. We had intended to have all patients undergo serum testing during the review period because that was our usual protocol. However, test results were available for only 889 (49%) of the 1830 patients with orthopedic trauma during the review period. Although a false-positive is theoretically possible, this series of orthopedic trauma patients is the largest in the literature and therefore should be more accurate than the previously reported small series.
Results
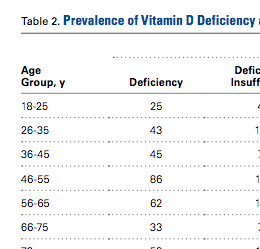
There were no significant (P < .05) age or sex differences in prevalence of vitamin D deficiency or insufficiency in our patient population. Overall prevalence of deficiency/insufficiency was 77.39%, and prevalence of deficiency alone was 39.03% (Table 1). 

Women in the 18- to 25-year age group had a lower prevalence of deficiency (25%; P = .41) and insufficiency (41.7%; P = .16) than women in the other age groups (Table 3). 

Discussion
We conducted this study to determine the prevalence of vitamin D deficiency in a large population of patients with orthopedic trauma. Results showed that vitamin D deficiency and insufficiency were prevalent in this population, which to our knowledge is the largest studied for vitamin D deficiency. In a 6-month study of 44 fractures, Steele and colleagues6 found an overall 60% rate of deficiency/insufficiency. Although their investigation is important—it was the first of its kind to evaluate patients with various fracture types, including those with high-energy causes—its numbers were small, and the period evaluated (June 1, 2006 to February 1, 2007) was short (8 months). Use of that time frame may have led to an underestimate of the prevalence of vitamin D deficiency, as vitamin D levels are higher in late summer because of increased sun exposure. Our study of 889 patients over 21 months allowed for seasonal variability of vitamin D levels. We did not notice a specific difference in patients who were treated during winter vs summer. Furthermore, our 77% prevalence of vitamin D insufficiency and 39% prevalence of vitamin D deficiency indicate how widespread low vitamin D levels are in a large Midwestern orthopedic trauma population. In the Pacific Northwest, Bee and colleagues7 studied seasonal differences in patients with surgically treated fractures and found an average difference of 3 ng/mL between winter and summer serum levels. However, the real issue, which should not be overlooked, is that the average 25-hydroxyvitamin D level was under 30 ng/mL in both cohorts (26.4 ng/mL in winter vs 29.8 ng/mL in summer). The emphasis should be that both levels were insufficient and that seasonal variance does not really change prevalence.
With use of the current definitions, it has been estimated that 1 billion people worldwide have vitamin D deficiency or insufficiency, with the elderly and certain ethnic populations at higher risk.8-10Vitamin D deficiency is a common diagnosis among elderly patients with hip fractures. According to various reports, 60% to 90% of patients treated for hip fractures are deficient or insufficient in vitamin D.8,9Hypovitaminosis D has also been noted in medical inpatients with and without risks for this deficiency.2 Surprisingly, low vitamin D levels are not isolated to the elderly. In Massachusetts, Gordon and colleagues11 found a 52% prevalence of vitamin D deficiency in Hispanic and black adolescents. Nesby-O’Dell and colleagues10 found that 42% of 15- to 49-year-old black women in the United States had vitamin D deficiency at the end of winter. Bogunovic and colleagues12 noted 5.5 times higher risk of low vitamin D levels in patients with darker skin tones. Although vitamin D deficiency has been linked to specific races, it frequently occurs in lower-risk populations as well. Sullivan and colleagues4 found a 48% prevalence of vitamin D deficiency in white preadolescent girls in Maine. Tangpricha and colleagues3 reported a 32% prevalence of vitamin D deficiency in otherwise fit healthcare providers sampled at a Boston hospital. Bogunovic and colleagues12 also showed that patients between ages 18 years and 50 years, and men, were more likely to have low vitamin D levels.
Establishing the prevalence of hypovitaminosis D in orthopedic trauma patients is needed in order to raise awareness of the disease and modify screening and treatment protocols. Brinker and O’Connor13 found vitamin D deficiency in 68% of patients with fracture nonunions, which suggests that hypovitaminosis D may partly account for difficulty in achieving fracture union. Bogunovic and colleagues12 found vitamin D insufficiency in 43% of 723 patients who underwent orthopedic surgery. Isolating the 121 patients on the trauma service revealed a 66% prevalence of low vitamin D levels. Our 77% prevalence of low vitamin D levels in 889 patients adds to the evidence that low levels are common in patients with orthopedic trauma. Understanding the importance of vitamin D deficiency can be significant in reducing the risk of complications, including delayed unions and nonunions, associated with treating orthopedic trauma cases.
Although our study indicates an alarming prevalence of insufficient vitamin D levels in our patient population, it does not provide a cause-and-effect link between low serum 25-hydroxyvitamin D levels and risk of fracture or nonunion. However, further investigations may yield clinically relevant data linking hypovitaminosis D with fracture risk. Although we did not include patients with nonunion in this study, new prospective investigations will address nonunions and subgroup analysis of race, fracture type, management type (surgical vs nonsurgical), injury date (to determine seasonal effect), and different treatment regimens.
The primary limitation of this study was its retrospective design. In addition, though we collected vitamin D data from 889 patients with acute fracture, our serum collection protocols were not standardized. Most patients who were admitted during initial orthopedic consultation in the emergency department had serum 25-hydroxyvitamin D levels drawn during their hospital stay, and patients initially treated in an ambulatory setting may not have had serum vitamin D levels drawn for up to 2 weeks after injury (the significance of this delay is unknown). Furthermore, the serum result rate for the overall orthopedic trauma population during the review period was only 49%, which could indicate selection bias. There are multiple explanations for the low rate. As with any new protocol or method, it takes time for the order to become standard practice; in the early stages, individuals can forget to ask for the test. In addition, during the review period, the serum test was also relatively new at our facility, and it was a “send-out” test, which could partly account for the lack of consistency. For example, some specimens were lost, and, in a number of other cases, excluded patients mistakenly had their 1,25-hydroxyvitamin D levels measured and were not comparable to included patients. Nevertheless, our sample of 889 patients with acute fractures remains the largest (by several hundred) reported in the literature.
From a practical standpoint, the present results were useful in updating our treatment protocols. Now we typically treat patients only prophylactically, with 50,000 units of vitamin D2 for 8 weeks and daily vitamin D3 and calcium until fracture healing. Patients are encouraged to continue daily vitamin D and calcium supplementation after fracture healing to maintain bone health. Compliance, however, remains a continued challenge and lack thereof can potentially explain the confusing effect of a supplementation protocol on the serum 25-hydroxyvitamin D level.14 The only patients who are not given prophylactic treatment are those who previously had been denied it (patients with chronic kidney disease or elevated blood calcium levels).
Vitamin D deficiency and insufficiency are prevalent in patients with orthopedic trauma. Studies are needed to further elucidate the relationship between low vitamin D levels and risk of complications. Retrospectively, without compliance monitoring, we have not seen a direct correlation with fracture complications.15 Our goal here was to increase orthopedic surgeons’ awareness of the problem and of the need to consider addressing low serum vitamin D levels. The treatment is low cost and low risk. The ultimate goal—if there is a prospective direct correlation between low serum vitamin D levels and complications—is to develop treatment strategies that can effectively lower the prevalence of low vitamin D levels.
Am J Orthop. 2016;45(7):E522-E526. Copyright Frontline Medical Communications Inc. 2016. All rights reserved.
1. Zaidi SA, Singh G, Owojori O, et al. Vitamin D deficiency in medical inpatients: a retrospective study of implications of untreated versus treated deficiency. Nutr Metab Insights. 2016;9:65-69.
2. Thomas MK, Lloyd-Jones DM, Thadhani RI, et al. Hypovitaminosis D in medical inpatients. N Engl J Med. 1998;338(12):777-783.
3. Tangpricha V, Pearce EN, Chen TC, Holick MF. Vitamin D insufficiency among free-living healthy young adults. Am J Med. 2002;112(8):659-662.
4. Sullivan SS, Rosen CJ, Halteman WA, Chen TC, Holick MF. Adolescent girls in Maine are at risk for vitamin D insufficiency. J Am Diet Assoc. 2005;105(6):971-974.
5. Hollis BW, Wagner CL. Normal serum vitamin D levels. N Engl J Med. 2005;352(5):515-516.
6. Steele B, Serota A, Helfet DL, Peterson M, Lyman S, Lane JM. Vitamin D deficiency: a common occurrence in both high- and low-energy fractures. HSS J. 2008;4(2):143-148.
7. Bee CR, Sheerin DV, Wuest TK, Fitzpatrick DC. Serum vitamin D levels in orthopaedic trauma patients living in the northwestern United States. J Orthop Trauma. 2013;27(5):e103-e106.
8. Bischoff-Ferrari HA, Can U, Staehelin HB, et al. Severe vitamin D deficiency in Swiss hip fracture patients. Bone. 2008;42(3):597-602.
9. Pieper CF, Colon-Emeric C, Caminis J, et al. Distribution and correlates of serum 25-hydroxyvitamin D levels in a sample of patients with hip fracture. Am J Geriatr Pharmacother. 2007;5(4):335-340.
10. Nesby-O’Dell S, Scanlon KS, Cogswell ME, et al. Hypovitaminosis D prevalence and determinants among African American and white women of reproductive age: third National Health and Nutrition Examination Survey, 1988–1994. Am J Clin Nutr. 2002;76(1):187-192.
11. Gordon CM, DePeter KC, Feldman HA, Grace E, Emans SJ. Prevalence of vitamin D deficiency among healthy adolescents. Arch Pediatr Adolesc Med. 2004;158(6):531-537.
12. Bogunovic L, Kim AD, Beamer BS, Nguyen J, Lane JM. Hypovitaminosis D in patients scheduled to undergo orthopaedic surgery: a single-center analysis. J Bone Joint Surg Am. 2010;92(13):2300-2304.
13. Brinker MR, O’Connor DP. Outcomes of tibial nonunion in older adults following treatment using the Ilizarov method. J Orthop Trauma. 2007;21(9):634-642.
14. Robertson DS, Jenkins T, Murtha YM, et al. Effectiveness of vitamin D therapy in orthopaedic trauma patients. J Orthop Trauma. 2015;29(11):e451-e453.
15. Bodendorfer BM, Cook JL, Robertson DS, et al. Do 25-hydroxyvitamin D levels correlate with fracture complications: J Orthop Trauma. 2016;30(9):e312-e317.
The role of vitamin D in general health maintenance is a topic of increasing interest and importance in the medical community. Not only has vitamin D deficiency been linked to a myriad of nonorthopedic maladies, including cancer, diabetes, and cardiovascular disease, but it has demonstrated an adverse effect on musculoskeletal health.1 Authors have found a correlation between vitamin D deficiency and muscle weakness, fragility fractures, and, most recently, fracture nonunion.1 Despite the detrimental effects of vitamin D deficiency on musculoskeletal and general health, evidence exists that vitamin D deficiency is surprisingly prevalent.2 This deficiency is known to be associated with increasing age, but recent studies have also found alarming rates of deficiency in younger populations.3,4
Although there has been some discussion regarding optimal serum levels of 25-hydroxyvitamin D, most experts have defined vitamin D deficiency as a 25-hydroxyvitamin D level of 20 ng/mL or less and insufficiency as 21 to 32 ng/mL.5 Hollis and Wagner5 found increased serum parathyroid hormone and bone resorption and impaired dietary absorption of calcium when 25-hydroxyvitamin D levels were under 32 ng/mL. Given these data, a 25-hydroxyvitamin D level of 21 to 32 ng/mL (52-72 nmol/L) can be considered as indicating a relative insufficiency of vitamin D, and a level of 20 ng/mL or less can be considered as indicating vitamin D deficiency.
Vitamin D plays a vital role in bone metabolism and has been implicated in increased fracture risk and in fracture healing ability. Therefore, documenting the prevalence of vitamin D deficiency in patients with trauma is the first step in raising awareness among orthopedic traumatologists and further developing a screening-and-treatment strategy for vitamin D deficiency in these patients. Steele and colleagues6 retrospectively studied 44 patients with high- and low-energy fractures and found an almost 60% prevalence of vitamin D insufficiency. If vitamin D insufficiency is this prevalent, treatment protocols for patients with fractures may require modifications that include routine screening and treatment for low vitamin D levels.
After noting a regular occurrence of hypovitaminosis D in our patient population (independent of age, sex, or medical comorbidities), we conducted a study to determine the prevalence of vitamin D deficiency in a large orthopedic trauma population.
Patients and Methods
After obtaining Institutional Review Board approval for this study, we retrospectively reviewed the charts of all patients with a fracture treated by 1 of 4 orthopedic traumatologists within a 21-month period (January 1, 2009 to September 30, 2010). Acute fracture and recorded 25-hydroxyvitamin D level were the primary criteria for study inclusion. Given the concern about vitamin D deficiency, it became common protocol to check the serum 25-hydroxyvitamin D levels of patients with acute fractures during the review period. Exclusion criteria were age under 18 years and presence of vitamin D deficiency risk factors, including renal insufficiency (creatinine level, ≥2 mg/dL), malabsorption, gastrectomy, active liver disease, acute myocardial infarction, alcoholism, anorexia nervosa, and steroid dependency.
During the period studied, 1830 patients over age 18 years were treated by 4 fellowship-trained orthopedic traumatologists. Of these patients, 889 (487 female, 402 male) met the inclusion criteria. Mean age was 53.8 years. Demographic data (age, sex, race, independent living status, comorbid medical conditions, medications) were collected from the patients’ medical records. Clinical data collected were mechanism of injury, fracture location and type, injury date, surgery date and surgical procedure performed (when applicable), and serum 25-hydroxyvitamin D levels.
Statistical Methods
Descriptive statistics (mean, median, mode) were calculated. The χ2 test was used when all cell frequencies were more than 5, and the Fisher exact probability test was used when any cell frequency was 5 or less. Prevalence of vitamin D deficiency and insufficiency was calculated in multiple patient populations. Patients were analyzed according to age and sex subgroups.
Definitions
Vitamin D deficiency was defined as a serum 25-hydroxyvitamin D level of 20 ng/mL or less and insufficiency as 21 to 32 ng/mL.2 As the serum test was performed independent of the investigators and with use of standard medical laboratory protocols and techniques, there should be no bias in the results. We had intended to have all patients undergo serum testing during the review period because that was our usual protocol. However, test results were available for only 889 (49%) of the 1830 patients with orthopedic trauma during the review period. Although a false-positive is theoretically possible, this series of orthopedic trauma patients is the largest in the literature and therefore should be more accurate than the previously reported small series.
Results
There were no significant (P < .05) age or sex differences in prevalence of vitamin D deficiency or insufficiency in our patient population. Overall prevalence of deficiency/insufficiency was 77.39%, and prevalence of deficiency alone was 39.03% (Table 1).
Women in the 18- to 25-year age group had a lower prevalence of deficiency (25%; P = .41) and insufficiency (41.7%; P = .16) than women in the other age groups (Table 3).
Discussion
We conducted this study to determine the prevalence of vitamin D deficiency in a large population of patients with orthopedic trauma. Results showed that vitamin D deficiency and insufficiency were prevalent in this population, which to our knowledge is the largest studied for vitamin D deficiency. In a 6-month study of 44 fractures, Steele and colleagues6 found an overall 60% rate of deficiency/insufficiency. Although their investigation is important—it was the first of its kind to evaluate patients with various fracture types, including those with high-energy causes—its numbers were small, and the period evaluated (June 1, 2006 to February 1, 2007) was short (8 months). Use of that time frame may have led to an underestimate of the prevalence of vitamin D deficiency, as vitamin D levels are higher in late summer because of increased sun exposure. Our study of 889 patients over 21 months allowed for seasonal variability of vitamin D levels. We did not notice a specific difference in patients who were treated during winter vs summer. Furthermore, our 77% prevalence of vitamin D insufficiency and 39% prevalence of vitamin D deficiency indicate how widespread low vitamin D levels are in a large Midwestern orthopedic trauma population. In the Pacific Northwest, Bee and colleagues7 studied seasonal differences in patients with surgically treated fractures and found an average difference of 3 ng/mL between winter and summer serum levels. However, the real issue, which should not be overlooked, is that the average 25-hydroxyvitamin D level was under 30 ng/mL in both cohorts (26.4 ng/mL in winter vs 29.8 ng/mL in summer). The emphasis should be that both levels were insufficient and that seasonal variance does not really change prevalence.
With use of the current definitions, it has been estimated that 1 billion people worldwide have vitamin D deficiency or insufficiency, with the elderly and certain ethnic populations at higher risk.8-10Vitamin D deficiency is a common diagnosis among elderly patients with hip fractures. According to various reports, 60% to 90% of patients treated for hip fractures are deficient or insufficient in vitamin D.8,9Hypovitaminosis D has also been noted in medical inpatients with and without risks for this deficiency.2 Surprisingly, low vitamin D levels are not isolated to the elderly. In Massachusetts, Gordon and colleagues11 found a 52% prevalence of vitamin D deficiency in Hispanic and black adolescents. Nesby-O’Dell and colleagues10 found that 42% of 15- to 49-year-old black women in the United States had vitamin D deficiency at the end of winter. Bogunovic and colleagues12 noted 5.5 times higher risk of low vitamin D levels in patients with darker skin tones. Although vitamin D deficiency has been linked to specific races, it frequently occurs in lower-risk populations as well. Sullivan and colleagues4 found a 48% prevalence of vitamin D deficiency in white preadolescent girls in Maine. Tangpricha and colleagues3 reported a 32% prevalence of vitamin D deficiency in otherwise fit healthcare providers sampled at a Boston hospital. Bogunovic and colleagues12 also showed that patients between ages 18 years and 50 years, and men, were more likely to have low vitamin D levels.
Establishing the prevalence of hypovitaminosis D in orthopedic trauma patients is needed in order to raise awareness of the disease and modify screening and treatment protocols. Brinker and O’Connor13 found vitamin D deficiency in 68% of patients with fracture nonunions, which suggests that hypovitaminosis D may partly account for difficulty in achieving fracture union. Bogunovic and colleagues12 found vitamin D insufficiency in 43% of 723 patients who underwent orthopedic surgery. Isolating the 121 patients on the trauma service revealed a 66% prevalence of low vitamin D levels. Our 77% prevalence of low vitamin D levels in 889 patients adds to the evidence that low levels are common in patients with orthopedic trauma. Understanding the importance of vitamin D deficiency can be significant in reducing the risk of complications, including delayed unions and nonunions, associated with treating orthopedic trauma cases.
Although our study indicates an alarming prevalence of insufficient vitamin D levels in our patient population, it does not provide a cause-and-effect link between low serum 25-hydroxyvitamin D levels and risk of fracture or nonunion. However, further investigations may yield clinically relevant data linking hypovitaminosis D with fracture risk. Although we did not include patients with nonunion in this study, new prospective investigations will address nonunions and subgroup analysis of race, fracture type, management type (surgical vs nonsurgical), injury date (to determine seasonal effect), and different treatment regimens.
The primary limitation of this study was its retrospective design. In addition, though we collected vitamin D data from 889 patients with acute fracture, our serum collection protocols were not standardized. Most patients who were admitted during initial orthopedic consultation in the emergency department had serum 25-hydroxyvitamin D levels drawn during their hospital stay, and patients initially treated in an ambulatory setting may not have had serum vitamin D levels drawn for up to 2 weeks after injury (the significance of this delay is unknown). Furthermore, the serum result rate for the overall orthopedic trauma population during the review period was only 49%, which could indicate selection bias. There are multiple explanations for the low rate. As with any new protocol or method, it takes time for the order to become standard practice; in the early stages, individuals can forget to ask for the test. In addition, during the review period, the serum test was also relatively new at our facility, and it was a “send-out” test, which could partly account for the lack of consistency. For example, some specimens were lost, and, in a number of other cases, excluded patients mistakenly had their 1,25-hydroxyvitamin D levels measured and were not comparable to included patients. Nevertheless, our sample of 889 patients with acute fractures remains the largest (by several hundred) reported in the literature.
From a practical standpoint, the present results were useful in updating our treatment protocols. Now we typically treat patients only prophylactically, with 50,000 units of vitamin D2 for 8 weeks and daily vitamin D3 and calcium until fracture healing. Patients are encouraged to continue daily vitamin D and calcium supplementation after fracture healing to maintain bone health. Compliance, however, remains a continued challenge and lack thereof can potentially explain the confusing effect of a supplementation protocol on the serum 25-hydroxyvitamin D level.14 The only patients who are not given prophylactic treatment are those who previously had been denied it (patients with chronic kidney disease or elevated blood calcium levels).
Vitamin D deficiency and insufficiency are prevalent in patients with orthopedic trauma. Studies are needed to further elucidate the relationship between low vitamin D levels and risk of complications. Retrospectively, without compliance monitoring, we have not seen a direct correlation with fracture complications.15 Our goal here was to increase orthopedic surgeons’ awareness of the problem and of the need to consider addressing low serum vitamin D levels. The treatment is low cost and low risk. The ultimate goal—if there is a prospective direct correlation between low serum vitamin D levels and complications—is to develop treatment strategies that can effectively lower the prevalence of low vitamin D levels.
Am J Orthop. 2016;45(7):E522-E526. Copyright Frontline Medical Communications Inc. 2016. All rights reserved.
1. Zaidi SA, Singh G, Owojori O, et al. Vitamin D deficiency in medical inpatients: a retrospective study of implications of untreated versus treated deficiency. Nutr Metab Insights. 2016;9:65-69.
2. Thomas MK, Lloyd-Jones DM, Thadhani RI, et al. Hypovitaminosis D in medical inpatients. N Engl J Med. 1998;338(12):777-783.
3. Tangpricha V, Pearce EN, Chen TC, Holick MF. Vitamin D insufficiency among free-living healthy young adults. Am J Med. 2002;112(8):659-662.
4. Sullivan SS, Rosen CJ, Halteman WA, Chen TC, Holick MF. Adolescent girls in Maine are at risk for vitamin D insufficiency. J Am Diet Assoc. 2005;105(6):971-974.
5. Hollis BW, Wagner CL. Normal serum vitamin D levels. N Engl J Med. 2005;352(5):515-516.
6. Steele B, Serota A, Helfet DL, Peterson M, Lyman S, Lane JM. Vitamin D deficiency: a common occurrence in both high- and low-energy fractures. HSS J. 2008;4(2):143-148.
7. Bee CR, Sheerin DV, Wuest TK, Fitzpatrick DC. Serum vitamin D levels in orthopaedic trauma patients living in the northwestern United States. J Orthop Trauma. 2013;27(5):e103-e106.
8. Bischoff-Ferrari HA, Can U, Staehelin HB, et al. Severe vitamin D deficiency in Swiss hip fracture patients. Bone. 2008;42(3):597-602.
9. Pieper CF, Colon-Emeric C, Caminis J, et al. Distribution and correlates of serum 25-hydroxyvitamin D levels in a sample of patients with hip fracture. Am J Geriatr Pharmacother. 2007;5(4):335-340.
10. Nesby-O’Dell S, Scanlon KS, Cogswell ME, et al. Hypovitaminosis D prevalence and determinants among African American and white women of reproductive age: third National Health and Nutrition Examination Survey, 1988–1994. Am J Clin Nutr. 2002;76(1):187-192.
11. Gordon CM, DePeter KC, Feldman HA, Grace E, Emans SJ. Prevalence of vitamin D deficiency among healthy adolescents. Arch Pediatr Adolesc Med. 2004;158(6):531-537.
12. Bogunovic L, Kim AD, Beamer BS, Nguyen J, Lane JM. Hypovitaminosis D in patients scheduled to undergo orthopaedic surgery: a single-center analysis. J Bone Joint Surg Am. 2010;92(13):2300-2304.
13. Brinker MR, O’Connor DP. Outcomes of tibial nonunion in older adults following treatment using the Ilizarov method. J Orthop Trauma. 2007;21(9):634-642.
14. Robertson DS, Jenkins T, Murtha YM, et al. Effectiveness of vitamin D therapy in orthopaedic trauma patients. J Orthop Trauma. 2015;29(11):e451-e453.
15. Bodendorfer BM, Cook JL, Robertson DS, et al. Do 25-hydroxyvitamin D levels correlate with fracture complications: J Orthop Trauma. 2016;30(9):e312-e317.
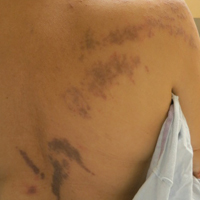
Purple Curvilinear Papules on the Back
The Diagnosis: Blaschkoid Graft-vs-host Disease
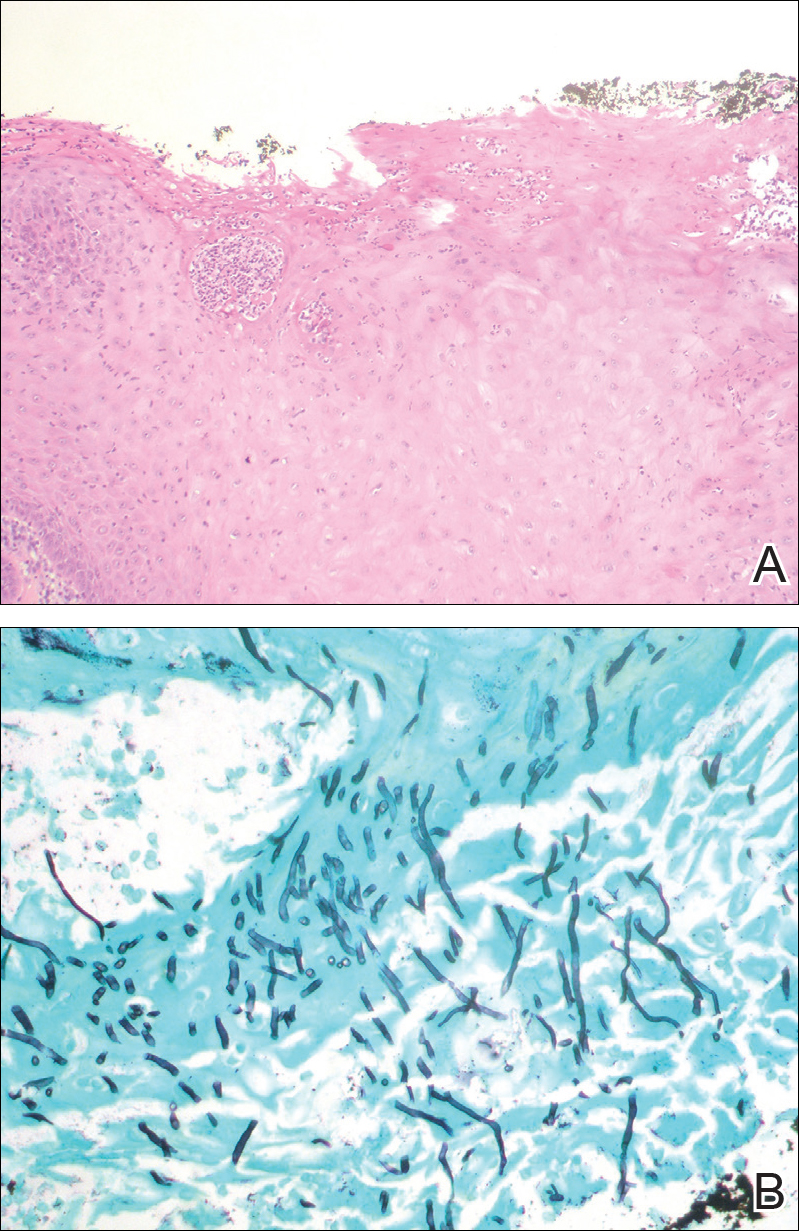
The patient had a history of myelodysplastic syndrome and underwent a bone marrow transplant 1 year prior to presentation. She had acute graft-vs-host disease (GVHD) 6 weeks following the transplant, which resolved with high-dose prednisone followed by UVB phototherapy. Skin biopsy demonstrated lichenoid dermatitis with vacuolar degeneration, dyskeratosis, and prominent pigment incontinence (Figure). Based on these findings and her clinical presentation, a diagnosis of blaschkoid GVHD was made.

Although acute GVHD is the result of immunocompetent donor T cells recognizing host tissues as foreign and initiating an immune response, the pathophysiology of chronic GVHD is not well understood.1,2 Theories for disease pathogenesis in chronic GVHD suggest an underlying autoimmune and/or alloreactive process.2-5 The skin often is the first organ affected in acute GVHD, and patients generally present with a pruritic morbilliform eruption that begins on the trunk and spreads to the rest of the body.1,2 Cutaneous manifestations of chronic GVHD may be protean. Lesions can resemble systemic sclerosis or morphea, lichen planus, psoriasis, ichthyosis, and many other conditions.2
The differential diagnosis of linear dermatoses includes herpes zoster, contact dermatitis, lichen striatus (blaschkitis), nevus unius lateris, inflammatory linear verrucous epidermal nevus, and incontinentia pigmenti.6,7 Lichen planus-like chronic GVHD occurring in a linear distribution has been described.6-14 Distinction between dermatomal and blaschkoid processes is diagnostically important. In the case of GVHD, dermatomal distribution may suggest an association between GVHD and prior herpes simplex virus or varicella-zoster virus infection.6,8 Herpesvirus may alter surface antigens of keratinocytes, rendering them targets of donor lymphocytes, and antibodies to viral particles may cross-react with host keratinocyte HLA antigens. It also is possible that dermatomal GVHD may simply be a type of isomorphic response (Köbner phenomenon).8
When cutaneous GVHD follows Blaschko lines, other mechanisms appear to be at play.9-14 It is plausible that these patients have an underlying genetic mosaicism, perhaps the result of a postzygotic mutation, that results in a daughter cell population that expresses surface antigens different from those of the primary cell population found elsewhere in the skin. Donor lymphocytes may selectively react to this mosaic population, leading to the clinical picture of chronic GVHD oriented along Blaschko lines.10,11,13,14
In conclusion, lichenoid linear GVHD following Blaschko lines is an uncommon presentation of chronic GVHD that highlights the heterogeneity of this disease and should be considered in the appropriate clinical setting.
- Ferrara JL, Levine JE, Reddy P, et al. Graft-versus-host disease. Lancet. 2009;373:1550-1561.
- Hymes SR, Alousi AM, Cowen EW. Graft-versus-host disease: part I. pathogenesis and clinical manifestations of graft-versus-host disease. J Am Acad Dermatol. 2012;66:515.e1-515.e18; quiz 533-534.
- Patriarca F, Skert C, Sperotto A, et al. The development of autoantibodies after allogeneic stem cell transplantation is related with chronic graft-vs-host disease and immune recovery. Exp Hematol. 2006;34:389-396.
- Shimada M, Onizuka M, Machida S, et al. Association of autoimmune disease-related gene polymorphisms with chronic graft-versus-host disease. Br J Haematol. 2007;139:458-463.
- Zhang C, Todorov I, Zhang Z, et al. Donor CD4+ T and B cells in transplants induce chronic graft-versus-host disease with autoimmune manifestations. Blood. 2006;107:2993-3001.
- Freemer CS, Farmer ER, Corio RL, et al. Lichenoid chronic graft-vs-host disease occurring in a dermatomal distribution. Arch Dermatol. 1994;130:70-72.
- Kikuchi A, Okamoto S, Takahashi S, et al. Linear chronic cutaneous graft-versus-host disease. J Am Acad Dermatol. 1997;37:1004-1006.
- Sanli H, Anadolu R, Arat M, et al. Dermatomal lichenoid graft-versus-host disease within herpes zoster scars. Int J Dermatol. 2003;42:562-564.
- Kennedy FE, Hilari H, Ferrer B, et al. Lichenoid chronic graft-vs-host disease following Blaschko lines. ActasDermosifiliogr. 2014;105:89-92.
- Lee SW, Kim YC, Lee E, et al. Linear lichenoid graft versus host disease: an unusual configuration following Blaschko's lines. J Dermatol. 2006;33:583-584.
- Beers B, Kalish RS, Kaye VN, et al. Unilateral linear lichenoid eruption after bone marrow transplantation: an unmasking of tolerance to an abnormal keratinocyte clone? J Am Acad Dermatol. 1993;28(5, pt 2):888-892.
- Wilson B, Lockman D. Linear lichenoid graft-vs-host disease. Arch Dermatol. 1994;130(9):1206-1208.
- Reisfeld PL. Lichenoid chronic graft-vs-host disease. Arch Dermatol. 1994;130:1207-1208.
- Vassallo C, Derlino F, Ripamonti F, et al. Lichenoid cutaneous chronic GvHD following Blaschko lines. Int J Dermatol. 2014;53:473-475.
The Diagnosis: Blaschkoid Graft-vs-host Disease
The patient had a history of myelodysplastic syndrome and underwent a bone marrow transplant 1 year prior to presentation. She had acute graft-vs-host disease (GVHD) 6 weeks following the transplant, which resolved with high-dose prednisone followed by UVB phototherapy. Skin biopsy demonstrated lichenoid dermatitis with vacuolar degeneration, dyskeratosis, and prominent pigment incontinence (Figure). Based on these findings and her clinical presentation, a diagnosis of blaschkoid GVHD was made.
Although acute GVHD is the result of immunocompetent donor T cells recognizing host tissues as foreign and initiating an immune response, the pathophysiology of chronic GVHD is not well understood.1,2 Theories for disease pathogenesis in chronic GVHD suggest an underlying autoimmune and/or alloreactive process.2-5 The skin often is the first organ affected in acute GVHD, and patients generally present with a pruritic morbilliform eruption that begins on the trunk and spreads to the rest of the body.1,2 Cutaneous manifestations of chronic GVHD may be protean. Lesions can resemble systemic sclerosis or morphea, lichen planus, psoriasis, ichthyosis, and many other conditions.2
The differential diagnosis of linear dermatoses includes herpes zoster, contact dermatitis, lichen striatus (blaschkitis), nevus unius lateris, inflammatory linear verrucous epidermal nevus, and incontinentia pigmenti.6,7 Lichen planus-like chronic GVHD occurring in a linear distribution has been described.6-14 Distinction between dermatomal and blaschkoid processes is diagnostically important. In the case of GVHD, dermatomal distribution may suggest an association between GVHD and prior herpes simplex virus or varicella-zoster virus infection.6,8 Herpesvirus may alter surface antigens of keratinocytes, rendering them targets of donor lymphocytes, and antibodies to viral particles may cross-react with host keratinocyte HLA antigens. It also is possible that dermatomal GVHD may simply be a type of isomorphic response (Köbner phenomenon).8
When cutaneous GVHD follows Blaschko lines, other mechanisms appear to be at play.9-14 It is plausible that these patients have an underlying genetic mosaicism, perhaps the result of a postzygotic mutation, that results in a daughter cell population that expresses surface antigens different from those of the primary cell population found elsewhere in the skin. Donor lymphocytes may selectively react to this mosaic population, leading to the clinical picture of chronic GVHD oriented along Blaschko lines.10,11,13,14
In conclusion, lichenoid linear GVHD following Blaschko lines is an uncommon presentation of chronic GVHD that highlights the heterogeneity of this disease and should be considered in the appropriate clinical setting.
- Ferrara JL, Levine JE, Reddy P, et al. Graft-versus-host disease. Lancet. 2009;373:1550-1561.
- Hymes SR, Alousi AM, Cowen EW. Graft-versus-host disease: part I. pathogenesis and clinical manifestations of graft-versus-host disease. J Am Acad Dermatol. 2012;66:515.e1-515.e18; quiz 533-534.
- Patriarca F, Skert C, Sperotto A, et al. The development of autoantibodies after allogeneic stem cell transplantation is related with chronic graft-vs-host disease and immune recovery. Exp Hematol. 2006;34:389-396.
- Shimada M, Onizuka M, Machida S, et al. Association of autoimmune disease-related gene polymorphisms with chronic graft-versus-host disease. Br J Haematol. 2007;139:458-463.
- Zhang C, Todorov I, Zhang Z, et al. Donor CD4+ T and B cells in transplants induce chronic graft-versus-host disease with autoimmune manifestations. Blood. 2006;107:2993-3001.
- Freemer CS, Farmer ER, Corio RL, et al. Lichenoid chronic graft-vs-host disease occurring in a dermatomal distribution. Arch Dermatol. 1994;130:70-72.
- Kikuchi A, Okamoto S, Takahashi S, et al. Linear chronic cutaneous graft-versus-host disease. J Am Acad Dermatol. 1997;37:1004-1006.
- Sanli H, Anadolu R, Arat M, et al. Dermatomal lichenoid graft-versus-host disease within herpes zoster scars. Int J Dermatol. 2003;42:562-564.
- Kennedy FE, Hilari H, Ferrer B, et al. Lichenoid chronic graft-vs-host disease following Blaschko lines. ActasDermosifiliogr. 2014;105:89-92.
- Lee SW, Kim YC, Lee E, et al. Linear lichenoid graft versus host disease: an unusual configuration following Blaschko's lines. J Dermatol. 2006;33:583-584.
- Beers B, Kalish RS, Kaye VN, et al. Unilateral linear lichenoid eruption after bone marrow transplantation: an unmasking of tolerance to an abnormal keratinocyte clone? J Am Acad Dermatol. 1993;28(5, pt 2):888-892.
- Wilson B, Lockman D. Linear lichenoid graft-vs-host disease. Arch Dermatol. 1994;130(9):1206-1208.
- Reisfeld PL. Lichenoid chronic graft-vs-host disease. Arch Dermatol. 1994;130:1207-1208.
- Vassallo C, Derlino F, Ripamonti F, et al. Lichenoid cutaneous chronic GvHD following Blaschko lines. Int J Dermatol. 2014;53:473-475.
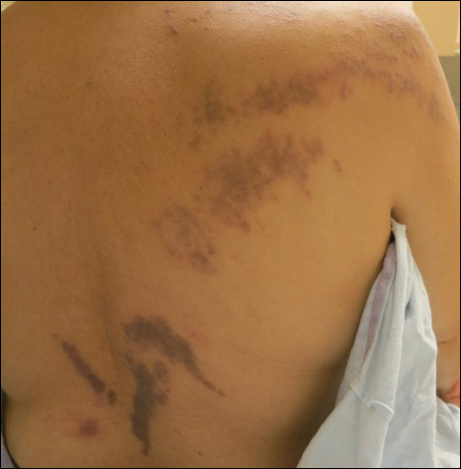
A 56-year-old woman with a history of bone marrow transplant presented for evaluation of a nonpruritic rash of 3 months' duration. Physical examination revealed confluent purple-colored and hyperpigmented papules localized to the back and right arm in a curvilinear pattern. Laboratory results were notable for mildly elevated aspartate transaminase and alanine transaminase levels.
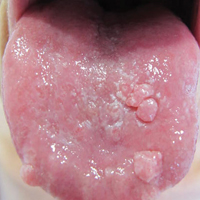
Pruritic and Painful Nodules on the Tongue
The Diagnosis: Chronic Hyperplastic Candidiasis (Nodular Form)
Chronic hyperplastic candidiasis (CHC) is a rare form of oropharyngeal candidiasis. The most frequent clinical presentation is a white plaque that cannot be detached (also known as candidal leukoplakia). It usually involves the anterior buccal mucosa, mainly the commissural area, though the palate and tongue also can be affected. The nodular type of CHC is even less common. Our patient exhibited the typical clinical presentation of the nodular type of CHC.1-3 The differential diagnosis includes leukoplakia, premalignant and malignant epithelial lesions, granular cell tumor, and florid oral papillomatosis.1,3 A biopsy usually is required for diagnostic confirmation. Histologically, CHC is characterized by parakeratosis and a hyperplastic epithelium invaded by Candida hyphae.4 Because Candida species are commensal in up to 50% of the healthy population, superficial colonization of tissues is not enough to indicate notable disease.1 In our patient, the histopathology revealed a hyperplastic mucosa without atypia and numerous hyphae (Figure). Both lingual swab and tissue cultures revealed high growth of Candida albicans.
Infection by C albicans depends on pathogen virulence and host factors such as wearing dentures, reduced salivary production, smoking habit, or immunosuppression.1,4 Apart from wearing dentures, our patient did not present with other predisposing factors. It is possible that the immunosuppressive status related to old age and associated oral changes contributed to Candida infection in this case.
Topical or systemic antifungal agents together with the elimination of predisposing factors are usual first-line treatments. Because of the relationship with atypia and the possibility of evolving into carcinoma in untreated or persistent lesions, follow-up is necessary to verify complete resolution after treatment.1,3,4 In the case reported herein, the lesions disappeared after 15 days of oral fluconazole treatment.
- Shibata T, Yamashita D, Hasegawa S, et al. Oral candidiasis mimicking tongue cancer [published online January 12, 2011]. Auris Nasus Larynx. 2011;38:418-420.
- Scardina GA, Ruggieri A, Messina P. Chronic hyperplastic candidosis: a pilot study of the efficacy of 0.18% isotretinoin. J Oral Sci. 2009;51:407-410.
- Sitheeque MA, Samaranayake LP. Chronic hyperplastic candidosis/candidiasis (candidal leukoplakia). Crit Rev Oral Biol Med. 2003;14:253-267.
- Williams DW, Bartie KL, Potts AJ, et al. Strain persistence of invasive Candida albicans in chronic hyperplastic candidosis that underwent malignant change. Gerodontology. 2001;18:73-78.
The Diagnosis: Chronic Hyperplastic Candidiasis (Nodular Form)
Chronic hyperplastic candidiasis (CHC) is a rare form of oropharyngeal candidiasis. The most frequent clinical presentation is a white plaque that cannot be detached (also known as candidal leukoplakia). It usually involves the anterior buccal mucosa, mainly the commissural area, though the palate and tongue also can be affected. The nodular type of CHC is even less common. Our patient exhibited the typical clinical presentation of the nodular type of CHC.1-3 The differential diagnosis includes leukoplakia, premalignant and malignant epithelial lesions, granular cell tumor, and florid oral papillomatosis.1,3 A biopsy usually is required for diagnostic confirmation. Histologically, CHC is characterized by parakeratosis and a hyperplastic epithelium invaded by Candida hyphae.4 Because Candida species are commensal in up to 50% of the healthy population, superficial colonization of tissues is not enough to indicate notable disease.1 In our patient, the histopathology revealed a hyperplastic mucosa without atypia and numerous hyphae (Figure). Both lingual swab and tissue cultures revealed high growth of Candida albicans.
Infection by C albicans depends on pathogen virulence and host factors such as wearing dentures, reduced salivary production, smoking habit, or immunosuppression.1,4 Apart from wearing dentures, our patient did not present with other predisposing factors. It is possible that the immunosuppressive status related to old age and associated oral changes contributed to Candida infection in this case.
Topical or systemic antifungal agents together with the elimination of predisposing factors are usual first-line treatments. Because of the relationship with atypia and the possibility of evolving into carcinoma in untreated or persistent lesions, follow-up is necessary to verify complete resolution after treatment.1,3,4 In the case reported herein, the lesions disappeared after 15 days of oral fluconazole treatment.
- Shibata T, Yamashita D, Hasegawa S, et al. Oral candidiasis mimicking tongue cancer [published online January 12, 2011]. Auris Nasus Larynx. 2011;38:418-420.
- Scardina GA, Ruggieri A, Messina P. Chronic hyperplastic candidosis: a pilot study of the efficacy of 0.18% isotretinoin. J Oral Sci. 2009;51:407-410.
- Sitheeque MA, Samaranayake LP. Chronic hyperplastic candidosis/candidiasis (candidal leukoplakia). Crit Rev Oral Biol Med. 2003;14:253-267.
- Williams DW, Bartie KL, Potts AJ, et al. Strain persistence of invasive Candida albicans in chronic hyperplastic candidosis that underwent malignant change. Gerodontology. 2001;18:73-78.

An 82-year-old woman with atrial fibrillation and chronic obstructive pulmonary disease presented with pruritic and painful lesions on the tongue of 10 years' duration. She had not undergone treatment with systemic or inhaled corticosteroids during the course of the pulmonary disease. On physical examination, several fleshy and well-defined erythematous papules speckled with whitish areas were observed on the dorsal aspect and anterior border of the tongue. Superficial whitish areas could not be removed by scraping.
VIDEO: Investigator discusses fulvestrant/everolimus combo
SAN ANTONIO – Most women with hormone receptor–positive breast cancer treated with an aromatase inhibitor will eventually develop resistance to these agents. Strategies for overcoming resistance include the addition of everolimus (Affinitor) to a steroidal aromatase inhibitor (AI) such as exemestane (Aromasin), as in the BOLERO-2 trial.
Alternatively, blocking estrogen-receptor signaling through the use of a selective estrogen receptor down regulator, such as fulvestrant (Faslodex), may result in more complete blockade of the ER signaling pathway than would a steroidal AI such as exemestane.
In this video interview at the San Antonio Breast Cancer Symposium, Noah S. Kornblum, MD, of the Montefiore-Einstein Center for Cancer Care, New York, discusses findings from the phase II PrECOG 0102 trial comparing a combination of fulvestrant and everolimus to fulvestrant and placebo for the treatment of postmenopausal women with hormone receptor–positive, HER2-negative breast cancer resistant to AI therapy.
The combination was associated with a median progression-free survival of 10.4 months, compared with 5.1 months for fulvestrant plus placebo (hazard ratio, 0.60; P = .02).
Dr. Kornblum says that the study provides additional evidence for adding everolimus to anti-estrogen therapy in AI-resistant disease.
The video associated with this article is no longer available on this site. Please view all of our videos on the MDedge YouTube channel
AT SABCS 2016

Strategies for Preventing Patient Falls
Between 700,000 and 1 million people fall each year in U.S. hospitals, and about a third of those result in injuries that add an additional 6.3 days to hospital stays, according to a report from the Joint Commission Center for Transforming Healthcare. Some 11,000 falls are fatal. The Joint Commission Center for Transforming Healthcare has now issued a report on the subject called “Preventing Patient Falls: A Systematic Approach from the Joint Commission Center for Transforming Healthcare Project.”1
“We try to pick those topics that healthcare organizations just haven’t been able to fully tackle even though they’ve put a lot of time and resources into trying to fix them,” says Kelly Barnes, MS, a center project lead in the Center for Transforming Healthcare at The Joint Commission.
The Joint Commission project involved seven hospitals that used Robust Process Improvement, which incorporates tools from Lean Six Sigma and change management methodologies, to reduce falls with injury on inpatient pilot units within their organizations.
During the project, each organization identified the specific factors that led to falls with injury in their environment and developed solutions targeted to those factors. The organizations identified 30 root causes and developed 21 targeted solutions. Because the contributing factors were different at each organization, solution sets were unique to each. Afterward, the organizations saw an aggregate 35% reduction in falls and a 62% reduction in falls with injury.
“One of the takeaways is that you really need support across an organization to have success,” Barnes says. “The more engaged the entire organization is from top down all the way to the bottom, the more successful people are in solving the problems.”
The study resulted in a Targeted Solutions Tool (TST), free to all Joint Commission–accredited customers, to help hospitals.
“You can put your data right into the tool,” Barnes says. “It tells you what your top contributing factors are, and it gives you the solutions that have worked for those contributing factors at other organizations.”
Reference
Health Research & Educational Trust. Preventing patient falls: a systematic approach from the Joint Commission Center for Transforming Healthcare project. Hospitals in Pursuit of Excellence website.
Helping Patients Quit Smoking
Inpatient hospitalization can be a key time for patients to quit smoking, according to an abstract called “No More Butts: An Automated System for Inpatient Smoking Cessation Team Consults.”1
“Tobacco smoking continues to be one of the most important public health threats that we face,” says lead author Sujatha Sankaran, MD, assistant clinical professor in the division of hospital medicine and medical director of smoking cessation at the University of California, San Francisco. “Hospitalization is an extremely important moment and provides an excellent opportunity to counsel and provide cessation resources for people who are concerned about their health.”
Inpatients who receive smoking cessation counseling, nicotine replacement, and referral to outpatient resources have increased quit rates six weeks after hospital discharge, their research showed.
However, according to the abstract, in 2014:
- 34.5% of tobacco users admitted to one 600-bed academic hospital were documented as having received and accepted tobacco cessation counseling
- 45.7% of tobacco users received nicotine replacement therapy
- 1.35% of tobacco users received after-discharge consultations to outpatient smoking cessation resources
Researchers piloted a system in which a dedicated respiratory therapist–staffed smoking cessation consult service was trained to provide targeted tobacco cessation services to all inpatients who use tobacco. Of 1944 patients identified as using tobacco, 1545 received and accepted cessation counseling from a trained member of the Smoking Cessation Team, 1526 received nicotine replacement therapy, and 464 received an electronic referral to either a telephone or in-person quit line
“Hospitalists know firsthand the serious harm that tobacco use causes to patients but often are overwhelmed by the acute issues of patients and are unable to fully address tobacco use with hospitalized patients,” Dr. Sankaran says. “An automated cessation service can help lessen this burden by providing automatic cessation resources to all tobacco users.”
Reference
- Sankaran S, Burke R, O’Keefe S. No more butts: an automated system for inpatient smoking cessation team consults [abstract]. J Hosp Med. 2016;11(suppl 1). Accessed November 9, 2016.
How Well Does the Braden Nutrition Subscale Agree With the VA Nutrition Classification Scheme Related to Pressure Ulcer Risk?
A pressure ulcer (PrU) is a localized injury to the skin and/or deep tissues that is due to pressure, friction, or shearing forces. Pressure ulcers are strongly associated with serious comorbidities, particularly inadequate nutrition and immobility.1,2 Pressure ulcers increase hospital costs significantly. In the U.S., PrU care is about $11 billion annually and a cost of between $2,000 and $21,410 per individual PrU.3-5
The impact of nosocomial PrUs remains a key health and economic concern of acute care facilities worldwide. In the U.S., about 2.5 million inpatients annually develop some degree of a PrU during their hospital stay. The reported incidence rates range from 0.4% to 38%.3,6 Each year about 60,000 people die of complications of a PrU.3,6,7 Inadequate nutrition is a critical factor that contributes to the incidence of PrUs.8-12 Consequences of inadequate nutrition have included alterations in skin integrity resulting in PrUs, longer hospital stays, increased costs of care, and higher rates of mortality.9 As a patient’s nutritional status becomes compromised, the likelihood of developing a PrU increases, especially if an individual is immobilized.7,9-11,13
Braden Scale History
The Braden Scale for Predicting Pressure Sore Risk was developed by Barbara Braden, PhD, RN, and Nancy Bergstrom, PhD, RN, in 1987.
The scale is composed of 6 factors: sensory perception, moisture, activity, mobility, friction and shear, and nutrition.14 Each factor is scored on a scale of 1 to 4 points (friction and shear are scored on a point scale of only 1 to 3) for a total possible score of 6 to 23 points (the lower the score, the greater the assumed PrU risk).
The Braden nutrition subscale relies heavily on recording observed or patient self-reported eating habits. It is typically documented by nurses who assess the daily intake of meals: recording a score of 4 if the patient’s meal intake is excellent (eats most of every meal), 3 if the patient’s intake is adequate (eats more than half of most meals), 2 if the patient’s intake is probably inadequate (rarely eats a complete meal), and 1 if a patient’s intake is very poor (never eats a complete meal) (Table 1).14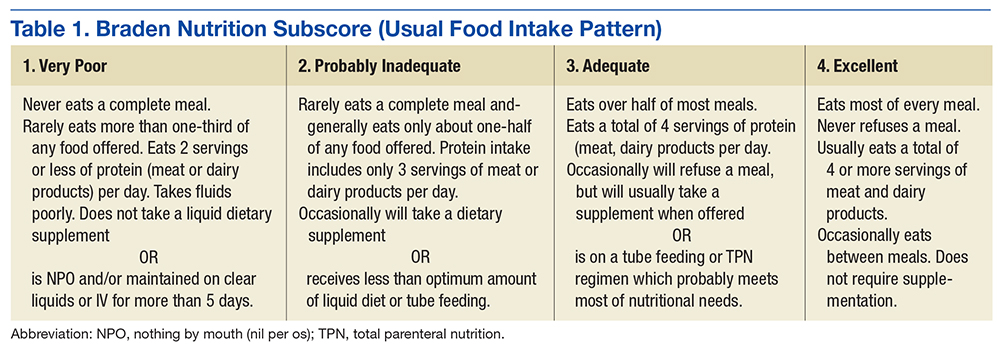
Historically, the Braden scale is reported to have good reliability when used by registered nurses as a risk prediction tool.14,16 A recent review also reported high interrater reliability of the Braden scale total score among nurses, nursing assistants, and graduate assistants.17 However, other studies suggest certain subscales (such as sensory and nutrition) may have very low interrater reliability among nurses and poor PrU predictability.18,19 To date, there are no known studies evaluating the agreement of the Braden nutrition subscale primarily used by nurses and the VA Nutrition Classification Scheme (VANCS) used by dietitians.
The VA standard of care recommends that PrU risk assessments are documented for all hospitalized veterans within 24 hours of admission, daily, with transfers or discharges, and when there is a status change in the patient. In addition, nutritional assessments by dietitians (using the VANCS) are encouraged within 24 hours of acute care hospitalization.20
The VANCS performed by dietitians consists of 4 classifications: no nutritional compromise, mild nutritional compromise, moderate nutritional compromise, and severenutritional compromise. These classifications are based on well-documented “comprehensive approaches to defining nutritional status that uses multiple parameters” including nutrition history, weight (body mass index and weight loss), diagnoses, diet (and diet orders), brief physical assessment, and preliminary laboratory data (serum albumin/pre-albumin and total lymphocyte count).20,21
The predictive ability of a risk assessment tool is critical to its clinical effectiveness in determining a clinical outcome.17 The Braden scale has been used for more than 30 years in various settings without any significant change to the scale or subscales. In a 2012 study, 4 medical factors were found to be more predictive of PrUs than the Braden scale total score in a sample of 213 acutely ill adult veterans.8 By performing a retrospective study using logistic regression predictive models, severe nutritional compromise (as identified by a dietitian), pneumonia, candidiasis, and surgery were identified as stronger predictors of PrU risk than was the Braden total score.8
With malnutrition as one of the most significant predictive factors in PrU risk, it is critical to determine whether discrepancies exist between the Braden nutrition subscale used primarily by nurses and the VANCS used by dietitians. Hence, the overall purpose of this study was to determine the level of agreement between the Braden nutrition subscale scores documented by nurses and the VANCS used by dietitians and examine the relationship of these assessments with PrU development.
Methods
The parent study was approved by the University of Florida Institutional Review Board before data collection. This secondary analysis of the parent study examined data already collected by Cowan and colleagues, which demonstrated the significance of nutritional compromise in PrU risk.
The de-identified data subset consisted of general demographics, hospital length of stay, specific diagnoses, Braden scores, PrU status, and registered dietician nutritional classification data from 213 acutely ill veterans admitted to North Florida/South Georgia Veterans Health System (NF/SGVHS) in Florida for more than 3 days between January and July 2008.8 The sample consisted of 100 veterans with nosocomial PrUs and 113 veterans without PrUs during their admission.
Scoring
Using the de-identified dataset, the variables of interest (VANCS, Braden nutrition subscale score, and the presence/absence of PrU) were coded. The VANCS was given a corresponding score ranging from 1 to 4 (1, severe nutritional compromise; 2, moderate nutritional compromise; 3, mild nutritional compromise; and 4, no nutritional compromise). The Braden nutrition subscale ranged from 1 to 4 (1 very poor nutrition; 2, probably inadequate nutrition; 3, adequate nutrition; and 4, excellent nutrition). PrU development was coded as 0, no PrU development and 1, PrU development. All nutritional assessments had been recorded in the electronic health record before any PrU reported in the parent study.
Statistical Analysis
After coding the variables of interest, the data were transferred into SAS v 9.4 (Cary, NC). The data collected compared VANCS and Braden nutrition subscale results. In addition, the authors examined the agreement between the score assigned to the VANCS and Braden nutrition subscale results with a weighted
Additionally, the authors computed sensitivity and specificity of the Braden nutrition subscale using the VANCS as the gold standard. The severe and moderately compromised categories of the VANCS combined to form the high-risk category, and the mild-to-no compromise categories were combined to form the low-risk category. The Braden nutrition subscale was similarly dichotomized with the very poor and probably inadequate intake forming the high-risk category and the adequate and excellent intake forming the low-risk category. Sensitivity and specificity of the Braden were then calculated.
Results
Nursing assessments using the Braden nutrition subscale were completed on 213 patients whose mean age (SD) was 71.0 (10.6) years. The VANCS documented by dietitians was completed on 205 patients. For 7 patients, a nutrition assessment was documented only by the Braden nutrition subscale and not the VANCS. Most of the patients were male (97%, n = 206), and white (81.4%, n = 171). The weighted
Landis and colleagues suggest that a 
Figure 2 shows the percentage of patients who developed a PrU during hospitalization among different measures of Braden nutrition subscale vs VANCS. In Figure 2, nutritional categories 1, 2, and 3 correspond to very poor intake (Braden)/severe compromise (VANCS), probably inadequate intake (Braden)/moderate compromise (VANCS), and adequate intake (Braden)/mild compromise (VANCS), respectively. There were 3 patients who had a no compromise VANCS; none of these had a PrU, so their data are not represented in Figure 2.
Discussion
Findings from this study indicate that the VANCS documented by dietitians is superior in assessing nutritional risk and predicting the development of PrUs in acutely ill hospitalized veterans compared with the Braden nutrition subscale. This study also shows that the Braden nutrition subscale did not accurately predict PrU development in acutely ill veterans. This finding concurs with the Serpa and Santos study in which the Braden nutrition subscale scores were not predictive for PrU development in hospitalized patients.
One possible explanation for the findings in this study is that the nutrition subscale of the Braden tool asks the assessing clinician to evaluate the amount of food intake the patient is currently taking in for their usual meals. This assessment is highly subjective and speculative and does not account for recent intake fluctuations or weight loss. By comparison, the VANCS is more comprehensive in its ability to assess nutritional compromise based on multiple factors, such as recent weight loss, laboratory indices, body habitus, dentition, and swallowing ability.20 The National Pressure Ulcer Advisory Panel suggests that following an acute care admission, a patient receive a consult from a dietitian if the health care provider suspects that the patient may be nutritionally compromised.1 The study findings demonstrate the utility of the VANCS as predictive of PrU risk.
Unfortunately, the authors have learned that the VANCS may be phased out soon, and many VA facilities are no longer using it. Findings from this study and other recent scientific literature suggest that all inpatients may benefit from nutritional assessments by dietitians. When performed, dietitian assessments provide the basis for more accurate nursing assessment of nutritional risk and targeted interventions. Nursing professionals should be encouraged to review the dietitian assessment and consultation notes and to incorporate this information into a more comprehensive PrU prevention and treatment plan.
Interestingly, in spite of those assessed to have severe nutritional compromise by dietitian assessment (n = 39), very few of these patients (n = 4) had an ICD-9 diagnosis related to malnutrition (ICD-9 codes, 262, 273.8, 269.9, 263.9) entered in their chart for that hospitalization. This observation suggests that 88% of patients with severe nutritional compromise were not appropriately coded at discharge. Improper coding has implications for researchers using ICD-9 diagnosis codes at discharge for accurate analysis of risk factors as well as for health care providers who may look at coded diagnoses information in the charts when considering comorbid conditions for health management.
This study highlights the importance of nutritional status as a risk factor for PrU development. Reasons suggested for nutritional status seeming to be the most significant correlate to PrUs in the acute care setting include the following: decreased protein alters oncotic pressure, making tissue prone to edema; decreases in subcutaneous fat reduce protection from pressure effects; nutritional compromise alters cellular transport of nutrients and waste and makes tissue cells more vulnerable to deformation and physical stresses; and lactate (a by-product of anaerobic glycolysis) or any other metabolic by-product of malnutrition could cause biochemical stress, and tissue cells can die faster as a result of the increased plasma membrane permeability.7,24-26
Limitations
This study was limited to 1 sample of veterans hospitalized in the 2 acute care facilities of NF/SGVHS and the use of a retrospective chart review. As a result, further research is necessary to establish generalizability to other acute care settings and high-risk populations. In spite of these limitations, this and other studies highlight the need for revision of the Braden scale, specifically the nutritional subscale, to lessen the ambiguity seen between dietitian and nursing assessments while also increasing the accuracy in determining a patient’s nutrition risk of PrU development during hospitalization.
Conclusion
These findings provide evidence that dietitians’ documentation of the VANCS related to nutritional compromise are superior to current nutritional risk assessments using the Braden nutrition subscale in predicting PrU risk.
Acknowledgments
The authors acknowledge that this work was supported by the resources of the North Florida/South Georgia Veterans Health System in Gainesville, Florida, and in part by a Small Project Award from the VA Office of Nursing Services.
1. National Pressure Ulcer Advisory Panel, European Pressure Ulcer Advisory Panel, Pan Pacific Pressure Injury Alliance. Prevention and Treatment of Pressure Ulcers: Clinical Practice Guideline. http://www.npuap.org/resources/educational-and-clinical -resources/prevention-and-treatment-of-pressure -ulcers-clinical-practice-guideline. Updated 2014. Accessed November 7, 2016.
2. National Pressure Ulcer Advisory Panel, European Pressure Ulcer Advisory Panel, Pan Pacific Pressure Injury Alliance. Prevention and treatment of pressure ulcers: quick reference guide. http://www .npuap.org/wp-content/uploads/2014/08/Updated -10-16-14-Quick-Reference-Guide-DIGITAL-NPUAP-EPUAP-PPPIA-16Oct2014.pdf. Updated October 16, 2014. Accessed October 21, 2016.
3. Sullivan N. Preventing in-facility pressure ulcers. In: Agency for Healthcare Research and Quality. Making Health Care Safer II. An Updated Critical Analysis of the Evidence for Patient Safety Practices. Evidence Reports/Technology Assessments. http://www.ahrq.gov/sites/default/files/wysiwyg/research/findings/evidence-based-reports/services/quality/ptsafetyII-full.pdf:212-232. Published March 2013. Accessed October 21, 2016.
4. Russo CA, Steiner C, Spector W. Hospitalizations related to pressure ulcers among adults 18 years and older, 2006. In: Healthcare Cost and Utilization Project (HCUP) Statistical Briefs. http://www.ncbi .nlm.nih.gov/books/NBK54557. Published December 2008. Accessed October 21, 2016.
5. Spetz J, Brown DS, Aydin C, Donaldson N. The value of reducing hospital-acquired pressure ulcer prevalence: an illustrative analysis. J Nurs Adm. 2013;43(4):235-241.
6. Whittington KT, Briones R. National prevalence and incidence study: 6-year sequential acute care data. Adv Skin Wound Care. 2004;17(9):490-494.
7. Dorner B, Posthauer ME, Thomas D; National Pressure Ulcer Advisory Panel. The role of nutrition in pressure ulcer prevention and treatment: National Pressure Ulcer Advisory Panel white paper. http://www.npuap.org/wp-content/uploads/2012/03/Nutrition-White-Paper-Website-Version.pdf. Published 2009. Accessed November 7, 2016.
8. Cowan LJ, Stechmiller JK, Rowe M, Kairalla JA. Enhancing Braden pressure ulcer risk assessment in acutely ill adult veterans. Wound Repair Regen. 2012;20(2):137-148.
9. Correia MI, Hegazi RA, Higashiguchi T, et al. Evidence-based recommendations for addressing malnutrition in health care: an updated strategy from the feedM.E. Global Study Group. J Am Med Dir Assoc. 2014;15(8):544-550.
10. Malafarina V, Úriz-Otano F, Fernández-Catalán C, Tejedo-Flors D. Nutritional status and pressure ulcers. Risk assessment and estimation in older adults. J Am Geriatr Soc. 2014;62(6):1209-1210.
11. Posthauer ME, Banks M, Dorner B, Schols JM. The role of nutrition for pressure ulcer management: national pressure ulcer advisory panel, European pressure ulcer advisory panel, and pan pacific pressure injury alliance white paper. Adv Skin Wound Care. 2015;28(4):175-188.
12. Brito PA, de Vasconcelos Generoso S, Correia MI. Prevalence of pressure ulcers in hospitals in Brazil and association with nutritional status—a multicenter, cross-sectional study. Nutrition. 2013;29(4):646-649.
13. Coleman S, Gorecki C, Nelson EA, et al. Patient risk factors for pressure ulcer development: systematic review. Int J Nurs Stud. 2013;50(7):974-1003.
14. Bergstrom N, Braden BJ, Laguzza A, Holman V. The Braden Scale for predicting pressure sore risk. Nurs Res. 1987;36(4):205-210.
15. Ayello EA, Braden B. How and why to do pressure ulcer risk assessment. Adv Skin Wound Care. 2002;15(3):125-131.
16. Wang LH, Chen HL, Yan HY, et al. Inter-rater reliability of three most commonly used pressure ulcer risk assessment scales in clinical practice. Int Wound J. 2015;12(5):590-594.
17. Wilchesky M, Lungu O. Predictive and concurrent validity of the Braden scale in long-term care: a meta-analysis. Wound Repair Regen. 2015;23(1):44-56.
18. Kottner J, Dassen T. An interrater reliability study of the Braden scale in two nursing homes. Int J Nurs Stud. 2008;45(10):1501-1511.
19. Yatabe MS, Taguchi F, Ishida I, et al. Mini nutritional assessment as a useful method of predicting the development of pressure ulcers in elderly inpatients. J Am Geriatr Soc. 2013;61(10):1698-1704.
20. Hiller L, Lowery JC, Davis JA, Shore CJ, Striplin DT. Nutritional status classification in the Department of Veterans Affairs. J Am Diet Assoc. 2001;101(7):786-792.
21. U.S. Department of Veterans Affairs. VHA Handbook 1109.02. Clinical nutrition management. http://www.va.gov/vhapublications/ViewPublica tion.asp?pub_ID=2493. Published February 2012. Accessed October 21, 2016.
22. Landis JR, Koch GG. The measurement of observer agreement for categorical data. Biometrics. 1977;33(1):159-174.
23. Serpa LF, Santos VL. Validity of the Braden Nutrition Subscale in predicting pressure ulcer development. J Wound Ostomy Continence Nurs. 2014;41(5):436-443.
24. Reddy M, Gill SS, Rochon PA. Preventing pressure ulcers: a systematic review. JAMA. 2006;296(8):974-984.
25. Cooper KL. Evidence-based prevention of pressure ulcers in the intensive care unit. Crit Care Nurse. 2013;33(6):57-66.
26. Leopold E, Gefen A. Changes in permeability of the plasma membrane of myoblasts to fluorescent dyes with different molecular masses under sustained uniaxial stretching. Med Eng Phys. 2013;35(5):601-607.
A pressure ulcer (PrU) is a localized injury to the skin and/or deep tissues that is due to pressure, friction, or shearing forces. Pressure ulcers are strongly associated with serious comorbidities, particularly inadequate nutrition and immobility.1,2 Pressure ulcers increase hospital costs significantly. In the U.S., PrU care is about $11 billion annually and a cost of between $2,000 and $21,410 per individual PrU.3-5
The impact of nosocomial PrUs remains a key health and economic concern of acute care facilities worldwide. In the U.S., about 2.5 million inpatients annually develop some degree of a PrU during their hospital stay. The reported incidence rates range from 0.4% to 38%.3,6 Each year about 60,000 people die of complications of a PrU.3,6,7 Inadequate nutrition is a critical factor that contributes to the incidence of PrUs.8-12 Consequences of inadequate nutrition have included alterations in skin integrity resulting in PrUs, longer hospital stays, increased costs of care, and higher rates of mortality.9 As a patient’s nutritional status becomes compromised, the likelihood of developing a PrU increases, especially if an individual is immobilized.7,9-11,13
Braden Scale History
The Braden Scale for Predicting Pressure Sore Risk was developed by Barbara Braden, PhD, RN, and Nancy Bergstrom, PhD, RN, in 1987.
The scale is composed of 6 factors: sensory perception, moisture, activity, mobility, friction and shear, and nutrition.14 Each factor is scored on a scale of 1 to 4 points (friction and shear are scored on a point scale of only 1 to 3) for a total possible score of 6 to 23 points (the lower the score, the greater the assumed PrU risk).
The Braden nutrition subscale relies heavily on recording observed or patient self-reported eating habits. It is typically documented by nurses who assess the daily intake of meals: recording a score of 4 if the patient’s meal intake is excellent (eats most of every meal), 3 if the patient’s intake is adequate (eats more than half of most meals), 2 if the patient’s intake is probably inadequate (rarely eats a complete meal), and 1 if a patient’s intake is very poor (never eats a complete meal) (Table 1).14
Historically, the Braden scale is reported to have good reliability when used by registered nurses as a risk prediction tool.14,16 A recent review also reported high interrater reliability of the Braden scale total score among nurses, nursing assistants, and graduate assistants.17 However, other studies suggest certain subscales (such as sensory and nutrition) may have very low interrater reliability among nurses and poor PrU predictability.18,19 To date, there are no known studies evaluating the agreement of the Braden nutrition subscale primarily used by nurses and the VA Nutrition Classification Scheme (VANCS) used by dietitians.
The VA standard of care recommends that PrU risk assessments are documented for all hospitalized veterans within 24 hours of admission, daily, with transfers or discharges, and when there is a status change in the patient. In addition, nutritional assessments by dietitians (using the VANCS) are encouraged within 24 hours of acute care hospitalization.20
The VANCS performed by dietitians consists of 4 classifications: no nutritional compromise, mild nutritional compromise, moderate nutritional compromise, and severenutritional compromise. These classifications are based on well-documented “comprehensive approaches to defining nutritional status that uses multiple parameters” including nutrition history, weight (body mass index and weight loss), diagnoses, diet (and diet orders), brief physical assessment, and preliminary laboratory data (serum albumin/pre-albumin and total lymphocyte count).20,21
The predictive ability of a risk assessment tool is critical to its clinical effectiveness in determining a clinical outcome.17 The Braden scale has been used for more than 30 years in various settings without any significant change to the scale or subscales. In a 2012 study, 4 medical factors were found to be more predictive of PrUs than the Braden scale total score in a sample of 213 acutely ill adult veterans.8 By performing a retrospective study using logistic regression predictive models, severe nutritional compromise (as identified by a dietitian), pneumonia, candidiasis, and surgery were identified as stronger predictors of PrU risk than was the Braden total score.8
With malnutrition as one of the most significant predictive factors in PrU risk, it is critical to determine whether discrepancies exist between the Braden nutrition subscale used primarily by nurses and the VANCS used by dietitians. Hence, the overall purpose of this study was to determine the level of agreement between the Braden nutrition subscale scores documented by nurses and the VANCS used by dietitians and examine the relationship of these assessments with PrU development.
Methods
The parent study was approved by the University of Florida Institutional Review Board before data collection. This secondary analysis of the parent study examined data already collected by Cowan and colleagues, which demonstrated the significance of nutritional compromise in PrU risk.
The de-identified data subset consisted of general demographics, hospital length of stay, specific diagnoses, Braden scores, PrU status, and registered dietician nutritional classification data from 213 acutely ill veterans admitted to North Florida/South Georgia Veterans Health System (NF/SGVHS) in Florida for more than 3 days between January and July 2008.8 The sample consisted of 100 veterans with nosocomial PrUs and 113 veterans without PrUs during their admission.
Scoring
Using the de-identified dataset, the variables of interest (VANCS, Braden nutrition subscale score, and the presence/absence of PrU) were coded. The VANCS was given a corresponding score ranging from 1 to 4 (1, severe nutritional compromise; 2, moderate nutritional compromise; 3, mild nutritional compromise; and 4, no nutritional compromise). The Braden nutrition subscale ranged from 1 to 4 (1 very poor nutrition; 2, probably inadequate nutrition; 3, adequate nutrition; and 4, excellent nutrition). PrU development was coded as 0, no PrU development and 1, PrU development. All nutritional assessments had been recorded in the electronic health record before any PrU reported in the parent study.
Statistical Analysis
After coding the variables of interest, the data were transferred into SAS v 9.4 (Cary, NC). The data collected compared VANCS and Braden nutrition subscale results. In addition, the authors examined the agreement between the score assigned to the VANCS and Braden nutrition subscale results with a weighted
Additionally, the authors computed sensitivity and specificity of the Braden nutrition subscale using the VANCS as the gold standard. The severe and moderately compromised categories of the VANCS combined to form the high-risk category, and the mild-to-no compromise categories were combined to form the low-risk category. The Braden nutrition subscale was similarly dichotomized with the very poor and probably inadequate intake forming the high-risk category and the adequate and excellent intake forming the low-risk category. Sensitivity and specificity of the Braden were then calculated.
Results
Nursing assessments using the Braden nutrition subscale were completed on 213 patients whose mean age (SD) was 71.0 (10.6) years. The VANCS documented by dietitians was completed on 205 patients. For 7 patients, a nutrition assessment was documented only by the Braden nutrition subscale and not the VANCS. Most of the patients were male (97%, n = 206), and white (81.4%, n = 171). The weighted
Landis and colleagues suggest that a
Figure 2 shows the percentage of patients who developed a PrU during hospitalization among different measures of Braden nutrition subscale vs VANCS. In Figure 2, nutritional categories 1, 2, and 3 correspond to very poor intake (Braden)/severe compromise (VANCS), probably inadequate intake (Braden)/moderate compromise (VANCS), and adequate intake (Braden)/mild compromise (VANCS), respectively. There were 3 patients who had a no compromise VANCS; none of these had a PrU, so their data are not represented in Figure 2.
Discussion
Findings from this study indicate that the VANCS documented by dietitians is superior in assessing nutritional risk and predicting the development of PrUs in acutely ill hospitalized veterans compared with the Braden nutrition subscale. This study also shows that the Braden nutrition subscale did not accurately predict PrU development in acutely ill veterans. This finding concurs with the Serpa and Santos study in which the Braden nutrition subscale scores were not predictive for PrU development in hospitalized patients.
One possible explanation for the findings in this study is that the nutrition subscale of the Braden tool asks the assessing clinician to evaluate the amount of food intake the patient is currently taking in for their usual meals. This assessment is highly subjective and speculative and does not account for recent intake fluctuations or weight loss. By comparison, the VANCS is more comprehensive in its ability to assess nutritional compromise based on multiple factors, such as recent weight loss, laboratory indices, body habitus, dentition, and swallowing ability.20 The National Pressure Ulcer Advisory Panel suggests that following an acute care admission, a patient receive a consult from a dietitian if the health care provider suspects that the patient may be nutritionally compromised.1 The study findings demonstrate the utility of the VANCS as predictive of PrU risk.
Unfortunately, the authors have learned that the VANCS may be phased out soon, and many VA facilities are no longer using it. Findings from this study and other recent scientific literature suggest that all inpatients may benefit from nutritional assessments by dietitians. When performed, dietitian assessments provide the basis for more accurate nursing assessment of nutritional risk and targeted interventions. Nursing professionals should be encouraged to review the dietitian assessment and consultation notes and to incorporate this information into a more comprehensive PrU prevention and treatment plan.
Interestingly, in spite of those assessed to have severe nutritional compromise by dietitian assessment (n = 39), very few of these patients (n = 4) had an ICD-9 diagnosis related to malnutrition (ICD-9 codes, 262, 273.8, 269.9, 263.9) entered in their chart for that hospitalization. This observation suggests that 88% of patients with severe nutritional compromise were not appropriately coded at discharge. Improper coding has implications for researchers using ICD-9 diagnosis codes at discharge for accurate analysis of risk factors as well as for health care providers who may look at coded diagnoses information in the charts when considering comorbid conditions for health management.
This study highlights the importance of nutritional status as a risk factor for PrU development. Reasons suggested for nutritional status seeming to be the most significant correlate to PrUs in the acute care setting include the following: decreased protein alters oncotic pressure, making tissue prone to edema; decreases in subcutaneous fat reduce protection from pressure effects; nutritional compromise alters cellular transport of nutrients and waste and makes tissue cells more vulnerable to deformation and physical stresses; and lactate (a by-product of anaerobic glycolysis) or any other metabolic by-product of malnutrition could cause biochemical stress, and tissue cells can die faster as a result of the increased plasma membrane permeability.7,24-26
Limitations
This study was limited to 1 sample of veterans hospitalized in the 2 acute care facilities of NF/SGVHS and the use of a retrospective chart review. As a result, further research is necessary to establish generalizability to other acute care settings and high-risk populations. In spite of these limitations, this and other studies highlight the need for revision of the Braden scale, specifically the nutritional subscale, to lessen the ambiguity seen between dietitian and nursing assessments while also increasing the accuracy in determining a patient’s nutrition risk of PrU development during hospitalization.
Conclusion
These findings provide evidence that dietitians’ documentation of the VANCS related to nutritional compromise are superior to current nutritional risk assessments using the Braden nutrition subscale in predicting PrU risk.
Acknowledgments
The authors acknowledge that this work was supported by the resources of the North Florida/South Georgia Veterans Health System in Gainesville, Florida, and in part by a Small Project Award from the VA Office of Nursing Services.
1. National Pressure Ulcer Advisory Panel, European Pressure Ulcer Advisory Panel, Pan Pacific Pressure Injury Alliance. Prevention and Treatment of Pressure Ulcers: Clinical Practice Guideline. http://www.npuap.org/resources/educational-and-clinical -resources/prevention-and-treatment-of-pressure -ulcers-clinical-practice-guideline. Updated 2014. Accessed November 7, 2016.
2. National Pressure Ulcer Advisory Panel, European Pressure Ulcer Advisory Panel, Pan Pacific Pressure Injury Alliance. Prevention and treatment of pressure ulcers: quick reference guide. http://www .npuap.org/wp-content/uploads/2014/08/Updated -10-16-14-Quick-Reference-Guide-DIGITAL-NPUAP-EPUAP-PPPIA-16Oct2014.pdf. Updated October 16, 2014. Accessed October 21, 2016.
3. Sullivan N. Preventing in-facility pressure ulcers. In: Agency for Healthcare Research and Quality. Making Health Care Safer II. An Updated Critical Analysis of the Evidence for Patient Safety Practices. Evidence Reports/Technology Assessments. http://www.ahrq.gov/sites/default/files/wysiwyg/research/findings/evidence-based-reports/services/quality/ptsafetyII-full.pdf:212-232. Published March 2013. Accessed October 21, 2016.
4. Russo CA, Steiner C, Spector W. Hospitalizations related to pressure ulcers among adults 18 years and older, 2006. In: Healthcare Cost and Utilization Project (HCUP) Statistical Briefs. http://www.ncbi .nlm.nih.gov/books/NBK54557. Published December 2008. Accessed October 21, 2016.
5. Spetz J, Brown DS, Aydin C, Donaldson N. The value of reducing hospital-acquired pressure ulcer prevalence: an illustrative analysis. J Nurs Adm. 2013;43(4):235-241.
6. Whittington KT, Briones R. National prevalence and incidence study: 6-year sequential acute care data. Adv Skin Wound Care. 2004;17(9):490-494.
7. Dorner B, Posthauer ME, Thomas D; National Pressure Ulcer Advisory Panel. The role of nutrition in pressure ulcer prevention and treatment: National Pressure Ulcer Advisory Panel white paper. http://www.npuap.org/wp-content/uploads/2012/03/Nutrition-White-Paper-Website-Version.pdf. Published 2009. Accessed November 7, 2016.
8. Cowan LJ, Stechmiller JK, Rowe M, Kairalla JA. Enhancing Braden pressure ulcer risk assessment in acutely ill adult veterans. Wound Repair Regen. 2012;20(2):137-148.
9. Correia MI, Hegazi RA, Higashiguchi T, et al. Evidence-based recommendations for addressing malnutrition in health care: an updated strategy from the feedM.E. Global Study Group. J Am Med Dir Assoc. 2014;15(8):544-550.
10. Malafarina V, Úriz-Otano F, Fernández-Catalán C, Tejedo-Flors D. Nutritional status and pressure ulcers. Risk assessment and estimation in older adults. J Am Geriatr Soc. 2014;62(6):1209-1210.
11. Posthauer ME, Banks M, Dorner B, Schols JM. The role of nutrition for pressure ulcer management: national pressure ulcer advisory panel, European pressure ulcer advisory panel, and pan pacific pressure injury alliance white paper. Adv Skin Wound Care. 2015;28(4):175-188.
12. Brito PA, de Vasconcelos Generoso S, Correia MI. Prevalence of pressure ulcers in hospitals in Brazil and association with nutritional status—a multicenter, cross-sectional study. Nutrition. 2013;29(4):646-649.
13. Coleman S, Gorecki C, Nelson EA, et al. Patient risk factors for pressure ulcer development: systematic review. Int J Nurs Stud. 2013;50(7):974-1003.
14. Bergstrom N, Braden BJ, Laguzza A, Holman V. The Braden Scale for predicting pressure sore risk. Nurs Res. 1987;36(4):205-210.
15. Ayello EA, Braden B. How and why to do pressure ulcer risk assessment. Adv Skin Wound Care. 2002;15(3):125-131.
16. Wang LH, Chen HL, Yan HY, et al. Inter-rater reliability of three most commonly used pressure ulcer risk assessment scales in clinical practice. Int Wound J. 2015;12(5):590-594.
17. Wilchesky M, Lungu O. Predictive and concurrent validity of the Braden scale in long-term care: a meta-analysis. Wound Repair Regen. 2015;23(1):44-56.
18. Kottner J, Dassen T. An interrater reliability study of the Braden scale in two nursing homes. Int J Nurs Stud. 2008;45(10):1501-1511.
19. Yatabe MS, Taguchi F, Ishida I, et al. Mini nutritional assessment as a useful method of predicting the development of pressure ulcers in elderly inpatients. J Am Geriatr Soc. 2013;61(10):1698-1704.
20. Hiller L, Lowery JC, Davis JA, Shore CJ, Striplin DT. Nutritional status classification in the Department of Veterans Affairs. J Am Diet Assoc. 2001;101(7):786-792.
21. U.S. Department of Veterans Affairs. VHA Handbook 1109.02. Clinical nutrition management. http://www.va.gov/vhapublications/ViewPublica tion.asp?pub_ID=2493. Published February 2012. Accessed October 21, 2016.
22. Landis JR, Koch GG. The measurement of observer agreement for categorical data. Biometrics. 1977;33(1):159-174.
23. Serpa LF, Santos VL. Validity of the Braden Nutrition Subscale in predicting pressure ulcer development. J Wound Ostomy Continence Nurs. 2014;41(5):436-443.
24. Reddy M, Gill SS, Rochon PA. Preventing pressure ulcers: a systematic review. JAMA. 2006;296(8):974-984.
25. Cooper KL. Evidence-based prevention of pressure ulcers in the intensive care unit. Crit Care Nurse. 2013;33(6):57-66.
26. Leopold E, Gefen A. Changes in permeability of the plasma membrane of myoblasts to fluorescent dyes with different molecular masses under sustained uniaxial stretching. Med Eng Phys. 2013;35(5):601-607.
Rinse could provide short-term treatment of oral cGVHD

Photo courtesy of NIH
SAN DIEGO—Results of a phase 2 study suggest an oral mouth rinse formulation of the steroid clobetasol could provide short-term treatment of oral chronic graft-vs-host disease (cGVHD).
A majority of patients had a greater than 25% improvement in their cGVHD after using the clobetasol rinse, and patients reported improvements in oral health-related quality of life.
The rinse even proved effective in patients who had failed prior treatment with clobetasol ointment.
However, researchers found evidence to suggest the clobetasol rinse is not suitable for unmonitored, long-term use, as some patients experienced adrenal suppression.
Jacqueline W. Mays, DDS, PhD, of the National Institutes of Health (NIH) in Bethesda, Maryland, presented these findings at the 2016 ASH Annual Meeting (abstract 826).
Dr Mays noted that topical therapy for oral cGVHD is intended to spare patients from exposure to systemic immunosuppressive agents.
According to NIH consensus criteria, dexamethasone is recommended as the first-line topical therapy for these patients. However, clinical trial data suggest only 29% to 58% of patients respond to this therapy.
Second-line treatment is not well-established, but it typically consists of topical steroids in a gel or ointment formulation. Unfortunately, patient compliance is an issue with this type of treatment.
“If you can imagine trying to apply something in a petrolatum base to the inside of your very wet wall cavity, you can imagine that’s a challenge for a healthy individual, much less for a chronic graft-vs-host disease patient who often will have joint mobility and fine motor issues,” Dr Mays said.
“So this leads to frequent treatment failures of topical regimens, not only due to the drug agents but also due to patient compliance.”
Dr Mays noted that clobetasol is a superpotent synthetic glucocorticoid that has been used off-label in ointment form to treat refractory oral GVHD.
In an attempt to overcome the application challenges with this ointment and improve patient adherence to oral cGVHD treatment, Dr Mays and her colleagues decided to investigate a clobetasol 0.05% solution formulated as an oral rinse in an aqueous base.
The team tested the rinse in a phase 2 trial with an initial 2-week randomized, double-blind, placebo-controlled period.
Patient population
The trial enrolled and randomized 36 patients with oral cGVHD. The patients had an Oral Mucositis Rating Scale (OMRS) score of ≥20 with moderate erythema and/or ulceration. They also had stable or tapering systemic therapy during the 2 weeks prior to starting the study and for the duration of the blinded period.
The patients’ median age was 42 (range, 18-68), and 20 were male. Thirty-five patients received ablative conditioning, 18 received a related-donor transplant, 34 received a matched-donor transplant, and 30 received a peripheral blood stem cell graft.
The median time from cGVHD diagnosis to trial enrollment was 257 days (range, 15-3013). Thirty-six patients had mouth cGVHD, 21 had skin cGVHD, 26 had eye cGVHD, 14 had gastrointestinal cGVHD, 16 had liver cGVHD, 11 had lung cGVHD, and 10 had cGVHD of the joints and fascia.
Six patients had not received any prior oral topical therapy. The other 30 patients had a median of 2 prior oral topical therapies. Eleven patients had received prior clobetasol ointment.
Treatment
The patients were randomized to receive clobetasol or placebo rinse for 2 weeks (blinded period). After that, all patients received clobetasol rinse until they completed 28 days of treatment.
The patients were required to perform a 2-minute swish with 10 ml of clobetasol rinse 3 times daily and a once-daily swish with nystatin (100,000 u/ml) rinse for antifungal prophylaxis. The patients continued on systemic pneumocystis, antiviral, and antifungal prophylaxis, per NIH cGVHD guidelines.
Thirty-two of the patients completed treatment, using the clobetasol rinse for the full 28 days.
Four patients went off study before completing 28 days of treatment. One of these patients could not tolerate the rinse. This patient had gastrointestinal issues that were attributed (by the patient and the physician) to use of the study drug.
Two patients went off study because they could not make it to the NIH for follow-up visits, and 1 patient died. The death was unrelated to the study drug.
Safety
Dr Mays noted that small amounts of clobetasol were detectable in the bloodstream, but she and her colleagues found this was not directly correlated to patient serum cortisol levels.
However, the researchers did observe a significant drop in serum cortisol levels from baseline to day 28, suggesting the rinse has an adrenal impact.
On the other hand, the peripheral lymphocyte profile was unchanged by the use of clobetasol rinse, which suggests there were no significant systemic immunosuppressive effects.
Adverse events considered possibly or probably related to clobetasol rinse included herpes simplex virus reactivation (n=3, grade 2-3), oral candidiasis (n=3, grade 2), other oral viral infection (n=1, grade 2), facial edema (n=3, grade 1), and adrenal suppression (6 grade 1 and 1 grade 2).
Dr Mays noted that many of the patients came on the study with adrenal suppression, but the clobetasol rinse had an additional impact.
Efficacy
The study’s primary endpoint was change in oral cGVHD severity scale at day 28 compared to baseline. Complete response was defined as a score of 0 on the erythema and ulceration components. Partial response was defined as a 25% decrease in score.
Progression was defined as a 25% increase in initial score. Stable disease was defined as a status that does not meet the criteria for progression or response.
Ninety-one percent of patients had a greater than 25% improvement in oral cGVHD severity scale. Nineteen percent of patients had a complete response, 72% of patients had a partial response, and 9% had stable disease. None of the patients progressed.
Dr Mays noted that patients who failed treatment with prior clobetasol ointment responded similarly to the clobetasol rinse when compared with the full study cohort.
Among the 11 patients with prior clobetasol ointment, 18% had a complete response, 73% had a partial response, 9% had stable disease, and none progressed.
Clobetasol rinse significantly decreased the clinical OMRS score (P<0.0001) and improved cGVHD pathology diagnosis (P=0.0001).
Patients reported a significant improvement in oral health-based quality of life (P=0.0008) after completing treatment, as well as significant improvements in oral pain (P=0.017) and oral sensitivity (P=0.0081).
Though saliva production did not change significantly from baseline to day 28, patients reported a significant improvement in oral dryness (P=0.014).
The blinded period of the study showed that placebo treatment was not effective. There was a significant difference between the placebo and clobetasol groups with regard to improvement in OMRS score from baseline to day 14 (P=0.0031).
“We found clobetasol oral rinse to be both effective and safe for short-term treatment of oral mucosal cGVHD and hope that it will improve sparing of systemic immunosuppressants in this patient population,” Dr Mays said. “Its risk profile is generally not suitable for unmonitored, long-term use.” ![]()
P falciparum malaria existed 2000 years ago, team says

individual from Velia, Italy
Photo courtesy of Luca
Bandioli, Pigorini Museum
An analysis of 2000-year-old human remains from several regions across the Italian peninsula has confirmed the presence of Plasmodium falciparum malaria during the Roman Empire, according to researchers.
The team found mitochondrial genomic evidence of P falciparum malaria, coaxed from the teeth of bodies buried in 3 Italian cemeteries, dating back to the Imperial period.
The researchers said these finding provide a key reference point for when and where the malaria parasite existed in humans, as well as more information about the evolution of human disease.
The team reported these findings in Current Biology.
“There is extensive written evidence describing fevers that sound like malaria in ancient Greece and Rome, but the specific malaria species responsible is unknown,” said study author Stephanie Marciniak, PhD, of Pennsylvania State University in University Park.
“Our data confirm that the species was likely Plasmodium falciparum and that it affected people in different ecological and cultural environments. These results open up new questions to explore, particularly how widespread this parasite was and what burden it placed upon communities in Imperial Roman Italy.”
Dr Marciniak and her colleagues sampled teeth taken from 58 adults interred at 3 Imperial period Italian cemeteries: Isola Sacra, Velia, and Vagnari.
Located on the coast, Velia and Isola Sacra were known as important port cities and trading centers. Vagnari is located further inland and believed to be the burial site of laborers who would have worked on a Roman rural estate.
The researchers mined tiny DNA fragments from dental pulp. They were able to extract, purify, and enrich specifically for the Plasmodium species known to infect humans.
The team noted that usable DNA is challenging to extract because the parasites primarily dwell within the bloodstream and organs, which decompose and break down over time—in this instance, over the course of 2 millennia.
However, the researchers recovered more than half of the P falciparum mitochondrial genome from 2 individuals from Velia and Vagnari. ![]()
Partnerships with pediatric tertiary care centers improve community ED asthma treatment
Partnerships between community emergency departments and pediatric tertiary care centers are feasible and improve care of pediatric asthma, according to Theresa A. Walls, MD, of the Children’s National Health Systems, Washington, D.C., and her associates.
A total of 724 asthma patients aged 2-17 years were included in the study. Of this group, 289 (40%) were treated at the community ED before the pediatric tertiary care center intervention and 435 (60%) were treated after the intervention. Treatment with steroids was significantly increased post intervention, with 76% of patients receiving steroids, compared with 60% of patients before the intervention.
“Because the overwhelming majority of pediatric emergency visits occur in community EDs, partnerships with these EDs can broaden the impact of quality improvement activities and should be part of future quality improvement efforts,” the investigators concluded.
Find the full study in Pediatrics (2016. doi: 10.1542/peds.2016-0088).
Dr. Walls and her group developed a quality improvement (QI) initiative with a community emergency department. One important part of the study was the use of an asthma score, which helped determine steps for ED therapy.

Dr. Walls and her group developed a quality improvement (QI) initiative with a community emergency department. One important part of the study was the use of an asthma score, which helped determine steps for ED therapy.
Dr. Walls and her group developed a quality improvement (QI) initiative with a community emergency department. One important part of the study was the use of an asthma score, which helped determine steps for ED therapy.
Partnerships between community emergency departments and pediatric tertiary care centers are feasible and improve care of pediatric asthma, according to Theresa A. Walls, MD, of the Children’s National Health Systems, Washington, D.C., and her associates.
A total of 724 asthma patients aged 2-17 years were included in the study. Of this group, 289 (40%) were treated at the community ED before the pediatric tertiary care center intervention and 435 (60%) were treated after the intervention. Treatment with steroids was significantly increased post intervention, with 76% of patients receiving steroids, compared with 60% of patients before the intervention.
“Because the overwhelming majority of pediatric emergency visits occur in community EDs, partnerships with these EDs can broaden the impact of quality improvement activities and should be part of future quality improvement efforts,” the investigators concluded.
Find the full study in Pediatrics (2016. doi: 10.1542/peds.2016-0088).
FROM PEDIATRICS