User login
New Slate of Officers for the CHEST Foundation
The CHEST Foundation has announced Michael E. Nelson, MD, FCCP, as its new President, effective November 1. At CHEST 2016, the annual meeting of the American College of Chest Physicians (CHEST), the CHEST board also confirmed the appointments of Lisa K. Moores, MD, FCCP, as President-Elect of the CHEST Foundation; Doreen J. Addrizzo-Harris, MD, FCCP, as CHEST Foundation President-Designate; and John A. Howington, MD, FCCP, as CHEST Foundation Immediate Past President.
Michael E. Nelson, MD, FCCP, is a private practice pulmonologist at Shawnee Mission Pulmonary Consultants, Kan., specializing in pulmonary diseases, critical care, and sleep medicine. A CHEST Foundation Trustee since 2012, Dr. Nelson has served the last 2 years as Foundation President-Elect, and has been affiliated with the American College of Chest Physicians for almost 22 years, holding a variety of roles. Dr. Nelson is board-certified in internal medicine, pulmonary disease, critical care medicine, and sleep medicine.
Lisa K. Moores, MD, FCCP, is the Associate Dean of Students and Professor of Medicine at F. Edward Hebert School of Medicine, Uniformed Services University of the Health Sciences, Bethesda, Md. Currently, Dr. Moores is on active duty with the U.S. Army Medical Corps. She has been a member of the American College of Chest Physicians since 1994, and she has played a very active role in her time with the College, including serving as a CHEST Foundation Trustee-at-Large since 2011. Dr. Moores was awarded the Edward C. Rosenow III, Master FCCP/Master Teacher Honor Lecture Award at CHEST 2013. She is board-certified in critical care medicine, pulmonary disease, and internal medicine.
Doreen J. Addrizzo-Harris, MD, FCCP, is a graduate in medicine from New York University Medical Center, where she currently serves as a Professor of Medicine in the Division of Pulmonary and Critical Care. A CHEST Foundation Trustee-at-Large since 2013, she has been a Fellow of the American College of Chest Physicians for more than 20 years. Dr. Addrizzo-Harris was awarded Teacher of the Year in Pulmonary and Critical Care at NYU in 2000 and then again in 2013, showcasing her outstanding commitment and dedication to teaching.
John A. Howington, MD, FCCP, is a thoracic surgeon oncologist at St. Thomas Health, Nashville, Tenn., specializing in minimally invasive treatment options for thoracic cancer. He serves as the Chairman of Thoracic Surgery and is also the Co-Director of the Thoracic Oncology Program. A CHEST Foundation Trustee since 2012 and CHEST Foundation President for the last 2 years, he has been involved with the American College of Chest Physicians for nearly 20 years. In that time, he has held a variety of roles.
Coding Updates
CHEST Physician Editorial Board Member
Confusion in EBUS Coding
There has been some confusion about appropriate coding using the new endobronchial ultrasound codes with some of the other bronchoscopy codes. Notably, when CPT code 31629 bronchoscopy with transbronchial needle aspiration biopsy(s), trachea, main stem and/or lobar bronchus(i) is appropriate to use with code 31652 with endobronchial ultrasound (EBUS) guided transtracheal and/or transbronchial sampling (e.g., aspiration[s]/biopsy[ies]), one or two mediastinal and/or hilar lymph node stations or structures and code 31653 with endobronchial ultrasound (EBUS) guided transtracheal and/or transbronchial sampling (e.g., aspiration[s]/biopsy[ies]), 3 or more mediastinal and/or hilar lymph node stations or structures. Both 31652 and 31653 include needle sampling as a part of the work and therefore, if the bronchoscopy involves only one these procedures, it would be inappropriate to include 31629.
However, mediastinal sampling is often done in conjunction with evaluation of a more peripheral lesion. If a bronchoscopy is performed with needle biopsy(ies) of a peripheral lesion and subsequently an EBUS scope is used to sample mediastinal or hilar lymph node stations, one could utilize 31629 and either 31652 or 31653. As an illustrative example, a 75-year-old man is found to have a 2-cm peripheral nodule in the anterior segment of the right-upper lobe with enlarged right hilar and subcarinal lymph nodes on CT scan. Bronchoscopy is performed, and, initially, the patient has a survey bronchoscopy using a non-EBUS scope, and no lesion is visible. A radial ultrasound probe is used to help identify the peripheral lesion, and multiple needle biopsies are performed as are brushings and washings. Subsequently, an EBUS scope is introduced, and right hilar, right paratracheal, and subcarinal needle biopsies were performed. The appropriate codes to utilize to describe the work done in this procedure include 31623, 31629, 31653, and 31654. Had no peripheral needle biopsies been performed, then code 31629 would NOT be used. Hopefully, this clarifies the issue further.
CMS Ceases Use of HCPCS G Codes for Smoking Cessation
Effective on or after October 1, the Centers for Medicare & Medicaid Services (CMS) will no longer allow use of Healthcare Common Procedural Coding System (HCPCS) codes G0436 (Smoking and tobacco cessation counseling visit for the asymptomatic patient; intermediate, greater than 3 minutes, up to 10 minutes) and G0437 (Smoking and tobacco cessation counseling visit for the asymptomatic patient; intensive, greater than 10 minutes). Instead, CMS will utilize the new codes developed for the Current Procedural Terminology (CPT) code set.
CMS has advised its Medicare contractors to replace code G0436 with CPT code 99406 (Smoking and tobacco use cessation counseling visit; intermediate, greater than 3 minutes up to 10 minutes) and code G0437 with CPT code 99407 (Smoking and tobacco use cessation counseling visit; intensive, greater than 10 minutes). According to the Medicare National Coverage Determination Manual, tobacco cessation counseling is covered both for symptomatic and asymptomatic smokers. CMS will allow health-care providers two attempts per 12 months to encourage Medicare patients to cease tobacco use but does not define an attempt. Rather, either of the codes may be used up to four times per attempt; so 99406 and 99407 or a combination of these codes may be used up to 8 times in a 12-month period. These codes may be used either as a stand-alone or with an evaluation and management (E&M) service with appropriate documentation. Remember, however, if one uses these codes during an E&M visit, a 25 modifier will need to be appended to the E&M code.
Catching Up With Our Past Presidents
Where are they now? What have they been up to? CHEST’s Past Presidents each forged the way for the many successes of the American College of Chest Physicians (CHEST), leading to enhanced patient care around the globe. Their outstanding leadership and vision are evidenced today in many of CHEST’s current initiatives, and now it is time to check in with these past leaders to give us a look at what’s new.
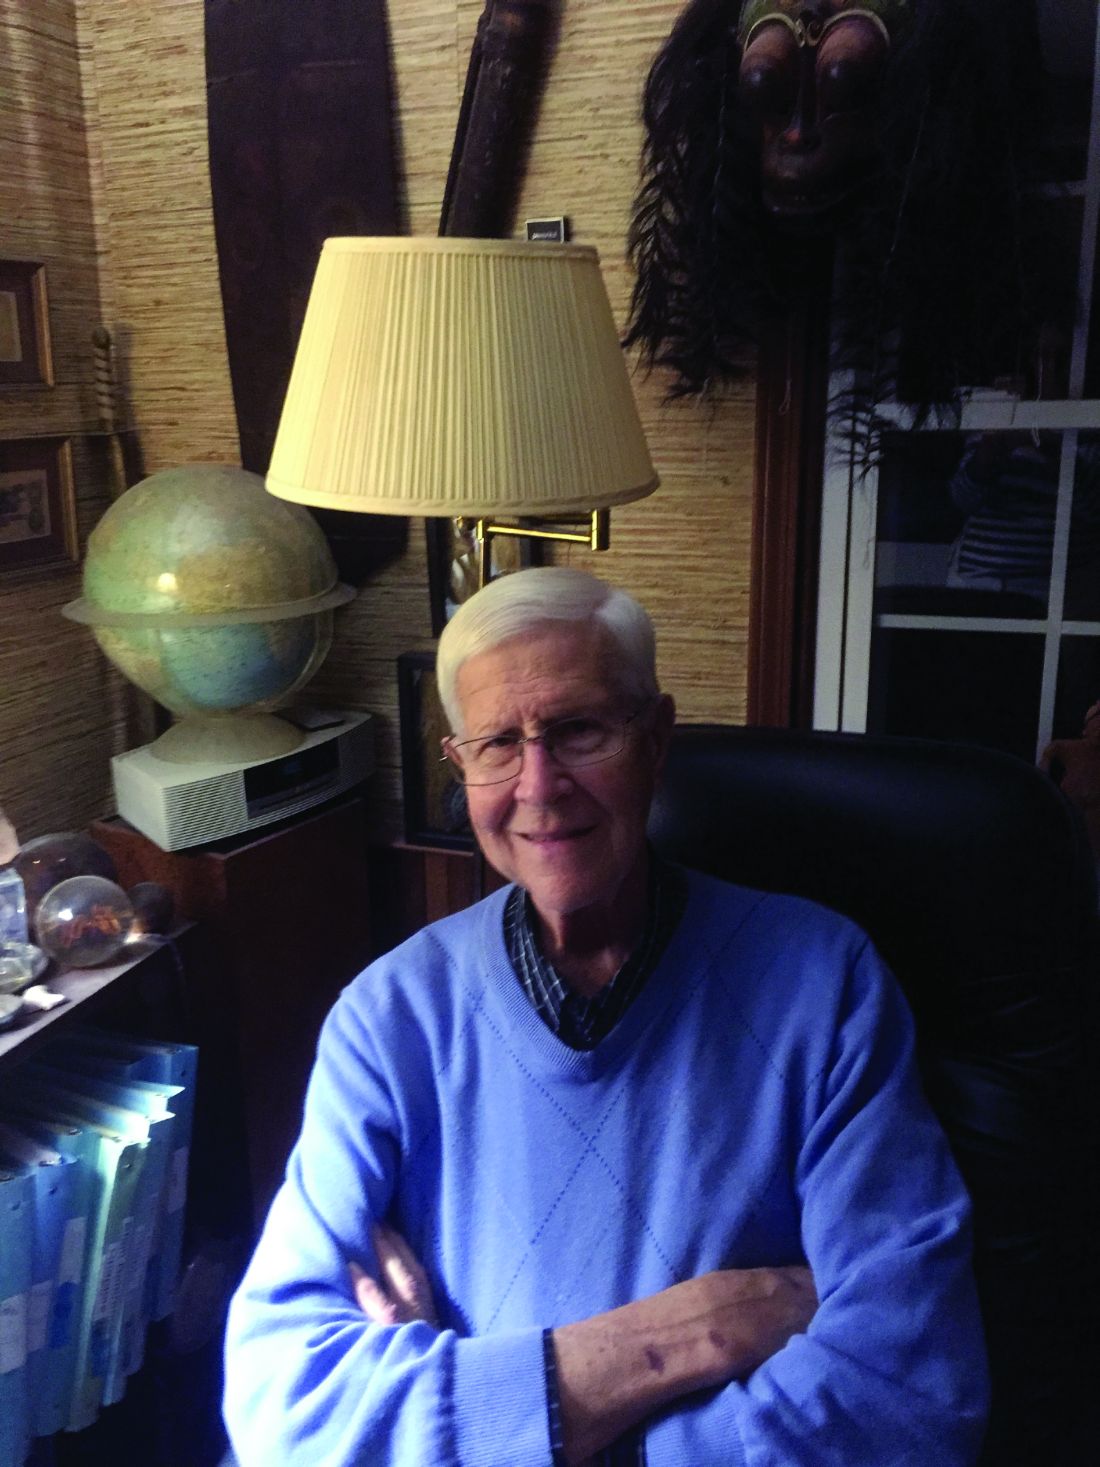
Paul Stein, MD, FCCP
President 1992-1993
It is now 24 years since I was president of the American College of Chest Physicians (CHEST). Dr. Al Soffer had just retired, and it was Al Lever’s first year. Dr. Roger Bone preceded me as President and Dr. Ron George followed me.
Getting back to pulmonary embolism, with distinguished collaborators throughout the United States, and some in Canada, we did the PIOPED II investigation of the accuracy of multidetector CT pulmonary angiography and PIOPED III, the accuracy of magnetic resonance imaging for the diagnosis of pulmonary embolism. I have written three editions of the book, “Pulmonary Embolism” (1998, 2007, 2016).
So that‘s how I spend most of my time, working and doing research, which I love. I feel blessed to be able to continue being productive at age 82. Janet and I just celebrated our 50th wedding anniversary. We have three children and two grandchildren.
My main hobby is playing the clarinet. I particularly enjoy playing classical sonatas and meet monthly with a superb pianist who had been a professional organist. We are hoping to make a CD. In addition, I play in a “swing band” and a concert band that hopefully will go to a national contest.
Another hobby is collections, which include fossils, old books, rocks, masks, tribal art, and musical instruments, to name a few. It is a thrill to hold the fossil of an animal that lived 400 million years ago or an arrowhead made by someone 10,000 years ago.
Where are they now? What have they been up to? CHEST’s Past Presidents each forged the way for the many successes of the American College of Chest Physicians (CHEST), leading to enhanced patient care around the globe. Their outstanding leadership and vision are evidenced today in many of CHEST’s current initiatives, and now it is time to check in with these past leaders to give us a look at what’s new.
Paul Stein, MD, FCCP
President 1992-1993
It is now 24 years since I was president of the American College of Chest Physicians (CHEST). Dr. Al Soffer had just retired, and it was Al Lever’s first year. Dr. Roger Bone preceded me as President and Dr. Ron George followed me.
Getting back to pulmonary embolism, with distinguished collaborators throughout the United States, and some in Canada, we did the PIOPED II investigation of the accuracy of multidetector CT pulmonary angiography and PIOPED III, the accuracy of magnetic resonance imaging for the diagnosis of pulmonary embolism. I have written three editions of the book, “Pulmonary Embolism” (1998, 2007, 2016).
So that‘s how I spend most of my time, working and doing research, which I love. I feel blessed to be able to continue being productive at age 82. Janet and I just celebrated our 50th wedding anniversary. We have three children and two grandchildren.
My main hobby is playing the clarinet. I particularly enjoy playing classical sonatas and meet monthly with a superb pianist who had been a professional organist. We are hoping to make a CD. In addition, I play in a “swing band” and a concert band that hopefully will go to a national contest.
Another hobby is collections, which include fossils, old books, rocks, masks, tribal art, and musical instruments, to name a few. It is a thrill to hold the fossil of an animal that lived 400 million years ago or an arrowhead made by someone 10,000 years ago.
Power of a Summit Award
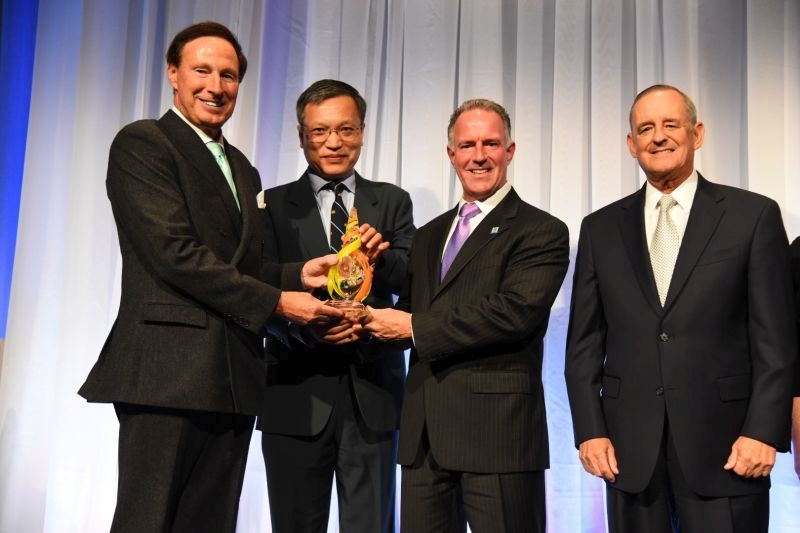
The American College of Chest Physicians (CHEST) was awarded The Power of a Summit Award from the American Society of Association Executives (ASAE) in October for the China-CHEST Pulmonary and Critical Care Medicine (PCCM) Fellowship Program (Fig 1). CHEST is one of only six associations chosen for this honor.
The goal of the China-CHEST PCCM Fellowship Program is to standardize training and to equip clinicians in China to provide care to those affected by respiratory and critical care illnesses. Through collaboration among multiple international associations, CHEST has been working since 2013 to prepare physicians in the first-ever medical subspecialty of pulmonary and critical care in China.
Since the launch of China-CHEST PCCM Fellowship Program in 2013, 12 participating Chinese institutions started their PCCM training programs. By the end of 2016, 30 programs with 300 fellows and 60 faculty will be participating at institutions throughout China, with the potential to impact the care of thousands of patients. The China-PCCM Fellowship Program welcomed and congratulated its first four graduates in September 2016 (Fig 2).
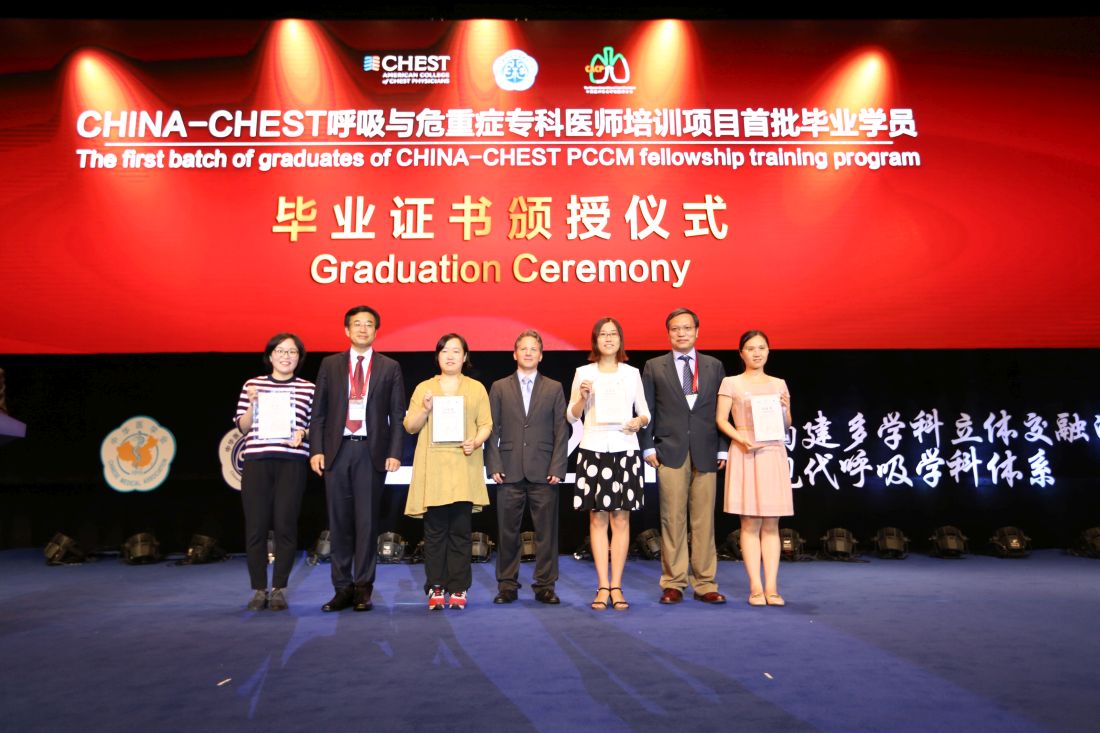
Li Huang, Xiangya Hospital, Changsha, Hunan (graduate); Chen Wang, MD, FCCP; Xianwen Sun, Ruijin Hospital, Shanghai (graduate); Robb Rabito; Chenjuan Gu, Ruijin (graduate); Renli Qiao, MD, FCCP; and Yingmeng Ni, Ruijing (graduate).
The vast reach and clinical exposure of this program highlights how a CHEST and the China-CHEST PCCM Fellowship Program were recognized at the ASAE’s 17th Annual Summit Awards Dinner in October. Steve Welch, CHEST interim EVP/CEO, accepted the award on behalf of CHEST.
The American College of Chest Physicians (CHEST) was awarded The Power of a Summit Award from the American Society of Association Executives (ASAE) in October for the China-CHEST Pulmonary and Critical Care Medicine (PCCM) Fellowship Program (Fig 1). CHEST is one of only six associations chosen for this honor.
The goal of the China-CHEST PCCM Fellowship Program is to standardize training and to equip clinicians in China to provide care to those affected by respiratory and critical care illnesses. Through collaboration among multiple international associations, CHEST has been working since 2013 to prepare physicians in the first-ever medical subspecialty of pulmonary and critical care in China.
Since the launch of China-CHEST PCCM Fellowship Program in 2013, 12 participating Chinese institutions started their PCCM training programs. By the end of 2016, 30 programs with 300 fellows and 60 faculty will be participating at institutions throughout China, with the potential to impact the care of thousands of patients. The China-PCCM Fellowship Program welcomed and congratulated its first four graduates in September 2016 (Fig 2).
Li Huang, Xiangya Hospital, Changsha, Hunan (graduate); Chen Wang, MD, FCCP; Xianwen Sun, Ruijin Hospital, Shanghai (graduate); Robb Rabito; Chenjuan Gu, Ruijin (graduate); Renli Qiao, MD, FCCP; and Yingmeng Ni, Ruijing (graduate).
The vast reach and clinical exposure of this program highlights how a CHEST and the China-CHEST PCCM Fellowship Program were recognized at the ASAE’s 17th Annual Summit Awards Dinner in October. Steve Welch, CHEST interim EVP/CEO, accepted the award on behalf of CHEST.
ABIM Alternative Assessment Model
The American Board of Internal Medicine (ABIM) announced in May 2016 it would be offering an alternate option to the 10-year MOC exam, beginning in January 2018. This announcement came in response to ongoing feedback from physicians and other stakeholders regarding the high-stakes recertification exam every 10 years.
The new option will include shorter, more-frequent assessments that can be completed from a physician’s office or home. These shorter assessments will identify knowledge gaps, so physicians can tailor their continuing education in order to stay current in knowledge and practice. Successful performance on the shorter assessments will allow physicians to opt out of the longer 10-year exam.
Prior to the launch of an alternative assessment model, ABIM has been soliciting input from diplomates through surveys and live conversations at society meetings.
The program will be piloted for internal medicine and select subspecialties, and based on feedback, will be extended to additional subspecialties at a later date. Physicians whose certifications expire prior to the new assessment option becoming available will need to pass the current exam in order to maintain certification, but then will not need to take another assessment for 10 years. Additional details regarding these alternative assessment options will be announced by the end of 2016 and can be tracked via ABIM’s blog. They also have an FAQ document online to address common questions regarding the alternative assessment pathway, as well as other topics related to MOC.
This Month in CHEST
Editor’s Picks
Giants in Chest Medicine: Bartolome Celli, MD, FCCP. By Dr. G. J. Criner
Elevated Plasma Levels of sRAGE Are Associated With Nonfocal CT-Based Lung Imaging in Patients With ARDS: A Prospective Multicenter Study. By Dr. S. Mrozek, et al.
A Case-Control Study Assessing the Impact of Nonventilated Hospital-Acquired Pneumonia on Patient Outcomes. By Dr. S. T. Micek, et al.
Low Prevalence of High-Grade Lesions Detected With Autofluorescence Bronchoscopy in the Setting of Lung Cancer Screening in the Pan-Canadian Lung Cancer Screening Study. By Dr. A. Tremblay, et al.
CHEST Clinical Trials Registry
Are you a clinical trials investigator with unused capacity? Would you like to refer patients to participate in groundbreaking clinical trials?
The CHEST Clinical Trials Registry is a free service that connects physicians to information about clinical trials in respiratory disease conducted by participating pharmaceutical companies.
Ongoing groundbreaking research could have a measurable impact on patient care, but a lack of clinical trial participants is significantly slowing research and threatening the development of new treatments. Recruiting and retaining trial participants are the greatest challenges to developing the next generation of treatment options.
Participation in clinical trials provides an opportunity to advance and accelerate medical research and contribute to an improved health outlook for future generations. Use our registry to get immediate information on how you can be involved in a clinical trial.
Access this site to learn more: www.chestnet.org/Guidelines-and-Resources/Clinical-Trials/Clinical-Trials-Registry.
Rheumatoid arthritis increases heart failure risk
ROME – Rheumatoid arthritis is associated with a significantly increased risk of hospitalization for heart failure, according to a nationwide Danish study, Usman Khalid, MD, reported at the annual congress of the European Society of Cardiology.
As a chronic systemic inflammatory disease, rheumatoid arthritis (RA) has been associated with increased risk of a variety of comorbid conditions, including cardiovascular disease. But RA’s relationship specifically with heart failure hasn’t previously been looked at in the comprehensive way that’s possible in Denmark, where linked national registries enable researchers to follow health issues in the entire population from birth to death, noted Dr. Khalid of the University of Copenhagen.

In an analysis adjusted for age, sex, and calendar year, individuals with RA were 83% more likely to be hospitalized for heart failure than were the non-RA Danish population. In a fully adjusted analysis that controlled for those potential confounders as well as comorbid conditions, smoking, alcohol intake, socioeconomic status, and prescription medications, patients with RA remained at a statistically significant and clinically meaningful 38% increased risk of heart failure hospitalization.
Further studies are planned to determine the underlying mechanisms of this association, Dr. Khalid added.
He reported having no financial conflicts of interest regarding this study, which was supported by an unrestricted grant from Leo Pharma.
ROME – Rheumatoid arthritis is associated with a significantly increased risk of hospitalization for heart failure, according to a nationwide Danish study, Usman Khalid, MD, reported at the annual congress of the European Society of Cardiology.
As a chronic systemic inflammatory disease, rheumatoid arthritis (RA) has been associated with increased risk of a variety of comorbid conditions, including cardiovascular disease. But RA’s relationship specifically with heart failure hasn’t previously been looked at in the comprehensive way that’s possible in Denmark, where linked national registries enable researchers to follow health issues in the entire population from birth to death, noted Dr. Khalid of the University of Copenhagen.
In an analysis adjusted for age, sex, and calendar year, individuals with RA were 83% more likely to be hospitalized for heart failure than were the non-RA Danish population. In a fully adjusted analysis that controlled for those potential confounders as well as comorbid conditions, smoking, alcohol intake, socioeconomic status, and prescription medications, patients with RA remained at a statistically significant and clinically meaningful 38% increased risk of heart failure hospitalization.
Further studies are planned to determine the underlying mechanisms of this association, Dr. Khalid added.
He reported having no financial conflicts of interest regarding this study, which was supported by an unrestricted grant from Leo Pharma.
AT THE ESC CONGRESS 2016
Key clinical point:
Major finding: The incidence rate for heart failure hospitalization was 7.37 per 1,000 person-years in Danish adults with rheumatoid arthritis, compared with 2.45 per 1,000 in the general population.
Data source: This study utilized Danish comprehensive national registries to determine the rate at which 13,800 Danes with rheumatoid arthritis and no baseline history of heart failure were hospitalized for heart failure during 15 years of follow-up.
Disclosures: The study was supported by an unrestricted grant from Leo Pharma. The presenter reported having no financial conflicts of interest.
Lessons learned from using CDK 4/6 inhibitors to treat metastatic breast cancer
45 new cancer drugs – a significant jump from the average 26 approvals annually from 2006 to 2014. This major shift in the number of approvals is due to many factors, including the intensified efforts by scientists and clinicians to develop new drugs, especially novel immunotherapies, and changes in the FDA’s drug approval process under the leadership of Dr Richard Pazdur.
Click on the PDF icon at the top of this introduction to read the full article.
Can carotid interventions affect cognitive function?
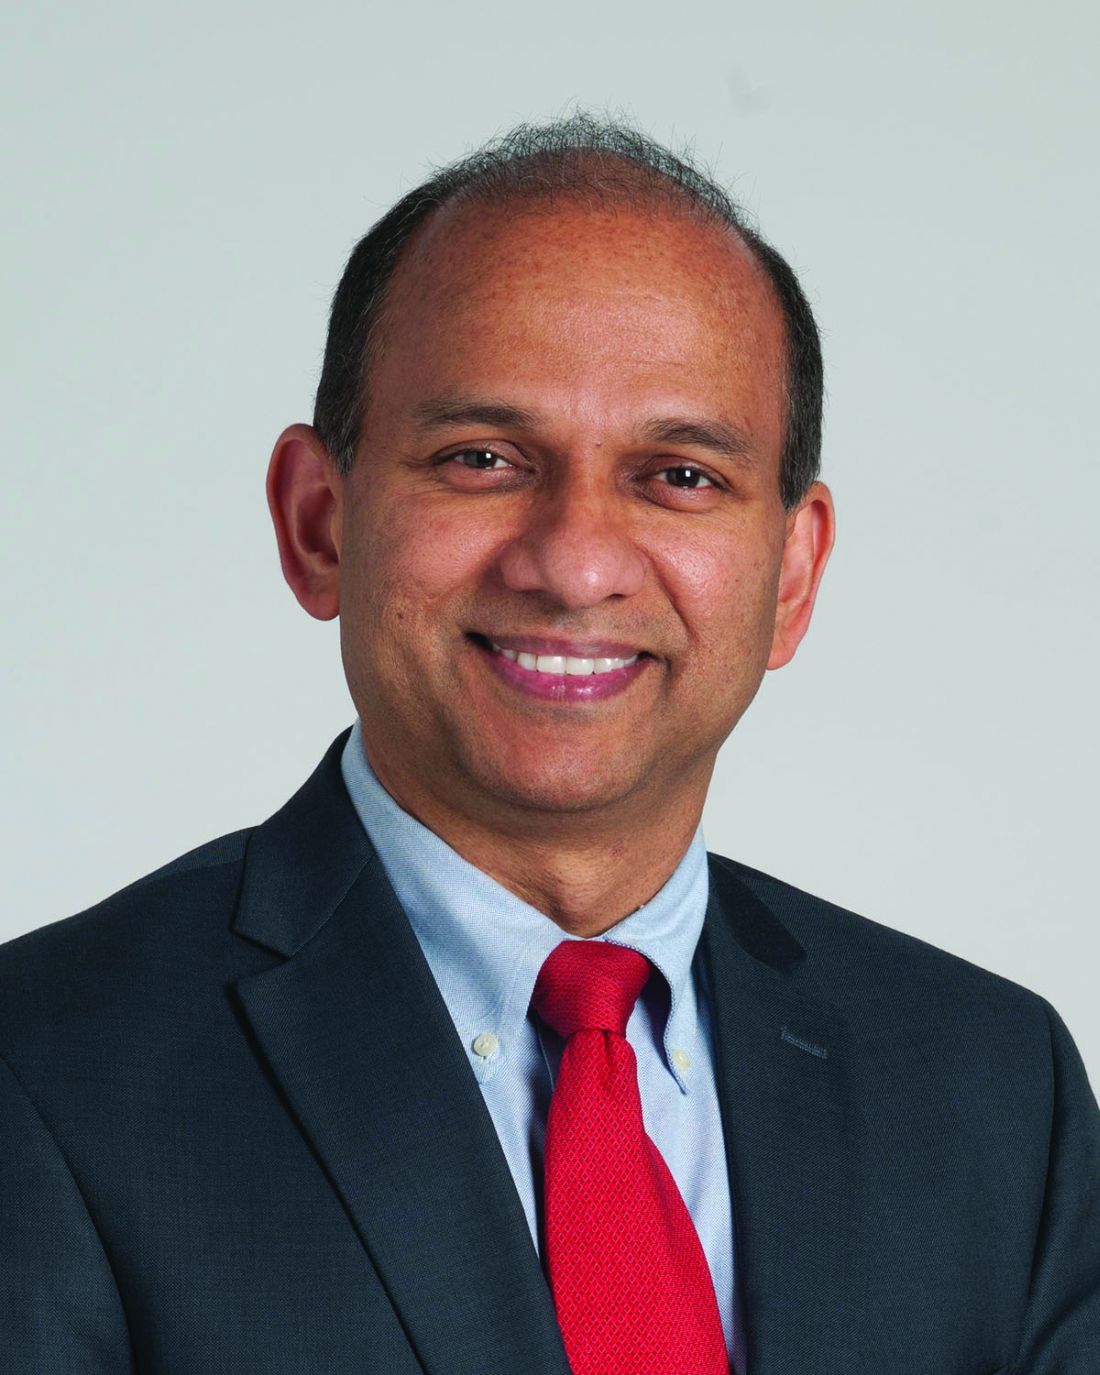
COLUMBUS, OHIO – The primary goal of carotid artery revascularization is to prevent stroke, heart attack or death, but carotid artery stenting and carotid endarterectomy may also cause changes in cognitive skills, according Raghu Motaganahalli, MD, of the Indiana University, Indianapolis.
“What about cognitive dysfunction as a result of carotid artery stenting (CAS) or carotid endarterectomy (CEA)?” Dr. Motaganahalli asked at the annual meeting of the Midwestern Vascular Surgical Society. “I think this is real, that there’s some truth to the matter. The question is how much and what domains of cognitive functions are affected?”

“Cerebrovascular hemodynamics status plays a role in cognitive function, but we need a better understanding of cerebrovascular hemodynamic failure and either improvement or decline of cognitive function after CAS or CEA,” he said.
A review of published trials shows that 10%-20% of patients who have either CAS or CEA have some degree of cognitive dysfunction as early as a day after the procedure. “It’s not a small number, compared to stoke, risk of myocardial infarction and death,” he said.
Some series have reported up to 40% of patients showed some cognitive dysfunction, and post–carotid endarterectomy cognitive dysfunction has been associated with early death, Dr. Motaganahalli said.
Cognitive dysfunction manifests in various forms, ranging from level of consciousness and memory to mood and ability to make calculations. Although the Mini-Mental State Examination Global Cognitive Assessment tool provides a method for evaluating cognitive function, “There is no uniformly accepted neurocognition test,” Dr. Motaganahalli said. That explains the wide variability of findings among published studies.
Vascular surgeons take a somewhat casual approach to their patients’ cognitive abilities after carotid revascularization, Dr. Motaganahalli said. “We don’t evaluate their memory and their cognitive functions on post-op day one; we just look to see whether they have neurologic dysfunction up front and that they’re capable of going home after that.”
But predicting in advance which patients are predisposed to cognitive decline after the procedures is difficult, he said. He cited a systematic review of 32 studies published between 1990-2007 that showed variable results (Stroke. 2008;39:3116-27): 11 studies during 1990-2005 suggested cognition actually improved after CEA; 9 studies during 1994-2006 suggested the opposite; 4 trials during 1992-2005 suggested no change in cognition after CEA; 5 studies during 2003-2007 showed improvement in cognition after CAS; and 3 trials comparing CAS and CEA and cognition found no differences in how the two procedures affect cognition.
Dr. Motaganahalli also cited a systematic review of 37 studies, 18 of which examined CEA, 12 CAS and seven compared CEA and CAS, found that either cognitive improvement or impairment for CEA and CAS separately were 10–15% of patients (Cerebrovasc Dis Extra. 2014;4:132-48).
“We have 69 papers that looked at cognitive function alone, but unfortunately, we don’t know whether cognitive function really improved based on this data set,” he said. “None of them are making the argument so clearly that there is cognitive improvement after revascularization.”
The variability in study findings can be due to differences in methodologies, the types of psychometric tests used, statistical analyses and the timing of cognitive assessments, Dr. Motaganahalli said.
Cognitive impairment after stroke caused by carotid disease is better understood than is cognitive impairment in the absence of a major stroke, Dr. Motaganahalli said.
“The mechanisms of how carotid disease can cause the cognitive impairment are threefold: It could be microembolism and hypoperfusion, which together can cause white matter disease and thereby some cognitive dysfunction in the long term,” he said (Neuroimaging Clin N Am. 2007 Aug;17:313-24).
Functional neurons may be a biomarker of cognitive outcome, he said. Hypoperfusion of functional neurons may lead to hypofunctional neurons, which can increase cerebral blood flow and cerebral metabolic rate for oxygen (CMRO2), and thus improve cognition. However, when additional variables are introduced to the hypofunctional neurons – such as microembolism, white matter disease, and prolonged hypoperfusion – that can lead to neuronal infarction that, while increasing cerebral blood flow, causes no change in CMRO2 and, thus, no cognitive improvement. The interval between hypofunctional neurons and neuronal infarction “is the time to do the revascularization, as long as you can demonstrate that there may be some truth to matter that it influences cognition,” Dr. Motaganahalli said.
While vascular surgeons may not be able to predict who will have cognitive decline after carotid interventions, “There are some pointers for possibly picking those patients who may benefit,” Dr. Motaganahalli said.
That choice of patients revolves around recognizing that chronic ischemia induces and increases the severity of cognitive dysfunction. Therefore, incorporating the pathophysiology of chronic ischemia into the algorithm for carotid artery disease may provide an opportunity to extend the goals of carotid artery revascularization to include preventing or reversing cognitive decline, he said.
Dr. Motaganahalli disclosed he is a consultant to Silk Road Medical.
COLUMBUS, OHIO – The primary goal of carotid artery revascularization is to prevent stroke, heart attack or death, but carotid artery stenting and carotid endarterectomy may also cause changes in cognitive skills, according Raghu Motaganahalli, MD, of the Indiana University, Indianapolis.
“What about cognitive dysfunction as a result of carotid artery stenting (CAS) or carotid endarterectomy (CEA)?” Dr. Motaganahalli asked at the annual meeting of the Midwestern Vascular Surgical Society. “I think this is real, that there’s some truth to the matter. The question is how much and what domains of cognitive functions are affected?”
“Cerebrovascular hemodynamics status plays a role in cognitive function, but we need a better understanding of cerebrovascular hemodynamic failure and either improvement or decline of cognitive function after CAS or CEA,” he said.
A review of published trials shows that 10%-20% of patients who have either CAS or CEA have some degree of cognitive dysfunction as early as a day after the procedure. “It’s not a small number, compared to stoke, risk of myocardial infarction and death,” he said.
Some series have reported up to 40% of patients showed some cognitive dysfunction, and post–carotid endarterectomy cognitive dysfunction has been associated with early death, Dr. Motaganahalli said.
Cognitive dysfunction manifests in various forms, ranging from level of consciousness and memory to mood and ability to make calculations. Although the Mini-Mental State Examination Global Cognitive Assessment tool provides a method for evaluating cognitive function, “There is no uniformly accepted neurocognition test,” Dr. Motaganahalli said. That explains the wide variability of findings among published studies.
Vascular surgeons take a somewhat casual approach to their patients’ cognitive abilities after carotid revascularization, Dr. Motaganahalli said. “We don’t evaluate their memory and their cognitive functions on post-op day one; we just look to see whether they have neurologic dysfunction up front and that they’re capable of going home after that.”
But predicting in advance which patients are predisposed to cognitive decline after the procedures is difficult, he said. He cited a systematic review of 32 studies published between 1990-2007 that showed variable results (Stroke. 2008;39:3116-27): 11 studies during 1990-2005 suggested cognition actually improved after CEA; 9 studies during 1994-2006 suggested the opposite; 4 trials during 1992-2005 suggested no change in cognition after CEA; 5 studies during 2003-2007 showed improvement in cognition after CAS; and 3 trials comparing CAS and CEA and cognition found no differences in how the two procedures affect cognition.
Dr. Motaganahalli also cited a systematic review of 37 studies, 18 of which examined CEA, 12 CAS and seven compared CEA and CAS, found that either cognitive improvement or impairment for CEA and CAS separately were 10–15% of patients (Cerebrovasc Dis Extra. 2014;4:132-48).
“We have 69 papers that looked at cognitive function alone, but unfortunately, we don’t know whether cognitive function really improved based on this data set,” he said. “None of them are making the argument so clearly that there is cognitive improvement after revascularization.”
The variability in study findings can be due to differences in methodologies, the types of psychometric tests used, statistical analyses and the timing of cognitive assessments, Dr. Motaganahalli said.
Cognitive impairment after stroke caused by carotid disease is better understood than is cognitive impairment in the absence of a major stroke, Dr. Motaganahalli said.
“The mechanisms of how carotid disease can cause the cognitive impairment are threefold: It could be microembolism and hypoperfusion, which together can cause white matter disease and thereby some cognitive dysfunction in the long term,” he said (Neuroimaging Clin N Am. 2007 Aug;17:313-24).
Functional neurons may be a biomarker of cognitive outcome, he said. Hypoperfusion of functional neurons may lead to hypofunctional neurons, which can increase cerebral blood flow and cerebral metabolic rate for oxygen (CMRO2), and thus improve cognition. However, when additional variables are introduced to the hypofunctional neurons – such as microembolism, white matter disease, and prolonged hypoperfusion – that can lead to neuronal infarction that, while increasing cerebral blood flow, causes no change in CMRO2 and, thus, no cognitive improvement. The interval between hypofunctional neurons and neuronal infarction “is the time to do the revascularization, as long as you can demonstrate that there may be some truth to matter that it influences cognition,” Dr. Motaganahalli said.
While vascular surgeons may not be able to predict who will have cognitive decline after carotid interventions, “There are some pointers for possibly picking those patients who may benefit,” Dr. Motaganahalli said.
That choice of patients revolves around recognizing that chronic ischemia induces and increases the severity of cognitive dysfunction. Therefore, incorporating the pathophysiology of chronic ischemia into the algorithm for carotid artery disease may provide an opportunity to extend the goals of carotid artery revascularization to include preventing or reversing cognitive decline, he said.
Dr. Motaganahalli disclosed he is a consultant to Silk Road Medical.
AT THE ANNUAL MEETING OF THE MIDWESTERN VASCULAR SURGERY SOCIETY
Key clinical point: Incorporating the pathophysiology of chronic ischemia into the algorithm for carotid artery disease could expand the goals of revascularization to encompass cognitive decline.
Major finding: Cerebrovascular hemodynamic status plays a role in cognitive function after carotid artery interventions, but the mechanisms of either improvement or decline need better understanding.
Data source: Systematic review of 32 papers on neurocognition after carotid interventions published between 1990-2007 and analysis of 37 studies of CAS or CEA or both published since 2007.
Disclosures: Dr. Motaganahalli disclosed he is a consultant to Silk Road Medical Inc.