User login
Make the Diagnosis - June 2015
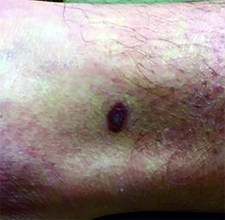
Diagnosis: Kaposi’s sarcoma
Kaposi's sarcoma is a vascular neoplasm with four principal clinical variants: HIV/AIDS-related Kaposi's sarcoma, classic Kaposi's sarcoma, African endemic Kaposi's sarcoma, and immunosuppression-associated Kaposi's sarcoma. The etiologic agent in all clinical variants is human herpes virus type 8 (HHV-8). HIV/AIDS-related Kaposi's sarcoma is primarily seen in men who have sex with men.
The four variants of Kaposi's sarcoma can have different clinical presentations. In HIV/AIDS-associated Kaposi's sarcoma, patients may present with a single lesion or with symmetric widespread lesions. Clinically, the lesions can range from faint erythematous macules, to small violaceous papules, to large plaques or ulcerated nodules. The lesions are generally asymptomatic.
Any mucocutaneous surface can be involved. Common body locations include the face (especially the nose), hard palate, trunk, penis, lower legs, and soles. The most common areas of internal involvement are the gastrointestinal system and lymphatics. Histologically, atypical, angular vessels with an associated inflammatory infiltrate containing plasma cells appear in the upper dermis in macular lesions. Nodules and tumors reveal a spindle cell neoplasm pattern. Lesions stain positive for human herpes virus 8 (HHV-8).
Since the introduction of highly active antiretroviral therapy (HAART), the incidence of Kaposi's sarcoma has greatly decreased. HAART is the most effective treatment method, and should be the initial therapy in most patients with mild to moderate disease.
However, some patients with HIV/AIDS-associated Kaposi's sarcoma require further treatment - those who have well-controlled HIV and undetectable viral loads. Other treatments include local destruction (cryotherapy), topical alitretinoin (9-cis-retinoic acid), intralesional interferon or vinblastine, superficial radiotherapy, liposomal doxorubicin, daunorubicin, or paclitaxel.

This case and photo were submitted by Dr. Ann Mazor Reed, Larkin Community Hospital, South Miami; and Dr. Donna Bilu Martin, Premier Dermatology, MD. Dr. Bilu Martin is in private practice at Premier Dermatology, MD in Aventura, Fla. To submit your case for possible publication, send an e-mail to [email protected]. A 39-year-old white male presented with a 2-month history involving asymptomatic violaceous plaques on his leg and posterior neck. He had no significant past medical history. He had no oral or mucosal involvement, no lymphadenopathy, and denied any systemic symptoms.
Steroids for sciatica
The other day, I received an electronic message that my patient presented to the emergency department following his attempt at lifting a relatively immovable object. The only thing apparently moved by this activity was his intervertebral disk – outward from its usual place and onto a nerve. He was quickly diagnosed with acute sciatica and treated with a healthy dose of steroids.
I enjoyed the subsequent soliloquy of the brilliance and outstanding clinical skill of our emergency department clinicians (which is true, by the way) when I saw him for follow-up. He was markedly improved.
In a moment of introspection, I questioned why we do not tend to use this strategy more in my practice, especially because it worked so well for my patient.
Perhaps it is because we are so used to dealing with medication side effects and the downstream consequences of insulin resistance in primary care that steroids make us squeamish. Perhaps it is also because we tend to see patients later in the course of their disease and think that it is too late for steroids to be beneficial. Maybe we are uncertain of their benefits.
So, how well do they work?
Dr. Harley Goldberg and colleagues recently published data from a randomized clinical trial exploring the efficacy of oral steroids for the treatment of acute sciatica (JAMA 2015;313:1915-23). A total of 269 adults with radicular pain for 3 months or less, an Oswestry Disability Index (ODI) of at least 30, and a herniated disk confirmed on MRI were randomized to prednisone or placebo. The prednisone dose was 60 mg for 5 days, then 40 mg for 5 days, and finally 20 mg for 5 days.
The prednisone group demonstrated significant reduction in the ODI at 3 weeks and 12 months, compared with placebo. No differences in pain or in rates of surgery were observed.
Adverse events were more common with prednisone, the most common being insomnia, increased appetite, and nervousness. No serious adverse events occurred related to treatment, and no differences were observed at 1 year.
The authors point out that the observation of a reduction in disability but no reduction in pain may be related to the fact that as patients improve functionally, they increase activity and experience more pain. Although analyses did not demonstrate a relationship between time until starting the steroids and identified effects of prednisone, clinical sense may press us to want to start them earlier in the course of disease.
Steroids might be a reasonable option in this setting, and combining them with other modalities (e.g., gabapentin) might further improve patients’ functional status and pain. As always, engaging patients in the shared decision making may help manage expectations.
Dr. Ebbert is professor of medicine, a general internist at the Mayo Clinic in Rochester, Minn., and a diplomate of the American Board of Addiction Medicine. The opinions expressed are those of the author and do not necessarily represent the views and opinions of the Mayo Clinic. The opinions expressed in this article should not be used to diagnose or treat any medical condition nor should they be used as a substitute for medical advice from a qualified, board-certified practicing clinician. Dr. Ebbert has no disclosures about this article.

Molecule accelerates recovery after BMT

Photo by Chad McNeeley
A small molecule may be able to accelerate cell recovery in bone marrow transplant (BMT) recipients and patients with liver or colon disease, researchers believe.
The molecule, SW033291, inhibits 15-PGDH, a prostaglandin-degrading enzyme that regulates tissue regeneration in multiple organs.
SW033291 accelerated hematopoietic recovery in mice that received BMTs and promoted tissue regeneration in mice with liver or colon injuries.
“We propose that SW033291 will be useful in accelerating recovery of bone marrow cells following a bone marrow transplant and may also be a treatment for colitis,” said James Willson, MD, of the University of Texas Southwestern Medical Center in Dallas.
He and his colleagues described their work with SW033291 in Science.
To examine the effects of inhibiting 15-PGDH on the bone marrow, the researchers conducted experiments with 15-PGDH-knockout mice and SW033291-treated mice, comparing them to control mice.
The team saw a 43% increase in neutrophil counts and a 39% increase in bone marrow Sca-1+ C-kit+ Lin– (SKL) cells in 15-PGDH knockout compared to wild-type mice. There were no significant differences in counts of other peripheral blood cells, bone marrow cellularity, or counts of bone marrow Sca-1+ C-kit+ Lin– CD48– CD150+ (SLAM) cells.
SW033291-treated mice had double the peripheral neutrophil counts of controls, a 65% increase in marrow SKL cells, and a 71% increase in marrow SLAM cells.
Results of additional experiments indicated that SW033291 works by increasing PGE2 levels in the bone marrow, and PGE2 functions through the EP2 and EP4 receptors to induce expression of CXCL12 and SCF.
The researchers also tested whether SW033291 could increase the bone marrow’s ability to attract and support new hematopoietic stem cells after BMT in mice. They found that BMT recipients treated with SW033291 had a 2- to 3-fold increase in the number of donor cells that homed to their bone marrow, compared to vehicle-treated BMT recipients.
The researchers said this SW033291-induced homing of transplanted bone marrow cells was driven, at least in part, by the induction of CXCL12 expression in CD45– nonmyeloid cells that were already resident in the bone marrow of recipient mice.
These results suggest 15-PGDH inhibition causes an increase in bone marrow PGE2, which induces the expression of bone marrow CXCL12 and SCF, and these cytokines alter the bone marrow microenvironment to better support the homing of transplanted cells.
The researchers also evaluated whether 15-PGDH inhibition promotes hematopoietic recovery after BMT. They studied lethally irradiated mice that received 200,000 strain-matched donor bone marrow cells, which were insufficient to reconstitute hematopoiesis in the mice.
When the mice were treated with SW033291, they survived for more than 30 days. All control mice, on the other hand, died between days 6 and 14.
For the last of their BMT experiments, the researchers examined the effect of SW033291 on mice transplanted with 500,000 bone marrow cells.
All SW033291-treated mice and 63% of control mice survived for 30 days, which allowed the team to compare hematopoietic recovery between the two groups. They found that SW033291 significantly accelerated the recovery of neutrophils, platelets, and red blood cells.
Experiments in mice with liver or colon injuries suggested that SW033291 can aid recovery in these models as well. ![]()
Modern housing may reduce malaria risk

Photo by James Gathany
Living in a “modern” house may reduce a person’s risk of contracting malaria, according to research published in Malaria Journal.
As insecticide and drug resistance are on the rise, researchers wanted to determine how making changes to housing might aid the fight against malaria.
So they reviewed 90 studies conducted in Africa, Asia, and South America, comparing the incidence of malaria among people who live in “traditional” and “modern” houses.
The traditional houses consisted of mud, stone, bamboo, or wood walls; thatched, mud, or wood roofs; and earth or wood floors. The modern houses had closed eaves, ceilings, screened doors, and windows.
The researchers found that residents of modern homes were 47% less likely to be infected with malaria than those living in traditional houses. And residents of modern homes were 45% to 65% less likely to have clinical malaria (fever with infection).
“Housing improvements were traditionally an important pillar of public health, but they remain underexploited in malaria control,” said study author Lucy Tusting, of the London School of Hygiene & Tropical Medicine in the UK.
“Good housing can block mosquitoes from entering homes and prevent them from transmitting malaria to the people who live there. Our study suggests housing could be an important tool in tackling malaria. This is a welcome finding at a time when we are facing increasing resistance to our most effective insecticides and drugs.”
“We now need to pinpoint which housing features can reduce mosquito entry in different settings, to incorporate these into local housing designs, and to assess the impact on malaria in large-scale field trials.”
The researchers noted that the effectiveness of improving housing will vary depending on the location. While many mosquitoes enter homes to bite humans at night, outdoor malaria transmission is more common in some places. So interventions centered on the home will have less of an impact in these areas.
The researchers also conceded that the studies eligible for inclusion in this review were of low quality. However, they said the consistency of the findings indicate that housing is an important risk factor for malaria. ![]()
‘Dabbing’ on the rise: Is this marijuana use dangerous?
The use of butane hash oil and the inhalation of concentrated tetrahydrocannabinol created through butane extraction, otherwise known as “dabbing,” seems to be on the rise in the United States, and might carry risks beyond that of traditional marijuana, according to John M. Stogner, Ph.D., and Bryan Lee Miller, Ph.D.
Butane hash oil (BHO) is produced by passing butane through a tube filled with cannabis trimmings. The tetrahydrocannabinol (THC) dissolves in the butane, and the mixture is collected. The butane evaporates off, leaving crystals that can be up to 80% THC. This process, known as blasting, can be done at home. However, butane is a dangerous and flammable substance, and the risks tied to blasting are similar to those of methamphetamine production.
Dabbing itself involves inhaling vaporized THC crystals through a glass water pipe using a hollow titanium rod heated by a blowtorch. Aside from the obvious health risk of using a blowtorch while mentally impaired, dabbing also can involve inhalation of off-gassing solder, rust from oxidized metal, and benzene.
There has been little research into the health effects of dabbing. Some sources suggest that substances that cause lung damage are not smoked and there is no risk of bacterial or fungal infection; others suggest that adverse side effects such as loss of consciousness and falls are more common, and that dabbing carries an increased risk of addiction.
Primary care physicians should inform patients of potential risk, but they “should avoid hyperbolic arguments like those of the media that describe dabbing as ‘the crack of pot,’ and instead urge caution. Patients should be advised that research is lacking, information is still largely anecdotal, and the safest option is to refrain from use when definitive answers are absent,” Dr. Stogner and Dr. Miller noted.
Find the full perspective in Pediatrics (doi:10.1542/peds.2015-0454).
Decompressive brain surgery carries high complication risk
VIENNA – Decompressive hemicraniectomy for malignant middle cerebral artery infarction was associated with high rates of in-hospital and late complications in a clinical practice setting, according to research reported at the annual European Stroke Conference.
The retrospective findings showed that 88.1% of the 48 patients who underwent the surgery experienced complications such as intracranial hemorrhage (ICH) or symptomatic epilepsy while hospitalized, and 89.5% experienced complications in the later months of their recovery.
While these complication rates are higher than those seen in the randomized controlled clinical studies, the operation still proved life saving for many, with in-hospital and overall mortality rates of 12.5% and 14.6%, respectively, which is similar to the mortality rate seen in the DESTINY trial (Stroke 2007;38:2518-25) after 6 months.

“Patients who underwent [decompressive hemicraniectomy] are a complication-prone collective”, said Dr. Hans-Werner Pledl, resident physician at the department of neurology, UniversitätsMedizin Mannheim, University of Heidelberg (Germany). “Especially in the elderly, recovery stays limited in relevant factors such as ambulation and conversation for self-sufficiency,” he added.
To date, four clinical trials – DECIMAL (Stroke 2007;38:2506-17), HAMLET (Lancet Neurol 2009;8:326-33) and DESTINY and DESTINY II (Int J Stroke 2011;6:79-86) – have looked at the efficacy and safety of DHC in small numbers of patients with life-threatening middle cerebral artery (MCA) infarction. Of these, only DESTINY II included patients over 60 years of age so while there was evidence that the pressure-relieving surgery reduced mortality if performed early, albeit with an increase in functional disability, experience in older patients was less clear. To look at the complication rates in a real-world practice setting, Dr. Pledl of University Hospital Mannheim’s stroke unit, examined the medical records of 48 patients with MCA infarction who underwent DHC between 2008 and 2014. At the time of admission, the 21 male and 27 female patients were aged 28 to 70 years, with the mean age being 57 years. Dr. Pledl noted that two out of every five (41.7%) patients was over the age of 60 years.
On average, patients were referred to the stroke unit within 3 hours and 44 minutes of the incident event, but some were seen within 30 minutes and others within 5 days. A total of 43.8% of patients had an MCA infarction involving the dominant hemisphere and just under 60% received thrombolytic therapy with rtPA. The median time to surgery was 1.3 days, with just over one-fifth (21.7%) of patients undergoing DHC more than 48 hours after their stroke.
The median National Institutes of Health Stroke Scale scores at admission and discharge were 19 and 18, respectively, while the modified Rankin Scale (mRS) score was 5 at both time points. The Barthel Index was 0 at admission, signifying that the patient was heavily dependent on a carer to perform basic living activities, and 7.5 at discharge, indicating some only marginal improvement in patients’ independence.
The majority (75%) of patients achieved reasonable recovery with early (phase B) rehabilitation, 44% with continued poststroke (phase C) rehabilitation, and 6% were able to become self-sufficient and some even returning to work (phase D). “Remarkably, nearly half (48.9%) of patients return home after rehabilitation and do not stay in a clinical or institutional care facility,” Dr. Pledl said.
In-hospital neurological or psychiatric complications included ICH (seven patients), symptomatic epilepsy (six patients), and delirium (five patients). Perioperative complications included meningitis (three patients), wound healing disorders (three patients), and two patients had epidural hemorrhage (EDH). Common infections included pneumonia (13 patients) and urinary tract infections (UTI, eight patients), and other complications included anemia (14 patients) and cardiac complications (nine patients).
During the recovery phase, the most common neurological or psychiatric complications were central pain syndrome and symptomatic epilepsy, affecting nine patients each. Patients again experienced EDH (five patients), with some cases of hydrocephalus (four patients) and wound-healing problems (three patients). UTIs were the most common type of infection, seen in 14 patients. Other late complications included dysphagia (41.7%) and tracheostomy (35.4%), and post-rehab depression (54.2%).
Dr. Pledl suggested that the findings could be used to help better inform patients and their carers so they can have “realistic expectations” of the procedure’s likely outcomes and decide whether or not to have the surgery performed. These “real world” data could also help physicians to be more aware of the likely complications and perhaps address them in some way so that they have minimal impact on patients’ quality of life.
Although patients who experienced complications in this study were not asked if they regretted the decision to undergo the surgery, there is evidence to show that patients and carers can accept a significant level of disability without having significantly impaired quality of life. Nevertheless, the decision on whether DHC should be performed should be made on an individual case basis, especially in older patients, Dr. Pledl concluded.
The next step is to see if there are any subgroups of patients who might fare better or worse after DHC and hopefully identify some predictive imaging markers that could help the decision-making process.
Dr. Pledl reported no conflicts.
VIENNA – Decompressive hemicraniectomy for malignant middle cerebral artery infarction was associated with high rates of in-hospital and late complications in a clinical practice setting, according to research reported at the annual European Stroke Conference.
The retrospective findings showed that 88.1% of the 48 patients who underwent the surgery experienced complications such as intracranial hemorrhage (ICH) or symptomatic epilepsy while hospitalized, and 89.5% experienced complications in the later months of their recovery.
While these complication rates are higher than those seen in the randomized controlled clinical studies, the operation still proved life saving for many, with in-hospital and overall mortality rates of 12.5% and 14.6%, respectively, which is similar to the mortality rate seen in the DESTINY trial (Stroke 2007;38:2518-25) after 6 months.
“Patients who underwent [decompressive hemicraniectomy] are a complication-prone collective”, said Dr. Hans-Werner Pledl, resident physician at the department of neurology, UniversitätsMedizin Mannheim, University of Heidelberg (Germany). “Especially in the elderly, recovery stays limited in relevant factors such as ambulation and conversation for self-sufficiency,” he added.
To date, four clinical trials – DECIMAL (Stroke 2007;38:2506-17), HAMLET (Lancet Neurol 2009;8:326-33) and DESTINY and DESTINY II (Int J Stroke 2011;6:79-86) – have looked at the efficacy and safety of DHC in small numbers of patients with life-threatening middle cerebral artery (MCA) infarction. Of these, only DESTINY II included patients over 60 years of age so while there was evidence that the pressure-relieving surgery reduced mortality if performed early, albeit with an increase in functional disability, experience in older patients was less clear. To look at the complication rates in a real-world practice setting, Dr. Pledl of University Hospital Mannheim’s stroke unit, examined the medical records of 48 patients with MCA infarction who underwent DHC between 2008 and 2014. At the time of admission, the 21 male and 27 female patients were aged 28 to 70 years, with the mean age being 57 years. Dr. Pledl noted that two out of every five (41.7%) patients was over the age of 60 years.
On average, patients were referred to the stroke unit within 3 hours and 44 minutes of the incident event, but some were seen within 30 minutes and others within 5 days. A total of 43.8% of patients had an MCA infarction involving the dominant hemisphere and just under 60% received thrombolytic therapy with rtPA. The median time to surgery was 1.3 days, with just over one-fifth (21.7%) of patients undergoing DHC more than 48 hours after their stroke.
The median National Institutes of Health Stroke Scale scores at admission and discharge were 19 and 18, respectively, while the modified Rankin Scale (mRS) score was 5 at both time points. The Barthel Index was 0 at admission, signifying that the patient was heavily dependent on a carer to perform basic living activities, and 7.5 at discharge, indicating some only marginal improvement in patients’ independence.
The majority (75%) of patients achieved reasonable recovery with early (phase B) rehabilitation, 44% with continued poststroke (phase C) rehabilitation, and 6% were able to become self-sufficient and some even returning to work (phase D). “Remarkably, nearly half (48.9%) of patients return home after rehabilitation and do not stay in a clinical or institutional care facility,” Dr. Pledl said.
In-hospital neurological or psychiatric complications included ICH (seven patients), symptomatic epilepsy (six patients), and delirium (five patients). Perioperative complications included meningitis (three patients), wound healing disorders (three patients), and two patients had epidural hemorrhage (EDH). Common infections included pneumonia (13 patients) and urinary tract infections (UTI, eight patients), and other complications included anemia (14 patients) and cardiac complications (nine patients).
During the recovery phase, the most common neurological or psychiatric complications were central pain syndrome and symptomatic epilepsy, affecting nine patients each. Patients again experienced EDH (five patients), with some cases of hydrocephalus (four patients) and wound-healing problems (three patients). UTIs were the most common type of infection, seen in 14 patients. Other late complications included dysphagia (41.7%) and tracheostomy (35.4%), and post-rehab depression (54.2%).
Dr. Pledl suggested that the findings could be used to help better inform patients and their carers so they can have “realistic expectations” of the procedure’s likely outcomes and decide whether or not to have the surgery performed. These “real world” data could also help physicians to be more aware of the likely complications and perhaps address them in some way so that they have minimal impact on patients’ quality of life.
Although patients who experienced complications in this study were not asked if they regretted the decision to undergo the surgery, there is evidence to show that patients and carers can accept a significant level of disability without having significantly impaired quality of life. Nevertheless, the decision on whether DHC should be performed should be made on an individual case basis, especially in older patients, Dr. Pledl concluded.
The next step is to see if there are any subgroups of patients who might fare better or worse after DHC and hopefully identify some predictive imaging markers that could help the decision-making process.
Dr. Pledl reported no conflicts.
AT THE EUROPEAN STROKE CONFERENCE
Key clinical point: The high risk of complications associated with decompressive hemicraniectomy for malignant middle cerebral artery infarction warrants appropriate counseling and individualized therapeutic decision-making.
Major finding: The in-hospital and late complication rates associated with decompressive hemicraniectomy for malignant middle cerebral artery infarction were 88.1% and 89.5%, respectively.
Data source: Retrospective, observational, single-center study of 48 patients who underwent decompressive hemicrainiectomy between 2008 and 2014.
Disclosures: Dr. Pledl reported no conflicts.

EHA: Inotuzumab rallies against refractory/relapsed ALL
VIENNA – The investigational agent inotuzumab ozagamicin more than doubled complete remission rates compared with standard therapy in relapsed or refractory acute lymphoblastic leukemia, preliminary results from the INO-VATE study show.
The co-primary endpoint of complete remission or CR with incomplete hematologic recovery (CRi) by independent review was achieved by 80.7% of patients treated with inotuzumab and 33.3% treated with standard of care (SOC) (P < .0001).
Significantly more CR/CRi responders treated with inotuzumab were minimal residual disease (MRD)-negative by multicolor flow cytometry (78.4% vs. 28.1%; P < .0001), Dr. Daniel DeAngelo reported in a late-breaking abstract (LBA2073) at the annual congress of the European Hematology Association.

“The fact that the response rate was astronomically high with a high MRD-negative status really allows this or this should be an opportunity for patients with relapsed/refractory disease,” he said in an interview.
Inotuzumab ozagamicin is an investigational anti-CD22 antibody conjugated to calicheamicin, an antitumor antibiotic. CD22 is expressed on the surface of about 90% of B-cell ALL cells.
Previous phase II studies reported strong initial antitumor activity and safety with inotuzumab in relapsed or refractory ALL, Dr. DeAngelo, of the Dana Farber Cancer Institute in Boston, said.
The ongoing phase III trial randomized 326 patients with relapsed/refractory CD22-positive ALL due for salvage 1 or 2 therapy to inotuzumab or SOC: either the FLAG regimen (fludarabine (Fludara)/cytarabine (Ara-C)/granulocyte colony-stimulating factor), Ara-C plus mitoxantrone (Novantrone), or high-dose Ara-C. The starting dose for inotuzumab was 1.8 mg/m2/cycle and was reduced to 1.5 mg/m2/cycle once CR/CRi was achieved. Patients were stratified by duration of first remission, salvage 1 or 2, and age.
The first 218 randomized patients were included in the intention-to-treat CR/CRi analysis, which was modified after excluding 13 patients from the SOC arm who refused to start treatment.
The patients’ median age was 47 years (ranging up to 79 years), two-thirds were salvage 1, and more than half had a remission duration of less than 12 months, an adverse prognostic feature.
Data for the co-primary endpoint of overall survival in all 326 patients are still blinded and not expected to mature until 2016, Dr. DeAngelo said.
CR/CRi analyses significantly favored inotuzumab in all stratification factors and baseline factors including peripheral blasts and CD22 expression. Cytogenetics are still being evaluated, but 11 of 14 (79%) patients with Philadelphia-positive karyotype achieved a CR or CRi, he said.
Median duration of remission among responders was 4.6 months in the inotuzumab arm and 3.1 months in the SOC arm (hazard ratio, 0.55; P = .016).
Safety assessed in 259 patients who received at least one dose of study drug showed similar incidence of grade 3 or higher adverse events in the inotuzumab and SOC arms (91% vs. 95%). There were 2 fatal events in the SOC arm and 4 in the inotuzumab arm: 2 veno-occlusive disease (VOD)/sinusoidal obstruction syndrome (SOS), both after poststudy transplant, 1 intestinal ischemia/septic shock, and 1 acute respiratory distress syndrome as a terminal event of pneumonia. In multivariate analysis, dual alkylator conditioning was the only significant covariate of VOD/SOS (P = .039), Dr. DeAngelo said.
An audience member chided the author for the short duration of remission, but session co-moderator Dr. Anthony Moorman, of Newcastle University, Newcastle upon Tyne, England, said it is not that concerning because of the aggressive nature of ALL.
“For all patients that have relapsed or refractory adult ALL, their responses are incredibly low. So any kind of complete remission is a major achievement in this patient population, especially if they are refractory or relapse after tyrosine kinase inhibitors or Philadelphia-positive,” he said in an interview.
“When you have an active agent that works with relapsed refractory disease, in this case leukemia, the goal is to move it up front,” Dr. DeAngelo told this publication.
Indeed, updated results presented at the meeting from M.D. Anderson Cancer Center of frontline inotuzumab added to low-intensity chemotherapy (Mini-hyper CVD) in elderly ALL patients were “provocative,” he added. CR rates reached 97% in the study, according to the abstract (S114).
VIENNA – The investigational agent inotuzumab ozagamicin more than doubled complete remission rates compared with standard therapy in relapsed or refractory acute lymphoblastic leukemia, preliminary results from the INO-VATE study show.
The co-primary endpoint of complete remission or CR with incomplete hematologic recovery (CRi) by independent review was achieved by 80.7% of patients treated with inotuzumab and 33.3% treated with standard of care (SOC) (P < .0001).
Significantly more CR/CRi responders treated with inotuzumab were minimal residual disease (MRD)-negative by multicolor flow cytometry (78.4% vs. 28.1%; P < .0001), Dr. Daniel DeAngelo reported in a late-breaking abstract (LBA2073) at the annual congress of the European Hematology Association.
“The fact that the response rate was astronomically high with a high MRD-negative status really allows this or this should be an opportunity for patients with relapsed/refractory disease,” he said in an interview.
Inotuzumab ozagamicin is an investigational anti-CD22 antibody conjugated to calicheamicin, an antitumor antibiotic. CD22 is expressed on the surface of about 90% of B-cell ALL cells.
Previous phase II studies reported strong initial antitumor activity and safety with inotuzumab in relapsed or refractory ALL, Dr. DeAngelo, of the Dana Farber Cancer Institute in Boston, said.
The ongoing phase III trial randomized 326 patients with relapsed/refractory CD22-positive ALL due for salvage 1 or 2 therapy to inotuzumab or SOC: either the FLAG regimen (fludarabine (Fludara)/cytarabine (Ara-C)/granulocyte colony-stimulating factor), Ara-C plus mitoxantrone (Novantrone), or high-dose Ara-C. The starting dose for inotuzumab was 1.8 mg/m2/cycle and was reduced to 1.5 mg/m2/cycle once CR/CRi was achieved. Patients were stratified by duration of first remission, salvage 1 or 2, and age.
The first 218 randomized patients were included in the intention-to-treat CR/CRi analysis, which was modified after excluding 13 patients from the SOC arm who refused to start treatment.
The patients’ median age was 47 years (ranging up to 79 years), two-thirds were salvage 1, and more than half had a remission duration of less than 12 months, an adverse prognostic feature.
Data for the co-primary endpoint of overall survival in all 326 patients are still blinded and not expected to mature until 2016, Dr. DeAngelo said.
CR/CRi analyses significantly favored inotuzumab in all stratification factors and baseline factors including peripheral blasts and CD22 expression. Cytogenetics are still being evaluated, but 11 of 14 (79%) patients with Philadelphia-positive karyotype achieved a CR or CRi, he said.
Median duration of remission among responders was 4.6 months in the inotuzumab arm and 3.1 months in the SOC arm (hazard ratio, 0.55; P = .016).
Safety assessed in 259 patients who received at least one dose of study drug showed similar incidence of grade 3 or higher adverse events in the inotuzumab and SOC arms (91% vs. 95%). There were 2 fatal events in the SOC arm and 4 in the inotuzumab arm: 2 veno-occlusive disease (VOD)/sinusoidal obstruction syndrome (SOS), both after poststudy transplant, 1 intestinal ischemia/septic shock, and 1 acute respiratory distress syndrome as a terminal event of pneumonia. In multivariate analysis, dual alkylator conditioning was the only significant covariate of VOD/SOS (P = .039), Dr. DeAngelo said.
An audience member chided the author for the short duration of remission, but session co-moderator Dr. Anthony Moorman, of Newcastle University, Newcastle upon Tyne, England, said it is not that concerning because of the aggressive nature of ALL.
“For all patients that have relapsed or refractory adult ALL, their responses are incredibly low. So any kind of complete remission is a major achievement in this patient population, especially if they are refractory or relapse after tyrosine kinase inhibitors or Philadelphia-positive,” he said in an interview.
“When you have an active agent that works with relapsed refractory disease, in this case leukemia, the goal is to move it up front,” Dr. DeAngelo told this publication.
Indeed, updated results presented at the meeting from M.D. Anderson Cancer Center of frontline inotuzumab added to low-intensity chemotherapy (Mini-hyper CVD) in elderly ALL patients were “provocative,” he added. CR rates reached 97% in the study, according to the abstract (S114).
AT THE EHA CONGRESS
Key clinical point: Inotuzumab ozagamicin shows promise as a new treatment option for relapsed or refractory acute lymphoblastic leukemia.
Major finding: The rate of complete remission or CR with incomplete hematologic recovery was 80.7% with inotuzumab vs. 28.1% with standard of care (P < .0001).
Data source: Randomized, phase III study in the first 218 of 326 patients.
Disclosures: Pfizer sponsored the study and funded editorial assistance supplied by Complete Heathcare Communications. Dr. De Angelo reported research support from Sigma Tau and consulting for Novartis, Sigma Tau, Bristol-Myers Squibb, Amgen, and Pfizer.
EHA: Dasatinib gets early edge over imatinib in CML
VIENNA – Patients with chronic-phase chronic myeloid leukemia treated with first-line dasatinib achieved significantly more molecular responses at 2 years than those treated with imatinib in the SPIRIT 2 trial.
So far there is no difference, however, in disease progression or overall survival in the ongoing phase III trial, Dr. Stephen O’Brien reported at the annual congress of the European Hematology Association.
With 814 patients, SPIRIT 2 is the largest randomized trial of dasatinib (Sprycel) vs. imatinib (Gleevec).

Its design is similar to the ongoing 519-patient DASISION trial, which reported higher response rates with dasatinib than imatinib in the same setting, but similar progression-free and overall survival rates at 3-year follow-up.
The primary endpoint of SPIRIT 2 is event-free survival at 5 years and will be available in March 2018, he said. Patients at 172 hospitals in the United Kingdom were evenly randomized to imatinib 400 mg daily or dasatinib 100 mg daily. One patient in each group was excluded due to protocol violation or withdrawal of consent. Median follow-up is 42.4 months.
At 24 months, 60.6% of imatinib patients (246/406) and 71.4% of dasatinib patients (290/406) remained on treatment.
Significantly more patients treated with dasatinib than imatinib achieved a complete cytogenetic response at 12 months (53.3% vs. 42%; P = .003), but the difference was diminished at 24 months (33.7% vs. 27.5%; P = .189). These results should be interpreted with caution, however, because the data were incomplete, Dr. O’Brien, of Newcastle University Medical School, Newcastle upon Tyne, England, said.
He noted that the molecular data are more reliable and were calculated based on samples drawn within a 6-week window on either side of the 24-month time point. Values had to be imputed for 22 patients who had no 24-month sample taken, although this imputation should not impact survival outcomes, he said. Major molecular response was defined as a 3-log reduction in the BCR-ABL/ABL ratio, relative to baseline, with data also captured for patients achieving a 4-log reduction.
Significantly more patients on dasatinib than imatinib achieved an MR3 response (57.5% vs. 46%; P < .001) and MR4.5 response (20.2% vs. 14.3%; P = .026).
More patients stopped imatinib than dasatinib due to investigator and/or patient concerns about inadequate response (10.8% vs. 1.3%), whereas nonhematologic toxicities drove more patients to abandon dasatinib (22% vs. 12%), according to Dr. O’Brien.
Pleural effusion, a known toxicity with dasatinib, occurred in 24.1% of patients given the drug vs. 1.2% given imatinib, requiring drainage in 22 cases vs. 1 case, respectively. There was also a “difficult-to-explain” signal for breathlessness with no obvious cause (15.5% vs. 8%). Hypertension was confirmed in only one of these cases and symptoms resolved in others when the drug was withdrawn, he said.
Serious cardiac adverse events were reported in 2.2% of patients in the imatinib arm and 4.2% in the dasatinib arm. Again, the results should be interpreted with caution because trials set up at the time of SPIRIT2 in 2008 were not designed to look carefully at this outcome, Dr. O’Brien observed.
In all, 38 patients have died; 19 in each group.
*Correction 6/18/2015: The headline for an earlier version of this article misstated the type of cancer treated in this study.
VIENNA – Patients with chronic-phase chronic myeloid leukemia treated with first-line dasatinib achieved significantly more molecular responses at 2 years than those treated with imatinib in the SPIRIT 2 trial.
So far there is no difference, however, in disease progression or overall survival in the ongoing phase III trial, Dr. Stephen O’Brien reported at the annual congress of the European Hematology Association.
With 814 patients, SPIRIT 2 is the largest randomized trial of dasatinib (Sprycel) vs. imatinib (Gleevec).
Its design is similar to the ongoing 519-patient DASISION trial, which reported higher response rates with dasatinib than imatinib in the same setting, but similar progression-free and overall survival rates at 3-year follow-up.
The primary endpoint of SPIRIT 2 is event-free survival at 5 years and will be available in March 2018, he said. Patients at 172 hospitals in the United Kingdom were evenly randomized to imatinib 400 mg daily or dasatinib 100 mg daily. One patient in each group was excluded due to protocol violation or withdrawal of consent. Median follow-up is 42.4 months.
At 24 months, 60.6% of imatinib patients (246/406) and 71.4% of dasatinib patients (290/406) remained on treatment.
Significantly more patients treated with dasatinib than imatinib achieved a complete cytogenetic response at 12 months (53.3% vs. 42%; P = .003), but the difference was diminished at 24 months (33.7% vs. 27.5%; P = .189). These results should be interpreted with caution, however, because the data were incomplete, Dr. O’Brien, of Newcastle University Medical School, Newcastle upon Tyne, England, said.
He noted that the molecular data are more reliable and were calculated based on samples drawn within a 6-week window on either side of the 24-month time point. Values had to be imputed for 22 patients who had no 24-month sample taken, although this imputation should not impact survival outcomes, he said. Major molecular response was defined as a 3-log reduction in the BCR-ABL/ABL ratio, relative to baseline, with data also captured for patients achieving a 4-log reduction.
Significantly more patients on dasatinib than imatinib achieved an MR3 response (57.5% vs. 46%; P < .001) and MR4.5 response (20.2% vs. 14.3%; P = .026).
More patients stopped imatinib than dasatinib due to investigator and/or patient concerns about inadequate response (10.8% vs. 1.3%), whereas nonhematologic toxicities drove more patients to abandon dasatinib (22% vs. 12%), according to Dr. O’Brien.
Pleural effusion, a known toxicity with dasatinib, occurred in 24.1% of patients given the drug vs. 1.2% given imatinib, requiring drainage in 22 cases vs. 1 case, respectively. There was also a “difficult-to-explain” signal for breathlessness with no obvious cause (15.5% vs. 8%). Hypertension was confirmed in only one of these cases and symptoms resolved in others when the drug was withdrawn, he said.
Serious cardiac adverse events were reported in 2.2% of patients in the imatinib arm and 4.2% in the dasatinib arm. Again, the results should be interpreted with caution because trials set up at the time of SPIRIT2 in 2008 were not designed to look carefully at this outcome, Dr. O’Brien observed.
In all, 38 patients have died; 19 in each group.
*Correction 6/18/2015: The headline for an earlier version of this article misstated the type of cancer treated in this study.
AT THE EHA CONGRESS
Key clinical point: Dasatinib provides more molecular responses than imatinib, but no survival advantage at 2 years in the first-line treatment of chronic-phase chronic myeloid leukemia.
Major finding: More patients receiving dasatinib than imatinib achieved an MR3 response (57.5% vs. 46%; P < .001) and MR4.5 response (20.2% vs. 6%; P = .02).
Data source: Randomized, phase III trial in 814 patients with newly diagnosed chronic myeloid leukemia in chronic phase.
Disclosures: Bristol-Myers Squibb sponsored the study. Dr. O’Brien reported honoraria and research funding from Ariad Pharmaceuticals, Bristol-Myers Squibb, Novartis, and Pfizer.

Viral protein protects EBV-infected B cells
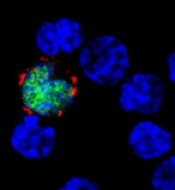
expresses the ligand (red)
that activates NKG2D, while
uninfected cells (blue) do not
Benjamin Chaigne-Delalande
A study published in PLOS Pathogens sheds new light on why the immune system cannot eliminate Epstein-Barr virus (EBV) or the risk of cancer associated with the virus.
Researchers investigated the immune system’s response against EBV, focusing on the role of LMP2A.
This viral protein is present in latently infected B cells and in many EBV-associated cancers, which have somehow escaped detection and elimination by the immune system.
Andreas Moosmann, PhD, of the Helmholtz-Zentrum in Munich, Germany, and his colleagues studied an engineered EBV virus that cannot make LMP2A and compared this mutant virus with the normal one.
The researchers infected human B cells with normal and LMP2A-deficient EBV. Because EBV transforms these cells, the team was able to examine lymphoblastic cell lines that contained either virus.
They found that LMP2A counteracts the recognition of EBV-infected B cells by EBV-specific, CD8+ killer T cells. In contrast, EBV-transformed cells without LMP2A are more efficiently identified, and the T cells’ ability to recognize and kill the EBV-infected B cells is enhanced.
The researchers examined the mechanism underlying the LMP2A-mediated evasion and found several ways in which it interferes with the recognition of EBV-infected cells.
First, LMP2A reduced the levels of several EBV proteins whose fragments are recognized by CD8+ T cells on the surface of the cell targeted for killing.
Second, LMP2A disturbs the expression of cellular molecules on infected B cells that interact with NKG2D, a host molecule on the surface of CD8+ T cells that aids their activation, thereby weakening the immune response against EBV-infected cells.
The researchers said these results suggest a functional immunomodulatory effect for the EBV protein LMP2A and show that LMP2A mediates the partial escape of infected B cells from recognition by CD8+ T cells.
The team also said similar immune evasion mechanisms may operate in different types of LMP2A-expressing cancers caused by EBV. ![]()
DDW: Early ERCP reduces LOS, costs of acute pancreatitis without cholangitis
WASHINGTON – When it’s given early in the course of treatment for patients who have acute pancreatitis and biliary obstruction without cholangitis, endoscopic retrograde cholangiopancreatography (ECRP) is associated with shorter lengths of stay, reductions in infectious complications, and substantially lower costs.
In more than 10,000 hospitalizations related to acute pancreatitis with choledocholithiasis/biliary obstruction with cholangitis, ECRP performed on the day of admission or the next day was associated with a significantly lower risk for septicemia than ECRP performed after the first full day of hospitalization, and hospitalization costs were nearly $20,000 lower when the procedure was done early in the course of care, reported Dr. Raxitkimar Jinjuvadia from the Henry Ford Hospital in Detroit.

“Even though the inpatient mortality did not differ among the early and late groups, early ERCP has significant other benefits in reducing health care resources utilization,” he said at the annual Digestive Disease Week.
The study’s use of a large, nationally representative hospital sample supports and adds weight to current guidelines on the use of ERCP from the American Society for Gastrointestinal Endoscopy (ASGE).
“We suggest that early ERCP should be encouraged for patients with acute biliary pancreatitis with biliary obstruction and without cholangitis,” he stated.
The investigators took a retrospective stroll through data from the National Inpatient Sample (NIS) database for the year 2011. From among approximately 8 million hospitalizations in about 1000 hospitals in the United States, they identified patients who presented with acute pancreatitis, choledocholithiasis, biliary obstruction, and cholangitis, as determined by International Classification of Disease, 9th Revision (ICD-9) codes.
The cohort included 10,364 hospitalizations related to acute pancreatitis with choledocholithiasis/biliary obstruction without cholangitis. The mean age of patients was 57.2 years, 66.4% were white and 62.2% were female. In all, 58.9% of patients underwent ERCP at some point during their hospitalizations, with 48.6% receiving it early (day 0 or day 1).
Patients who had ERCP had a significantly lower rate of inpatient deaths compared with those who did not have the procedure (0.5% vs, 1.7%, P < .001), but the timing of the procedure, the primary endpoint, did not make a difference in in-hospital mortality.
However, when the authors looked at secondary outcomes, they found that early ERCP was associated with significantly lower rates of septicemia (4.0% vs 7.2%, P < .001), shorter mean length of stay (5.2 vs. 8.0 days, P < .001) and lower costs ($52,400 vs $71,736, P <. 001).
In multivariable modeling adjusted for age, sex, race and Elixhauser comorbidities, independent risk factors for in-hospital mortality were age (adjusted odds ratio [aOR], 1.04, 95% confidence interval [CI] 1.03-1.06), Elixhauser comorbidities (aOR 1.17, 95% CI, 1.06-1.29), ERCP during hospitalization (aOR 0.30, 95% CI 0.19-0.47), and septicemia (aOR 13.5, 95% CI, 8.75-20.75).
As noted before, early ERCP was not an independent risk factor for inpatient mortality.
Dr. Jinjuvadia said that the study was limited by potential biases related to ICD-9 coding; the lack of lab values, imaging, or treatment data; and the fact that the database does not include data from Veterans Affairs hospitals.
WASHINGTON – When it’s given early in the course of treatment for patients who have acute pancreatitis and biliary obstruction without cholangitis, endoscopic retrograde cholangiopancreatography (ECRP) is associated with shorter lengths of stay, reductions in infectious complications, and substantially lower costs.
In more than 10,000 hospitalizations related to acute pancreatitis with choledocholithiasis/biliary obstruction with cholangitis, ECRP performed on the day of admission or the next day was associated with a significantly lower risk for septicemia than ECRP performed after the first full day of hospitalization, and hospitalization costs were nearly $20,000 lower when the procedure was done early in the course of care, reported Dr. Raxitkimar Jinjuvadia from the Henry Ford Hospital in Detroit.
“Even though the inpatient mortality did not differ among the early and late groups, early ERCP has significant other benefits in reducing health care resources utilization,” he said at the annual Digestive Disease Week.
The study’s use of a large, nationally representative hospital sample supports and adds weight to current guidelines on the use of ERCP from the American Society for Gastrointestinal Endoscopy (ASGE).
“We suggest that early ERCP should be encouraged for patients with acute biliary pancreatitis with biliary obstruction and without cholangitis,” he stated.
The investigators took a retrospective stroll through data from the National Inpatient Sample (NIS) database for the year 2011. From among approximately 8 million hospitalizations in about 1000 hospitals in the United States, they identified patients who presented with acute pancreatitis, choledocholithiasis, biliary obstruction, and cholangitis, as determined by International Classification of Disease, 9th Revision (ICD-9) codes.
The cohort included 10,364 hospitalizations related to acute pancreatitis with choledocholithiasis/biliary obstruction without cholangitis. The mean age of patients was 57.2 years, 66.4% were white and 62.2% were female. In all, 58.9% of patients underwent ERCP at some point during their hospitalizations, with 48.6% receiving it early (day 0 or day 1).
Patients who had ERCP had a significantly lower rate of inpatient deaths compared with those who did not have the procedure (0.5% vs, 1.7%, P < .001), but the timing of the procedure, the primary endpoint, did not make a difference in in-hospital mortality.
However, when the authors looked at secondary outcomes, they found that early ERCP was associated with significantly lower rates of septicemia (4.0% vs 7.2%, P < .001), shorter mean length of stay (5.2 vs. 8.0 days, P < .001) and lower costs ($52,400 vs $71,736, P <. 001).
In multivariable modeling adjusted for age, sex, race and Elixhauser comorbidities, independent risk factors for in-hospital mortality were age (adjusted odds ratio [aOR], 1.04, 95% confidence interval [CI] 1.03-1.06), Elixhauser comorbidities (aOR 1.17, 95% CI, 1.06-1.29), ERCP during hospitalization (aOR 0.30, 95% CI 0.19-0.47), and septicemia (aOR 13.5, 95% CI, 8.75-20.75).
As noted before, early ERCP was not an independent risk factor for inpatient mortality.
Dr. Jinjuvadia said that the study was limited by potential biases related to ICD-9 coding; the lack of lab values, imaging, or treatment data; and the fact that the database does not include data from Veterans Affairs hospitals.
AT DDW® 2015
Key clinical point: ECRP early in the course of hospitalization reduced adverse events, length of stay, and costs.
Major finding: For patients with acute pancreatitis with biliary obstruction without cholangitis, early ERCP was associated with a 4.0% rate of septicemia, compared with 7.2% for ERCP after the first day.
Data source: Retrospective review of inpatient data on 10,364 hospitalizations.
Disclosures: The study funding source was not disclosed. Dr. Jinjuvadia reported having no relevant disclosures.