User login
Study reveals ‘doorway’ into RBCs

infecting an RBC
Photo courtesy of St. Jude
Children’s Research Hospital
A protein on the surface of red blood cells (RBCs) serves as an essential entry point for malaria parasite invasion, according to researchers.
They found the presence of this protein, CD55, was critical to the Plasmodium falciparum parasite’s ability to attach itself to the RBC surface.
The team believes this discovery, published in Science, opens up a promising new avenue for developing therapies to treat and prevent malaria.
“Plasmodium falciparum malaria parasites have evolved several key-like molecules to enter into human red blood cells through different door-like host receptors,” said study author Manoj Duraisingh, PhD, of the Harvard T. H. Chan School of Public Health in Boston, Massachusetts.
“Hence, if one red blood cell door is blocked, the parasite finds another way to enter. We have now identified an essential host factor which, when removed, prevents all parasite strains from entering red blood cells.”
The researchers accomplished this by developing a new technique to tap into a relatively unexplored area: identifying characteristics of a host RBC that make it susceptible to parasites. RBCs are difficult targets for such efforts as they lack a nucleus, which makes genetic manipulation impossible.
So the team transformed stem cells into RBCs, which allowed them to conduct a genetic screen for host determinants of P falciparum infection. They found that malaria parasites failed to attach properly to the surface of RBCs that lacked CD55.
The protein was required for invasion in all tested strains of the parasite, including those developed in a lab and those isolated from patients. This makes CD55 a primary candidate for intervention, the researchers said.
“The discovery of CD55 as an essential host factor for P falciparum raises the intriguing possibility of host-directed therapeutics for malaria, as is used in HIV,” said study author Elizabeth Egan, MD, PhD, also of the Harvard T. H. Chan School of Public Health.
“CD55 also gives us a hook with which to search for new parasite proteins important for invasion, which could serve as vaccine targets.” ![]()
Fear of “Contagion” Keeps Man’s Girlfriend Away
A 25-year-old man presents to dermatology with a “yeast infection” at the corners of his mouth that has failed to respond to anti-yeast creams (nystatin, clotrimazole) and oral medications (fluconazole). He has also tried a variety of “home remedies,” including hydrogen peroxide, rubbing alcohol, mouthwash, diaper cream, triple-antibiotic ointment, and tea tree oil. If anything, these seemed to worsen the problem.
He is fairly sure the problem developed because, several weeks ago, he shaved too close in the affected area. Soon after, he went to the dentist, who suggested the problem might be caused by a vitamin deficiency—but several weeks of taking a multivitamin produced no discernable result.
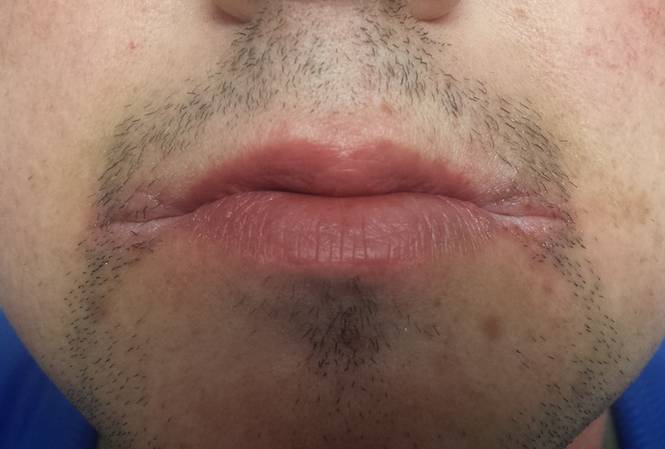
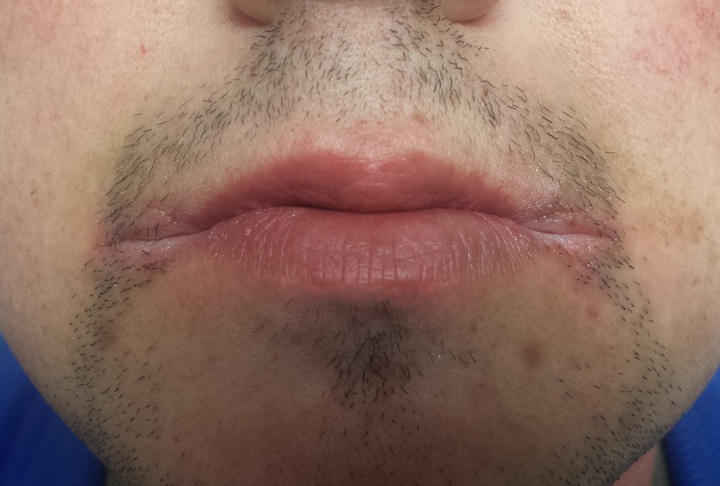
The affected area is irritated and sometimes painful, and he has a hard time leaving it alone. Several times a day, despite knowing how counterproductive it is, he finds himself picking at it. But worst of all, to the patient, is the fact that his girlfriend refuses to let him near her, citing fears of contagion.
The patient claims to be in good health otherwise, although his history includes seasonal allergies and eczema.
EXAMINATION
The corners of the patient’s mouth are quite macerated, eroded, and focally scaly, with modest erythema. There is no edema or tenderness on palpation. Examination of the inside of his mouth is within normal limits.
What is the diagnosis?
DISCUSSION
This is a typical clinical and historical snapshot of a very common problem: angular stomatitis (AS), also known as perleche or angular cheilitis (among others). A rather simple problem, it nonetheless causes confusion in primary care settings.
Virtually every AS patient I’ve seen was referred to dermatology after trying at least half a dozen different treatments. These attempts rarely work—and even if one of them did, the average AS patient wouldn’t realize it, because he’s almost always using several medications simultaneously.
AS, in its usual form, is not a complex problem. Thin tissue at the corner of the mouth is traumatized (shaving is one method, but another is holding the mouth open for two hours while at the dentist), and then the patient often picks at the resulting scale, making it worse. During sleep, saliva may flow onto the affected area, causing maceration and further damaging already irritated skin. The saliva introduces a multitude of bacteria, yeast, and other micro-organisms to this damaged tissue, further contributing to the inflammation.
At this point, some patients will panic, compounding the problem by throwing anything and everything they can think of at it: lip balm, peroxide, alcohol, triple-antibiotic ointment. If they seek professional help, they are often given a prescription for an oral anti-yeast medication (eg, fluconazole). Seldom does this help, and for a very good reason: Even though Candida is almost always present in and around the mouth—and may well contribute to the problem—only rarely is the issue a “yeast infection.” In the rare instances I’ve seen this, the patient was immunosuppressed.
In its simplest and most common form, AS is a form of intertrigo, in which inflammation is perpetuated by moist skin on skin—in this case, by the little channel created by the labial commissures. We see essentially the same thing under the breasts, in the axillae, in the folds of the abdomen, and in the groin. These manifestations are almost always diagnosed as “yeast infection,” even though treatment for such usually fails.
Patients who might find themselves particularly susceptible to AS include those with poorly fitting dentures, which allow overclosure of the mouth, accentuating the labial folds; those with atopy, whose skin is already thin and easily irritated; and those with seasonal allergies, who mouth-breathe while sleeping, drying out their lips while drooling from the corners of the mouth. Select patients may have true vitamin or mineral deficiencies (eg, zinc) due to poor dietary intake.
The majority of AS patients respond quite well to a combination of a topical imidazole cream or ointment (eg, miconazole or oxiconazole) and a mid-strength topical steroid ointment (eg, 2.5% hydrocortisone), mixed half and half by hand and applied twice a day. The patient must be persuaded to stop using all other contactants, since these often perpetuate the problem. Once the condition is under control (usually within a week), the application of petroleum jelly will help to prevent recurrences.
TAKE-HOME LEARNING POINTS
• Angular stomatitis (AS) typically represents inflammation of thin, sensitive lip skin; the irritation is perpetuated by saliva, which causes maceration and makes the tissue vulnerable to the normal flora present in every human mouth.
• Though AS is not an infection, it can be worsened by micro-organisms, especially yeast—but monotherapy with anti-yeast medication almost always fails.
• Effective treatment must address the inflammation, via the application of a topical steroid and cessation of all other topical treatments in case they’re contributory.
• Prevention of recurrences may require the patient to address a chronic dental problem, or the provider to rule out less typical causes (eg, dietary deficiencies).
A 25-year-old man presents to dermatology with a “yeast infection” at the corners of his mouth that has failed to respond to anti-yeast creams (nystatin, clotrimazole) and oral medications (fluconazole). He has also tried a variety of “home remedies,” including hydrogen peroxide, rubbing alcohol, mouthwash, diaper cream, triple-antibiotic ointment, and tea tree oil. If anything, these seemed to worsen the problem.
He is fairly sure the problem developed because, several weeks ago, he shaved too close in the affected area. Soon after, he went to the dentist, who suggested the problem might be caused by a vitamin deficiency—but several weeks of taking a multivitamin produced no discernable result.
The affected area is irritated and sometimes painful, and he has a hard time leaving it alone. Several times a day, despite knowing how counterproductive it is, he finds himself picking at it. But worst of all, to the patient, is the fact that his girlfriend refuses to let him near her, citing fears of contagion.
The patient claims to be in good health otherwise, although his history includes seasonal allergies and eczema.
EXAMINATION
The corners of the patient’s mouth are quite macerated, eroded, and focally scaly, with modest erythema. There is no edema or tenderness on palpation. Examination of the inside of his mouth is within normal limits.
What is the diagnosis?
DISCUSSION
This is a typical clinical and historical snapshot of a very common problem: angular stomatitis (AS), also known as perleche or angular cheilitis (among others). A rather simple problem, it nonetheless causes confusion in primary care settings.
Virtually every AS patient I’ve seen was referred to dermatology after trying at least half a dozen different treatments. These attempts rarely work—and even if one of them did, the average AS patient wouldn’t realize it, because he’s almost always using several medications simultaneously.
AS, in its usual form, is not a complex problem. Thin tissue at the corner of the mouth is traumatized (shaving is one method, but another is holding the mouth open for two hours while at the dentist), and then the patient often picks at the resulting scale, making it worse. During sleep, saliva may flow onto the affected area, causing maceration and further damaging already irritated skin. The saliva introduces a multitude of bacteria, yeast, and other micro-organisms to this damaged tissue, further contributing to the inflammation.
At this point, some patients will panic, compounding the problem by throwing anything and everything they can think of at it: lip balm, peroxide, alcohol, triple-antibiotic ointment. If they seek professional help, they are often given a prescription for an oral anti-yeast medication (eg, fluconazole). Seldom does this help, and for a very good reason: Even though Candida is almost always present in and around the mouth—and may well contribute to the problem—only rarely is the issue a “yeast infection.” In the rare instances I’ve seen this, the patient was immunosuppressed.
In its simplest and most common form, AS is a form of intertrigo, in which inflammation is perpetuated by moist skin on skin—in this case, by the little channel created by the labial commissures. We see essentially the same thing under the breasts, in the axillae, in the folds of the abdomen, and in the groin. These manifestations are almost always diagnosed as “yeast infection,” even though treatment for such usually fails.
Patients who might find themselves particularly susceptible to AS include those with poorly fitting dentures, which allow overclosure of the mouth, accentuating the labial folds; those with atopy, whose skin is already thin and easily irritated; and those with seasonal allergies, who mouth-breathe while sleeping, drying out their lips while drooling from the corners of the mouth. Select patients may have true vitamin or mineral deficiencies (eg, zinc) due to poor dietary intake.
The majority of AS patients respond quite well to a combination of a topical imidazole cream or ointment (eg, miconazole or oxiconazole) and a mid-strength topical steroid ointment (eg, 2.5% hydrocortisone), mixed half and half by hand and applied twice a day. The patient must be persuaded to stop using all other contactants, since these often perpetuate the problem. Once the condition is under control (usually within a week), the application of petroleum jelly will help to prevent recurrences.
TAKE-HOME LEARNING POINTS
• Angular stomatitis (AS) typically represents inflammation of thin, sensitive lip skin; the irritation is perpetuated by saliva, which causes maceration and makes the tissue vulnerable to the normal flora present in every human mouth.
• Though AS is not an infection, it can be worsened by micro-organisms, especially yeast—but monotherapy with anti-yeast medication almost always fails.
• Effective treatment must address the inflammation, via the application of a topical steroid and cessation of all other topical treatments in case they’re contributory.
• Prevention of recurrences may require the patient to address a chronic dental problem, or the provider to rule out less typical causes (eg, dietary deficiencies).
ACOG presidents highlight their visions for the College at the 2015 clinical meeting
The 65th and 66th presidents of the American College of Obstetricians and Gynecologists (ACOG) met May 4 at the College’s 2015 Annual Clinical Meeting in San Francisco to discuss highlights of the past and upcoming years. John C. Jennings, MD, outgoing president, described the “dynamic time we live in” and said his focus has been on shifting to efficient value-based health-care delivery based on ObGyns’ ability to work in multidisciplinary teams.
“What we’ve done this year is to bring together a collaborative practice task force to look at how we develop efficiently operating health care teams. And in doing that, I think, we’re going to be able to produce a model that is transportable to other specialties—not just obstetrics and gynecology but the overall delivery of women’s health care,” he said.
“We’ve had at the table with us the American College of Physicians, the American Academy of Pediatrics, colleagues in pharmacy, advanced nurse practitioners, and certified nurse midwives. We’ve also had representatives from the lay public. We have developed a document that will be polished off and published later this year,” he said. “Obviously I want that to be a living document that helps guide us—in particular, our Fellows—in developing effective team-based practice for the future.”
Mark S. DeFrancesco, MD, MBA, incoming president, noted that, with a team-based focus on practice, he will be able to “take it to the next level” and approach population health. “We need to recognize that many women patients—certainly, between the ages of 18 and 50—see their ObGyn primarily for health care. Short of an acute illness, they tend to not see other doctors.” Among the health issues that merit special attention among these women are obesity and smoking, Dr. DeFrancesco said.
“These two areas kill 780,000 people per year in this country. That’s compared to 70,000 who die from breast, uterine, ovarian, and cervical cancers. That’s a tenfold increase in deaths just from smoking and obesity. I’m saying let’s focus some of our zeal for healing on these issues, particularly if we build the teams that John’s talking about and, with our advanced practice RNs and nurse midwives, see patients more efficiently. Let’s do some real screening and attack these problems,” Dr. DeFrancesco said.
Obesity is an especially critical issue to address in obstetric care, Dr. DeFrancesco noted.
“Now there’s a whole body of knowledge developing about genetic changes that are driven by maternal and even paternal obesity,” he said. “I think that may be a lever to help us help our patients lose weight when we remind them that it’s not just about avoiding cesarean section but it’s about preventing a newborn from having a medically complicated life.”
Other issues Dr. DeFrancesco plans to address include physician burnout and dissatisfaction. “Unhappy doctors cannot provide high-quality care,” he noted.
“We’re also going to be doing a total review of our strategic plan,” he said. “It’s an awful lot to do and I’m going to see a few patients in between all these things. Fortunately, ACOG has fantastic senior management and staff, so it’s easier for me to kind of set the course and let the troops bring it the rest of the way.”
Audio - A survey of liability claims against obstetric providers highlights major areas of contention
Tool identifies CNAs other algorithms miss

Image courtesy of NIGMS
A new tool can detect genetic alterations that have proven difficult to identify, according to research published in Nature Methods.
The tool is an algorithm called CONSERTING (Copy Number Segmentation by Regression Tree in Next-Generation Sequencing).
Researchers created CONSERTING to improve their ability to detect copy number alterations (CNAs) in the information generated by whole-genome sequencing techniques.
The group showed that CONSERTING could detect CNAs with better accuracy and sensitivity than other techniques, including 4 published algorithms used to recognize CNAs in whole-genome sequencing data.
The data the team analyzed encompassed the normal and tumor genomes from 43 children and adults with leukemia, brain tumors, melanoma, and retinoblastoma.
“CONSERTING helped us identify alterations that other algorithms missed, including previously undetected chromosomal rearrangements and copy number alterations present in a small percentage of tumor cells,” said study author Xiang Chen, PhD, of St. Jude Children’s Research Hospital in Memphis, Tennessee.
“[C]ONSERTING identified copy number alterations in children with 100 times greater precision and 10 times greater precision in adults,” added Jinghui Zhang, PhD, also of St. Jude.
Using CONSERTING, the researchers discovered genetic alterations driving pediatric leukemia, low-grade glioma, glioblastoma, and retinoblastoma.
The algorithm also helped the team identify genetic changes that are present in a small percentage of a tumor’s cells. The alterations may be the key to understanding why tumors sometimes return after treatment, they said.
Dr Zhang said CONSERTING should make it easier to track the evolution of tumors with complex genetic rearrangements.
St. Jude has made CONSERTING available to researchers free of charge. The software, user manual, and related data can be downloaded from http://www.stjuderesearch.org/site/lab/zhang.
St. Jude researchers have also developed a cloud version of CONSERTING and related tools that can be accessed through Amazon Web Services. Instead of downloading CONSERTING, scientists can upload data for analysis.
Creating CONSERTING
Work on CONSERTING began in 2010, shortly after the St. Jude Children’s Research Hospital-Washington University Pediatric Cancer Genome Project was launched. The Pediatric Cancer Genome Project used next-generation, whole-genome sequencing to study some of the most aggressive and least understood childhood cancers.
Early on in the project, researchers realized that existing analytic methods often missed duplications or deletions of DNA segments, particularly small changes that involve a handful of genes and provide insight into the origins of a patient’s cancer.
CONSERTING has now been used to analyze data for the Pediatric Cancer Genome Project. The project includes the normal and cancer genomes of 700 pediatric cancer patients with 21 different cancer subtypes.
CONSERTING combines a method of data analysis called regression tree, which is a machine-learning algorithm, with next-generation, whole-genome sequencing. Machine learning capitalizes on advances in computing to design algorithms that repeatedly and rapidly analyze large, complex sets of data and unearth unexpected insights.
“This combination has provided us with a powerful tool for recognizing copy number alterations, even those present in relatively few cells or in tumor samples that include normal cells along with tumor cells,” Dr Zhang said.
Next-generation, whole-genome sequencing involves breaking the human genome into about 1 billion pieces that are copied and reassembled using the normal genome as a template.
CONSERTING software compensates for gaps and variations in sequencing data. The sequencing data is integrated with information about the chromosomal rearrangements to find CNAs and identify their origins in the genome. ![]()
Agent preferentially targets FLT3-ITD AML

PHILADELPHIA—Preclinical research suggests a novel agent has preferential activity in acute myeloid leukemia (AML) with FMS-like tyrosine kinase 3 internal tandem duplication (FLT3-ITD) mutations.
The agent, VNLG-152, proved more cytotoxic in AML cell lines and patient samples with FLT3-ITD than in samples and cell lines with wild-type FLT3.
Exactly how and why this occurs remains somewhat of a mystery, however.
Sheetal Karne, MD, of the University of Maryland School of Medicine in Baltimore, and her colleagues detailed this mystery in a poster presentation at the AACR Annual Meeting 2015 (abstract 5408*).
Dr Karne noted that VNLG-152 targets translation by promoting the degradation of MAPK-interacting kinases (Mnks).
“[VNLG-152] has been previously published as functioning in Mnk degradation, which has been shown in triple-negative breast cancer and prostate cancer—in vivo and in vitro,” she said. “Our hypothesis was that, since [the drug] worked via decreasing translation, it would function in leukemia cells and, specifically, in leukemic cells with ITD mutations.”
So the investigators tested VNLG-152 in samples from AML patients, as well as both murine and human cell lines. They found that VNLG-152 was more cytotoxic in the presence of FLT3-ITD mutations, as evidenced by low micromolar IC50 concentrations.
The IC50 concentration was 3.4 μM in Ba/F3-ITD cells and 5.8 μM in Ba/F3-WT cells, which are murine cells transfected with human FLT3-ITD and wild-type FLT3, respectively. Similarly, the IC50 concentration was 1.8 μM in 32D-ITD cells and 18.2 μM in 32D-WT cells.
In the human FLT3-ITD AML cell lines MV4-11 and MOLM-14, IC50 concentrations were 2.3 μM and 4.2 μM, respectively. But concentrations were greater than 10 µM in the wild-type FLT3 human cell lines HL60 and U937.
In patient samples, the IC50 concentration was 1.0 μM in FLT3-ITD AML and 7.5 μM in AML with wild-type FLT3.
In additional tests with murine cell lines, the investigators found that VNLG-152 inhibits the growth of Ba/F3-ITD and Ba/F3-WT cells. But the drug induces apoptosis in these cell lines only when given in high concentrations.
Looking into the mechanism of VNLG-152, the investigators found that the drug decreased Mnk-1 expression in Ba/F3-ITD and Ba/F3-WT cell lines.
“We saw that VNLG-152 worked via degradation of Mnk, but it was the same in both wild-type and ITD, so we’re still looking for an explanation as to what caused this difference,” Dr Karne said.
She and her colleagues believe the Mnk degradation inhibits the phosphorylation of eukaryotic translation initiation factor 4E (eIF4E), a downstream target of FLT3-ITD. But they are still investigating that possibility.
The team is also hoping to test VNLG-152 in combination with other drugs, such as FLT3 inhibitors or chemotherapeutic agents. ![]()
*Information in the abstract differs from that presented at the meeting.
Inhibitor gets breakthrough designation for CLL
Though a safety issue previously slowed development of the BCL-2 inhibitor venetoclax (ABT-199), the drug is now moving through the pipeline.
The US Food and Drug Administration (FDA) has granted venetoclax breakthrough therapy designation to treat patients with relapsed or refractory chronic lymphocytic leukemia (CLL), including those with 17p deletion.
The drug has proven active against CLL and other hematologic malignancies.
However, it is also known to induce tumor lysis syndrome (TLS). In fact, TLS-related deaths temporarily halted enrollment in trials of venetoclax. But researchers discovered ways to reduce the risk of TLS, and the trials continued.
Now, the FDA has granted the drug breakthrough designation, which is intended to expedite the development and review of drugs indicated for serious or life-threatening conditions.
The criteria for breakthrough designation include preliminary clinical evidence suggesting the drug may offer substantial improvement on at least one clinically significant endpoint compared to available therapy.
Venetoclax in CLL/SLL
Results presented at the 2014 EHA Congress suggested that venetoclax can be effective in patients with CLL/small lymphocytic lymphoma (SLL), and certain measures can reduce the risk of TLS.
Researchers reported that modifying the dosing schedule of venetoclax, administering TLS prophylaxis, and monitoring patients can decrease or eliminate the risk of TLS. And venetoclax can produce responses in patients with high-risk disease.
In a phase 1 trial, the researchers tested venetoclax monotherapy in 105 patients with high-risk CLL/SLL. Seventy-eight patients were evaluable for treatment response as of April 2014. Nineteen of these patients had del (17p), 41 were fludarabine-refractory, and 24 had unmutated IGHV.
The response rate was 77% overall, 79% among patients with del (17p), 76% in patients who were fludarabine-refractory, and 75% in those with unmutated IGHV. The complete response rates were 23%, 26%, 22%, and 29%, respectively.
The median progression-free survival was about 18 months overall, but the median progression-free survival had not been reached for patients treated at or above 400 mg.
Seven patients developed TLS. One of these patients died, and 1 required dialysis. At the time of analysis, there were no cases of TLS among the 49 patients who received TLS prophylaxis and were given venetoclax according to the modified dosing schedule.
Common treatment-emergent adverse events included diarrhea (40%), neutropenia (36%), and nausea (35%). Grade 3/4 neutropenia occurred in 33% of patients, and febrile neutropenia occurred in 4%.
Thirty-seven patients discontinued treatment—22 due to progressive disease, 12 due to adverse events, and 3 for other reasons (1 required warfarin, and 2 proceeded to transplant).
Venetoclax is now being tested in phase 2 and 3 trials of CLL, as well as trials in other hematologic malignancies. Venetoclax is under development by AbbVie and Genentech/Roche. ![]()
Drug can alleviate transfusion dependence in non-del-5q MDS

Photo courtesy of Celgene
WASHINGTON, DC—Results of a phase 3 trial support the use of lenalidomide in patients with lower-risk myelodysplastic syndromes (MDS) without 5q deletion who are unresponsive or refractory to erythropoiesis-stimulating agents (ESAs), according to researchers.
About 27% of patients who received lenalidomide achieved transfusion independence for 8 weeks or more, and about 18% were transfusion-independent for 24 weeks or more.
Valeria Santini, MD, of AOU Careggi in Florence, Italy, and her colleagues presented these results at the 13th International Symposium on Myelodysplastic Syndromes (abstract 115). The trial, MDS-005, was supported by Celgene Corporation, the company developing lenalidomide.
The trial was a comparison of lenalidomide and placebo in 239 patients with non-del-5q MDS who had failed treatment with ESAs. The patients were transfusion-dependent and had low- or intermediate-1-risk disease according to the International Prognostic Scoring System.
Patients were randomized 2:1 to receive oral lenalidomide at 10 mg once daily on days 1 to 28 of 28-day cycles (5 mg for patients with creatinine clearance 40 to 60 mL/min) or placebo.
Significantly more patients in the lenalidomide arm than in the placebo arm achieved transfusion independence for 8 weeks or more—26.9% vs 2.5% (P<0.001).
Likewise, significantly more patients in the lenalidomide arm than in the placebo arm achieved transfusion independence for 24 weeks or more—17.5% vs 0% (P<0.001).
Ninety percent of the lenalidomide-treated patients who achieved transfusion independence for 8 weeks or more responded within 4 cycles of treatment. The median duration of response was 32.9 weeks.
The median follow-up was 1.6 years (range, 0-3.6) in the lenalidomide arm and 1.3 years (range, 0-4.0) in the placebo arm. Within these time periods, patients in the placebo arm were more likely than those who received lenalidomide to progress to acute myeloid leukemia (AML) or to develop second primary malignancies (SPMs).
The AML incidence rate per 100 person-years was 1.91 in the lenalidomide arm and 2.46 in the placebo arm. And the SPM incidence rate per 100 person-years was 2.19 in the lenalidomide arm and 2.27 in the placebo arm.
As expected, treatment-emergent adverse events (AEs) were more common in the lenalidomide arm than in the placebo arm. AEs included neutropenia (64.4% vs 12.7%), thrombocytopenia (39.4% vs 7.6%), diarrhea (42.5% vs 22.8%), constipation (22.5% vs 12.7%), infections (51.9% vs 43%), hemorrhage (20.6% vs 10.1%), hepatic disorders (14.4% vs 5.1%), cardiac arrhythmia (11.3% vs 8.9%), and cutaneous reactions (10% vs 1.3%).
Grade 3-4 AEs in the lenalidomide arm included neutropenia (61.9%), thrombocytopenia (35.6%), infections (14.4%), hepatic disorders (5%), diarrhea (2.5%), hemorrhage (1.9%), deep vein thrombosis (1.9%), cardiac arrhythmia (1.3%), and cutaneous reactions (1.3%).
Based on the results of this trial, Celgene plans to submit a regulatory filing with the US Food and Drug Administration in the second half of 2015. Lenalidomide is not approved in the US to treat patients with non-del-5q MDS. ![]()
Growth in preventive personalized medicine could increase life expectancy
Americans could see improvements in their quality of life and life expectancy if more of them utilize personalized and precision medicine (PPM), according to an opinion piece by Dr. Victor J. Dzau, president of the Institute of Medicine, Washington, D.C., and his colleagues.
“Applications of personalized and precision medicine aimed at prevention have the potential to generate substantial value for society,” the authors wrote.
This opinion is based on the authors’ analysis of an assessment of the benefits and costs of PPM innovations designed to improve screening and risk-factor stratification technologies for identifying presymptomatic individuals at high risk for specific diseases. Dr. Dzau and his associates assumed that the preventive PPM interventions permanently reduced the incidence of cancer, diabetes, heart disease, hypertension, lung disease, and stroke by a fixed percentage beginning in 2012 and needed to be sustained over a lifetime. Benefits were computed by looking at life expectancy and quality-adjusted life expectancy gains during the subsequent 50 years. Values of health were expressed in dollars using $100,000 per quality-adjusted life year.
According to the assessment performed with the Health Economics Medical Innovation Simulation, a PPM innovation that reduced the incidence of the six aforementioned diseases by 10% would generate between $33 billion and $114 billion per disease in the form of longer lives. When the incidence of the diseases was reduced by 50%, the values of health generated ranged from $161 billion to $607 billion. In both scenarios, reductions in heart disease generated the highest number of quality-adjusted life years.
Dr. Dzau and his associates acknowledged that “PPM treatments that might generate less value overall, but provide greater short-term returns” are favored in the current reimbursement environment.
Read the full paper in the Lancet (2015 [doi:10.1016/S0140-6736(15)60722-X]).
BPD sometimes lives in ‘shadow’ of bipolar disorder
Borderline personality disorder is associated with levels of psychosocial morbidities that rival and sometimes surpass those found in bipolar disorder, according to Dr. Mark Zimmerman and his associates.
The investigators assessed patients with borderline personality disorder and bipolar disorder using semistructured interviews. Nearly 80% of the borderline personality patients (BPD) had three or more Axis I disorders, compared with 34% of bipolar patients. Patients with borderline personality disorders were more likely to have Global Assessment of Functioning scores of 50 or less. BPD patients also were less likely to have graduated from college and to be married, compared with their bipolar counterparts.
Despite those findings, about 51% of bipolar patients reported admission to a psychiatric hospital, compared with 43% of BPD patients.
“A potential consequence of the campaign to improve the recognition of bipolar disorder has been its overdiagnosis (and overtreatment) in patients with borderline personality disorder. The overdiagnosis of bipolar disorder to the neglect of borderline personality disorder might become an even greater problem in the future if efforts to expand bipolar disorder’s diagnostic boundary take hold,” noted Dr. Zimmerman of the department of psychiatry and human behavior at Brown University in Providence, R.I., and his associates.
Find the full study in the British Journal of Psychiatry (2015 [doi:10.1192/bjp.bp.114.153569]).