User login
What’s the best test for underlying osteomyelitis in patients with diabetic foot ulcers?
Magnetic resonance imaging (MRI) has a higher sensitivity and specificity (90% and 79%) than plain radiography (54% and 68%) for diagnosing diabetic foot osteomyelitis. MRI performs somewhat better than any of several common tests—probe to bone (PTB), erythrocyte sedimentation rate (ESR) >70 mm/hr, C-reactive protein (CRP) >14 mg/L, procalcitonin >0.3 ng/mL, and ulcer size >2 cm2—although PTB has the highest specificity of any test and is commonly used together with MRI. No studies have directly compared MRI with a combination of these tests, which may assist in diagnosis (strength of recommendation [SOR]: B, meta-analysis of cohort trials and individual cohort and case control trial).
Experts recommend obtaining plain films when considering diabetic foot ulcers to evaluate for bony abnormalities, soft tissue gas, and foreign body; MRI should be considered in most situations when infection is suspected (SOR: B, evidence-based guidelines).
EVIDENCE SUMMARY
One-fifth of patients with diabetes who have foot ulcerations will develop osteomyelitis.1,2 Most cases of diabetic foot osteomyelitis result from the spread of a foot infection to underlying bone.2
MRI has highest sensitivity, probe to bone test is most specific
A meta-analysis3 of 9 cohort trials (8 prospective, 1 retrospective) of 612 patients with diabetes and a foot ulcer examined the accuracy of diagnostic methods for osteomyelitis (TABLE3,4). MRI had the highest sensitivity (90%), followed by bone scan (81%). Bone scan was the least specific (28%), however. Plain film radiography had the lowest sensitivity (54%). A PTB test was highly specific (91%) but had moderate sensitivity (60%). (PTB involves inserting a sterile, blunt stainless steel probe into an ulcerated lesion. If the probe comes to a hard stop, considered to be bone, the test is positive.)
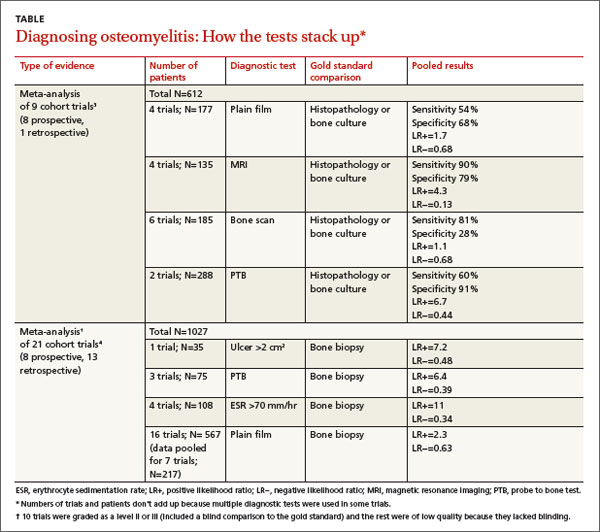
A meta-analysis of 21 prospective and retrospective trials with 1027 diabetic patients with foot ulcers or suspected osteomyelitis found that ulcer size >2 cm2, PTB, and ESR >70 mm/hr were helpful in making the diagnosis.4
Combining ESR with ulcer size increases specificity
A prospective trial of 46 diabetic patients hospitalized with a foot infection examined the accuracy of a combination of clinical and laboratory diagnostic features in patients with diabetic foot osteomyelitis that had been diagnosed by MRI or histopathology.5 (Twenty-four patients had osteomyelitis, and 22 didn’t.)
ESR >70 mm/hr had a sensitivity of 83% and specificity of 77% (positive likelihood ratio [LR+]=3.6; negative likelihood ratio [LR−]=0.22). Ulcer size >2 cm2 had a sensitivity of 88% and specificity of 77% (LR+=3.8; LR−=0.16). Combined, an ESR >70 mm/hr and ulcer size >2cm2 had a slightly better specificity than either finding alone, 82%, but a lower sensitivity of 79% (LR+=4.4; LR−= 0.26).
Serum markers accurately distinguish osteomyelitis from infection
An individual prospective cohort trial of 61 adult patients with diabetes and a foot infection, published after the meta-analysis4 described previously, examined the accuracy of serum markers (ESR, CRP, procalcitonin) for diagnosing osteomyelitis.6 A positive PTB test and imaging study (plain film, MRI, or nuclear scintigraphy) were used as the diagnostic gold standard.
Thirty-four patients had a soft tissue infection and 27 had osteomyelitis. All markers were higher in patients with osteomyelitis than in patients with a soft tissue infection (ESR=76 mm/hr vs 66 mm/hr; P<.001; CRP=25 mg/L vs 8.7 mg/L; P<.001; procalcitonin=2.4 ng/mL vs 0.71 ng/mL; P<.001). The sensitivity and specificity for each marker at its optimum points were: ESR >67 mm/hr (sensitivity 84%; specificity 75%; LR+=3.4; LR−=0.21); CRP >14 mg/L (sensitivity 85%; specificity 83%; LR+=5; LR−=0.18); and procalcitonin >0.3 ng/mL (sensitivity 81%; specificity 71%; LR+=2.8; LR−=0.27).
RECOMMENDATIONS
The Infectious Diseases Society of America (IDSA) recommends performing the PTB test on any diabetic foot infection with an open wound (level of evidence: strong moderate).7 It also recommends performing plain radiography on all patients presenting with a new infection to evaluate for bony abnormalities, soft tissue gas, and foreign bodies (level of evidence: strong moderate).
The IDSA, the American College of Radiology diagnostic imaging expert panel, and the National Institute for Health and Clinical Excellence recommend using MRI in most clinical scenarios when osteomyelitis is suspected (level of evidence: strong moderate).8,9
1. Gemechu FW, Seemant F, Curley CA. Diabetic foot infections. Am Fam Physician. 2013;88:177-184.
2. Lavery LA, Armstrong DG, Peters EJ, et al. Probe-to-bone test for diagnosing diabetic foot osteomyelitis: reliable or relic? Diabetes Care. 2007;30:270-274.
3. Dinh MT, Abad CL, Safdar N. Diagnostic accuracy of the physical examination and imaging tests for osteomyelitis underlying diabetic foot ulcers: meta-analysis. Clin Infect Dis. 2008;47:519-527.
4. Butalia S, Palda VA, Sargeant RJ, et al. Does this patient with diabetes have osteomyelitis of the lower extremity? JAMA. 2008;299:806-813.
5. Ertugrul BM, Savk O, Ozturk B, et al. The diagnosis of diabetic foot osteomyelitis: examination findings and laboratory values. Med Sci Monit. 2009;15:CR307-CR312.
6. Michail M, Jude E, Liaskos C, et al. The performance of serum inflammatory markers for the diagnosis and follow-up of patients with osteomyelitis. Int J Low Extrem Wounds. 2013;12:94-99.
7. Lipsky BA, Berendt AR, Cornia PB, et al. 2012 Infectious Diseases Society of America clinical practice guideline for the diagnosis and treatment of diabetic foot infections. Clin Infect Dis. 2012;54:e132-e173.
8. Schweitzer ME, Daffner RH, Weissman BN, et al. ACR Appropriateness Criteria on suspected osteomyelitis in patients with diabetes mellitus. J Am Coll Radiol. 2008;5:881-886.
9. Tan T, Shaw EJ, Siddiqui F, et al; Guideline Development Group. Inpatient management of diabetic foot problems: summary of NICE guidance. BMJ. 2011;342:d1280.
Magnetic resonance imaging (MRI) has a higher sensitivity and specificity (90% and 79%) than plain radiography (54% and 68%) for diagnosing diabetic foot osteomyelitis. MRI performs somewhat better than any of several common tests—probe to bone (PTB), erythrocyte sedimentation rate (ESR) >70 mm/hr, C-reactive protein (CRP) >14 mg/L, procalcitonin >0.3 ng/mL, and ulcer size >2 cm2—although PTB has the highest specificity of any test and is commonly used together with MRI. No studies have directly compared MRI with a combination of these tests, which may assist in diagnosis (strength of recommendation [SOR]: B, meta-analysis of cohort trials and individual cohort and case control trial).
Experts recommend obtaining plain films when considering diabetic foot ulcers to evaluate for bony abnormalities, soft tissue gas, and foreign body; MRI should be considered in most situations when infection is suspected (SOR: B, evidence-based guidelines).
EVIDENCE SUMMARY
One-fifth of patients with diabetes who have foot ulcerations will develop osteomyelitis.1,2 Most cases of diabetic foot osteomyelitis result from the spread of a foot infection to underlying bone.2
MRI has highest sensitivity, probe to bone test is most specific
A meta-analysis3 of 9 cohort trials (8 prospective, 1 retrospective) of 612 patients with diabetes and a foot ulcer examined the accuracy of diagnostic methods for osteomyelitis (TABLE3,4). MRI had the highest sensitivity (90%), followed by bone scan (81%). Bone scan was the least specific (28%), however. Plain film radiography had the lowest sensitivity (54%). A PTB test was highly specific (91%) but had moderate sensitivity (60%). (PTB involves inserting a sterile, blunt stainless steel probe into an ulcerated lesion. If the probe comes to a hard stop, considered to be bone, the test is positive.)
A meta-analysis of 21 prospective and retrospective trials with 1027 diabetic patients with foot ulcers or suspected osteomyelitis found that ulcer size >2 cm2, PTB, and ESR >70 mm/hr were helpful in making the diagnosis.4
Combining ESR with ulcer size increases specificity
A prospective trial of 46 diabetic patients hospitalized with a foot infection examined the accuracy of a combination of clinical and laboratory diagnostic features in patients with diabetic foot osteomyelitis that had been diagnosed by MRI or histopathology.5 (Twenty-four patients had osteomyelitis, and 22 didn’t.)
ESR >70 mm/hr had a sensitivity of 83% and specificity of 77% (positive likelihood ratio [LR+]=3.6; negative likelihood ratio [LR−]=0.22). Ulcer size >2 cm2 had a sensitivity of 88% and specificity of 77% (LR+=3.8; LR−=0.16). Combined, an ESR >70 mm/hr and ulcer size >2cm2 had a slightly better specificity than either finding alone, 82%, but a lower sensitivity of 79% (LR+=4.4; LR−= 0.26).
Serum markers accurately distinguish osteomyelitis from infection
An individual prospective cohort trial of 61 adult patients with diabetes and a foot infection, published after the meta-analysis4 described previously, examined the accuracy of serum markers (ESR, CRP, procalcitonin) for diagnosing osteomyelitis.6 A positive PTB test and imaging study (plain film, MRI, or nuclear scintigraphy) were used as the diagnostic gold standard.
Thirty-four patients had a soft tissue infection and 27 had osteomyelitis. All markers were higher in patients with osteomyelitis than in patients with a soft tissue infection (ESR=76 mm/hr vs 66 mm/hr; P<.001; CRP=25 mg/L vs 8.7 mg/L; P<.001; procalcitonin=2.4 ng/mL vs 0.71 ng/mL; P<.001). The sensitivity and specificity for each marker at its optimum points were: ESR >67 mm/hr (sensitivity 84%; specificity 75%; LR+=3.4; LR−=0.21); CRP >14 mg/L (sensitivity 85%; specificity 83%; LR+=5; LR−=0.18); and procalcitonin >0.3 ng/mL (sensitivity 81%; specificity 71%; LR+=2.8; LR−=0.27).
RECOMMENDATIONS
The Infectious Diseases Society of America (IDSA) recommends performing the PTB test on any diabetic foot infection with an open wound (level of evidence: strong moderate).7 It also recommends performing plain radiography on all patients presenting with a new infection to evaluate for bony abnormalities, soft tissue gas, and foreign bodies (level of evidence: strong moderate).
The IDSA, the American College of Radiology diagnostic imaging expert panel, and the National Institute for Health and Clinical Excellence recommend using MRI in most clinical scenarios when osteomyelitis is suspected (level of evidence: strong moderate).8,9
1. Gemechu FW, Seemant F, Curley CA. Diabetic foot infections. Am Fam Physician. 2013;88:177-184.
2. Lavery LA, Armstrong DG, Peters EJ, et al. Probe-to-bone test for diagnosing diabetic foot osteomyelitis: reliable or relic? Diabetes Care. 2007;30:270-274.
3. Dinh MT, Abad CL, Safdar N. Diagnostic accuracy of the physical examination and imaging tests for osteomyelitis underlying diabetic foot ulcers: meta-analysis. Clin Infect Dis. 2008;47:519-527.
4. Butalia S, Palda VA, Sargeant RJ, et al. Does this patient with diabetes have osteomyelitis of the lower extremity? JAMA. 2008;299:806-813.
5. Ertugrul BM, Savk O, Ozturk B, et al. The diagnosis of diabetic foot osteomyelitis: examination findings and laboratory values. Med Sci Monit. 2009;15:CR307-CR312.
6. Michail M, Jude E, Liaskos C, et al. The performance of serum inflammatory markers for the diagnosis and follow-up of patients with osteomyelitis. Int J Low Extrem Wounds. 2013;12:94-99.
7. Lipsky BA, Berendt AR, Cornia PB, et al. 2012 Infectious Diseases Society of America clinical practice guideline for the diagnosis and treatment of diabetic foot infections. Clin Infect Dis. 2012;54:e132-e173.
8. Schweitzer ME, Daffner RH, Weissman BN, et al. ACR Appropriateness Criteria on suspected osteomyelitis in patients with diabetes mellitus. J Am Coll Radiol. 2008;5:881-886.
9. Tan T, Shaw EJ, Siddiqui F, et al; Guideline Development Group. Inpatient management of diabetic foot problems: summary of NICE guidance. BMJ. 2011;342:d1280.
Evidence-based answers from the Family Physicians Inquiries Network
VIDEO: Larger lentigo maligna lesions increase risk
ASHEVILLE, N.C. – What are the risk factors for invasive melanoma in patients with lentigo maligna? Size, for one thing, according to Dr. Suzanne M. Olbricht.
In an interview at the annual meeting of the Noah Worcester Dermatological Society, Dr. Olbricht of the Lahey Hospital and Medical Center in Burlington, Mass., reviewed evidence suggesting that the recurrence rate is highest for large lesions. “This is important information that helps us think about the treatments we can use,” she said.
Dr. Olbricht had no financial conflicts to disclose.
The video associated with this article is no longer available on this site. Please view all of our videos on the MDedge YouTube channel
AT NOAH 57

Pleuritic chest pain and globus pharyngeus
A 22-year-old woman with a history of attention-deficit/hyperactivity disorder and childhood asthma came to the emergency department (ED) for treatment of a cramping, substernal, pleuritic chest pain she’d had for a week and the feeling of a “lump in her throat” that made it difficult and painful for her to swallow. The patient’s vital signs were normal and her substernal chest pain was reproducible with palpation. An anteroposterior (AP) chest x-ray (CXR) was unremarkable.
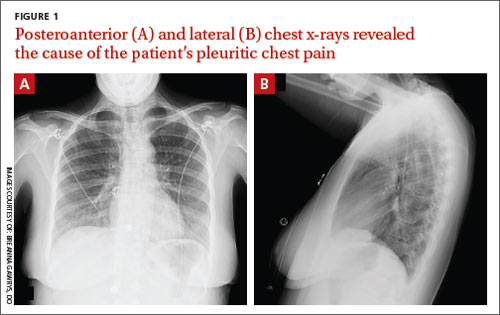
A “GI cocktail” (lidocaine, Mylanta and Donnatal), ketorolac, morphine, and lorazepam were administered in the ED, but did not provide the patient with any relief. She was admitted to the hospital to rule out acute coronary syndrome and was kept NPO overnight. A repeat CXR with posteroanterior (PA) and lateral views was also obtained (FIGURE 1A AND 1B).
WHAT IS YOUR DIAGNOSIS?
HOW WOULD YOU TREAT THIS PATIENT?
Diagnosis: Pneumomediastinum
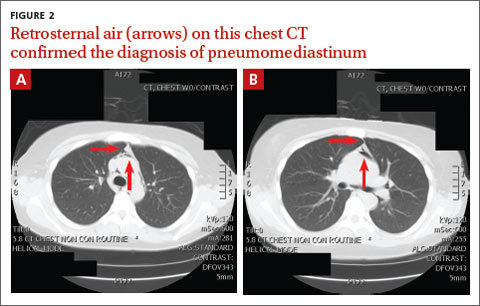
The PA and lateral view CXRs revealed the presence of retrosternal air, suggesting the patient had pneumomediastinum. A computed tomography (CT) scan of the chest also showed retrosternal air (FIGURE 2A AND 2B, arrows) and confirmed this diagnosis. To rule out esophageal perforation, the team ordered Gastrografin and barium swallow studies. The patient was kept NPO until both studies were confirmed to be negative.
Pneumomediastinum—the presence of free air in the mediastinum—can develop spontaneously (as was the case with our patient) or in response to trauma. Common causes include respiratory diseases such as asthma, and trauma to the esophagus secondary to mechanical ventilation, endoscopy, and excessive vomiting.1 Other possible causes include respiratory infections, foreign body aspiration, recent dental extraction, diabetic ketoacidosis, esophageal perforation, barotrauma (due to activities such as flying or scuba diving), and use of illicit drugs.1
Patients with pneumomediastinum often complain of retrosternal, pleuritic pain that radiates to their back, shoulders, and arms. They may also have difficulty swallowing (globus pharyngeus), a nasal voice, and/or dyspnea. Physical findings can include subcutaneous emphysema in the neck and supraclavicular fossa as manifested by Hamman’s sign (a precordial “crunching” sound heard during systole), a fever, and distended neck veins.1
Differential diagnosis includes inflammatory conditions
The differential diagnosis for pneumomediastinum includes pericarditis, mediastinitis, Boerhaave syndrome, and acute coronary syndrome.
Pericarditis. In a patient with inflammation of the pericardium, you would hear reduced heart sounds and observe electrocardiogram (EKG) changes (eg, diffuse ST elevation in acute pericarditis). These signs typically would not be present in a patient with pneumomediastinum.1
Mediastinitis. Patients with mediastinitis—inflammation of the mediastinum—are more likely to have hypotension and shock.1
Boerhaave syndrome, or spontaneous esophageal perforation, has a similar presentation to pneumomediastinum but is more likely to be accompanied by hypotension and shock. Additionally, there would be extravasation of the contrast agent during swallow studies.2
Acute coronary syndrome is also part of the differential. However, in ACS, you would see ST changes on the patient’s EKG and elevated cardiac enzymes.1
Lateral x-rays are especially useful in making the diagnosis
Diagnosis is made by CXR and/or chest CT. On a CXR, retrosternal air is best seen in the lateral projection. Small amounts of air can appear as linear lucencies outlining mediastinal contours. This air can be seen under the skin, surrounding the pericardium, around the pulmonary and/or aortic vasculature, and/or between the parietal pleura and diaphragm.2 A pleural effusion—particularly on the patient’s left side—should raise concern for esophageal perforation.
For most patients, rest and pain control are key
Because pneumomediastinum is generally a self-limiting condition, patients who don’t have severe symptoms, such as respiratory distress or signs of inflammation, should be observed for 2 days, managed with rest and pain control, and discharged home.
If severe symptoms or inflammatory signs are present, a Gastrografin swallow study is recommended to rule out esophageal perforation. If the result of this test is abnormal, a follow-up study with barium is recommended.3 Gastrografin swallow studies are the preferred initial study.3 A barium swallow study is more sensitive, but has a higher risk of causing pneumomediastinitis if an esophageal perforation is present.2
If the swallow study reveals a perforation, surgical decompression and antibiotics may be necessary.1,4,5
Our patient received subsequent serial CXRs that showed improvement in pneumomediastinum. Once our patient’s pain was well controlled with oral nonsteroidal anti-inflammatory drugs, she was discharged home after a 3-day hospitalization with close follow-up. One week later, she had no further complaints and her pain had almost entirely resolved.
CORRESPONDENCE
Breanna Gawrys, DO, Fort Belvoir Community Hospital Family Medicine Residency, 9300 DeWitt Loop, Fort Belvoir, VA 22060; [email protected]
1. Park DE, Vallieres E. Pneumomediastinum and mediastinitis. In: Mason R, Broaddus V, Murray J, et al. Murray and Nadel’s Textbook of Respiratory Medicine. 4th ed. Philadelphia, PA: Elsevier Health Sciences; 2005:2039–2068.
2. Zylak CM, Standen JR, Barnes GR, et al. Pneumomediastinum revisited. Radiographics. 2000;20:1043-1057.
3. Takada K, Matsumoto S, Hiramatsu T, et al. Management of spontaneous pneumomediastinum based on clinical experience of 25 cases. Respir Med. 2008;102:1329-1334.
4. Macia I, Moya J, Ramos R, et al. Spontaneous pneumomediastinum: 41 cases. Eur J Cardiothorac Surg. 2007;31:1110-1114.
5. Chalumeau M, Le Clainche L, Sayeg N, et al. Spontaneous pneumomediastinum in children. Pediatr Pulmonol. 2001;31:67-75.
A 22-year-old woman with a history of attention-deficit/hyperactivity disorder and childhood asthma came to the emergency department (ED) for treatment of a cramping, substernal, pleuritic chest pain she’d had for a week and the feeling of a “lump in her throat” that made it difficult and painful for her to swallow. The patient’s vital signs were normal and her substernal chest pain was reproducible with palpation. An anteroposterior (AP) chest x-ray (CXR) was unremarkable.
A “GI cocktail” (lidocaine, Mylanta and Donnatal), ketorolac, morphine, and lorazepam were administered in the ED, but did not provide the patient with any relief. She was admitted to the hospital to rule out acute coronary syndrome and was kept NPO overnight. A repeat CXR with posteroanterior (PA) and lateral views was also obtained (FIGURE 1A AND 1B).
WHAT IS YOUR DIAGNOSIS?
HOW WOULD YOU TREAT THIS PATIENT?
Diagnosis: Pneumomediastinum
The PA and lateral view CXRs revealed the presence of retrosternal air, suggesting the patient had pneumomediastinum. A computed tomography (CT) scan of the chest also showed retrosternal air (FIGURE 2A AND 2B, arrows) and confirmed this diagnosis. To rule out esophageal perforation, the team ordered Gastrografin and barium swallow studies. The patient was kept NPO until both studies were confirmed to be negative.
Pneumomediastinum—the presence of free air in the mediastinum—can develop spontaneously (as was the case with our patient) or in response to trauma. Common causes include respiratory diseases such as asthma, and trauma to the esophagus secondary to mechanical ventilation, endoscopy, and excessive vomiting.1 Other possible causes include respiratory infections, foreign body aspiration, recent dental extraction, diabetic ketoacidosis, esophageal perforation, barotrauma (due to activities such as flying or scuba diving), and use of illicit drugs.1
Patients with pneumomediastinum often complain of retrosternal, pleuritic pain that radiates to their back, shoulders, and arms. They may also have difficulty swallowing (globus pharyngeus), a nasal voice, and/or dyspnea. Physical findings can include subcutaneous emphysema in the neck and supraclavicular fossa as manifested by Hamman’s sign (a precordial “crunching” sound heard during systole), a fever, and distended neck veins.1
Differential diagnosis includes inflammatory conditions
The differential diagnosis for pneumomediastinum includes pericarditis, mediastinitis, Boerhaave syndrome, and acute coronary syndrome.
Pericarditis. In a patient with inflammation of the pericardium, you would hear reduced heart sounds and observe electrocardiogram (EKG) changes (eg, diffuse ST elevation in acute pericarditis). These signs typically would not be present in a patient with pneumomediastinum.1
Mediastinitis. Patients with mediastinitis—inflammation of the mediastinum—are more likely to have hypotension and shock.1
Boerhaave syndrome, or spontaneous esophageal perforation, has a similar presentation to pneumomediastinum but is more likely to be accompanied by hypotension and shock. Additionally, there would be extravasation of the contrast agent during swallow studies.2
Acute coronary syndrome is also part of the differential. However, in ACS, you would see ST changes on the patient’s EKG and elevated cardiac enzymes.1
Lateral x-rays are especially useful in making the diagnosis
Diagnosis is made by CXR and/or chest CT. On a CXR, retrosternal air is best seen in the lateral projection. Small amounts of air can appear as linear lucencies outlining mediastinal contours. This air can be seen under the skin, surrounding the pericardium, around the pulmonary and/or aortic vasculature, and/or between the parietal pleura and diaphragm.2 A pleural effusion—particularly on the patient’s left side—should raise concern for esophageal perforation.
For most patients, rest and pain control are key
Because pneumomediastinum is generally a self-limiting condition, patients who don’t have severe symptoms, such as respiratory distress or signs of inflammation, should be observed for 2 days, managed with rest and pain control, and discharged home.
If severe symptoms or inflammatory signs are present, a Gastrografin swallow study is recommended to rule out esophageal perforation. If the result of this test is abnormal, a follow-up study with barium is recommended.3 Gastrografin swallow studies are the preferred initial study.3 A barium swallow study is more sensitive, but has a higher risk of causing pneumomediastinitis if an esophageal perforation is present.2
If the swallow study reveals a perforation, surgical decompression and antibiotics may be necessary.1,4,5
Our patient received subsequent serial CXRs that showed improvement in pneumomediastinum. Once our patient’s pain was well controlled with oral nonsteroidal anti-inflammatory drugs, she was discharged home after a 3-day hospitalization with close follow-up. One week later, she had no further complaints and her pain had almost entirely resolved.
CORRESPONDENCE
Breanna Gawrys, DO, Fort Belvoir Community Hospital Family Medicine Residency, 9300 DeWitt Loop, Fort Belvoir, VA 22060; [email protected]
1. Park DE, Vallieres E. Pneumomediastinum and mediastinitis. In: Mason R, Broaddus V, Murray J, et al. Murray and Nadel’s Textbook of Respiratory Medicine. 4th ed. Philadelphia, PA: Elsevier Health Sciences; 2005:2039–2068.
2. Zylak CM, Standen JR, Barnes GR, et al. Pneumomediastinum revisited. Radiographics. 2000;20:1043-1057.
3. Takada K, Matsumoto S, Hiramatsu T, et al. Management of spontaneous pneumomediastinum based on clinical experience of 25 cases. Respir Med. 2008;102:1329-1334.
4. Macia I, Moya J, Ramos R, et al. Spontaneous pneumomediastinum: 41 cases. Eur J Cardiothorac Surg. 2007;31:1110-1114.
5. Chalumeau M, Le Clainche L, Sayeg N, et al. Spontaneous pneumomediastinum in children. Pediatr Pulmonol. 2001;31:67-75.
Another good reason to recommend low-dose aspirin
Prescribe low-dose aspirin (eg, 81 mg/d) to pregnant women who are at high risk for preeclampsia because it reduces the risk of this complication, as well as preterm birth and intrauterine growth restriction.1
Strength of recommendation
A: Based on a systematic review and meta-analysis of 23 studies, including 21 randomized controlled trials.
Henderson J, Whitlock E, O’Connor E, et al. Low-dose aspirin for prevention of morbidity and mortality from preeclampsia: a systematic evidence review for the U.S. Preventive Services Task Force. Ann Intern Med. 2014;160:695-703.
Illustrative case
A 22-year-old G2P1 pregnant woman at 18 weeks gestation who has a history of preeclampsia comes to your office for a routine prenatal visit. On exam, her blood pressure continues to be in the 110s/60s, as it has been for several visits. Her history puts her at risk of developing preeclampsia again, and you wonder if anything can be done to prevent this from happening.
The incidence of preeclampsia, which occurs in 2% to 8% of pregnancies worldwide and 3.4% of pregnancies in the United States, appears to be steadily increasing.2,3 Preeclampsia is defined as new-onset hypertension at >20 weeks gestation, plus proteinuria, thrombocytopenia, renal insufficiency, impaired liver function, pulmonary edema, and/or cerebral or visual symptoms.4 The condition is associated with several adverse maternal and fetal outcomes, including eclampsia, abruption, intrauterine growth restriction (IUGR), preterm birth, stillbirth, and maternal death.2,4 Risk factors for preeclampsia include previous preeclampsia, maternal age ≥40 years, chronic medical conditions, and multi-fetal pregnancy.5
The only effective treatment for preeclampsia is delivery.4 Given the lack of other treatments, strategies for preventing preeclampsia would be highly valuable.
In 1996, the US Preventive Services Task Force (USPSTF) addressed this issue and concluded that there was insufficient evidence to recommend for or against using aspirin to prevent preeclampsia.6 More recently, Henderson et al1 conducted a systematic review and meta-analysis to support the USPSTF in a revision of its earlier recommendation.
STUDY SUMMARY: Aspirin use lowers risk of preeclampsia and preterm birth
Henderson et al1 evaluated the impact of low-dose aspirin on maternal and fetal outcomes among pregnant women at risk for preeclampsia. The review of 23 studies included 21 randomized placebo-controlled trials that evaluated 24,666 patients. Slightly more than half of the studies that evaluated maternal and fetal health benefits were graded as good-quality, and 67% of those that evaluated maternal, perinatal, and developmental harms were rated good-quality.
Most women were white and ages 20 to 33 years. Aspirin doses ranged from 60 mg/d to 150 mg/d; most studies used 60 mg/d or 100 mg/d. Aspirin was initiated between 12 to 36 weeks gestation, with 9 trials initiating aspirin before 16 weeks. In most trials, aspirin was continued until delivery.
Among women at high preeclampsia risk (10 studies), the pooled relative risk (RR) for perinatal death was 0.81 (95% confidence interval [CI], 0.65-1.01) for low-dose aspirin compared to placebo. However, this finding was not statistically significant (P=.78).
Among women who received low-dose aspirin, researchers noted a 14% risk reduction for preterm birth (RR=0.86; 95% CI, 0.76-0.98); a 20% risk reduction for IUGR (RR=0.80; 95% CI, 0.65-0.99), and a 24% risk reduction for preeclampsia (RR=0.76; 95% CI, 0.62-0.95). The absolute risk reduction for preeclampsia was estimated to be 2% to 5%.
While the results for preterm birth, IUGR, and preeclampsia were statistically significant, the authors noted that these results could have been biased by small study effects (the tendency of smaller studies to report positive findings, which in turn can skew the results of a meta-analysis based primarily on such studies). The timing and dosage of aspirin had no significant effect on outcomes.
There was no evidence of increased maternal postpartum hemorrhage with aspirin use (RR=1.02; 95% CI, 0.96-1.09). Aspirin use did not seem to increase perinatal mortality among all risk levels (RR=0.92; 95% CI, 0.76-1.11; P=.65). No differences were noted in the toddlers’ development at 18 months.
WHAT'S NEW: Low-dose aspirin use is now recommended
The 1996 USPSTF recommendation concluded that there was insufficient evidence to recommend aspirin use for preventing preeclampsia. This systematic review and meta-analysis, along with findings from a 2007 Cochrane review7 and a meta-analysis from the PARIS Collaborative Group,8 provide good-quality evidence that aspirin reduces negative maternal and fetal outcomes associated with preeclampsia. In 2014, the USPSTF cited this evidence when it decided to recommend using low-dose aspirin (81 mg/d) to prevent preeclampsia in women who are at high risk for preeclampsia (Grade B).9 (For more on the USPSTF, see “Catching up on the latest USPSTF recommendations”.)
CAVEATS: Much of the data came from small studies
A substantial portion of the data in this systematic review and meta-analysis came from small studies with positive findings. Because small studies with null findings tend to not be published, there is concern that the results reported by Henderson et al1 may be somewhat biased, and that future studies may push the overall observed effect toward a null finding.
Also, the criteria used to define “high risk” for preeclampsia varied by study, so it’s unclear which groups of women would benefit most from aspirin use during pregnancy. Finally, there is a lack of high-quality data on the effects of aspirin use during pregnancy on long-term outcomes in children. Despite these caveats, the cumulative evidence strongly points to greater benefit than harm.
CHALLENGES TO IMPLEMENTATION: You need to determine which patients are at highest risk
The principle challenge lies in identifying which patients are at high risk for preeclampsia, and thus, will likely benefit from this intervention. This systematic review and meta-analysis used a large variety of risk factors to determine whether a woman was high risk. A 2013 American College of Obstetricians and Gynecologists Task Force on Hypertension in Pregnancy report defined high-risk as women with a history of preeclampsia in more than one previous pregnancy or women with a previous preterm delivery due to preeclampsia.4
The updated USPSTF recommendation suggests that women be considered high risk if they have any of the following: 1) previous preeclampsia, 2) multifetal gestation, 3) chronic hypertension, 4) diabetes, 5) renal disease, or 6) autoimmune disease.9 We consider both sets of criteria reasonable for identifying women who may benefit from low-dose aspirin during pregnancy.
ACKNOWLEDGEMENT
The PURLs Surveillance System was supported in part by Grant Number UL1RR024999 from the National Center For Research Resources, a Clinical Translational Science Award to the University of Chicago. The content is solely the responsibility of the authors and does not necessarily represent the official views of the National Center For Research Resources or the National Institutes of Health.
1. Henderson J, Whitlock E, O’Connor E, et al. Low-dose aspirin for prevention of morbidity and mortality from preeclampsia: a systematic evidence review for the U.S. Preventive Services Task Force. Ann Intern Med. 2014;160:695-703.
2. Ghulmiyyah L, Sibai B. Maternal mortality from preeclampsia/eclampsia. Semin Perinatol. 2012;36:56-59.
3. Ananth CV, Keyes KM, Wapner RJ. Pre-eclampsia rates in the United States, 1980-2010: age-period-cohort analysis. BMJ. 2013;347:f6564.
4. American College of Obstetricians and Gynecologists; Task Force on Hypertension in Pregnancy. Hypertension in pregnancy. Report of the American College of Obstetricians and Gynecologists’ Task Force on Hypertension in Pregnancy. Obstet Gynecol. 2013;122:1122-1131.
5. Duckitt K, Harrington D. Risk factors for pre-eclampsia at antenatal booking: systematic review of controlled studies. BMJ. 2005;330:565.
6. US Preventive Services Task Force. Aspirin prophylaxis in pregnancy. In: Guide to Clinical Preventive Services: Report of the U.S. Preventive Services Task Force. 2nd edition. Washington, DC: US Department of Health and Human Services; 1996.
7. Duley L, Henderson-Smart DJ, Meher S, et al. Antiplatelet agents for preventing pre-eclampsia and its complications. Cochrane Database Syst Rev. 2007(2):CD004659.
8. Askie LM, Duley L, Henderson-Smart DJ, et al; PARIS Collaborative Group. Antiplatelet agents for prevention of pre-eclampsia: a meta-analysis of individual patient data. Lancet. 2007;369:1791-1798.
9. LeFevre ML; U.S. Preventive Services Task Force. Low-dose aspirin use for the prevention of morbidity and mortality from preeclampsia: U.S. Preventive Services Task Force recommendation statement. Ann Intern Med. 2014;161:819-826.
Prescribe low-dose aspirin (eg, 81 mg/d) to pregnant women who are at high risk for preeclampsia because it reduces the risk of this complication, as well as preterm birth and intrauterine growth restriction.1
Strength of recommendation
A: Based on a systematic review and meta-analysis of 23 studies, including 21 randomized controlled trials.
Henderson J, Whitlock E, O’Connor E, et al. Low-dose aspirin for prevention of morbidity and mortality from preeclampsia: a systematic evidence review for the U.S. Preventive Services Task Force. Ann Intern Med. 2014;160:695-703.
Illustrative case
A 22-year-old G2P1 pregnant woman at 18 weeks gestation who has a history of preeclampsia comes to your office for a routine prenatal visit. On exam, her blood pressure continues to be in the 110s/60s, as it has been for several visits. Her history puts her at risk of developing preeclampsia again, and you wonder if anything can be done to prevent this from happening.
The incidence of preeclampsia, which occurs in 2% to 8% of pregnancies worldwide and 3.4% of pregnancies in the United States, appears to be steadily increasing.2,3 Preeclampsia is defined as new-onset hypertension at >20 weeks gestation, plus proteinuria, thrombocytopenia, renal insufficiency, impaired liver function, pulmonary edema, and/or cerebral or visual symptoms.4 The condition is associated with several adverse maternal and fetal outcomes, including eclampsia, abruption, intrauterine growth restriction (IUGR), preterm birth, stillbirth, and maternal death.2,4 Risk factors for preeclampsia include previous preeclampsia, maternal age ≥40 years, chronic medical conditions, and multi-fetal pregnancy.5
The only effective treatment for preeclampsia is delivery.4 Given the lack of other treatments, strategies for preventing preeclampsia would be highly valuable.
In 1996, the US Preventive Services Task Force (USPSTF) addressed this issue and concluded that there was insufficient evidence to recommend for or against using aspirin to prevent preeclampsia.6 More recently, Henderson et al1 conducted a systematic review and meta-analysis to support the USPSTF in a revision of its earlier recommendation.
STUDY SUMMARY: Aspirin use lowers risk of preeclampsia and preterm birth
Henderson et al1 evaluated the impact of low-dose aspirin on maternal and fetal outcomes among pregnant women at risk for preeclampsia. The review of 23 studies included 21 randomized placebo-controlled trials that evaluated 24,666 patients. Slightly more than half of the studies that evaluated maternal and fetal health benefits were graded as good-quality, and 67% of those that evaluated maternal, perinatal, and developmental harms were rated good-quality.
Most women were white and ages 20 to 33 years. Aspirin doses ranged from 60 mg/d to 150 mg/d; most studies used 60 mg/d or 100 mg/d. Aspirin was initiated between 12 to 36 weeks gestation, with 9 trials initiating aspirin before 16 weeks. In most trials, aspirin was continued until delivery.
Among women at high preeclampsia risk (10 studies), the pooled relative risk (RR) for perinatal death was 0.81 (95% confidence interval [CI], 0.65-1.01) for low-dose aspirin compared to placebo. However, this finding was not statistically significant (P=.78).
Among women who received low-dose aspirin, researchers noted a 14% risk reduction for preterm birth (RR=0.86; 95% CI, 0.76-0.98); a 20% risk reduction for IUGR (RR=0.80; 95% CI, 0.65-0.99), and a 24% risk reduction for preeclampsia (RR=0.76; 95% CI, 0.62-0.95). The absolute risk reduction for preeclampsia was estimated to be 2% to 5%.
While the results for preterm birth, IUGR, and preeclampsia were statistically significant, the authors noted that these results could have been biased by small study effects (the tendency of smaller studies to report positive findings, which in turn can skew the results of a meta-analysis based primarily on such studies). The timing and dosage of aspirin had no significant effect on outcomes.
There was no evidence of increased maternal postpartum hemorrhage with aspirin use (RR=1.02; 95% CI, 0.96-1.09). Aspirin use did not seem to increase perinatal mortality among all risk levels (RR=0.92; 95% CI, 0.76-1.11; P=.65). No differences were noted in the toddlers’ development at 18 months.
WHAT'S NEW: Low-dose aspirin use is now recommended
The 1996 USPSTF recommendation concluded that there was insufficient evidence to recommend aspirin use for preventing preeclampsia. This systematic review and meta-analysis, along with findings from a 2007 Cochrane review7 and a meta-analysis from the PARIS Collaborative Group,8 provide good-quality evidence that aspirin reduces negative maternal and fetal outcomes associated with preeclampsia. In 2014, the USPSTF cited this evidence when it decided to recommend using low-dose aspirin (81 mg/d) to prevent preeclampsia in women who are at high risk for preeclampsia (Grade B).9 (For more on the USPSTF, see “Catching up on the latest USPSTF recommendations”.)
CAVEATS: Much of the data came from small studies
A substantial portion of the data in this systematic review and meta-analysis came from small studies with positive findings. Because small studies with null findings tend to not be published, there is concern that the results reported by Henderson et al1 may be somewhat biased, and that future studies may push the overall observed effect toward a null finding.
Also, the criteria used to define “high risk” for preeclampsia varied by study, so it’s unclear which groups of women would benefit most from aspirin use during pregnancy. Finally, there is a lack of high-quality data on the effects of aspirin use during pregnancy on long-term outcomes in children. Despite these caveats, the cumulative evidence strongly points to greater benefit than harm.
CHALLENGES TO IMPLEMENTATION: You need to determine which patients are at highest risk
The principle challenge lies in identifying which patients are at high risk for preeclampsia, and thus, will likely benefit from this intervention. This systematic review and meta-analysis used a large variety of risk factors to determine whether a woman was high risk. A 2013 American College of Obstetricians and Gynecologists Task Force on Hypertension in Pregnancy report defined high-risk as women with a history of preeclampsia in more than one previous pregnancy or women with a previous preterm delivery due to preeclampsia.4
The updated USPSTF recommendation suggests that women be considered high risk if they have any of the following: 1) previous preeclampsia, 2) multifetal gestation, 3) chronic hypertension, 4) diabetes, 5) renal disease, or 6) autoimmune disease.9 We consider both sets of criteria reasonable for identifying women who may benefit from low-dose aspirin during pregnancy.
ACKNOWLEDGEMENT
The PURLs Surveillance System was supported in part by Grant Number UL1RR024999 from the National Center For Research Resources, a Clinical Translational Science Award to the University of Chicago. The content is solely the responsibility of the authors and does not necessarily represent the official views of the National Center For Research Resources or the National Institutes of Health.
1. Henderson J, Whitlock E, O’Connor E, et al. Low-dose aspirin for prevention of morbidity and mortality from preeclampsia: a systematic evidence review for the U.S. Preventive Services Task Force. Ann Intern Med. 2014;160:695-703.
2. Ghulmiyyah L, Sibai B. Maternal mortality from preeclampsia/eclampsia. Semin Perinatol. 2012;36:56-59.
3. Ananth CV, Keyes KM, Wapner RJ. Pre-eclampsia rates in the United States, 1980-2010: age-period-cohort analysis. BMJ. 2013;347:f6564.
4. American College of Obstetricians and Gynecologists; Task Force on Hypertension in Pregnancy. Hypertension in pregnancy. Report of the American College of Obstetricians and Gynecologists’ Task Force on Hypertension in Pregnancy. Obstet Gynecol. 2013;122:1122-1131.
5. Duckitt K, Harrington D. Risk factors for pre-eclampsia at antenatal booking: systematic review of controlled studies. BMJ. 2005;330:565.
6. US Preventive Services Task Force. Aspirin prophylaxis in pregnancy. In: Guide to Clinical Preventive Services: Report of the U.S. Preventive Services Task Force. 2nd edition. Washington, DC: US Department of Health and Human Services; 1996.
7. Duley L, Henderson-Smart DJ, Meher S, et al. Antiplatelet agents for preventing pre-eclampsia and its complications. Cochrane Database Syst Rev. 2007(2):CD004659.
8. Askie LM, Duley L, Henderson-Smart DJ, et al; PARIS Collaborative Group. Antiplatelet agents for prevention of pre-eclampsia: a meta-analysis of individual patient data. Lancet. 2007;369:1791-1798.
9. LeFevre ML; U.S. Preventive Services Task Force. Low-dose aspirin use for the prevention of morbidity and mortality from preeclampsia: U.S. Preventive Services Task Force recommendation statement. Ann Intern Med. 2014;161:819-826.
Copyright © 2015 Family Physicians Inquiries Network. All rights reserved.
Acute Kidney Injury: Magnesium for Protection
Q) Our radiology department is discussing use of IV magnesium for diabetic patients to “protect them from kidney injury.” Is this a standard of care now?
Magnesium, the fourth most abundant cation in the body, plays an important physiologic role. Balance is maintained by renal regulation of magnesium reabsorption, and deficiency occurs when there is increased renal excretion initiated by osmotic diuresis. Clinical manifestations of deficiency include cardiac arrhythmias, neuromuscular hyperexcitability, and biochemical abnormalities of hypocalcaemia and hypokalemia.
Diabetes is one of the leading causes of magnesium deficiency, with incidence ranging from 25% to 39%.1 Fluctuations in serum magnesium concentrations are directly correlated with fasting blood glucose, A1C levels, albumin excretion, and the duration of diabetes. It has been postulated that magnesium depletion, via its effect on inositol transport, is pathogenic in the progression of diabetic complications.
Contrast-induced acute kidney injury (CI-AKI) is a potentially adverse consequence of percutaneous coronary interventions (PCI), particularly in diabetic patients. It results in significant morbidity and mortality and adds to the costs of diagnostic and interventional cardiology procedures. Intravenous (IV) agents used during radiologic imaging are notorious for causing acute kidney injury in diabetic patients. Preprocedural hydration and discontinuation of all nephrotoxic medications have proven beneficial in protecting these patients from CI-AKI.
A recent prospective, randomized, open-label clinical trial looked at the effect of administering IV magnesium prior to PCI.2 The control group underwent standard preprocedural hydration and discontinuation of nephrotoxic medications. The study group added IV magnesium to the standard protocol.
In this single-center study, 26.6% of patients in the control group and 14.5% in the study group sustained CI-AKI, a statistically significant result (P = .01). Neither group experienced mortality or required dialysis.
Although not considered standard of care at this time, prophylactic use of IV magnesium (pending pre-op labs), along with the recognized benefit of preprocedural hydration and discontinuation of nephrotoxic medications, can be supported in primary PCI patients. Your radiology department is on the cutting edge of protecting these very high-risk patients.
Debra L. Coplon, DNP, DCC
City of Memphis Wellness Clinic, Tennessee
REFERENCES
1. Ayuk J, Gittoes N. Contemporary view of the clinical relevance of magnesium homeostasis. Ann Clin Biochem. 2014;51(Pt 2):179-188.
2. Firouzi A, Maadani M, Kiani R, et al. Intravenous magnesium sulfate: new method in prevention of contrast-induced nephropathy in primary percutaneous coronary intervention. Int Urol Nephrol. 2015;47(3):521-525.
| Clinician Reviews in partnership with |
Renal Consult is edited by Jane S. Davis, CRNP, DNP, a member of the Clinician Reviews editorial board, who is a nurse practitioner in the Division of Nephrology at the University of Alabama at Birmingham and is the communications chairperson for the National Kidney Foundation’s Council of Advanced Practitioners (NKF-CAP); and Kim Zuber, PA-C, MSPS, DFAAPA, who is a physician assistant with Metropolitan Nephrology in Alexandria, Virginia, and Clinton, Maryland; she is also past chair of the NKF-CAP. This month’s responses were authored by Debra L. Coplon, DNP, DCC, who practices at the City of Memphis Wellness Clinic in Tennessee, and Elizabeth C. Evans, RN, MSN, CNP, DNP, who practices with Renal Medicine Associates in Albuquerque.
Q) Our radiology department is discussing use of IV magnesium for diabetic patients to “protect them from kidney injury.” Is this a standard of care now?
Magnesium, the fourth most abundant cation in the body, plays an important physiologic role. Balance is maintained by renal regulation of magnesium reabsorption, and deficiency occurs when there is increased renal excretion initiated by osmotic diuresis. Clinical manifestations of deficiency include cardiac arrhythmias, neuromuscular hyperexcitability, and biochemical abnormalities of hypocalcaemia and hypokalemia.
Diabetes is one of the leading causes of magnesium deficiency, with incidence ranging from 25% to 39%.1 Fluctuations in serum magnesium concentrations are directly correlated with fasting blood glucose, A1C levels, albumin excretion, and the duration of diabetes. It has been postulated that magnesium depletion, via its effect on inositol transport, is pathogenic in the progression of diabetic complications.
Contrast-induced acute kidney injury (CI-AKI) is a potentially adverse consequence of percutaneous coronary interventions (PCI), particularly in diabetic patients. It results in significant morbidity and mortality and adds to the costs of diagnostic and interventional cardiology procedures. Intravenous (IV) agents used during radiologic imaging are notorious for causing acute kidney injury in diabetic patients. Preprocedural hydration and discontinuation of all nephrotoxic medications have proven beneficial in protecting these patients from CI-AKI.
A recent prospective, randomized, open-label clinical trial looked at the effect of administering IV magnesium prior to PCI.2 The control group underwent standard preprocedural hydration and discontinuation of nephrotoxic medications. The study group added IV magnesium to the standard protocol.
In this single-center study, 26.6% of patients in the control group and 14.5% in the study group sustained CI-AKI, a statistically significant result (P = .01). Neither group experienced mortality or required dialysis.
Although not considered standard of care at this time, prophylactic use of IV magnesium (pending pre-op labs), along with the recognized benefit of preprocedural hydration and discontinuation of nephrotoxic medications, can be supported in primary PCI patients. Your radiology department is on the cutting edge of protecting these very high-risk patients.
Debra L. Coplon, DNP, DCC
City of Memphis Wellness Clinic, Tennessee
REFERENCES
1. Ayuk J, Gittoes N. Contemporary view of the clinical relevance of magnesium homeostasis. Ann Clin Biochem. 2014;51(Pt 2):179-188.
2. Firouzi A, Maadani M, Kiani R, et al. Intravenous magnesium sulfate: new method in prevention of contrast-induced nephropathy in primary percutaneous coronary intervention. Int Urol Nephrol. 2015;47(3):521-525.
Catching up on the latest USPSTF recommendations
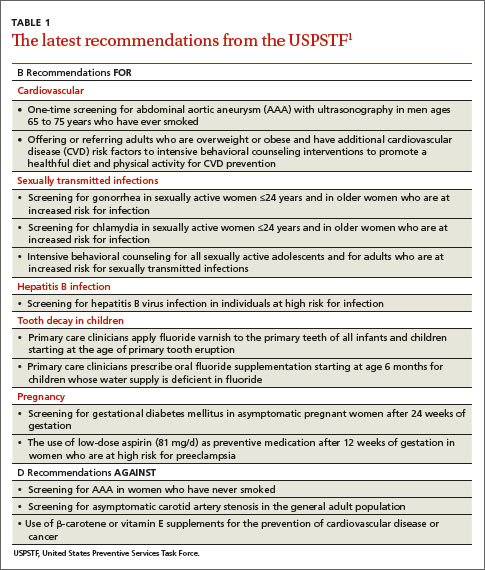
In 2014, the United States Preventive Services Task Force released 24 recommendations on 14 topics.1 There were no level A recommendations, 10 B recommendations, 1 C recommendation, 3 D recommendations, and 10 I statements. A and B recommendations require that commercial insurance plans offer the recommended services at no cost to patients. This Practice Alert focuses on last year’s B and D recommendations (TABLE 11).
Cardiovascular disease
When to screen for abdominal aortic aneurism. The Task Force (TF) reaffirmed a previous B recommendation for a one-time abdominal ultrasound (US) screening for abdominal aortic aneurism (AAA) in men ages 65 to 75 years who have ever smoked. This screening and follow-up of abnormal findings results in decreased AAA rupture and AAA-related mortality, although it appears to have no effect on all-cause mortality.2 The value of screening men who have never smoked is very small and should be considered selectively for men who have a family history of AAA, or a personal history of cardiovascular risk factors or disease. The prevalence of AAA in men in the target age group is 6% to 7% (it is 0.8% for women overall in the same age range).2
The recommended screening modality, abdominal US, matches the sensitivity and specificity of abdominal CT but at lower cost and with no radiation exposure. Refer patients with AAAs ≥5.5 cm for surgical repair.2
Patients with smaller aneurysms (3.0 to 5.4 cm) can be managed conservatively with repeated US every 3 to 12 months. Patients with AAAs <3 cm that exhibit rapid growth (>1 cm/year) or that cross the threshold of 5.5 cm on repeated US should undergo surgical consultation.2
The TF also looked at the value of AAA screening for women in the same age group who have ever smoked, and it could not find enough evidence to make a recommendation. However, in women who have never smoked, the TF concluded that, largely due to the low prevalence of AAA, potential harms of screening outweigh its benefits.2
General screening for carotid artery stenosis is unhelpful. For asymptomatic adults, the TF gave a thumbs-down D recommendation on screening for carotid artery stenosis.3 Carotid artery screening is conducted with US, followed by, if findings indicate the need, confirmatory testing with angiography. US has reasonable sensitivity (90%) for finding the most significant lesions, but the specificity of 94% often leads to false-positive results that can bring about unnecessary surgery and serious harms, including death, stroke, and myocardial infarction. There is no evidence of any benefit from screening by auscultation of the neck.
The TF believes it is better to focus on primary prevention of stroke, including screening for hypertension and dyslipidemia, counseling on smoking cessation, encouraging healthful diet and physical activity, and recommending aspirin use for those at increased risk for cardiovascular disease.3
Focus on CVD prevention. For adults who are overweight or obese and have additional cardiovascular disease (CVD) risk factors, the TF recommends offering, or referring patients for, intensive behavioral counseling interventions to promote a healthy diet and increased physical activity. A previous Practice Alert discussed the rationale behind this selective intensive approach to CVD prevention, as well as the lack of endorsement of vitamins to prevent CVD or cancer.4
Sexually transmitted infections
When to screen for gonorrhea and chlamydia. The TF recommends screening for chlamydial and gonorrheal infections in all sexually active women ages 24 years and younger, and for women older than 24 years who are at high risk.5 The TF could not find adequate evidence to make a recommendation for or against screening men for either disease.
Risk is defined rather broadly to include having a new sex partner, more than one sex partner, or a sex partner with concurrent partners or a sexually transmitted infection (STI); inconsistent condom use among individuals who are not in mutually monogamous relationships; having a previous or coexisting STI; and exchanging sex for money or drugs. The TF also points out that physicians should know the prevalence of these infections in their community and be aware of particular groups that are at higher risk.
Chlamydia and gonorrhea are the most commonly reported STIs in the United States. In 2012, more than 1.4 million cases of chlamydial infection were reported to the Centers for Disease Control and Prevention (CDC).5 This is an underestimate of true prevalence because most infections are asymptomatic and not detected. The rate of chlamydial infection in females was 643.3 cases per 100,000 (more than twice that seen in males—262.6 cases per 100,000), with most infections occurring in females ages 15 to 24 years.5
In 2012, more than 330,000 cases of gonococcal infection were reported to the CDC. The rate of gonorrhea infection was similar for females and males (108.7 vs. 105.8 cases per 100,000, respectively), but while most infections in females occurred between the ages of 15 and 24 years, men most often affected were ages 20 to 24 years.5
Chlamydial and gonococcal infections can be diagnosed by nucleic acid amplification tests conducted on specimens collected in a number of ways: urine; endocervical, vaginal, and male urethral specimens; and self-collected vaginal specimens in clinical settings. Treatment recommendations for both infections can be found on the CDC STI treatment Web site.6
Intensive behavioral counseling as a means of preventing STIs is recommended for all sexually active adolescents and adults at elevated risk—ie, those with current STIs or infected within the past year, those who have multiple sex partners, and those who do not consistently use condoms.7
Intensive intervention ranges from 30 minutes to 2 hours or more of contact time. All counseling within this range is beneficial, with more time being more effective.7 These interventions can be delivered by primary care clinicians or behavioral counselors. The most successful approaches provide basic information about STIs (and STI transmission) and train patients in important skills, such as condom use, communication about safe sex, problem solving, and goal setting.
Hepatitis B screening: A change
The TF changed its previous position on screening for chronic hepatitis B virus (HBV) in those at high risk from an I statement to a B recommendation. Previously, the TF opposed screening of low-risk populations; the new recommendation is silent on this issue. Those at high risk for HBV include:8
• individuals born in countries and regions with a prevalence of HBV infection ≥2%
• US-born individuals not vaccinated as infants, whose parents are from regions with a very high prevalence of HBV infection (≥8%)—eg, sub-Saharan Africa or southeast or central Asia
• HIV-positive individuals
• injection drug users
• men who have sex with men
• household contacts or sexual partners of individuals with HBV infection.
Information on countries and regions with a high prevalence of HBV infection can be found at: www.cdc.gov/mmwr/preview/mmwrhtml/rr5708a1.htm.
The TF notes that approximately 700,000 to 2.2 million individuals in the United States have chronic HBV infection.8 However, HBV vaccine has been a recommended child vaccine for more than 20 years and the pool of those at risk shrinks annually.
Chronic HBV infection can lead to cirrhosis, hepatic failure, and hepatocellular carcinoma. An estimated 15% to 25% of individuals with chronic HBV infection die of cirrhosis or hepatocellular carcinoma.8 Those with chronic infection can also infect others. Screening for HBV infection could identify chronically infected people who may benefit from treatment and be counseled to prevent transmission.
In screening, test for hepatitis B surface antigen (HBsAg), which has a reported sensitivity and specificity of >98%.8 While the TF did not find direct evidence of screening benefits on mortality, it found convincing evidence that antiviral treatment in patients with chronic HBV infection improves intermediate outcomes (virologic or histologic improvement or clearance of hepatitis B e antigen [HBeAg]) and adequate evidence that antiviral regimens improve health outcomes (such as reduced risk for hepatocellular carcinoma).8
Prevention of tooth decay in kids
The TF recommends that primary care physicians implement 2 interventions to prevent tooth decay in infants and children: prescribing oral fluoride supplementation starting at age 6 months in areas where the local water supply is deficient in fluoride (defined as <0.6 ppm F); and periodically applying fluoride varnish to primary teeth starting at the age of tooth eruption through age 5 years. The TF emphasizes, however, that the most effective way to prevent dental decay in children is to maintain recommended levels of fluoride in community water supplies.9
Both recommended interventions are supported by good evidence, although no study directly assessed the appropriate ages at which to start and stop the application of fluoride varnish or the optimal frequency of applications. Most studies looked at children ages 3 to 5 years, but the TF believes that benefits are likely to begin at the time of primary tooth eruption.
Limited evidence found no clear difference in benefit between performing a single fluoride varnish once every 6 months vs once a year or between a single application every 6 months vs multiple applications once a year or every 6 months.9
Pregnancy
Screen for gestational diabetes. The previous TF statement on gestational diabetes mellitus (GDM) found insufficient evidence to screen for this condition. The new recommendation advises screening starting at 24 weeks gestation using the 50-g oral glucose challenge test.10 Other screening options, such as the use of fasting plasma glucose testing or basing decisions to screen on risk factors, have not been studied as extensively. The USPSTF found inadequate evidence to compare the effectiveness of different screening tests or thresholds in determining positive screen results.
Treating those with GDM with diet, glucose monitoring, and insulin (if needed) can significantly reduce the risk of preeclampsia, fetal macrosomia, and shoulder dystocia, which, according to the TF, adds up to a moderate net benefit for both mother and infant. There is no evidence that treatment will improve long-term metabolic outcomes in women.

The TF found inadequate evidence to determine whether there are benefits to screening for GDM in women before 24 weeks of gestation.
Give low-dose aspirin to prevent preeclampsia. In a new recommendation, the TF endorses low-dose aspirin (81 mg/d) to reduce rates of preeclampsia, preterm birth, and intrauterine growth restriction (IUGR) in women at increased risk for preeclampsia—defined as those with kidney disease, diabetes (type 1 or 2), hypertension, autoimmune disease, a history of preeclampsia, or a current multifetal pregnancy.11
Aspirin should be started after 12 weeks and before 28 weeks of gestation, which has been shown to reduce the risk of preeclampsia by 24%, preterm birth by 14%, and IUGR by 20%.11 The number needed to treat to prevent one case of preeclampsia was 42; 71 for IUGR, and 65 for preterm birth.11 (For more on the evidence behind this recommendation, see “Another good reason to recommend lowdose aspirin” on page 301.)
TABLE 211 lists risk factors for preeclampsia and recommendations for those in high-, moderate-, and low-risk groups.
Screenings/interventions with insufficient supporting evidence
Three conditions that cause significant morbidity or mortality were looked at by the TF last year, and insufficient evidence was found to make a recommendation—screening for cognitive impairment (early Alzheimer’s); primary care interventions to prevent or reduce illicit drug or nonmedical pharmaceutical use in children and adolescents; and screening for suicide risk in adolescents, adults, and older adults in primary care. In addition, no evidence could be found for the benefit of screening for vitamin D deficiency in adults.
1. US Preventive Services Task Force. Published recommendations. US Preventive Services Task Force Web site. Available at: http://www.uspreventiveservicestaskforce.org/BrowseRec/Index. Accessed March 24, 2015.
2. US Preventive Services Task Force. Abdominal aortic aneurism: screening. US Preventive Services Task Force Web site. Available at: http://www.uspreventiveservicestaskforce.org/Page/Document/RecommendationStatementFinal/abdominal-aortic-aneurysm-screening. Accessed March 24, 2015.
3. US Preventive Services Task Force. Carotid artery stenosis: screening. US Preventive Services Task Force Web site. Available at: http://www.uspreventiveservicestaskforce.org/Page/Document/RecommendationStatementFinal/carotid-artery-stenosis-screening. Accessed March 24, 2015.
4. Campos-Outcalt D. Diet, exercise, and CVD: When counseling makes the most sense. J Fam Pract. 2014;63:458-460.
5. US Preventive Services Task Force. Chlamydia and gonorrhea screening. US Preventive Services Task Force Web site. Available at: http://www.uspreventiveservicestaskforce.org/Page/Document/RecommendationStatementFinal/chlamydia-and-gonorrhea-screening. Accessed March 24, 2015.
6. Centers for Disease Control and Prevention. 2010 STD treatment guidelines. Centers for Disease Control and Prevention Web site. Available at: http://www.cdc.gov/std/treatment/2010/default.htm. Accessed March 24, 2015.
7. US Preventive Services Task Force. Sexually transmitted infections: behavioral counseling. US Preventive Services Task Force Web site. Available at: http://www.uspreventiveservicestaskforce.org/Page/Document/RecommendationStatementFinal/sexually-transmitted-infections-behavioral-counseling1. Accessed March 24, 2015.
8. US Preventive Services Task Force. Hepatitis B virus infection: screening, 2014. US Preventive Services Task Force Web site. Available at: http://www.uspreventiveservicestaskforce.org/Page/Document/RecommendationStatementFinal/hepatitis-bvirus-infection-screening-2014. Accessed March 24, 2015.
9. US Preventive Services Task Force. Dental caries in children from birth through age 5 years: screening. US Preventive Services Task Force Web site. Available at: http://www.uspreventiveservicestaskforce.org/Page/Document/RecommendationStatementFinal/dental-caries-in-children-from-birth-through-age-5-years-screening. Accessed March 24, 2015.
10. US Preventive Services Task Force. Gestational diabetes mellitus, screening. US Preventive Services Task Force Web site. Available at: http://www.uspreventiveservicestaskforce.org/Page/Document/RecommendationStatementFinal/gestational-diabetesmellitus-screening. Accessed March 24, 2015.
11. US Preventive Services Task Force. Low-dose aspirin use for the prevention of morbidity and mortality from preeclampsia: preventive medication. US Preventive Services Task Force Web site. Available at: http://www.uspreventiveservicestaskforce.org/Page/Document/RecommendationStatementFinal/low-dose-aspirin-use-for-the-prevention-of-morbidity-and-mortality-frompreeclampsia-preventive-medication. Accessed March 24, 2015.
In 2014, the United States Preventive Services Task Force released 24 recommendations on 14 topics.1 There were no level A recommendations, 10 B recommendations, 1 C recommendation, 3 D recommendations, and 10 I statements. A and B recommendations require that commercial insurance plans offer the recommended services at no cost to patients. This Practice Alert focuses on last year’s B and D recommendations (TABLE 11).
Cardiovascular disease
When to screen for abdominal aortic aneurism. The Task Force (TF) reaffirmed a previous B recommendation for a one-time abdominal ultrasound (US) screening for abdominal aortic aneurism (AAA) in men ages 65 to 75 years who have ever smoked. This screening and follow-up of abnormal findings results in decreased AAA rupture and AAA-related mortality, although it appears to have no effect on all-cause mortality.2 The value of screening men who have never smoked is very small and should be considered selectively for men who have a family history of AAA, or a personal history of cardiovascular risk factors or disease. The prevalence of AAA in men in the target age group is 6% to 7% (it is 0.8% for women overall in the same age range).2
The recommended screening modality, abdominal US, matches the sensitivity and specificity of abdominal CT but at lower cost and with no radiation exposure. Refer patients with AAAs ≥5.5 cm for surgical repair.2
Patients with smaller aneurysms (3.0 to 5.4 cm) can be managed conservatively with repeated US every 3 to 12 months. Patients with AAAs <3 cm that exhibit rapid growth (>1 cm/year) or that cross the threshold of 5.5 cm on repeated US should undergo surgical consultation.2
The TF also looked at the value of AAA screening for women in the same age group who have ever smoked, and it could not find enough evidence to make a recommendation. However, in women who have never smoked, the TF concluded that, largely due to the low prevalence of AAA, potential harms of screening outweigh its benefits.2
General screening for carotid artery stenosis is unhelpful. For asymptomatic adults, the TF gave a thumbs-down D recommendation on screening for carotid artery stenosis.3 Carotid artery screening is conducted with US, followed by, if findings indicate the need, confirmatory testing with angiography. US has reasonable sensitivity (90%) for finding the most significant lesions, but the specificity of 94% often leads to false-positive results that can bring about unnecessary surgery and serious harms, including death, stroke, and myocardial infarction. There is no evidence of any benefit from screening by auscultation of the neck.
The TF believes it is better to focus on primary prevention of stroke, including screening for hypertension and dyslipidemia, counseling on smoking cessation, encouraging healthful diet and physical activity, and recommending aspirin use for those at increased risk for cardiovascular disease.3
Focus on CVD prevention. For adults who are overweight or obese and have additional cardiovascular disease (CVD) risk factors, the TF recommends offering, or referring patients for, intensive behavioral counseling interventions to promote a healthy diet and increased physical activity. A previous Practice Alert discussed the rationale behind this selective intensive approach to CVD prevention, as well as the lack of endorsement of vitamins to prevent CVD or cancer.4
Sexually transmitted infections
When to screen for gonorrhea and chlamydia. The TF recommends screening for chlamydial and gonorrheal infections in all sexually active women ages 24 years and younger, and for women older than 24 years who are at high risk.5 The TF could not find adequate evidence to make a recommendation for or against screening men for either disease.
Risk is defined rather broadly to include having a new sex partner, more than one sex partner, or a sex partner with concurrent partners or a sexually transmitted infection (STI); inconsistent condom use among individuals who are not in mutually monogamous relationships; having a previous or coexisting STI; and exchanging sex for money or drugs. The TF also points out that physicians should know the prevalence of these infections in their community and be aware of particular groups that are at higher risk.
Chlamydia and gonorrhea are the most commonly reported STIs in the United States. In 2012, more than 1.4 million cases of chlamydial infection were reported to the Centers for Disease Control and Prevention (CDC).5 This is an underestimate of true prevalence because most infections are asymptomatic and not detected. The rate of chlamydial infection in females was 643.3 cases per 100,000 (more than twice that seen in males—262.6 cases per 100,000), with most infections occurring in females ages 15 to 24 years.5
In 2012, more than 330,000 cases of gonococcal infection were reported to the CDC. The rate of gonorrhea infection was similar for females and males (108.7 vs. 105.8 cases per 100,000, respectively), but while most infections in females occurred between the ages of 15 and 24 years, men most often affected were ages 20 to 24 years.5
Chlamydial and gonococcal infections can be diagnosed by nucleic acid amplification tests conducted on specimens collected in a number of ways: urine; endocervical, vaginal, and male urethral specimens; and self-collected vaginal specimens in clinical settings. Treatment recommendations for both infections can be found on the CDC STI treatment Web site.6
Intensive behavioral counseling as a means of preventing STIs is recommended for all sexually active adolescents and adults at elevated risk—ie, those with current STIs or infected within the past year, those who have multiple sex partners, and those who do not consistently use condoms.7
Intensive intervention ranges from 30 minutes to 2 hours or more of contact time. All counseling within this range is beneficial, with more time being more effective.7 These interventions can be delivered by primary care clinicians or behavioral counselors. The most successful approaches provide basic information about STIs (and STI transmission) and train patients in important skills, such as condom use, communication about safe sex, problem solving, and goal setting.
Hepatitis B screening: A change
The TF changed its previous position on screening for chronic hepatitis B virus (HBV) in those at high risk from an I statement to a B recommendation. Previously, the TF opposed screening of low-risk populations; the new recommendation is silent on this issue. Those at high risk for HBV include:8
• individuals born in countries and regions with a prevalence of HBV infection ≥2%
• US-born individuals not vaccinated as infants, whose parents are from regions with a very high prevalence of HBV infection (≥8%)—eg, sub-Saharan Africa or southeast or central Asia
• HIV-positive individuals
• injection drug users
• men who have sex with men
• household contacts or sexual partners of individuals with HBV infection.
Information on countries and regions with a high prevalence of HBV infection can be found at: www.cdc.gov/mmwr/preview/mmwrhtml/rr5708a1.htm.
The TF notes that approximately 700,000 to 2.2 million individuals in the United States have chronic HBV infection.8 However, HBV vaccine has been a recommended child vaccine for more than 20 years and the pool of those at risk shrinks annually.
Chronic HBV infection can lead to cirrhosis, hepatic failure, and hepatocellular carcinoma. An estimated 15% to 25% of individuals with chronic HBV infection die of cirrhosis or hepatocellular carcinoma.8 Those with chronic infection can also infect others. Screening for HBV infection could identify chronically infected people who may benefit from treatment and be counseled to prevent transmission.
In screening, test for hepatitis B surface antigen (HBsAg), which has a reported sensitivity and specificity of >98%.8 While the TF did not find direct evidence of screening benefits on mortality, it found convincing evidence that antiviral treatment in patients with chronic HBV infection improves intermediate outcomes (virologic or histologic improvement or clearance of hepatitis B e antigen [HBeAg]) and adequate evidence that antiviral regimens improve health outcomes (such as reduced risk for hepatocellular carcinoma).8
Prevention of tooth decay in kids
The TF recommends that primary care physicians implement 2 interventions to prevent tooth decay in infants and children: prescribing oral fluoride supplementation starting at age 6 months in areas where the local water supply is deficient in fluoride (defined as <0.6 ppm F); and periodically applying fluoride varnish to primary teeth starting at the age of tooth eruption through age 5 years. The TF emphasizes, however, that the most effective way to prevent dental decay in children is to maintain recommended levels of fluoride in community water supplies.9
Both recommended interventions are supported by good evidence, although no study directly assessed the appropriate ages at which to start and stop the application of fluoride varnish or the optimal frequency of applications. Most studies looked at children ages 3 to 5 years, but the TF believes that benefits are likely to begin at the time of primary tooth eruption.
Limited evidence found no clear difference in benefit between performing a single fluoride varnish once every 6 months vs once a year or between a single application every 6 months vs multiple applications once a year or every 6 months.9
Pregnancy
Screen for gestational diabetes. The previous TF statement on gestational diabetes mellitus (GDM) found insufficient evidence to screen for this condition. The new recommendation advises screening starting at 24 weeks gestation using the 50-g oral glucose challenge test.10 Other screening options, such as the use of fasting plasma glucose testing or basing decisions to screen on risk factors, have not been studied as extensively. The USPSTF found inadequate evidence to compare the effectiveness of different screening tests or thresholds in determining positive screen results.
Treating those with GDM with diet, glucose monitoring, and insulin (if needed) can significantly reduce the risk of preeclampsia, fetal macrosomia, and shoulder dystocia, which, according to the TF, adds up to a moderate net benefit for both mother and infant. There is no evidence that treatment will improve long-term metabolic outcomes in women.
The TF found inadequate evidence to determine whether there are benefits to screening for GDM in women before 24 weeks of gestation.
Give low-dose aspirin to prevent preeclampsia. In a new recommendation, the TF endorses low-dose aspirin (81 mg/d) to reduce rates of preeclampsia, preterm birth, and intrauterine growth restriction (IUGR) in women at increased risk for preeclampsia—defined as those with kidney disease, diabetes (type 1 or 2), hypertension, autoimmune disease, a history of preeclampsia, or a current multifetal pregnancy.11
Aspirin should be started after 12 weeks and before 28 weeks of gestation, which has been shown to reduce the risk of preeclampsia by 24%, preterm birth by 14%, and IUGR by 20%.11 The number needed to treat to prevent one case of preeclampsia was 42; 71 for IUGR, and 65 for preterm birth.11 (For more on the evidence behind this recommendation, see “Another good reason to recommend lowdose aspirin” on page 301.)
TABLE 211 lists risk factors for preeclampsia and recommendations for those in high-, moderate-, and low-risk groups.
Screenings/interventions with insufficient supporting evidence
Three conditions that cause significant morbidity or mortality were looked at by the TF last year, and insufficient evidence was found to make a recommendation—screening for cognitive impairment (early Alzheimer’s); primary care interventions to prevent or reduce illicit drug or nonmedical pharmaceutical use in children and adolescents; and screening for suicide risk in adolescents, adults, and older adults in primary care. In addition, no evidence could be found for the benefit of screening for vitamin D deficiency in adults.
1. US Preventive Services Task Force. Published recommendations. US Preventive Services Task Force Web site. Available at: http://www.uspreventiveservicestaskforce.org/BrowseRec/Index. Accessed March 24, 2015.
2. US Preventive Services Task Force. Abdominal aortic aneurism: screening. US Preventive Services Task Force Web site. Available at: http://www.uspreventiveservicestaskforce.org/Page/Document/RecommendationStatementFinal/abdominal-aortic-aneurysm-screening. Accessed March 24, 2015.
3. US Preventive Services Task Force. Carotid artery stenosis: screening. US Preventive Services Task Force Web site. Available at: http://www.uspreventiveservicestaskforce.org/Page/Document/RecommendationStatementFinal/carotid-artery-stenosis-screening. Accessed March 24, 2015.
4. Campos-Outcalt D. Diet, exercise, and CVD: When counseling makes the most sense. J Fam Pract. 2014;63:458-460.
5. US Preventive Services Task Force. Chlamydia and gonorrhea screening. US Preventive Services Task Force Web site. Available at: http://www.uspreventiveservicestaskforce.org/Page/Document/RecommendationStatementFinal/chlamydia-and-gonorrhea-screening. Accessed March 24, 2015.
6. Centers for Disease Control and Prevention. 2010 STD treatment guidelines. Centers for Disease Control and Prevention Web site. Available at: http://www.cdc.gov/std/treatment/2010/default.htm. Accessed March 24, 2015.
7. US Preventive Services Task Force. Sexually transmitted infections: behavioral counseling. US Preventive Services Task Force Web site. Available at: http://www.uspreventiveservicestaskforce.org/Page/Document/RecommendationStatementFinal/sexually-transmitted-infections-behavioral-counseling1. Accessed March 24, 2015.
8. US Preventive Services Task Force. Hepatitis B virus infection: screening, 2014. US Preventive Services Task Force Web site. Available at: http://www.uspreventiveservicestaskforce.org/Page/Document/RecommendationStatementFinal/hepatitis-bvirus-infection-screening-2014. Accessed March 24, 2015.
9. US Preventive Services Task Force. Dental caries in children from birth through age 5 years: screening. US Preventive Services Task Force Web site. Available at: http://www.uspreventiveservicestaskforce.org/Page/Document/RecommendationStatementFinal/dental-caries-in-children-from-birth-through-age-5-years-screening. Accessed March 24, 2015.
10. US Preventive Services Task Force. Gestational diabetes mellitus, screening. US Preventive Services Task Force Web site. Available at: http://www.uspreventiveservicestaskforce.org/Page/Document/RecommendationStatementFinal/gestational-diabetesmellitus-screening. Accessed March 24, 2015.
11. US Preventive Services Task Force. Low-dose aspirin use for the prevention of morbidity and mortality from preeclampsia: preventive medication. US Preventive Services Task Force Web site. Available at: http://www.uspreventiveservicestaskforce.org/Page/Document/RecommendationStatementFinal/low-dose-aspirin-use-for-the-prevention-of-morbidity-and-mortality-frompreeclampsia-preventive-medication. Accessed March 24, 2015.

Epithelial Ovarian Cancer: Management of Advanced Disease
Edited by: Arthur T. Skarin, MD, FACP, FCCP
Epithelial ovarian cancer is the fifth leading cause of cancer death among women in the United States. Most women with ovarian cancer present at an advanced stage (International Federation of Gynecology and Obstetrics stage III), for which the standard treatment remains cytoreductive surgery followed by platinum- and taxane-based combination chemotherapy. Although this treatment frequently is curative for patients with early-stage disease, more than 60% of women with advanced disease will develop recurrent disease with progressively shorter disease-free intervals. However, there are many clinical trials in progress that are aimed at refining current therapy and evaluating different approaches to postoperative therapy, with the goal of improving prognosis and quality of life.
To read the full article in PDF:
Mind the Gap: Case Study in Toxicology
Case
An 8-month-old boy with a history of hypotonia, developmental delay, and seizure disorder refractory to multiple anticonvulsant medications, was presented to the ED with a 2-week history of intermittent fever and poor oral intake. His current medications included sodium bromide 185 mg orally twice daily for his seizure disorder.

On physical examination, the boy appeared small for his age, with diffuse hypotonia and diminished reflexes. He was able to track with his eyes but was otherwise unresponsive. No rash was present. Results of initial laboratory studies were: sodium 144 mEq/L; potassium, 4.8 mEq/L; chloride, 179 mEq/L; bicarbonate, 21 mEq/L; blood urea nitrogen, 6 mg/dL; creatinine, 0.1 mg/dL; and glucose, 63 mg/dL. His anion gap (AG) was −56.
What does the anion gap represent?
The AG is a valuable clinical calculation derived from the measured extracellular electrolytes and provides an index of acid-base status.1 Due to the necessity of electroneutrality, the sum of positive charges (cations) in the extracellular fluid must be balanced exactly with the sum of negative charges (anions). However, to routinely measure all of the cations and anions in the serum would be time-consuming and is also unnecessary. Because most clinical laboratories commonly only measure one relevant cation (sodium) and two anions (chloride and bicarbonate), the positive and negative sums are not completely balanced. The AG therefore refers to this difference (ie, AG = Na – [Cl + HCO3]).
Of course, electroneutrality exists in vivo, and is accomplished by the presence of unmeasured anions (UA) (eg, lactate and phosphate) and unmeasured cations (UC) (eg, potassium and calcium) not accounted for in the AG (ie, AG = UA – UC). In other words, the sum of measured plus the unmeasured anions must equal the sum of the measured plus unmeasured cations.
What causes a low or negative anion gap?
While most healthcare providers are well versed in the clinical significance of an elevated AG (eg, MUDPILES [methanol, uremia, diabetic ketoacidosis, propylene glycol or phenformin, iron or isoniazid, lactate, ethylene glycol, salicylates]), the meaning of a low or negative AG is underappreciated. There are several scenarios that could potentially yield a low or negative AG, including decreased concentration of UA, increased concentrations of nonsodium cations (UC), and overestimation of serum chloride.
Decreased Concentration of Unmeasured Anions. This most commonly occurs by two mechanisms: dilution of the extracellular fluid or hypoalbuminemia. The addition of water to the extracellular fluid will cause a proportionate dilution of all the measured electrolytes. Since the concentration of measured cations is higher than the measured anions, there is a small and relatively insignificant decrease in the AG.
Alternatively, hypoalbuminemia results in a low AG due to the change in UA; albumin is negatively charged. At physiologic pH, the overwhelming majority of serum proteins are anionic and counter-balanced by the positive charge of sodium. Albumin, the most abundant serum protein, accounts for approximately 75% of the normal AG. Hypoalbuminemic states, such as cirrhosis or nephrotic syndrome, can therefore cause low AG due to the retention of chloride to replace the lost negative charge. The albumin concentration can be corrected to calculate the AG.2
Nonsodium Cations. There are a number of clinical conditions that result in the retention of nonsodium cations. For example, the excess positively charged paraproteins associated with IgG myeloma raise the UC concentration, resulting in a low AG. Similarly, elevations of unmeasured cationic electrolytes, such as calcium and magnesium, may also result in a lower AG. Significant changes in AG, though, are caused only by profound (and often life-threatening) hypercalcemia or hypermagnesemia.
Overestimation of Serum Chloride. Overestimation of serum chloride most commonly occurs in the clinical scenario of bromide exposure. In normal physiologic conditions, chloride is the only halide present in the extracellular fluid. With intake of brominated products, chloride may be partially replaced by bromide. As there is greater renal tubular avidity for bromide, chronic ingestion of bromide results in a gradual rise in serum bromide concentrations with a proportional fall in chloride. However, and more importantly, bromide interferes with a number of laboratory techniques measuring chloride concentrations, resulting in a spuriously elevated chloride, or pseudohyperchloremia. Because the measured sodium and bicarbonate concentrations will remain unchanged, this falsely elevated chloride measurement will result in a negative AG.
What causes the falsely elevated chloride?
All of the current laboratory techniques for measurement of serum chloride concentration can potentially result in a falsely elevated value. However, the degree of pseudohyperchloremia will depend on the specific assay used for measurement. The ion-selective electrode method used by many common laboratory analyzers appears to have the greatest interference on chloride measurement in the presence of bromide. This is simply due to the molecular similarity of bromide and chloride. Conversely, the coulometry method, often used as a reference standard, has the least interference of current laboratory methods.3 This is because coulometry does not completely rely on molecular structure to measure concentration, but rather it measures the amount of energy produced or consumed in an electrolysis reaction. Iodide, another halide compound, has also been described as a cause of pseudohyperchloremia, whereas fluoride does not seem to have significant interference.4
How are patients exposed to bromide salts?
Bromide salts, specifically sodium bromide, are infrequently used to treat seizure disorders, but are generally reserved for patients with epilepsy refractory to other, less toxic anticonvulsant medications. During the era when bromide salts were more commonly used to treat epilepsy, bromide intoxication, or bromism, was frequently observed.
Bromism may manifest as a constellation of nonspecific neurological and psychiatric symptoms. These most commonly include headache, weakness, agitation, confusion, and hallucinations. In more severe cases of bromism, stupor and coma may occur.3,5
Although bromide salts are no longer commonly prescribed, a number of products still contain brominated ingredients. Symptoms of bromide intoxication can occur with chronic use of a cough syrup containing dextromethorphan hydrobromide as well as the brominated vegetable oils found in some soft drinks.5
How is bromism treated?
The treatment of bromism involves preventing further exposure to bromide and promoting bromide excretion. Bromide has a long half-life (10-12 days), and in patients with normal renal function, it is possible to reduce this half-life to approximately 3 days with hydration and diuresis with sodium chloride.3 Alternatively, in patients with impaired renal function or severe intoxication, hemodialysis has been used effectively.5
Case Conclusion
The patient was admitted for observation and treated with intravenous sodium chloride. After consultation with his neurologist, he was discharged home in the care of his parents, who were advised to continue him on sodium bromide 185 mg orally twice daily since his seizures were refractory to other anticonvulsant medications.
Dr Repplinger is a medical toxicology fellow in the department of emergency medicine at New York University Langone Medical Center. Dr Nelson, editor of “Case Studies in Toxicology,” is a professor in the department of emergency medicine and director of the medical toxicology fellowship program at the New York University School of Medicine and the New York City Poison Control Center. He is also associate editor, toxicology, of the EMERGENCY MEDICINE editorial board.
- Emmett M, Narins RG. Clinical use of the anion gap. Medicine (Baltimore). 1977;56(1):38-54.
- Figge J, Jabor A, Kazda A, Fencl V. Anion gap and hypoalbuminemia. Crit Care Med. 1998;26(11):1807-1810.
- Vasuyattakul S, Lertpattanasuwan N, Vareesangthip K, Nimmannit S, Nilwarangkur S. A negative aniongap as a clue to diagnose bromide intoxication.Nephron. 1995;69(3):311-313.
- Yamamoto K, Kobayashi H, Kobayashi T, MurakamiS. False hyperchloremia in bromism. J Anesth.1991;5(1):88-91.
- Ng YY, Lin WL, Chen TW. Spurious hyperchloremiaand decreased anion gap in a patient with dextromethorphan bromide. Am J Nephrol. 1992;12(4):268-270.
Case
An 8-month-old boy with a history of hypotonia, developmental delay, and seizure disorder refractory to multiple anticonvulsant medications, was presented to the ED with a 2-week history of intermittent fever and poor oral intake. His current medications included sodium bromide 185 mg orally twice daily for his seizure disorder.
On physical examination, the boy appeared small for his age, with diffuse hypotonia and diminished reflexes. He was able to track with his eyes but was otherwise unresponsive. No rash was present. Results of initial laboratory studies were: sodium 144 mEq/L; potassium, 4.8 mEq/L; chloride, 179 mEq/L; bicarbonate, 21 mEq/L; blood urea nitrogen, 6 mg/dL; creatinine, 0.1 mg/dL; and glucose, 63 mg/dL. His anion gap (AG) was −56.
What does the anion gap represent?
The AG is a valuable clinical calculation derived from the measured extracellular electrolytes and provides an index of acid-base status.1 Due to the necessity of electroneutrality, the sum of positive charges (cations) in the extracellular fluid must be balanced exactly with the sum of negative charges (anions). However, to routinely measure all of the cations and anions in the serum would be time-consuming and is also unnecessary. Because most clinical laboratories commonly only measure one relevant cation (sodium) and two anions (chloride and bicarbonate), the positive and negative sums are not completely balanced. The AG therefore refers to this difference (ie, AG = Na – [Cl + HCO3]).
Of course, electroneutrality exists in vivo, and is accomplished by the presence of unmeasured anions (UA) (eg, lactate and phosphate) and unmeasured cations (UC) (eg, potassium and calcium) not accounted for in the AG (ie, AG = UA – UC). In other words, the sum of measured plus the unmeasured anions must equal the sum of the measured plus unmeasured cations.
What causes a low or negative anion gap?
While most healthcare providers are well versed in the clinical significance of an elevated AG (eg, MUDPILES [methanol, uremia, diabetic ketoacidosis, propylene glycol or phenformin, iron or isoniazid, lactate, ethylene glycol, salicylates]), the meaning of a low or negative AG is underappreciated. There are several scenarios that could potentially yield a low or negative AG, including decreased concentration of UA, increased concentrations of nonsodium cations (UC), and overestimation of serum chloride.
Decreased Concentration of Unmeasured Anions. This most commonly occurs by two mechanisms: dilution of the extracellular fluid or hypoalbuminemia. The addition of water to the extracellular fluid will cause a proportionate dilution of all the measured electrolytes. Since the concentration of measured cations is higher than the measured anions, there is a small and relatively insignificant decrease in the AG.
Alternatively, hypoalbuminemia results in a low AG due to the change in UA; albumin is negatively charged. At physiologic pH, the overwhelming majority of serum proteins are anionic and counter-balanced by the positive charge of sodium. Albumin, the most abundant serum protein, accounts for approximately 75% of the normal AG. Hypoalbuminemic states, such as cirrhosis or nephrotic syndrome, can therefore cause low AG due to the retention of chloride to replace the lost negative charge. The albumin concentration can be corrected to calculate the AG.2
Nonsodium Cations. There are a number of clinical conditions that result in the retention of nonsodium cations. For example, the excess positively charged paraproteins associated with IgG myeloma raise the UC concentration, resulting in a low AG. Similarly, elevations of unmeasured cationic electrolytes, such as calcium and magnesium, may also result in a lower AG. Significant changes in AG, though, are caused only by profound (and often life-threatening) hypercalcemia or hypermagnesemia.
Overestimation of Serum Chloride. Overestimation of serum chloride most commonly occurs in the clinical scenario of bromide exposure. In normal physiologic conditions, chloride is the only halide present in the extracellular fluid. With intake of brominated products, chloride may be partially replaced by bromide. As there is greater renal tubular avidity for bromide, chronic ingestion of bromide results in a gradual rise in serum bromide concentrations with a proportional fall in chloride. However, and more importantly, bromide interferes with a number of laboratory techniques measuring chloride concentrations, resulting in a spuriously elevated chloride, or pseudohyperchloremia. Because the measured sodium and bicarbonate concentrations will remain unchanged, this falsely elevated chloride measurement will result in a negative AG.
What causes the falsely elevated chloride?
All of the current laboratory techniques for measurement of serum chloride concentration can potentially result in a falsely elevated value. However, the degree of pseudohyperchloremia will depend on the specific assay used for measurement. The ion-selective electrode method used by many common laboratory analyzers appears to have the greatest interference on chloride measurement in the presence of bromide. This is simply due to the molecular similarity of bromide and chloride. Conversely, the coulometry method, often used as a reference standard, has the least interference of current laboratory methods.3 This is because coulometry does not completely rely on molecular structure to measure concentration, but rather it measures the amount of energy produced or consumed in an electrolysis reaction. Iodide, another halide compound, has also been described as a cause of pseudohyperchloremia, whereas fluoride does not seem to have significant interference.4
How are patients exposed to bromide salts?
Bromide salts, specifically sodium bromide, are infrequently used to treat seizure disorders, but are generally reserved for patients with epilepsy refractory to other, less toxic anticonvulsant medications. During the era when bromide salts were more commonly used to treat epilepsy, bromide intoxication, or bromism, was frequently observed.
Bromism may manifest as a constellation of nonspecific neurological and psychiatric symptoms. These most commonly include headache, weakness, agitation, confusion, and hallucinations. In more severe cases of bromism, stupor and coma may occur.3,5
Although bromide salts are no longer commonly prescribed, a number of products still contain brominated ingredients. Symptoms of bromide intoxication can occur with chronic use of a cough syrup containing dextromethorphan hydrobromide as well as the brominated vegetable oils found in some soft drinks.5
How is bromism treated?
The treatment of bromism involves preventing further exposure to bromide and promoting bromide excretion. Bromide has a long half-life (10-12 days), and in patients with normal renal function, it is possible to reduce this half-life to approximately 3 days with hydration and diuresis with sodium chloride.3 Alternatively, in patients with impaired renal function or severe intoxication, hemodialysis has been used effectively.5
Case Conclusion
The patient was admitted for observation and treated with intravenous sodium chloride. After consultation with his neurologist, he was discharged home in the care of his parents, who were advised to continue him on sodium bromide 185 mg orally twice daily since his seizures were refractory to other anticonvulsant medications.
Dr Repplinger is a medical toxicology fellow in the department of emergency medicine at New York University Langone Medical Center. Dr Nelson, editor of “Case Studies in Toxicology,” is a professor in the department of emergency medicine and director of the medical toxicology fellowship program at the New York University School of Medicine and the New York City Poison Control Center. He is also associate editor, toxicology, of the EMERGENCY MEDICINE editorial board.
- Emmett M, Narins RG. Clinical use of the anion gap. Medicine (Baltimore). 1977;56(1):38-54.
- Figge J, Jabor A, Kazda A, Fencl V. Anion gap and hypoalbuminemia. Crit Care Med. 1998;26(11):1807-1810.
- Vasuyattakul S, Lertpattanasuwan N, Vareesangthip K, Nimmannit S, Nilwarangkur S. A negative aniongap as a clue to diagnose bromide intoxication.Nephron. 1995;69(3):311-313.
- Yamamoto K, Kobayashi H, Kobayashi T, MurakamiS. False hyperchloremia in bromism. J Anesth.1991;5(1):88-91.
- Ng YY, Lin WL, Chen TW. Spurious hyperchloremiaand decreased anion gap in a patient with dextromethorphan bromide. Am J Nephrol. 1992;12(4):268-270.

Malpractice Counsel
Sepsis Following Vaginal Hysterectomy
| A 45-year-old woman presented to the ED complaining of lower abdominal pain, which she described as gradual, aching, and intermittent. The patient stated that she had undergone a vaginal hysterectomy a few days prior and that the pain started less than 24 hours after discharge from the hospital. She denied fever or chills, nausea, or vomiting, and said that she had a bowel movement earlier that day. She also denied any urinary symptoms. Her medical history was significant only for hypothyroidism, for which she was taking levothyroxine. The patient denied cigarette smoking or alcohol consumption. She said she had been taking acetaminophen-hydrocodone for postoperative pain, but that it did not provide any relief. |
The patient’s vital signs were: temperature, 98.6˚F; blood pressure, 112/65 mm Hg; heart rate, 98 beats/minute; and respiratory rate, 20 breaths/minute. The head, eyes, ears, nose, and throat examination was normal, as were the heart and lung examinations. The patient’s abdomen was soft, with mild diffuse lower abdominal tenderness. There was no guarding, rebound, or mass present. A gross nonspeculum examination of the vaginal area did not reveal any discharge or erythema; a rectal examination was not performed.
The EP ordered a complete blood count (CBC), lipase evaluation, and urinalysis. All test results were normal. The emergency physician (EP) then contacted the obstetrician-gynecologist (OB/GYN) who had performed the hysterectomy. The OB/GYN recommended the EP change the analgesic agent to acetaminophen-oxycodone and to encourage the patient to keep her follow-up postoperative appointment in 1 week. The EP followed these instructions and discharged the patient home with a prescription for the new analgesic.
Three days later, however, the patient presented back to the same ED complaining of increased and now generalized abdominal pain, nausea, and vomiting. She was noted to be febrile, tachycardic, and hypotensive. On physical examination, her abdomen was diffusely tender with guarding and rebound. She was given a 2-L bolus of intravenous (IV) normal saline and started on broad spectrum IV antibiotics. After another consultation with the patient’s OB/GYN surgeon, the patient was taken immediately to the operating room. On exploration, she was found to have a segment of perforated bowel and peritonitis. A portion of the bowel was resected, but her postoperative course was complicated by sepsis. After a 1-month stay in the hospital, she was discharged home.

The patient sued the EP—but not her OB/GYN—for failure to obtain a CT scan of the abdomen/pelvis on her initial ED visit, or at least to admit her to the hospital for observation. The EP argued that even if a computed tomography (CT) scan had been performed on the initial visit, it probably would have been normal, since the bowel had not yet perforated. After trial, a defense verdict was returned.
Discussion
This case illustrates two important points. First, not every patient with abdominal pain requires a CT scan of the abdomen/pelvis. So many malpractice cases against EPs involve the failure to perform advanced imaging. Unfortunately, that is usually only through the benefit of hindsight. For a patient with mild abdominal pain, only minimal tenderness on examination, and a negative laboratory workup, it can be perfectly appropriate to treat him or her symptomatically with close follow-up and specific instructions to return to the ED if his or her condition worsens (as was the case with this patient).
The second important point is to not over-rely on a consultant(s), especially if she or he has not independently examined the patient. When calling a consultant, it is best to have a specific question (ie, “Can you see the patient in the morning?”) or action (ie, “I would like to admit the patient to your service”). In general, the EP should not rely on the consultant to give “permission” to discharge the patient. As the physician seeing the patient, the EP is the most well-equipped to work up the patient and determine the needed disposition. Rare is the consultant that can arrive at a better disposition than the EP who performed the history and physical examination on the patient.
Regarding the patient’s GYN surgery, vaginal hysterectomy (VH) is preferred over abdominal hysterectomy (AH) for benign disease as it is associated with reduced infective morbidity and earlier return to normal activities.1 With respect to postoperative events, clinicians typically employ the Clavien-Dindo grading system for the classification of surgical complications.2 The system consists of five grades, ranging from Grade I (any deviation from normal postoperative course, without the need for pharmacological intervention) to Grade V (death).
Following hysterectomy, postoperative urinary or pelvic infections are not uncommon, with an incidence of 15% to 20%.1 In the Clavien-Dindo system, these complications would typically be considered Grade II (pharmacological treatment other than what is considered an acceptable therapeutic regimen), requiring antibiotics and no surgical intervention. Grade III complications, however, usually involve postoperative issues that require surgical, endoscopic, or radiological intervention, which in VH would include ureteral, bladder, or bowel injury.1 In a study by Gendy et al,1 the incidence of such complications posthysterectomy, ranged from 1.7% to 5.7%. So while not extremely common, serious complications can occur postoperatively.
The last point is a minor one, but a truth every EP needs to remember: While it may be difficult for a patient to sue her or his own physician, especially one with whom she or he has a longstanding patient-physician relationship, it is much easier for her or him to place blame upon and sue another physician—for example, the EP.
Missed Testicular Torsion?
| A 14-year-old boy presented to the ED with a several day history of abdominal pain with radiation to the right testicle. The patient denied any nausea, vomiting, or changes in bowel habits. He also denied any genitourinary symptoms, including dysuria or urinary frequency. The boy was otherwise in good health, on no medications, and up to date on his immunizations. |
The patient was a well appearing teenager in no acute distress. All vital signs were normal, as were the heart and lung examinations. The abdominal examination revealed mild, generalized tenderness without guarding or rebound. The genitalia examination was normal.
The EP ordered a CBC, urinalysis, and a testicular ultrasound, the results of which were all normal. The patient was discharged home with instructions to follow up with his pediatrician in 2 days and to return to the ED if his symptoms worsened.
The patient was seen by his pediatrician approximately 1 month later for his scheduled annual physical examination. The pediatrician, who was aware of the boy’s prior ED visit, found the patient in good health, and performed no additional testing.
Approximately 9 months after the initial ED visit, the patient was accidently kicked in the groin while jumping on a trampoline. He experienced immediate onset of severe, excruciating right testicular pain and presented to the ED approximately 24 hours later with continued pain and swelling. A testicular ultrasound was immediately ordered and demonstrated an enlarged right testicle due to torsion.
The patient underwent surgery to remove the right testicle. His family sued the EP and hospital from the initial visit (9 months earlier) for missed intermittent testicular torsion. They argued that the patient should have been referred to a urologist for further evaluation. In addition, the plaintiff claimed he could no longer participate in sports and suffered disfigurement as a result of the surgery. The EP asserted that the patient’s pain during that initial visit was primarily abdominal in nature and that an ultrasound of the testicles was normal, and did not reveal any evidence of testicular torsion. The EP further argued that the testicular torsion was due to the trauma incurred on the trampoline. According to published accounts, a defense verdict was returned.
Discussion
Testicular torsion occurs in a bimodal age distribution—during the first year of life (perinatal) and between ages 13 and 16 years (as was the case with this patient).1 In approximately 4% to 8% of patients, there is a history of an athletic event, strenuous physical activity, or trauma just prior to the onset of scrotal pain.2
Patients typically present with sudden onset of testicular pain that is frequently associated with nausea and vomiting. However, this condition can present with only lower abdominal pain—in part be due to the fact that adolescents and children may be reluctant to complain of testicular or scrotal pain out of fear or embarrassment.1 In all cases, a genital examination should be performed on every adolescent male with a chief complaint of lower abdominal pain.3
On physical examination, the patient will usually have a swollen tender testicle. In comparison to the opposite side, the affected testicle is frequently raised and rests on a horizontal axis. The cremasteric reflex (ie, scratching the proximal inner thigh causes the ipsilateral testicle to rise) is frequently absent.4
Because of the time sensitive nature of the disease process, in classic presentations, a urologist should be immediately consulted. Ischemic changes to the testicle can begin within hours, and complete testicular atrophy occurs after 24 hours in most cases.4 Detorsion within 6 hours of onset of symptoms has a salvage rate of 90% to 100%, which drops to 25% to 50% after 12 hours and to less than 10% after 24 hours.4
For less obvious cases, color duplex testicular ultrasonography can be very helpful. Demonstration of decreased or absent blood flow is diagnostic and requires operative intervention. If untwisting the testis restores blood flow, then the condition is resolved; if this procedure fails, the testis is removed. Regardless of the outcome, the contralateral testis is fixed to prevent future torsion.
Intermittent testicular torsion is a difficult diagnosis to make. A history of recurrent unilateral scrotal pain is highly suspicious and warrants referral to a urologist. This patient had only one previous episode, which was primarily abdominal pain—not scrotal or testicular pain.
In this case, it appears the jury came to the correct decision. Given the patient had only one previous episode of abdominal pain, and an inciting event (trauma to the testicle) on the second presentation, this does not appear to be a case of missed intermittent testicular torsion. Rather, this was a correctly diagnosed testicular torsion with a delayed presentation, resulting in an unsalvageable testicle.
Reference - Sepsis Following Vaginal Hysterectomy
- Gendy R, Walsh CA, Walsh SR, Karantanis E. Vaginal hysterectomy versus total laparoscopic hysterectomy for benign disease: a metaanalysis of randomized controlled trials. Am J Obstet Gynecol. 2011;204(5):388.e1-8.
- Clavien PA, Barkun J, de Oliveira ML, et al. The Clavien-Dindo classification of surgical complications: five-year experience. Ann Surg. 2009:250(2):187-196.
Reference - Missed Testicular Torsion?
- Pogorelić Z, Mrklić I, Jurić I. Do not forget to include testicular torsion in differential diagnosis of lower acute abdominal pain in young males. J Pediatr Urol. 2013;9(6 Pt B):1161-1165.
- Nicks BA, Manthey DE. Male genital problems. In: Tintinalli JE, Stapczynski JS, Ma OJ, Cine DM, Cydulka RK, Meckler GD, eds. Tintinalli’s Emergency Medicine: A Comprehensive Study Guide. 7th ed. New York: McGraw-Hill Medical; 2011:649.
- Lopez RN, Beasley SW. Testicular torsion: potential pitfalls in its diagnosis and management. J Paediatr Child Health. 2012;48(2):E30-E32.
- Somani BK, Watson G, Townell N. Testicular torsion. BMJ. 2010;341:c3213.
Sepsis Following Vaginal Hysterectomy
| A 45-year-old woman presented to the ED complaining of lower abdominal pain, which she described as gradual, aching, and intermittent. The patient stated that she had undergone a vaginal hysterectomy a few days prior and that the pain started less than 24 hours after discharge from the hospital. She denied fever or chills, nausea, or vomiting, and said that she had a bowel movement earlier that day. She also denied any urinary symptoms. Her medical history was significant only for hypothyroidism, for which she was taking levothyroxine. The patient denied cigarette smoking or alcohol consumption. She said she had been taking acetaminophen-hydrocodone for postoperative pain, but that it did not provide any relief. |
The patient’s vital signs were: temperature, 98.6˚F; blood pressure, 112/65 mm Hg; heart rate, 98 beats/minute; and respiratory rate, 20 breaths/minute. The head, eyes, ears, nose, and throat examination was normal, as were the heart and lung examinations. The patient’s abdomen was soft, with mild diffuse lower abdominal tenderness. There was no guarding, rebound, or mass present. A gross nonspeculum examination of the vaginal area did not reveal any discharge or erythema; a rectal examination was not performed.
The EP ordered a complete blood count (CBC), lipase evaluation, and urinalysis. All test results were normal. The emergency physician (EP) then contacted the obstetrician-gynecologist (OB/GYN) who had performed the hysterectomy. The OB/GYN recommended the EP change the analgesic agent to acetaminophen-oxycodone and to encourage the patient to keep her follow-up postoperative appointment in 1 week. The EP followed these instructions and discharged the patient home with a prescription for the new analgesic.
Three days later, however, the patient presented back to the same ED complaining of increased and now generalized abdominal pain, nausea, and vomiting. She was noted to be febrile, tachycardic, and hypotensive. On physical examination, her abdomen was diffusely tender with guarding and rebound. She was given a 2-L bolus of intravenous (IV) normal saline and started on broad spectrum IV antibiotics. After another consultation with the patient’s OB/GYN surgeon, the patient was taken immediately to the operating room. On exploration, she was found to have a segment of perforated bowel and peritonitis. A portion of the bowel was resected, but her postoperative course was complicated by sepsis. After a 1-month stay in the hospital, she was discharged home.
The patient sued the EP—but not her OB/GYN—for failure to obtain a CT scan of the abdomen/pelvis on her initial ED visit, or at least to admit her to the hospital for observation. The EP argued that even if a computed tomography (CT) scan had been performed on the initial visit, it probably would have been normal, since the bowel had not yet perforated. After trial, a defense verdict was returned.
Discussion
This case illustrates two important points. First, not every patient with abdominal pain requires a CT scan of the abdomen/pelvis. So many malpractice cases against EPs involve the failure to perform advanced imaging. Unfortunately, that is usually only through the benefit of hindsight. For a patient with mild abdominal pain, only minimal tenderness on examination, and a negative laboratory workup, it can be perfectly appropriate to treat him or her symptomatically with close follow-up and specific instructions to return to the ED if his or her condition worsens (as was the case with this patient).
The second important point is to not over-rely on a consultant(s), especially if she or he has not independently examined the patient. When calling a consultant, it is best to have a specific question (ie, “Can you see the patient in the morning?”) or action (ie, “I would like to admit the patient to your service”). In general, the EP should not rely on the consultant to give “permission” to discharge the patient. As the physician seeing the patient, the EP is the most well-equipped to work up the patient and determine the needed disposition. Rare is the consultant that can arrive at a better disposition than the EP who performed the history and physical examination on the patient.
Regarding the patient’s GYN surgery, vaginal hysterectomy (VH) is preferred over abdominal hysterectomy (AH) for benign disease as it is associated with reduced infective morbidity and earlier return to normal activities.1 With respect to postoperative events, clinicians typically employ the Clavien-Dindo grading system for the classification of surgical complications.2 The system consists of five grades, ranging from Grade I (any deviation from normal postoperative course, without the need for pharmacological intervention) to Grade V (death).
Following hysterectomy, postoperative urinary or pelvic infections are not uncommon, with an incidence of 15% to 20%.1 In the Clavien-Dindo system, these complications would typically be considered Grade II (pharmacological treatment other than what is considered an acceptable therapeutic regimen), requiring antibiotics and no surgical intervention. Grade III complications, however, usually involve postoperative issues that require surgical, endoscopic, or radiological intervention, which in VH would include ureteral, bladder, or bowel injury.1 In a study by Gendy et al,1 the incidence of such complications posthysterectomy, ranged from 1.7% to 5.7%. So while not extremely common, serious complications can occur postoperatively.
The last point is a minor one, but a truth every EP needs to remember: While it may be difficult for a patient to sue her or his own physician, especially one with whom she or he has a longstanding patient-physician relationship, it is much easier for her or him to place blame upon and sue another physician—for example, the EP.
Missed Testicular Torsion?
| A 14-year-old boy presented to the ED with a several day history of abdominal pain with radiation to the right testicle. The patient denied any nausea, vomiting, or changes in bowel habits. He also denied any genitourinary symptoms, including dysuria or urinary frequency. The boy was otherwise in good health, on no medications, and up to date on his immunizations. |
The patient was a well appearing teenager in no acute distress. All vital signs were normal, as were the heart and lung examinations. The abdominal examination revealed mild, generalized tenderness without guarding or rebound. The genitalia examination was normal.
The EP ordered a CBC, urinalysis, and a testicular ultrasound, the results of which were all normal. The patient was discharged home with instructions to follow up with his pediatrician in 2 days and to return to the ED if his symptoms worsened.
The patient was seen by his pediatrician approximately 1 month later for his scheduled annual physical examination. The pediatrician, who was aware of the boy’s prior ED visit, found the patient in good health, and performed no additional testing.
Approximately 9 months after the initial ED visit, the patient was accidently kicked in the groin while jumping on a trampoline. He experienced immediate onset of severe, excruciating right testicular pain and presented to the ED approximately 24 hours later with continued pain and swelling. A testicular ultrasound was immediately ordered and demonstrated an enlarged right testicle due to torsion.
The patient underwent surgery to remove the right testicle. His family sued the EP and hospital from the initial visit (9 months earlier) for missed intermittent testicular torsion. They argued that the patient should have been referred to a urologist for further evaluation. In addition, the plaintiff claimed he could no longer participate in sports and suffered disfigurement as a result of the surgery. The EP asserted that the patient’s pain during that initial visit was primarily abdominal in nature and that an ultrasound of the testicles was normal, and did not reveal any evidence of testicular torsion. The EP further argued that the testicular torsion was due to the trauma incurred on the trampoline. According to published accounts, a defense verdict was returned.
Discussion
Testicular torsion occurs in a bimodal age distribution—during the first year of life (perinatal) and between ages 13 and 16 years (as was the case with this patient).1 In approximately 4% to 8% of patients, there is a history of an athletic event, strenuous physical activity, or trauma just prior to the onset of scrotal pain.2
Patients typically present with sudden onset of testicular pain that is frequently associated with nausea and vomiting. However, this condition can present with only lower abdominal pain—in part be due to the fact that adolescents and children may be reluctant to complain of testicular or scrotal pain out of fear or embarrassment.1 In all cases, a genital examination should be performed on every adolescent male with a chief complaint of lower abdominal pain.3
On physical examination, the patient will usually have a swollen tender testicle. In comparison to the opposite side, the affected testicle is frequently raised and rests on a horizontal axis. The cremasteric reflex (ie, scratching the proximal inner thigh causes the ipsilateral testicle to rise) is frequently absent.4
Because of the time sensitive nature of the disease process, in classic presentations, a urologist should be immediately consulted. Ischemic changes to the testicle can begin within hours, and complete testicular atrophy occurs after 24 hours in most cases.4 Detorsion within 6 hours of onset of symptoms has a salvage rate of 90% to 100%, which drops to 25% to 50% after 12 hours and to less than 10% after 24 hours.4
For less obvious cases, color duplex testicular ultrasonography can be very helpful. Demonstration of decreased or absent blood flow is diagnostic and requires operative intervention. If untwisting the testis restores blood flow, then the condition is resolved; if this procedure fails, the testis is removed. Regardless of the outcome, the contralateral testis is fixed to prevent future torsion.
Intermittent testicular torsion is a difficult diagnosis to make. A history of recurrent unilateral scrotal pain is highly suspicious and warrants referral to a urologist. This patient had only one previous episode, which was primarily abdominal pain—not scrotal or testicular pain.
In this case, it appears the jury came to the correct decision. Given the patient had only one previous episode of abdominal pain, and an inciting event (trauma to the testicle) on the second presentation, this does not appear to be a case of missed intermittent testicular torsion. Rather, this was a correctly diagnosed testicular torsion with a delayed presentation, resulting in an unsalvageable testicle.
Reference - Sepsis Following Vaginal Hysterectomy
- Gendy R, Walsh CA, Walsh SR, Karantanis E. Vaginal hysterectomy versus total laparoscopic hysterectomy for benign disease: a metaanalysis of randomized controlled trials. Am J Obstet Gynecol. 2011;204(5):388.e1-8.
- Clavien PA, Barkun J, de Oliveira ML, et al. The Clavien-Dindo classification of surgical complications: five-year experience. Ann Surg. 2009:250(2):187-196.
Reference - Missed Testicular Torsion?
- Pogorelić Z, Mrklić I, Jurić I. Do not forget to include testicular torsion in differential diagnosis of lower acute abdominal pain in young males. J Pediatr Urol. 2013;9(6 Pt B):1161-1165.
- Nicks BA, Manthey DE. Male genital problems. In: Tintinalli JE, Stapczynski JS, Ma OJ, Cine DM, Cydulka RK, Meckler GD, eds. Tintinalli’s Emergency Medicine: A Comprehensive Study Guide. 7th ed. New York: McGraw-Hill Medical; 2011:649.
- Lopez RN, Beasley SW. Testicular torsion: potential pitfalls in its diagnosis and management. J Paediatr Child Health. 2012;48(2):E30-E32.
- Somani BK, Watson G, Townell N. Testicular torsion. BMJ. 2010;341:c3213.