User login
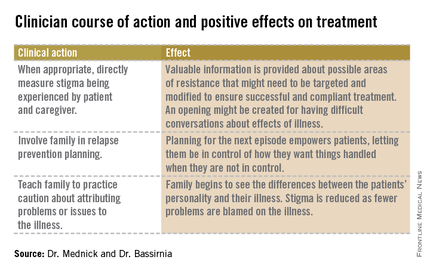
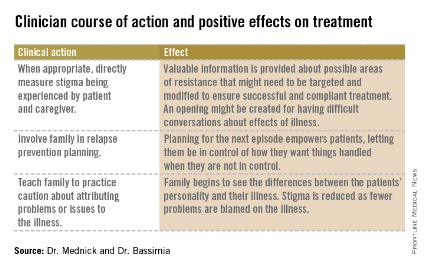
Four questions address stigma
Naomi is a 61-year-old woman who has lived with bipolar disorder and its stigma for 30 years. After a major manic episode and hospitalization, she entered into family treatment at the urging of her three daughters. Previously, her husband had been the primary force in guiding her psychiatric care, and she had been in treatment with a psychiatrist who is his professional colleague.
The patient’s first depressive episode began in the postpartum period, but she did not seek help at that time because she thought that her feelings were normal for a new mother. She did not receive any psychiatric attention until she cycled into mania and called the police for fear her child was being poisoned by neighbors. Her most recent manic episode occurred after she stopped her medications because of concerns about side effects. She was too embarrassed to tell her husband or doctor. She routinely fails to tell her other medical doctors that she is on mood stabilizers, because she does not want them to know she has bipolar disorder.
As Naomi recovers from the most recent manic episode and settles into family treatment, she is struggling with the consequences of her actions to her family. In family therapy in the past, her husband has revealed his belief that he has been protecting the family from Naomi’s mania and protecting Naomi from "embarrassing herself." This is difficult for Naomi to hear as she has always prided herself on being a good mother and protecting her daughters. Naomi’s situation illustrates the difficulty of coping with a diagnosis of bipolar disorder, the consequences of the illness on the family, and the importance of addressing stigma.
How stigma gets in the way
As discussed previously by Dr. Alison M. Heru ("Mental illness stigma is a family affair," Clinical Psychiatry News, April 2014, p. 8), stigma, when internalized or self-directed, can lead to psychological distress, decreased self-esteem and life satisfaction, and increased depression and suicidality (Compr. Psychiatry 2010;51:603-6). Close family members of those with mental disorders are affected by stigma, commonly referred to as "stigma by association" or "courtesy stigma."
Up to 92% of caregivers of people with psychiatric disorders have reported internalized stigma (J. Psychiatr. Ment. Health Nurs. 2012;19:665-71). These family members become distant and avoidant, resulting in a reduced quality of life and an impaired ability to provide critical support for their loved ones. Caregiver anxiety is inversely related to patient anxiety, stigma, and poor alliance (J. Nerv. Ment. Disease 2011;199:18-24).
As a result of these factors, while people with psychiatric disorders have to cope with their own mental illness as well as the public and self-stigma that alienate them from society, they also are at risk of losing their family connections.
In order to confront stigma, the Family Center for Bipolar Disorder in New York City, for example, uses a Family Inclusive Treatment (FIT) model. The FIT model includes an engagement period at the initiation of treatment that is focused on psychoeducation and relapse prevention planning. FIT is unique in that every patient is required to sign a release of information giving permission for full, open communication at all times between the patient’s clinician and a treatment partner of their choice. After the initial engagement period, there are quarterly family visits to supplement regular individual treatment sessions. FIT treatment promotes open communication about symptoms and medications. FIT strives to minimize patient isolation from families; they can talk openly with one another and their clinician.

After seeing many families enter treatment, FIT staff noticed the prominence of stigma.
We have begun to ask about stigma directly. Do people with more stigma do worse in treatment? Do they adhere more poorly to treatment? Do their families tend to become less involved over time? To begin, Dr. Mednick and staff examined demographic data looking for factors that might predispose a person to experience increased stigma.
In terms of diagnosis, people with more internalizing disorders such as depression and anxiety disorders tend to experience more stigma. Distress is experienced internally. As Dr. Bassirnia and her colleagues wrote in a poster presented at the recent American Psychiatric Association meeting, people with externalizing disorders, such as substance abuse and antisocial disorders, are more likely to express their distress outwardly and are less likely to suffer from stigma ("The relationship between personality traits and perceived internalized stigma in bipolar patients and their caregivers," 2014).
Meanwhile, two systematic review studies have reported moderate to high levels of internalized stigma in people with bipolar disorder. In these studies, a higher level of internalized stigma had a negative correlation with self-esteem, social adjustment, and perceived social support, and positive correlation with severity of symptoms, functional impairment, and rehospitalization. In spite of having more severe symptoms; people with higher levels of self-stigma are less likely to seek professional help and adhere to their treatment. Stigma by association and its negative consequences in caregivers of people with mental disorders also have been reported (J. Affect. Disord. 2013;150:181-91).
A useful and easy to administer scale that helps to identify stigma is the "Perceived Criticism Scale" (J. Abnorm. Psychol. 1989;98:225-35). By asking four questions, the clinician can get a good sense of family dynamics and can monitor the progress and change over time. The questions rate perception on a scale of 1-10, where "X" is the other person involved in treatment, either patient or caregiver. Here are the questions:
1. How critical do you think you are of X?
2. How critical do you think X is of you?
3. When X criticizes you, how upset do you get?
4. When you criticize X, how upset does he/she get?
For families with high scores, follow-up is needed. The Internalized Stigma of Mental Illness (ISMI) scale (Psychiatry Res. 2003;121:31-49) can be used. The ISMI scale makes statements about stigma for which participants rate their agreement on a Likert scale, such as:
• I don’t talk about myself much because I don’t want to burden others with my mental illness.
• Being around people who don’t have a mental illness makes me feel out of place or inadequate.
• People can tell that I have a mental illness by the way I look.
• Mentally ill people tend to be violent.
• I feel out of place in the world because I have a mental illness.
The ISMI scale contains 29 short, simple statements like the ones above and can be completed in less than 10 minutes. The statements are designed to avoid hypothetical situations, stay focused in the present, and address the participant’s own identity and experience.
Using the tools in practice
Naomi entered family treatment with her husband and daughters. Using the ISMI to measure the stigma of mental illness that each family member was experiencing, Naomi was shocked to see that her daughters felt far less stigma about having a mother with mental illness than she had assumed. In turn, her daughters were shocked at how much stigma Naomi was experiencing. Naomi’s husband scored between them. This data paved the way for an open family conversation about how Naomi’s illness had affected their lives, and especially how Naomi’s husband and his perceptions of her illness had affected her treatment course.
Caregivers play a very important role in bipolar disorder. After all, the illness can lead to difficulty functioning and can threaten the family’s stability. Sometimes caregivers can serve as a source of strength and a beacon of stability in the occasional storm. It is hard for the family between the storms, when the same flashing beacon can be a constant reminder to the patient of their illness. Often, well intentioned concerns become constant checking up, making the patient feel stigmatized and expected to fail.
"Good" caregivers will be aware of the stigma and the impact it has on their loved one and on themselves, without becoming a source of stigma.
Dr. Mednick is an attending psychiatrist at the Family Center for Bipolar at Mount Sinai Beth Israel in New York City. Dr. Bassirnia is a second-year psychiatry resident at Mount Sinai Beth Israel. Scan the QR code to read more Families in Psychiatry columns at clinicalpsychiatrynews.com.
Naomi is a 61-year-old woman who has lived with bipolar disorder and its stigma for 30 years. After a major manic episode and hospitalization, she entered into family treatment at the urging of her three daughters. Previously, her husband had been the primary force in guiding her psychiatric care, and she had been in treatment with a psychiatrist who is his professional colleague.
The patient’s first depressive episode began in the postpartum period, but she did not seek help at that time because she thought that her feelings were normal for a new mother. She did not receive any psychiatric attention until she cycled into mania and called the police for fear her child was being poisoned by neighbors. Her most recent manic episode occurred after she stopped her medications because of concerns about side effects. She was too embarrassed to tell her husband or doctor. She routinely fails to tell her other medical doctors that she is on mood stabilizers, because she does not want them to know she has bipolar disorder.
As Naomi recovers from the most recent manic episode and settles into family treatment, she is struggling with the consequences of her actions to her family. In family therapy in the past, her husband has revealed his belief that he has been protecting the family from Naomi’s mania and protecting Naomi from "embarrassing herself." This is difficult for Naomi to hear as she has always prided herself on being a good mother and protecting her daughters. Naomi’s situation illustrates the difficulty of coping with a diagnosis of bipolar disorder, the consequences of the illness on the family, and the importance of addressing stigma.
How stigma gets in the way
As discussed previously by Dr. Alison M. Heru ("Mental illness stigma is a family affair," Clinical Psychiatry News, April 2014, p. 8), stigma, when internalized or self-directed, can lead to psychological distress, decreased self-esteem and life satisfaction, and increased depression and suicidality (Compr. Psychiatry 2010;51:603-6). Close family members of those with mental disorders are affected by stigma, commonly referred to as "stigma by association" or "courtesy stigma."
Up to 92% of caregivers of people with psychiatric disorders have reported internalized stigma (J. Psychiatr. Ment. Health Nurs. 2012;19:665-71). These family members become distant and avoidant, resulting in a reduced quality of life and an impaired ability to provide critical support for their loved ones. Caregiver anxiety is inversely related to patient anxiety, stigma, and poor alliance (J. Nerv. Ment. Disease 2011;199:18-24).
As a result of these factors, while people with psychiatric disorders have to cope with their own mental illness as well as the public and self-stigma that alienate them from society, they also are at risk of losing their family connections.
In order to confront stigma, the Family Center for Bipolar Disorder in New York City, for example, uses a Family Inclusive Treatment (FIT) model. The FIT model includes an engagement period at the initiation of treatment that is focused on psychoeducation and relapse prevention planning. FIT is unique in that every patient is required to sign a release of information giving permission for full, open communication at all times between the patient’s clinician and a treatment partner of their choice. After the initial engagement period, there are quarterly family visits to supplement regular individual treatment sessions. FIT treatment promotes open communication about symptoms and medications. FIT strives to minimize patient isolation from families; they can talk openly with one another and their clinician.
After seeing many families enter treatment, FIT staff noticed the prominence of stigma.
We have begun to ask about stigma directly. Do people with more stigma do worse in treatment? Do they adhere more poorly to treatment? Do their families tend to become less involved over time? To begin, Dr. Mednick and staff examined demographic data looking for factors that might predispose a person to experience increased stigma.
In terms of diagnosis, people with more internalizing disorders such as depression and anxiety disorders tend to experience more stigma. Distress is experienced internally. As Dr. Bassirnia and her colleagues wrote in a poster presented at the recent American Psychiatric Association meeting, people with externalizing disorders, such as substance abuse and antisocial disorders, are more likely to express their distress outwardly and are less likely to suffer from stigma ("The relationship between personality traits and perceived internalized stigma in bipolar patients and their caregivers," 2014).
Meanwhile, two systematic review studies have reported moderate to high levels of internalized stigma in people with bipolar disorder. In these studies, a higher level of internalized stigma had a negative correlation with self-esteem, social adjustment, and perceived social support, and positive correlation with severity of symptoms, functional impairment, and rehospitalization. In spite of having more severe symptoms; people with higher levels of self-stigma are less likely to seek professional help and adhere to their treatment. Stigma by association and its negative consequences in caregivers of people with mental disorders also have been reported (J. Affect. Disord. 2013;150:181-91).
A useful and easy to administer scale that helps to identify stigma is the "Perceived Criticism Scale" (J. Abnorm. Psychol. 1989;98:225-35). By asking four questions, the clinician can get a good sense of family dynamics and can monitor the progress and change over time. The questions rate perception on a scale of 1-10, where "X" is the other person involved in treatment, either patient or caregiver. Here are the questions:
1. How critical do you think you are of X?
2. How critical do you think X is of you?
3. When X criticizes you, how upset do you get?
4. When you criticize X, how upset does he/she get?
For families with high scores, follow-up is needed. The Internalized Stigma of Mental Illness (ISMI) scale (Psychiatry Res. 2003;121:31-49) can be used. The ISMI scale makes statements about stigma for which participants rate their agreement on a Likert scale, such as:
• I don’t talk about myself much because I don’t want to burden others with my mental illness.
• Being around people who don’t have a mental illness makes me feel out of place or inadequate.
• People can tell that I have a mental illness by the way I look.
• Mentally ill people tend to be violent.
• I feel out of place in the world because I have a mental illness.
The ISMI scale contains 29 short, simple statements like the ones above and can be completed in less than 10 minutes. The statements are designed to avoid hypothetical situations, stay focused in the present, and address the participant’s own identity and experience.
Using the tools in practice
Naomi entered family treatment with her husband and daughters. Using the ISMI to measure the stigma of mental illness that each family member was experiencing, Naomi was shocked to see that her daughters felt far less stigma about having a mother with mental illness than she had assumed. In turn, her daughters were shocked at how much stigma Naomi was experiencing. Naomi’s husband scored between them. This data paved the way for an open family conversation about how Naomi’s illness had affected their lives, and especially how Naomi’s husband and his perceptions of her illness had affected her treatment course.
Caregivers play a very important role in bipolar disorder. After all, the illness can lead to difficulty functioning and can threaten the family’s stability. Sometimes caregivers can serve as a source of strength and a beacon of stability in the occasional storm. It is hard for the family between the storms, when the same flashing beacon can be a constant reminder to the patient of their illness. Often, well intentioned concerns become constant checking up, making the patient feel stigmatized and expected to fail.
"Good" caregivers will be aware of the stigma and the impact it has on their loved one and on themselves, without becoming a source of stigma.
Dr. Mednick is an attending psychiatrist at the Family Center for Bipolar at Mount Sinai Beth Israel in New York City. Dr. Bassirnia is a second-year psychiatry resident at Mount Sinai Beth Israel. Scan the QR code to read more Families in Psychiatry columns at clinicalpsychiatrynews.com.
Scientists’ success in job market is predictable, study suggests

Credit: Rhoda Baer
A scientist’s chances of landing a faculty position at an academic institution are predictable based solely on his or her publication record, according to a study published in Current Biology.
Chances depend mostly on the number of publications the scientist has, the impact factor of the journals in which those papers are published, and the number of papers that receive more citations than expected based on the journal in which they were published, the researchers said.
“We’d like to start a discussion on what factors are taken into account when people are selected to become a principal investigator,” said study author David van Dijk, PhD, of the Weizmann Institute of Science in Rehovot, Israel.
“On the one hand, these results are encouraging, because they suggest that people are promoted based on merit. On the other hand, many of the most groundbreaking papers were not published in high-impact-factor journals and did not initially receive a high number of citations. This filtering method will certainly miss some phenomenal and ahead-of-their time scientists.”
Dr Van Dijk said he and his colleagues were motivated by endless conversations with fellow graduate students and post docs, who were dreaming of their first paper in a prestigious journal. There was the sense that those publications were the tickets to success.
So Dr van Dijk and his colleagues wanted to see if they could find evidence to that effect. And, indeed, they could.
The researchers generated publication record data for more than 25,000 scientists and used a machine-learning approach to generate a model of each individual’s chances of moving from the first-author position, typically reserved for trainees, to the last-author position, a place most often held by principal investigators (PIs).
“We find that whether or not a scientist becomes a PI is largely predictable by their publication record, even taking into account only the first few years of publication,” the researchers reported. “Our model is able to predict with relatively high accuracy who becomes a PI and is also able to predict how long this will take.”
To calculate your own likelihood of success using this model, visit: http://www.pipredictor.com.
Dr Van Dijk said the study results suggest the current system is working. Understanding how it works might be useful for those thinking through their careers or for those on hiring committees who might like to allow factors outside of the publication record to factor more significantly in hiring decisions.
The authors don’t recommend that scientists make decisions about their futures based solely on their PI prediction scores, of course. There are surely plenty of other harder-to-quantify factors that can also play a role. And there is some hopeful news for those who are persistent, even if they haven’t landed that stellar paper just yet.
“There is an element of luck in getting a paper in Nature, Cell, or Science, so it can be frustrating if you think you are a good scientist and want to succeed, but that high-impact-factor paper just doesn’t happen,” Dr van Dijk said.
“It’s encouraging that we find that doing good-quality science on a consistent basis—as evidenced by multiple first-author papers of reasonable impact factor—does seem to be rewarded in the end.” ![]()
Impact of Pocket Ultrasound Use
Applications of point‐of‐care ultrasonography (POC‐US) have grown rapidly over the past 20 years. POC‐US training is required by the Accreditation Council for Graduate Medical Education for several graduate medical education training programs, including emergency medicine residency and pulmonary/critical care fellowships.[1] Recent efforts have examined the utility of ultrasound in the education of medical students[2] and the diagnostic and procedural applications performed by residents.[3] One powerful application of POC‐US is the use of lung ultrasound to diagnose causes of respiratory failure at the bedside.[4] Although lung ultrasound has been shown to have superior diagnostic accuracy to chest x‐rays,[5] limited availability of expert physicians and ultrasound equipment have presented barriers to wider application. The advent of lower cost pocket ultrasounds may present a solution given the early reports of similar efficacy to traditional devices in the assessment of left ventricular dysfunction, acute decompensated heart failure,[6] and focused assessment with sonography for trauma.[7] We assessed the feasibility and diagnostic accuracy of residents trained in lung ultrasound with a pocket device for evaluating patients with dyspnea.
MATERIALS AND METHODS
Study Design
We performed a prospective, observational study of internal medicine residents performing lung ultrasound with a pocket ultrasound from September 2012 to August 2013 at Beth Israel Medical Center, an 856‐bed teaching hospital in New York City. This study was approved by the Committee of Scientific Affairs of Beth Israel Medical Center, which waived the requirement for informed consent (institutional review board #016‐10). Ten pocket ultrasounds (Vscan; GE Vingmed Ultrasound, Horten, Norway) were acquired through an educational grant from General Electric Company. Grant sponsors were not involved in any aspect of the study.
Recruitment and Training
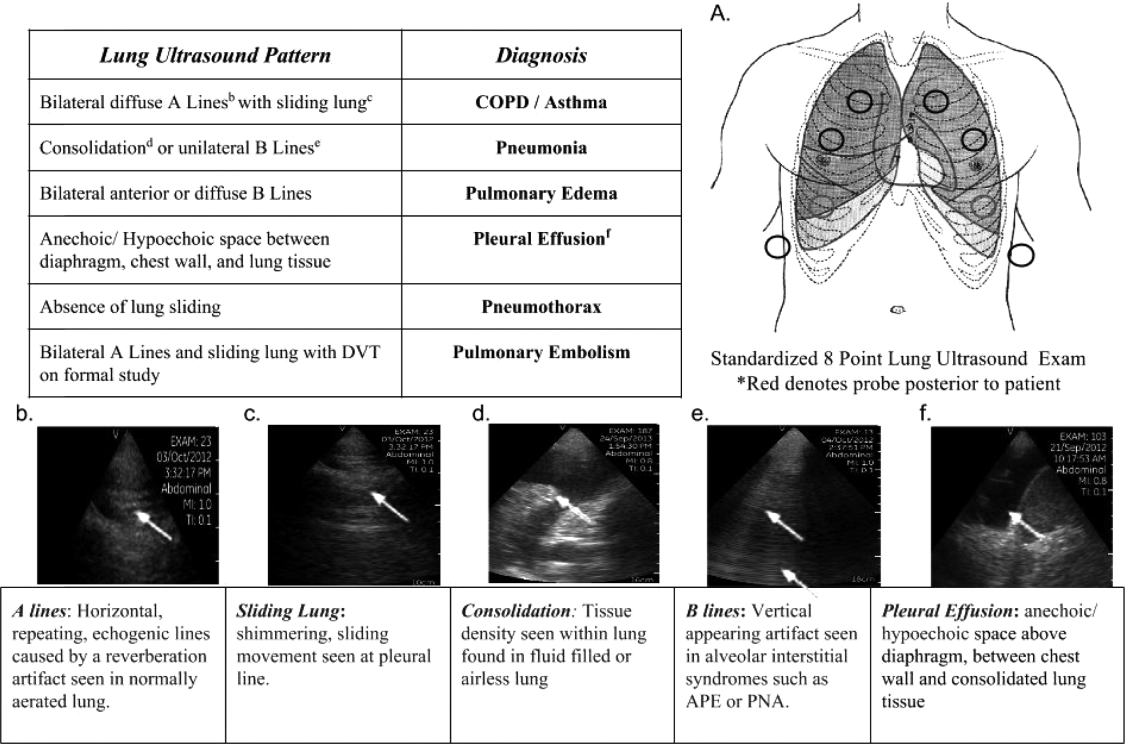
One hundred nineteen internal medicine residents were offered training on lung ultrasound in return for participating in the study. Initially, 10 residents from 3 postgraduate years with no previous lung ultrasound experience volunteered for the study and received a pocket ultrasound along with either focused or extended training. Focused and extended training groups both received 2 sessions of 90 minutes that included didactics covering image creation of the 5 main diagnostic lung ultrasound patterns and their pathological correlates. Sessions also included training in the operation of a pocket ultrasound along with bedside instruction in image acquisition using an 8‐point exam protocol (Figure 1A). All residents were required to demonstrate competency in this 8‐point protocol with proper image acquisition and interpretation of 3 lung ultrasound exams under direct supervision by an expert practitioner (P.K.). Only 5 residents completed the training due mostly to other commitments. Two extended training residents, both authors of this article, who plan to continue training in pulmonary and critical care medicine, volunteered for an additional 2‐week general critical care ultrasound elective. This elective included daily bedside supervised performance and interpretation of lung ultrasound patterns on at least 15 patients admitted during intensive care unit rounds.
Patient Selection
Patients admitted to a resident's service were considered for inclusion at their convenience if the patient reported a chief complaint of dyspnea.
Diagnostic Protocol
Upon admission, residents recorded a clinical diagnosis of dyspnea based on a standard diagnostic evaluation including complete history, physical exam, and all relevant laboratory and imaging studies, including chest x‐ray and computed tomography (CT) scans. A diagnosis of dyspnea after lung ultrasound was then recorded based on the lung ultrasound findings and integrated with all other clinical information available. Standard lung ultrasound patterns and diagnostic correlates are shown in Figure 1. Diagnoses of dyspnea were recorded as one of 7 possibilities; 1) exacerbation of chronic obstructive pulmonary disease or asthma (COPD/asthma), 2) acute pulmonary edema (APE), 3) pneumonia (PNA), 4) pulmonary embolus (PE), 5) pneumothorax (PTX), 6) pleural effusion (PLEFF), and 7) other (OTH), namely anemia, ascites, and dehydration.
Data Collection
Patient demographics, comorbidities, lung ultrasound findings, and both clinical and ultrasound diagnosis were recorded on a standardized form. A final diagnosis based on the attending physicians' diagnosis of dyspnea was determined through chart review by 3 investigators blinded to the clinical and ultrasound diagnoses. Discordant findings were resolved by consensus. Attending physicians were blinded to the lung ultrasound exam results.
Statistical Analysis
Sensitivity and specificity of the clinical and ultrasound diagnoses for focused and extended training groups were calculated for each diagnosis using final attending diagnosis as the gold standard. Causes of dyspnea were often deemed multifactorial, leading to more than 1 diagnosis recorded per patient exam. Overall diagnostic accuracy was calculated for each group using the reported clinical, ultrasound, and final diagnoses. Receiver operating curve (ROC) analysis was performed with Stata 12.1 (StataCorp, College Station, TX).
RESULTS
Five residents performed lung ultrasound on a convenience sample of 69 newly admitted patients. Patient baseline characteristics are shown in Table 1. Three residents made up the focused training group and examined 21 patients, resulting in 27 clinical diagnoses, 27 ultrasound diagnoses, and 31 final attending diagnoses. Two residents made up the extended training group and examined 48 patients, resulting in 61 clinical diagnoses, 60 ultrasound diagnoses, and 60 final attending diagnoses. Improvements in sensitivity and specificity using lung ultrasound were more pronounced for the extended training group and are shown for each diagnosis in Table 2.
| Age, y, mean | 69 |
|---|---|
| |
| Sex, male, % | 52.2 |
| BMI, mean, kg/m2 | 25.7 |
| Comorbidities, % | |
| COPD | 43.3 |
| CHF | 23.9 |
| Hypertension | 59.4 |
| Diabetes mellitus | 29 |
| Atrial fibrillation | 18.9 |
| DVT/PE | 1.5 |
| Lung cancer | 5.9 |
| Finding on admission, % | |
| CXR available | 94 |
| Chest CT available | 22.4 |
| WBC >10.4 K/L | 36.2 |
| BNP >400 pg/mL | 27.5 |
| Temperature >100.9F | 6 |
| Heart rate >90 bpm | 47.8 |
| Desaturation* | 32 |
| Focused Training Group | Extended Training Group | |||||||
|---|---|---|---|---|---|---|---|---|
| CLINDIAG, N=27 | USDIAG, N=27 | CLINDIAG, N=61 | USDIAG, N=20 | |||||
| Diagnosis | Sens, % | Spec, % | Sens, % | Spec, % | Sens, % | Spec, % | Sens, % | Spec, % |
| ||||||||
| COPD/asthma | 60 | 96 | 60 | 96 | 55 | 96 | 91 | 96 |
| Pneumonia | 45 | 90 | 36 | 100 | 93 | 88 | 96 | 100 |
| Pulmonary edema | 100 | 85 | 100 | 86 | 89 | 96 | 89 | 100 |
| Pleural effusion | 57 | 100 | 86 | 96 | 57 | 96 | 100 | 96 |
| Other | 50 | 100 | 75 | 96 | 80 | 96 | 80 | 100 |
Overall diagnostic accuracy using lung ultrasound improved only for the extended training group (clinical 92% vs ultrasound 97%), whereas the focused training group's accuracy was unchanged (clinical 87% vs ultrasound 88%).
ROC analysis demonstrated a superior diagnostic performance of ultrasound when compared to clinical diagnosis (Table 3).
| Diagnosis | CLINDIAG AUC, N=69 | USDIAG AUC, N=69 | P Value |
|---|---|---|---|
| |||
| COPD/asthma | 0.73 | 0.85 | 0.06 |
| Pulmonary edema | 0.85 | 0.89 | 0.49 |
| Pneumonia | 0.77 | 0.88 | 0.01 |
| Pleural effusion | 0.76 | 0.96 | 0.002 |
| Other* | 0.78 | 0.69 | 0.01 |
| All causes, n=69 | 0.81 | 0.87 | 0.01 |
DISCUSSION
In this prospective, observational study of residents performing lung ultrasound of patients with dyspnea, the diagnostic accuracy incorporating ultrasound increased compared to a standard diagnostic approach relying on history, physical exam, blood tests, and radiography. To our knowledge, this is the first study of residents independently performing lung ultrasound with a pocket ultrasound to diagnose dyspnea. Receiver operating curve analysis shows improvements in diagnostic accuracy for causes such as PNA, pleural effusion and COPD/asthma and demonstrates the feasibility and clinical utility of residents using pocket ultrasounds. The finding that improvements in sensitivity and specificity were larger in the extended training group highlights the need for sufficient training to demonstrate increased utility. Although a 2‐week critical care ultrasound elective may not be possible for all residents, perhaps training of intensity somewhere in between these 2 levels would be most feasible.
Challenges in diagnosing dyspnea have been well described, attributed to a lack of accurate history combined with often insensitive and nonspecific physical exam findings, blood tests, and radiographs.[8, 9] Further, patients often present with multiple contributing causes as was evidenced in this study.[10] Lack of initial, accurate diagnoses often leads to the provision of multiple, incorrect treatment regimens that may increase mortality.[11] The high accuracy of lung ultrasound in defining causes of respiratory failure suggests potential as a low‐cost solution.[12]
This study design differed from prior work in several respects. First, it included patients presenting with dyspnea to a hospital ward rather than acute respiratory failure to an intensive care unit (ICU), suggesting its diagnostic potential in a broader population of patients and settings. Second, the lung ultrasound was integrated with traditional clinical information rather than relied upon alone, a situation mimicking real‐world application of POC‐US. Third, operators were residents with limited amounts of training rather than highly trained experts. Finally, the lung ultrasound exams were performed using a pocket ultrasound with inferior imaging capability than larger, more established ultrasound devices. Despite these constraints, the utility of lung ultrasound was still evident, particularly in the diagnosis or exclusion of pneumonia and PLEFF.
Limitations include reliance on a small cohort of highly motivated residents with an interest in pulmonary and critical care, 2 who are authors of this article, making reproducibility a concern. Although convenience sampling may more closely mimic real world practices of POC‐US, a bias toward less challenging patients is possible and may limit conclusions regarding utility. Over‐reading and feedback were not provided to residents to improve their performance of lung ultrasound exams. Also, because chest CT is considered the gold standard in most studies examining the diagnostic accuracy of lung ultrasound, all residents aware of these data may underestimate the potential impact of integrating lung ultrasound with all clinical findings. Finally, the high cost of pocket ultrasounds is a barrier to general use. Recent studies on the significant cost savings associated with POC‐US make a further analysis of cost‐benefit ratios mandatory before broad use can be recommended.[13]
CONCLUSIONS
Residents participating in lung ultrasound training with a pocket ultrasound device showed improved diagnostic accuracy in their evaluation of patients with dyspnea. Those who received extended training had greater improvements across all causes of dyspnea. Training residents to apply lung ultrasound in non‐ICU settings appears to be feasible. Further study with a larger cohort of internal medicine residents and perhaps training duration that lies in between the focused and extended training groups is warranted.
Acknowledgements
The authors thank Dr. David Lucido for guidance on statistical analysis and Stephane Gatesoupe and the Vscan team at General Electric.
Disclosure: Ten Vscan pocket ultrasounds (General Electric) were provided free of cost solely for the purpose of conducting the clinical research study. This represented their sole participation in any stage of the research. The authors have no conflicts of interest to disclose.
- , , , . Barriers to ultrasound training in critical care medicine fellowships: a survey of program directors. Crit Care Med. 2010;38(10):1978–1983.
- , , , et al. Comparison of effectiveness of hand‐carried ultrasound to bedside cardiovascular physical examination. Am J Cardiol. 2005;96(7):1002–1006.
- , , . Diagnosing pulmonary edema: lung ultrasound versus chest radiography. Eur J Emerg Med. 2013;20(5):356–360.
- , . Relevance of lung ultrasound in the diagnosis of acute respiratory failure: the BLUE protocol. Chest. 2008;134(1):117–125.
- , , , et al. Lung ultrasound in the diagnosis and follow‐up of community‐acquired pneumonia: a prospective, multicenter, diagnostic accuracy study. Chest. 2012;142(4):965–972.
- , , , , , . Evaluation of a new pocket echoscopic device for focused cardiac ultrasonography in an emergency setting. Crit Care. 2012;16(3):R82.
- , , , . Our new stethoscope in the emergency department: handheld ultrasound. Ulus Travma Acil Cerrahi Derg. 2011;17(6):488–492.
- , , . Discriminating causes of dyspnea through clinical examination. J Gen Intern Med. 1993;8(7):383–392.
- , , . Does this patient have community‐acquired pneumonia? Diagnosing pneumonia by history and physical examination. JAMA. 1997;278(17):1440–1445.
- , , , et al. Acute respiratory failure in the elderly: etiology, emergency diagnosis and prognosis. Crit Care. 2006;10(3):R82.
- , , , et al. Early interventions in severe sepsis and septic shock: a review of the evidence one decade later. Minerva Anestesiol. 2012;78(6):712–724.
- , , , . Ultrasound diagnosis of alveolar consolidation in the critically ill. Intensive Care Med. 2004;30(2):276–281.
- , , , , , . Ultrasound assessment of pulmonary embolism in patients receiving computerized tomography pulmonary angiography. Chest. 2014;145(4):818–823.
Applications of point‐of‐care ultrasonography (POC‐US) have grown rapidly over the past 20 years. POC‐US training is required by the Accreditation Council for Graduate Medical Education for several graduate medical education training programs, including emergency medicine residency and pulmonary/critical care fellowships.[1] Recent efforts have examined the utility of ultrasound in the education of medical students[2] and the diagnostic and procedural applications performed by residents.[3] One powerful application of POC‐US is the use of lung ultrasound to diagnose causes of respiratory failure at the bedside.[4] Although lung ultrasound has been shown to have superior diagnostic accuracy to chest x‐rays,[5] limited availability of expert physicians and ultrasound equipment have presented barriers to wider application. The advent of lower cost pocket ultrasounds may present a solution given the early reports of similar efficacy to traditional devices in the assessment of left ventricular dysfunction, acute decompensated heart failure,[6] and focused assessment with sonography for trauma.[7] We assessed the feasibility and diagnostic accuracy of residents trained in lung ultrasound with a pocket device for evaluating patients with dyspnea.
MATERIALS AND METHODS
Study Design
We performed a prospective, observational study of internal medicine residents performing lung ultrasound with a pocket ultrasound from September 2012 to August 2013 at Beth Israel Medical Center, an 856‐bed teaching hospital in New York City. This study was approved by the Committee of Scientific Affairs of Beth Israel Medical Center, which waived the requirement for informed consent (institutional review board #016‐10). Ten pocket ultrasounds (Vscan; GE Vingmed Ultrasound, Horten, Norway) were acquired through an educational grant from General Electric Company. Grant sponsors were not involved in any aspect of the study.
Recruitment and Training
One hundred nineteen internal medicine residents were offered training on lung ultrasound in return for participating in the study. Initially, 10 residents from 3 postgraduate years with no previous lung ultrasound experience volunteered for the study and received a pocket ultrasound along with either focused or extended training. Focused and extended training groups both received 2 sessions of 90 minutes that included didactics covering image creation of the 5 main diagnostic lung ultrasound patterns and their pathological correlates. Sessions also included training in the operation of a pocket ultrasound along with bedside instruction in image acquisition using an 8‐point exam protocol (Figure 1A). All residents were required to demonstrate competency in this 8‐point protocol with proper image acquisition and interpretation of 3 lung ultrasound exams under direct supervision by an expert practitioner (P.K.). Only 5 residents completed the training due mostly to other commitments. Two extended training residents, both authors of this article, who plan to continue training in pulmonary and critical care medicine, volunteered for an additional 2‐week general critical care ultrasound elective. This elective included daily bedside supervised performance and interpretation of lung ultrasound patterns on at least 15 patients admitted during intensive care unit rounds.
Patient Selection
Patients admitted to a resident's service were considered for inclusion at their convenience if the patient reported a chief complaint of dyspnea.
Diagnostic Protocol
Upon admission, residents recorded a clinical diagnosis of dyspnea based on a standard diagnostic evaluation including complete history, physical exam, and all relevant laboratory and imaging studies, including chest x‐ray and computed tomography (CT) scans. A diagnosis of dyspnea after lung ultrasound was then recorded based on the lung ultrasound findings and integrated with all other clinical information available. Standard lung ultrasound patterns and diagnostic correlates are shown in Figure 1. Diagnoses of dyspnea were recorded as one of 7 possibilities; 1) exacerbation of chronic obstructive pulmonary disease or asthma (COPD/asthma), 2) acute pulmonary edema (APE), 3) pneumonia (PNA), 4) pulmonary embolus (PE), 5) pneumothorax (PTX), 6) pleural effusion (PLEFF), and 7) other (OTH), namely anemia, ascites, and dehydration.
Data Collection
Patient demographics, comorbidities, lung ultrasound findings, and both clinical and ultrasound diagnosis were recorded on a standardized form. A final diagnosis based on the attending physicians' diagnosis of dyspnea was determined through chart review by 3 investigators blinded to the clinical and ultrasound diagnoses. Discordant findings were resolved by consensus. Attending physicians were blinded to the lung ultrasound exam results.
Statistical Analysis
Sensitivity and specificity of the clinical and ultrasound diagnoses for focused and extended training groups were calculated for each diagnosis using final attending diagnosis as the gold standard. Causes of dyspnea were often deemed multifactorial, leading to more than 1 diagnosis recorded per patient exam. Overall diagnostic accuracy was calculated for each group using the reported clinical, ultrasound, and final diagnoses. Receiver operating curve (ROC) analysis was performed with Stata 12.1 (StataCorp, College Station, TX).
RESULTS
Five residents performed lung ultrasound on a convenience sample of 69 newly admitted patients. Patient baseline characteristics are shown in Table 1. Three residents made up the focused training group and examined 21 patients, resulting in 27 clinical diagnoses, 27 ultrasound diagnoses, and 31 final attending diagnoses. Two residents made up the extended training group and examined 48 patients, resulting in 61 clinical diagnoses, 60 ultrasound diagnoses, and 60 final attending diagnoses. Improvements in sensitivity and specificity using lung ultrasound were more pronounced for the extended training group and are shown for each diagnosis in Table 2.
| Age, y, mean | 69 |
|---|---|
| |
| Sex, male, % | 52.2 |
| BMI, mean, kg/m2 | 25.7 |
| Comorbidities, % | |
| COPD | 43.3 |
| CHF | 23.9 |
| Hypertension | 59.4 |
| Diabetes mellitus | 29 |
| Atrial fibrillation | 18.9 |
| DVT/PE | 1.5 |
| Lung cancer | 5.9 |
| Finding on admission, % | |
| CXR available | 94 |
| Chest CT available | 22.4 |
| WBC >10.4 K/L | 36.2 |
| BNP >400 pg/mL | 27.5 |
| Temperature >100.9F | 6 |
| Heart rate >90 bpm | 47.8 |
| Desaturation* | 32 |
| Focused Training Group | Extended Training Group | |||||||
|---|---|---|---|---|---|---|---|---|
| CLINDIAG, N=27 | USDIAG, N=27 | CLINDIAG, N=61 | USDIAG, N=20 | |||||
| Diagnosis | Sens, % | Spec, % | Sens, % | Spec, % | Sens, % | Spec, % | Sens, % | Spec, % |
| ||||||||
| COPD/asthma | 60 | 96 | 60 | 96 | 55 | 96 | 91 | 96 |
| Pneumonia | 45 | 90 | 36 | 100 | 93 | 88 | 96 | 100 |
| Pulmonary edema | 100 | 85 | 100 | 86 | 89 | 96 | 89 | 100 |
| Pleural effusion | 57 | 100 | 86 | 96 | 57 | 96 | 100 | 96 |
| Other | 50 | 100 | 75 | 96 | 80 | 96 | 80 | 100 |
Overall diagnostic accuracy using lung ultrasound improved only for the extended training group (clinical 92% vs ultrasound 97%), whereas the focused training group's accuracy was unchanged (clinical 87% vs ultrasound 88%).
ROC analysis demonstrated a superior diagnostic performance of ultrasound when compared to clinical diagnosis (Table 3).
| Diagnosis | CLINDIAG AUC, N=69 | USDIAG AUC, N=69 | P Value |
|---|---|---|---|
| |||
| COPD/asthma | 0.73 | 0.85 | 0.06 |
| Pulmonary edema | 0.85 | 0.89 | 0.49 |
| Pneumonia | 0.77 | 0.88 | 0.01 |
| Pleural effusion | 0.76 | 0.96 | 0.002 |
| Other* | 0.78 | 0.69 | 0.01 |
| All causes, n=69 | 0.81 | 0.87 | 0.01 |
DISCUSSION
In this prospective, observational study of residents performing lung ultrasound of patients with dyspnea, the diagnostic accuracy incorporating ultrasound increased compared to a standard diagnostic approach relying on history, physical exam, blood tests, and radiography. To our knowledge, this is the first study of residents independently performing lung ultrasound with a pocket ultrasound to diagnose dyspnea. Receiver operating curve analysis shows improvements in diagnostic accuracy for causes such as PNA, pleural effusion and COPD/asthma and demonstrates the feasibility and clinical utility of residents using pocket ultrasounds. The finding that improvements in sensitivity and specificity were larger in the extended training group highlights the need for sufficient training to demonstrate increased utility. Although a 2‐week critical care ultrasound elective may not be possible for all residents, perhaps training of intensity somewhere in between these 2 levels would be most feasible.
Challenges in diagnosing dyspnea have been well described, attributed to a lack of accurate history combined with often insensitive and nonspecific physical exam findings, blood tests, and radiographs.[8, 9] Further, patients often present with multiple contributing causes as was evidenced in this study.[10] Lack of initial, accurate diagnoses often leads to the provision of multiple, incorrect treatment regimens that may increase mortality.[11] The high accuracy of lung ultrasound in defining causes of respiratory failure suggests potential as a low‐cost solution.[12]
This study design differed from prior work in several respects. First, it included patients presenting with dyspnea to a hospital ward rather than acute respiratory failure to an intensive care unit (ICU), suggesting its diagnostic potential in a broader population of patients and settings. Second, the lung ultrasound was integrated with traditional clinical information rather than relied upon alone, a situation mimicking real‐world application of POC‐US. Third, operators were residents with limited amounts of training rather than highly trained experts. Finally, the lung ultrasound exams were performed using a pocket ultrasound with inferior imaging capability than larger, more established ultrasound devices. Despite these constraints, the utility of lung ultrasound was still evident, particularly in the diagnosis or exclusion of pneumonia and PLEFF.
Limitations include reliance on a small cohort of highly motivated residents with an interest in pulmonary and critical care, 2 who are authors of this article, making reproducibility a concern. Although convenience sampling may more closely mimic real world practices of POC‐US, a bias toward less challenging patients is possible and may limit conclusions regarding utility. Over‐reading and feedback were not provided to residents to improve their performance of lung ultrasound exams. Also, because chest CT is considered the gold standard in most studies examining the diagnostic accuracy of lung ultrasound, all residents aware of these data may underestimate the potential impact of integrating lung ultrasound with all clinical findings. Finally, the high cost of pocket ultrasounds is a barrier to general use. Recent studies on the significant cost savings associated with POC‐US make a further analysis of cost‐benefit ratios mandatory before broad use can be recommended.[13]
CONCLUSIONS
Residents participating in lung ultrasound training with a pocket ultrasound device showed improved diagnostic accuracy in their evaluation of patients with dyspnea. Those who received extended training had greater improvements across all causes of dyspnea. Training residents to apply lung ultrasound in non‐ICU settings appears to be feasible. Further study with a larger cohort of internal medicine residents and perhaps training duration that lies in between the focused and extended training groups is warranted.
Acknowledgements
The authors thank Dr. David Lucido for guidance on statistical analysis and Stephane Gatesoupe and the Vscan team at General Electric.
Disclosure: Ten Vscan pocket ultrasounds (General Electric) were provided free of cost solely for the purpose of conducting the clinical research study. This represented their sole participation in any stage of the research. The authors have no conflicts of interest to disclose.
- , , , . Barriers to ultrasound training in critical care medicine fellowships: a survey of program directors. Crit Care Med. 2010;38(10):1978–1983.
- , , , et al. Comparison of effectiveness of hand‐carried ultrasound to bedside cardiovascular physical examination. Am J Cardiol. 2005;96(7):1002–1006.
- , , . Diagnosing pulmonary edema: lung ultrasound versus chest radiography. Eur J Emerg Med. 2013;20(5):356–360.
- , . Relevance of lung ultrasound in the diagnosis of acute respiratory failure: the BLUE protocol. Chest. 2008;134(1):117–125.
- , , , et al. Lung ultrasound in the diagnosis and follow‐up of community‐acquired pneumonia: a prospective, multicenter, diagnostic accuracy study. Chest. 2012;142(4):965–972.
- , , , , , . Evaluation of a new pocket echoscopic device for focused cardiac ultrasonography in an emergency setting. Crit Care. 2012;16(3):R82.
- , , , . Our new stethoscope in the emergency department: handheld ultrasound. Ulus Travma Acil Cerrahi Derg. 2011;17(6):488–492.
- , , . Discriminating causes of dyspnea through clinical examination. J Gen Intern Med. 1993;8(7):383–392.
- , , . Does this patient have community‐acquired pneumonia? Diagnosing pneumonia by history and physical examination. JAMA. 1997;278(17):1440–1445.
- , , , et al. Acute respiratory failure in the elderly: etiology, emergency diagnosis and prognosis. Crit Care. 2006;10(3):R82.
- , , , et al. Early interventions in severe sepsis and septic shock: a review of the evidence one decade later. Minerva Anestesiol. 2012;78(6):712–724.
- , , , . Ultrasound diagnosis of alveolar consolidation in the critically ill. Intensive Care Med. 2004;30(2):276–281.
- , , , , , . Ultrasound assessment of pulmonary embolism in patients receiving computerized tomography pulmonary angiography. Chest. 2014;145(4):818–823.

Bullying
Bullying affects approximately 20% of children, according to a 2012 survey of 20,000 students in grades 3-12 (Bullying in U.S. Schools 2012 Status Report, published by the Hazelden Foundation 2013).
As pediatricians, we have all faced the grieving parent distraught by the ill treatment of their child. Many of us have probably felt helpless because it’s not a medical issue – or is it? I think we can all agree that it doesn’t start as a medical issue, but for sure it can end as one.
Anxiety, depression, cutting, abdominal pain, headaches, and weight loss can all be the end result of the stress of bullying. Some children are able to be honest about how they are feeling, but many internalize it and parents are sometimes the last to know. Approximately 160,000 students stay home from school everyday because of bullying, according to the National Association of School Psychologists.
Many school systems have adopted antibullying programs in which children are educated on the effects of bullying, how to treat their peers, and what to do if they are bullied. But some recent research shows that these programs may not be successful, and bullying rates are actually higher at schools that have implemented these programs, according to the Canadian Journal of School Psychology (2011;26:283-300).
One of the main differences with bullying now is that social media may play a significant role in the extent of the bullying. Facebook, Instagram, and Snapchat are vehicles that are used by the bully and that can make the extent of the damage much worse. Twenty years ago, a rumor had to spread by word of mouth; now, with just a touch of a button, hundreds of students can see and know of the ill-intended work of a bully.
"Bullycide" is a newly coined term that suggests a child committed suicide because she was bullied. The rate of these occurrences is rising largely because of the attention placed on bullying, but the media also serves as an information trail, which allows us to connect the dots more clearly.
Intervention that we can do as professionals is to identify things that may put a student at risk and try to intervene early. Severe acne, obesity, and social anxiety are all things that can be treated to improve a child’s self-esteem and make them less of a target. Parents are not always in tune to this because their love is unconditional, and they may not recognize the role these play. Using the well-child visit to uncover these issues and offer treatment for things that may not have been brought up.
When approached by parents who are seeking help, directing them to the stopbullyingnow.gov provides a great source of information that can help parents navigate dealing with the school and helping the child deal with stress. The CyberBully Hotline is a program that schools can implement that allows parents and student to anonymously report cyberbullying. This has been shown to be extremely effective in reducing the number of fights that occur.
Parents should be educated that any threat of suicide should be taken seriously, and an immediate intervention should be taken. 800-273-TALK is the suicide hotline that parents can use if they are concerned that their child is at risk. Emergency departments are equipped with social workers who can assess if hospitalization is necessary or if a child should be followed as an outpatient.
Dr. Pearce is a pediatrician in Frankfort, Ill. E-mail her at [email protected].

A Review of Hair Care Products for Black Individuals
Dermatology Coding Changes With ICD-10
Giant Cell Tumor of Soft Tissue
Exome sequencing not always accurate, presenter says
Credit: Jeremy L. Grisham
MILAN, ITALY—New research suggests exome sequencing does not always produce high-quality results with regard to subsets of genes.
The American College of Medical Genetics and Genomics (ACMG) recommends physicians inform patients of clinically actionable genetic findings in the course of clinical exome testing.
Specifically, mutations in 56 specific genes with known clinical importance should be reported, even when they are incidental to the patient’s medical condition.
However, an analysis of 44 exome datasets from 4 different testing kits showed that they missed a high proportion of clinically relevant regions in the 56 ACMG genes.
“At least 1 gene in each exome method was missing more than 40% of disease-causing genetic variants, and we found that the worst-performing method missed more than 90% of such variants in four of the 56 genes,” said Eric Londin, PhD, of Thomas Jefferson University in Philadelphia, Pennsylvania.
He and his colleagues presented these findings at the European Society of Human Genetics Conference 2014 (abstract C07.6).
A central question, according to the researchers, is not how often a clinical diagnosis can be made using exome sequencing, but how often it is missed. And this study suggests there is a high false-negative rate using existing sequencing kits.
“Our concern is that when a clinical exome analysis does not report a disease-causing genetic variant, it may be that the location of that variant has not been analyzed, rather than the patient’s DNA being free of a disease-causing variant,” Dr Londin said.
“Depending on the method and the laboratory, a significant fraction (more than 10%) of the exome may be untested, and this raises concerns as to how results are being communicated to patients and their families.”
A total of 17,774 disease-causing genetic variants are annotated in the Human Gene Mutation Database for the 56 genes mentioned in the ACMG recommendations. The researchers examined the coverage of the exome datasets for the locations where the 17,774 disease-causing variants can occur.
Although the exome datasets are comparable in quality to other published clinical and research exome data sets, the coverage of the disease-causing locations was very heterogeneous and often poor.
The researchers believe that clinical labs that implement the ACMG reporting guidelines should recognize the substantial possibility of reporting false negative results.
The team said one potential improvement would be to have clinical exome sequencing use methods designed to provide a maximum yield of all clinically relevant genes.
“Many of the currently used exome kits are designed to provide a very broad dataset including genomic features that do not yet have a well-established clinical association,” Dr Londin said.
“There is a need to develop new kits and methods which provide adequate and reliable coverage of genes with known disease associations. If adequate performance cannot be obtained across the exome, then further use of targeted disease-specific panels of genes should be explored.”
The researchers also found that exome datasets generated from low amounts of sequence data (fewer than 6 gigabases) performed much worse than datasets that were generated from higher amounts of sequence data (more than 10 gigabases).
This finding is consistent with previous studies showing that exome methods do not have a linear relationship between sequence-generated and nucleotide coverage. Instead, a minimum threshold of sequencing data needs to be met before optimum nucleotide coverage is obtained.
“Current consensus and regulatory guidelines do not prescribe a minimum data requirement for clinical exome tests,” Dr Londin said. “The result is that when a causative variant cannot be identified, it does not necessarily imply that the variant is not present, rather that there may be a technical issue with the exome technology used.”
“In other words, a clinical ‘whole-exome’ study may not be ‘wholesome’ in coverage. Patients and their families should be made aware of this problem and of the implications of the genomic findings of clinical exome sequencing in its current state.” ![]()
Why Hospitalists Should Heed Choosing Wisely Recommendations

By now, most hospitalists are at least familiar with the Choosing Wisely campaign, which has been widely published and embraced by numerous medical societies, including the Society of Hospital Medicine.1 This campaign was conceived in 2009 by the National Physicians Alliance, which developed simple lists for three primary care specialties—internal medicine, pediatrics, and family medicine—to help them become more effective in utilizing specific resources.
The effort was first published in the Archives of Internal Medicine in 2011 by the “Good Stewardship Working Group,” which outlined the five most overutilized types of care by the three groups, including items such as routinely ordering complete blood counts or electrocardiograms, prescribing brand name versus generic statin drugs, and prescribing antibiotics for pediatric pharyngitis. From this small list alone, they found incredible variability among primary care practices, with utilization of these services ranging from 1% to 56% and resulting in an estimated annual cost of $6.8 billion. Although this first pilot found simple reductions in utilization can have a powerful impact on cost, the group estimated that this overutilization in primary care is only a very small fraction of overutilization cost in the U.S. As such, they called upon other specialties outside of primary care to identify their own sets of targets to reduce unnecessary utilization of low-value services.
Many specialty groups heeded this call to action, which resulted in the Choosing Wisely campaign, launched in April 2012. In just two short years, this simple effort has expanded to published recommendations about resource use in more than 60 specialty societies.2 Like the original primary care list, most recommendations have focused on overutilization of diagnostic testing (imaging, cardiac testing, labs, pathology) and medication use. Later this year, the campaign will expand to include non-physician provider organizations, including the American Dental Association, the American Physical Therapy Association, and the American Academy of Nursing.
The Next Phase
The program has evolved from asking specialty groups to develop consensus and abide by their lists to targeting patients and their families so that they can understand and abide by those same lists. In fact, one of the major aims of the campaign is empowering patients to insist on care that is evidence based, necessary, not duplicative, and more beneficial than harmful. To do this, Consumer Reports has partnered up with the Choosing Wisely campaign to develop patient-friendly educational materials and with multiple consumer groups to help these materials reach their target audience. Major funding for the project has been provided by the American Board of Internal Medicine (ABIM) Foundation and the Robert Wood Johnson Foundation (RWJF). So far, they have awarded 21 projects.
These grants have been awarded to medical societies (see “SHM Choosing Wisely Case Study Competition,” p. 4), regional health organizations, and consumer advocate groups. Many of the tactics will include educational campaigns to teach practitioners about the content of the recommendations, programs aimed to enhance physician communication skills geared toward practicing physicians, other educational campaigns geared toward patients and families, and the establishment of a learning network to assist practices in quickly and effectively learning from one another how to implement the various recommendations.3
The three major assets of the Choosing Wisely campaign are:
- It attacks a core issue within the medical industry: Healthcare costs are higher here than in any other industrialized nation in the world, without clear evidence of higher quality to justify that cost;
- The lists are created by those who are responsible for most of the spending; and
- The campaign is spending resources to get information to the patients and their families so that there will be bilateral exchange and acceptance of the recommendations.
Without widespread patient education, overutilization will likely continue; a recent survey sponsored by the Choosing Wisely campaign found about half of physicians admitted they would order a test they know is unnecessary if the patient is insistent.4
Variable Outcomes
While there are many reasons to celebrate the success of the campaign, there is some concern that the Choosing Wisely campaign may have unintended consequences. Although a major driver in the success of the program is the fact that the lists have been created and endorsed by physician societies, a sort of “self-governance,” with no influence or impact from payers, critics of the program note the variability that each list has on the actual practice or revenue of the physician groups enacting the lists.
For example, a recent New England Journal of Medicine (NEJM) essay notes that the list produced by the American Academy of Orthopedic Surgeons does not include procedures that are high volume and variably valuable (such as knee arthoplasty) but does include over-the-counter medication use and low-volume procedures (such as needle lavage for knee osteoarthritis).5 Some societies list specialty services that need to be curbed but neglect to mention their own.
And, although the campaign specifically states on its website that the “recommendations should not be used to establish coverage decisions or exclusions,” some are legitimately concerned that these Choosing Wisely lists might very well be used by payers and/or quality reporting bodies to determine payments. This is undeniably tempting: How can practitioners argue against public display and reimbursement schemes being tightly tethered to their performance on metrics that they themselves have deemed unnecessary? As the NEJM editorial summarizes, these efforts should be embraced as long as there is thoughtful discussion about inclusion criteria, exclusion criteria, and measurement beforehand.5
In Sum
Despite concerns, the impact of the Choosing Wisely campaign has been widespread and impressive. The full extent to which this will have an impact on utilization and healthcare cost remains to be seen, but this yeoman’s attempt to reduce waste by providers is long overdue. Whether the program will be used for unintended purposes, such as public reporting, financial penalties, or incentives for performance, is still unknown, but physician groups should be paying close attention to the lists that we can impact, and we should pledge to be good stewards of the finite healthcare resources available to our patients.
Dr. Scheurer is a hospitalist and chief quality officer at the Medical University of South Carolina in Charleston. She is physician editor of The Hospitalist. Email her at [email protected].
References
- Choosing Wisely Campaign. Available at: http://www.choosingwisely.org. Accessed May 11, 2014.
- Choosing Wisely Consumer Partners. Available at: http://www.choosingwisely.org/partners. Access May 11, 2014.
- Choosing Wisely Grantees. Available at: http://www.choosingwisely.org/grantees. Accessed May 11, 2014.
- Choosing Wisely & Consumer Reports. Available at: http://consumerhealthchoices.org/wp-content/uploads/2014/03/ChoosingWiselyAndConsumerHealthChoices.pdf. Accessed May 11, 2014.
- Morden ME, Colla CH, Sequist TD, Rosenthal MB. Choosing Wisely—the politics and economics of labeling low-value services. Available at: http://www.nejm.org/doi/full/10.1056/NEJMp1314965. Accessed May 11, 2014.
How Generation X-Era Physicians Have Energized Hospital Medicine

“Each generation goes further than the generation preceding it, because it stands on the shoulders of that generation. You will have opportunities beyond anything we've ever known.”
—Former U.S. President Ronald Reagan
In the April 2014 issue of The Hospitalist, I began the tale of our specialty and the beginning of our evolution into a social movement. A social movement occurs when a large number of agents take coordinated action simultaneously.1 In the early days, managed care and other factors began driving doctors to try new, more efficient ways to practice, including early hospitalist practices, but usually these practices were one-offs and uncoordinated in their actions. Additionally, small numbers of doctors, perhaps a few hundred, focused their practice in the hospital. Drs. Wachter and Goldman published their “Sounding Board” article in the New England Journal of Medicine and, suddenly, hospital doctors across the country had a common identity: hospitalists.2 The specialty was poised for growth, but who would fill the need to come?
We should back up a few years to the dawn of the hospitalist movement in the late 1980s and early 1990s. For 20 years, Baby Boomers had been matriculating and graduating from medical school. The last Baby Boomers would graduate as the 1990s were just beginning. Baby Boomers were raised in the post-war era, largely by intact families with working fathers and stay-at-home mothers. They grew up in a competitive school environment—fueled by Sputnik—with a focus on success and working hard as the means to achieve that success. They were raised to be idealists and to question authority—remember Vietnam protests? These traits served the Baby Boomers well when managed care began to exert its pressure on physician practices. It was these physicians who figured out a new way to succeed in an altered landscape. It was either them or the big payers; their competitive nature was funneled into trying new, efficient practice models, to maintain income and control over their practices. Hospitalist systems were the most visible new practice model created in this era.
Fast forward a few years to the mid 1990s. A demographic shift was occurring. A new generation of Americans arrived on the scene of modern medicine—Generation X. The first Gen-X physicians graduated from medical school in 1991 and began moving into internship. They would graduate from residency in 1994, just as the early HM groups were starting to build a quiet but critical mass. This was a generation raised as latchkey kids in a time of rising divorce rates and working mothers. These kids were often home alone and grew up with more freedom and independence than any recent generation in history. Gen-X kids learned how to function on their own. Resourceful and self-reliant, they took on responsibility, but, conversely, did not appreciate being watched over. They liked to work at their own pace and valued work-life balance in a way that was foreign to the Baby Boomers. They weren’t born with keyboards in their cradles, but this was the first generation raised with technology—and they embraced it.
As these Generation X’ers came out of residency looking for the right fit in a specialty, trying creative ways of doing things, and seeking balance in their lives, they saw the early hospitalist programs the Boomer pioneers had created and started to join. They saw in these early hospitalist programs all that they were looking for in a practice. In many programs, the first hospitalists were lonely souls—but lonely by choice, usually left to their own devices. Their partners in the clinic stopped coming to the hospital, and their administrative leaders focused on the engine of running the clinic and managing the capitated and non-capitated costs of care.
Hospitalist practices became bastions of independence and freedom. No longer were these physicians chained down to their small area in one hallway of the clinic, nor did they cling to the metaphor of the fast-moving production line. Hospitalists could roam the hospital at will, from inpatient unit to ED to ICU. Hospitalists could eat lunch when they wanted to! Gen-X physicians flocked to this model of independence that so aligned with their own inner desire to work at their own pace and in their own way.
These early hospitalist programs, still trying to find their way in a complicated and changing healthcare environment, necessitated continued resourcefulness. We saw creative approaches to scheduling that favored continuity (seven on/seven off), transitions to hospitalists as teaching attendings, and early attempts at night coverage. The transition from at-home call or coverage by residents to in-house shifts to nocturnists could fill its own column. The creative opportunities offered by these early practices strongly appealed to the Gen-X sensibilities and values.3
Lastly, work-life balance strongly resonated with Gen-X physicians. Many of the Boomer physicians of the time were content to stay in the clinic and “run faster” to keep up with the demands of managed care; however, the Boomers who migrated to the hospital and the early Gen-X physicians seemed to have a different mindset. They relished the opportunity to work in the new hybrid model. I say hybrid because it certainly wasn’t the ongoing continuity model that it originated from in primary care, but neither was it pure shift work like in the ED. It had the element of daily shifts—but clustered together in five to 14 day runs, often with an equal amount of time away from work. Additionally, nobody was taking work home—at least not until EMR. Work-life balance was the recruiting “pitch” during the late 90s and early 2000s.
So, after the creation of the field by Baby Boomers, the Gen-X doctors were the fuel needed to grow the specialty at a pace never before seen in medicine. Wachter and Goldman’s article opened the floodgates. Between 1997 and 2006, the number of hospitalists grew by 29%—not in total, but 29% per year!
Gen-X physicians latched onto the idea created and publicized by the Boomers, but the movement needed more to sustain, even accelerate, that early growth than just an interesting new idea for how to see hospital patients. What was the oxygen? What gave the HM social movement its purpose?
In my August column, I will explore what came next to propel HM from a new area of practice, an offshoot of primary care, into a full-fledged movement. It was that next thing that made our field “go viral.”
Dr. Kealey is SHM president and medical director of hospital specialties at HealthPartners Medical Group in St. Paul, Minn.
References
- Lancaster LC, Stillman D. When Generations Collide. Who They Are. Why They Clash. How to Solve the Generational Puzzle at Work. New York: HarperCollins; 2002.
- Wachter RM, Goldman L. The emerging role of “hospitalists” in the American health care system. New Engl J Med. 1996;335(7):514-517.
- Wachter R. Today’s NEJM hospitalist study: what’s the news? Available at: http://community.the-hospitalist.org/2009/03/13/today-s-nejm-hospitalist-study-what-s-the-news/. Accessed May 11, 2014.