User login
What Are the Indications for a Blood Transfusion?

Case
A 65-year-old man with a history of coronary artery disease (CAD) presents to the ED after a mechanical fall. He was found to have a hip fracture, admitted to orthopedic service, and underwent an uneventful hip repair. His post-operative course was uncomplicated, except for his hemoglobin level of 7.5 g/dL, which had decreased from his pre-operative hemoglobin of 11.2 g/dL. The patient was without cardiac symptoms, was ambulating with assistance, had normal vital signs, and was otherwise having an unremarkable recovery. The orthopedic surgeon, who recently heard that you do not have to transfuse patients unless their hemoglobin is less than 7 g/dL, consulted the hospitalist to help make the decision. What would your recommendation be?
Overview
Blood transfusions are a common medical procedure routinely given in the hospital.1 An estimated 15 million red blood cell (RBC) units are transfused each year in the United States.2 Despite its common use, the clinical indications for transfusion continue to be the subject of considerable debate. Most clinicians would agree that treating a patient with a low hemoglobin level and symptoms of anemia is reasonable.1,3 However, in the absence of overt symptoms, there is debate about when transfusions are appropriate.2,3
Because tissue oxygen delivery is dependent on hemoglobin and cardiac output, past medical practice has supported the use of the “golden 10/30 rule,” by which patients are transfused to a hemoglobin concentration of 10 g/dL or a hematocrit of 30%, regardless of symptoms. The rationale for this approach is based on physiologic evidence that cardiac output increases when hemoglobin falls below 7 g/dl. In patients with cardiac disease, the ability to increase cardiac output is compromised. Therefore, in order to reduce strain on the heart, hemoglobin levels historically have been kept higher than this threshold.
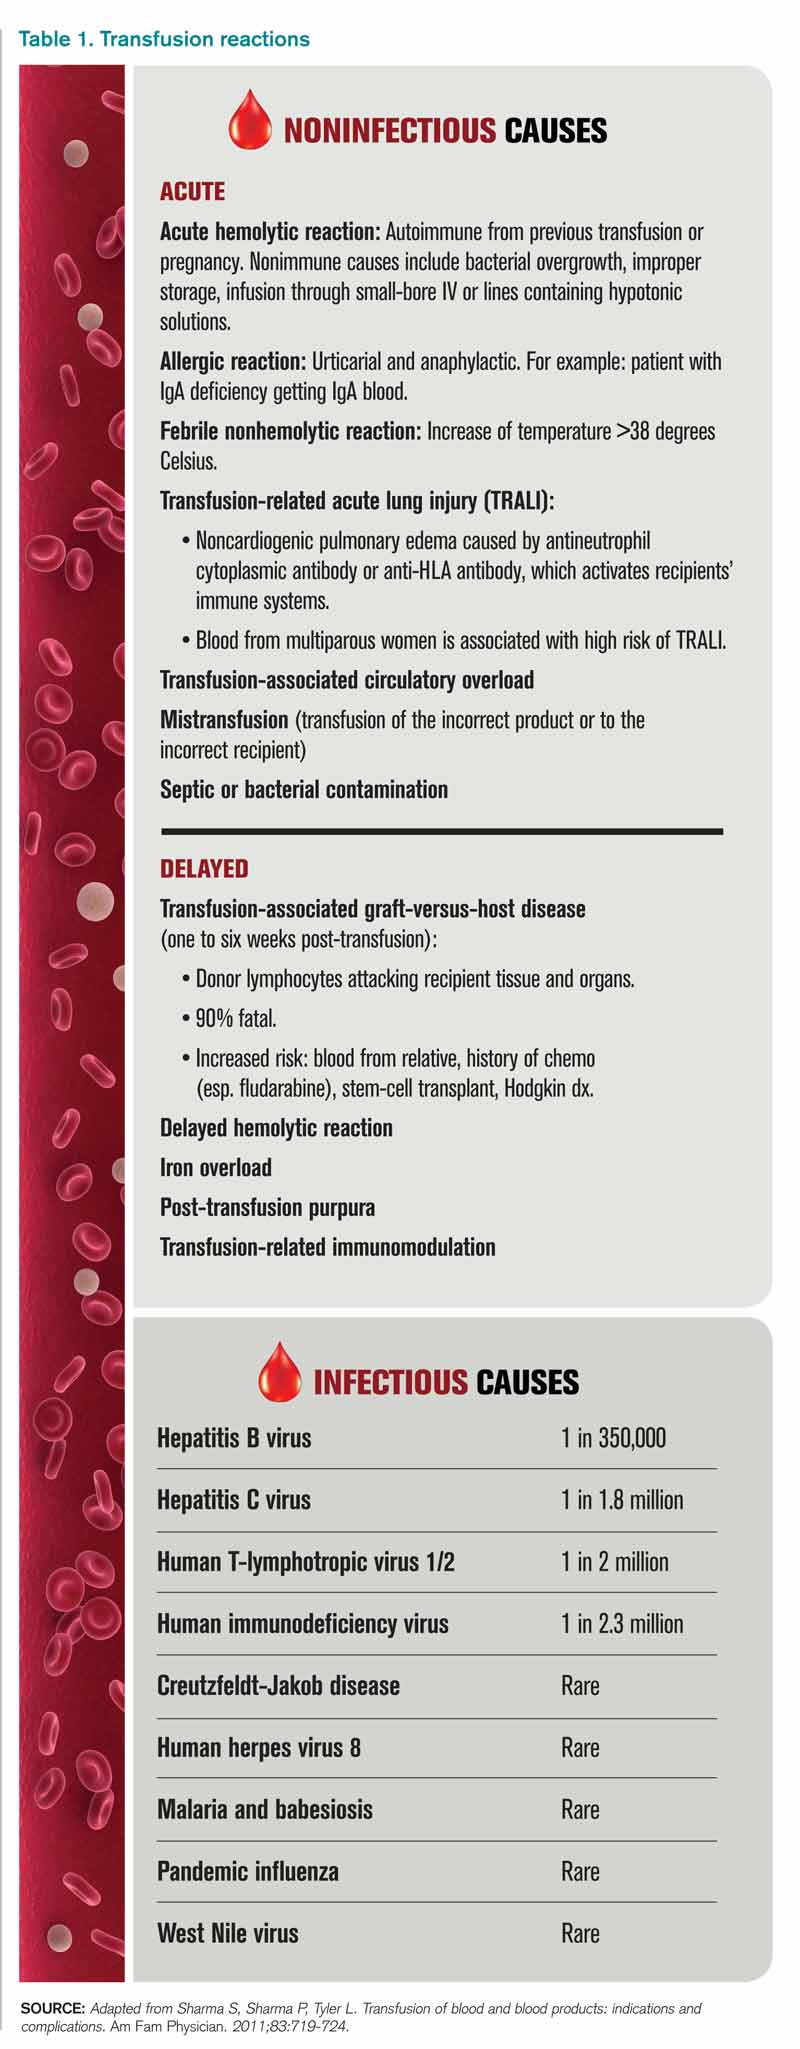
However, several studies have forced us to re-evaluate this old paradigm, including increasing concern for the infectious and noninfectious complications associated with blood transfusions and the need for cost containment (see Table 1).1,2,4 Due to improved blood screening, infectious complications from transfusions have been greatly reduced; noninfectious complications are 1,000 times more likely than infectious ones.
Review of Data
Although a number of studies have been performed on the indications for blood transfusions, many of the trials conducted in the past were too small to substantiate a certain practice. However, three trials with a large number of participants have allowed for a more evidence-based approach to blood transfusions. The studies address different patient populations to help broaden the restrictive transfusion approach to a larger range of patients.
TRICC trial: critically ill patients5. The TRICC trial was the first major study that compared a liberal transfusion strategy (transfuse when Hb <10 g/dL) to a more conservative approach (transfuse when Hb <7 g/dL). In this multicenter, randomized controlled trial, Hébert et al enrolled 418 critically ill patients and found that there was no significant difference in 30-day all-cause mortality between the restrictive-strategy group (18.7%) and the liberal-strategy group (23.3%).
However, in the pre-determined subgroup analysis, patients who were less severely ill (APACHE II scores of <20) had 30-day all-cause mortality of 8.7%, compared with 16.1% in the liberal-strategy group. Interestingly, there were more cardiac complications (pulmonary edema, angina, MI, and cardiac arrest) in the liberal-strategy group (21%) compared with the restrictive-strategy group (13%). Despite this finding, 30-day mortality was not significantly different in patients with clinically significant cardiac disease (primary or secondary diagnosis of cardiac disease [20.5% restrictive versus 22.9% liberal]).
An average of 2.6 units of RBCs per patient were given in the restrictive group, while 5.6 units were given to patients in the liberal group. This reflects a 54% decrease in the number of transfusions used in the conservative group. All the patients in the liberal group received transfusions, while 33% of the restrictive group’s patients received no blood at all.
The results of this trial suggested that there is no clinical advantage in transfusing ICU patients to Hb values above 9 g/dL, even if they have a history of cardiac disease. In fact, it may be harmful to practice a liberal transfusion strategy in critically ill younger patients (<55 years old) and those who are less severely ill (APACHE II <20).5
FOCUS trial: hip surgery and history of cardiac disease6. The FOCUS trial is a recent study that looked at the optimal hemoglobin level at which an RBC transfusion is beneficial for patients undergoing hip surgery. This study enrolled patients aged 50 or older who had a history or risk factors for cardiovascular disease (clinical evidence of cardiovascular disease: h/o ischemic heart disease, EKG evidence of previous MI, h/o CHF/PVD, h/o stroke/TIA, h/o HTN, DM, hyperlipidemia (TC >200/LDL >130), current tobacco use, or Cr>2.0), who were undergoing primary surgical repair of a hip fracture, and who had Hb <10g/dL within three days after surgery.
More than 2,000 patients were assigned randomly to a liberal-strategy group (transfuse to maintain a Hb >10g/dL) or a restrictive strategy group (transfuse to maintain Hg >8g/dl or for symptoms or signs of anemia). These signs/symptoms included chest pain that was possibly cardiac-related, congestive heart failure, tachycardia, and unresponsive hypotension. The primary outcomes were mortality or inability to walk 10 feet without assistance at 60-day follow-up.
The FOCUS trial found no statistically significant difference in mortality rate (7.6% in the liberal group versus 6.6% in the restrictive group) or in the ability to walk at 60 days (35.2% in the liberal group versus 34.7% in the restrictive group). There were no significant differences in the rates of in-hospital acute MI, unstable angina, or death between the two groups.
Patients in the restrictive-strategy group received 65% fewer units of blood than the liberal group, with 59% receiving no blood after surgery compared with 3% of the liberal group. Overall, the liberal group received 1,866 units of blood, compared with 652 units in the restrictive group.
This trial helps support the findings in previous trials, such as TRICC, by showing that a restrictive transfusion strategy using a trigger point of 8 g/dl does not increase mortality or cardiovascular complications and does not decrease functional ability after orthopedic surgery.
TRAC trial: patients after cardiac surgery7. The TRAC trial was a prospective randomized trial in 502 patients undergoing cardiac surgery that assigned 253 patients to the liberal-transfusion-strategy group (Hb >10g/dl) and 249 to the restrictive-strategy group (Hb >8 g/dl). In this study, the primary endpoint of all-cause 30-day mortality occurred in 10% of the liberal group and 11% of the restrictive group. This difference was not significant.
Subanalysis showed that blood transfusion in both groups was an independent risk factor for the occurrence of respiratory, cardiac, renal, and infectious complications, in addition to the composite end point of 30-day mortality—again highlighting the risk involved in of blood transfusions.
These results support the other trial conclusions that a restrictive transfusion strategy of maintaining a hematocrit of 24% (Hb 8 g/dL) is as safe as a more liberal strategy with a hematocrit of 30% (Hb 10 g/dL). It also offers further evidence of the risks of blood transfusions and supports the view that blood transfusions should never be given simply to correct low hemoglobin levels.
Cochrane Review. A recent Cochrane Review that comprised 19 trials with a combined total of 6,264 patients also supported a restrictive-strategy approach.8 In this review, no difference in mortality was established between the restrictive and liberal transfusion groups, with a trend toward decreased hospital mortality in the restrictive-transfusion group. The authors of the study felt that for most patients, blood transfusion is not necessary until hemoglobin levels drop below 7-8 g/dL but emphasized that this criteria should not be generalized to patients with an acute cardiac issue.
Back to the Case
In this case, the patient is doing well post-operatively and has no cardiac symptoms or hypotension. However, based on the new available data from the FOCUS trial, given the patient’s history of CAD, and the threshold of 8 g/dL used in the study, it was recommended that the patient be transfused.
Bottom Line
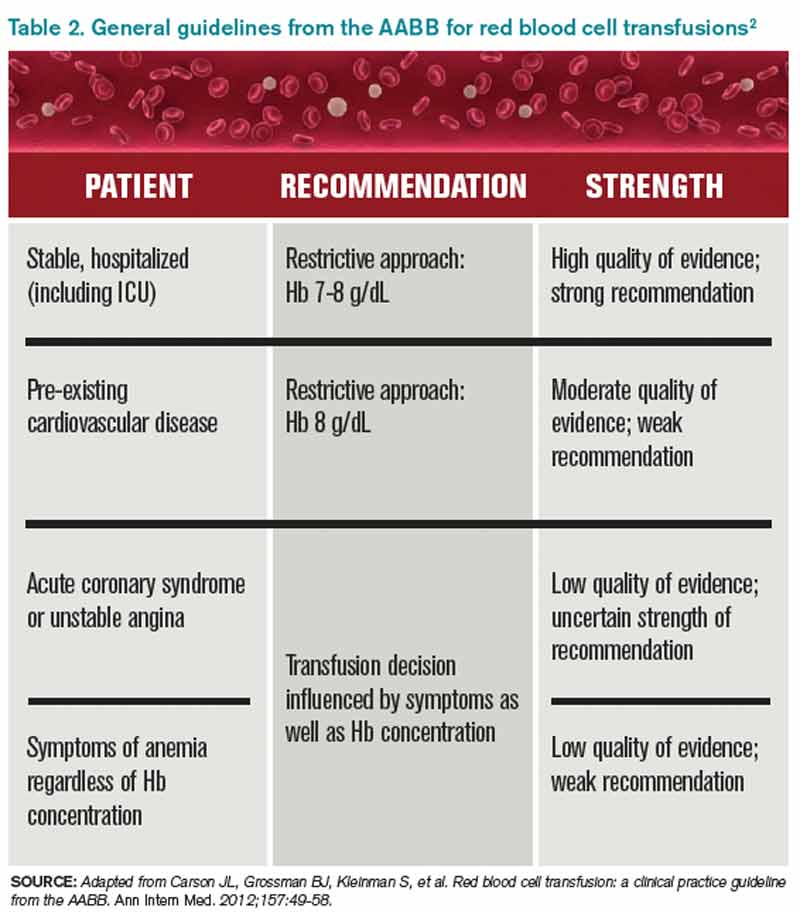
Current practice guidelines clearly support clinical judgment as the primary determinant in the decision to transfuse.2 However, current evidence is growing that our threshold for blood transfusions should be a hemoglobin level of 7-8 g/dl.
Dr. Chang is a hospitalist and assistant professor at Mount Sinai Medical Center in New York City, and is co-director of the medicine-geriatrics clerkship at the Icahn School of Medicine at Mount Sinai. Dr. Torgalkar is a hospitalist and assistant professor at Mount Sinai Medical Center.
References
- Sharma S, Sharma P, Tyler L. Transfusion of blood and blood products: indications and complications. Am Fam Physician. 2011;83:719-724.
- Carson JL, Grossman BJ, Kleinman S, et al. Red blood cell transfusion: a clinical practice guideline from the AABB. Ann Intern Med. 2012;157:49-58.
- Valeri CR, Crowley JP, Loscalzo J. The red cell transfusion trigger: has a sin of commission now become a sin of omission? Transfusion. 1998;38:602-610.
- Klein HG, Spahn DR, Carson JL. Red blood cell transfusion in clinical practice. Lancet. 2007;370(9585):415-426.
- Hébert PC, Wells G, Blajchman MA, et al. A multicenter, randomized, controlled clinical trial of transfusion requirements in critical care. N Engl J Med. 1999;340:409-17.
- Carson JL, Terrin ML, Noveck H, et al. Liberal or restrictive transfusion in high-risk patients after hip surgery. N Engl J Med. 2011;365:2453-2462.
- Hajjar LA, Vincent JL, Galas FR, et al. Transfusion requirements after cardiac surgery: the TRACS randomized controlled trial. JAMA. 2010;304:1559-1567.
- Carson JL, Carless PA, Hébert PC. Transfusion thresholds and other strategies for guiding allogeneic red blood cell transfusion. Cochrane Database Syst Rev. 2012; 4:CD002042.
Case
A 65-year-old man with a history of coronary artery disease (CAD) presents to the ED after a mechanical fall. He was found to have a hip fracture, admitted to orthopedic service, and underwent an uneventful hip repair. His post-operative course was uncomplicated, except for his hemoglobin level of 7.5 g/dL, which had decreased from his pre-operative hemoglobin of 11.2 g/dL. The patient was without cardiac symptoms, was ambulating with assistance, had normal vital signs, and was otherwise having an unremarkable recovery. The orthopedic surgeon, who recently heard that you do not have to transfuse patients unless their hemoglobin is less than 7 g/dL, consulted the hospitalist to help make the decision. What would your recommendation be?
Overview
Blood transfusions are a common medical procedure routinely given in the hospital.1 An estimated 15 million red blood cell (RBC) units are transfused each year in the United States.2 Despite its common use, the clinical indications for transfusion continue to be the subject of considerable debate. Most clinicians would agree that treating a patient with a low hemoglobin level and symptoms of anemia is reasonable.1,3 However, in the absence of overt symptoms, there is debate about when transfusions are appropriate.2,3
Because tissue oxygen delivery is dependent on hemoglobin and cardiac output, past medical practice has supported the use of the “golden 10/30 rule,” by which patients are transfused to a hemoglobin concentration of 10 g/dL or a hematocrit of 30%, regardless of symptoms. The rationale for this approach is based on physiologic evidence that cardiac output increases when hemoglobin falls below 7 g/dl. In patients with cardiac disease, the ability to increase cardiac output is compromised. Therefore, in order to reduce strain on the heart, hemoglobin levels historically have been kept higher than this threshold.
However, several studies have forced us to re-evaluate this old paradigm, including increasing concern for the infectious and noninfectious complications associated with blood transfusions and the need for cost containment (see Table 1).1,2,4 Due to improved blood screening, infectious complications from transfusions have been greatly reduced; noninfectious complications are 1,000 times more likely than infectious ones.
Review of Data
Although a number of studies have been performed on the indications for blood transfusions, many of the trials conducted in the past were too small to substantiate a certain practice. However, three trials with a large number of participants have allowed for a more evidence-based approach to blood transfusions. The studies address different patient populations to help broaden the restrictive transfusion approach to a larger range of patients.
TRICC trial: critically ill patients5. The TRICC trial was the first major study that compared a liberal transfusion strategy (transfuse when Hb <10 g/dL) to a more conservative approach (transfuse when Hb <7 g/dL). In this multicenter, randomized controlled trial, Hébert et al enrolled 418 critically ill patients and found that there was no significant difference in 30-day all-cause mortality between the restrictive-strategy group (18.7%) and the liberal-strategy group (23.3%).
However, in the pre-determined subgroup analysis, patients who were less severely ill (APACHE II scores of <20) had 30-day all-cause mortality of 8.7%, compared with 16.1% in the liberal-strategy group. Interestingly, there were more cardiac complications (pulmonary edema, angina, MI, and cardiac arrest) in the liberal-strategy group (21%) compared with the restrictive-strategy group (13%). Despite this finding, 30-day mortality was not significantly different in patients with clinically significant cardiac disease (primary or secondary diagnosis of cardiac disease [20.5% restrictive versus 22.9% liberal]).
An average of 2.6 units of RBCs per patient were given in the restrictive group, while 5.6 units were given to patients in the liberal group. This reflects a 54% decrease in the number of transfusions used in the conservative group. All the patients in the liberal group received transfusions, while 33% of the restrictive group’s patients received no blood at all.
The results of this trial suggested that there is no clinical advantage in transfusing ICU patients to Hb values above 9 g/dL, even if they have a history of cardiac disease. In fact, it may be harmful to practice a liberal transfusion strategy in critically ill younger patients (<55 years old) and those who are less severely ill (APACHE II <20).5
FOCUS trial: hip surgery and history of cardiac disease6. The FOCUS trial is a recent study that looked at the optimal hemoglobin level at which an RBC transfusion is beneficial for patients undergoing hip surgery. This study enrolled patients aged 50 or older who had a history or risk factors for cardiovascular disease (clinical evidence of cardiovascular disease: h/o ischemic heart disease, EKG evidence of previous MI, h/o CHF/PVD, h/o stroke/TIA, h/o HTN, DM, hyperlipidemia (TC >200/LDL >130), current tobacco use, or Cr>2.0), who were undergoing primary surgical repair of a hip fracture, and who had Hb <10g/dL within three days after surgery.
More than 2,000 patients were assigned randomly to a liberal-strategy group (transfuse to maintain a Hb >10g/dL) or a restrictive strategy group (transfuse to maintain Hg >8g/dl or for symptoms or signs of anemia). These signs/symptoms included chest pain that was possibly cardiac-related, congestive heart failure, tachycardia, and unresponsive hypotension. The primary outcomes were mortality or inability to walk 10 feet without assistance at 60-day follow-up.
The FOCUS trial found no statistically significant difference in mortality rate (7.6% in the liberal group versus 6.6% in the restrictive group) or in the ability to walk at 60 days (35.2% in the liberal group versus 34.7% in the restrictive group). There were no significant differences in the rates of in-hospital acute MI, unstable angina, or death between the two groups.
Patients in the restrictive-strategy group received 65% fewer units of blood than the liberal group, with 59% receiving no blood after surgery compared with 3% of the liberal group. Overall, the liberal group received 1,866 units of blood, compared with 652 units in the restrictive group.
This trial helps support the findings in previous trials, such as TRICC, by showing that a restrictive transfusion strategy using a trigger point of 8 g/dl does not increase mortality or cardiovascular complications and does not decrease functional ability after orthopedic surgery.
TRAC trial: patients after cardiac surgery7. The TRAC trial was a prospective randomized trial in 502 patients undergoing cardiac surgery that assigned 253 patients to the liberal-transfusion-strategy group (Hb >10g/dl) and 249 to the restrictive-strategy group (Hb >8 g/dl). In this study, the primary endpoint of all-cause 30-day mortality occurred in 10% of the liberal group and 11% of the restrictive group. This difference was not significant.
Subanalysis showed that blood transfusion in both groups was an independent risk factor for the occurrence of respiratory, cardiac, renal, and infectious complications, in addition to the composite end point of 30-day mortality—again highlighting the risk involved in of blood transfusions.
These results support the other trial conclusions that a restrictive transfusion strategy of maintaining a hematocrit of 24% (Hb 8 g/dL) is as safe as a more liberal strategy with a hematocrit of 30% (Hb 10 g/dL). It also offers further evidence of the risks of blood transfusions and supports the view that blood transfusions should never be given simply to correct low hemoglobin levels.
Cochrane Review. A recent Cochrane Review that comprised 19 trials with a combined total of 6,264 patients also supported a restrictive-strategy approach.8 In this review, no difference in mortality was established between the restrictive and liberal transfusion groups, with a trend toward decreased hospital mortality in the restrictive-transfusion group. The authors of the study felt that for most patients, blood transfusion is not necessary until hemoglobin levels drop below 7-8 g/dL but emphasized that this criteria should not be generalized to patients with an acute cardiac issue.
Back to the Case
In this case, the patient is doing well post-operatively and has no cardiac symptoms or hypotension. However, based on the new available data from the FOCUS trial, given the patient’s history of CAD, and the threshold of 8 g/dL used in the study, it was recommended that the patient be transfused.
Bottom Line
Current practice guidelines clearly support clinical judgment as the primary determinant in the decision to transfuse.2 However, current evidence is growing that our threshold for blood transfusions should be a hemoglobin level of 7-8 g/dl.
Dr. Chang is a hospitalist and assistant professor at Mount Sinai Medical Center in New York City, and is co-director of the medicine-geriatrics clerkship at the Icahn School of Medicine at Mount Sinai. Dr. Torgalkar is a hospitalist and assistant professor at Mount Sinai Medical Center.
References
- Sharma S, Sharma P, Tyler L. Transfusion of blood and blood products: indications and complications. Am Fam Physician. 2011;83:719-724.
- Carson JL, Grossman BJ, Kleinman S, et al. Red blood cell transfusion: a clinical practice guideline from the AABB. Ann Intern Med. 2012;157:49-58.
- Valeri CR, Crowley JP, Loscalzo J. The red cell transfusion trigger: has a sin of commission now become a sin of omission? Transfusion. 1998;38:602-610.
- Klein HG, Spahn DR, Carson JL. Red blood cell transfusion in clinical practice. Lancet. 2007;370(9585):415-426.
- Hébert PC, Wells G, Blajchman MA, et al. A multicenter, randomized, controlled clinical trial of transfusion requirements in critical care. N Engl J Med. 1999;340:409-17.
- Carson JL, Terrin ML, Noveck H, et al. Liberal or restrictive transfusion in high-risk patients after hip surgery. N Engl J Med. 2011;365:2453-2462.
- Hajjar LA, Vincent JL, Galas FR, et al. Transfusion requirements after cardiac surgery: the TRACS randomized controlled trial. JAMA. 2010;304:1559-1567.
- Carson JL, Carless PA, Hébert PC. Transfusion thresholds and other strategies for guiding allogeneic red blood cell transfusion. Cochrane Database Syst Rev. 2012; 4:CD002042.
Copper-Surface Experiment Makes Immediate Impact
Given the encouraging results published in Infection Control and Hospital Epidemiology regarding the effectiveness of copper-alloy surfaces in killing bacteria, one institution has decided to go full steam ahead with installing copper components.1
The Ronald McDonald House of Charleston, S.C. (RMHC), a home for families of critically ill children who are being treated at the Medical University of South Carolina (MUSC), was the first nonprofit, temporary-residence facility in the U.S. to undertake an antimicrobial copper retrofit.
“We were the ideal public building site to test copper’s antimicrobial efficacy outside of ICUs,” says Robin Willis, RMHC’s antimicrobial project manager.
South Carolina Research Authority, which managed the study, approached RMHC about being the “guinea pig.”
“The families would get the benefits for a long time, and we would have additional data outside of a closed ICU,” Willis says. “Additionally, it gave vendors a testing ground for copper components.”
Surfaces that were identified in the study as having the highest bacteria counts (stair railings, sinks, faucets, tables, locksets, cabinet pulls, and chair arms) were replaced with solid, copper-based metals such as bronze and brass that are registered by the Environmental Protection Agency. The Copper Development Association donated the bulk of funds for the project. Copper manufacturers and installers donated their time and materials.
Initial discussions about the project began in 2010; copper installations started in November 2011. The facility remained open and fully functional throughout the project, which was completed in April 2012.
MUSC measured the amount of bacteria on touch surfaces prior to the copper retrofit, then compared the amount of bacteria on the new copper surfaces against their predecessors.
“Bacteria levels dropped more than 90 percent, around the clock, without cleaning agents,” Willis says.
The study’s lead investigator, Michael Schmidt, PhD, professor and vice chair of the department of microbiology and immunology at MUSC, says the practical application of antimicrobial copper “provides a strong, real-world example of the public-health benefits of copper materials, not only in a health-care setting, but also in hotels, restaurants, and other public gathering places.” TH
Karen Appold is a freelance writer in Pennsylvania.
Reference
1. Salgado CD, Sepkowitz KA, John JF, et al. Copper surfaces reduce the rate of healthcare-acquired infections in the intensive care unit. Infect Control Hosp Epidemiol. 2013;34(5):479-486.
Research, Innovation, and Clinical Vignette (RIV) Winners Discuss What the Recognition Meant for Their Careers
Study Investigator Explains Why Copper Surfaces Can Help Prevent Infections
Click here to listen to more of our interview with Dr. Schmidt
Click here to listen to more of our interview with Dr. Schmidt
Click here to listen to more of our interview with Dr. Schmidt
MGMA Physician Compensation Survey Raises Questions About Performance Pay

Sorting out whether a hospitalist’s bonus and other compensation elements are in line with survey data often leads to confusion. The 2013 MGMA Physician Compensation and Production Survey report, based on 2012 data, shows median compensation of $240,352 for internal-medicine hospitalists (I’ll round it to $240,000 for the rest of this piece). So is your compensation in line with survey medians if your base pay is $230,000 and you have a performance bonus of up to $20,000?
The problem is that you can’t know in advance how much of the $20,000 performance bonus you will earn. And isn’t a bonus supposed to be on top of typical compensation? To be in line with the survey, shouldn’t your base pay equal the $240,000 median, with any available bonus dollars on top of that? (Base pay means all forms of compensation other than a performance bonus; it could be productivity-based compensation, pay connected to numbers of shifts or hours worked, or a fixed annual salary, etc.)
The short answer is no, and to demonstrate why, I’ll first review some facts about the survey itself, then apply that knowledge to the hospitalist marketplace.
I want to emphasize that in this article, I’m not taking a position on the right amount of workload, compensation, or bonus for any hospitalist practice. And I’m using survey medians just to simplify the discussion, not because they’re optimal for any particular practice.
Survey Data
The most important thing to know about the survey data is that the $240,000 figure takes into account all forms of pay, including extra shift pay and any bonuses that might have been paid to each provider in the data set. Such benefits as health insurance and retirement-plan contribution are not included in this figure.
There are several ways a hospitalist might have earned compensation that matches the survey median. He or she might have a fixed annual salary equal to the median with no bonus available or had a meaningful bonus (e.g. $10,000 to $20,000) available and failed to earn any of it. Or the base might have come to $230,000, and he or she earned half of the available $20,000 performance bonus. Many other permutations of bonus and other salary elements could occur to arrive at the same $240,000 figure.
The important thing to remember is that whatever bonus dollars were paid, they are included in the salary figure from the survey—not added on top of that figure. So if all bonus dollars earned were subtracted from the survey, the total “nonbonus” compensation would be lower than $240,000.
How much lower?
Typical Hospitalist Bonus Amounts
The MGMA survey doesn’t report the portion of compensation tied to a bonus, but SHM’s does. SHM’s 2012 State of Hospital Medicine Report, based on 2011 data (www.hospitalmedicine.org/survey), is based on the most recent data available, and it showed (on page 60) that an average of 7% of pay was tied to performance for nonacademic hospitalist groups serving adults only. This included any payments for good individual or group performance on quality, efficiency, service, satisfaction, and/or other nonproduction measures. In conversation, this often is referred to as a “bonus” rather than “performance compensation.”
One way to estimate the nonbonus compensation would be to reduce the total pay by 7%, which comes to $223,200. Keep in mind that there are all kinds of mathematical and methodological problems in manipulating the reported survey numbers from two separate surveys to derive additional benchmarks. But this seems like a reasonable guess.
An increasing portion of hospitalist groups have some pay tied to performance, and the portion of total pay tied to performance seems to be going up at least a little. It was 5% of pay in 2010 and 4% in 2011, compared with 7% in the 2012 survey.
Keep in mind two things. First, this 7% reflects the performance or bonus dollars actually paid out, not the total amount available. In other words, even if the median total bonus dollars available were 20% of compensation, hospitalists earned less than that. Some hospitalists earned all dollars available, and some earned only a portion of what was available. And second, some hospitalists fail to earn any bonus or don’t have one available at all. So the survey would show for them zero compensation tied to bonus.
Making Sense of the Numbers
If you follow the reasoning above, then you probably agree that if your goal is to match mean compensation from the MGMA survey (I’m not suggesting that is the best goal, merely using it for simplicity), then you would set nonbonus compensation 7% below median—as long as you’re likely to get the same portion of a bonus as the median practice.
In some practices, performance thresholds are set at a level that is very easy to achieve, meaning the hospitalists are almost guaranteed to get all of the bonus compensation available. To be consistent with survey medians, it would be appropriate for them to set nonbonus compensation by subtracting all bonus dollars from the survey median. For example, if a $20,000 bonus is available and all of it is likely to be earned by the hospitalists, then total nonbonus compensation would be $220,000.
However, what if the bonus requires significant improvements in performance by the doctors (which seems most appropriate to me; why have a bonus otherwise?) and it is likely they will earn only 25% of all bonus dollars available? If the total available bonus is $20,000, then something like 25%, or $5,000, should be subtracted from the median to yield a total nonbonus compensation of $235,000.
Simple Thinking
I think it makes most sense to set total nonbonus compensation below the targeted total compensation. Failure to achieve any performance thresholds means no bonus and compensation will be below target that year. Meeting some thresholds (some improvement in performance) should result in matching the target compensation, and truly terrific performance that meets or exceeds all thresholds should result in the doctor being paid above the target.
Dr. Nelson has been a practicing hospitalist since 1988. He is co-founder and past president of SHM, and principal in Nelson Flores Hospital Medicine Consultants. He is co-director for SHM’s “Best Practices in Managing a Hospital Medicine Program” course. Write to him at [email protected].
Proactive Approaches Necessary to Offset Primary-Care Physician Shortage

As I was reading my departmental, end-of-the-academic-year newsletter, I was pondering my own group’s hospitalist pipeline. Each year, I earnestly read the list of internal-medicine-program graduates, focusing on what and where they are going to practice. I first selfishly scan the list for “hospital medicine, MUSC.” Then I go back and reread the list to see who I can now send my discharges to or who I can refer any new friends or relatives who move to town, scanning the list for “primary care, MUSC.”
This year, similar to recent years, the list for “primary care” is slim.
SHM has long been motivated to think about the pipeline, about how to get the best and the brightest interested in practicing HM, and practicing primary care, as they are vital partners in the spectrum of generalist care. We need to know and understand our pipeline: Where will they train, how will they be trained, will they be prepared to function and thrive in the medical industry of tomorrow? Regardless of how or where you practice, all of us should be thinking about our pipeline.
As such, all of us should be thinking about graduate medical education (GME), how it is funded, how much it is funded, and what regulations control the types of specialties that come out of U.S. training programs.1 This is especially true given the projected need for more hospitalists in all areas of the hospital of the future, the ever-expanding role of “specialty hospitalists,” and the need for hospitalists during the “peri-hospital” stay (from pre-operative clinics to post-discharge clinics). And this is especially true given the ongoing projected expanse of the primary-care shortage.
The career path for physicians starts long before medical school and is heavily shaped by what types of physicians they are exposed to, when they are exposed to them, and what their experience was. The periods of medical school and graduate medical education training can have a profound impact on the “health” of the U.S. health-care system and whether it is equipped to care for the needs of its citizens.
American taxpayers have long been in the business of funding the physician pipeline. The federal government invests $13 billion annually on graduate medical education subsidies. The money flows directly to teaching hospitals to pay for the salaries of the trainees and the salaries of the attendings who supervise their work, as well as the hospital overhead that has to be invested to house these trainees during their tenure.
Federal subsidies for apprenticeships are relatively unheard of in other industries; this funding stream was initiated with the passage of Medicare almost 50 years ago, under the provision that additional training for medical students would result in better and safer medical care for all Americans. However, what was not set up as a tagline to these federal subsidies was any type of accountability on process or outcome measures, such as how exactly do teaching hospitals invest their GME money, and how will they produce the types and amounts of physicians that the U.S. needs?
Cold, Hard Facts
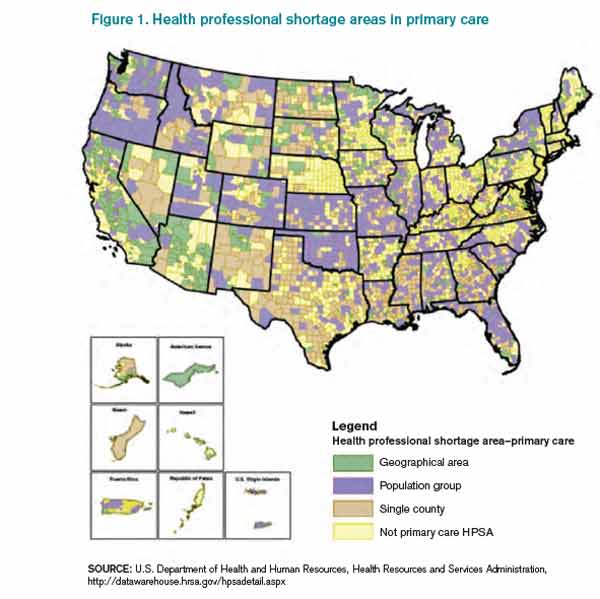
Source: U.S. Department of Health and Human Resources, Health Resources and Services Administration, http://datawarehouse.hrsa.gov/hpsadetail.aspx
So what do Americans get for that annual $13 billion investment? We get what we should expect out of the “free will” of graduating residents: We get an oversupply of specialists in areas of abundance and an undersupply of generalists in most areas. The system “produces” the most appealing specialties (those handsomely reimbursed and highly prestigious), leaving a dwindling number of generalists to be spread thinly. And the most prestigious and top-ranked academic medical centers are the least likely to produce generalists. In many of these highly ranked training programs, less than 10% of their graduates go on to work in primary care, and even fewer work in rural or public health facilities. More than 20% of all residency programs produce no primary-care physicians (PCPs) at all. Despite the $13 billion annual investment, the American Association of Medical Colleges (AAMC) predicts a shortage of 45,000 primary-care physicians by 2020.2
Because of this shortage, even fully insured Americans find the act of securing a generalist to be problematic: Almost 1 in 5 of us live in a federally designated primary-care-shortage area (see Figure 1).3 It is estimated that our current training programs will produce 40% fewer PCPs than will be needed to keep pace with the baby boomers and the insurance expansion of the Affordable Care Act. Attempts at using GME subsidies as a lever to increase the number of generalists have failed for decades. Almost 30 years ago, Dan Quayle petitioned Medicare to forgo any subsidies to training programs that did not commit to graduating at least 70% of trainees to primary-care careers, to no avail. Years later, the Institute of Medicine appealed to the federal government to reduce the training of specialists, and increase the training pool for generalists, to no avail. To reduce the financial burden of GME training, about 15 years ago, Congress threw in place a stop-gap measure, putting a freeze on the total number of residency slots that would be funded, but it did not put any measures in place to ensure that the allocation of slots would match what the U.S. health-care system needs. This has left us in a global shortage of physicians, the most grotesque of which is among generalists in regions of greatest need.
The Good News
So where does this leave hospitalists? Fortunately for our specialty, hospital medicine remains very appealing to new graduates and to the health-care system. For new graduates, it offers a competitive salary and work-life balance, without additional fellowship training. For the health-care system, we are generalists who can enhance the “value equation,” having proven to enhance quality while simultaneously reducing cost. As generalists, our specialty remains relatively undifferentiated and flexible to meet the needs of the system, including caring for patients at many stages of an acute or chronic illness; pre-operative care; post-discharge transitions of care; and assisting in some stages of “specialty care” (e.g. the medical care of the neurologic emergency, the pregnant patient, comanagement with a variety of surgical subspecialists).
As a progressive specialty, we should continue to focus on the pipeline, not only to ensure we recruit our “favorite picks” to hospital medicine, but also to support the reform needed to enhance the appeal of generalist practices and reduce the irresistible appeal of specialty care. In this way, we can add yet another meaningful contribution to meeting the needs of the U.S. health-care system.
Dr. Scheurer is a hospitalist and chief quality officer at the Medical University of South Carolina in Charleston. She is physician editor of The Hospitalist. Email her at [email protected].
References
- Longman P. First teach no harm. The Washington Monthly website. Available at: http://www.washingtonmonthly.com/magazine/july_august_2013/features/first_teach_no_harm045361.php?page=all. Accessed Aug. 4, 2013.
- Association of American Medical Colleges. Physician shortages to worsen without increases in residency training. Association of American Medical Colleges website. Available at: https://www.aamc.org/download/150612/data/md-shortage.pdf. Accessed Aug. 4, 2013.
As I was reading my departmental, end-of-the-academic-year newsletter, I was pondering my own group’s hospitalist pipeline. Each year, I earnestly read the list of internal-medicine-program graduates, focusing on what and where they are going to practice. I first selfishly scan the list for “hospital medicine, MUSC.” Then I go back and reread the list to see who I can now send my discharges to or who I can refer any new friends or relatives who move to town, scanning the list for “primary care, MUSC.”
This year, similar to recent years, the list for “primary care” is slim.
SHM has long been motivated to think about the pipeline, about how to get the best and the brightest interested in practicing HM, and practicing primary care, as they are vital partners in the spectrum of generalist care. We need to know and understand our pipeline: Where will they train, how will they be trained, will they be prepared to function and thrive in the medical industry of tomorrow? Regardless of how or where you practice, all of us should be thinking about our pipeline.
As such, all of us should be thinking about graduate medical education (GME), how it is funded, how much it is funded, and what regulations control the types of specialties that come out of U.S. training programs.1 This is especially true given the projected need for more hospitalists in all areas of the hospital of the future, the ever-expanding role of “specialty hospitalists,” and the need for hospitalists during the “peri-hospital” stay (from pre-operative clinics to post-discharge clinics). And this is especially true given the ongoing projected expanse of the primary-care shortage.
The career path for physicians starts long before medical school and is heavily shaped by what types of physicians they are exposed to, when they are exposed to them, and what their experience was. The periods of medical school and graduate medical education training can have a profound impact on the “health” of the U.S. health-care system and whether it is equipped to care for the needs of its citizens.
American taxpayers have long been in the business of funding the physician pipeline. The federal government invests $13 billion annually on graduate medical education subsidies. The money flows directly to teaching hospitals to pay for the salaries of the trainees and the salaries of the attendings who supervise their work, as well as the hospital overhead that has to be invested to house these trainees during their tenure.
Federal subsidies for apprenticeships are relatively unheard of in other industries; this funding stream was initiated with the passage of Medicare almost 50 years ago, under the provision that additional training for medical students would result in better and safer medical care for all Americans. However, what was not set up as a tagline to these federal subsidies was any type of accountability on process or outcome measures, such as how exactly do teaching hospitals invest their GME money, and how will they produce the types and amounts of physicians that the U.S. needs?
Cold, Hard Facts
Source: U.S. Department of Health and Human Resources, Health Resources and Services Administration, http://datawarehouse.hrsa.gov/hpsadetail.aspx
So what do Americans get for that annual $13 billion investment? We get what we should expect out of the “free will” of graduating residents: We get an oversupply of specialists in areas of abundance and an undersupply of generalists in most areas. The system “produces” the most appealing specialties (those handsomely reimbursed and highly prestigious), leaving a dwindling number of generalists to be spread thinly. And the most prestigious and top-ranked academic medical centers are the least likely to produce generalists. In many of these highly ranked training programs, less than 10% of their graduates go on to work in primary care, and even fewer work in rural or public health facilities. More than 20% of all residency programs produce no primary-care physicians (PCPs) at all. Despite the $13 billion annual investment, the American Association of Medical Colleges (AAMC) predicts a shortage of 45,000 primary-care physicians by 2020.2
Because of this shortage, even fully insured Americans find the act of securing a generalist to be problematic: Almost 1 in 5 of us live in a federally designated primary-care-shortage area (see Figure 1).3 It is estimated that our current training programs will produce 40% fewer PCPs than will be needed to keep pace with the baby boomers and the insurance expansion of the Affordable Care Act. Attempts at using GME subsidies as a lever to increase the number of generalists have failed for decades. Almost 30 years ago, Dan Quayle petitioned Medicare to forgo any subsidies to training programs that did not commit to graduating at least 70% of trainees to primary-care careers, to no avail. Years later, the Institute of Medicine appealed to the federal government to reduce the training of specialists, and increase the training pool for generalists, to no avail. To reduce the financial burden of GME training, about 15 years ago, Congress threw in place a stop-gap measure, putting a freeze on the total number of residency slots that would be funded, but it did not put any measures in place to ensure that the allocation of slots would match what the U.S. health-care system needs. This has left us in a global shortage of physicians, the most grotesque of which is among generalists in regions of greatest need.
The Good News
So where does this leave hospitalists? Fortunately for our specialty, hospital medicine remains very appealing to new graduates and to the health-care system. For new graduates, it offers a competitive salary and work-life balance, without additional fellowship training. For the health-care system, we are generalists who can enhance the “value equation,” having proven to enhance quality while simultaneously reducing cost. As generalists, our specialty remains relatively undifferentiated and flexible to meet the needs of the system, including caring for patients at many stages of an acute or chronic illness; pre-operative care; post-discharge transitions of care; and assisting in some stages of “specialty care” (e.g. the medical care of the neurologic emergency, the pregnant patient, comanagement with a variety of surgical subspecialists).
As a progressive specialty, we should continue to focus on the pipeline, not only to ensure we recruit our “favorite picks” to hospital medicine, but also to support the reform needed to enhance the appeal of generalist practices and reduce the irresistible appeal of specialty care. In this way, we can add yet another meaningful contribution to meeting the needs of the U.S. health-care system.
Dr. Scheurer is a hospitalist and chief quality officer at the Medical University of South Carolina in Charleston. She is physician editor of The Hospitalist. Email her at [email protected].
References
- Longman P. First teach no harm. The Washington Monthly website. Available at: http://www.washingtonmonthly.com/magazine/july_august_2013/features/first_teach_no_harm045361.php?page=all. Accessed Aug. 4, 2013.
- Association of American Medical Colleges. Physician shortages to worsen without increases in residency training. Association of American Medical Colleges website. Available at: https://www.aamc.org/download/150612/data/md-shortage.pdf. Accessed Aug. 4, 2013.
New Thinking, Higher Expectations Needed to Solve Hospital Readmission Problem


As we enter a new era of health-care and payment reform, we are all keenly aware of the need to limit unnecessary readmissions. We have been given tools and tips on how to most efficiently and effectively transition patients from the hospital setting to the outpatient world in order to limit the chances that they will “bounce back” to us, resulting in penalties to our hospital or health-care system. Tools such as Project BOOST and others help us to educate patients, transfer information effectively, follow up on patients post-discharge, and reconcile medications safely across the continuum of care. But without a competent and committed provider of care to “catch” the patient on the other side, we might just be dropping the ball yet again.
It is imperative as we look to safely transition patients into the next level of care that we, as hospitalists, get outside the box and begin to engage the community of care providers outside our walls, and yes, even outside of our control. We have been down this road before with other quality initiatives, which at first glance appeared to be outside our sphere of influence—such projects as post-operative antibiotic use and hospitalwide DVT prophylaxis. Given the right hospitalist leader, with the right set of leadership tools, these quality-improvement (QI) projects have been widely successful in many environments.
I would suggest that the issue of safe transitions for our patients is no different, and maybe more important, to the health and safety of our patients.
Solving the readmission problem on a local level requires an analytical approach, much like a “root-cause analysis.” We need to begin to examine the sources of our readmitted patients, as well as the routes of our discharged patients, and we need to ask ourselves if we are continuing to feed patients into the vicious circle that results in readmissions. Are there post-acute-care facilities in your area that are responsible for more than their fair share of patients returning to your service? If so, why do we continue to discharge patients to their care? Is it because we are pressured to lower length of stay, and any bed at the next level of care is better than another day in the acute-care hospital? At some point, this reasoning fails, and given the penalties coming soon, it may be better to begin to more discriminately discharge patients to facilities that provide higher-quality care and assist us in our goals to reduce unnecessary readmissions. Leading the charge in this endeavor also necessitates that we begin to engage those providers on the other side, making them aware of the quality data related to their facility and providing education and resources to assist them in improving their performance.
Realities of the Care Continuum
Several options pertaining to hospitalist groups are available. The first, already a large movement in our current marketplace, is to extend the current hospitalist group across the chasm and begin to deliver care in those post-acute facilities. Long-term acute care (LTAC) and skilled nursing facilities (SNF) are prime examples of this movement; the obvious advantage lies in the effective control of quality and efficient transfer of information that a single group can achieve when it extends to these facilities. Obviously, manpower issues and financial support are drawbacks in a model such as this.
More realistically, a group might consider taking a less aggressive approach to this problem. Educating care providers and assisting these facilities with QI projects would require fewer resources and might provide a higher return on investment (ROI) for your group and hospital. Engaging these physicians, nonphysician providers, and facility administrators is key to our ability to impact this problem. Demanding quality care for our discharged patients in terms of timeliness of follow-up, adherence to care paths, and responsiveness to changes in condition should be non-negotiable and factored into our development of referral patterns.
As our population of patients continues to be more acutely ill, and the level of care provided at post-acute care facilities continues to rise, our current reality is that a majority of these patients, at any given time, meet hospital admissions criteria. Preventing readmissions requires that post-acute care providers have mechanisms in place to stop the “knee-jerk” transfer to the emergency department, rather than attempt to evaluate and treat the patient in the facility. Interact II (http://interact2.net/index.aspx) is a resource that provides tools for post-acute-care facilities to use in monitoring their own internal data around acute-care transfers. It also provides tracking tools, communication strategies, advanced-care-planning tools, and clinical pathways for limiting the number of acute-care transfers. The reality is, once these patients end up in the emergency department, they are likely to be referred to us for consideration of readmission. The best way to stop this is to stop the transfer before it happens.
Demand Better
We, as hospitalists, need to begin to leverage our own “buying power” as it relates to the care of our patients post-discharge. We can start by educating and assisting care providers on a local level to improve compliance with well-known standards of care that prevent unnecessary readmissions. We need to be prepared to wield our collective weight as a specialty to demand from our post-acute care colleagues what has been demanded of us over the last several years: quality and value. Make no mistake—hospitalists have to get outside the box.
Dr. Harrington is an SHM board member and chief medical officer of Locum Leaders in Alpharetta, Ga.
Project BOOST Study Documents Modest Impact on 30-Day Hospital Readmissions

Initial research on outcomes following Project BOOST (Better Outcomes for Older Adults through Safe Transitions) implementation shows modest improvement in rehospitalization rates. Moreover, some experts suggest the real problem might lie in using 30-day hospital readmissions, now a target for Medicare reimbursement penalties, as the quality metric for care transitions out of the hospital.
Study data showed a 2% absolute reduction in all-patient, 30-day readmission rates at 11 of the original 30 BOOST sites (to 12.7% from 14.7%), according to an article in the August issue of the Journal of Hospital Medicine.1
“Everybody has talked about readmissions as the quality target, but really it should be about improving transitions of care for the patient going home,” says Ashish Jha, MD, MPH, of the Harvard School of Public Health, Health Policy and Management. “If we’re going to use readmissions as our quality measure, maybe we’re set up to fail. Can we do care transitions better? Yes, we can. Can we do better quality measures? Yes. My take-home message is that we should get clearer on what we are trying to achieve.”
Project BOOST (www.hospitalmedicine.org/boost) has been a major quality initiative for SHM since 2008 and one of several national programs aimed at helping hospitals improve care-transitions processes and patient outcomes. BOOST offers participating sites an online toolkit of strategies and interventions, along with the support of an expert mentor.
“Participation in Project BOOST appeared to be associated with a decrease in readmission rates,” the authors conclude. But two accompanying editorials in the journal expressed disappointment with a lack of “robustness” to these results and lack of participation by BOOST sites.2,3 The editorials also acknowledge the challenges of multisite, voluntary research on a topic that, so far, has largely resisted validated, generalizable research outcomes demonstrating what really works in preventing readmissions.
“I think people want a silver bullet on this issue,” says lead author Luke Hansen, MD, MHS, of the division of hospital medicine at Northwestern University Feinberg School of Medicine in Chicago. “They want to be able to define an intervention to take care of all of the avoidable fraction of rehospitalizations. But I don’t think that’s possible. The disappointment may come from the fact that this is a more complicated issue than we thought.”
Dr. Hansen says data reporting was voluntary and uncompensated, and the BOOST research team is trying to facilitate better reporting from subsequent cohorts. He says one of BOOST’s unique aspects—tailoring interventions to local circumstances—could be a drawback to outcomes research. “We have to incorporate the diversity of experience into our research methods and our expectations,” he says.
Hospitalist Bradley Flansbaum, DO, MPH, FACP, SFHM, of Lenox Hill Hospital in New York City says BOOST reinforces many of things hospitalists should be doing to provide optimal discharges and transitions
.
—Ashish Jha, MD, MPH, Harvard School of Public Health, Health Policy, and Management, Boston
“Like appropriate teaching and patient education, medication reconciliation, and setting up follow-up appointments,” says Dr. Flansbaum, a member of SHM’s Public Policy Committee and regular contributor to SHM’s Practice Management blog. “But if there was one thing I’d like hospitalists to take home from this research, it’s the cognitive dissonance—the challenge of matching the evidence with what the regulatory bodies expect from us and knowing that the evidence is falling short.
“As much as we might be held accountable for outcomes like readmissions, the reality is that we can’t control them. What we’re learning is that this is really hard to do.”
Amy Boutwell, MD, MPP, a hospitalist in Newton, Mass., and founder of Collaborative Healthcare Strategies, agrees transitions of care are difficult. However, she also thinks hospitals and hospitalists cannot wait for conclusive research that proves what works in preventing readmissions.
“The BOOST results reflect my own experience working with more than a hundred STAAR [State Action on Avoidable Readmissions] hospitals. We haven’t yet been able to sufficiently extract the data about readmissions from the field—and we need to figure out how to do that,” she says. “But when you look at the issue from a patient’s perspective and their desire for a safe transition, why would you not do the things recommended by Project BOOST and similar initiatives?”
Primary-care physicians (PCPs) need to know about major changes in a discharged patient’s plan of care in a timely manner, along with any results from pending lab tests, Dr. Boutwell explains. She emphasizes that patients and their caregivers need to be given clear discharge instructions when they leave the hospital.
“We have an obligation to do what we know to be best practices and standards of care. The BOOST toolkit of recommendations is very comprehensive and gives hospitals a lot of options to improve their internal processes,” Dr. Boutwell says. “It’s hard to argue against any of them, even if it’s hard to draw clear links between them and readmissions rates. These are the self-evident, basic tasks that I would want done for myself or my child or my parent, if we were in the hospital.”
Larry Beresford is a freelance writer in San Francisco.
References
- Hansen L, Greenwald J, Budnitz T, et al. Project BOOST: Effectiveness of a multihospital effort to reduce rehospitalization. J Hosp Med. 2013;8(8):421-427. doi: 10.1002/jhm.2054. Epub 2013 Jul 22.
- Auerbach A, Fang M, Glasheen J, Brotman D, O’Leary KJ, Horwitz LJ. BOOST: Evidence needing a lift. J Hosp Med. 2013;8(8):468-469. doi: 10.1002/jhm.2065. Epub 2013 Jul 22.
- Jha A. BOOST and readmissions: Thinking beyond the walls of the hospital. J Hosp Med. 2013;8(8):470-471. doi: 10.1002/jhm.2069. Epub 2013 Jul 22.
Wasteful Practices in Hospital Cardiac Services Identified
A recent article in the American Journal of Medical Quality reviewed 366 cardiac-related medical studies and 21 practice guidelines to identify eight measures of potential waste in hospital cardiac services.4 The wasteful measures included excess use of higher-cost implantable cardioverter-defibrillators and similar cardiac devices, the use of dual-chamber defibrillators rather than single-chamber devices, and excess lengths of stay in the hospital. The eight measures were validated with data from 261 hospitals.
The authors emphasize that their set of measures is not designed to determine clinical appropriateness but to highlight areas of potential overutilization that can be benchmarked with other hospitals.
Larry Beresford is a freelance writer in San Francisco.
References
- Hartocollis A. With money at risk, hospitals push staff to wash hands. The New York Times website. Available at: http://www.nytimes.com/2013/05/29/nyregion/hospitals-struggle-to-get-workers-to-wash-their-hands.html?pagewanted=all&_r=0. Accessed May 28, 2013.
- Cumbler E, Castillo L, Satorie L, et al. Culture change in infection control: applying psychological principles to improve hand hygiene. J Nurs Care Qual. 2013 May 10 [Epub ahead of print].
- Bernhard B. High tech hand washing comes to St. Louis hospital. St. Louis Post-Dispatch website. Available at: http://www.stltoday.com/lifestyles/health-med-fit/health/high-tech-hand-washing-comes-to-st-louis-hospital/article_9379065d-85ff-5643-bae2-899254cb22fa.html. Accessed June 27, 2013.
- Lowe TJ, Partovian C, Kroch E, Martin J, Bankowitz R. Measuring cardiac waste: the Premier cardiac waste measures. Am J Med Qual. 2013 May 29 [Epub ahead of print].
- Elixhauser A, Steiner C. Readmissions to U.S. hospitals by diagnosis, 2010. Healthcare Cost and Utilization Project website. Available at: http://www.hcup-us.ahrq.gov/reports/statbriefs/sb153.pdf. Accessed July 15, 2013.
- Jackson Healthcare. Filling the void: 2013 physician outlook & practice trends. Jackson Healthcare website. Available at: http://www.jacksonhealthcare.com/media/193525/jc-2013physiciantrends-void_ebk0513.pdf. Accessed July 15, 2013.
Applied Psychology Improves Hand Hygiene in Hospitals
According to a recent New York Times report, hand-hygiene compliance in hospitals can be as low as 30%, with serious implications regarding hospital-acquired infections.1 While many initiatives have employed secret observers, vibrating badges, or hand-washing coaches, a Research, Innovations, and Clinical Vignettes (RIV) poster at HM13 outlined how a multidisciplinary committee at University of Colorado Hospital in Aurora applied principles of psychology to the challenge of compliance.2
The initiative focused on behavioral changes: surreptitiously auditing staff behaviors, real-time feedback, and immediate public corrections for observed nonadherence on the test unit from an infection-control champion. The study randomly assigned daily auditing responsibilities across all members of the nursing staff, including aides. Taking a page from soccer referees, auditors handed out red tickets to hygiene violators—and individually wrapped Life Savers to reinforce adherence.
When unprofessional behavior is the response to a verbal correction, leadership has to be prepared to act, explains hospitalist and lead author Ethan Cumbler, MD, FACP.
“We need to stop thinking about hospital staff and physicians as rational actors when it comes to hand hygiene, but as social animals who will respond to positive and negative reinforcements and group culture,” he says.
Noncompliant hand hygiene is largely unconscious behavior that needs to be brought to conscious attention but is amenable to change, Dr. Cumbler says, adding that “unit leadership steps in for repeated nonadherence or an unprofessional response to correction. We have never needed to intervene more than once with the same person.”
Hand-hygiene adherence reached 97% on the pilot unit in the second quarter of 2012 and has remained at that level, Dr. Cumbler says. Additionally, iatrogenic infections dropped to zero from 4.8 per 1,000 urinary catheter days, with bloodstream infections falling at a similar rate.
Similar results with hand-hygiene compliance have been reported at St. Mary’s Health Center in St. Louis, which has been testing a system that reminds nurses to wash their hands at various checkpoints in the hospital, tracking their compliance with a badge that turns green when registering the presence of hand sanitizer, thereby informing patients that the nurse’s hands are clean.
The system, developed by Biovigil Hygiene Technologies of Ann Arbor, Mich., started on two pilot units last year, where compliance has grown to 97% and 99%, respectively. System set-up can cost about $2,000 per patient room, plus monthly subscriptions per employee, but more hospitals in the system could sign on next year, reports the St. Louis Post-Dispatch.3
Larry Beresford is a freelance writer in San Francisco.
References
- Hartocollis A. With money at risk, hospitals push staff to wash hands. The New York Times website. Available at: http://www.nytimes.com/2013/05/29/nyregion/hospitals-struggle-to-get-workers-to-wash-their-hands.html?pagewanted=all&_r=0. Accessed May 28, 2013.
- Cumbler E, Castillo L, Satorie L, et al. Culture change in infection control: applying psychological principles to improve hand hygiene. J Nurs Care Qual. 2013 May 10 [Epub ahead of print].
- Bernhard B. High tech hand washing comes to St. Louis hospital. St. Louis Post-Dispatch website. Available at: http://www.stltoday.com/lifestyles/health-med-fit/health/high-tech-hand-washing-comes-to-st-louis-hospital/article_9379065d-85ff-5643-bae2-899254cb22fa.html. Accessed June 27, 2013.
- Lowe TJ, Partovian C, Kroch E, Martin J, Bankowitz R. Measuring cardiac waste: the Premier cardiac waste measures. Am J Med Qual. 2013 May 29 [Epub ahead of print].
- Elixhauser A, Steiner C. Readmissions to U.S. hospitals by diagnosis, 2010. Healthcare Cost and Utilization Project website. Available at: http://www.hcup-us.ahrq.gov/reports/statbriefs/sb153.pdf. Accessed July 15, 2013.
- Jackson Healthcare. Filling the void: 2013 physician outlook & practice trends. Jackson Healthcare website. Available at: http://www.jacksonhealthcare.com/media/193525/jc-2013physiciantrends-void_ebk0513.pdf. Accessed July 15, 2013.