User login
A new way to treat ear infections
A new way to treat ear infections in children called "individualized care" is described in the May 2013 issue of Pediatric Infectious Diseases Journal. It explains how to reduce the frequency of repeated ear infections nearly 500% and how to reduce the need for ear tube surgery by 600% in your practice.
Dr. Janet Casey at Legacy Pediatrics in Rochester, N.Y.; Anthony Almudevar, Ph.D., of the University of Rochester; and I conducted the prospective, longitudinal multiyear study with the support of the National Institutes of Health’s National Institute for Deafness and Communication Disorders and the Thrasher Research Fund (Pediatr. Infect. Dis. J. 2013 Jan. 21 [Epub ahead of print]).
The study compared three groups: children who were in the Legacy Pediatrics practice and received individualized care; control children in the Legacy practice who did not participate because their parents declined participation (they did not want venipunctures or ear taps); and community controls drawn from a different pediatric practice in the suburbs of Rochester that used the diagnostic criteria of the American Academy of Pediatrics and treated all children empirically with high-dose amoxicillin as endorsed by the former and new AAP treatment guidelines (Pediatrics 2013;131:e964-99).
The new treatment paradigm of individualized care included a tympanocentesis procedure, also called an ear tap, to determine precisely the bacteria causing the ear infection. Treatment was started with high-dose amoxicillin/clavulanate. The sample of fluid then was taken to my laboratory at the Rochester General Hospital Research Institute, where the bacteria isolated were tested against a panel of antibiotics to determine whether to continue with amoxicillin/clavulanate or switch to a more effective antibiotic for the child based on culture susceptibility. By doing the ear tap and antibiotic testing, the frequency of repeated ear infections was reduced by 250%, compared with the Legacy practice controls who did not participate, and by 460%, compared with the community controls.
The most common reason for children to receive ear tubes is repeated ear infections, so when the frequency of ear infections was reduced so too was the frequency of ear tube surgery. The new treatment approach resulted in 260% fewer ear tube surgeries in the individualized care group, compared with the Legacy Pediatrics controls, and 620% fewer surgeries than the community controls.
Allowing the child to receive an ear tap was a requirement for the study. Dr. Casey and I found a way to do the procedure painlessly by instilling 8% Novocain in the ear canal as drops to anesthetize the tympanic membrane. After 15 minutes there was no pain when the tap was done. We used a papoose to hold the child still.
The ear-tap procedure not only allowed individualized care with the astonishing results reported, it also allowed more rapid healing of the ear since removal of the pus and bacteria from behind the ear allowed the antibiotics to work better and the immune system to clear the infection more effectively.
The article discusses reasons for the remarkable difference in results with the individualized care approach. First, Dr. Casey and I have undergone special training from ear, nose, and throat (ENT) doctors in the diagnosis of ear infections.
In earlier studies, a group of experts in otitis media diagnosis joined together in a continuing medical education course sponsored by Outcomes Management Education Workshops to use video exams to test whether pediatricians, family physicians, and urgent care physicians knew how to correctly distinguish true acute otitis media (AOM) from otitis media with effusion (OME) and variations of normal in the tympanic membrane exam. We found that all three specialty groups and residents in training in all three specialties and nurse practitioners and physician assistants overdiagnosed AOM about half the time.
Second, the selection of antibiotic proved to be key. Dr. Casey and I have the only otitis media research center in the United States providing tympanocentesis data at the current time. We have found that amoxicillin kills the bacteria causing AOM infections in children in the Rochester area only about 30% of the time. By knowing the bacteria, an evidence-based antibiotic can be chosen.
I expect that readers of this column will believe they diagnose AOM correctly nearly all the time and that it is the other physician who overdiagnoses. I expect that readers will be reluctant to not adhere to the AAP guideline recommendation of using amoxicillin as the treatment of first choice. Most of all, I expect readers to be reluctant to undertake training on how to do the ear tap procedure. Change is always resisted by the majority, and only with time does it occur if the evidence is strong and there is growing adoption.
Nevertheless, I encourage all to find an opportunity to attend a CME course on AOM diagnosis and I hope that resident training programs will incorporate more effective teaching on AOM diagnosis. I recommend high-dose amoxicillin/clavulanate as the treatment of choice for AOM; if it is not tolerated, then one of the preferred cephalosporins endorsed by the AAP guideline should be chosen.
I recommend that resident training programs include tympanocentesis as part of the curriculum. Why are residents taught how to do a spinal tap, arterial artery puncture, and lung tap but not an ear tap? I also recommend that practicing pediatricians gain the skill to perform tympanocentesis as well. I recognize that some just won’t have the hand/eye coordination or steady hand needed, so it’s not for everyone. However, especially in group practices, a few trained providers could become an internal referral resource for getting the procedure done.
Arguments about malpractice are a smokescreen. The risks of tympanocentesis are no greater than venipuncture in trained and skilled hands. It is included as a standard procedure for pediatricians in our state without any additional malpractice insurance costs. And Dr. Casey and I have effectively managed to get the procedure done when a patient needs it without blowing our schedules off the map and raising the ire of patients and staff. It just takes a commitment.
It would be convenient to refer to an ENT doctor for a tympanocentesis, but most ENT doctors have not been trained to do the procedure while the child is awake and prefer to have the child asleep. Also, try to get a child in for an appointment with an ENT with no notice on the same day! Moreover, ENT doctors have been trained that if an ear tap is needed then it is advisable to go ahead and put in an ear tube.
Because of the success of this research, our center received a renewal of support from NIH in 2012 to continue the study through 2017. Several pediatric practices in Rochester are part of the research – Long Pond Pediatrics, Westfall Pediatrics, Sunrise Pediatrics, Lewis Pediatrics, and Pathway Pediatrics – as well as Dr. Margo Benoit of the department of otolaryngology at the University of Rochester and Dr. Frank Salamone and Dr. Kevin Kozara of the Rochester Otolaryngology Group, which is affiliated with Rochester General Hospital.
Dr. Pichichero, a specialist in pediatric infectious diseases, is director of the Rochester (N.Y.) General Hospital Research Institute. He is also a pediatrician at Legacy Pediatrics in Rochester. He said he had no relevant financial conflicts of interest to disclose.

Hospitalist Communication Training
Hospital settings present unique challenges to patient‐clinician communication and collaboration. Patients frequently have multiple, active conditions. Interprofessional teams are large and care for multiple patients at the same time, and team membership is dynamic and dispersed. Moreover, physicians spend relatively little time with patients[1, 2] and seldom receive training in communication skills after medical school.
The Agency for Healthcare Research and Quality (AHRQ) has developed the Hospital Consumer Assessment of Healthcare Providers and Systems (HCAHPS) survey to assess hospitalized patients' experiences with care.[3, 4, 5] Results are publicly reported on the US Department of Health and Human Services Hospital Compare Web site[6] and now affect hospital payment through the Center for Medicare and Medicaid Services Hospital Value‐Based Purchasing Program.[7]
Despite this increased transparency and accountability for performance related to the patient experience, little research has been conducted on how hospitals or clinicians might improve performance. Although interventions to enhance physician communication skills have shown improvements in observed behaviors, few studies have assessed benefit from the patient's perspective and few interventions have been integrated into practice.[8] We sought to assess the impact of a communication‐skills training program, based on a common framework used by hospitals, on patient satisfaction with doctor communication and overall hospital care.
METHODS
Setting and Study Design
The study was conducted at Northwestern Memorial Hospital (NMH), an 897‐bed tertiary‐care teaching hospital in Chicago, IL, and was approved by the institutional review board of Northwestern University. This study was a preintervention vs postintervention comparison of patient‐satisfaction scores. The intervention was a communication‐skills training program for all NMH hospitalists. We compared patient‐satisfaction survey data for patients admitted to the nonteaching hospitalist service during the 26 weeks prior to the intervention with data for patients admitted to the same service during the 22 weeks afterward. Hospitalists on this service worked 7 consecutive days, usually followed by 7 days free from clinical duty. Hospitalists cared for approximately 1014 patients per day without the assistance of resident physicians or midlevel providers (ie, physician assistants or nurse practitioners). Nighttime patient care was provided by in‐house hospitalists (ie, nocturnists). A majority of nighttime shifts were staffed by physicians who worked for the group for a single year. As a result of a prior intervention, hospitalists' patients were localized to specific units, each overseen by a hospitalist‐unit medical director.[9] We excluded all patients initially admitted to other services (eg, intensive care unit, surgical services) and patients discharged from other services.
Hospitalist Communication Skills Training Program
Northwestern Memorial Hospital implemented a communication‐skills training program in 2009 intended to enhance patient experience and improve patient‐satisfaction scores. All nonphysician staff were required to attend a 4‐hour training session based on the AIDET (Acknowledge, Introduce, Duration, Explanation, and Thank You) principles developed by the Studer Group.[10] The Studer Group is a well‐known healthcare consulting firm that aims to assist healthcare organizations to improve clinical, operational, and financial outcomes. The acronym AIDET provides a framework for communication‐skills behaviors (Table 1).
| AIDET Element | Explanation | Examples |
|---|---|---|
| ||
| Acknowledge | Use appropriate greeting, smile, and make eye contact. | Knock on patient's door. Hello, may I come in now? |
| Respect privacy: Knock and ask for permission before entering. Use curtains/doors appropriately. | Good morning. Is it a good time to talk? | |
| Position yourself on the same level as the patient. | Who do you have here with you today? | |
| Do not ignore others in the room (visitors or colleagues). | ||
| Introduce | Introduce yourself by name and role. | My name is Dr. Smith and I am your hospitalist physician. I'll be taking care of you while you are in the hospital. |
| Introduce any accompanying members of your team. | When on teaching service: I'm the supervising physician or I'm the physician in charge of your care. | |
| Address patients by title and last name (eg, Mrs. Smith) unless given permission to use first name. | ||
| Explain why you are there. | ||
| Do not assume patients remember your name or role. | ||
| Duration | Provide specific information on when you will be available, or when you will be back. | I'll be back between 2 and 3 pm, so if you think of any additional questions I can answer them then. |
| For tests/procedures: Explain how long it will take. Provide a time range for when it will happen. | In my experience, the test I am ordering for you will be done within the next 12 to 24 hours. | |
| Provide updates to the patient if the expected wait time has changed. | I should have the results for this test when I see you tomorrow morning. | |
| Do not blame another department or staff for delays. | ||
| Explanation | Explain your rationale for decisions. | I have ordered this test because |
| Use terms the patient can understand. | The possible side effects of this medication include | |
| Explain next steps/summarize plan for the day. | What questions do you have? | |
| Confirm understanding using teach back. | What are you most concerned about? | |
| Assume patients have questions and/or concerns. | I want to make sure you understood everything. Can you tell me in your own words what you will need to do once you are at home? | |
| Do not use acronyms that patients may not understand (eg, PRN, IR, ICU). | ||
| Thank you | Thank the patient and/or family. | I really appreciate you telling me about your symptoms. I know you told several people before. |
| Ask if there is anything else you can do for the patient. | Thank you for giving me the opportunity to care for you. What else can I do for you today? | |
| Explain when you will be back and how the patient can reach you if needed. | I'll see you again tomorrow morning. If you need me before then, just ask the nurse to page me. | |
| Do not appear rushed or distracted when ending your interaction. | ||
We adapted the AIDET framework and designed a communication‐skills training program, specifically for physicians, to emphasize reflection on current communication behaviors, deliberate practice of enhanced communication skills, and feedback based on performance during simulated and real clinical encounters. These educational methods are consistent with recommended strategies to improve behavioral performance.[11] During the first session, we discussed measurement of patient satisfaction, introduced AIDET principles, gave examples of specific behaviors for each principle, and had participants view 2 short videos displaying a range of communication skills followed by facilitated debriefing.[12] The second session included 3 simulation‐based exercises. Participants rotated roles in the scenarios (eg, patient, family member, physician) and facilitated debriefing was co‐led by a hospitalist leader (K.J.O.) and a patient‐experience administrative leader (either T.D. or J.R.). The third session involved direct observation of participants' clinical encounters and immediate feedback. This coaching session was performed for an initial group of 5 hospitalist‐unit medical directors by the manager of patient experience (T.D.) and subsequently by these medical directors for the remaining participants in the program. Each of the 3 sessions lasted 90 minutes. Instructional materials are available from the authors upon request.
The communication‐skills training program began in August 2011 and extended through January 2012. Participation was strongly encouraged but not mandatory. Sessions were offered multiple times to accommodate clinical schedules. One of the co‐investigators took attendance at each session to assess participation rates.
Survey Instruments and Data
During the study period, NMH used a third‐party vendor, Press Ganey Associates, Inc., to administer the HCAHPS survey to a random sample of 40% of hospitalized patients between 48 hours and 6 weeks after discharge. The HCAHPS survey has 27 total questions, including 3 questions assessing doctor communication as a domain.[3] In addition to the HCAHPS questions, the survey administered to NMH patients included questions developed by Press Ganey. Questions in the surveys used ordinal response scales. Specifically, response options for HCAHPS doctor‐communication questions were never, sometimes, usually, and always. Response options for Press Ganey doctor‐communication questions were very poor, poor, fair, good, and very good. Patients provided an overall hospital rating in the HCAHPS survey using a 010 scale, with 0=worst hospital possible and 10=best hospital possible.
We defined the preintervention period as the 26 weeks prior to implementation of the communication‐skills program (patients admitted on or between January 31, 2011, and July 31, 2011) and the postintervention period as the 22 weeks after implementation (patients admitted on or between January 31, 2012, and June 30, 2012). The postintervention period was 1 month shorter than the preintervention period in an effort to avoid confounding due to a number of new hospitalists starting in July 2012. We defined a discharge attending as highly trained if he/she attended all 3 sessions of the communication‐skills training program. The discharge attending was designated as no/low training if he/she attended fewer than the full 3 sessions.
Data Analysis
Data were obtained from the Northwestern Medicine Enterprise Data Warehouse, a single, integrated database of all clinical and research data from all patients receiving treatment through Northwestern University healthcare affiliates. We used 2 and Student t tests to compare patient demographic characteristics preintervention vs postintervention. We used 2 tests to compare the percentage of patients giving top‐box ratings to each doctor‐communication question (ie, always for HCAHPS and very good for Press Ganey) and giving an overall hospital rating of 9 or 10. We used top‐box comparisons, rather than comparison of mean or median scores, because patient‐satisfaction data are typically highly skewed toward favorable responses. This approach is consistent with prior HCAHPS research.[4, 5] We calculated composite doctor‐communication scores as the proportion of top‐box responses across items in each survey (ie, HCAHPS and Press Ganey). We first compared all patients during the preintervention and postintervention period. We then identified patients for whom the discharge attending worked as a hospitalist at NMH during both the preintervention and postintervention periods and compared satisfaction for patients discharged by hospitalists who had no/low training and for patients discharged by hospitalists who were highly trained. We performed multivariate logistic regression, using intervention period as the predictor variable and top‐box rating as the outcome variable for each doctor‐communication question and for overall hospital rating of 9 or 10. Covariates included patient age, sex, race, payer, self‐reported education level, and self‐reported health status. Models accounted for clustering of patients within discharge physicians. Similarly, we conducted multivariate logistic regression, using discharge attending category as the predictor variable (no/low training vs highly trained). The various comparisons described were intended to mimic intention to treat and treatment received analyses in light of incomplete participation in the communication‐skills program. All analyses were conducted using Stata version 11.2 (StataCorp, College Station, TX).
RESULTS
Overall, 61 (97%) of 63 hospitalists completed the first session, 44 (70%) completed the second session, and 25 (40%) completed the third session of program. Patient‐satisfaction data were available for 278 patients during the preintervention period and 186 patients during the postintervention period. Patient demographic characteristics were similar for the 2 periods (Table 2).
| Characteristic | Preintervention (n=278) | Postintervention (n=186) | P Value |
|---|---|---|---|
| |||
| Mean age, y (SD) | 62.8 (17.0) | 61.6 (17.6) | 0.45 |
| Female, no. (%) | 155 (55.8) | 114 (61.3) | 0.24 |
| Nonwhite race, no. (%) | 87 (32.2) | 53 (29.1) | 0.48 |
| Highest education completed, no. (%) | |||
| Did not complete high school | 12 (4.6) | 6 (3.3) | 0.45 |
| High school | 110 (41.7) | 81 (44.0) | |
| 4‐year college | 50 (18.9) | 43 (23.4) | |
| Advanced degree | 92 (34.9) | 54 (29.4) | |
| Payer, no. (%) | |||
| Medicare | 137 (49.3) | 89 (47.9) | 0.83 |
| Private | 113 (40.7) | 73 (39.3) | |
| Medicaid | 13 (4.7) | 11 (5.9) | |
| Self‐pay/other | 15 (5.4) | 13 (7.0) | |
| Self‐reported health status, no. (%) | |||
| Poor | 19 (7.1) | 18 (9.8) | 0.41 |
| Fair | 53 (19.7) | 43 (23.4) | |
| Good | 89 (33.1) | 57 (31.0) | |
| Very good | 89 (33.1) | 49 (26.6) | |
| Excellent | 19 (7.1) | 17 (9.2) | |
Patient Satisfaction With Hospitalist Communication
The HCAHPS and Press Ganey doctor communication domain scores were not significantly different between the preintervention and postintervention periods (75.8 vs 79.2, P=0.42 and 61.4 vs 65.9, P=0.39). Two of the 3 HCAHPS items assessing doctor communication were rated higher during the postintervention period, but no result was statistically significant (Table 3). Similarly, all 5 of the Press Ganey items assessing doctor communication were rated higher during the postintervention period, but no result was statistically significant. The HCAHPS overall rating of hospital care was also not significantly different between the preintervention and postintervention period. Results were similar in multivariate analyses, with no items showing statistically significant differences between the preintervention and postintervention periods.
| Unadjusted Analysisa | Adjusted Analysis | ||||
|---|---|---|---|---|---|
| Preintervention, No. (%) [n=270277] | Postintervention, No. (%) [n=183186] | P Value | OR (95% CI) | P Value | |
| |||||
| HCAHPS doctor‐communication domain | |||||
| How often did doctors treat you with courtesy and respect? | 224 (83) | 160 (86) | 0.31 | 1.23 (0.81‐2.44) | 0.22 |
| How often did doctors listen carefully to you? | 205 (75) | 145 (78) | 0.52 | 1.22 (0.74‐2.04) | 0.42 |
| How often did doctors explain things in a way you could understand? | 203 (75) | 137 (74) | 0.84 | 0.98 (0.59‐1.64) | 0.94 |
| Press Ganey physician‐communication domain | |||||
| Skill of physician | 189 (68) | 137 (74) | 0.19 | 1.38 (0.82‐2.31) | 0.22 |
| Physician's concern for your questions and worries | 157 (57) | 117 (64) | 0.14 | 1.30 (0.79‐2.12) | 0.30 |
| How well physician kept you informed | 158 (58) | 114 (62) | 0.36 | 1.15 (0.78‐1.72) | 0.71 |
| Time physician spent with you | 140 (51) | 101 (54) | 0.43 | 1.12 (0.66‐1.89) | 0.67 |
| Friendliness/courtesy of physician | 198 (71) | 136 (74) | 0.57 | 1.20 (0.74‐1.94) | 0.46 |
| HCAHPS global ratings | |||||
| Overall rating of hospital | 189 (70) [n=270] | 137 (74) [n=186] | 0.40 | 1.33 (0.82‐2.17) | 0.24 |
Pre‐post comparisons based on level of hospitalist participation in the training program are shown in Table 4. For patients discharged by no/low‐training hospitalists, 4 of the 8 total items assessing doctor communication were rated higher during the postintervention period, and 4 were rated lower, but no result was statistically significant. For patients discharged by highly trained hospitalists, all 8 items assessing doctor communication were rated higher during the postintervention period, but no result was statistically significant. Multivariate analyses were similar, with no items showing statistically significant differences between the preintervention and postintervention periods for either group.
| No/Low Training | Highly Trained | |||||||||
|---|---|---|---|---|---|---|---|---|---|---|
| Unadjusted Analysisa | Adjusted Analysis | Unadjusted Analysisa | Adjusted Analysis | |||||||
| Preintervention, No. (%) [n=151156] | Postintervention, No. (%) [n=6770] | P Value | OR (95% CI) | P Value | Preintervention, No. (%) [n=119122] | Postintervention, No. (%) [n=115116] | P Value | OR (95% CI) | P Value | |
| ||||||||||
| HCAHPS doctor‐ communication domain | ||||||||||
| How often did doctors treat you with courtesy and respect? | 125 (83) | 61 (88) | 0.28 | 1.79 (0.82‐3.89) | 0.14 | 99 (83) | 99 (85) | 0.65 | 1.33 (0.62‐2.91) | 0.46 |
| How often did doctors listen carefully to you? | 116 (77) | 53 (76) | 0.86 | 1.08 (0.49‐2.38) | 0.19 | 89 (74) | 92 (79) | 0.30 | 1.43 (0.76‐2.69) | 0.27 |
| How often did doctors explain things in a way you could understand? | 115 (76) | 47 (68) | 0.24 | 0.59 (0.27‐1.28) | 0.18 | 88 (74) | 90 (78) | 0.52 | 1.31 (0.68‐2.50) | 0.42 |
| Press Ganey physician‐communication domain | ||||||||||
| Skill of physician | 110 (71) | 52 (74) | 0.56 | 1.32 (0.78‐2.22) | 0.31 | 79 (65) | 85 (73) | 0.16 | 1.45 (0.65‐3.27) | 0.37 |
| Physician's concern for your questions and worries | 92 (60) | 41 (61) | 0.88 | 1.00 (0.59‐1.77) | 0.99 | 65 (53) | 76 (66) | 0.06 | 1.71 (0.81‐3.60) | 0.16 |
| How well physician kept you informed | 89 (59) | 42 (61) | 0.75 | 1.16 (0.64‐2.08) | 0.62 | 69 (57) | 72 (63) | 0.34 | 1.29 (0.75‐2.20) | 0.35 |
| Time physician spent with you | 83 (54) | 37 (53) | 0.92 | 0.87 (0.47‐1.61) | 0.65 | 57 (47) | 64 (55) | 0.19 | 1.44 (0.64‐3.21) | 0.38 |
| Friendliness/courtesy of physician | 116 (75) | 45 (66) | 0.18 | 0.72 (0.37‐1.38) | 0.32 | 82 (67) | 91 (78) | 0.05 | 1.89 (0.97‐3.68) | 0.60 |
| HCAHPS global ratings | ||||||||||
| Overall rating of hospital | 109 (73) | 53 (75) | 0.63 | 1.37 (0.67‐2.81) | 0.39 | 86 (71) | 90 (78) | 0.21 | 1.60 (0.73‐3.53) | 0.24 |
DISCUSSION
We found no significant improvement in patient satisfaction with doctor communication or overall rating of hospital care after implementation of a communication‐skills training program for hospitalists. There are several potential explanations for our results. First, though we used sound educational methods and attempted to replicate common clinical scenarios during simulation exercises, our program may not have resulted in improved communication behaviors during actual clinical care. We attempted to balance instructional methods that would result in behavioral change with a feasible investment of time and effort on the part of our learners (ie, practicing hospitalists). It is possible that additional time, feedback, and practice of communication skills would be necessary to change behaviors in the clinical setting. However, prior communication‐skills interventions have similarly struggled to show an impact on patient satisfaction.[13, 14] Second, we had incomplete participation in the program, with only 40% of hospitalists completing all 3 planned sessions. We encouraged all hospitalists, regardless of job type, to participate in the program. Participation rates were lower for 1‐year hospitalists compared with career hospitalists. The results of our analyses based on level of hospitalist participation in the training program, although not achieving statistical significance, suggest a greater effect of the program with higher degrees of participation.
Most important, the study was likely underpowered to detect a statistically significant difference in satisfaction results. Leaders were committed to providing communication‐skills training throughout our organization. We did not know the magnitude of potential improvement in satisfaction scores that might arise from our efforts, and therefore we did not conduct power calculations before designing and implementing the training program. Our HCAHPS composite doctor‐communication domain performance was 76% during the preintervention period and 79% during the postintervention period. Assuming an absolute 3% improvement is indeed possible, we would have needed >3000 patients in each period to have 80% power to detect a significant difference. Similarly, we would have needed >2000 patients during each period to have 80% power to detect an absolute 4% improvement in global rating of hospital care.
In an attempt to discern whether our favorable results were due to secular trends, we conducted post hoc analyses of HCAHPS nurse‐communication and hospital‐environment domains for the preintervention vs postintervention periods. Two of the 3 nurse‐communication items were rated lower during the postintervention period, but no result was statistically significant. Both hospital‐environment domain items were rated lower during the postintervention period, and 1 result was statistically significant (quiet at night). This post hoc evaluation lends additional support to the potential benefit of the communication‐skills training program.
The findings from this study represent an important issue for leaders attempting to improve quality performance within their organizations. What level of proof is needed before investing time and effort in implementing an intervention? With mounting pressure to improve performance, leaders are often left to make informed decisions based on data that fall short of scientifically rigorous evidence. Importantly, an increase in composite doctor‐communication ratings from 76% to 79% would translate into an improvement from the 25th percentile to 50th‐percentile performance in the fiscal‐year 2011 Press Ganey University Healthcare Consortium benchmark comparison (based on surveys received from September 1, 2010, to August 31, 2011).[15]
Our study has several limitations. First, we assessed an intervention on a single service in a single hospital. Generalizability may be limited, as hospital medicine groups, hospitals, and the patients they serve vary. Second, our intervention was based on a framework (ie, AIDET) that has face validity but has not undergone extensive study to confirm that the underlying constructs, and the behaviors related to them, are tightly linked to patient satisfaction. Third, as previously mentioned, we were likely underpowered to detect a significant improvement in satisfaction resulting from our intervention. Incomplete participation in the training program may have also limited the effect of our intervention. Finally, our comparisons by hospitalist level of participation were based on the discharging physician. Attribution of a patient response to a single physician is problematic because many patients encounter more than 1 hospitalist and 1 or more specialist physicians during their stay.
CONCLUSION
In summary, we found improvements in patient satisfaction with doctor communication, which were not statistically significant, after implementation of a communication‐skills training program for hospitalists. Larger studies are needed to assess whether a communication‐skills training program can truly improve patient satisfaction with doctor communication and overall hospital care.
Acknowledgments
The authors express their gratitude to the hospitalists involved in this program, especially Eric Schaefer, Nita Kulkarni, Stevie Mazyck, Rachel Cyrus, and Hiren Shah. The authors also thank Nicholas Christensen for assistance in data acquisition.
Disclosures: Nothing to report.
- , , , , , . Four minutes for a patient, twenty seconds for a relative—an observational study at a university hospital. BMC Health Serv Res. 2010;10:94.
- , , . How hospitalists spend their time: insights on efficiency and safety. J Hosp Med. 2006;1(2):88–93.
- CAHPS: Surveys and Tools to Advance Patient‐Centered Care. Available at: http://cahps.ahrq.gov. Accessed July 12, 2012.
- , , , , . Development, implementation, and public reporting of the HCAHPS survey. Med Care Res Rev. 2010;67(1):27–37.
- , , , , . Measuring hospital care from the patients' perspective: an overview of the CAHPS Hospital Survey development process. Health Serv Res. 2005;40(6 part 2):1977–1995.
- US Department of Health and Human Services. Hospital Compare. Available at: http://hospitalcompare.hhs.gov/. Accessed November 5, 2012.
- Center for Medicare and Medicaid Services. Hospital Value Based Purchasing Program. Available at: http://www.cms.gov/Medicare/Quality‐Initiatives‐Patient‐Assessment‐Instruments/hospital‐value‐based‐purchasing/index.html?redirect=/hospital‐value‐based‐purchasing. Accessed August 1, 2012.
- , , , . Communication interventions make a difference in conversations between physicians and patients: a systematic review of the evidence. Med Care. 2007;45(4):340–349.
- , , , et al. Impact of localizing physicians to hospital units on nurse‐physician communication and agreement on the plan of care. J Gen Intern Med. 2009;24(11):1223–1227.
- Studer Group. Acknowledge, Introduce, Duration, Explanation and Thank You. Available at: http://www.studergroup.com/aidet. Accessed November 5, 2012.
- Kern DE, Thomas PA, Bass EB, Howard DM, eds. Curriculum Development for Medical Education: A Six‐Step Approach. Baltimore, MD: Johns Hopkins University Press; 1998.
- Vanderbilt University Medical Center and Studer Group. Building Patient Trust with AIDET®: Clinical Excellence with Patient Compliance Through Effective Communication. Gulf Breeze, FL: Fire Starter Publishing; 2008.
- , , , . Effect of clinician communication skills training on patient satisfaction: a randomized, controlled trial. Ann Intern Med. 1999;131(11):822–829.
- , , , , , . Effectiveness of a short course in clinical communication skills for hospital doctors: results of a crossover randomized controlled trial (ISRCTN22153332). Patient Educ Couns. 2010;84(2):163–169.
- Press Ganey HCAHPS Top Box and Rank Report, Fiscal Year 2011. Inpatient, University Healthcare Consortium Peer Group. South Bend, IN: Press Ganey Associates; 2011.
Hospital settings present unique challenges to patient‐clinician communication and collaboration. Patients frequently have multiple, active conditions. Interprofessional teams are large and care for multiple patients at the same time, and team membership is dynamic and dispersed. Moreover, physicians spend relatively little time with patients[1, 2] and seldom receive training in communication skills after medical school.
The Agency for Healthcare Research and Quality (AHRQ) has developed the Hospital Consumer Assessment of Healthcare Providers and Systems (HCAHPS) survey to assess hospitalized patients' experiences with care.[3, 4, 5] Results are publicly reported on the US Department of Health and Human Services Hospital Compare Web site[6] and now affect hospital payment through the Center for Medicare and Medicaid Services Hospital Value‐Based Purchasing Program.[7]
Despite this increased transparency and accountability for performance related to the patient experience, little research has been conducted on how hospitals or clinicians might improve performance. Although interventions to enhance physician communication skills have shown improvements in observed behaviors, few studies have assessed benefit from the patient's perspective and few interventions have been integrated into practice.[8] We sought to assess the impact of a communication‐skills training program, based on a common framework used by hospitals, on patient satisfaction with doctor communication and overall hospital care.
METHODS
Setting and Study Design
The study was conducted at Northwestern Memorial Hospital (NMH), an 897‐bed tertiary‐care teaching hospital in Chicago, IL, and was approved by the institutional review board of Northwestern University. This study was a preintervention vs postintervention comparison of patient‐satisfaction scores. The intervention was a communication‐skills training program for all NMH hospitalists. We compared patient‐satisfaction survey data for patients admitted to the nonteaching hospitalist service during the 26 weeks prior to the intervention with data for patients admitted to the same service during the 22 weeks afterward. Hospitalists on this service worked 7 consecutive days, usually followed by 7 days free from clinical duty. Hospitalists cared for approximately 1014 patients per day without the assistance of resident physicians or midlevel providers (ie, physician assistants or nurse practitioners). Nighttime patient care was provided by in‐house hospitalists (ie, nocturnists). A majority of nighttime shifts were staffed by physicians who worked for the group for a single year. As a result of a prior intervention, hospitalists' patients were localized to specific units, each overseen by a hospitalist‐unit medical director.[9] We excluded all patients initially admitted to other services (eg, intensive care unit, surgical services) and patients discharged from other services.
Hospitalist Communication Skills Training Program
Northwestern Memorial Hospital implemented a communication‐skills training program in 2009 intended to enhance patient experience and improve patient‐satisfaction scores. All nonphysician staff were required to attend a 4‐hour training session based on the AIDET (Acknowledge, Introduce, Duration, Explanation, and Thank You) principles developed by the Studer Group.[10] The Studer Group is a well‐known healthcare consulting firm that aims to assist healthcare organizations to improve clinical, operational, and financial outcomes. The acronym AIDET provides a framework for communication‐skills behaviors (Table 1).
| AIDET Element | Explanation | Examples |
|---|---|---|
| ||
| Acknowledge | Use appropriate greeting, smile, and make eye contact. | Knock on patient's door. Hello, may I come in now? |
| Respect privacy: Knock and ask for permission before entering. Use curtains/doors appropriately. | Good morning. Is it a good time to talk? | |
| Position yourself on the same level as the patient. | Who do you have here with you today? | |
| Do not ignore others in the room (visitors or colleagues). | ||
| Introduce | Introduce yourself by name and role. | My name is Dr. Smith and I am your hospitalist physician. I'll be taking care of you while you are in the hospital. |
| Introduce any accompanying members of your team. | When on teaching service: I'm the supervising physician or I'm the physician in charge of your care. | |
| Address patients by title and last name (eg, Mrs. Smith) unless given permission to use first name. | ||
| Explain why you are there. | ||
| Do not assume patients remember your name or role. | ||
| Duration | Provide specific information on when you will be available, or when you will be back. | I'll be back between 2 and 3 pm, so if you think of any additional questions I can answer them then. |
| For tests/procedures: Explain how long it will take. Provide a time range for when it will happen. | In my experience, the test I am ordering for you will be done within the next 12 to 24 hours. | |
| Provide updates to the patient if the expected wait time has changed. | I should have the results for this test when I see you tomorrow morning. | |
| Do not blame another department or staff for delays. | ||
| Explanation | Explain your rationale for decisions. | I have ordered this test because |
| Use terms the patient can understand. | The possible side effects of this medication include | |
| Explain next steps/summarize plan for the day. | What questions do you have? | |
| Confirm understanding using teach back. | What are you most concerned about? | |
| Assume patients have questions and/or concerns. | I want to make sure you understood everything. Can you tell me in your own words what you will need to do once you are at home? | |
| Do not use acronyms that patients may not understand (eg, PRN, IR, ICU). | ||
| Thank you | Thank the patient and/or family. | I really appreciate you telling me about your symptoms. I know you told several people before. |
| Ask if there is anything else you can do for the patient. | Thank you for giving me the opportunity to care for you. What else can I do for you today? | |
| Explain when you will be back and how the patient can reach you if needed. | I'll see you again tomorrow morning. If you need me before then, just ask the nurse to page me. | |
| Do not appear rushed or distracted when ending your interaction. | ||
We adapted the AIDET framework and designed a communication‐skills training program, specifically for physicians, to emphasize reflection on current communication behaviors, deliberate practice of enhanced communication skills, and feedback based on performance during simulated and real clinical encounters. These educational methods are consistent with recommended strategies to improve behavioral performance.[11] During the first session, we discussed measurement of patient satisfaction, introduced AIDET principles, gave examples of specific behaviors for each principle, and had participants view 2 short videos displaying a range of communication skills followed by facilitated debriefing.[12] The second session included 3 simulation‐based exercises. Participants rotated roles in the scenarios (eg, patient, family member, physician) and facilitated debriefing was co‐led by a hospitalist leader (K.J.O.) and a patient‐experience administrative leader (either T.D. or J.R.). The third session involved direct observation of participants' clinical encounters and immediate feedback. This coaching session was performed for an initial group of 5 hospitalist‐unit medical directors by the manager of patient experience (T.D.) and subsequently by these medical directors for the remaining participants in the program. Each of the 3 sessions lasted 90 minutes. Instructional materials are available from the authors upon request.
The communication‐skills training program began in August 2011 and extended through January 2012. Participation was strongly encouraged but not mandatory. Sessions were offered multiple times to accommodate clinical schedules. One of the co‐investigators took attendance at each session to assess participation rates.
Survey Instruments and Data
During the study period, NMH used a third‐party vendor, Press Ganey Associates, Inc., to administer the HCAHPS survey to a random sample of 40% of hospitalized patients between 48 hours and 6 weeks after discharge. The HCAHPS survey has 27 total questions, including 3 questions assessing doctor communication as a domain.[3] In addition to the HCAHPS questions, the survey administered to NMH patients included questions developed by Press Ganey. Questions in the surveys used ordinal response scales. Specifically, response options for HCAHPS doctor‐communication questions were never, sometimes, usually, and always. Response options for Press Ganey doctor‐communication questions were very poor, poor, fair, good, and very good. Patients provided an overall hospital rating in the HCAHPS survey using a 010 scale, with 0=worst hospital possible and 10=best hospital possible.
We defined the preintervention period as the 26 weeks prior to implementation of the communication‐skills program (patients admitted on or between January 31, 2011, and July 31, 2011) and the postintervention period as the 22 weeks after implementation (patients admitted on or between January 31, 2012, and June 30, 2012). The postintervention period was 1 month shorter than the preintervention period in an effort to avoid confounding due to a number of new hospitalists starting in July 2012. We defined a discharge attending as highly trained if he/she attended all 3 sessions of the communication‐skills training program. The discharge attending was designated as no/low training if he/she attended fewer than the full 3 sessions.
Data Analysis
Data were obtained from the Northwestern Medicine Enterprise Data Warehouse, a single, integrated database of all clinical and research data from all patients receiving treatment through Northwestern University healthcare affiliates. We used 2 and Student t tests to compare patient demographic characteristics preintervention vs postintervention. We used 2 tests to compare the percentage of patients giving top‐box ratings to each doctor‐communication question (ie, always for HCAHPS and very good for Press Ganey) and giving an overall hospital rating of 9 or 10. We used top‐box comparisons, rather than comparison of mean or median scores, because patient‐satisfaction data are typically highly skewed toward favorable responses. This approach is consistent with prior HCAHPS research.[4, 5] We calculated composite doctor‐communication scores as the proportion of top‐box responses across items in each survey (ie, HCAHPS and Press Ganey). We first compared all patients during the preintervention and postintervention period. We then identified patients for whom the discharge attending worked as a hospitalist at NMH during both the preintervention and postintervention periods and compared satisfaction for patients discharged by hospitalists who had no/low training and for patients discharged by hospitalists who were highly trained. We performed multivariate logistic regression, using intervention period as the predictor variable and top‐box rating as the outcome variable for each doctor‐communication question and for overall hospital rating of 9 or 10. Covariates included patient age, sex, race, payer, self‐reported education level, and self‐reported health status. Models accounted for clustering of patients within discharge physicians. Similarly, we conducted multivariate logistic regression, using discharge attending category as the predictor variable (no/low training vs highly trained). The various comparisons described were intended to mimic intention to treat and treatment received analyses in light of incomplete participation in the communication‐skills program. All analyses were conducted using Stata version 11.2 (StataCorp, College Station, TX).
RESULTS
Overall, 61 (97%) of 63 hospitalists completed the first session, 44 (70%) completed the second session, and 25 (40%) completed the third session of program. Patient‐satisfaction data were available for 278 patients during the preintervention period and 186 patients during the postintervention period. Patient demographic characteristics were similar for the 2 periods (Table 2).
| Characteristic | Preintervention (n=278) | Postintervention (n=186) | P Value |
|---|---|---|---|
| |||
| Mean age, y (SD) | 62.8 (17.0) | 61.6 (17.6) | 0.45 |
| Female, no. (%) | 155 (55.8) | 114 (61.3) | 0.24 |
| Nonwhite race, no. (%) | 87 (32.2) | 53 (29.1) | 0.48 |
| Highest education completed, no. (%) | |||
| Did not complete high school | 12 (4.6) | 6 (3.3) | 0.45 |
| High school | 110 (41.7) | 81 (44.0) | |
| 4‐year college | 50 (18.9) | 43 (23.4) | |
| Advanced degree | 92 (34.9) | 54 (29.4) | |
| Payer, no. (%) | |||
| Medicare | 137 (49.3) | 89 (47.9) | 0.83 |
| Private | 113 (40.7) | 73 (39.3) | |
| Medicaid | 13 (4.7) | 11 (5.9) | |
| Self‐pay/other | 15 (5.4) | 13 (7.0) | |
| Self‐reported health status, no. (%) | |||
| Poor | 19 (7.1) | 18 (9.8) | 0.41 |
| Fair | 53 (19.7) | 43 (23.4) | |
| Good | 89 (33.1) | 57 (31.0) | |
| Very good | 89 (33.1) | 49 (26.6) | |
| Excellent | 19 (7.1) | 17 (9.2) | |
Patient Satisfaction With Hospitalist Communication
The HCAHPS and Press Ganey doctor communication domain scores were not significantly different between the preintervention and postintervention periods (75.8 vs 79.2, P=0.42 and 61.4 vs 65.9, P=0.39). Two of the 3 HCAHPS items assessing doctor communication were rated higher during the postintervention period, but no result was statistically significant (Table 3). Similarly, all 5 of the Press Ganey items assessing doctor communication were rated higher during the postintervention period, but no result was statistically significant. The HCAHPS overall rating of hospital care was also not significantly different between the preintervention and postintervention period. Results were similar in multivariate analyses, with no items showing statistically significant differences between the preintervention and postintervention periods.
| Unadjusted Analysisa | Adjusted Analysis | ||||
|---|---|---|---|---|---|
| Preintervention, No. (%) [n=270277] | Postintervention, No. (%) [n=183186] | P Value | OR (95% CI) | P Value | |
| |||||
| HCAHPS doctor‐communication domain | |||||
| How often did doctors treat you with courtesy and respect? | 224 (83) | 160 (86) | 0.31 | 1.23 (0.81‐2.44) | 0.22 |
| How often did doctors listen carefully to you? | 205 (75) | 145 (78) | 0.52 | 1.22 (0.74‐2.04) | 0.42 |
| How often did doctors explain things in a way you could understand? | 203 (75) | 137 (74) | 0.84 | 0.98 (0.59‐1.64) | 0.94 |
| Press Ganey physician‐communication domain | |||||
| Skill of physician | 189 (68) | 137 (74) | 0.19 | 1.38 (0.82‐2.31) | 0.22 |
| Physician's concern for your questions and worries | 157 (57) | 117 (64) | 0.14 | 1.30 (0.79‐2.12) | 0.30 |
| How well physician kept you informed | 158 (58) | 114 (62) | 0.36 | 1.15 (0.78‐1.72) | 0.71 |
| Time physician spent with you | 140 (51) | 101 (54) | 0.43 | 1.12 (0.66‐1.89) | 0.67 |
| Friendliness/courtesy of physician | 198 (71) | 136 (74) | 0.57 | 1.20 (0.74‐1.94) | 0.46 |
| HCAHPS global ratings | |||||
| Overall rating of hospital | 189 (70) [n=270] | 137 (74) [n=186] | 0.40 | 1.33 (0.82‐2.17) | 0.24 |
Pre‐post comparisons based on level of hospitalist participation in the training program are shown in Table 4. For patients discharged by no/low‐training hospitalists, 4 of the 8 total items assessing doctor communication were rated higher during the postintervention period, and 4 were rated lower, but no result was statistically significant. For patients discharged by highly trained hospitalists, all 8 items assessing doctor communication were rated higher during the postintervention period, but no result was statistically significant. Multivariate analyses were similar, with no items showing statistically significant differences between the preintervention and postintervention periods for either group.
| No/Low Training | Highly Trained | |||||||||
|---|---|---|---|---|---|---|---|---|---|---|
| Unadjusted Analysisa | Adjusted Analysis | Unadjusted Analysisa | Adjusted Analysis | |||||||
| Preintervention, No. (%) [n=151156] | Postintervention, No. (%) [n=6770] | P Value | OR (95% CI) | P Value | Preintervention, No. (%) [n=119122] | Postintervention, No. (%) [n=115116] | P Value | OR (95% CI) | P Value | |
| ||||||||||
| HCAHPS doctor‐ communication domain | ||||||||||
| How often did doctors treat you with courtesy and respect? | 125 (83) | 61 (88) | 0.28 | 1.79 (0.82‐3.89) | 0.14 | 99 (83) | 99 (85) | 0.65 | 1.33 (0.62‐2.91) | 0.46 |
| How often did doctors listen carefully to you? | 116 (77) | 53 (76) | 0.86 | 1.08 (0.49‐2.38) | 0.19 | 89 (74) | 92 (79) | 0.30 | 1.43 (0.76‐2.69) | 0.27 |
| How often did doctors explain things in a way you could understand? | 115 (76) | 47 (68) | 0.24 | 0.59 (0.27‐1.28) | 0.18 | 88 (74) | 90 (78) | 0.52 | 1.31 (0.68‐2.50) | 0.42 |
| Press Ganey physician‐communication domain | ||||||||||
| Skill of physician | 110 (71) | 52 (74) | 0.56 | 1.32 (0.78‐2.22) | 0.31 | 79 (65) | 85 (73) | 0.16 | 1.45 (0.65‐3.27) | 0.37 |
| Physician's concern for your questions and worries | 92 (60) | 41 (61) | 0.88 | 1.00 (0.59‐1.77) | 0.99 | 65 (53) | 76 (66) | 0.06 | 1.71 (0.81‐3.60) | 0.16 |
| How well physician kept you informed | 89 (59) | 42 (61) | 0.75 | 1.16 (0.64‐2.08) | 0.62 | 69 (57) | 72 (63) | 0.34 | 1.29 (0.75‐2.20) | 0.35 |
| Time physician spent with you | 83 (54) | 37 (53) | 0.92 | 0.87 (0.47‐1.61) | 0.65 | 57 (47) | 64 (55) | 0.19 | 1.44 (0.64‐3.21) | 0.38 |
| Friendliness/courtesy of physician | 116 (75) | 45 (66) | 0.18 | 0.72 (0.37‐1.38) | 0.32 | 82 (67) | 91 (78) | 0.05 | 1.89 (0.97‐3.68) | 0.60 |
| HCAHPS global ratings | ||||||||||
| Overall rating of hospital | 109 (73) | 53 (75) | 0.63 | 1.37 (0.67‐2.81) | 0.39 | 86 (71) | 90 (78) | 0.21 | 1.60 (0.73‐3.53) | 0.24 |
DISCUSSION
We found no significant improvement in patient satisfaction with doctor communication or overall rating of hospital care after implementation of a communication‐skills training program for hospitalists. There are several potential explanations for our results. First, though we used sound educational methods and attempted to replicate common clinical scenarios during simulation exercises, our program may not have resulted in improved communication behaviors during actual clinical care. We attempted to balance instructional methods that would result in behavioral change with a feasible investment of time and effort on the part of our learners (ie, practicing hospitalists). It is possible that additional time, feedback, and practice of communication skills would be necessary to change behaviors in the clinical setting. However, prior communication‐skills interventions have similarly struggled to show an impact on patient satisfaction.[13, 14] Second, we had incomplete participation in the program, with only 40% of hospitalists completing all 3 planned sessions. We encouraged all hospitalists, regardless of job type, to participate in the program. Participation rates were lower for 1‐year hospitalists compared with career hospitalists. The results of our analyses based on level of hospitalist participation in the training program, although not achieving statistical significance, suggest a greater effect of the program with higher degrees of participation.
Most important, the study was likely underpowered to detect a statistically significant difference in satisfaction results. Leaders were committed to providing communication‐skills training throughout our organization. We did not know the magnitude of potential improvement in satisfaction scores that might arise from our efforts, and therefore we did not conduct power calculations before designing and implementing the training program. Our HCAHPS composite doctor‐communication domain performance was 76% during the preintervention period and 79% during the postintervention period. Assuming an absolute 3% improvement is indeed possible, we would have needed >3000 patients in each period to have 80% power to detect a significant difference. Similarly, we would have needed >2000 patients during each period to have 80% power to detect an absolute 4% improvement in global rating of hospital care.
In an attempt to discern whether our favorable results were due to secular trends, we conducted post hoc analyses of HCAHPS nurse‐communication and hospital‐environment domains for the preintervention vs postintervention periods. Two of the 3 nurse‐communication items were rated lower during the postintervention period, but no result was statistically significant. Both hospital‐environment domain items were rated lower during the postintervention period, and 1 result was statistically significant (quiet at night). This post hoc evaluation lends additional support to the potential benefit of the communication‐skills training program.
The findings from this study represent an important issue for leaders attempting to improve quality performance within their organizations. What level of proof is needed before investing time and effort in implementing an intervention? With mounting pressure to improve performance, leaders are often left to make informed decisions based on data that fall short of scientifically rigorous evidence. Importantly, an increase in composite doctor‐communication ratings from 76% to 79% would translate into an improvement from the 25th percentile to 50th‐percentile performance in the fiscal‐year 2011 Press Ganey University Healthcare Consortium benchmark comparison (based on surveys received from September 1, 2010, to August 31, 2011).[15]
Our study has several limitations. First, we assessed an intervention on a single service in a single hospital. Generalizability may be limited, as hospital medicine groups, hospitals, and the patients they serve vary. Second, our intervention was based on a framework (ie, AIDET) that has face validity but has not undergone extensive study to confirm that the underlying constructs, and the behaviors related to them, are tightly linked to patient satisfaction. Third, as previously mentioned, we were likely underpowered to detect a significant improvement in satisfaction resulting from our intervention. Incomplete participation in the training program may have also limited the effect of our intervention. Finally, our comparisons by hospitalist level of participation were based on the discharging physician. Attribution of a patient response to a single physician is problematic because many patients encounter more than 1 hospitalist and 1 or more specialist physicians during their stay.
CONCLUSION
In summary, we found improvements in patient satisfaction with doctor communication, which were not statistically significant, after implementation of a communication‐skills training program for hospitalists. Larger studies are needed to assess whether a communication‐skills training program can truly improve patient satisfaction with doctor communication and overall hospital care.
Acknowledgments
The authors express their gratitude to the hospitalists involved in this program, especially Eric Schaefer, Nita Kulkarni, Stevie Mazyck, Rachel Cyrus, and Hiren Shah. The authors also thank Nicholas Christensen for assistance in data acquisition.
Disclosures: Nothing to report.
- , , , , , . Four minutes for a patient, twenty seconds for a relative—an observational study at a university hospital. BMC Health Serv Res. 2010;10:94.
- , , . How hospitalists spend their time: insights on efficiency and safety. J Hosp Med. 2006;1(2):88–93.
- CAHPS: Surveys and Tools to Advance Patient‐Centered Care. Available at: http://cahps.ahrq.gov. Accessed July 12, 2012.
- , , , , . Development, implementation, and public reporting of the HCAHPS survey. Med Care Res Rev. 2010;67(1):27–37.
- , , , , . Measuring hospital care from the patients' perspective: an overview of the CAHPS Hospital Survey development process. Health Serv Res. 2005;40(6 part 2):1977–1995.
- US Department of Health and Human Services. Hospital Compare. Available at: http://hospitalcompare.hhs.gov/. Accessed November 5, 2012.
- Center for Medicare and Medicaid Services. Hospital Value Based Purchasing Program. Available at: http://www.cms.gov/Medicare/Quality‐Initiatives‐Patient‐Assessment‐Instruments/hospital‐value‐based‐purchasing/index.html?redirect=/hospital‐value‐based‐purchasing. Accessed August 1, 2012.
- , , , . Communication interventions make a difference in conversations between physicians and patients: a systematic review of the evidence. Med Care. 2007;45(4):340–349.
- , , , et al. Impact of localizing physicians to hospital units on nurse‐physician communication and agreement on the plan of care. J Gen Intern Med. 2009;24(11):1223–1227.
- Studer Group. Acknowledge, Introduce, Duration, Explanation and Thank You. Available at: http://www.studergroup.com/aidet. Accessed November 5, 2012.
- Kern DE, Thomas PA, Bass EB, Howard DM, eds. Curriculum Development for Medical Education: A Six‐Step Approach. Baltimore, MD: Johns Hopkins University Press; 1998.
- Vanderbilt University Medical Center and Studer Group. Building Patient Trust with AIDET®: Clinical Excellence with Patient Compliance Through Effective Communication. Gulf Breeze, FL: Fire Starter Publishing; 2008.
- , , , . Effect of clinician communication skills training on patient satisfaction: a randomized, controlled trial. Ann Intern Med. 1999;131(11):822–829.
- , , , , , . Effectiveness of a short course in clinical communication skills for hospital doctors: results of a crossover randomized controlled trial (ISRCTN22153332). Patient Educ Couns. 2010;84(2):163–169.
- Press Ganey HCAHPS Top Box and Rank Report, Fiscal Year 2011. Inpatient, University Healthcare Consortium Peer Group. South Bend, IN: Press Ganey Associates; 2011.
Copyright © 2013 Society of Hospital Medicine
Impact of Penicillin Skin Testing
Self‐reported penicillin allergy is common and frequently limits the available antimicrobial agents to choose from. This often results in the use of more expensive, potentially more toxic, and possibly less efficacious agents.[1, 2]
For over 30 years, penicilloyl‐polylysine (PPL) penicillin skin testing (PST) was widely used to diagnose penicillin allergy with a negative predictive value (NPV) of about 97% to 99%.[3] After being off the market for 5 years, PPL PST was reapproved in 2009 as PRE‐PEN.[4] However, many clinicians still fail to utilize PST despite its simplicity and substantial clinical impact. The main purpose of this study was to describe the predictive value of PST and impact on antibiotic selection in a sample of hospitalized patients with a reported history of penicillin allergy.
METHODS
In 2010, PST was introduced as a quality‐improvement measure after approval and support from the chief of professional services and the medical staff executive committee at Vidant Medical Center, an 861‐bed tertiary care and teaching hospital. Our antimicrobial stewardship program is regularly contacted for approval of alternative therapies in penicillin allergic patients. The PST quality‐improvement intervention was implemented to avoid resorting to less appropriate therapies in these situations. Following approval by the University and Medical Center Institutional Review Board, we designed a 4‐month study to assess the impact of this ongoing quality improvement measure from March 2012 to July 2012.
Hospitalized patients of all ages with reported penicillin allergies were obtained from our antimicrobial stewardship database. Their charts were reviewed for demographics, antibiotic use, clinical infection, and allergic description. Deciding whether to alter antibiotic therapy to a ‐lactam regimen was based on microbiologic results, laboratory values, clinical infection, and history of immunoglobulin E (IgE)‐mediated reactions, as defined by the updated drug allergy practice parameters.[5] IgE‐mediated reactions included: (1) immediate urticaria, laryngeal edema, or hypotension; (2) anemia; and (3) fever, arthralgias, lymphadenopathy, and an urticarial rash after 7 to 21 days.[5, 6, 7] We defined anaphylaxis as the development of angioedema or hemodynamic instability within 1 hour of penicillin administration. A true negative reaction was a lack of an IgE‐mediated reaction to all the drug challenges.
Patients in the medical, surgical, labor, and delivery wards; intensive care units; and emergency department underwent testing. The ‐lactam agent used after a negative PST was recorded, and the patients were followed for 24 hours after transitioning their therapy to a ‐lactam regimen. Excluded subjects included those with (1) nonIgE‐mediated reactions, (2) skin conditions that can give false positive results, (3) medications that may interfere with anaphylactic therapy, (4) history of severe exfoliative reactions to ‐lactams, (5) anaphylaxis less than 4 weeks prior, (6) allergies to antibiotics other than penicillin, and (7) uncertain allergy history.
PST Reagents/Procedure
Our benzylpenicilloyl major determinant molecule, commercially produced as PPL, was purchased as a PRE‐PEN from ALK‐Abello, Round Rock, Texas. Penicillin G potassium, purchased from Pfizer, New York, New York, is the only commercially available minor determinant and can improve identification of penicillin allergy by up to 97%.[2] The PST panel also included histamine (positive control) and normal saline (negative control).
Skin Testing Procedure
An infectious diseases fellow (R.H.R. or B.K.) was supervised in preparing for potential anaphylaxis, applying the reagents and interpreting the results based on drug allergy practice parameters.[5] The preliminary epicutaneous prick/puncture test was performed with a lancet in subjects without prior anaphylaxis using full‐strength PPL and penicillin G potassium reagents. If there was no response within 15 minutes, which we defined as a lack of wheal formation 3 mm or greater than that of the negative control, 0.02 to 0.03 mL of each reagent was injected intradermally using a tuberculin syringe and examined for 15 minutes.[5] If there was no response, patients were then challenged with either a single oral dose of penicillin V potassium 250 mg or whichever oral penicillin agent they previously reported an allergy to. If no reaction was appreciated within 2 hours, their therapy was changed to a ‐lactam agent including penicillins, cephalosporins, and carbapenems for the remaining duration of therapy (Figure 1) An estimate of NPV was obtained after 24 hours follow‐up.

Statistical Analysis
We designed a study to estimate whether the reapproved PST achieves an NPV of at least 95%.[3] We hypothesized that clinicians will be willing to utilize PST even if it has an NPV of slightly less than 98% compared to the current standard of treating patients without PST.[7] Assuming an equivalence margin of 3%, we estimated a sample size of 146 to achieve at least 82% power to test a hypothesis of NPV 95% using a 1‐sided Z test with a type‐I error rate of 5%.[8] Once the sample size of 146 subjects was reached, we stopped recruiting patients.
Sample characteristics of the subjects who underwent testing were summarized using descriptive statistics. Sample proportions were calculated to summarize categorical variables. Mean and standard deviation were calculated to summarize continuous variables. Cost analysis of antibiotic therapy was estimated from the Vidant Medical Center antibiotic pharmaceutical acquisition costs. Estimated cost of peripherally inserted central catheter (PICC) placement and removal as well as laboratory testing costs were obtained from our institution's medical billing department. Marketing costs of pharmacist drug calibration and nursing assessments with dressing changes were obtained from hospital‐affiliated outpatient antibiotic infusion companies.
RESULTS
A total of 4031 allergy histories were reviewed during the 5‐month study period to achieve the sample size of 146 patients (Table 1). Of those, 3885 were excluded (Figure 2). Common infections included pneumonias (26%) and urinary tract infections (20%) (Table 2) Only 1 subject had a positive reaction with hives, edema, and itching approximately 6 minutes after the agents were injected intradermally. The remaining 145 (99%) had negative reactions to the PST and oral challenge and were then successfully transitioned to a ‐lactam agent without any reaction at 24 hours, giving an NPV of 100%. Ten subjects were switched from intravenous to oral ‐lactam agents (Figure 1). Avoidance of PICC placement ($1,200) and removal ($65), dressing changes, weekly drug‐level testing, laboratory technician, and pharmaceutical drug calibration costs allowed for a healthcare reduction of $5,233 ($520/patient) based on the 146 patients studied. The total cost of therapy would have been $113,991 if the PST had not been performed. However, the cost of altered therapy following a negative PST was $81,180, a difference of $32,811 ($225/per patient) in a 5‐month period. The total estimated annual difference, including antibiotic alteration and associated drug‐costs, would be $82,000.
| Antibiotic | No. of Patients Reporting An Allergy | % Per Total Charts Reviewed |
|---|---|---|
| Penicillin | 428 | 10.6 |
| Sulfonamide | 271 | 6.7 |
| Quinolone | 108 | 2.7 |
| Cephalosporin | 81 | 2.0 |
| Macrolide | 65 | 1.6 |
| Vancomycin | 39 | 0.9 |
| Tetracycline | 20 | 0.5 |
| Clindamycin | 18 | 0.4 |
| Metronidazole | 9 | 0.2 |
| Linezolid | 2 | 0.05 |
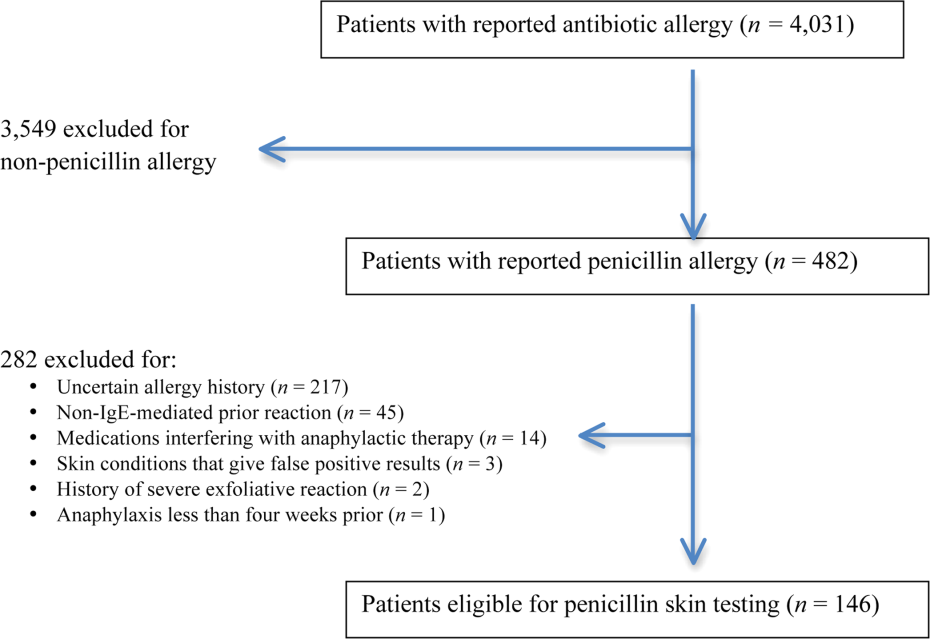
| Categories | No. of Patients (%) |
|---|---|
| |
| Time since last reported penicillin use | |
| 1 month1 year | 6 (4) |
| 25 years | 39 (27) |
| 610 years | 23 (16) |
| >10 years | 78 (53) |
| Reported IgE‐mediated reactions | |
| Bronchospasm | 23 (16) |
| Urticarial rash | 100 (68) |
| Edema | 32 (22) |
| Anaphylaxis | 21 (14) |
| Age on admission, y | |
| 2050 | 28 (19) |
| 5160 | 29 (20) |
| 6170 | 41 (28) |
| 7180 | 24 (16) |
| >80 | 24 (16) |
| Gender | |
| Male | 55 (40) |
| Female | 88 (60) |
| Race | |
| White | 82 (56) |
| Black | 61 (42) |
| Hispanic | 3 (2) |
| Infections being treated | |
| Bacteremia | 7 (4.8) |
| Catheter‐related bloodstream infection | 2 (1.4) |
| Empyema | 1 (0.7) |
| Epidural abscess | 2 (1.4) |
| Infective endocarditis | 4 (2.7) |
| Intra‐abdominal infection | 24 (16.4) |
| Meningitis | 1 (0.7) |
| Neutropenic fever | 1 (0.7) |
| Osteomyelitis | 6 (4.1) |
| Pericardial effusion | 1 (0.7) |
| Prosthetic joint infection | 5 (3.4) |
| Pneumonia | 40 (27.4) |
| Skin and soft‐tissue infection | 20 (13.7) |
| Syphilis | 3 (2.1) |
| Urinary tract infection | 29 (19.7) |
DISCUSSION
PST is the most rapid, sensitive, and cost‐effective modality for evaluating patients with immediate allergic reactions to penicillin. Over 90% of individuals with a true history of penicillin allergy have confirmed sensitivity with a PST, implying most patients who are skin tested negative are truly not allergic.[7, 9, 10, 11, 12] Our study shows that the reapproved PST with the PPL and penicillin G determinants continues to have a high NPV. A patient with a negative PST result is generally at a low risk of developing an immediate‐type hypersensitivity reaction to penicillin.[2, 11] PST frequently allowed for less expensive agents that would have been avoided due to a reported allergy. The estimated annual savings of $82,000 dollars from antibiotic alteration with successful transition to a ‐lactam agent after a negative PST illustrates its value, supports its validity, and makes this study novel.
Many ‐lactamase inhibitors (ie, piperacillin‐tazobactam), fourth generation cephalosporins (ie, cefepime), and carbapenems still remain costly. Despite this, we were still able to achieve a significant reduction in overall cost. In addition to financial benefits, PST allowed for the use of more appropriate agents with less potential adverse effects. Narrow‐spectrum, non‐lactam agents were sometimes altered to a broader‐spectrum ‐lactam agent. We also frequently tailored 2 agents to just 1 broad‐spectrum ‐lactam. This led to more patients being given broad‐spectrum agents after the PST (72 vs 89 patients). However, we were able to avoid using second‐line agents, such as aztreonam, vancomycin, linezolid, daptomycin, and tobramycin, in many patients with infections that are often best treated with penicillin‐based antibiotics (ie, syphilis, group B Streptococcus infections). With increasing incidence and recovery of multidrug‐resistant bacteria, PST may also allow use of potentially more effective antimicrobial agents.
A possible limitation is that our prevalence of a true penicillin allergy was 1%, whereas Bousquet et al. illustrate a higher prevalence of about 20%.[7] Although our prevalence may not be generalizable, Bousquet's study only assessed patients with allergies 5 years prior.
The introduction of PST into clinical practice will allow trained healthcare providers to prescribe cheaper, more appropriate, less toxic antimicrobial agents. The overall benefit of reintroducing penicillin agents when needed in the future is far more cost‐effective than what is described here. PST should become a standard of care when prescribing antibiotics to patients with a history of penicillin allergy. Medical providers should be aware of its utility, acquire training, and incorporate it into their practice.
Acknowledgment
Disclosures: Paul P. Cook, MD, has potential conflicts of interest with Gilead (investigator), Pfizer (investigator), Merck (investigator and speakers' bureau), and Forest (speakers' bureau). Neither he nor any of the other authors has received any sources of funding for this article. For the remaining authors, no conflicts were declared. The corresponding author, Ramzy Rimawi, MD, had full access to all of the data in the study and had final responsibility for the decision to submit for publication.
- , , . Elective penicillin skin testing in a pediatric outpatient setting. Ann Allergy Asthma Immunol. 2006;97(6):807–812.
- US Department of Veterans Affairs Web site. Benzypenicilloyl polylisine (PRE‐PEN) national drug monograph. May 2012. Available at: http://www.pbm.va.gov/DrugMonograph.aspx. Accessed September 1, 2012.
- , . Diagnosis and management of penicillin allergy. Mayo Clin Proc. 2005;80(3):405–410.
- PRE‐PEN penicillin skin test antigen. Available at: http://www.alk‐abello.com/us/products/pre‐pen/Pages/PREPEN.aspx. Accessed September 1, 2012.
- , , , et al.; Joint Task Force on Practice Parameters; American Academy of Allergy, Asthma and Immunology; American College of Allergy, Asthma and Immunology; Joint Council of Allergy, Asthma and Immunology. Drug allergy: an updated practice parameter. Ann Allergy Asthma Immunol. 2010;105:259–273.
- . Immunochemical mechanisms in penicillin allergy. Fed Proc. 1965;24:51–54.
- , , , et al. Oral challenges are needed in the diagnosis of beta‐lactam hypersensitivity. Clin Exp Allergy. 2008;38(1):185–190.
- , , . Sample Size Calculations in Clinical Research. New York, NY: Chapman 2003.
- , , , et al. Retrospective case series analysis of penicillin allergy testing in a UK specialist regional allergy clinic. J Clin Pathol. 2011;64:1014–1018.
- . Prevalence of skin test reactivity in patients with convincing, vague and unnacceptible histories of penicillin allergy. Allergy Asthma Proc. 2005;26(1):59–64.
- , . Frequency of systemic reactions to penicillin skin tests. Ann Allergy Asthma Immunol. 2000;85:363–365.
- , , , et al. The incidence of antimicrobial allergies in hospitalized patients. Arch Intern Med. 2000;160;2819–2822.
Self‐reported penicillin allergy is common and frequently limits the available antimicrobial agents to choose from. This often results in the use of more expensive, potentially more toxic, and possibly less efficacious agents.[1, 2]
For over 30 years, penicilloyl‐polylysine (PPL) penicillin skin testing (PST) was widely used to diagnose penicillin allergy with a negative predictive value (NPV) of about 97% to 99%.[3] After being off the market for 5 years, PPL PST was reapproved in 2009 as PRE‐PEN.[4] However, many clinicians still fail to utilize PST despite its simplicity and substantial clinical impact. The main purpose of this study was to describe the predictive value of PST and impact on antibiotic selection in a sample of hospitalized patients with a reported history of penicillin allergy.
METHODS
In 2010, PST was introduced as a quality‐improvement measure after approval and support from the chief of professional services and the medical staff executive committee at Vidant Medical Center, an 861‐bed tertiary care and teaching hospital. Our antimicrobial stewardship program is regularly contacted for approval of alternative therapies in penicillin allergic patients. The PST quality‐improvement intervention was implemented to avoid resorting to less appropriate therapies in these situations. Following approval by the University and Medical Center Institutional Review Board, we designed a 4‐month study to assess the impact of this ongoing quality improvement measure from March 2012 to July 2012.
Hospitalized patients of all ages with reported penicillin allergies were obtained from our antimicrobial stewardship database. Their charts were reviewed for demographics, antibiotic use, clinical infection, and allergic description. Deciding whether to alter antibiotic therapy to a ‐lactam regimen was based on microbiologic results, laboratory values, clinical infection, and history of immunoglobulin E (IgE)‐mediated reactions, as defined by the updated drug allergy practice parameters.[5] IgE‐mediated reactions included: (1) immediate urticaria, laryngeal edema, or hypotension; (2) anemia; and (3) fever, arthralgias, lymphadenopathy, and an urticarial rash after 7 to 21 days.[5, 6, 7] We defined anaphylaxis as the development of angioedema or hemodynamic instability within 1 hour of penicillin administration. A true negative reaction was a lack of an IgE‐mediated reaction to all the drug challenges.
Patients in the medical, surgical, labor, and delivery wards; intensive care units; and emergency department underwent testing. The ‐lactam agent used after a negative PST was recorded, and the patients were followed for 24 hours after transitioning their therapy to a ‐lactam regimen. Excluded subjects included those with (1) nonIgE‐mediated reactions, (2) skin conditions that can give false positive results, (3) medications that may interfere with anaphylactic therapy, (4) history of severe exfoliative reactions to ‐lactams, (5) anaphylaxis less than 4 weeks prior, (6) allergies to antibiotics other than penicillin, and (7) uncertain allergy history.
PST Reagents/Procedure
Our benzylpenicilloyl major determinant molecule, commercially produced as PPL, was purchased as a PRE‐PEN from ALK‐Abello, Round Rock, Texas. Penicillin G potassium, purchased from Pfizer, New York, New York, is the only commercially available minor determinant and can improve identification of penicillin allergy by up to 97%.[2] The PST panel also included histamine (positive control) and normal saline (negative control).
Skin Testing Procedure
An infectious diseases fellow (R.H.R. or B.K.) was supervised in preparing for potential anaphylaxis, applying the reagents and interpreting the results based on drug allergy practice parameters.[5] The preliminary epicutaneous prick/puncture test was performed with a lancet in subjects without prior anaphylaxis using full‐strength PPL and penicillin G potassium reagents. If there was no response within 15 minutes, which we defined as a lack of wheal formation 3 mm or greater than that of the negative control, 0.02 to 0.03 mL of each reagent was injected intradermally using a tuberculin syringe and examined for 15 minutes.[5] If there was no response, patients were then challenged with either a single oral dose of penicillin V potassium 250 mg or whichever oral penicillin agent they previously reported an allergy to. If no reaction was appreciated within 2 hours, their therapy was changed to a ‐lactam agent including penicillins, cephalosporins, and carbapenems for the remaining duration of therapy (Figure 1) An estimate of NPV was obtained after 24 hours follow‐up.
Statistical Analysis
We designed a study to estimate whether the reapproved PST achieves an NPV of at least 95%.[3] We hypothesized that clinicians will be willing to utilize PST even if it has an NPV of slightly less than 98% compared to the current standard of treating patients without PST.[7] Assuming an equivalence margin of 3%, we estimated a sample size of 146 to achieve at least 82% power to test a hypothesis of NPV 95% using a 1‐sided Z test with a type‐I error rate of 5%.[8] Once the sample size of 146 subjects was reached, we stopped recruiting patients.
Sample characteristics of the subjects who underwent testing were summarized using descriptive statistics. Sample proportions were calculated to summarize categorical variables. Mean and standard deviation were calculated to summarize continuous variables. Cost analysis of antibiotic therapy was estimated from the Vidant Medical Center antibiotic pharmaceutical acquisition costs. Estimated cost of peripherally inserted central catheter (PICC) placement and removal as well as laboratory testing costs were obtained from our institution's medical billing department. Marketing costs of pharmacist drug calibration and nursing assessments with dressing changes were obtained from hospital‐affiliated outpatient antibiotic infusion companies.
RESULTS
A total of 4031 allergy histories were reviewed during the 5‐month study period to achieve the sample size of 146 patients (Table 1). Of those, 3885 were excluded (Figure 2). Common infections included pneumonias (26%) and urinary tract infections (20%) (Table 2) Only 1 subject had a positive reaction with hives, edema, and itching approximately 6 minutes after the agents were injected intradermally. The remaining 145 (99%) had negative reactions to the PST and oral challenge and were then successfully transitioned to a ‐lactam agent without any reaction at 24 hours, giving an NPV of 100%. Ten subjects were switched from intravenous to oral ‐lactam agents (Figure 1). Avoidance of PICC placement ($1,200) and removal ($65), dressing changes, weekly drug‐level testing, laboratory technician, and pharmaceutical drug calibration costs allowed for a healthcare reduction of $5,233 ($520/patient) based on the 146 patients studied. The total cost of therapy would have been $113,991 if the PST had not been performed. However, the cost of altered therapy following a negative PST was $81,180, a difference of $32,811 ($225/per patient) in a 5‐month period. The total estimated annual difference, including antibiotic alteration and associated drug‐costs, would be $82,000.
| Antibiotic | No. of Patients Reporting An Allergy | % Per Total Charts Reviewed |
|---|---|---|
| Penicillin | 428 | 10.6 |
| Sulfonamide | 271 | 6.7 |
| Quinolone | 108 | 2.7 |
| Cephalosporin | 81 | 2.0 |
| Macrolide | 65 | 1.6 |
| Vancomycin | 39 | 0.9 |
| Tetracycline | 20 | 0.5 |
| Clindamycin | 18 | 0.4 |
| Metronidazole | 9 | 0.2 |
| Linezolid | 2 | 0.05 |
| Categories | No. of Patients (%) |
|---|---|
| |
| Time since last reported penicillin use | |
| 1 month1 year | 6 (4) |
| 25 years | 39 (27) |
| 610 years | 23 (16) |
| >10 years | 78 (53) |
| Reported IgE‐mediated reactions | |
| Bronchospasm | 23 (16) |
| Urticarial rash | 100 (68) |
| Edema | 32 (22) |
| Anaphylaxis | 21 (14) |
| Age on admission, y | |
| 2050 | 28 (19) |
| 5160 | 29 (20) |
| 6170 | 41 (28) |
| 7180 | 24 (16) |
| >80 | 24 (16) |
| Gender | |
| Male | 55 (40) |
| Female | 88 (60) |
| Race | |
| White | 82 (56) |
| Black | 61 (42) |
| Hispanic | 3 (2) |
| Infections being treated | |
| Bacteremia | 7 (4.8) |
| Catheter‐related bloodstream infection | 2 (1.4) |
| Empyema | 1 (0.7) |
| Epidural abscess | 2 (1.4) |
| Infective endocarditis | 4 (2.7) |
| Intra‐abdominal infection | 24 (16.4) |
| Meningitis | 1 (0.7) |
| Neutropenic fever | 1 (0.7) |
| Osteomyelitis | 6 (4.1) |
| Pericardial effusion | 1 (0.7) |
| Prosthetic joint infection | 5 (3.4) |
| Pneumonia | 40 (27.4) |
| Skin and soft‐tissue infection | 20 (13.7) |
| Syphilis | 3 (2.1) |
| Urinary tract infection | 29 (19.7) |
DISCUSSION
PST is the most rapid, sensitive, and cost‐effective modality for evaluating patients with immediate allergic reactions to penicillin. Over 90% of individuals with a true history of penicillin allergy have confirmed sensitivity with a PST, implying most patients who are skin tested negative are truly not allergic.[7, 9, 10, 11, 12] Our study shows that the reapproved PST with the PPL and penicillin G determinants continues to have a high NPV. A patient with a negative PST result is generally at a low risk of developing an immediate‐type hypersensitivity reaction to penicillin.[2, 11] PST frequently allowed for less expensive agents that would have been avoided due to a reported allergy. The estimated annual savings of $82,000 dollars from antibiotic alteration with successful transition to a ‐lactam agent after a negative PST illustrates its value, supports its validity, and makes this study novel.
Many ‐lactamase inhibitors (ie, piperacillin‐tazobactam), fourth generation cephalosporins (ie, cefepime), and carbapenems still remain costly. Despite this, we were still able to achieve a significant reduction in overall cost. In addition to financial benefits, PST allowed for the use of more appropriate agents with less potential adverse effects. Narrow‐spectrum, non‐lactam agents were sometimes altered to a broader‐spectrum ‐lactam agent. We also frequently tailored 2 agents to just 1 broad‐spectrum ‐lactam. This led to more patients being given broad‐spectrum agents after the PST (72 vs 89 patients). However, we were able to avoid using second‐line agents, such as aztreonam, vancomycin, linezolid, daptomycin, and tobramycin, in many patients with infections that are often best treated with penicillin‐based antibiotics (ie, syphilis, group B Streptococcus infections). With increasing incidence and recovery of multidrug‐resistant bacteria, PST may also allow use of potentially more effective antimicrobial agents.
A possible limitation is that our prevalence of a true penicillin allergy was 1%, whereas Bousquet et al. illustrate a higher prevalence of about 20%.[7] Although our prevalence may not be generalizable, Bousquet's study only assessed patients with allergies 5 years prior.
The introduction of PST into clinical practice will allow trained healthcare providers to prescribe cheaper, more appropriate, less toxic antimicrobial agents. The overall benefit of reintroducing penicillin agents when needed in the future is far more cost‐effective than what is described here. PST should become a standard of care when prescribing antibiotics to patients with a history of penicillin allergy. Medical providers should be aware of its utility, acquire training, and incorporate it into their practice.
Acknowledgment
Disclosures: Paul P. Cook, MD, has potential conflicts of interest with Gilead (investigator), Pfizer (investigator), Merck (investigator and speakers' bureau), and Forest (speakers' bureau). Neither he nor any of the other authors has received any sources of funding for this article. For the remaining authors, no conflicts were declared. The corresponding author, Ramzy Rimawi, MD, had full access to all of the data in the study and had final responsibility for the decision to submit for publication.
- , , . Elective penicillin skin testing in a pediatric outpatient setting. Ann Allergy Asthma Immunol. 2006;97(6):807–812.
- US Department of Veterans Affairs Web site. Benzypenicilloyl polylisine (PRE‐PEN) national drug monograph. May 2012. Available at: http://www.pbm.va.gov/DrugMonograph.aspx. Accessed September 1, 2012.
- , . Diagnosis and management of penicillin allergy. Mayo Clin Proc. 2005;80(3):405–410.
- PRE‐PEN penicillin skin test antigen. Available at: http://www.alk‐abello.com/us/products/pre‐pen/Pages/PREPEN.aspx. Accessed September 1, 2012.
- , , , et al.; Joint Task Force on Practice Parameters; American Academy of Allergy, Asthma and Immunology; American College of Allergy, Asthma and Immunology; Joint Council of Allergy, Asthma and Immunology. Drug allergy: an updated practice parameter. Ann Allergy Asthma Immunol. 2010;105:259–273.
- . Immunochemical mechanisms in penicillin allergy. Fed Proc. 1965;24:51–54.
- , , , et al. Oral challenges are needed in the diagnosis of beta‐lactam hypersensitivity. Clin Exp Allergy. 2008;38(1):185–190.
- , , . Sample Size Calculations in Clinical Research. New York, NY: Chapman 2003.
- , , , et al. Retrospective case series analysis of penicillin allergy testing in a UK specialist regional allergy clinic. J Clin Pathol. 2011;64:1014–1018.
- . Prevalence of skin test reactivity in patients with convincing, vague and unnacceptible histories of penicillin allergy. Allergy Asthma Proc. 2005;26(1):59–64.
- , . Frequency of systemic reactions to penicillin skin tests. Ann Allergy Asthma Immunol. 2000;85:363–365.
- , , , et al. The incidence of antimicrobial allergies in hospitalized patients. Arch Intern Med. 2000;160;2819–2822.
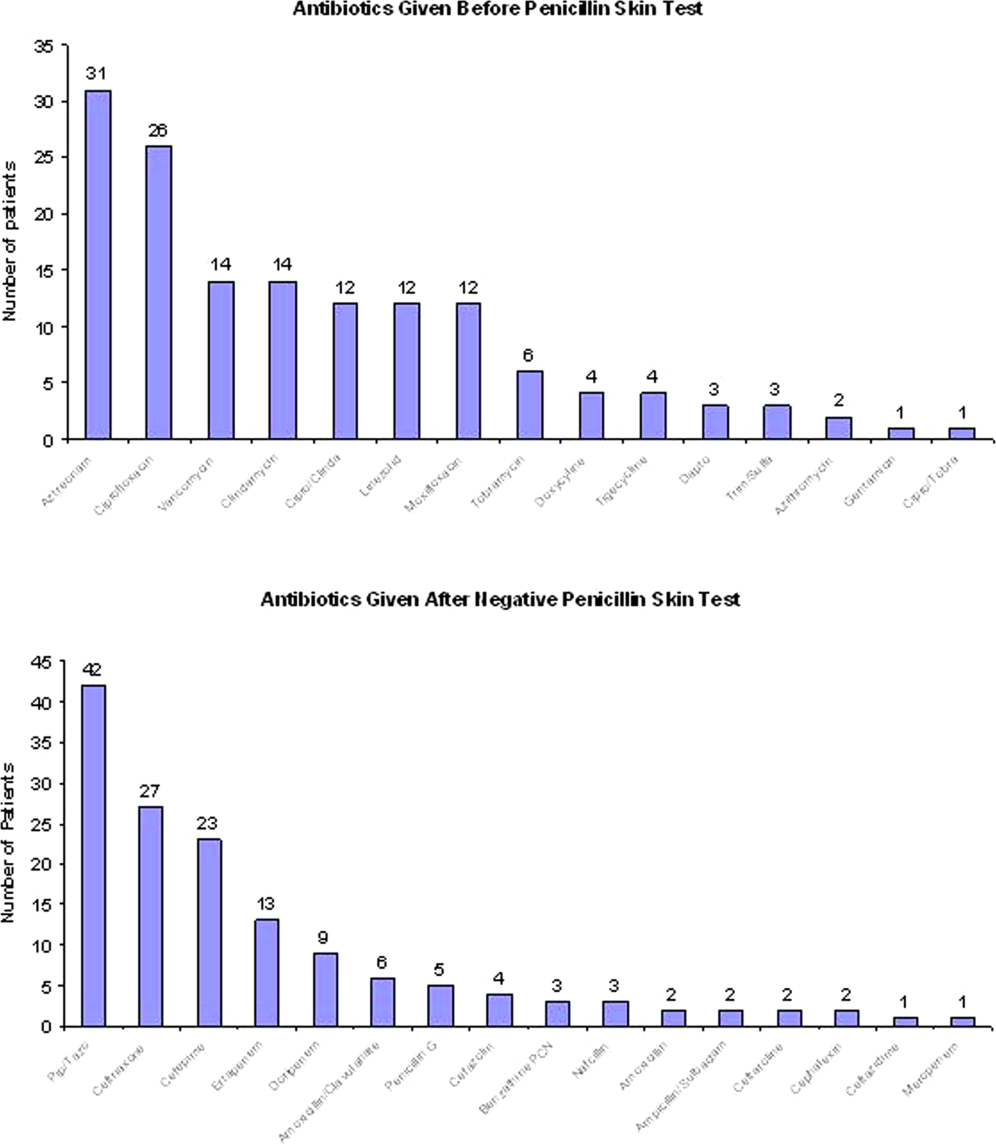
Duloxetine reduces chemo-induced neuropathy
A 5-week course of daily oral duloxetine reduced pain and improved function and quality of life for patients with chemotherapy-induced peripheral neuropathy, according to a report in the April 3 issue of JAMA.
Duloxetine’s effects on chemotherapy-induced peripheral neuropathic pain were measured in a randomized, double-blind, placebo-controlled, crossover clinical trial involving 231 cancer patients aged 25 years and older who had been treated with platinum or taxane agents. Study subjects were approximately twice as likely to experience a 30% reduction in pain while taking duloxetine than while taking placebo and were 2.4 times more likely to experience a 50% reduction in pain, said Ellen M. Lavoie Smith, Ph.D., of the University of Michigan School of Nursing, Ann Arbor, and her associates. The data were presented at the 2012 annual meeting of the American Society of Clinical Oncology.
Patients also reported better daily functioning with duloxetine, compared with placebo, including improved scores on measures assessing numbness, tingling, or discomfort of the hands or feet; tinnitus or difficulty hearing; joint pain; muscle cramps and weakness; and difficulty walking, dressing, or feeling small objects in the hands. Pain-related quality of life also improved to a greater degree with duloxetine (mean change of 2.44 points out of 44 possible points on the Functional Assessment of Cancer Treatment, Gynecologic Oncology Group Neurotoxicity subscale) than with placebo (mean change of 0.87 points).
There were no hematologic or grade 4 adverse events. Mild adverse events were reported by 16% during duloxetine treatment and 27% during placebo treatment, and moderate adverse effects were reported by 7% and 3%, respectively. These included fatigue, insomnia, and nausea in both patient groups, the investigators said (JAMA 2013;309:1359-67).
This study was supported by the National Cancer Institute and the Alliance Statistics and Data Center. Study drugs and placebo were supplied by Eli Lilly. Dr. Smith reported no conflicts of interest, and one of her associates reported ties to Genentech.
FROM JAMA
Major finding: Study subjects were 2.4 times more likely to experience a 50% pain reduction while taking duloxetine than while taking placebo.
Data source: A randomized, double-blind, placebo-controlled crossover trial involving 231 cancer patients.
Disclosures: This study was supported by the National Cancer Institute and the Alliance Statistics and Data Center. Study drugs and placebo were supplied by Eli Lilly. Dr. Smith reported no conflicts of interest, and one of her associates reported ties to Genentech.
How to avoid opioid misuse
Opioids have become the standard of care for numerous chronic pain complaints and are the most misused drugs in the United States.1 The result: A public health issue with challenges for patients with pain, clinicians treating pain, and the broader community. (See “Opioid analgesic misuse: Scope of the problem,” below1-7).
Ultimately, clinicians are faced with trying to provide adequate pain relief while predicting which patients are at risk for misuse. An expert panel commissioned by the American Pain Society and American Academy of Pain Medicine (APS/AAPM) reviewed the evidence and issued clinical guidelines for long-term opioid therapy in chronic noncancer pain.8 Using the APS/AAPM framework, this article discusses how to:
-
identify the risk of problem use in the individual patient
-
monitor opioid therapy to ensure safe prescribing
-
determine when to terminate opioid therapy in cases of opioid misuse.
| OPIOID ANALGESIC MISUSE: SCOPE OF THE PROBLEM Americans consume an estimated 80% of the global supply of prescription opioids.2 From 1997 to 2007, average sales of opioid analgesics per person increased 402%.3 Because opioid analgesics are increasingly available in the community,4 the prevalence of opioid misuse has followed suit. Opioid analgesics have become the most misused drug class in the United States—second only to marijuana among all illicit substances.1 Nonmedical users of opioid analgesics numbered 4.5 million in 2011, and 1.8 million opioid analgesic users met diagnostic criteria for dependence or abuse.1 In 2007, the costs to society of opioid analgesic abuse were estimated at $25.6 billion due to lost productivity, $25.9 billion due to health care costs, and $5.1 billion due to criminal justice costs, totaling $55.7 billion.5 Regardless of whether opioid analgesics are obtained by prescription or diversion (sharing medication, stolen, or purchased illegally), their misuse in all its forms is a significant public health problem. Opioid analgesic–related emergency department visits increased 111% from 2004 to 2008, to a total of 305,900 visits.6 Deaths involving opioid analgesics, including intentional and unintentional overdoses, quadrupled from 1999 to 2008.7 Additionally, from 1999 to 2009, national admission rates for treatment of an opioid analgesic–related substance use disorder increased nearly sixfold.7 |
Before treatment: Determine misuse risk
Despite their widespread use, long-term opioid analgesics are not recommended as first-choice therapy.8 Evidence supporting long-term efficacy is limited, and studies indicate modest clinical effectiveness.9 Concerns also are emerging about the safety of long-term opioid use, including iatrogenic opioid-related substance use disorders. Even categorizing opioid misuse is difficult because consensus is lacking on misuse terminology (TABLE 1).8,10-12
On the other hand, many patients with chronic pain do benefit from opioid analgesics, and most who are prescribed long-term opioid therapy do not misuse their medications. The use of opioid analgesics for chronic pain presents an opportunity for misuse in a subset of susceptible people.
| Key Point The use of opioid analgesics for chronic pain presents an opportunity for misuse in a subset of susceptible people. |
TABLE 1
Glossary of of opioid use terminology
| DSM, Diagnostic and Statistical Manual of Mental Disorders. |
| Aberrant drug-related behavior Opioid-related behavior that demonstrates nonadherence to the patient-clinician agreed-upon therapeutic plan8 |
| Misuse Use of an opioid in a manner other than how it is prescribed10,11 |
Abuse Illicit opioid use that is detrimental to the user or others10 Nonmedical use of an opioid for the purpose of attaining a “high”11 A DSM-IV-TR substance use disorder diagnosis, evidenced by a maladaptive pattern of opioid use, leading to clinically significant impairment or distress as manifested by ≥1 of the following criteria in a 12-month period:
|
Dependence A DSM-IV-TR substance use disorder diagnosis, evidenced by a maladaptive pattern of opioid use, leading to clinically significant impairment or distress as manifested by ≥3 of the following criteria in a 12-month period:
|
Risk factors thought to increase susceptibility include younger age, more severe pain intensity, multiple pain complaints, history of a substance use disorder, and history of a psychiatric disorder.2 Identifying individuals with potential for misuse is difficult, however, and clinicians’ attempts are not necessarily accurate.13
Screening tools. The APS/AAPM guidelines recommend empirically derived screening questionnaires (TABLE 2)8 to help you identify misuse potential before initiating opioid therapy. Instruments also are available to monitor misuse for individuals already in treatment. The Screener and Opioid Assessment for Patients with Pain (SOAPP) appears to be the most predictive of misuse potential, although selecting a screening instrument may depend on particular practice needs.14 These tools are most valuable when used within a comprehensive evaluation that includes the clinical interview with history and pain assessment.
TABLE 2
Questionnaires for screening and opioid misuse risk identification8
| Risk assessment tools | |
| Screener and Opioid Assessment for Patients with Pain (SOAPP) http://www.painedu.org/soapp.asp | Predicts how much monitoring a patient will need on long-term opioid therapy |
| Opioid Risk Tool (ORT) http://www.partnersagainstpain.com/printouts/ Opioid_Risk_Tool.pdf | Assesses for known conditions that indicate higher risk for medication misuse, including history of substance abuse, age, history of sexual abuse, and psychiatric disorders |
| Diagnosis, Intractability, Risk, Efficacy (DIRE) http://www.google.com/url?sa=t&rct=j&q=&esrc=s&source=web&cd=5& ved=0CEgQFjAE&url=http%3A%2F%2Fwww.fmdrl.org%2Findex.cfm%3Fevent%3Dc .getAttachment%26riid%3D6613&ei=vJ7lULDHFqKc2AWCiIGwAQ&usg=AFQjCNECSYFnam9UATA-Xm_JQ0cjm6Xdiw& bvm=bv.1355534169,d.b2I | Assigns the patient a score of 1 to 3 for each of 4 factors: diagnosis, intractability, risk (psychological, chemical health, reliability, social support), and efficacy |
| Monitoring tools during long-term opioid therapy | |
| Pain Assessment and Documentation Tool (PADT) http://www.ucdenver.edu/academics/colleges/PublicHealth/research/centers/maperc/online/Documents/Pain Assessment Documentation Tool %28PADT%29.pdf | Assesses pain relief, daily functioning, and opioid-related adverse events; also whether patient appears to be engaging in potential aberrant drug-related behaviors |
| Current Opioid Misuse Measure (COMM) http://www.painedu.org/soapp.asp | Assists in identifying patients exhibiting aberrant drug-related behaviors |
When you identify someone at high risk of opioid misuse, proceed carefully using multiple sources of clinical information. Balance appropriate pain care with safeguarding against misuse. In the absence of evidence of current misuse, the decision depends on clinical judgment. You might try alternative pain treatments to avoid opioid exposure or consider opioid analgesics with additional monitoring of prescribing (TABLE 3).8
TABLE 3
Practical strategies for addressing opioid misuse8
Before treatment
|
During treatment
|
When things go wrong
|
Managing risk during treatment
Opioid trial. The APS/AAPM panel8 and the World Health Organization analgesic ladder for treating cancer pain15 recommend an opioid trial before long-term opioids are prescribed. This approach assumes that opioid therapy may not be universally effective and appropriate for all patients and all pain complaints for which opioids are indicated.
By agreeing to an evaluation period, such as 30 days, you and your patient understand that opioid treatment may not continue beyond the trial without an accompanying treatment response. Whereas you may tailor specific outcomes to the individual, a successful response should include:
-
reduced pain
-
increased function (such as return to work or other valued activities)
-
and improved quality of life.
If the agreed-upon outcomes are not met, consider discontinuing the opioid trial and trying alternative treatments. Full discussion of the well-documented strategies for managing opioid therapy is beyond the scope of this article. (See other sources for information about strategies such as opioid rotation, which involves switching from one opioid to another in an effort to increase therapeutic benefit or reduce harm.16,17 )
Monitoring aids. In addition to screening and monitoring questionnaires, urine drug screens and prescription monitoring programs (PMPs) can help you objectively monitor for aberrant drug-related behaviors that may indicate misuse.
Urine drug screens can identify substance abuse or dependence and potential problems you might not have detected.2 When used appropriately, urine drug screens can provide useful information about an individual’s substance abuse potential (such as a positive test for an illicit substance). The absence of a prescribed opioid may be as significant as a positive finding because this may suggest compliance issues or diversion.
Prescription monitoring programs have been established by most states since 2002 through grants from the Department of Justice. PMPs store prescription drug information from pharmacies in a statewide database and develop algorithms that can detect behaviors suggesting opioid misuse.18 For example, an algorithm may track factors such as having 5 or more prescribers, 3 or more pharmacies, or 3 or more early refills within 1 year.19
Individual states administer PMPs differently, but prescribers generally can request information to monitor individual patients and detect illicit behaviors. Although relatively new, PMPs have been shown to reduce prescription sales,20 doctor shopping,19 and opioid analgesic misuse.21 A comprehensive list of state PMPs is available from the Alliance of States with Prescription Monitoring Programs (www.pmpalliance.org/content/pmp-access).
| Key Point Although relatively new, prescription monitoring programs have been shown to reduce doctor shopping and opioid analgesic misuse. |
Responding to evidence of aberrant behavior
Even when you follow recommended opioid risk mitigation strategies, expect some individuals to show aberrant drug-taking behavior, abuse, or even the emergence of a co-occurring substance use disorder. Although evidence is limited regarding best practices in these circumstances, terminating opioid treatment is not necessarily the only option.8
Should you identify aberrant drug-related behaviors or any form of opioid analgesic misuse, evaluate the patient to determine the circumstances and immediately address the behavior. For example, using more medication than prescribed may be a sign of inadequately managed pain or clinical status, rather than an indication of abuse.
Referrals may be beneficial as part of your evaluation process. A pain specialist may offer alternative treatment approaches to mitigate medication overuse. An addiction specialist can evaluate patient safety for continued treatment with opioids, facilitate referrals for treatment of a substance use disorder, and provide consultation if discontinuing opioid therapy is appropriate.
Intervention. The patient’s pain complaint will persist whether or not you continue opioids, and substance abuse treatment may complement pain management. Even for an individual who continues opioid therapy, substance abuse treatment can provide tools for understanding and managing substance misuse. For instance, a cognitive-behavioral training program helped curb misuse and increase adherence in high-risk patients on opioid therapy for chronic back pain.22
Providing specialized care before you consider terminating opioid therapy allows people to address their reasons for misusing. Integrated treatment by a clinician specializing in co-occurring chronic pain and addiction may be particularly beneficial, as pain is an important motivator of individuals seeking treatment for an opioid use disorder.23
Termination. If, after additional resources and referral, an individual fails to make progress toward the therapeutic goal, you may need to terminate long-term opioid therapy. By making this decision, you may prevent the emergence of an opioid use disorder. Even so, telling someone that you are stopping opioid treatment can be a difficult discussion. The National Institute on Drug Abuse provides a wealth of online resources to assist with these and other opioid misuse conversations.24,25
Opioid detoxification is complex and should be managed and monitored to mitigate opioid withdrawal symptoms. Unfortunately, very little clinical guidance exists on effective opioid taper strategies for chronic pain patients. Consultation with an addiction specialist is recommended to assist with discontinuing treatment.
Future directions: A role for buprenorphine?
The introduction of transdermal buprenorphine in the United States in 2001 spurred new interest in this medication for treating moderate to severe chronic pain.26 Buprenorphine’s reported lower abuse potential may differentiate it from other opioid analgesics.27 Although a 2006 report showed evidence of modest diversion and abuse of buprenorphine,28 survey data and human laboratory studies demonstrate consistently that the abuse potential is lower—particularly with the combined buprenorphine/naloxone formulation—than with other opioids.29
Sublingual buprenorphine formulations, with and without naloxone, are FDA approved for opioid use disorder and opioid dependence, but not for pain. Thus, it is a medication with analgesic properties that is approved for an opioid use disorder. Some preliminary evidence supports off-label use of sublingual buprenorphine for chronic pain,30 but more research is needed before this approach can be recommended.
Additional clinical studies are examining whether the sublingual formulation’s efficacy for pain is comparable to other buprenorphine formulations. If this is supported, buprenorphine may become an appropriate, safer option for patients at risk of misusing who might benefit from continued opioid therapy.
| Key Point Some preliminary evidence supports off-label use of sublingual buprenorphine for chronic pain, but more research is needed. |
Maintaining a rational, evidence-based approach
Opioid analgesic misuse is a serious public health problem. It would be unfortunate, however, if clinicians were to avoid medically appropriate opioid prescribing for people with chronic pain. Rational, evidence-based strategies to mitigate opioid misuse are the appropriate goal, accompanied by efforts to improve chronic pain treatment with and without opioids. To provide safe and effective opioid therapy, we urge you to develop a proactive approach informed by clinical guidelines, clinical experience, and the scientific literature.
| Key Point While opioid analgesic misuse is a serious problem, it would be unfortunate if clinicians avoided prescribing opioids for people in chronic pain. |
| Disclosure Dr. Potter receives grant support from the National Institute on Drug Abuse K23 DA02297 (Potter) and U10 DA020024 (Trivedi) and serves as a consultant to Observant LLC. Ms. Marino reported no potential conflict of interest relevant to this article. |
References
- Results from the 2011 National Survey on Drug Use and Health: summary of national findings. Rockville, MD: Substance Abuse and Mental Health Services Administration, 2012. Available at: http://www.samhsa.gov/data/NSDUH.aspx. Accessed December 26, 2012.
- Sehgal N, Manchikanti L, Smith HS. Prescription opioid abuse in chronic pain: a review of opioid abuse predictors and strategies to curb opioid abuse. Pain Physician. 2012;15(3 suppl):ES67–E92.
- Manchikanti L, Fellows B, Ailinani H, et al. Therapeutic use, abuse, and nonmedical use of opioids: a ten-year perspective. Pain Physician. 2010;13:401–435.
- Boudreau D, Von Korff M, Rutter CM, et al. Trends in long-term opioid therapy for chronic non-cancer pain. Pharmacoepidemiol Drug Saf. 2009;18:1166–1175.
- Birnbaum HG, White AG, Schiller M, et al. Societal costs of prescription opioid abuse, dependence, and misuse in the United States. Pain Med. 2011;12:657–667.
- Centers for Disease Control and Prevention. Emergency department visits involving nonmedical use of selected prescription drugs - United States, 2004-2008. MMWR Morb Mortal Wkly Rep. 2010;59:705–734.
- Centers for Disease Control and Prevention. Overdoses of prescription opioid pain relievers - United States, 1999-2008. MMWR Morb Mortal Wkly Rep. 2011;60:1487–1492.
- Chou R, Fanciullo GJ, Fine PG, et al. Clinical guidelines for the use of chronic opioid therapy in chronic noncancer pain. J Pain. 2009;10:113–130.
- Martell BA, O’Connor PG, Kerns RD, et al. Systematic review: opioid treatment for chronic back pain: prevalence, efficacy, and association with addiction. Ann Intern Med. 2007;146:116–127.
- Butler SF, Budman SH, Fernandez KC, et al. Development and validation of the Current Opioid Misuse Measure. Pain. 2007;130:144–156.
- Katz NP, Adams EH, Chilcoat H, et al. Challenges in the development of prescription opioid abuse-deterrent formulations. Clin J Pain. 2007;23:648–660.
- Diagnostic and Statistical Manual of Mental Disorders, 4th ed., text rev. Washington, DC: American Psychiatric Association, 2000.
- Katz N, Fanciullo GJ. Role of urine toxicology testing in the management of chronic opioid therapy. Clin J Pain. 2002;18(4 suppl):S76–S82.
- Moore TM, Jones T, Browder JH, et al. A comparison of common screening methods for predicting aberrant drug-related behavior among patients receiving opioids for chronic pain management. Pain Med. 2009;10:1426–1433.
- World Health Organization. Cancer: WHO’s pain ladder. Available at: http://www.who.int/cancer/palliative/painladder/en. Accessed December 26, 2012.
- Fine PG, Portenoy RK. Establishing “best practices” for opioid rotation: conclusions of an expert panel. J Pain Symptom Manage. 2009;38:418–425.
- Ballantyne JC, Mao J. Opioid therapy for chronic pain. N Engl J Med. 2003;349:1943–1953.
- Worley J. Prescription drug monitoring programs, a response to doctor shopping: purpose, effectiveness, and directions for future research. Issues Ment Health Nurs. 2012;33:319–328.
- Katz N, Panas L, Kim M, et al. Usefulness of prescription monitoring programs for surveillance—analysis of Schedule II opioid prescription data in Massachusetts, 1996-2006. Pharmacoepidemiol Drug Saf. 2010;19:115–123.
- Simeone R, Holland L. An evaluation of prescription monitoring programs, September 1, 2006. Available at: https://www.bja.gov/publications/pdmpexecsumm.pdf. Accessed December 26, 2012.
- Wang J, Christo PJ. The influence of prescription monitoring programs on chronic pain management. Pain Physician. 2009;12:507–515.
- Jamison RN, Ross EL, Michna E, et al. Substance misuse treatment for high-risk chronic pain patients on opioid therapy: a randomized trial. Pain. 2010;150:390–400.
- Potter JS. Co-occurring chronic pain and opioid addiction: is there a role for integrated treatment? Honolulu, HI: American Psychiatric Association Annual Meeting, 2011.
- National Institute on Drug Abuse. Talking to patients about sensitive topics: communication and screening techniques for increasing the reliability of patient self-report. Available at: http://www.drugabuse.gov/nidamed/centers-excellence/resources/talking-to-patients-about-sensitive-topics-communication-screening-techniques-increasing. Accessed January 10, 2013.
- National Institute on Drug Abuse. Managing pain patients who abuse prescription drugs. Available at: http://www.drugabuse.gov/nidamed/etools/managing-pain-patients-who-abuse-prescription-drugs. Accessed January 10, 2013.
- Pergolizzi J, Aloisi AM, Dahan A, et al. Current knowledge of buprenorphine and its unique pharmacological profile. Pain Pract. 2010;10:428–450.
- Park HS, Lee HY, Kim YH, et al. A highly selective kappa-opioid receptor agonist with low addictive potential and dependence liability. Bioorg Med Chem Lett. 2006;16:3609–3613.
- Substance Abuse and Mental Health Services Administration. Diversion and abuse of buprenorphine: a brief assessment of emerging indicators. Final report, 2006. Available at: http://buprenorphine.samhsa.gov. Accessed December 26, 2012.
- Comer SD, Sullivan MA, Vosburg SK, et al. Abuse liability of intravenous buprenorphine/naloxone and buprenorphine alone in buprenorphine-maintained intravenous heroin abusers. Addiction. 2010;105:709–718.
- Malinoff HL, Barkin RL, Wilson G. Sublingual buprenorphine is effective in the treatment of chronic pain syndrome. Am J Ther. 2005;12:379–384.
Do surgical residents need ethics teaching?
Recently, I was invited to present surgical grand rounds on an ethics topic. After the talk, a senior surgeon, now retired, who was in the audience confided to me that in all of his years of residency, he had never had a lecture on ethics. This off-hand comment raised a question that demands consideration in the contemporary era of increasingly limited time available for teaching in surgical residencies. Do we need ethics teaching in surgery residencies?
As someone who spent significant time in the last few years in ethics teaching activities, my reflex answer is “Yes.” However, it is worthwhile to explore the reasons why, in the education of contemporary surgeons, it is important to focus dedicated attention on the ethical issues that arise in the practice of surgery.
Certainly, it is not true that ethics was previously unimportant in surgery. In 1915 when the early organizers of the American College of Surgeons were first writing down the qualifications for membership, they emphasized the importance of ethics: “The moral and ethical fitness of the candidates shall be determined by the reports of surgeons whose names are submitted by the candidate himself, and by such other reports and data as the Credentials Committee and the administration of the College may obtain.”[i] Thus, the early founders of the College considered “ethical fitness” to be essential to their members. Since there were clearly ethical and unethical ways to practice surgery, why has the focused emphasis on ethics teaching only occurred in recent decades?
I believe that there are three changes that have occurred in surgical care and surgical education that have led to the importance of this recent focus on ethics education in contemporary surgical training programs: the limitations on work hours for surgical residents, the increasing shift to outpatient care, and the increasing number of options for surgical patients brought about by improvements in surgical technology.
To begin with, surgical residents today spend significantly less time in the hospital every week than did surgical residents in years past. Although one could debate the actual educational value the additional time that I and my surgical predecessors spent in the hospital, there is no question that the significant shortening of the amount of time that surgical residents spend with surgical faculty has resulted in fewer opportunities for learning through role modeling. These many additional hours in the hospital for surgical residents in the past resulted in greater opportunities for residents to see how their faculty dealt with the challenges of managing ethically complex cases. Although these interactions were not often thought of as “ethical role modeling” in prior years, there is no question that significant ethical teaching occurred in this informal curriculum.
Second, and closely related to the reduction in surgical resident work hours, has been the significant shift to outpatient surgical care. This shift has meant that surgical residents whose time is focused on what happens in the hospital have even fewer opportunities to witness faculty engaging in many central aspects of the ethical care of surgical patients (e.g., obtaining informed consent for complex surgical procedures, communicating bad news to patients and families, or weighing risks and benefits of high risk elective surgical procedures).
Perhaps most importantly, today there are more options for surgical therapies than ever before. The central question for a surgeon in 1913 when the American College of Surgeons was formed was, “What can be done for this patient?” Today, in caring for the most complex and critically ill patients, the question that is foremost for surgeons is often “What should be done?” This question is not a purely surgical question, but also an ethical question. Consider a patient who has developed multisystem organ failure after complications from surgery. Because of the advances in critical care, such a patient might be able to be kept alive with technologies such as mechanical ventilation, augmented cardiac output with a ventricular assist device, and hemodialysis. These therapies cannot be judged to be appropriate or not without thoughtful consideration of an individual patient’s overall goals and values. In such a case, weighing values and probabilities for success or failure relative to a particular patient’s goals moves beyond purely scientific surgical decision making into the realm of ethics.
For all of these reasons, I believe that although surgeons have practiced in an ethical fashion for countless generations, the contemporary education of surgeons should include focused attention on ethics and the ethical implications of the surgical interventions that we recommend for our patients. Some might argue that the ultimate goal of surgical education should be to fully integrate the ethical considerations into the surgical care rendered to patients. However, there is so much surgical science to be learned in residency, that in order for consideration of the ethical implications to not be lost, I believe that there must be dedicated attention to ethics teaching.
Although it is an artificial separation to think about distinguishing the ethical considerations from the surgical decision making for a particular patient, the separation is valuable to emphasize the differences between surgical science and surgical ethics. The former is dependent on anatomy, physiology, and surgical technique; whereas the latter is dependent on relationships, communication, and patient values. Although we can train surgical residents to be excellent technicians with a focus purely on surgical science, we can only educate great doctors who are also surgeons by expanding the discussions of optimal surgical care to include the considerations central to surgical ethics.
[1] This important historical background is courtesy of David Nahrwold, MD.
Dr. Angelos is an ACS Fellow, the Linda Kohler Anderson Professor of Surgery and Surgical Ethics, chief, endocrine surgery, and associate director of the MacLean Center for Clinical Medical Ethics at the University of Chicago.
HM13: Bringing Hospital Medicine to the East Coast
Every year, hospitalists from across the country come together at SHM’s annual meeting. With this year’s convention located just a few miles south of Washington, D.C., HM13 will be the most convenient meeting for thousands of hospitalists who live and work on or near the East Coast.
In fact, many won’t even need to board a plane to meet up with thousands of fellow hospitalists. For those in Boston, Baltimore, New York, Philadelphia, and other cities in the northeast corridor, the only meeting designed specifically for hospitalists is just a short drive or train ride away.
And when they arrive at the Gaylord National Resort and Convention Center in National Harbor, Md., hospitalists will find a truly expansive experience dedicated to the specialty. In addition to featuring four days of educational content, the meeting gives hospitalists the chance to catch up with old friends and network with new colleagues. Plus, with an exhibit floor filled with the nation’s top recruiters, service providers, and pharmaceutical innovators, hospitalists can get up to speed on the best offerings in the industry in a matter of hours.
Check out our 6-minute feature video: "Five Reasons You Should Attend HM13"
With so many offerings and opportunities in one place, the challenge for most hospitalists isn’t finding something to do—it’s planning their meeting schedule to achieve all of their career and educational goals.
This year, hospitalists can plan their meeting experience with HM13 at Hand, SHM’s mobile application. Now, any hospitalist with a tablet or smartphone and an Internet connection can add educational sessions to their HM13 plan, view paperless abstracts, and connect with other HM13 attendees in advance of the meeting.
For more HM13 information, visit www.hospitalmedicine2013.org.
Brendon Shank is SHM’s associate vice president of communications.
SHM Tallies Ratio of Hospital Respondents' Observation Admissions to Inpatient Admission Encounters

SHM added a new item to its 2012 State of Hospital Medicine report: the ratio of respondents’ observation admissions to inpatient admission encounters. This metric was added because observation encounters have been increasing, with financial effects on hospitals and patients. SHM survey respondents reported a 20% observation rate for both adult and pediatric practice groups (see Figure 1).
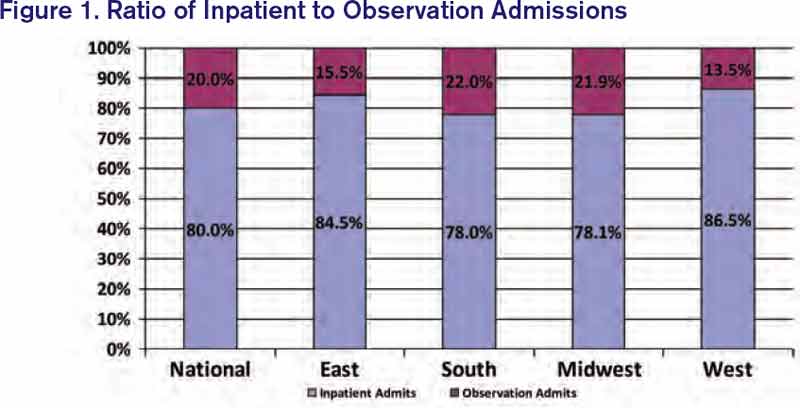
Under observation status, services that used to be billed as inpatient status (e.g. chest pain evaluation, treatment of asthma exacerbation) must be billed by the hospital at much lower outpatient rates. Some hospitals have responded to this financial pressure by creating observation units or making other operational adjustments. One recent analysis suggested that nationwide adoption of such efforts could save billions of dollars.1
Becoming lean enough to do short work in short time, though, does not address all of the observation-related issues facing hospitals. When the Centers for Medicare & Medicaid Services’ (CMS) Recovery Audit Contractors (RACs) determine retrospectively that an inpatient admission should have been an observation encounter, the hospital’s payment is not downgraded but forfeited.2 This development has prompted hospitals to preemptively opt for observation status for certain patients. Case managers and providers increasingly are spending time reviewing inpatient versus observation status throughout a patient’s stay. Many hospitals have turned to third-party contractors to help review observation status.
Observation status has financial implications for patients as well. In the past year, USA Today, The Wall Street Journal, and CNN Money all have reported on patients hit with unexpected out-of-pocket expenses related to observation care.3,4,5 A common theme: Medicare patient hospitalized with an acute fracture, managed nonoperatively but requiring rehabilitation prior to returning home. These patients found out too late that observation, a status they were often unaware of, did not qualify for CMS’ three-day inpatient requirement to cover rehabilitation costs. Some patients were charged exorbitant prices for noncovered “outpatient” services, such as providing their routine medications.
Advocacy groups have joined the fray on patients’ behalf, and legal challenges have ensued. AARP and others are educating patients about observation status—and their right to challenge it. The Center for Medicare Advocacy (www.kslaw.com/Library/publication/HH111411_Bagnall.pdf) has filed a lawsuit against the U.S. Department of Health and Human Services on behalf of patients hit with uncovered rehabilitation costs, and the American Hospital Association has teamed with several hospitals to sue over funds forfeited in RAC audits (www.aha.org/content/12/121101-aha-hhs-medicare-com.pdf). Both houses of Congress have legislation (H.R. 1543 and S. 818) seeking to count observation days toward the Medicare three-day rule. For its part, CMS has promised to review observation status and, hopefully, clarify the rules.
Hospitalists, meanwhile, are gearing up for more observation care. The 2012 State of Hospital Medicine report shows that 37% of adult groups and 28% of pediatric groups reported having primary responsibility for observation or short-stay units. My own hospital runs both a clinical decision unit in the ED and a short-stay unit staffed by our hospitalist group. As SHM tracks observation status in future surveys, HM groups will be able to follow this phenomenon among their colleagues and benchmark their own rates of observation encounters.
Dr. Creamer is medical director of the short-stay unit at MetroHealth Medical Center in Cleveland and a member of SHM’s Practice Analysis Committee.
References
- Feng Z, Wright DB, Mor V. Sharp rise in Medicare enrollees being held in hospitals for observation raises concerns about causes and consequences. Health Aff (Millwood). 2012;31(6):1251-1259.
- Baugh CW, Venkatesh AK, Hilton JA, Samuel PA, Schuur JD, Bohan JS. Making greater use of dedicated hospital observation units for many short-stay patients could save $3.1 billion a year. Health Aff (Millwood). 2012;31(10):2314-2323.
- Gengler A. The painful new trend in Medicare. CNN Money website. Available at: http://money.cnn.com/2012/08/07/pf/medicare-rehab-costs.moneymag/index.htm. Accessed March 6, 2013.
- Jaffe S. Patients held for observation can face steep drug bills. USA Today website. Available at: http://usatoday30.usatoday.com/money/industries/health/drugs/story/2012-04-30/drugs-can-be-expensive-in-observation-care/54646378/1. Accessed March 6, 2013.
- Landro L. Filling a gap between ERs and inpatient rooms. The Wall Street Journal website. Available at: http://online.wsj.com/article/SB10001424052970204349404578101060863887052.html. Accessed March 6, 2013.
SHM added a new item to its 2012 State of Hospital Medicine report: the ratio of respondents’ observation admissions to inpatient admission encounters. This metric was added because observation encounters have been increasing, with financial effects on hospitals and patients. SHM survey respondents reported a 20% observation rate for both adult and pediatric practice groups (see Figure 1).
Under observation status, services that used to be billed as inpatient status (e.g. chest pain evaluation, treatment of asthma exacerbation) must be billed by the hospital at much lower outpatient rates. Some hospitals have responded to this financial pressure by creating observation units or making other operational adjustments. One recent analysis suggested that nationwide adoption of such efforts could save billions of dollars.1
Becoming lean enough to do short work in short time, though, does not address all of the observation-related issues facing hospitals. When the Centers for Medicare & Medicaid Services’ (CMS) Recovery Audit Contractors (RACs) determine retrospectively that an inpatient admission should have been an observation encounter, the hospital’s payment is not downgraded but forfeited.2 This development has prompted hospitals to preemptively opt for observation status for certain patients. Case managers and providers increasingly are spending time reviewing inpatient versus observation status throughout a patient’s stay. Many hospitals have turned to third-party contractors to help review observation status.
Observation status has financial implications for patients as well. In the past year, USA Today, The Wall Street Journal, and CNN Money all have reported on patients hit with unexpected out-of-pocket expenses related to observation care.3,4,5 A common theme: Medicare patient hospitalized with an acute fracture, managed nonoperatively but requiring rehabilitation prior to returning home. These patients found out too late that observation, a status they were often unaware of, did not qualify for CMS’ three-day inpatient requirement to cover rehabilitation costs. Some patients were charged exorbitant prices for noncovered “outpatient” services, such as providing their routine medications.
Advocacy groups have joined the fray on patients’ behalf, and legal challenges have ensued. AARP and others are educating patients about observation status—and their right to challenge it. The Center for Medicare Advocacy (www.kslaw.com/Library/publication/HH111411_Bagnall.pdf) has filed a lawsuit against the U.S. Department of Health and Human Services on behalf of patients hit with uncovered rehabilitation costs, and the American Hospital Association has teamed with several hospitals to sue over funds forfeited in RAC audits (www.aha.org/content/12/121101-aha-hhs-medicare-com.pdf). Both houses of Congress have legislation (H.R. 1543 and S. 818) seeking to count observation days toward the Medicare three-day rule. For its part, CMS has promised to review observation status and, hopefully, clarify the rules.
Hospitalists, meanwhile, are gearing up for more observation care. The 2012 State of Hospital Medicine report shows that 37% of adult groups and 28% of pediatric groups reported having primary responsibility for observation or short-stay units. My own hospital runs both a clinical decision unit in the ED and a short-stay unit staffed by our hospitalist group. As SHM tracks observation status in future surveys, HM groups will be able to follow this phenomenon among their colleagues and benchmark their own rates of observation encounters.
Dr. Creamer is medical director of the short-stay unit at MetroHealth Medical Center in Cleveland and a member of SHM’s Practice Analysis Committee.
References
- Feng Z, Wright DB, Mor V. Sharp rise in Medicare enrollees being held in hospitals for observation raises concerns about causes and consequences. Health Aff (Millwood). 2012;31(6):1251-1259.
- Baugh CW, Venkatesh AK, Hilton JA, Samuel PA, Schuur JD, Bohan JS. Making greater use of dedicated hospital observation units for many short-stay patients could save $3.1 billion a year. Health Aff (Millwood). 2012;31(10):2314-2323.
- Gengler A. The painful new trend in Medicare. CNN Money website. Available at: http://money.cnn.com/2012/08/07/pf/medicare-rehab-costs.moneymag/index.htm. Accessed March 6, 2013.
- Jaffe S. Patients held for observation can face steep drug bills. USA Today website. Available at: http://usatoday30.usatoday.com/money/industries/health/drugs/story/2012-04-30/drugs-can-be-expensive-in-observation-care/54646378/1. Accessed March 6, 2013.
- Landro L. Filling a gap between ERs and inpatient rooms. The Wall Street Journal website. Available at: http://online.wsj.com/article/SB10001424052970204349404578101060863887052.html. Accessed March 6, 2013.
We Welcome the Newest SHM Members
- E. Cornatzer, MD, Alabama
- P. Cornatzer, MD, Alabama
- S. Meadows, MD, Alabama
- F. Shaikh, MD, PhD, Alabama
- A. Zouhary, MACP, Alabama
- L. Balk, Arizona
- E. Harding, MD, Arizona
- G. Rao, MD, Arizona
- S. Shah, MD, Arizona
- R. Snedecor, Arizona
- M. Dirst-Roberts, MD, Arkansas
- R. Campbell, California
- J. Idury, MD, California
- H. Jackson, MD, California
- C. Johnson, MD, MS, California
- G. Kanwar, California
- B. Kong, MD, California
- P. Lee, MD, California
- S. Pendharkar, USA, California
- S. Perry, California
- T. Pham, MD, California
- M. Sarwar Sr., MD, California
- A. Tandon, California
- E. Wu, MD, California
- G. Clover, MD, Colorado
- J. Cunningham, MD, Colorado
- A. Del Pino-Jones, Colorado
- D. Hilty, Colorado
- K. Kanel, Colorado
- E. Batista, MD, Connecticut
- A. Montero, MD, District of Columbia
- D. Westervelt, NP, District of Columbia
- C. Dumois, MD, Florida
- L. Gatien, DO, Florida
- G. Del Rio, MD, Florida
- M. Khan, MD, Florida
- I. Kuizon, MD, Florida
- S. Menon, DO, MPH, Florida
- G. Newlands, Florida
- R. Patil, MD, MBBS, Florida
- R. Ribon, MD, Florida
- C. Shah, MD, Florida
- C. Brooks, FAAP, Georgia
- S. Clarke, M.H.A., Georgia
- S. Lofgren, MD, Georgia
- K. Nieh, MD, Georgia
- R. Wright, MD, Georgia
- T. Dibuono, RN, Illinois
- C. Kandaswamy, MD, Illinois
- K. Kaul, MD, Illinois
- M. Majid, MD, Illinois
- D. Mitra, MD, Illinois
- J. Peace, Illinois
- A. Rahman, Illinois
- J. Rogers, Illinois
- M. Bolden, MD, Indiana
- T. Callahan, DO, Indiana
- G. Dupre, MD, Indiana
- K. Hall, MD, Indiana
- K. Hunt, MD, Indiana
- E. Tripp, MD, Indiana
- J. Gehling, Iowa
- B. Halsch, Iowa
- H. Zook, Kansas
- R. McLendon Jr., MD, Louisiana
- J. Newsom, Louisiana
- A. Karikkineth, USA, Maryland
- M. Lee, Maryland
- A. Rahim, MD, Maryland
- J. Riley, PA, Maryland
- M. Short, MD, Maryland
- L. Balestrero, MD, Massachusetts
- S. Dhungel, Massachusetts
- A. Finn, Massachusetts
- W. Garcia-Beltran, Massachusetts
- A. Khan, Massachusetts
- N. Najjar, MD, Massachusetts
- A. Sharma, MD, Massachusetts
- J. Cimadevilla, MD, Massachusetts
- M. Byland, MD, Michigan
- D. Coffin, PA-C, Michigan
- K. Covell, DO, Michigan
- J. Hill, Michigan
- M. Howard, PA-C, Michigan
- M. Kabach, Michigan
- K. Karikari, MD, MS, Michigan
- M. Kelsey, PA-C, Michigan
- J. Knoke, PA-C, Michigan
- A. Lawrin, Michigan
- E. Li Fuentes, MD, Michigan
- C. Petrilli, MD, Michigan
- J. Peyton, DO, Michigan
- L. Reynolds, PA-C, Michigan
- O. Sinyavskiy, MD, Michigan
- N. Veerapaneni, MD, MS, Michigan
- D. Wells, PA-C, Michigan
- L. Worthington, PA, Michigan
- E. Canan, MHA, Minnesota
- J. Hsieh, MD, Minnesota
- S. Hsieh, MD, Minnesota
- M. Moore, MD, Minnesota
- S. Xie, MD, Minnesota
- R. Bardowell, MD, Missouri
- A. Chowdhury, MD, Missouri
- I. Elayyan, MD, Missouri
- S. Majcina, Missouri
- P. Martin, Missouri
- S. Budd, MD, Nebraska
- U. Indukuri, MBBS, Nebraska
- J. Stolp, DO, Nebraska
- M. Mahdavian, MD, Canada
- I. Ahmad, MBBS, New Jersey
- T. Kostrub, MS, New Jersey
- S. Ozawa, RN, New Jersey
- G. Smith, MD, New Mexico
- D. Yu, MBA, FACP, New Mexico
- S. Aruchamy, MD, New York
- S. Chikoti, MD, New York
- J. Cohen, MD, New York
- M. Nerkar, MD, New York
- A. Mednick, MD, New York
- E. Metzger, NP, New York
- C. Morrow, MD, New York
- A. Ragusa, MD, New York
- D. Silverstein, MD, New York
- L. Sinvani, MD, New York
- A. Subramony, FAAP, New York
- P. Tierney, MD, New York
- A. Vien, New York
- F. Volpicelli, MD, New York
- E. Bindewald, MD, New Zealand
- R. Brown, FACP, North Carolina
- T. Cook, North Carolina
- K. Gallagher, MD, North Carolina
- C. Jones, North Carolina
- C. McKay, MB, North Carolina
- R. Nagaraj, MBBS, MPH, North Carolina
- A. Purohit, MD, North Carolina
- J. Guntakandla, FHM, North Dakota
- E. Albert, MD, Ohio
- F. Kuo, MD, MBA, Ohio
- A. Suciu, Ohio
- H. Tiu, MN, Ohio
- K. Wright, Ohio
- C. Kaufman, Oklahoma
- R. McGuire, MD, Ontario, Canada
- M. Shafiee, MD, Ontario, Canada
- J. Hughson, MD, Oregon
- M. Moore, MD, Oregon
- J. Richards, Oregon
- K. Alcorn, Pennsylvania
- J. Bogart Jr., ACNP, MSN, RN, Pennsylvania
- M. Buisch, PA-C, Pennsylvania
- P. Dolan, RN, Pennsylvania
- M. Dunkle, PA-C, Pennsylvania
- E. Faulconbridge, PA-C, Pennsylvania
- J. Frommer Jr., DO, Pennsylvania
- G. Horn, Pennsylvania
- K. Killian, PA-C, Pennsylvania
- J. Klutz, MD, FACFM, Pennsylvania
- B. Nolt, MD, Pennsylvania
- B. Randleman, DO, Pennsylvania
- E. Reynolds, MHS, PA-C, Pennsylvania
- S. Schwalm, MA, Pennsylvania
- K. McNally, BSC, CCFP, MD, Prince
- Edward Island, Canada
- J. Germain, CCFP, Quebec, Canada
- J. Garzone, DO, South Carolina
- M. Chaney, MD, Tennessee
- C. Foxley, MD, Tennessee
- S. Geller, MD, FACP, MPH, Tennessee
- J. Mann, MD, Tennessee
- D. Sargent, MD, Tennessee
- O. Adeyinka, MBBS, Texas
- J. Asuaje, Texas
- A. Bhuriwala, MBBS, Texas
- B. Fishman, MD, FACP, Texas
- S. Gerineni, Texas
- G. Guzman, MD, Texas
- R. Ledesma, Texas
- R. Mckelvey, BC, Texas
- R. Mohme, MD, Texas
- J. Ramineni, MD, Texas
- N. Robinson, MD, Texas
- M. Seas, Texas
- E. Silva, MD, Texas
- S. Siripurapu, Texas
- E. Trevino, DMD, Texas
- J. Miller, MD, Utah
- S. Sadiq, MBBS, Utah
- C. Wells, MD, Utah
- C. Mitchell, MD, Vermont
- K. Free, PA-C, Virginia
- M. Gomez-Sanchez, MD, Virginia
- P. Lee, MD, Virginia
- M. Ayub, MD, Washington
- B. Dentler, MD, Washington
- S. Fogarty, MD, Washington
- J. James, MD, Washington
- M. Larrabee, MD, Washington
- M. Marton, PhD, Washington
- C. Meyers, MD, Washington
- M. Narayanan, MD, MPH, Washington
- B. Randhawa, MD, Washington
- T. Spector, MD, Washington
- A. Thomas, Washington
- J. Tieder, MD, Washington
- J. Yoon, MD, Washington
- L. Mousa, MD, West Virginia
- D. La Voie, MD, Wisconsin
Affordable Care Act (ACA) Provision Carries Pay Raise for Some Hospitalists
For those who remain unaware, hospitalists who care for Medicaid patients will be getting a raise in 2013 and 2014. The reason is that the Affordable Care Act (ACA) requires Medicaid rates for specified primary-care services to be equal to those of Medicare rates during those two years, with the federal government paying the difference. Hospitalists generally meet the requirements and, therefore, will see this pay increase for their applicable Medicaid billing. For some context of the scope of this change, on average, Medicaid pays physicians at 66% of the national Medicare rates, although there is significant variation among the states.
To qualify, a physician must have a specialty designation of family medicine, internal medicine, or pediatrics, then further attest to board certification in one of those specialties or related subspecialties. Alternatively, the physician must have a 60% claims history for the specified evaluation and management (E&M) codes.
Multiple parties who have heard reports about state plans for Medicaid parity recently have contacted SHM; the plans, they report, intentionally would exclude hospitalists from the promised increase. There are variations on the explanation for the exclusion and where the idea is coming from, but the inquiries follow this general theme: “Since the definition of eligible physicians remains a grey area, states are developing alternative plans with a more narrow interpretation of the qualifying factors for the increase. These plans are only including physicians who practice in the community setting (i.e. not the hospital setting).”
This is demonstrably wrong. Even if states are having these discussions, such a plan is not going to come to fruition. The final rule for Medicaid parity, which essentially has the effect of law, is very clear: It does not allow for differing eligibility or alternate state plans.
The Centers for Medicare & Medicaid Services (CMS) specifically stated in the final rule that the increase is not limited to office-based primary-care services, but it will also include hospital observation and consultation for inpatient services provided by nonadmitting physicians, ED services, and critical-care services. In other words, a hospitalist who attests eligibility for their respective state Medicaid agency and bills 99231-3, 99221-3, 99238-9, etc., will receive the increased payment for these codes.
In response to an SHM inquiry for further clarification, CMS officials have stated, “The regulation requires that qualified physicians billing eligible codes receive higher payment. States do not have the latitude to exclude physicians simply because they practice in hospitals.”
It is possible that some confusion might be arising due to the recent controversies around the upcoming Medicaid expansion, which would extend Medicaid eligibility to individuals who earn up to 138% of the federal poverty line. Some states have chosen to opt out of this expansion and have publicly fought its implementation. The Medicaid parity provision is parallel to, but independent of, Medicaid expansion. Even if a state opts out of the expansion, the Medicaid payment increase for primary-care services should remain unaffected.
This isn’t to say that the Medicaid parity provision is a certainty. With the eyes of Congress turned toward budget cuts and austerity, the funds allocated for this temporary increase could easily be targeted. Regardless, any change in eligibility would require a rule change at the federal level, which is unlikely.
Many states have already devoted much time and effort on plans to implement the provision, and the plans were due to be submitted to CMS on March 31. It is pretty late in the game to consider changes. Barring an unlikely rule change or total elimination of funding, it is clear that hospitalists are eligible for the payment bump and should remain so.
Josh Boswell is SHM’s senior manager of government relations.