User login
COVID-19 Cycle Threshold/Cycle Number Testing at a Community Living Center
COVID-19, caused by SARS-CoV-2, is more severe in individuals with underlying illnesses. Because complete social distancing might be more difficult in nursing homes and community living centers (CLCs), public health leaders and clinicians have been concerned about the epidemiology and disease course in nursing homes even before the COVID-19 pandemic.1-7 A report of a COVID-19 outbreak in a nursing home facility in King County, Washington, documented a 33.7% overall fatality rate for residents and 52.4% among the most critically ill.4,5 The experience at King County, Washington, shows that proactive steps to identify, monitor, and apply preventive control measures is important for future outbreaks.5
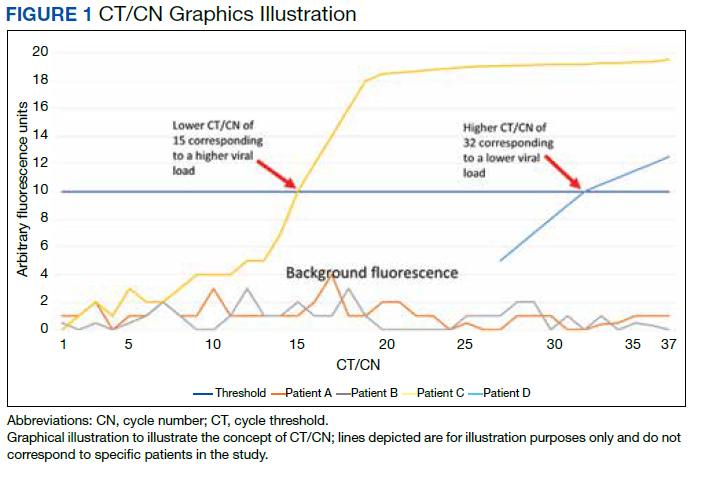
Reverse transcriptase polymerase chain reaction (RT-PCR) testing produces a cycle threshold (CT) or cycle number (CN) that correlates with viral load and infectiousness. 8-14 CT/CN represents the number of RT-PCR cycles required for the fluorescent signal to cross the detection threshold (exceed background level) and is inversely proportional to the viral load. Effectively, the higher the viral load, the lower the CT/ CN value (Figure 1). Tracking CT/CN values was not documented in the Washington nursing home outbreak. Reports of COVID- 19 testing in CLCs during outbreaks are sparse, and CT/CN values and demographic distribution of these veterans has not been reported.15 The CLC veteran population, with known higher vulnerability to infection and chronic diseases, is epidemiologically different from the general nursing home population.15-18 To address these literature gaps, we present the first report of COVID- 19 testing with CT/CN value correlations in the high-risk veteran CLC population.
Methods
A retrospective review of all COVID-19 CT/CN testing at the Corporal Michael J. Crescenz Veterans Affairs Medical Center (VAMC) CLC in Philadelphia, Pennsylvania, from March 28, 2020, to April 24, 2020, was performed with a US Department of Veterans Affairs (VA) Veterans Health Information System Architecture VistA/FileMan search. Only veteran residents were included in this review. Data collected included initial and serial test results, CT/CN on positive test results, test dates, testing platform used, demographic information (age, self-reported ethnicity, and sex), and clinical follow-up information. Health records were reviewed retrospectively to identify death, the first day after diagnosis with no documented symptoms, or hospitalization status.
RT-PCR testing was performed with the Abbott RealTime SARS-CoV-2 assay on the Abbott m2000 platform and the Xpert Xpress SARS-CoV-2 assay on the Cepheid Infinity platform. The Xpert Xpress assay gave 2 CT values for the E and N2 targets on positive samples.19 For this assay to indicate a positive specimen, amplification by RT-PCR of the N2 target or both the N2 and E target is required. The Xpert Xpress assay results as presumptive positive if only the E target amplified. This assay counts a maximum of 45 cycles. The Abbott RealTime SARS-CoV-2 assay gave 1 CN derived from the RNA-dependent RNA polymerase and N targets on positive samples.20 The Abbott assay on the m2000 counts a maximum of 37 cycles. The CT/CN value is the number of cycles required by RT-PCR for the fluorescence signal to cross a threshold value exceeding background level.19,20
Samples that are negative for COVID-19 by RT-PCR do not produce a CT/CN value. Although both instruments were used for RT-PCR, the precise CT/CN values are not interchangeable and CT/CN observations over time between the 2 instruments during the disease course would be based on CT/CN value movement (general upward or downward trend) rather than absolute CT/CN differences. Both assays have been approved by emergency use authorization as qualitative tests for the presence/absence of COVID-19. Although the CT/CN value is available to laboratory staff after test completion, the CT/CN value is not reported routinely in the patient health record. All veteran patients identified on the initial review from March 28, 2020, to April 24, 2020, had all serial COVID-19 testing recorded until November 10, 2020. The CN values at the limit of detection (LOD) for the Abbott m2000 platform from the initial validation study were reviewed for reference.21
Results
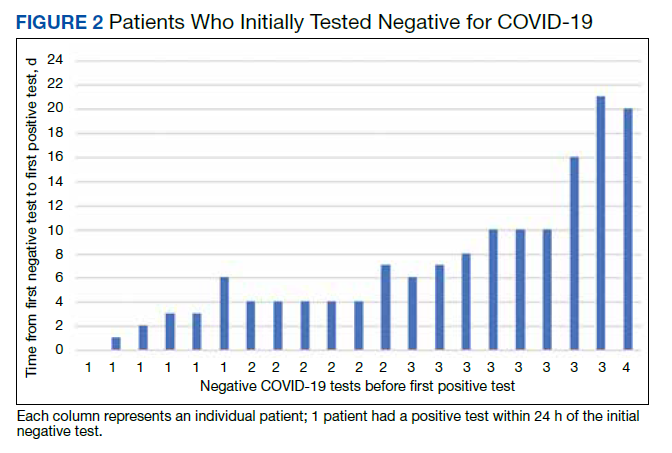
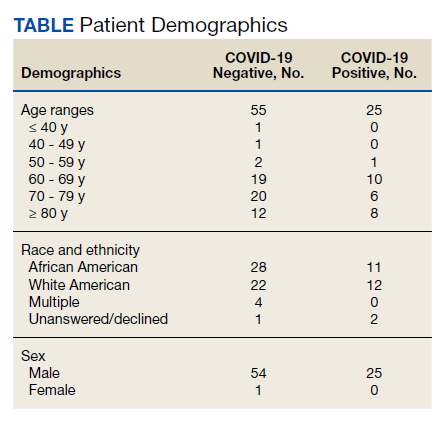
Of 80 patients, 25 (31%) were COVID-19 positive over the course of testing. The study population had a mean age of 73.5 years; 92% were aged > 60 years. The group was predominantly male (79 male vs 1 female). Among the 77 patients with a stated ethnicity, 39 (51%) were African American. In comparison, 43% of residents in Philadelphia County are African American (Table).22,23 Additionally, a previously published total COVID-19 tested population by ethnicity at the same regional VAMC revealed 46.8% of tested veteran patients were African American. 24 Three patients had no stated ethnicity. Among those who tested positive, 11 were African American patients, 12 were White patients, and 2 had no stated ethnicity. Four patients tested positive on their first test. The other 21 patients were positive on repeat testing. Interestingly, 6 patients had 1 initial negative test before a positive test, 6 patients had 2, 8 patients had 3, and 1 patient had 4 initial negative tests before a positive test result. Among the 25 positive patients, 22 were either positive within 10 days of the initial negative test result or initially positive (Figure 2). Three patients who tested positive after 10 days did so at 16, 20, and 21 days after the initial negative test result. Among the 25 positive patients, 23 had initial and serial testing from both the Abbott and Xpert Xpress assays. The remaining 2 positive patients had initial and serial testing from the Abbott assay exclusively.
Only positive COVID-19 results by RTPCR produced a CT/CN value. After disease resolution with a negative test, no CT/CN value was produced with the negative test result on either testing platform. Because repeat testing after the initial positive result took place no sooner than 10 days, we observed that the CT/CN value increased after the initial positive result until the disease resolved, and a negative result was obtained (eAppendix 1, available online at doi:10.12788/fp.0276). A t test comparing the initial CT/CN value to the value more than 10 days after the initial positive showed the CT/CN was statistically significantly higher (P < .05).
Prompt repeat testing after the initial test can show a decrease in the CT/CN value because of increasing viral load before the expected increase until disease resolution if the initial test caught the infection early. Twelve patients had a negative test result between 2 serial positive results. These negative test results occurred later, near the end of the disease course. Among the 12 patients with this positive-negativepositive CT/CN pattern, 7 were symptomatic and no longer had documented symptoms or hospitalization around the time of this positive-negative-positive pattern. Four of these individuals were asymptomatic during the entire infection course. One of the 12 patients with this pattern expired with the negative result occurring on day 27 of the disease in the context of rising CT/CN. One of these 12 patients only had a presumptive positive test result on the Cepheid because it detected only the E target with a CT value of 38.7. In 1 of the 12 patients, the negative test result occurred between 2 positive test results with CT/CN values < 20 (12.05 and 19.05 for the positive tests before and after the negative result, respectively). When the initial CT/CN values was separated based on ethnicity, the average CT/CN value for African Americans (23.3) was higher than for other ethnicities (19.9), although it did not reach statistical significance (P = .35).
Ten of the 25 patients testing positive were admitted to the hospital, including 1 admitted 15 days before diagnosis (patient 20) and 1 admitted 80 days after diagnosis (patient 7). Among these 10 patients, 6 were admitted to the intensive care unit, including patient 7. None of the patients were intubated. Three of the 10 admitted patients died (patients 7, 20, and 24). Patient 7 was a 79-year-old male with a history of dementia, cerebrovascular accident, hypertension, hyperlipidemia, and chronic kidney disease with symptoms of lethargy and refusal of oral intake when he was diagnosed with COVID-19. He was admitted 80 days after diagnosis for hyponatremia and acute renal failure, with death on day 87 recorded as complications from the earlier COVID-19 infection. Patient 20, an 89-year-old male with a history of dementia, chronic kidney disease, and hyperlipidemia, had been admitted with fever, cough, and leukocytosis 17 days before COVID-19 diagnosis. He continued to be symptomatic after diagnosis with development of hypotension, dehydration, and refusal of oral intake while on comfort measures/endof- life care and died 15 days after COVID- 19 infection diagnosis. Patient 24 was a 96-year-old male with history of heart failure, hypertension, coronary artery disease, prostate carcinoma, and dementia who developed a cough at the time of diagnosis; because of his underlying condition, he remained in the CLC on comfort care. His symptoms, including hypoxia, worsened until he died 7 days after diagnosis.
Among the 25 patients, 17 were symptomatic at the time of diagnosis; the 14 initially symptomatic patients who survived improved clinically and returned to baseline. Eight of the 25 patients were asymptomatic initially and 3 developed symptoms 2 to 5 days after diagnosis. Only 1 patient who remained asymptomatic was admitted for inability to adhere to quarantine at the CLC. Review of the health records of all surviving symptomatic patients showed symptom resolution with return to baseline that corresponds to an increasing CT/CN value. A 1-tailed t test comparing the initial CT/ CN at the time of diagnosis to the last CT/CN value for symptomatic patients who recovered revealed a statistically significant increase (P < .05). For the symptomatic, symptom resolution and hospital discharge took (if required) a mean 20 days (range, 7-46). Among those who were not hospitalized, symptoms resolved in 7 to 36 days (18 days). Among those requiring hospitalization at any time (excluding patients who died or were asymptomatic), symptom and hospitalization resolution took a mean 22 days (range, 10-46). Asymptomatic patients (patients 8, 10, 15, 16, and 25) also showed increasing CT/CN value during the infection course, although there was no correlation with the continued lack of symptoms.
During the initial validation of the Abbott m2000 instrument, an LOD study included concentrations of 1000, 500, 250, 100, 70, 60, and 50 virus copies/mL (eAppendix 2, available online at doi:10.12788/fp.0276).21 The average CN at 100 virus copies/mL—the manufacturer provided LOD in the instructions for use—was 25.74.20 At a concentration of one-half that (50 virus copies/mL), the average CN was 28.39.
Discussion
This is the first study in the English literature to track CT/CN values as part of serial testing of a veteran CLC. Widescale testing and repeat screening in the absence of symptoms of nursing home residents would identify those who are infected and allow providers to track viral load clearance.9-14 CT/CN values, when serially tracked during the infection course, appear to increase with illness resolution, consistent with earlier reports that CT/CN correlates with viral load.8-14 Serial CT/CN values that are high (> 25) and continue to increase with each test suggest progression toward disease resolution or viral RNA clearance.8-14 After symptom resolution, patients can have a persistent low level of viral shedding (corresponding to a high CT/CN value).10-14,25 Near the end of disease resolution, a negative serial RT-PCR sample test before a subsequent positive might be a promising clinical sign of near disease recovery. Once the viral load is low with a CT/CN significantly higher than 25, some specimens might result as negative but turn up positive on subsequent sampling with a high CT/CN value. This pattern, with attendant high CT/CN values for the positive results, are consistent with the known effect of viral load (ie, a low viral load correlates to a high CT/CN) and adequacy of specimen collection on CT/CN values.25 If the patient’s viral load is low, the sample collected might have a viral load at or near the testing platform’s LOD.
For Abbott m2000, the manufacturer provided LOD is 100 virus copies/mL, although the instrument was able to detect virus concentrations below that level during the initial validation.20 The actual LOD of the instrument at our institution is < 100 virus copies/mL. For the Cepheid Xpert Xpress SARS-CoV-2 assay, the manufacturer-provided LOD is 250 virus copies/mL.19 An LOD study including samples below the manufacturer-provided LOD was not part of the initial validation study for the Xpert Xpress assay. Nonetheless, the virus concentration of samples with very high CT values at or near the maximum CT value of 45 is expected to be at or near the platform’s actual LOD.
If the samples collected near the end of the patient’s disease course have viral loads near these low concentrations, the encouraging positive-negative-positive pattern with high CT/CN values might be a promising sign for viral clearance. On the other hand, a positive-negative-positive pattern in the setting of low CT/CN values before and after the negative test might indicate poor sampling for the negative specimen. The back-and-forth or positive-negative-positive pattern generally appears to indicate near resolution of the infection course, although clinical correlation is necessary to rule out inadequate sampling earlier in the disease course or prolonged viral RNA shedding.9-14 In all of the surviving symptomatic patients who showed the positive-negative-positive pattern, this sign occurred around or after symptom resolution. It also is important to consider that in some patients, SARS-CoV-2 RNA might remain detectable with increasing CT/CN after symptom resolution, and samples from these patients might not result positive. Therefore, CT/CN values cannot be interpreted without considering the clinical picture.25
Studies on infectiousness and virus culture from COVID-19 samples with CT/ CN correlation have shown that patients with high CT/CN at the end of their disease course might not be as infectious.9-14,25 Because 1 patient had a presumptive positive result after the negative result, this study shows that this positive-negative-positive pattern could include presumptive positive results. Also, in the setting of a recent positive result on the same testing platform, a patient with this pattern is presumed to be positive for COVID-19 RNA because of scant viral material.
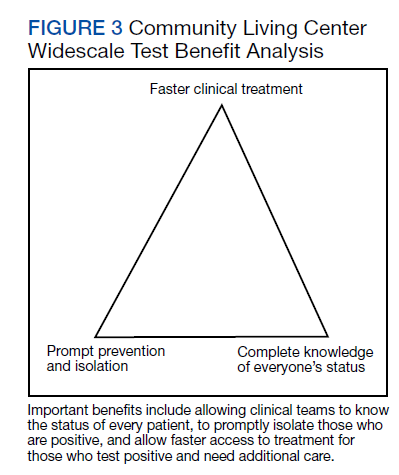
Taiwan’s public health response to the outbreak illustrates the ability to mitigate an outbreak throughout a society.26 These actions could help blunt an outbreak within a civilian nursing home population.5 Mitigation within a veteran CLC population has been documented, but the study, which focused on mitigation, did not consider CT/CN values, demographic distribution, testing access of the studied population, or laboratory findings related to disease pathophysiology.15 A key ingredient in widescale, serial testing is the availability of a rapid turnaround from testing in-house that allowed identification within 24 hours instead of several days at a reference laboratory. 15 Rapid widescale testing would allow clinical teams to optimize the Triangle of Benefit of Widescale Timely Tests for CLC (Figure 3).15 Timely laboratory testing remains pivotal for CLC veteran residents to aid successful clinical triage and management. Reporting serial CT/CN values can provide additional information to clinicians about the disease course because CT/ CN correlates with viral load, which varies based on where the patient is in the disease course.9-14 CT/CN values carry significant prognostic value, particularly with respect to intubation and mortality.8
Limitations
Important limitations to our study include the use of 2 separate RT-PCR platforms. Using different RT-PCR platforms is common in clinical laboratories trying to take advantage of the unique characteristics of different platforms—for example, turnaround time vs high throughput— to manage COVID-19 testing workflow.25 However, the exact CT/CN values obtained from each platform might not translate to the other, and the general trend (CT/CN values are rising or falling across serial tests) rather than a single value could be useful for clinical correlation. Even when the same platform is used for the serial testing, CT/CN values can be affected by adequacy of specimen collection; therefore, clinical correlation and considering the trend in CT/CN values is necessary for interpretation.10-14,25 Because of the known trend in viral dynamics, a positive specimen collected with a high CT/CN followed by a subsequent (within 2 days) positive specimen collected with a low CT/CN might be compatible with early detection of COVID- 19 infection in the appropriate clinical context. 10-14 However, detection late in the infection course or even after the symptomatic disease resolved with prolonged viral shedding might show serial positive samples with increasing CT/CN values.10-14
Patients with prolonged viral shedding might not be infectious.27 Because of the clinical correlation required for interpretation and the other factors that might affect CT/CN values, recommendations advise against using CT/CN values in clinical practice at this time, although these recommendations could change with future research.25 Serial CT/CN values have the potential, if appropriately correlated with the clinical picture, to provide useful information, such as whether the viral load of the sample is relatively high or low and increasing or decreasing.
Veterans, as a population, are more susceptible to poor health outcomes and morbidity compared with similar civilian counterparts.2,14-16 Veteran CLC patients likely would experience worse outcomes with COVID-19, including more infections, expiration, and morbidity compared with similar general population nursing homes. Similar to what had been reported for the civilian population, a trend (high CT/CN values early in the disease course with repeat testing needed to detect all positives followed by lower CT/CN value to correlate with increased viral load and then increased CT/CN value as the infection resolved) also was observed in this veteran population.
It has been extensively documented that minority groups experience decreased health care access and worse health outcomes. 28-30 Considering the critical medical supply shortages, including personal protective equipment, ventilators, and even testing supplies, there is the potential for a resource access disparity by ethnicity.28-31 Because the VA does not depend on measures of wealth and privilege such as health insurance, there was no disparity noted in access to testing by race or ethnicity at the VAMC CLC. When considering the health outcome of viral load from the measured CT/CN value, the viral loads of African American patients and those of other ethnicities was not significantly different in this study.
Conclusions
This is the first study to bring up critical points including serial CT/CN value correlation in RT-PCR tests, demographic distributions demonstrating easy and equal access in a veteran nursing home to COVID-19 testing, and clinical laboratory signs related to disease pathophysiology. Unlike other populations who have undergone serial CT/CN monitoring, nursing homes represent a particularly vulnerable population who require measures to prevent the spread and mitigate outbreaks of COVID-19.2,4,5 Test measurements obtained such as the CT/CN value during routine clinical care can provide useful information for public health, epidemiologic, or clinical purposes with appropriate correlation to clinical and other laboratory parameters. This study demonstrates early intervention of serial testing of an outbreak in a veterans nursing home with CT/CN value correlation.
1. Chen T, Wu D, Chen H, et al. Clinical characteristics of 113 deceased patients with coronavirus disease 2019: retrospective study. BMJ. 2020;368:m1091. doi:10.1136/bmj.m1091
2. Tsan L, Davis C, Langberg R, et al. Prevalence of nursing home-associated infections in the Department of Veterans Affairs nursing home care units. Am J Infect Control. 2008;36(3):173-179. doi:10.1016/j.ajic.2007.06.008
3. Zhou F, Yu T, Du R, et al. Clinical course and risk factors for mortality of adult inpatients with COVID-19 in Wuhan, China: a retrospective cohort study. Lancet. 2020;395(10229):1054-1062. doi:10.1016/S0140-6736(20)30566-3
4. Arentz M, Yim E, Klaff L, et al. Characteristics and outcomes of 21 critically ill patients with COVID-19 in Washington State. JAMA. 2020;323(16):1612-1614. doi:10.1001/jama.2020.4326
5. McMichael TM, Currie DW, Clark S, et al. Public Health–Seattle and King County, EvergreenHealth, and CDC COVID-19 Investigation Team. Epidemiology of Covid-19 in a long-term care facility in King County, Washington. N Engl J Med. 2020;382(21):2005-2011. doi:10.1056/NEJMoa2005412
6. Childs A, Zullo AR, Joyce NR, et al. The burden of respiratory infections among older adults in long-term care: a systematic review. BMC Geriatr. 2019;19(1):210. doi:10.1186/s12877-019-1236-6
7. Eriksen HM, Iversen BG, Aavitsland PJ. Prevalence of nosocomial infections and use of antibiotics in long-term care facilities in Norway, 2002 and 2003. Hosp Infect. 2004;57(4):316-320. doi:10.1016/j.jhin.2004.03.028
8. Magleby R, Westblade LF, Trzebucki A, et al. Impact Severe acute respiratory syndrome coronavirus 2 viral load on risk of intubation and mortality among hospitalized patients with coronavirus disease 2019. Clin Infect Dis. 2021;73(11):e4197-e4205. doi:10.1093/cid/ciaa851
9. Buchan B, Hoff J, Gmehlin C, et al. Distribution of SARSCoV- 2 PCR cycle threshold values provide practical insight into overall and target-specific sensitivity among symptomatic patients. Am Clin Pathol. 2020;154:479-485. doi:10.1093/ajcp/aqaa133
10. He X, Lau EHY, Wu P, et al. Temporal dynamics in viral shedding and transmissibility of COVID-19. Nat Med. 2020;26(5):672-675. doi:10.1038/s41591-020-0869-5
11. Zou L, Ruan F, Huang M, et al. SARS-CoV-2 Viral load in upper respiratory specimens of infected patients. N Engl J Med. 2020;382(12):1177-1179. doi:10.1056/NEJMc2001737
12. Singanayagam A, Patel M, Charlett A, et al. Duration of infectiousness and correlation with RT-PCR cycle threshold values in cases of COVID-19, England, January to May 2020. Euro Surveill. 2020;25(32):2001483. doi:10.2807/1560-7917.ES.2020.25.32.2001483
13. Salvatore P, Dawson P, Wadhwa A, et al. Epidemiological correlates of PCR cycles threshold values in the detection of SARS-CoV-2. Clin Infect Dis. 2021;72(11):e761-e767. doi:10.1093/cid/ciaa1469
14. Kissler S, Fauver J, Mack C, et al. Viral dynamics of SARS-CoV-2 infection and the predictive value of repeat testing. medRxiv. 2020;10.21.20217042. doi:10.1101/2020.10.21.20217042 1
5. Escobar DJ, Lanzi M, Saberi P, et al. Mitigation of a COVID-19 outbreak in a nursing home through serial testing of residents and staff. Clin Infect Dis. 2021;72(9):e394- e396. doi:10.1093/cid/ciaa1021
16. Eibner C, Krull H, Brown KM, et al. Current and projected characteristics and unique health care needs of the patient population served by the Department of Veterans Affairs. Rand Health Q. 2016;5(4):13.
17. Agha Z, Lofgren RP, VanRuiswyk JV, Layde PM. Are patients at Veterans Affairs medical centers sicker? A comparative analysis of health status and medical resource use. Arch Intern Med. 2000;160(21):3252-3257. doi:10.1001/archinte.160.21.3252
18. Morgan RO, Teal CR, Reddy SG, Ford ME, Ashton CM. Measurement in Veterans Affairs Health Services Research: veterans as a special population. Health Serv Res. 2005;40(5 Pt 2):1573-1583. doi:10.1111/j.1475-6773.2005.00448.x 1
9. Xpert Xpress SARS-CoV-2. Instructions for use. Cepheid. 302-2562, Rev. C April 2020. Accessed January 7, 2021. https://www.fda.gov/media/136314/download
20. Abbott RealTime SARS-CoV-2. Instructions for use Abbott. 09N77-95. July 2020. Accessed January 7, 2021. https:// www.fda.gov/media/136258/download
21. Petersen JM, Dalal S, Jhala D. Successful implementation of SARS-CoV-2 testing in midst of pandemic with emphasis on all phases of testing. J Clin Pathol. 2021;74:273- 278. doi:10.1136/jclinpath-2020-207175
22. United States Census Bureau. Quick Facts: Philadelphia County, Pennsylvania. Accessed April 16, 2020. https://www .census.gov/quickfacts/philadelphiacountypennsylvania
23. Centers for Disease Control and Prevention. United States COVID-19 cases, deaths, and laboratory testing (NAATS) by state, territory, and jurisdiction. Accessed April 26, 2020. https://www.cdc.gov/coronavirus/2019-ncov/cases -updates/cases-in-us.html 2
4. Petersen J, Jhala D. Ethnicity, comorbid medical conditions, and SARS-CoV-2 test cycle thresholds in the veteran population [published online ahead of print, 2021 Jul 28]. J Racial Ethn Health Disparities. 2021;1-8. doi:10.1007/s40615-021-01114-4
25. Infectious Diseases Society of America, Association for Molecular Pathology. IDSA and AMP joint statement on the use of SARS-CoV-2 PCR cycle threshold (Ct) values for clinical decision-making. Accessed August 28, 2021. https://www.idsociety.org/globalassets/idsa/public-health /covid-19/idsa-amp-statement.pdf
26. Wang J, Ng CY, Brook RH. Response to COVID-19 in Taiwan: big data analysis, new technology, and proactive testing. JAMA. 2020;323(14):1341-1342. doi:10.1001/jama.2020.3151
27. Centers for Disease Control and Prevention. Overview of testing for SARS-CoV-2, the virus that causes COVID- 19. Accessed July 28, 2021. https://www.cdc.gov /coronavirus/2019-ncov/hcp/testing-overview.html
28. Zuvekas SH, Taliaferro GS. Pathways to access: health insurance, the health care delivery system, and racial/ethnic disparities, 1996-1999. Health Aff. 2003;22(2):139-153. doi:10.1377/hlthaff.22.2.139
29. Egede LE. Race, ethnicity, culture, and disparities in health care. J Gen Intern Med. 2006;21(6):667-669. doi:10.1111/j.1525-1497.2006.0512.x
30. Institute of Medicine (US) Committee on Understanding and Eliminating Racial and Ethnic Disparities in Health Care. Smedley BD, Stith AY, Nelson AR, eds. Unequal treatment: confronting racial and ethnic disparities in health care. National Academies Press; 2003. doi:10.17226/12875
31. Ranney ML, Griffeth V, Jha AK. Critical supply shortages – the need for ventilators and personal protective equipment during the Covid-19 Pandemic. N Engl J Med. 2020;382(18):e41. doi:10.1056/NEJMp2006141
COVID-19, caused by SARS-CoV-2, is more severe in individuals with underlying illnesses. Because complete social distancing might be more difficult in nursing homes and community living centers (CLCs), public health leaders and clinicians have been concerned about the epidemiology and disease course in nursing homes even before the COVID-19 pandemic.1-7 A report of a COVID-19 outbreak in a nursing home facility in King County, Washington, documented a 33.7% overall fatality rate for residents and 52.4% among the most critically ill.4,5 The experience at King County, Washington, shows that proactive steps to identify, monitor, and apply preventive control measures is important for future outbreaks.5
Reverse transcriptase polymerase chain reaction (RT-PCR) testing produces a cycle threshold (CT) or cycle number (CN) that correlates with viral load and infectiousness. 8-14 CT/CN represents the number of RT-PCR cycles required for the fluorescent signal to cross the detection threshold (exceed background level) and is inversely proportional to the viral load. Effectively, the higher the viral load, the lower the CT/ CN value (Figure 1). Tracking CT/CN values was not documented in the Washington nursing home outbreak. Reports of COVID- 19 testing in CLCs during outbreaks are sparse, and CT/CN values and demographic distribution of these veterans has not been reported.15 The CLC veteran population, with known higher vulnerability to infection and chronic diseases, is epidemiologically different from the general nursing home population.15-18 To address these literature gaps, we present the first report of COVID- 19 testing with CT/CN value correlations in the high-risk veteran CLC population.
Methods
A retrospective review of all COVID-19 CT/CN testing at the Corporal Michael J. Crescenz Veterans Affairs Medical Center (VAMC) CLC in Philadelphia, Pennsylvania, from March 28, 2020, to April 24, 2020, was performed with a US Department of Veterans Affairs (VA) Veterans Health Information System Architecture VistA/FileMan search. Only veteran residents were included in this review. Data collected included initial and serial test results, CT/CN on positive test results, test dates, testing platform used, demographic information (age, self-reported ethnicity, and sex), and clinical follow-up information. Health records were reviewed retrospectively to identify death, the first day after diagnosis with no documented symptoms, or hospitalization status.
RT-PCR testing was performed with the Abbott RealTime SARS-CoV-2 assay on the Abbott m2000 platform and the Xpert Xpress SARS-CoV-2 assay on the Cepheid Infinity platform. The Xpert Xpress assay gave 2 CT values for the E and N2 targets on positive samples.19 For this assay to indicate a positive specimen, amplification by RT-PCR of the N2 target or both the N2 and E target is required. The Xpert Xpress assay results as presumptive positive if only the E target amplified. This assay counts a maximum of 45 cycles. The Abbott RealTime SARS-CoV-2 assay gave 1 CN derived from the RNA-dependent RNA polymerase and N targets on positive samples.20 The Abbott assay on the m2000 counts a maximum of 37 cycles. The CT/CN value is the number of cycles required by RT-PCR for the fluorescence signal to cross a threshold value exceeding background level.19,20
Samples that are negative for COVID-19 by RT-PCR do not produce a CT/CN value. Although both instruments were used for RT-PCR, the precise CT/CN values are not interchangeable and CT/CN observations over time between the 2 instruments during the disease course would be based on CT/CN value movement (general upward or downward trend) rather than absolute CT/CN differences. Both assays have been approved by emergency use authorization as qualitative tests for the presence/absence of COVID-19. Although the CT/CN value is available to laboratory staff after test completion, the CT/CN value is not reported routinely in the patient health record. All veteran patients identified on the initial review from March 28, 2020, to April 24, 2020, had all serial COVID-19 testing recorded until November 10, 2020. The CN values at the limit of detection (LOD) for the Abbott m2000 platform from the initial validation study were reviewed for reference.21
Results
Of 80 patients, 25 (31%) were COVID-19 positive over the course of testing. The study population had a mean age of 73.5 years; 92% were aged > 60 years. The group was predominantly male (79 male vs 1 female). Among the 77 patients with a stated ethnicity, 39 (51%) were African American. In comparison, 43% of residents in Philadelphia County are African American (Table).22,23 Additionally, a previously published total COVID-19 tested population by ethnicity at the same regional VAMC revealed 46.8% of tested veteran patients were African American. 24 Three patients had no stated ethnicity. Among those who tested positive, 11 were African American patients, 12 were White patients, and 2 had no stated ethnicity. Four patients tested positive on their first test. The other 21 patients were positive on repeat testing. Interestingly, 6 patients had 1 initial negative test before a positive test, 6 patients had 2, 8 patients had 3, and 1 patient had 4 initial negative tests before a positive test result. Among the 25 positive patients, 22 were either positive within 10 days of the initial negative test result or initially positive (Figure 2). Three patients who tested positive after 10 days did so at 16, 20, and 21 days after the initial negative test result. Among the 25 positive patients, 23 had initial and serial testing from both the Abbott and Xpert Xpress assays. The remaining 2 positive patients had initial and serial testing from the Abbott assay exclusively.
Only positive COVID-19 results by RTPCR produced a CT/CN value. After disease resolution with a negative test, no CT/CN value was produced with the negative test result on either testing platform. Because repeat testing after the initial positive result took place no sooner than 10 days, we observed that the CT/CN value increased after the initial positive result until the disease resolved, and a negative result was obtained (eAppendix 1, available online at doi:10.12788/fp.0276). A t test comparing the initial CT/CN value to the value more than 10 days after the initial positive showed the CT/CN was statistically significantly higher (P < .05).
Prompt repeat testing after the initial test can show a decrease in the CT/CN value because of increasing viral load before the expected increase until disease resolution if the initial test caught the infection early. Twelve patients had a negative test result between 2 serial positive results. These negative test results occurred later, near the end of the disease course. Among the 12 patients with this positive-negativepositive CT/CN pattern, 7 were symptomatic and no longer had documented symptoms or hospitalization around the time of this positive-negative-positive pattern. Four of these individuals were asymptomatic during the entire infection course. One of the 12 patients with this pattern expired with the negative result occurring on day 27 of the disease in the context of rising CT/CN. One of these 12 patients only had a presumptive positive test result on the Cepheid because it detected only the E target with a CT value of 38.7. In 1 of the 12 patients, the negative test result occurred between 2 positive test results with CT/CN values < 20 (12.05 and 19.05 for the positive tests before and after the negative result, respectively). When the initial CT/CN values was separated based on ethnicity, the average CT/CN value for African Americans (23.3) was higher than for other ethnicities (19.9), although it did not reach statistical significance (P = .35).
Ten of the 25 patients testing positive were admitted to the hospital, including 1 admitted 15 days before diagnosis (patient 20) and 1 admitted 80 days after diagnosis (patient 7). Among these 10 patients, 6 were admitted to the intensive care unit, including patient 7. None of the patients were intubated. Three of the 10 admitted patients died (patients 7, 20, and 24). Patient 7 was a 79-year-old male with a history of dementia, cerebrovascular accident, hypertension, hyperlipidemia, and chronic kidney disease with symptoms of lethargy and refusal of oral intake when he was diagnosed with COVID-19. He was admitted 80 days after diagnosis for hyponatremia and acute renal failure, with death on day 87 recorded as complications from the earlier COVID-19 infection. Patient 20, an 89-year-old male with a history of dementia, chronic kidney disease, and hyperlipidemia, had been admitted with fever, cough, and leukocytosis 17 days before COVID-19 diagnosis. He continued to be symptomatic after diagnosis with development of hypotension, dehydration, and refusal of oral intake while on comfort measures/endof- life care and died 15 days after COVID- 19 infection diagnosis. Patient 24 was a 96-year-old male with history of heart failure, hypertension, coronary artery disease, prostate carcinoma, and dementia who developed a cough at the time of diagnosis; because of his underlying condition, he remained in the CLC on comfort care. His symptoms, including hypoxia, worsened until he died 7 days after diagnosis.
Among the 25 patients, 17 were symptomatic at the time of diagnosis; the 14 initially symptomatic patients who survived improved clinically and returned to baseline. Eight of the 25 patients were asymptomatic initially and 3 developed symptoms 2 to 5 days after diagnosis. Only 1 patient who remained asymptomatic was admitted for inability to adhere to quarantine at the CLC. Review of the health records of all surviving symptomatic patients showed symptom resolution with return to baseline that corresponds to an increasing CT/CN value. A 1-tailed t test comparing the initial CT/ CN at the time of diagnosis to the last CT/CN value for symptomatic patients who recovered revealed a statistically significant increase (P < .05). For the symptomatic, symptom resolution and hospital discharge took (if required) a mean 20 days (range, 7-46). Among those who were not hospitalized, symptoms resolved in 7 to 36 days (18 days). Among those requiring hospitalization at any time (excluding patients who died or were asymptomatic), symptom and hospitalization resolution took a mean 22 days (range, 10-46). Asymptomatic patients (patients 8, 10, 15, 16, and 25) also showed increasing CT/CN value during the infection course, although there was no correlation with the continued lack of symptoms.
During the initial validation of the Abbott m2000 instrument, an LOD study included concentrations of 1000, 500, 250, 100, 70, 60, and 50 virus copies/mL (eAppendix 2, available online at doi:10.12788/fp.0276).21 The average CN at 100 virus copies/mL—the manufacturer provided LOD in the instructions for use—was 25.74.20 At a concentration of one-half that (50 virus copies/mL), the average CN was 28.39.
Discussion
This is the first study in the English literature to track CT/CN values as part of serial testing of a veteran CLC. Widescale testing and repeat screening in the absence of symptoms of nursing home residents would identify those who are infected and allow providers to track viral load clearance.9-14 CT/CN values, when serially tracked during the infection course, appear to increase with illness resolution, consistent with earlier reports that CT/CN correlates with viral load.8-14 Serial CT/CN values that are high (> 25) and continue to increase with each test suggest progression toward disease resolution or viral RNA clearance.8-14 After symptom resolution, patients can have a persistent low level of viral shedding (corresponding to a high CT/CN value).10-14,25 Near the end of disease resolution, a negative serial RT-PCR sample test before a subsequent positive might be a promising clinical sign of near disease recovery. Once the viral load is low with a CT/CN significantly higher than 25, some specimens might result as negative but turn up positive on subsequent sampling with a high CT/CN value. This pattern, with attendant high CT/CN values for the positive results, are consistent with the known effect of viral load (ie, a low viral load correlates to a high CT/CN) and adequacy of specimen collection on CT/CN values.25 If the patient’s viral load is low, the sample collected might have a viral load at or near the testing platform’s LOD.
For Abbott m2000, the manufacturer provided LOD is 100 virus copies/mL, although the instrument was able to detect virus concentrations below that level during the initial validation.20 The actual LOD of the instrument at our institution is < 100 virus copies/mL. For the Cepheid Xpert Xpress SARS-CoV-2 assay, the manufacturer-provided LOD is 250 virus copies/mL.19 An LOD study including samples below the manufacturer-provided LOD was not part of the initial validation study for the Xpert Xpress assay. Nonetheless, the virus concentration of samples with very high CT values at or near the maximum CT value of 45 is expected to be at or near the platform’s actual LOD.
If the samples collected near the end of the patient’s disease course have viral loads near these low concentrations, the encouraging positive-negative-positive pattern with high CT/CN values might be a promising sign for viral clearance. On the other hand, a positive-negative-positive pattern in the setting of low CT/CN values before and after the negative test might indicate poor sampling for the negative specimen. The back-and-forth or positive-negative-positive pattern generally appears to indicate near resolution of the infection course, although clinical correlation is necessary to rule out inadequate sampling earlier in the disease course or prolonged viral RNA shedding.9-14 In all of the surviving symptomatic patients who showed the positive-negative-positive pattern, this sign occurred around or after symptom resolution. It also is important to consider that in some patients, SARS-CoV-2 RNA might remain detectable with increasing CT/CN after symptom resolution, and samples from these patients might not result positive. Therefore, CT/CN values cannot be interpreted without considering the clinical picture.25
Studies on infectiousness and virus culture from COVID-19 samples with CT/ CN correlation have shown that patients with high CT/CN at the end of their disease course might not be as infectious.9-14,25 Because 1 patient had a presumptive positive result after the negative result, this study shows that this positive-negative-positive pattern could include presumptive positive results. Also, in the setting of a recent positive result on the same testing platform, a patient with this pattern is presumed to be positive for COVID-19 RNA because of scant viral material.
Taiwan’s public health response to the outbreak illustrates the ability to mitigate an outbreak throughout a society.26 These actions could help blunt an outbreak within a civilian nursing home population.5 Mitigation within a veteran CLC population has been documented, but the study, which focused on mitigation, did not consider CT/CN values, demographic distribution, testing access of the studied population, or laboratory findings related to disease pathophysiology.15 A key ingredient in widescale, serial testing is the availability of a rapid turnaround from testing in-house that allowed identification within 24 hours instead of several days at a reference laboratory. 15 Rapid widescale testing would allow clinical teams to optimize the Triangle of Benefit of Widescale Timely Tests for CLC (Figure 3).15 Timely laboratory testing remains pivotal for CLC veteran residents to aid successful clinical triage and management. Reporting serial CT/CN values can provide additional information to clinicians about the disease course because CT/ CN correlates with viral load, which varies based on where the patient is in the disease course.9-14 CT/CN values carry significant prognostic value, particularly with respect to intubation and mortality.8
Limitations
Important limitations to our study include the use of 2 separate RT-PCR platforms. Using different RT-PCR platforms is common in clinical laboratories trying to take advantage of the unique characteristics of different platforms—for example, turnaround time vs high throughput— to manage COVID-19 testing workflow.25 However, the exact CT/CN values obtained from each platform might not translate to the other, and the general trend (CT/CN values are rising or falling across serial tests) rather than a single value could be useful for clinical correlation. Even when the same platform is used for the serial testing, CT/CN values can be affected by adequacy of specimen collection; therefore, clinical correlation and considering the trend in CT/CN values is necessary for interpretation.10-14,25 Because of the known trend in viral dynamics, a positive specimen collected with a high CT/CN followed by a subsequent (within 2 days) positive specimen collected with a low CT/CN might be compatible with early detection of COVID- 19 infection in the appropriate clinical context. 10-14 However, detection late in the infection course or even after the symptomatic disease resolved with prolonged viral shedding might show serial positive samples with increasing CT/CN values.10-14
Patients with prolonged viral shedding might not be infectious.27 Because of the clinical correlation required for interpretation and the other factors that might affect CT/CN values, recommendations advise against using CT/CN values in clinical practice at this time, although these recommendations could change with future research.25 Serial CT/CN values have the potential, if appropriately correlated with the clinical picture, to provide useful information, such as whether the viral load of the sample is relatively high or low and increasing or decreasing.
Veterans, as a population, are more susceptible to poor health outcomes and morbidity compared with similar civilian counterparts.2,14-16 Veteran CLC patients likely would experience worse outcomes with COVID-19, including more infections, expiration, and morbidity compared with similar general population nursing homes. Similar to what had been reported for the civilian population, a trend (high CT/CN values early in the disease course with repeat testing needed to detect all positives followed by lower CT/CN value to correlate with increased viral load and then increased CT/CN value as the infection resolved) also was observed in this veteran population.
It has been extensively documented that minority groups experience decreased health care access and worse health outcomes. 28-30 Considering the critical medical supply shortages, including personal protective equipment, ventilators, and even testing supplies, there is the potential for a resource access disparity by ethnicity.28-31 Because the VA does not depend on measures of wealth and privilege such as health insurance, there was no disparity noted in access to testing by race or ethnicity at the VAMC CLC. When considering the health outcome of viral load from the measured CT/CN value, the viral loads of African American patients and those of other ethnicities was not significantly different in this study.
Conclusions
This is the first study to bring up critical points including serial CT/CN value correlation in RT-PCR tests, demographic distributions demonstrating easy and equal access in a veteran nursing home to COVID-19 testing, and clinical laboratory signs related to disease pathophysiology. Unlike other populations who have undergone serial CT/CN monitoring, nursing homes represent a particularly vulnerable population who require measures to prevent the spread and mitigate outbreaks of COVID-19.2,4,5 Test measurements obtained such as the CT/CN value during routine clinical care can provide useful information for public health, epidemiologic, or clinical purposes with appropriate correlation to clinical and other laboratory parameters. This study demonstrates early intervention of serial testing of an outbreak in a veterans nursing home with CT/CN value correlation.
1. Chen T, Wu D, Chen H, et al. Clinical characteristics of 113 deceased patients with coronavirus disease 2019: retrospective study. BMJ. 2020;368:m1091. doi:10.1136/bmj.m1091
2. Tsan L, Davis C, Langberg R, et al. Prevalence of nursing home-associated infections in the Department of Veterans Affairs nursing home care units. Am J Infect Control. 2008;36(3):173-179. doi:10.1016/j.ajic.2007.06.008
3. Zhou F, Yu T, Du R, et al. Clinical course and risk factors for mortality of adult inpatients with COVID-19 in Wuhan, China: a retrospective cohort study. Lancet. 2020;395(10229):1054-1062. doi:10.1016/S0140-6736(20)30566-3
4. Arentz M, Yim E, Klaff L, et al. Characteristics and outcomes of 21 critically ill patients with COVID-19 in Washington State. JAMA. 2020;323(16):1612-1614. doi:10.1001/jama.2020.4326
5. McMichael TM, Currie DW, Clark S, et al. Public Health–Seattle and King County, EvergreenHealth, and CDC COVID-19 Investigation Team. Epidemiology of Covid-19 in a long-term care facility in King County, Washington. N Engl J Med. 2020;382(21):2005-2011. doi:10.1056/NEJMoa2005412
6. Childs A, Zullo AR, Joyce NR, et al. The burden of respiratory infections among older adults in long-term care: a systematic review. BMC Geriatr. 2019;19(1):210. doi:10.1186/s12877-019-1236-6
7. Eriksen HM, Iversen BG, Aavitsland PJ. Prevalence of nosocomial infections and use of antibiotics in long-term care facilities in Norway, 2002 and 2003. Hosp Infect. 2004;57(4):316-320. doi:10.1016/j.jhin.2004.03.028
8. Magleby R, Westblade LF, Trzebucki A, et al. Impact Severe acute respiratory syndrome coronavirus 2 viral load on risk of intubation and mortality among hospitalized patients with coronavirus disease 2019. Clin Infect Dis. 2021;73(11):e4197-e4205. doi:10.1093/cid/ciaa851
9. Buchan B, Hoff J, Gmehlin C, et al. Distribution of SARSCoV- 2 PCR cycle threshold values provide practical insight into overall and target-specific sensitivity among symptomatic patients. Am Clin Pathol. 2020;154:479-485. doi:10.1093/ajcp/aqaa133
10. He X, Lau EHY, Wu P, et al. Temporal dynamics in viral shedding and transmissibility of COVID-19. Nat Med. 2020;26(5):672-675. doi:10.1038/s41591-020-0869-5
11. Zou L, Ruan F, Huang M, et al. SARS-CoV-2 Viral load in upper respiratory specimens of infected patients. N Engl J Med. 2020;382(12):1177-1179. doi:10.1056/NEJMc2001737
12. Singanayagam A, Patel M, Charlett A, et al. Duration of infectiousness and correlation with RT-PCR cycle threshold values in cases of COVID-19, England, January to May 2020. Euro Surveill. 2020;25(32):2001483. doi:10.2807/1560-7917.ES.2020.25.32.2001483
13. Salvatore P, Dawson P, Wadhwa A, et al. Epidemiological correlates of PCR cycles threshold values in the detection of SARS-CoV-2. Clin Infect Dis. 2021;72(11):e761-e767. doi:10.1093/cid/ciaa1469
14. Kissler S, Fauver J, Mack C, et al. Viral dynamics of SARS-CoV-2 infection and the predictive value of repeat testing. medRxiv. 2020;10.21.20217042. doi:10.1101/2020.10.21.20217042 1
5. Escobar DJ, Lanzi M, Saberi P, et al. Mitigation of a COVID-19 outbreak in a nursing home through serial testing of residents and staff. Clin Infect Dis. 2021;72(9):e394- e396. doi:10.1093/cid/ciaa1021
16. Eibner C, Krull H, Brown KM, et al. Current and projected characteristics and unique health care needs of the patient population served by the Department of Veterans Affairs. Rand Health Q. 2016;5(4):13.
17. Agha Z, Lofgren RP, VanRuiswyk JV, Layde PM. Are patients at Veterans Affairs medical centers sicker? A comparative analysis of health status and medical resource use. Arch Intern Med. 2000;160(21):3252-3257. doi:10.1001/archinte.160.21.3252
18. Morgan RO, Teal CR, Reddy SG, Ford ME, Ashton CM. Measurement in Veterans Affairs Health Services Research: veterans as a special population. Health Serv Res. 2005;40(5 Pt 2):1573-1583. doi:10.1111/j.1475-6773.2005.00448.x 1
9. Xpert Xpress SARS-CoV-2. Instructions for use. Cepheid. 302-2562, Rev. C April 2020. Accessed January 7, 2021. https://www.fda.gov/media/136314/download
20. Abbott RealTime SARS-CoV-2. Instructions for use Abbott. 09N77-95. July 2020. Accessed January 7, 2021. https:// www.fda.gov/media/136258/download
21. Petersen JM, Dalal S, Jhala D. Successful implementation of SARS-CoV-2 testing in midst of pandemic with emphasis on all phases of testing. J Clin Pathol. 2021;74:273- 278. doi:10.1136/jclinpath-2020-207175
22. United States Census Bureau. Quick Facts: Philadelphia County, Pennsylvania. Accessed April 16, 2020. https://www .census.gov/quickfacts/philadelphiacountypennsylvania
23. Centers for Disease Control and Prevention. United States COVID-19 cases, deaths, and laboratory testing (NAATS) by state, territory, and jurisdiction. Accessed April 26, 2020. https://www.cdc.gov/coronavirus/2019-ncov/cases -updates/cases-in-us.html 2
4. Petersen J, Jhala D. Ethnicity, comorbid medical conditions, and SARS-CoV-2 test cycle thresholds in the veteran population [published online ahead of print, 2021 Jul 28]. J Racial Ethn Health Disparities. 2021;1-8. doi:10.1007/s40615-021-01114-4
25. Infectious Diseases Society of America, Association for Molecular Pathology. IDSA and AMP joint statement on the use of SARS-CoV-2 PCR cycle threshold (Ct) values for clinical decision-making. Accessed August 28, 2021. https://www.idsociety.org/globalassets/idsa/public-health /covid-19/idsa-amp-statement.pdf
26. Wang J, Ng CY, Brook RH. Response to COVID-19 in Taiwan: big data analysis, new technology, and proactive testing. JAMA. 2020;323(14):1341-1342. doi:10.1001/jama.2020.3151
27. Centers for Disease Control and Prevention. Overview of testing for SARS-CoV-2, the virus that causes COVID- 19. Accessed July 28, 2021. https://www.cdc.gov /coronavirus/2019-ncov/hcp/testing-overview.html
28. Zuvekas SH, Taliaferro GS. Pathways to access: health insurance, the health care delivery system, and racial/ethnic disparities, 1996-1999. Health Aff. 2003;22(2):139-153. doi:10.1377/hlthaff.22.2.139
29. Egede LE. Race, ethnicity, culture, and disparities in health care. J Gen Intern Med. 2006;21(6):667-669. doi:10.1111/j.1525-1497.2006.0512.x
30. Institute of Medicine (US) Committee on Understanding and Eliminating Racial and Ethnic Disparities in Health Care. Smedley BD, Stith AY, Nelson AR, eds. Unequal treatment: confronting racial and ethnic disparities in health care. National Academies Press; 2003. doi:10.17226/12875
31. Ranney ML, Griffeth V, Jha AK. Critical supply shortages – the need for ventilators and personal protective equipment during the Covid-19 Pandemic. N Engl J Med. 2020;382(18):e41. doi:10.1056/NEJMp2006141
Health Systems Education Leadership: Learning From the VA Designated Education Officer Role
The US Department of Veterans Affairs (VA) operates the largest integrated health care system in the United States, providing physical and mental health care to more than 9 million veterans enrolled each year through a national system of inpatient, outpatient, and long-term care settings.1 As 1 of 4 statutory missions, the VA conducts the largest training effort for health professionals in cooperation with affiliated academic institutions. From 2016 through 2020, an average of 123,000 trainees from various professions received training at the VA.2 Physician residents comprised the largest trainee group (37%), followed by associated health students and residents (20%), and nursing professionals (21%).2 In VA, associated health professions include all health care disciplines other than allopathic and osteopathic medicine, dentistry, and nursing. The associated health professions encompass about 40 specialties, including audiology, dietetics, physical and occupational therapy, optometry, pharmacy, podiatry, psychology, and social work.
The VA also trains a smaller number of advanced fellows to address specialties important to the nation and veterans health that are not sufficiently addressed by standard accredited professional training.3 The VA Advanced Fellowship programs include 22 postresidency, postdoctoral, and postmasters fellowships to physicians and dentists, and associated health professions, including psychologists, social workers, and pharmacists. 3 From 2015 to 2019, 57 to 61% of medical school students reported having a VA clinical training experience during medical school.4 Of current VA employees, 20% of registered nurses, 64% of physicians, 73% of podiatrists and optometrists, and 81% of psychologists reported VA training prior to employment.5
Health professions education is led by the designated education officer (DEO) at each VA facility.6 Also known as the associate chief of staff for education (ACOS/E), the DEO is a leadership position that is accountable to local VA facility executive leadership as well as the national Office of Academic Affiliations (OAA), which directs all VA health professions training across the US.6 At most VA facilities, the DEO oversees clinical training and education reporting directly to the facility chief of staff. At the same time, the ACOS/E is accountable to the OAA to ensure adherence with national education directives and policy. The DEO oversees trainee programs through collaboration with training program directors, faculty, academic affiliates, and accreditation agencies across > 40 health professions.
The DEO is expected to possess expertise in leadership attributes identified by the US Office of Personnel Management as essential to build a federal corporate culture that drives results, serves customers, and builds successful teams and coalitions within and outside the VA.7 These leadership attributes include leading change, leading people, driving results, business acumen, and building coalitions.7 They are operationalized by OAA as 4 domains of expertise required to lead education across multiple professions, including: (1) creating and sustaining an organizational work environment that supports learning, discovery, and continuous improvement; (2) aligning and managing fiscal, human, and capital resources to meet organizational learning needs; (3) driving learning and performance results to impact organizational success; and (4) leading change and transformation through positioning and implementing innovative learning and education strategies (Table 1).6
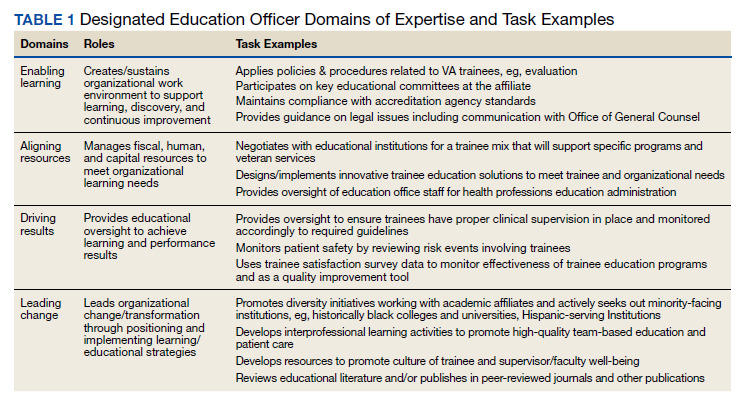
In this article we describe the VA DEO leadership role and the tasks required to lead education across multiple professions within the VA health care system. Given the broad scope of leading educational programs across multiple clinical professions and the interprofessional backgrounds of DEOs across the VA, we evaluated DEO self-perceived effectiveness to impact educational decisions and behavior by professional discipline. Our evaluation question is: Are different professional education and practice backgrounds functionally capable of providing leadership over all education of health professions training programs? Finally, we describe DEOs perceptions of facilitators and barriers to performing their DEO role within the VA.
Methods
We conducted a mixed methods analysis of data collected by OAA to assess DEO needs within a multiprofessional clinical learning environment. The needs assessment was conducted by an OAA evaluator (NH) with input on instrument development and data analysis from OAA leadership (KS, MB). This evaluation is categorized as an operations activity based on VA Handbook 1200 where information generated is used for business operations and quality improvement. 8 The overall project was subject to administrative rather than institutional review board oversight.
A needs assessment tool was developed based on the OAA domains of expertise.6 Prior to its administration, the tool was piloted with 8 DEOs in the field and the survey shortened based on their feedback. DEOs were asked about individual professional characteristics (eg, clinical profession, academic appointment, type of health professions training programs at the VA site) and their self-perceived effectiveness in impacting educational decisions and behaviors on general and profession-specific tasks within each of the 4 domains of expertise on a 5-point Likert scale (1, not effective; 5, very effective). 6,9 The needs assessment also included an open-ended question asking respondents to comment on any issues they felt important to understanding DEO role effectiveness.
The needs assessment was administered online via SurveyMonkey to 132 DEOs via email in September and October 2019. The DEOs represented 148 of 160 VA facilities with health professions education; 14 DEOs covered > 1 VA facility, and 12 positions were vacant. Email reminders were sent to nonresponders after 1 week. At 2 weeks, nonresponders received telephone reminders and personalized follow-up emails from OAA staff. The response rate at the end of 3 weeks was 96%.
Data Analysis
Mixed methods analyses included quantitative analyses to identify differences in general and profession-specific self-ratings of effectiveness in influencing educational decisions and behaviors by DEO profession, and qualitative analyses to further understand DEO’s perceptions of facilitators and barriers to DEO task effectiveness.10,11 Quantitative analyses included descriptive statistics for all variables followed by nonparametric tests including χ2 and Mann- Whitney U tests to assess differences between physician and other professional DEOs in descriptive characteristics and selfperceived effectiveness on general and profession- specific tasks. Quantitative analyses were conducted using SPSS software, version 26. Qualitative analyses consisted of rapid assessment procedures to identify facilitators and barriers to DEO effectiveness by profession using Atlas.ti version 8, which involved reviewing responses to the open-ended question and assigning each response to predetermined categories based on the organizational level it applied to (eg, individual DEO, VA facility, or external to the organization).12,13 Responses within categories were then summarized to identify the main themes.
Results
Completed surveys were received from 127 respondents representing 139 VA facilities. Eighty percent were physicians and 20% were other professionals, including psychologists, pharmacists, dentists, dieticians, nurses, and nonclinicians. There were no statistically significant differences between physician and other professional DEOs in the percent working full time or length of time spent working in the position. About one-third of the sample had been in the position for < 2 years, one-third had been in the position for 2 to < 5 years, and one-third had been in the role for ≥ 5 years. Eighty percent reported having a faculty appointment with an academic affiliate. While 92% of physician DEOs had a faculty appointment, only 40% of other professional DEOs did (P < .001). Most faculty appointments for both groups were with a school of medicine. More physician DEOs than other professionals had training programs at their site for physicians (P = .003) and dentists (P < .001), but there were no statistically significant differences for having associated health, nursing, or advanced fellowship training programs at their sites. Across all DEOs, 98% reported training programs at their site for associated health professions, 95% for physician training, 93% for nursing training, 59% for dental training, and 48% for advanced fellowships.
Self-Perceived Effectiveness
There were no statistically significant differences between physician and other professional DEOs on self-perceived effectiveness in impacting educational decisions or behaviors for general tasks applicable across professions (Table 2). This result held even after controlling for length of time in the position and whether the DEO had an academic appointment. Generally, both groups reported being effective on tasks in the enabling learning domain, including applying policies and procedures related to trainees who rotate through the VA and maintaining adherence with accreditation agency standards across health professions. Mean score ranges for both physician and other professional DEOs reported moderate effectiveness in aligning resources effectiveness questions (2.45-3.72 vs 2.75-3.76), driving results questions (3.02-3.60 vs 3.39-3.48), and leading change questions (3.12-3.50 vs 3.42-3.80).
For profession-specific tasks, effectiveness ratings between the 2 groups were generally not statistically significant for medical, dental, and advanced fellowship training programs (Table 3). There was a pattern of statistically significant differences between physician and other professional DEOs for associated health and nursing training programs on tasks across the 4 domains of expertise with physicians having lower mean ratings compared with other professionals. Generally, physician DEOs had higher task effectiveness when compared with other professionals for medical training programs, and other professionals had higher task effectiveness ratings than did physicians for associated health or nursing training programs.
Facilitators and Barriers
Seventy responses related to facilitators and barriers to DEO effectiveness were received (59 from physicians and 11 from other professionals). Most responses were categorized as individual level facilitators or barriers (53% for physician and 64% for other professionals). Only 3% of comments were categorized as external to the organization (all made by physicians). The themes were similar for both groups and were aggregated in Table 4. Facilitators included continuing education, having a mentor who works at a similar type of facility, maintaining balance and time management when working with different training programs, learning to work and develop relationships with training program directors, developing an overall picture of each type of health professions training program, holding regular meetings with all health training programs and academic affiliates, having a formal education service line with budget and staffing, facility executive leadership who are knowledgeable of the education mission and DEO role, having a national oversight body, and the DEO’s relationships with academic affiliates.
Barriers to role effectiveness at the individual DEO level included assignment of multiple roles and a focus on regulation and monitoring with little time for development of new programs and strategic planning. The organizational level barriers included difficulty getting core services to engage with health professions trainees and siloed education leadership.
Discussion
DEOs oversee multiple health professions training programs within local facilities. The DEO is accountable to local VA facility leadership and a national education office to lead local health professions education at local facilities and integrate these educational activities across the national VA system.
The VA DEO role is similar to the Accreditation Council for Graduate Medical Education designated institutional official (DIO) except that the VA DEO provides oversight of > 40 health professions training programs.14,15 The VA DEO, therefore, has broader oversight than the DIO role that focuses only on graduate physician education. Similar to the DIO, the VA DEO role initially emphasized the enabling learning and aligning resources domains to provide oversight and administration of health professions training programs. Over time, both roles have expanded to include defining and ensuring healthy clinical learning environments, aligning educational resources and training with the institutional mission, workforce, and societal needs, and creating continuous educational improvement models.6,16,17 To accomplish these expanded goals, both the DEO and the DIO work closely with other educational leaders at the academic affiliate and the VA facility. As health professions education advances, there will be increased emphasis placed on delivering educational programs to improve clinical practice and health care outcomes.18
Our findings that DEO profession did not influence self-ratings of effectiveness to influence educational decisions or behaviors on general tasks applicable across health professions suggest that education and practice background are not factors influencing selfratings. Nor were self-ratings influenced by other factors. Since the DEO is a senior leadership position, candidates for the position already may possess managerial and leadership skills. In our sample, several individuals commented that they had prior education leadership positions, eg, training program director or had years of experience working in the VA. Similarly, having an academic appointment may not be important for the performance of general administrative tasks. However, an academic appointment may be important for effective performance of educational tasks, such as clinical teaching, didactic training, and curriculum development, which were not measured in this study.
The finding of differences in self-ratings between physicians and other professionals on profession-specific tasks for associated health and nursing suggests that physicians may require additional curriculum to enhance their knowledge in managing other professional educational programs. For nursing specifically, this finding could also reflect substantial input from the lead nurse executive in the facility. DEOs also identified practical ways to facilitate their work with multiple health professions that could immediately be put into practice, including developing relationships and enhancing communication with training program directors, faculty, and academic affiliates of each profession.
Taken together, the quantitative and qualitative findings indicate that despite differences in professional backgrounds, DEOs have high self-ratings of their own effectiveness to influence educational decisions and behaviors on general tasks they are expected to accomplish. There are some professionspecific tasks where professional background does influence self-perceived effectiveness, ie, physicians have higher self-ratings on physician-specific tasks and other professionals have higher self-ratings on associated health or nursing tasks. These perceived differences may be mitigated by increasing facilitators and decreasing barriers identified for the individual DEO, within the organization, and external to the organization.
Limitations Our findings should be interpreted with the following limitations in mind. The selfreport nature of the data opens the possibility of self-report bias or Dunning-Kruger effects where effectiveness ratings could have been overestimated by respondents.21 Although respondents were assured of their anonymity and that results would only be reported in the aggregate, there is potential for providing more positive responses on a needs assessment administered by the national education program office. We recommend further work be conducted to validate the needs assessment tool against other data collection methods, such as actual outcomes of educational effectiveness. Our study did not incorporate measures of educational effectiveness to determine whether self-perceived DEO effectiveness is translated to better trainee or learning outcomes. Before this can happen, educational policymakers must identify the most important facility-level learning outcomes. Since the DEO is a facility level educational administrator, learning efeffectiveness must be defined at the facility level. The qualitative findings could also be expanded through the application of more detailed qualitative methods, such as indepth interviews. The tasks rated by DEOs were based on OAA’s current definition of the DEO role.6 As the field advances, DEO tasks will also evolve.22-24
Conclusions
The DEO is a senior educational leadership role that oversees all health professions training in the VA. Our findings are supportive of individuals from various health disciplines serving in the VA DEO role with responsibilities that span multiple health profession training programs. We recommend further work to validate the instrument used in this study, as well as the application of qualitative methods like indepth interviews to further our understanding of the DEO role.
1. US Department of Veterans Affairs, Veterans Health Administration. Updated April 18, 2022. Accessed May 6, 2022. https://www.va.gov/health/aboutvha.asp
2. US Department of Veterans Affairs, Veterans Health Administration, Office of Academic Affiliations. Health professions education: academic Year 2019-2020. Published 2020. Accessed May 6, 2022. https://www.va.gov/OAA/docs /OAA_Statistics_2020.pdf
3. US Department of Veterans Affairs, Veterans Health Administration, Office of Academic Affiliations. Advanced Fellowships and Professional Development. Updated November 26, 2021. Accessed May 6, 2022. https://www.va.gov/oaa /advancedfellowships/advanced-fellowships.asp
4. Association of American Medical Colleges. Medical school graduation questionnaire, 2019 all schools summary report. Published July 2019. Accessed May 6, 2022. https://www.aamc.org/system/files/2019-08/2019-gq-all-schools -summary-report.pdf
5. US Department of Veterans Affairs, National Center for Organization Development. VA all employee survey. Published 2019. Accessed May 6, 2022. https://www.va.gov /NCOD/VAworkforcesurveys.asp
6. US Department of Veterans Affairs, Veterans Health Administration, Office of Academic Affiliations. Education leaders in the VA: the role of the designated education officer (DEO). Published December 2019. Accessed May 6, 2022. https://www.va.gov/OAA/docs/DEO_Learning _Leader_2019.pdf
7. US Office of Personnel Management. Policy, data oversight: guide to senior executive service qualifications. Published 2010. Accessed May 6, 2022. https://www.opm .gov/policy-data-oversight/senior-executive-service /executive-core-qualifications/
8. US Department of Veterans Affairs, Office of Research and Development. Program guide: 1200.21 VHA operations activities that may constitute research. Published January 9, 2019. Accessed May 6, 2022. https://www.research .va.gov/resources/policies/ProgramGuide-1200-21-VHA -Operations-Activities.pdf
9. Riesenberg LA, Rosenbaum PF, Stick SL. Competencies, essential training, and resources viewed by designated institutional officials as important to the position in graduate medical education [published correction appears in Acad Med. 2006 Dec;81(12):1025]. Acad Med. 2006;81(5):426- 431. doi:10.1097/01.ACM.0000222279.28824.f5
10. Palinkas LA, Mendon SJ, Hamilton AB. Inn o v a t i o n s i n M i x e d M e t h o d s E v a l u a - tions. Annu Rev Public Health. 2019;40:423-442. doi:10.1146/annurev-publhealth-040218-044215
11. Tashakkori A, Creswell JW. Exploring the nature of research questions in mixed methods research. J Mix Methods Res. 2007;1(3):207-211. doi:10.1177/1558689807302814
12. Averill JB. Matrix analysis as a complementary analytic strategy in qualitative inquiry. Qual Health Res. 2002;12(6):855-866. doi:10.1177/104973230201200611
13. Hamilton AB, Finley EP. Qualitative methods in implementation research: An introduction. Psychiatry Res. 2019;280:112516.
14. Bellini L, Hartmann D, Opas L. Beyond must: supporting the evolving role of the designated institutional official. J Grad Med Educ. 2010;2(2):147-150. doi:10.4300/JGME-D-10-00073.1
15. Riesenberg LA, Rosenbaum P, Stick SL. Characteristics, roles, and responsibilities of the Designated Institutional Official (DIO) position in graduate medical education education [published correction appears in Acad Med. 2006 Dec;81(12):1025] [published correction appears in Acad Med. 2006 Mar;81(3):274]. Acad Med. 2006;81(1):8-19. doi:10.1097/00001888-200601000-00005
16. Group on Resident Affairs Core Competency Task Force. Institutional GME leadership competencies. 2015. Accessed May 6, 2022. https://www.aamc.org/system /files/c/2/441248-institutionalgmeleadershipcompetencies .pdf
17. Weiss KB, Bagian JP, Nasca TJ. The clinical learning environment: the foundation of graduate medical education. JAMA. 2013;309(16):1687-1688. doi:10.1001/jama.2013.1931
18. Beliveau ME, Warnes CA, Harrington RA, et al. Organizational change, leadership, and the transformation of continuing professional development: lessons learned from the American College of Cardiology. J Contin Educ Health Prof. 2015;35(3):201-210. doi:10.1002/chp.21301
19. World Health Organization. Framework for Action on Interprofessional Education and Collaborative Practice. Published September 1, 2020. Accessed May 10, 2022. https://www.who.int/publications/i/item/framework -for-action-on-interprofessional-education-collaborative -practice
20. Weiss K, Passiment M, Riordan L, Wagner R for the National Collaborative for Improving the Clinical Learning Environment IP-CLE Report Work Group. Achieving the optimal interprofessional clinical learning environment: proceedings from an NCICLE symposium. Published January 18, 2019. Accessed May 6, 2022. doi:10.33385/NCICLE.0002
21. Althubaiti A. Information bias in health research: definition, pitfalls, and adjustment methods. J Multidiscip Healthc. 2016;9:211-217. Published 2016 May 4. doi:10.2147/JMDH.S104807
22. Gilman SC, Chokshi DA, Bowen JL, Rugen KW, Cox M. Connecting the dots: interprofessional health education and delivery system redesign at the Veterans Health Administration. Acad Med. 2014;89(8):1113-1116. doi:10.1097/ACM.0000000000000312
23. Health Professions Accreditors Collaborative. Guidance on developing quality interprofessional education for the health professions. Published February 1, 2019. Accessed May 6, 2022. https://healthprofessionsaccreditors.org/wp -content/uploads/2019/02/HPACGuidance02-01-19.pdf
24. Watts BV, Paull DE, Williams LC, Neily J, Hemphill RR, Brannen JL. Department of Veterans Affairs Chief Resident in Quality and Patient Safety Program: a model to spread change. Am J Med Qual. 2016;31(6):598-600. doi:10.1177/1062860616643403
The US Department of Veterans Affairs (VA) operates the largest integrated health care system in the United States, providing physical and mental health care to more than 9 million veterans enrolled each year through a national system of inpatient, outpatient, and long-term care settings.1 As 1 of 4 statutory missions, the VA conducts the largest training effort for health professionals in cooperation with affiliated academic institutions. From 2016 through 2020, an average of 123,000 trainees from various professions received training at the VA.2 Physician residents comprised the largest trainee group (37%), followed by associated health students and residents (20%), and nursing professionals (21%).2 In VA, associated health professions include all health care disciplines other than allopathic and osteopathic medicine, dentistry, and nursing. The associated health professions encompass about 40 specialties, including audiology, dietetics, physical and occupational therapy, optometry, pharmacy, podiatry, psychology, and social work.
The VA also trains a smaller number of advanced fellows to address specialties important to the nation and veterans health that are not sufficiently addressed by standard accredited professional training.3 The VA Advanced Fellowship programs include 22 postresidency, postdoctoral, and postmasters fellowships to physicians and dentists, and associated health professions, including psychologists, social workers, and pharmacists. 3 From 2015 to 2019, 57 to 61% of medical school students reported having a VA clinical training experience during medical school.4 Of current VA employees, 20% of registered nurses, 64% of physicians, 73% of podiatrists and optometrists, and 81% of psychologists reported VA training prior to employment.5
Health professions education is led by the designated education officer (DEO) at each VA facility.6 Also known as the associate chief of staff for education (ACOS/E), the DEO is a leadership position that is accountable to local VA facility executive leadership as well as the national Office of Academic Affiliations (OAA), which directs all VA health professions training across the US.6 At most VA facilities, the DEO oversees clinical training and education reporting directly to the facility chief of staff. At the same time, the ACOS/E is accountable to the OAA to ensure adherence with national education directives and policy. The DEO oversees trainee programs through collaboration with training program directors, faculty, academic affiliates, and accreditation agencies across > 40 health professions.
The DEO is expected to possess expertise in leadership attributes identified by the US Office of Personnel Management as essential to build a federal corporate culture that drives results, serves customers, and builds successful teams and coalitions within and outside the VA.7 These leadership attributes include leading change, leading people, driving results, business acumen, and building coalitions.7 They are operationalized by OAA as 4 domains of expertise required to lead education across multiple professions, including: (1) creating and sustaining an organizational work environment that supports learning, discovery, and continuous improvement; (2) aligning and managing fiscal, human, and capital resources to meet organizational learning needs; (3) driving learning and performance results to impact organizational success; and (4) leading change and transformation through positioning and implementing innovative learning and education strategies (Table 1).6
In this article we describe the VA DEO leadership role and the tasks required to lead education across multiple professions within the VA health care system. Given the broad scope of leading educational programs across multiple clinical professions and the interprofessional backgrounds of DEOs across the VA, we evaluated DEO self-perceived effectiveness to impact educational decisions and behavior by professional discipline. Our evaluation question is: Are different professional education and practice backgrounds functionally capable of providing leadership over all education of health professions training programs? Finally, we describe DEOs perceptions of facilitators and barriers to performing their DEO role within the VA.
Methods
We conducted a mixed methods analysis of data collected by OAA to assess DEO needs within a multiprofessional clinical learning environment. The needs assessment was conducted by an OAA evaluator (NH) with input on instrument development and data analysis from OAA leadership (KS, MB). This evaluation is categorized as an operations activity based on VA Handbook 1200 where information generated is used for business operations and quality improvement. 8 The overall project was subject to administrative rather than institutional review board oversight.
A needs assessment tool was developed based on the OAA domains of expertise.6 Prior to its administration, the tool was piloted with 8 DEOs in the field and the survey shortened based on their feedback. DEOs were asked about individual professional characteristics (eg, clinical profession, academic appointment, type of health professions training programs at the VA site) and their self-perceived effectiveness in impacting educational decisions and behaviors on general and profession-specific tasks within each of the 4 domains of expertise on a 5-point Likert scale (1, not effective; 5, very effective). 6,9 The needs assessment also included an open-ended question asking respondents to comment on any issues they felt important to understanding DEO role effectiveness.
The needs assessment was administered online via SurveyMonkey to 132 DEOs via email in September and October 2019. The DEOs represented 148 of 160 VA facilities with health professions education; 14 DEOs covered > 1 VA facility, and 12 positions were vacant. Email reminders were sent to nonresponders after 1 week. At 2 weeks, nonresponders received telephone reminders and personalized follow-up emails from OAA staff. The response rate at the end of 3 weeks was 96%.
Data Analysis
Mixed methods analyses included quantitative analyses to identify differences in general and profession-specific self-ratings of effectiveness in influencing educational decisions and behaviors by DEO profession, and qualitative analyses to further understand DEO’s perceptions of facilitators and barriers to DEO task effectiveness.10,11 Quantitative analyses included descriptive statistics for all variables followed by nonparametric tests including χ2 and Mann- Whitney U tests to assess differences between physician and other professional DEOs in descriptive characteristics and selfperceived effectiveness on general and profession- specific tasks. Quantitative analyses were conducted using SPSS software, version 26. Qualitative analyses consisted of rapid assessment procedures to identify facilitators and barriers to DEO effectiveness by profession using Atlas.ti version 8, which involved reviewing responses to the open-ended question and assigning each response to predetermined categories based on the organizational level it applied to (eg, individual DEO, VA facility, or external to the organization).12,13 Responses within categories were then summarized to identify the main themes.
Results
Completed surveys were received from 127 respondents representing 139 VA facilities. Eighty percent were physicians and 20% were other professionals, including psychologists, pharmacists, dentists, dieticians, nurses, and nonclinicians. There were no statistically significant differences between physician and other professional DEOs in the percent working full time or length of time spent working in the position. About one-third of the sample had been in the position for < 2 years, one-third had been in the position for 2 to < 5 years, and one-third had been in the role for ≥ 5 years. Eighty percent reported having a faculty appointment with an academic affiliate. While 92% of physician DEOs had a faculty appointment, only 40% of other professional DEOs did (P < .001). Most faculty appointments for both groups were with a school of medicine. More physician DEOs than other professionals had training programs at their site for physicians (P = .003) and dentists (P < .001), but there were no statistically significant differences for having associated health, nursing, or advanced fellowship training programs at their sites. Across all DEOs, 98% reported training programs at their site for associated health professions, 95% for physician training, 93% for nursing training, 59% for dental training, and 48% for advanced fellowships.
Self-Perceived Effectiveness
There were no statistically significant differences between physician and other professional DEOs on self-perceived effectiveness in impacting educational decisions or behaviors for general tasks applicable across professions (Table 2). This result held even after controlling for length of time in the position and whether the DEO had an academic appointment. Generally, both groups reported being effective on tasks in the enabling learning domain, including applying policies and procedures related to trainees who rotate through the VA and maintaining adherence with accreditation agency standards across health professions. Mean score ranges for both physician and other professional DEOs reported moderate effectiveness in aligning resources effectiveness questions (2.45-3.72 vs 2.75-3.76), driving results questions (3.02-3.60 vs 3.39-3.48), and leading change questions (3.12-3.50 vs 3.42-3.80).
For profession-specific tasks, effectiveness ratings between the 2 groups were generally not statistically significant for medical, dental, and advanced fellowship training programs (Table 3). There was a pattern of statistically significant differences between physician and other professional DEOs for associated health and nursing training programs on tasks across the 4 domains of expertise with physicians having lower mean ratings compared with other professionals. Generally, physician DEOs had higher task effectiveness when compared with other professionals for medical training programs, and other professionals had higher task effectiveness ratings than did physicians for associated health or nursing training programs.
Facilitators and Barriers
Seventy responses related to facilitators and barriers to DEO effectiveness were received (59 from physicians and 11 from other professionals). Most responses were categorized as individual level facilitators or barriers (53% for physician and 64% for other professionals). Only 3% of comments were categorized as external to the organization (all made by physicians). The themes were similar for both groups and were aggregated in Table 4. Facilitators included continuing education, having a mentor who works at a similar type of facility, maintaining balance and time management when working with different training programs, learning to work and develop relationships with training program directors, developing an overall picture of each type of health professions training program, holding regular meetings with all health training programs and academic affiliates, having a formal education service line with budget and staffing, facility executive leadership who are knowledgeable of the education mission and DEO role, having a national oversight body, and the DEO’s relationships with academic affiliates.
Barriers to role effectiveness at the individual DEO level included assignment of multiple roles and a focus on regulation and monitoring with little time for development of new programs and strategic planning. The organizational level barriers included difficulty getting core services to engage with health professions trainees and siloed education leadership.
Discussion
DEOs oversee multiple health professions training programs within local facilities. The DEO is accountable to local VA facility leadership and a national education office to lead local health professions education at local facilities and integrate these educational activities across the national VA system.
The VA DEO role is similar to the Accreditation Council for Graduate Medical Education designated institutional official (DIO) except that the VA DEO provides oversight of > 40 health professions training programs.14,15 The VA DEO, therefore, has broader oversight than the DIO role that focuses only on graduate physician education. Similar to the DIO, the VA DEO role initially emphasized the enabling learning and aligning resources domains to provide oversight and administration of health professions training programs. Over time, both roles have expanded to include defining and ensuring healthy clinical learning environments, aligning educational resources and training with the institutional mission, workforce, and societal needs, and creating continuous educational improvement models.6,16,17 To accomplish these expanded goals, both the DEO and the DIO work closely with other educational leaders at the academic affiliate and the VA facility. As health professions education advances, there will be increased emphasis placed on delivering educational programs to improve clinical practice and health care outcomes.18
Our findings that DEO profession did not influence self-ratings of effectiveness to influence educational decisions or behaviors on general tasks applicable across health professions suggest that education and practice background are not factors influencing selfratings. Nor were self-ratings influenced by other factors. Since the DEO is a senior leadership position, candidates for the position already may possess managerial and leadership skills. In our sample, several individuals commented that they had prior education leadership positions, eg, training program director or had years of experience working in the VA. Similarly, having an academic appointment may not be important for the performance of general administrative tasks. However, an academic appointment may be important for effective performance of educational tasks, such as clinical teaching, didactic training, and curriculum development, which were not measured in this study.
The finding of differences in self-ratings between physicians and other professionals on profession-specific tasks for associated health and nursing suggests that physicians may require additional curriculum to enhance their knowledge in managing other professional educational programs. For nursing specifically, this finding could also reflect substantial input from the lead nurse executive in the facility. DEOs also identified practical ways to facilitate their work with multiple health professions that could immediately be put into practice, including developing relationships and enhancing communication with training program directors, faculty, and academic affiliates of each profession.
Taken together, the quantitative and qualitative findings indicate that despite differences in professional backgrounds, DEOs have high self-ratings of their own effectiveness to influence educational decisions and behaviors on general tasks they are expected to accomplish. There are some professionspecific tasks where professional background does influence self-perceived effectiveness, ie, physicians have higher self-ratings on physician-specific tasks and other professionals have higher self-ratings on associated health or nursing tasks. These perceived differences may be mitigated by increasing facilitators and decreasing barriers identified for the individual DEO, within the organization, and external to the organization.
Limitations Our findings should be interpreted with the following limitations in mind. The selfreport nature of the data opens the possibility of self-report bias or Dunning-Kruger effects where effectiveness ratings could have been overestimated by respondents.21 Although respondents were assured of their anonymity and that results would only be reported in the aggregate, there is potential for providing more positive responses on a needs assessment administered by the national education program office. We recommend further work be conducted to validate the needs assessment tool against other data collection methods, such as actual outcomes of educational effectiveness. Our study did not incorporate measures of educational effectiveness to determine whether self-perceived DEO effectiveness is translated to better trainee or learning outcomes. Before this can happen, educational policymakers must identify the most important facility-level learning outcomes. Since the DEO is a facility level educational administrator, learning efeffectiveness must be defined at the facility level. The qualitative findings could also be expanded through the application of more detailed qualitative methods, such as indepth interviews. The tasks rated by DEOs were based on OAA’s current definition of the DEO role.6 As the field advances, DEO tasks will also evolve.22-24
Conclusions
The DEO is a senior educational leadership role that oversees all health professions training in the VA. Our findings are supportive of individuals from various health disciplines serving in the VA DEO role with responsibilities that span multiple health profession training programs. We recommend further work to validate the instrument used in this study, as well as the application of qualitative methods like indepth interviews to further our understanding of the DEO role.
1. US Department of Veterans Affairs, Veterans Health Administration. Updated April 18, 2022. Accessed May 6, 2022. https://www.va.gov/health/aboutvha.asp
2. US Department of Veterans Affairs, Veterans Health Administration, Office of Academic Affiliations. Health professions education: academic Year 2019-2020. Published 2020. Accessed May 6, 2022. https://www.va.gov/OAA/docs /OAA_Statistics_2020.pdf
3. US Department of Veterans Affairs, Veterans Health Administration, Office of Academic Affiliations. Advanced Fellowships and Professional Development. Updated November 26, 2021. Accessed May 6, 2022. https://www.va.gov/oaa /advancedfellowships/advanced-fellowships.asp
4. Association of American Medical Colleges. Medical school graduation questionnaire, 2019 all schools summary report. Published July 2019. Accessed May 6, 2022. https://www.aamc.org/system/files/2019-08/2019-gq-all-schools -summary-report.pdf
5. US Department of Veterans Affairs, National Center for Organization Development. VA all employee survey. Published 2019. Accessed May 6, 2022. https://www.va.gov /NCOD/VAworkforcesurveys.asp
6. US Department of Veterans Affairs, Veterans Health Administration, Office of Academic Affiliations. Education leaders in the VA: the role of the designated education officer (DEO). Published December 2019. Accessed May 6, 2022. https://www.va.gov/OAA/docs/DEO_Learning _Leader_2019.pdf
7. US Office of Personnel Management. Policy, data oversight: guide to senior executive service qualifications. Published 2010. Accessed May 6, 2022. https://www.opm .gov/policy-data-oversight/senior-executive-service /executive-core-qualifications/
8. US Department of Veterans Affairs, Office of Research and Development. Program guide: 1200.21 VHA operations activities that may constitute research. Published January 9, 2019. Accessed May 6, 2022. https://www.research .va.gov/resources/policies/ProgramGuide-1200-21-VHA -Operations-Activities.pdf
9. Riesenberg LA, Rosenbaum PF, Stick SL. Competencies, essential training, and resources viewed by designated institutional officials as important to the position in graduate medical education [published correction appears in Acad Med. 2006 Dec;81(12):1025]. Acad Med. 2006;81(5):426- 431. doi:10.1097/01.ACM.0000222279.28824.f5
10. Palinkas LA, Mendon SJ, Hamilton AB. Inn o v a t i o n s i n M i x e d M e t h o d s E v a l u a - tions. Annu Rev Public Health. 2019;40:423-442. doi:10.1146/annurev-publhealth-040218-044215
11. Tashakkori A, Creswell JW. Exploring the nature of research questions in mixed methods research. J Mix Methods Res. 2007;1(3):207-211. doi:10.1177/1558689807302814
12. Averill JB. Matrix analysis as a complementary analytic strategy in qualitative inquiry. Qual Health Res. 2002;12(6):855-866. doi:10.1177/104973230201200611
13. Hamilton AB, Finley EP. Qualitative methods in implementation research: An introduction. Psychiatry Res. 2019;280:112516.
14. Bellini L, Hartmann D, Opas L. Beyond must: supporting the evolving role of the designated institutional official. J Grad Med Educ. 2010;2(2):147-150. doi:10.4300/JGME-D-10-00073.1
15. Riesenberg LA, Rosenbaum P, Stick SL. Characteristics, roles, and responsibilities of the Designated Institutional Official (DIO) position in graduate medical education education [published correction appears in Acad Med. 2006 Dec;81(12):1025] [published correction appears in Acad Med. 2006 Mar;81(3):274]. Acad Med. 2006;81(1):8-19. doi:10.1097/00001888-200601000-00005
16. Group on Resident Affairs Core Competency Task Force. Institutional GME leadership competencies. 2015. Accessed May 6, 2022. https://www.aamc.org/system /files/c/2/441248-institutionalgmeleadershipcompetencies .pdf
17. Weiss KB, Bagian JP, Nasca TJ. The clinical learning environment: the foundation of graduate medical education. JAMA. 2013;309(16):1687-1688. doi:10.1001/jama.2013.1931
18. Beliveau ME, Warnes CA, Harrington RA, et al. Organizational change, leadership, and the transformation of continuing professional development: lessons learned from the American College of Cardiology. J Contin Educ Health Prof. 2015;35(3):201-210. doi:10.1002/chp.21301
19. World Health Organization. Framework for Action on Interprofessional Education and Collaborative Practice. Published September 1, 2020. Accessed May 10, 2022. https://www.who.int/publications/i/item/framework -for-action-on-interprofessional-education-collaborative -practice
20. Weiss K, Passiment M, Riordan L, Wagner R for the National Collaborative for Improving the Clinical Learning Environment IP-CLE Report Work Group. Achieving the optimal interprofessional clinical learning environment: proceedings from an NCICLE symposium. Published January 18, 2019. Accessed May 6, 2022. doi:10.33385/NCICLE.0002
21. Althubaiti A. Information bias in health research: definition, pitfalls, and adjustment methods. J Multidiscip Healthc. 2016;9:211-217. Published 2016 May 4. doi:10.2147/JMDH.S104807
22. Gilman SC, Chokshi DA, Bowen JL, Rugen KW, Cox M. Connecting the dots: interprofessional health education and delivery system redesign at the Veterans Health Administration. Acad Med. 2014;89(8):1113-1116. doi:10.1097/ACM.0000000000000312
23. Health Professions Accreditors Collaborative. Guidance on developing quality interprofessional education for the health professions. Published February 1, 2019. Accessed May 6, 2022. https://healthprofessionsaccreditors.org/wp -content/uploads/2019/02/HPACGuidance02-01-19.pdf
24. Watts BV, Paull DE, Williams LC, Neily J, Hemphill RR, Brannen JL. Department of Veterans Affairs Chief Resident in Quality and Patient Safety Program: a model to spread change. Am J Med Qual. 2016;31(6):598-600. doi:10.1177/1062860616643403
Predictors of County-Level Home Modification Use Across the US
This article is part of a series of articles on the Home Improvements and Structural Alterations program (HISA), a home modification (HM) program within the Veterans Health Administration (VHA). HISA is a benefit awarded to veterans with disabilities (VWDs) and is instrumental in affording physical accessibility and structural alterations to veterans’ homes.1 The overarching goals of this project are to describe and understand HISA use by VWDs. Previous work has shown geographical variation in the number of HISA prescriptions across counties in the US (Figure 1).1 The current work seeks to describe and predict the county-level rates of HISA use. Information about what predicts HISA utilization at the county level is important because it enhances understanding of program utilization at a national level. The long-term goal of the series is to provide knowledge about HM services within VHA to improve community-based independent living of VWDs by increasing awareness and utilization of HM services.
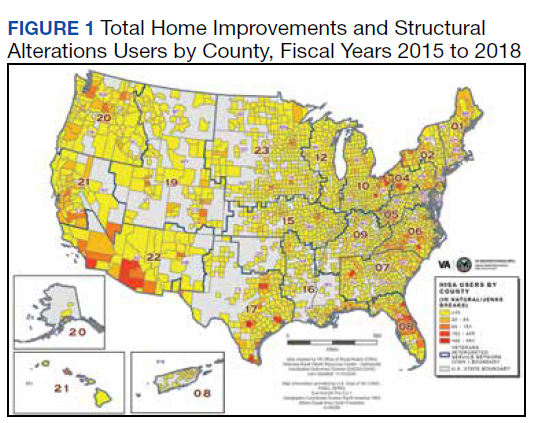
Background
A health care professional (HCP) approves a HM support award by evaluating the practicality of the support to improve the built environment of a given veteran’s disability.1,2 Previously we detailed some of the preliminary research into the HISA program, including HISA user demographic and clinical characteristics, types of HMs received, user suggestions for improvement, and geospatial analysis of HISA prescriptions concentration.1-4
The geospatial analyses of HISA prescriptions revealed clusters of high numbers of HISA users (hot spots) and low numbers of HISA users (cold spots), indicating that HISA is either not prescribed or uniformly used across the US. The previous research prompted investigation into county-level variables that may impact HISA utilization rates. This inquiry focuses on county characteristics associated with HISA use rates, such as measures of clinical care and quality of care (eg, access to health services variables, lack of insurance, preventable hospital stays), physical environment, and sociodemographic characteristics. Clinical care and quality of care measures promote the interaction with HCPs. Moreover, access to health care is an important indicator of health outcomes.5,6 An individual’s capacity to access health services, such as a HM program, greatly impacts well-being, safety, independence, and health.2,4 Well-being, safety, independence, and health become compromised if individuals cannot access care, if needed care is lacking in their area, if HCPs are not available, or are unwilling to provide care due to lack of insurance coverage.7-12 In locations where health care services are minimal due to lack of specialists or health care facilities, the quality of (or access to) care may be compromised, resulting in preventable conditions becoming problematic.13,14 These conditions may result in unnecessary hospitalizations for conditions that could have been treated during routine care. Financial barriers to care particularly among low-income people and the uninsured have proven detrimental to health.15,16 On the other hand, preventable hospital stays are a quality of care measure (ie, a proxy for poor quality of care). HISA operates within a health care system; thus, it is imperative to include these measures impacting health.
In this study, we sought to identify county-level predictors—in particular, county-level proxies for access to care—that may be associated with county-level HISA use. We define HISA utilization rate as the percentage of a county’s VHA patients who have received a HISA award.
Methods
This study used data from the National Prosthetics Patient Database (NPPD), US Department of Veterans Affairs (VA) medical database inpatient and outpatient datasets, VHA Support Service Center (VSSC) data cubes, and the County Health Rankings database (CHRD). First, the study cohort was identified from NPPD users who have obtained a HISA award from fiscal years (FY) 2015 to 2018. Analysis started with FY 2015 following new regulations (38 CFR § 17) governing the operations of the HISA program.2 The study cohort was matched with records from NPPD and VA inpatient and outpatient datasets to obtain information about the veterans’ demographic characteristics and their HM characteristics and costs. The number of VHA end-of-year (EOY) patients per county was extracted from the VSSC Current Enrollment Cube, which was used in calculation of the county-level HISA utilization rate.17 Finally, zip code–based locational data were used to calculate approximate drive time and distance from the HISA user’s approximate location to the facility where they received their HM prescription. Drive times and drive distances were calculated with Esri ArcGIS Pro (v2.6.3) by placing zip code centroid and VHA facilities on a nationwide road network that contains both road speeds and distances.
Calculations
Patient-level data were aggregated up to county-level variables by calculating the sum, mean, or percent per county. HISA user sample characteristics, including sex, race, rurality (urban, rural), marital status, and Class 1 vs Class 2 disability-related eligibility groups, were aggregated to the county level by calculating percentages of HISA users of the given characteristics out of total HISA users in the county. Disability-related eligibility groups (Class 1 vs Class 2 HISA users) determines the maximum lifetime award dollar amount. Specifically, those with service-connected disabilities or those with a ≥ 50% disability rating (regardless of whether or not their disability is service connected) are classified as Class 1 HISA users and are eligible to receive a maximum lifetime award of $6800. Those with a recorded disability that is not connected to their military service, and who have a disability rating of < 50% are classified as Class 2 HISA users and are eligible to receive a lifetime maximum award of $2000.
The county-level number of HISA users was used as the numerator for calculation of county-level HISA utilization rate. Counties with zero HISA users were excluded. The number of EOY VHA patients per county in FY 2018 was divided by 1000 and used as the denominator in the calculation of county-level HISA utilization rate. Thus, the outcome variable is HISA utilization rate per 1000 VHA patients in FY 2018 (HISA utilization rate).
County-Level Variables
County-level variables were downloaded from the 2020 CHRD.5,6 An explanation of the CHRD model and the factors used in this study are shown in the eAppendix (available at doi: 10.12788/fp.0279).6 County-level aggregated HISA user data and the CHRD data were matched using county Federal Information Processing Standards codes. Access to care measures collected from CHRD included percentages uninsured and ratios of population to primary care physicians, dentists, mental health professionals, and other primary care professionals. Other CHRD measures included those for quality of care (rate of preventable hospital stay) and housing quality (percent of households with high housing costs, percent of households with overcrowding, percent of households with lack of kitchen or plumbing, percent of households with severe housing cost burden, percent of homeownership). Of secondary interest was county population rurality, as previous research findings showed the annual average of HISA users who are from rural areas ranged from 30 to 35%.
Analysis Methods
SAS (v9.4), R (v4.0.2), and RStudio (v1.3.1093) were used for data preparation and analysis.18 Multiple regression analysis was used to predict county-level utilization rate from county-level variables. Sociodemographic characteristics from CHRD and HISA data were included as important control predictors in the regression model, though our focus for this paper are the access to care and housing quality predictors.
Model diagnostics (examination of model residuals, Breusch-Godfrey test, Breusch-Pagan test) revealed significant heteroskedasticity of the model; thus, robust standard errors and associated P values were computed using the R estimatr package (v0.30.2).19 Some predictor variables of interest (eg, ratio of mental health professionals) were removed during the model building process either due to problems of multicollinearity or excessive missingness that would have resulted in listwise deletion.
Results
County-level HISA utilization rate per 1000 EOY VHA patients ranged from 0.09 to 59.7%, with a 6.6% mean and 5% median (Figure 2). The data were highly positively skewed. The final model included 33 total predictor variables (Table 1). The final regression model was a significantly better predictor of county-level HISA utilization rate than a null model (F[33-2184], 10.18; P < .001). The adjusted model R2 showed that the overall model accounted for approximately 23% of variance in county-level HISA utilization rate (Table 2).
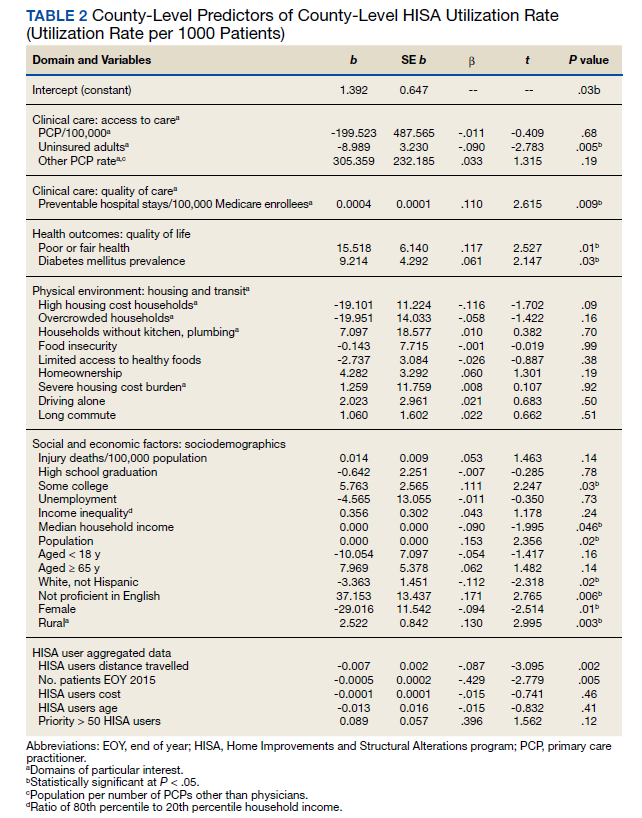
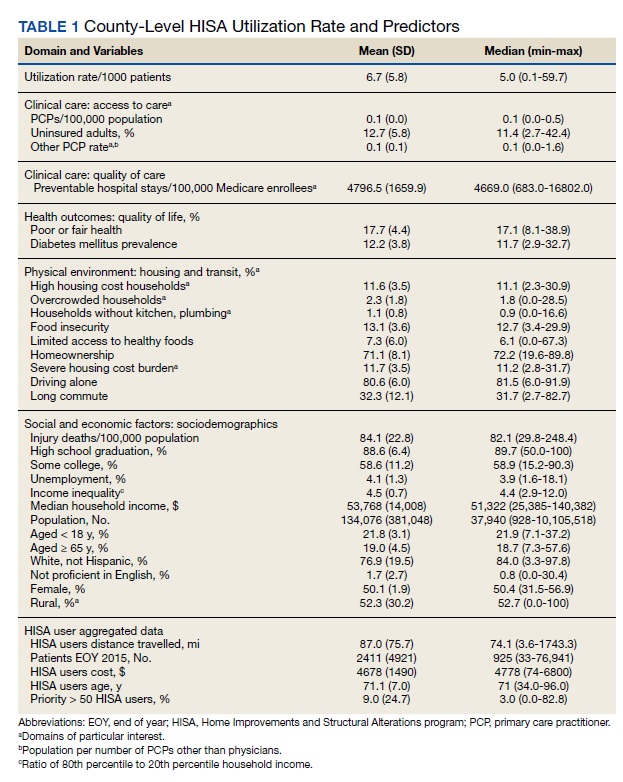
Among the primary variables of interest, percent uninsured adults and rate of preventable hospital stays emerged as significant predictors of county-level HISA utilization rate. Specifically, county percentage of uninsured adults was negatively related to county-level HISA utilization rate (b = -8.99, P = .005), indicating that the higher the proportion of uninsured adults—with all other predictors held constant—the lower the HISA utilization rate. Percent uninsured adults ranged from 2.7 to 42.4% across counties, with a mean (SD) of 12.7% (5.8%) and 11.4% median.
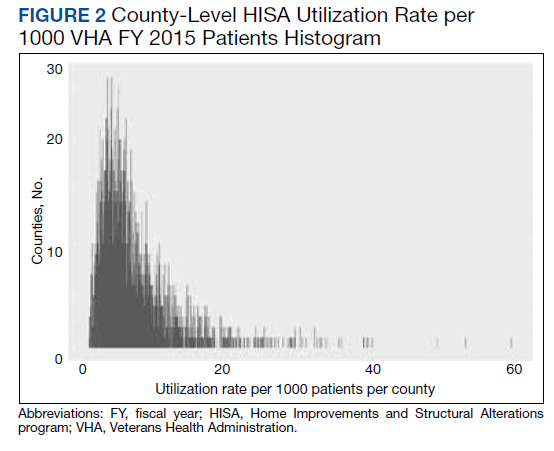
County rate of preventable hospital stays, however, was significantly and positively related to county-level HISA utilization rate (b = .0004, P = .009), indicating that the higher the rate of preventable hospital stays—with all other predictors held constant—the higher the HISA utilization rate. The direction of this effect is the opposite of the direction of the effect of percent uninsured adults (positive rather than negative), even though both could be considered measures of access to care. The standardized β for these 2 predictors indicate that county rate of preventable hospital stays is a somewhat stronger predictor of county-level HISA utilization rate than is county percent of uninsured adults (β = .11 and β = -.09, respectively). Rate of preventable hospital stays ranged from 683 to 16,802 across counties included in this analysis, with a mean (SD) of 4,796.5 (1659.9) and a 4669 median.
Of secondary interest was county rurality. The county-level percentage of rural residents was significantly and positively related to county-level HISA utilization rate, indicating that the higher the proportion of individuals within county considered rural—all other predictors held constant—the higher the HISA utilization rate. The mean (SD) percentage of rural residents per county was 52.3% (30.2) and 52.7 % median.
Discussion
This study examined whether county-level characteristics, specifically variables for access to care, quality of care, and housing quality, were predictive of a county’s HISA utilization rate. Given that this series of work on the HISA program is (to our knowledge) the first of its kind, and given the exploratory nature of this analysis, we did not have specific predictions for the effects of any one given variable. Nevertheless, some of the results were surprising, and we believe they warrant additional study. In particular, the opposing direction of effects for access to care and quality of care variables were hard to reconcile.
The county percent of uninsured adults (an access to care variable, specifically, a proxy for poor access to care) was negatively associated with county-level HISA utilization rate, whereas the county rate of preventable hospital stays (a quality of care variable, but also potentially an access to care variable, and specifically, proxies for poor quality of care or poor access to care) was positively associated with county-level HISA utilization rate. To describe the relationships more generally, one coefficient in the regression model indicated that the poorer the access to care, the lower the HISA utilization rate (higher percent of uninsured adults predicts lower HISA utilization rate), while another coefficient in the regression model indicated the poorer the quality of and access to care, the higher the HISA utilization rate (higher rate of preventable hospital stays predicts higher HISA utilization rate). Future study is warranted to disentangle and reconcile the various community-level predictors of this service.
Housing quality measures (eg, percent of households with high housing costs, percent of households with overcrowding, percent of households with lack of kitchen or plumbing, percent of households with severe housing cost burden, and percent of homeownership) are important in the consideration of whether a HM will be performed or should be performed. For example, if a person is cost burdened by the amount of expenditure spent in housing there will be little discretionary funds to perform a HM. Individuals who do not own their home may experience complications in obtaining permission from landlords to perform a HM. County-level predictors of housing quality (percent of households with high housing costs, overcrowding, and lack of kitchen or plumbing) were not significantly associated with county-level HISA utilization rate but are also nevertheless relevant to the discussion of home modifications. Of particular interest is the percent of households with lack of kitchen or plumbing variable, which was positively related to county-level HISA utilization rate although not statistically significant. HM elements related to the kitchen (eg, heighten countertop) add to the accessibility of the home allowing for the performing of activities of daily living such as cooking. Between FY 2015 and FY 2018, we discovered 131 prescriptions for kitchen (n = 90) and plumbing (n = 41) HMs, which is a very small proportion of the 30,780 total HMs (there were 24,397 bathroom HMs). The nonsignificant coefficient for this variable may reflect the small number of veterans that obtained these HM.
Limitations
The potentially conflicting direction of effects for a significant access to care variable (percent uninsured adults) and a significant access to care and quality of care variable (preventable hospital stays) are interesting and warrant additional study, but the inability to interpret or explain this apparent inconsistency constitutes a limitation of the current data and analyses presented here. Another limitation is that this analysis uses county-level predictors for what is ultimately an individual-level outcome. It would have been ideal to have both individual- and county-level data to conduct a multilevel analysis; in particular, individual-level data within counties of individuals (both veterans and nonveterans) who did not receive a HISA award (including both those who applied and were denied, and who did not apply) would be highly valuable.
Conclusions
Our continuing research into veterans’ use of HM fills a gap in the literature about the characteristics of HISA users, the impact of county-level variables on the use of HISA, and the geographic distribution and use of HISA within the VHA. While it is important to examine the influence of broader systems on individual outcomes, there could be myriad other factors that are more proximal and more closely related to whether any one individual applies for, let alone receives, a HISA award. Indeed, a low overall adjusted model R2 indicates that there is considerable variability in county-level HISA utilization rate that was not accounted for by the current model; this further speaks to warranted additional study.
More research is needed to understand and account for geographical variation in HISA utilization rate across the US. However, this work serves as an exploratory first step at quantifying and predicting HISA utilization rate at a broad level, with the ultimate goal of increasing access to HMs for veterans with disabilities.
Acknowledgments
This research was supported by grant 15521 from the US Department of Veterans Affairs, Office of Rural Health. Furthermore, the research was supported in part by grant K12 HD055929 from the National Institutes of Health. We want to acknowledge Cheri E. Knecht, Project Coordinator, for her assistance throughout all aspects of our research study and for her thoughtful contributions during the writing of this manuscript.
1. Semeah LM, Ahrentzen S, Jia H, Cowper-Ripley DC, Levy CE, Mann WC. The home improvements and structural alterations benefits program: veterans with disabilities and home accessibility. J Disability Policy Studies. 2017;28(1):43-51. doi:10.1177/1044207317696275
2. Semeah LM, Wang X, Cowper Ripley DC, Lee MJ, Ahonle ZJ, Ganesh SP, et al. Improving health through a home modification service for veterans. In: Fiedler BA, ed. Three Facets of Public Health and Paths to Improvements. Academic Press; 2020:381-416.
3. Semeah LM, Ahrentzen S, Cowper-Ripley DC, Santos-Roman LM, Beamish JO, Farley K. Rental housing needs and barriers from the perspective of veterans with disabilities. Housing Policy Debate. 2019;29(4):542-558. doi:10.1080/10511482.2018.1543203
4. Semeah LM, Ganesh SP, Wang X, et al. Home modification and health services utilization by rural and urban veterans with disabilities. Housing Policy Debate. 2021;31(6):862-874.doi:10.1080/10511482.2020.1858923
5. University of Wisconsin Population Health Institute. County health rankings model. Accessed May 13, 2022. https://www.countyhealthrankings.org/about-us
6. Remington PL, Catlin BB, Gennuso KP. The County Health Rankings: rationale and methods. Popul Health Metr. 2015;13(11). doi:10.1186/s12963-015-0044-2
7. National Academies of Sciences, Engineering, and Medicine. Health-Care Utilization as a Proxy in Disability Determination. Washington, DC: The National Academies Press; 2018.
8. Douthit N, Kiv S, Dwolatzky T, Biswas S. Exposing some important barriers to health care access in the rural USA. Public Health. 2015;129(6):611-20. doi:10.1016/j.puhe.2015.04.001
9. Medicaid and Chip Payment and Access Commission (MACPAC). Medicaid access in brief: adults’ experiences in obtaining medical care. November 2016. Accessed May 13, 2022. https://www.macpac.gov/publication/access-in-brief-adults-experiences-in-obtaining-medical-care
10. Tolbert J, Orgera, K, Damico A. Key facts about the uninsured population. November 6, 2020. Accessed May 13, 2022. https://www.kff.org/uninsured/issue-brief/key-facts-about-the-uninsured-population
11. Meit M, Knudson A, Gilbert T, et al. The 2014 update of the rural-urban chartbook, 2014. October 2014. Accessed May 13, 2022. http://www.ruralhealthresearch.org
12. National Center for Health Statistics (US). Report No.: 2016-1232. Health, United States, 2015: with special feature on racial and ethnic health disparities. Hyattsville, MD: National Center for Health Statistics.
13. Broussard DL, Mason KE, Carruth AR, Carton TW. Assessing potentially preventable hospitalizations at the county level: a comparison of measures using Medicare data and state hospital discharge data. Popul Health Manag. 2018;21(6):438-445. doi:10.1089/pop.2017.0141
14. Pezzin LE, Bogner HR, Kurichi JE, et al. Preventable hospitalizations, barriers to care, and disability. Medicine (Baltimore). 2018;97:e0691 doi:10.1097/MD.0000000000010691
15. Davis K, Ballreich J. Equitable access to care: how the United States ranks internationally. N Engl J Med. 2014;371(17):1567-70. doi:10.1056/NEJMp1406707
16. Squires D, Anderson C. U.S. health care from a global perspective: spending, use of services, prices, and health in 13 countries. Issue Brief (Commonw Fund). 2015;15:1-15.
17. VHA Service Support Center. Current enrollment cube (vssc.med.va.gov). Retrieved August 06, 2019. [Data not verified.]
18. Bunn A, Korpela M. R: A language and environment for statistical computing: an introduction to dplR. January 29, 2021. Accessed May 13, 2022. http://r.meteo.uni.wroc.pl/web/packages/dplR/vignettes/intro-dplR.pdf
19. Sheppard BH, Hartwick J, Warshaw PR. The theory of reasoned action: a meta-analysis of past research with recommendations for modifications and future research. J Consumer Research. 1988;15(3):325-343. doi:10.1086/209170
This article is part of a series of articles on the Home Improvements and Structural Alterations program (HISA), a home modification (HM) program within the Veterans Health Administration (VHA). HISA is a benefit awarded to veterans with disabilities (VWDs) and is instrumental in affording physical accessibility and structural alterations to veterans’ homes.1 The overarching goals of this project are to describe and understand HISA use by VWDs. Previous work has shown geographical variation in the number of HISA prescriptions across counties in the US (Figure 1).1 The current work seeks to describe and predict the county-level rates of HISA use. Information about what predicts HISA utilization at the county level is important because it enhances understanding of program utilization at a national level. The long-term goal of the series is to provide knowledge about HM services within VHA to improve community-based independent living of VWDs by increasing awareness and utilization of HM services.
Background
A health care professional (HCP) approves a HM support award by evaluating the practicality of the support to improve the built environment of a given veteran’s disability.1,2 Previously we detailed some of the preliminary research into the HISA program, including HISA user demographic and clinical characteristics, types of HMs received, user suggestions for improvement, and geospatial analysis of HISA prescriptions concentration.1-4
The geospatial analyses of HISA prescriptions revealed clusters of high numbers of HISA users (hot spots) and low numbers of HISA users (cold spots), indicating that HISA is either not prescribed or uniformly used across the US. The previous research prompted investigation into county-level variables that may impact HISA utilization rates. This inquiry focuses on county characteristics associated with HISA use rates, such as measures of clinical care and quality of care (eg, access to health services variables, lack of insurance, preventable hospital stays), physical environment, and sociodemographic characteristics. Clinical care and quality of care measures promote the interaction with HCPs. Moreover, access to health care is an important indicator of health outcomes.5,6 An individual’s capacity to access health services, such as a HM program, greatly impacts well-being, safety, independence, and health.2,4 Well-being, safety, independence, and health become compromised if individuals cannot access care, if needed care is lacking in their area, if HCPs are not available, or are unwilling to provide care due to lack of insurance coverage.7-12 In locations where health care services are minimal due to lack of specialists or health care facilities, the quality of (or access to) care may be compromised, resulting in preventable conditions becoming problematic.13,14 These conditions may result in unnecessary hospitalizations for conditions that could have been treated during routine care. Financial barriers to care particularly among low-income people and the uninsured have proven detrimental to health.15,16 On the other hand, preventable hospital stays are a quality of care measure (ie, a proxy for poor quality of care). HISA operates within a health care system; thus, it is imperative to include these measures impacting health.
In this study, we sought to identify county-level predictors—in particular, county-level proxies for access to care—that may be associated with county-level HISA use. We define HISA utilization rate as the percentage of a county’s VHA patients who have received a HISA award.
Methods
This study used data from the National Prosthetics Patient Database (NPPD), US Department of Veterans Affairs (VA) medical database inpatient and outpatient datasets, VHA Support Service Center (VSSC) data cubes, and the County Health Rankings database (CHRD). First, the study cohort was identified from NPPD users who have obtained a HISA award from fiscal years (FY) 2015 to 2018. Analysis started with FY 2015 following new regulations (38 CFR § 17) governing the operations of the HISA program.2 The study cohort was matched with records from NPPD and VA inpatient and outpatient datasets to obtain information about the veterans’ demographic characteristics and their HM characteristics and costs. The number of VHA end-of-year (EOY) patients per county was extracted from the VSSC Current Enrollment Cube, which was used in calculation of the county-level HISA utilization rate.17 Finally, zip code–based locational data were used to calculate approximate drive time and distance from the HISA user’s approximate location to the facility where they received their HM prescription. Drive times and drive distances were calculated with Esri ArcGIS Pro (v2.6.3) by placing zip code centroid and VHA facilities on a nationwide road network that contains both road speeds and distances.
Calculations
Patient-level data were aggregated up to county-level variables by calculating the sum, mean, or percent per county. HISA user sample characteristics, including sex, race, rurality (urban, rural), marital status, and Class 1 vs Class 2 disability-related eligibility groups, were aggregated to the county level by calculating percentages of HISA users of the given characteristics out of total HISA users in the county. Disability-related eligibility groups (Class 1 vs Class 2 HISA users) determines the maximum lifetime award dollar amount. Specifically, those with service-connected disabilities or those with a ≥ 50% disability rating (regardless of whether or not their disability is service connected) are classified as Class 1 HISA users and are eligible to receive a maximum lifetime award of $6800. Those with a recorded disability that is not connected to their military service, and who have a disability rating of < 50% are classified as Class 2 HISA users and are eligible to receive a lifetime maximum award of $2000.
The county-level number of HISA users was used as the numerator for calculation of county-level HISA utilization rate. Counties with zero HISA users were excluded. The number of EOY VHA patients per county in FY 2018 was divided by 1000 and used as the denominator in the calculation of county-level HISA utilization rate. Thus, the outcome variable is HISA utilization rate per 1000 VHA patients in FY 2018 (HISA utilization rate).
County-Level Variables
County-level variables were downloaded from the 2020 CHRD.5,6 An explanation of the CHRD model and the factors used in this study are shown in the eAppendix (available at doi: 10.12788/fp.0279).6 County-level aggregated HISA user data and the CHRD data were matched using county Federal Information Processing Standards codes. Access to care measures collected from CHRD included percentages uninsured and ratios of population to primary care physicians, dentists, mental health professionals, and other primary care professionals. Other CHRD measures included those for quality of care (rate of preventable hospital stay) and housing quality (percent of households with high housing costs, percent of households with overcrowding, percent of households with lack of kitchen or plumbing, percent of households with severe housing cost burden, percent of homeownership). Of secondary interest was county population rurality, as previous research findings showed the annual average of HISA users who are from rural areas ranged from 30 to 35%.
Analysis Methods
SAS (v9.4), R (v4.0.2), and RStudio (v1.3.1093) were used for data preparation and analysis.18 Multiple regression analysis was used to predict county-level utilization rate from county-level variables. Sociodemographic characteristics from CHRD and HISA data were included as important control predictors in the regression model, though our focus for this paper are the access to care and housing quality predictors.
Model diagnostics (examination of model residuals, Breusch-Godfrey test, Breusch-Pagan test) revealed significant heteroskedasticity of the model; thus, robust standard errors and associated P values were computed using the R estimatr package (v0.30.2).19 Some predictor variables of interest (eg, ratio of mental health professionals) were removed during the model building process either due to problems of multicollinearity or excessive missingness that would have resulted in listwise deletion.
Results
County-level HISA utilization rate per 1000 EOY VHA patients ranged from 0.09 to 59.7%, with a 6.6% mean and 5% median (Figure 2). The data were highly positively skewed. The final model included 33 total predictor variables (Table 1). The final regression model was a significantly better predictor of county-level HISA utilization rate than a null model (F[33-2184], 10.18; P < .001). The adjusted model R2 showed that the overall model accounted for approximately 23% of variance in county-level HISA utilization rate (Table 2).
Among the primary variables of interest, percent uninsured adults and rate of preventable hospital stays emerged as significant predictors of county-level HISA utilization rate. Specifically, county percentage of uninsured adults was negatively related to county-level HISA utilization rate (b = -8.99, P = .005), indicating that the higher the proportion of uninsured adults—with all other predictors held constant—the lower the HISA utilization rate. Percent uninsured adults ranged from 2.7 to 42.4% across counties, with a mean (SD) of 12.7% (5.8%) and 11.4% median.
County rate of preventable hospital stays, however, was significantly and positively related to county-level HISA utilization rate (b = .0004, P = .009), indicating that the higher the rate of preventable hospital stays—with all other predictors held constant—the higher the HISA utilization rate. The direction of this effect is the opposite of the direction of the effect of percent uninsured adults (positive rather than negative), even though both could be considered measures of access to care. The standardized β for these 2 predictors indicate that county rate of preventable hospital stays is a somewhat stronger predictor of county-level HISA utilization rate than is county percent of uninsured adults (β = .11 and β = -.09, respectively). Rate of preventable hospital stays ranged from 683 to 16,802 across counties included in this analysis, with a mean (SD) of 4,796.5 (1659.9) and a 4669 median.
Of secondary interest was county rurality. The county-level percentage of rural residents was significantly and positively related to county-level HISA utilization rate, indicating that the higher the proportion of individuals within county considered rural—all other predictors held constant—the higher the HISA utilization rate. The mean (SD) percentage of rural residents per county was 52.3% (30.2) and 52.7 % median.
Discussion
This study examined whether county-level characteristics, specifically variables for access to care, quality of care, and housing quality, were predictive of a county’s HISA utilization rate. Given that this series of work on the HISA program is (to our knowledge) the first of its kind, and given the exploratory nature of this analysis, we did not have specific predictions for the effects of any one given variable. Nevertheless, some of the results were surprising, and we believe they warrant additional study. In particular, the opposing direction of effects for access to care and quality of care variables were hard to reconcile.
The county percent of uninsured adults (an access to care variable, specifically, a proxy for poor access to care) was negatively associated with county-level HISA utilization rate, whereas the county rate of preventable hospital stays (a quality of care variable, but also potentially an access to care variable, and specifically, proxies for poor quality of care or poor access to care) was positively associated with county-level HISA utilization rate. To describe the relationships more generally, one coefficient in the regression model indicated that the poorer the access to care, the lower the HISA utilization rate (higher percent of uninsured adults predicts lower HISA utilization rate), while another coefficient in the regression model indicated the poorer the quality of and access to care, the higher the HISA utilization rate (higher rate of preventable hospital stays predicts higher HISA utilization rate). Future study is warranted to disentangle and reconcile the various community-level predictors of this service.
Housing quality measures (eg, percent of households with high housing costs, percent of households with overcrowding, percent of households with lack of kitchen or plumbing, percent of households with severe housing cost burden, and percent of homeownership) are important in the consideration of whether a HM will be performed or should be performed. For example, if a person is cost burdened by the amount of expenditure spent in housing there will be little discretionary funds to perform a HM. Individuals who do not own their home may experience complications in obtaining permission from landlords to perform a HM. County-level predictors of housing quality (percent of households with high housing costs, overcrowding, and lack of kitchen or plumbing) were not significantly associated with county-level HISA utilization rate but are also nevertheless relevant to the discussion of home modifications. Of particular interest is the percent of households with lack of kitchen or plumbing variable, which was positively related to county-level HISA utilization rate although not statistically significant. HM elements related to the kitchen (eg, heighten countertop) add to the accessibility of the home allowing for the performing of activities of daily living such as cooking. Between FY 2015 and FY 2018, we discovered 131 prescriptions for kitchen (n = 90) and plumbing (n = 41) HMs, which is a very small proportion of the 30,780 total HMs (there were 24,397 bathroom HMs). The nonsignificant coefficient for this variable may reflect the small number of veterans that obtained these HM.
Limitations
The potentially conflicting direction of effects for a significant access to care variable (percent uninsured adults) and a significant access to care and quality of care variable (preventable hospital stays) are interesting and warrant additional study, but the inability to interpret or explain this apparent inconsistency constitutes a limitation of the current data and analyses presented here. Another limitation is that this analysis uses county-level predictors for what is ultimately an individual-level outcome. It would have been ideal to have both individual- and county-level data to conduct a multilevel analysis; in particular, individual-level data within counties of individuals (both veterans and nonveterans) who did not receive a HISA award (including both those who applied and were denied, and who did not apply) would be highly valuable.
Conclusions
Our continuing research into veterans’ use of HM fills a gap in the literature about the characteristics of HISA users, the impact of county-level variables on the use of HISA, and the geographic distribution and use of HISA within the VHA. While it is important to examine the influence of broader systems on individual outcomes, there could be myriad other factors that are more proximal and more closely related to whether any one individual applies for, let alone receives, a HISA award. Indeed, a low overall adjusted model R2 indicates that there is considerable variability in county-level HISA utilization rate that was not accounted for by the current model; this further speaks to warranted additional study.
More research is needed to understand and account for geographical variation in HISA utilization rate across the US. However, this work serves as an exploratory first step at quantifying and predicting HISA utilization rate at a broad level, with the ultimate goal of increasing access to HMs for veterans with disabilities.
Acknowledgments
This research was supported by grant 15521 from the US Department of Veterans Affairs, Office of Rural Health. Furthermore, the research was supported in part by grant K12 HD055929 from the National Institutes of Health. We want to acknowledge Cheri E. Knecht, Project Coordinator, for her assistance throughout all aspects of our research study and for her thoughtful contributions during the writing of this manuscript.
1. Semeah LM, Ahrentzen S, Jia H, Cowper-Ripley DC, Levy CE, Mann WC. The home improvements and structural alterations benefits program: veterans with disabilities and home accessibility. J Disability Policy Studies. 2017;28(1):43-51. doi:10.1177/1044207317696275
2. Semeah LM, Wang X, Cowper Ripley DC, Lee MJ, Ahonle ZJ, Ganesh SP, et al. Improving health through a home modification service for veterans. In: Fiedler BA, ed. Three Facets of Public Health and Paths to Improvements. Academic Press; 2020:381-416.
3. Semeah LM, Ahrentzen S, Cowper-Ripley DC, Santos-Roman LM, Beamish JO, Farley K. Rental housing needs and barriers from the perspective of veterans with disabilities. Housing Policy Debate. 2019;29(4):542-558. doi:10.1080/10511482.2018.1543203
4. Semeah LM, Ganesh SP, Wang X, et al. Home modification and health services utilization by rural and urban veterans with disabilities. Housing Policy Debate. 2021;31(6):862-874.doi:10.1080/10511482.2020.1858923
5. University of Wisconsin Population Health Institute. County health rankings model. Accessed May 13, 2022. https://www.countyhealthrankings.org/about-us
6. Remington PL, Catlin BB, Gennuso KP. The County Health Rankings: rationale and methods. Popul Health Metr. 2015;13(11). doi:10.1186/s12963-015-0044-2
7. National Academies of Sciences, Engineering, and Medicine. Health-Care Utilization as a Proxy in Disability Determination. Washington, DC: The National Academies Press; 2018.
8. Douthit N, Kiv S, Dwolatzky T, Biswas S. Exposing some important barriers to health care access in the rural USA. Public Health. 2015;129(6):611-20. doi:10.1016/j.puhe.2015.04.001
9. Medicaid and Chip Payment and Access Commission (MACPAC). Medicaid access in brief: adults’ experiences in obtaining medical care. November 2016. Accessed May 13, 2022. https://www.macpac.gov/publication/access-in-brief-adults-experiences-in-obtaining-medical-care
10. Tolbert J, Orgera, K, Damico A. Key facts about the uninsured population. November 6, 2020. Accessed May 13, 2022. https://www.kff.org/uninsured/issue-brief/key-facts-about-the-uninsured-population
11. Meit M, Knudson A, Gilbert T, et al. The 2014 update of the rural-urban chartbook, 2014. October 2014. Accessed May 13, 2022. http://www.ruralhealthresearch.org
12. National Center for Health Statistics (US). Report No.: 2016-1232. Health, United States, 2015: with special feature on racial and ethnic health disparities. Hyattsville, MD: National Center for Health Statistics.
13. Broussard DL, Mason KE, Carruth AR, Carton TW. Assessing potentially preventable hospitalizations at the county level: a comparison of measures using Medicare data and state hospital discharge data. Popul Health Manag. 2018;21(6):438-445. doi:10.1089/pop.2017.0141
14. Pezzin LE, Bogner HR, Kurichi JE, et al. Preventable hospitalizations, barriers to care, and disability. Medicine (Baltimore). 2018;97:e0691 doi:10.1097/MD.0000000000010691
15. Davis K, Ballreich J. Equitable access to care: how the United States ranks internationally. N Engl J Med. 2014;371(17):1567-70. doi:10.1056/NEJMp1406707
16. Squires D, Anderson C. U.S. health care from a global perspective: spending, use of services, prices, and health in 13 countries. Issue Brief (Commonw Fund). 2015;15:1-15.
17. VHA Service Support Center. Current enrollment cube (vssc.med.va.gov). Retrieved August 06, 2019. [Data not verified.]
18. Bunn A, Korpela M. R: A language and environment for statistical computing: an introduction to dplR. January 29, 2021. Accessed May 13, 2022. http://r.meteo.uni.wroc.pl/web/packages/dplR/vignettes/intro-dplR.pdf
19. Sheppard BH, Hartwick J, Warshaw PR. The theory of reasoned action: a meta-analysis of past research with recommendations for modifications and future research. J Consumer Research. 1988;15(3):325-343. doi:10.1086/209170
Online Information About Hydroquinone: An Assessment of Accuracy and Readability
To the Editor:
The internet is a popular resource for patients seeking information about dermatologic treatments. Hydroquinone (HQ) cream 4% is approved by the US Food and Drug Administration for skin hyperpigmentation.1 The agency enforced the CARES (Coronavirus Aid, Relief, and Economic Security) Act and OTC (over-the-counter) Monograph Reform on September 25, 2020, to restrict distribution of OTC HQ.2 Exogenous ochronosis is listed as a potential adverse effect in the prescribing information for HQ.1
 flow diagram of the article selection process")
We sought to assess online resources on HQ for accuracy of information, including the recent OTC ban, as well as readability. The word hydroquinone was searched on 3 internet search engines—Google, Yahoo, and Bing—on December 12, 2020, each for the first 20 URLs (ie, websites)(total of 60 URLs). Preferred Reporting Items for Systematic Reviews and Meta-analyses (PRISMA)(Figure) reporting guidelines were used to assess a list of relevant websites to include in the final analysis. Website data were reviewed by both authors. Eighteen duplicates and 27 irrelevant and non–English-language URLs were excluded. The remaining 15 websites were analyzed. Based on a previously published and validated tool, a pro forma was designed to evaluate information on HQ for each website based on accountability, quality, readability, display, support, and transparency (Table).1,3

Scores for all 15 websites are listed in eTable 1. The mean overall (total) score was


The mean display score was 0.3 (of a possible 4; range, 0–2); 66.7% of websites (10/15) had advertisements or irrelevant material. Only 6.7% and 13.3% of websites included relevant videos or images, respectively, on applying HQ (eTable 2). We identified only 3 photographs—across all 15 websites—that depicted skin, all of which were Fitzpatrick skin types II or III. Therefore, none of the websites included a diversity of images to indicate broad ethnic relatability.

The average support score was 2.5 (of a possible 4; range, 1–3); 20% (3/15) of URLs included chat sites, message boards, or forums, and approximately half (8/15 [53.3%]) included references. Only 7 URLs (46.7%) had been updated in the last 12 months. Only 4 (26.7%) were written by a board-certified dermatologist (eTable 2). Most (60%) websites contained advertising, though none were sponsored by a pharmaceutical company that manufactures HQ.
Only 46.7% (7/15) of websites recommended limiting a course of HQ treatment to 3 months; only 40% (6/15) mentioned shelf life or photochemical degradation when exposed to air. Although 93.3% (14/15) of URLs mentioned ochronosis, a clinical description of the condition was provided in only 33.3% (5/15)—none with images.
Only 2 sites (13.3%; Everyday Health and WebMD) met the accepted 7th-grade reading level for online patient education material; those sites scored lower on quality (9 of 17 and 6 of 17, respectively) than sites with higher overall scores.
None of the 15 websites studied, therefore, demonstrated optimal features on combined measures of accountability, quality, readability, display, support, and transparency regarding HQ. Notably, the American Academy of Dermatology website (www.aad.org) was not among the 15 websites studied; the AAD website mentions HQ in a section on melasma, but only minimal detail is provided.
Limitations of this study include the small number of websites analyzed and possible selection bias because only 3 internet search engines were used to identify websites for study and analysis.
Previously, we analyzed content about HQ on the video-sharing and social media platform YouTube.4 The most viewed YouTube videos on HQ had poor-quality information (ie, only 20% mentioned ochronosis and only 28.6% recommended sunscreen [N=70]). However, average reading level of these videos was 7th grade.4,5 Therefore, YouTube HQ content, though comprehensible, generally is of poor quality.
By conducting a search for website content about HQ, we found that the most popular URLs had either accurate information with poor readability or lower-quality educational material that was more comprehensible. We conclude that there is a need to develop online patient education materials on HQ that are characterized by high-quality, up-to-date medical information; have been written by board-certified dermatologists; are comprehensible (ie, no more than approximately 1200 words and written at a 7th-grade reading level); and contain relevant clinical images and references. We encourage dermatologists to recognize the limitations of online patient education resources on HQ and educate patients on the proper use of the drug as well as its potential adverse effects
- US National Library of Medicine. Label: hydroquinone cream. DailyMed website. Updated November 24, 2020. Accessed May 19, 2022. https://dailymed.nlm.nih.gov/dailymed/drugInfo.cfm?setid=dc72c0b2-4505-4dcf-8a69-889cd9f41693
- US Congress. H.R.748 - CARES Act. 116th Congress (2019-2020). Updated March 27, 2020. Accessed May 19, 2022. https://www.congress.gov/bill/116th-congress/house-bill/748/text?fbclid=IwAR3ZxGP6AKUl6ce-dlWSU6D5MfCLD576nWNBV5YTE7R2a0IdLY4Usw4oOv4
- Kang R, Lipner S. Evaluation of onychomycosis information on the internet. J Drugs Dermatol. 2019;18:484-487.
- Ishack S, Lipner SR. Assessing the impact and educational value of YouTube as a source of information on hydroquinone: a content-quality and readability analysis. J Dermatolog Treat. 2020:1-3. doi:10.1080/09546634.2020.1782318
- Weiss BD. Health Literacy: A Manual for Clinicians. American Medical Association Foundation and American Medical Association; 2003. Accessed May 19, 2022. http://lib.ncfh.org/pdfs/6617.pdf
To the Editor:
The internet is a popular resource for patients seeking information about dermatologic treatments. Hydroquinone (HQ) cream 4% is approved by the US Food and Drug Administration for skin hyperpigmentation.1 The agency enforced the CARES (Coronavirus Aid, Relief, and Economic Security) Act and OTC (over-the-counter) Monograph Reform on September 25, 2020, to restrict distribution of OTC HQ.2 Exogenous ochronosis is listed as a potential adverse effect in the prescribing information for HQ.1
We sought to assess online resources on HQ for accuracy of information, including the recent OTC ban, as well as readability. The word hydroquinone was searched on 3 internet search engines—Google, Yahoo, and Bing—on December 12, 2020, each for the first 20 URLs (ie, websites)(total of 60 URLs). Preferred Reporting Items for Systematic Reviews and Meta-analyses (PRISMA)(Figure) reporting guidelines were used to assess a list of relevant websites to include in the final analysis. Website data were reviewed by both authors. Eighteen duplicates and 27 irrelevant and non–English-language URLs were excluded. The remaining 15 websites were analyzed. Based on a previously published and validated tool, a pro forma was designed to evaluate information on HQ for each website based on accountability, quality, readability, display, support, and transparency (Table).1,3
Scores for all 15 websites are listed in eTable 1. The mean overall (total) score was
The mean display score was 0.3 (of a possible 4; range, 0–2); 66.7% of websites (10/15) had advertisements or irrelevant material. Only 6.7% and 13.3% of websites included relevant videos or images, respectively, on applying HQ (eTable 2). We identified only 3 photographs—across all 15 websites—that depicted skin, all of which were Fitzpatrick skin types II or III. Therefore, none of the websites included a diversity of images to indicate broad ethnic relatability.
The average support score was 2.5 (of a possible 4; range, 1–3); 20% (3/15) of URLs included chat sites, message boards, or forums, and approximately half (8/15 [53.3%]) included references. Only 7 URLs (46.7%) had been updated in the last 12 months. Only 4 (26.7%) were written by a board-certified dermatologist (eTable 2). Most (60%) websites contained advertising, though none were sponsored by a pharmaceutical company that manufactures HQ.
Only 46.7% (7/15) of websites recommended limiting a course of HQ treatment to 3 months; only 40% (6/15) mentioned shelf life or photochemical degradation when exposed to air. Although 93.3% (14/15) of URLs mentioned ochronosis, a clinical description of the condition was provided in only 33.3% (5/15)—none with images.
Only 2 sites (13.3%; Everyday Health and WebMD) met the accepted 7th-grade reading level for online patient education material; those sites scored lower on quality (9 of 17 and 6 of 17, respectively) than sites with higher overall scores.
None of the 15 websites studied, therefore, demonstrated optimal features on combined measures of accountability, quality, readability, display, support, and transparency regarding HQ. Notably, the American Academy of Dermatology website (www.aad.org) was not among the 15 websites studied; the AAD website mentions HQ in a section on melasma, but only minimal detail is provided.
Limitations of this study include the small number of websites analyzed and possible selection bias because only 3 internet search engines were used to identify websites for study and analysis.
Previously, we analyzed content about HQ on the video-sharing and social media platform YouTube.4 The most viewed YouTube videos on HQ had poor-quality information (ie, only 20% mentioned ochronosis and only 28.6% recommended sunscreen [N=70]). However, average reading level of these videos was 7th grade.4,5 Therefore, YouTube HQ content, though comprehensible, generally is of poor quality.
By conducting a search for website content about HQ, we found that the most popular URLs had either accurate information with poor readability or lower-quality educational material that was more comprehensible. We conclude that there is a need to develop online patient education materials on HQ that are characterized by high-quality, up-to-date medical information; have been written by board-certified dermatologists; are comprehensible (ie, no more than approximately 1200 words and written at a 7th-grade reading level); and contain relevant clinical images and references. We encourage dermatologists to recognize the limitations of online patient education resources on HQ and educate patients on the proper use of the drug as well as its potential adverse effects
- US National Library of Medicine. Label: hydroquinone cream. DailyMed website. Updated November 24, 2020. Accessed May 19, 2022. https://dailymed.nlm.nih.gov/dailymed/drugInfo.cfm?setid=dc72c0b2-4505-4dcf-8a69-889cd9f41693
- US Congress. H.R.748 - CARES Act. 116th Congress (2019-2020). Updated March 27, 2020. Accessed May 19, 2022. https://www.congress.gov/bill/116th-congress/house-bill/748/text?fbclid=IwAR3ZxGP6AKUl6ce-dlWSU6D5MfCLD576nWNBV5YTE7R2a0IdLY4Usw4oOv4
- Kang R, Lipner S. Evaluation of onychomycosis information on the internet. J Drugs Dermatol. 2019;18:484-487.
- Ishack S, Lipner SR. Assessing the impact and educational value of YouTube as a source of information on hydroquinone: a content-quality and readability analysis. J Dermatolog Treat. 2020:1-3. doi:10.1080/09546634.2020.1782318
- Weiss BD. Health Literacy: A Manual for Clinicians. American Medical Association Foundation and American Medical Association; 2003. Accessed May 19, 2022. http://lib.ncfh.org/pdfs/6617.pdf
Practice Points
- Hydroquinone (HQ) 4% is US Food and Drug Administration (FDA) approved for skin hyperpigmentation including melasma.
- In September 2020, the FDA enforced the CARES (Coronavirus Aid, Relief, and Economic Security) Act and OTC (over-the-counter) Monograph Reform, announcing that HQ is not classified as Category II/not generally recognized as safe and effective, thus prohibiting the distribution of OTC HQ products.
- Exogenous ochronosis is a potential side effect associated with HQ.
- There is a need for dermatologists to develop online patient education materials on HQ that are characterized by high-quality and up-to-date medical information.
Assessing Treatment Delays for Vitiligo Patients: A Retrospective Chart Review
Similar to other dermatologic conditions, barriers to early care in patients with vitiligo can exacerbate health disparities.1 Delayed treatment of vitiligo is known to hamper successful disease stabilization and repigmentation, as therapies tend to work more effectively in early stages of the disease.2
To investigate the factors associated with treatment delays for patients with vitiligo, we conducted a retrospective chart review of 102 consecutive patients with vitiligo attending an academic outpatient clinic in Austin, Texas, over 36 months.
Methods
Our sample included 102 consecutive patients with vitiligo who attended an academic outpatient clinic in Austin, Texas, from January 2017 to January 2020. Demographic information, clinical characteristics of vitiligo, and treatment data were self-reported via a standardized questionnaire given to all patients with vitiligo and gathered from medical chart review. Patient characteristics are outlined in the Table. The delay to treatment was the time (in months) from the date the patient first noticed the lesion to the start date of first treatment. This retrospective chart review was reviewed by the University of Texas at Austin institutional review board and was determined to be exempt.

Statistical Analysis—The data were analyzed descriptively with a Wilcoxon rank sum test (type I error rate of .05).
Results
Of the 102 charts that were analyzed, 45 were females and 57 were males. More than half of the patients (54.9% [56/102]) were White. Sixteen were Asian, 13 were Hispanic non-White, 11 were Black/African American, and 4 were American Indian/Alaska Native. The median age of disease onset was 21 years, minimum age was 1 year, and maximum age was 83 years. The diagnosis of vitiligo was made by a dermatologist for 72 patients and by a physician of another specialty for 20 patients. Ten patients did not declare the specialty of the diagnosing physician.
Individuals older than 21 years when their disease started had a shorter delay to treatment than individuals who noticed their first lesion at an age younger than 21 years (median, 75 months vs 13 months; P<.01). Individuals diagnosed by a dermatologist had a shorter delay to treatment than individuals diagnosed by a physician of another specialty (median, 13 months vs 58 months; P<.05). White individuals had a shorter delay to treatment than individuals with skin of color (median, 13 months vs 31 months; P=.08), though this trend did not reach statistical significance. Individuals with 1% to 25% of body surface area (BSA) affected at time of presentation to clinic also had a shorter delay to treatment than those with a greater BSA affected (median, 13 months vs 74 months; P<.06), though this trend did not reach statistical significance. Type of vitiligo (P<.8), Fitzpatrick skin type (P<.6), and smoking status (P<.7) were not associated with differential delays.
Comment
Impact of Age on Vitiligo Treatment—Our data suggest that individuals who develop vitiligo at a younger age experience longer treatment delays compared to older individuals. Reasons for this are uncertain but could include access issues, medical decision-making agency, and younger patients not remembering being treated during their youth. Our data also could be influenced by some of the adult patients in our study first noticing their lesions many years ago when treatments for vitiligo were more limited. Nevertheless, detrimental effects on quality of life in children and adolescents with vitiligo suggest that motivating younger individuals with vitiligo to seek treatment or proactively making them aware of treatment opportunities may be beneficial.3
Diagnosis of Vitiligo by Nondermatologists—The increase in delay to treatment when a nondermatologist diagnoses vitiligo suggests that prompt initiation of treatment or referrals to dermatology by primary care providers may not routinely be occurring.4 Our data indicate the need to educate primary care providers on treatment opportunities for individuals with vitiligo and that early treatment generally is more effective.5
Impact of Race/Ethnicity on Vitiligo Treatment—Our data also show trends for longer treatment delays for individuals with skin of color. Although this did not reach statistical significance, we hope future studies will investigate this issue, especially because patients with skin of color experience more stigmatization and quality-of-life impacts by vitiligo than White patients.5
Impact of BSA on Vitiligo Treatment—Our data show that patients with a smaller BSA had a shorter delay to treatment than those with a greater BSA affected. This was a unique finding given it initially was hypothesized that patients with greater BSA would seek treatment earlier because of the associated increase in quality of life impact. This trend was not statistically significant, but further investigation would be helpful to analyze the reason behind treatment delays in patients with greater BSA affected.
Conclusion
The delay to treatment in our study population was correlated with the diagnosing physician’s specialty and patient age at disease onset, with trends also observed for race and BSA affected. These findings emphasize the need to investigate specific causes of barriers to early care to promote health equity among individuals with vitiligo.
- Tripathi R, Archibald LK, Mazmudar RS, et al. Racial differences in time to treatment for melanoma. J Am Acad Dermatol. 2020;83:854-859.
- Boniface K, Seneschal J. Vitiligo as a skin memory disease: the need for early intervention with immunomodulating agents and a maintenance therapy to target resident memory T cells. Exp Dermatol. 2019;28:656-661.
- Silverberg JI, Silverberg NB. Quality of life impairment in children and adolescents with vitiligo. Pediatr Dermatol. 2014;31:309-318.
- Amer AA, Gao XH. Quality of life in patients with vitiligo: an analysis of the dermatology life quality index outcome over the past two decades. Int J Dermatol. 2016;55:608-614.
- Weibel L, Laguda B, Atherton D, et al. Misdiagnosis and delay in referral of children with localized scleroderma. Br J Dermatol. 2011;165:1308-1313.
Similar to other dermatologic conditions, barriers to early care in patients with vitiligo can exacerbate health disparities.1 Delayed treatment of vitiligo is known to hamper successful disease stabilization and repigmentation, as therapies tend to work more effectively in early stages of the disease.2
To investigate the factors associated with treatment delays for patients with vitiligo, we conducted a retrospective chart review of 102 consecutive patients with vitiligo attending an academic outpatient clinic in Austin, Texas, over 36 months.
Methods
Our sample included 102 consecutive patients with vitiligo who attended an academic outpatient clinic in Austin, Texas, from January 2017 to January 2020. Demographic information, clinical characteristics of vitiligo, and treatment data were self-reported via a standardized questionnaire given to all patients with vitiligo and gathered from medical chart review. Patient characteristics are outlined in the Table. The delay to treatment was the time (in months) from the date the patient first noticed the lesion to the start date of first treatment. This retrospective chart review was reviewed by the University of Texas at Austin institutional review board and was determined to be exempt.
Statistical Analysis—The data were analyzed descriptively with a Wilcoxon rank sum test (type I error rate of .05).
Results
Of the 102 charts that were analyzed, 45 were females and 57 were males. More than half of the patients (54.9% [56/102]) were White. Sixteen were Asian, 13 were Hispanic non-White, 11 were Black/African American, and 4 were American Indian/Alaska Native. The median age of disease onset was 21 years, minimum age was 1 year, and maximum age was 83 years. The diagnosis of vitiligo was made by a dermatologist for 72 patients and by a physician of another specialty for 20 patients. Ten patients did not declare the specialty of the diagnosing physician.
Individuals older than 21 years when their disease started had a shorter delay to treatment than individuals who noticed their first lesion at an age younger than 21 years (median, 75 months vs 13 months; P<.01). Individuals diagnosed by a dermatologist had a shorter delay to treatment than individuals diagnosed by a physician of another specialty (median, 13 months vs 58 months; P<.05). White individuals had a shorter delay to treatment than individuals with skin of color (median, 13 months vs 31 months; P=.08), though this trend did not reach statistical significance. Individuals with 1% to 25% of body surface area (BSA) affected at time of presentation to clinic also had a shorter delay to treatment than those with a greater BSA affected (median, 13 months vs 74 months; P<.06), though this trend did not reach statistical significance. Type of vitiligo (P<.8), Fitzpatrick skin type (P<.6), and smoking status (P<.7) were not associated with differential delays.
Comment
Impact of Age on Vitiligo Treatment—Our data suggest that individuals who develop vitiligo at a younger age experience longer treatment delays compared to older individuals. Reasons for this are uncertain but could include access issues, medical decision-making agency, and younger patients not remembering being treated during their youth. Our data also could be influenced by some of the adult patients in our study first noticing their lesions many years ago when treatments for vitiligo were more limited. Nevertheless, detrimental effects on quality of life in children and adolescents with vitiligo suggest that motivating younger individuals with vitiligo to seek treatment or proactively making them aware of treatment opportunities may be beneficial.3
Diagnosis of Vitiligo by Nondermatologists—The increase in delay to treatment when a nondermatologist diagnoses vitiligo suggests that prompt initiation of treatment or referrals to dermatology by primary care providers may not routinely be occurring.4 Our data indicate the need to educate primary care providers on treatment opportunities for individuals with vitiligo and that early treatment generally is more effective.5
Impact of Race/Ethnicity on Vitiligo Treatment—Our data also show trends for longer treatment delays for individuals with skin of color. Although this did not reach statistical significance, we hope future studies will investigate this issue, especially because patients with skin of color experience more stigmatization and quality-of-life impacts by vitiligo than White patients.5
Impact of BSA on Vitiligo Treatment—Our data show that patients with a smaller BSA had a shorter delay to treatment than those with a greater BSA affected. This was a unique finding given it initially was hypothesized that patients with greater BSA would seek treatment earlier because of the associated increase in quality of life impact. This trend was not statistically significant, but further investigation would be helpful to analyze the reason behind treatment delays in patients with greater BSA affected.
Conclusion
The delay to treatment in our study population was correlated with the diagnosing physician’s specialty and patient age at disease onset, with trends also observed for race and BSA affected. These findings emphasize the need to investigate specific causes of barriers to early care to promote health equity among individuals with vitiligo.
- Tripathi R, Archibald LK, Mazmudar RS, et al. Racial differences in time to treatment for melanoma. J Am Acad Dermatol. 2020;83:854-859.
- Boniface K, Seneschal J. Vitiligo as a skin memory disease: the need for early intervention with immunomodulating agents and a maintenance therapy to target resident memory T cells. Exp Dermatol. 2019;28:656-661.
- Silverberg JI, Silverberg NB. Quality of life impairment in children and adolescents with vitiligo. Pediatr Dermatol. 2014;31:309-318.
- Amer AA, Gao XH. Quality of life in patients with vitiligo: an analysis of the dermatology life quality index outcome over the past two decades. Int J Dermatol. 2016;55:608-614.
- Weibel L, Laguda B, Atherton D, et al. Misdiagnosis and delay in referral of children with localized scleroderma. Br J Dermatol. 2011;165:1308-1313.
Practice Points
- The medical community should be aware of factors associated with delay to treatment in patients with vitiligo, such as the diagnosing physician’s specialty and patient age at disease onset.
- Race and percentage of body surface area affected at time of presentation also demonstrate trends regarding treatment delays in patients with vitiligo.
Intravenous Immunoglobulin in Treating Nonventilated COVID-19 Patients With Moderate-to-Severe Hypoxia: A Pharmacoeconomic Analysis
From Sharp Memorial Hospital, San Diego, CA (Drs. Poremba, Dehner, Perreiter, Semma, and Mills), Sharp Rees-Stealy Medical Group, San Diego, CA (Dr. Sakoulas), and Collaborative to Halt Antibiotic-Resistant Microbes (CHARM), Department of Pediatrics, University of California San Diego School of Medicine, La Jolla, CA (Dr. Sakoulas).
Abstract
Objective: To compare the costs of hospitalization of patients with moderate-to-severe COVID-19 who received intravenous immunoglobulin (IVIG) with those of patients of similar comorbidity and illness severity who did not.
Design: Analysis 1 was a case-control study of 10 nonventilated, moderately to severely hypoxic patients with COVID-19 who received IVIG (Privigen [CSL Behring]) matched 1:2 with 20 control patients of similar age, body mass index, degree of hypoxemia, and comorbidities. Analysis 2 consisted of patients enrolled in a previously published, randomized, open-label prospective study of 14 patients with COVID-19 receiving standard of care vs 13 patients who received standard of care plus IVIG (Octagam 10% [Octapharma]).
Setting and participants: Patients with COVID-19 with moderate-to-severe hypoxemia hospitalized at a single site located in San Diego, California.
Measurements: Direct cost of hospitalization.
Results: In the first (case-control) population, mean total direct costs, including IVIG, for the treatment group were $21,982 per IVIG-treated case vs $42,431 per case for matched non-IVIG-receiving controls, representing a net cost reduction of $20,449 (48%) per case. For the second (randomized) group, mean total direct costs, including IVIG, for the treatment group were $28,268 per case vs $62,707 per case for untreated controls, representing a net cost reduction of $34,439 (55%) per case. Of the patients who did not receive IVIG, 24% had hospital costs exceeding $80,000; none of the IVIG-treated patients had costs exceeding this amount (P = .016, Fisher exact test).
Conclusion: If allocated early to the appropriate patient type (moderate-to-severe illness without end-organ comorbidities and age <70 years), IVIG can significantly reduce hospital costs in COVID-19 care. More important, in our study it reduced the demand for scarce critical care resources during the COVID-19 pandemic.
Keywords: IVIG, SARS-CoV-2, cost saving, direct hospital costs.
Intravenous immunoglobulin (IVIG) has been available in most hospitals for 4 decades, with broad therapeutic applications in the treatment of Kawasaki disease and a variety of inflammatory, infectious, autoimmune, and viral diseases, via multifactorial mechanisms of immune modulation.1 Reports of COVID-19−associated multisystem inflammatory syndrome in adults and children have supported the use of IVIG in treatment.2,3 Previous studies of IVIG treatment for COVID-19 have produced mixed results. Although retrospective studies have largely been positive,4-8 prospective clinical trials have been mixed, with some favorable results9-11 and another, more recent study showing no benefit.12 However, there is still considerable debate regarding whether some subgroups of patients with COVID-19 may benefit from IVIG; the studies that support this argument, however, have been diluted by broad clinical trials that lack granularity among the heterogeneity of patient characteristics and the timing of IVIG administration.13,14 One study suggests that patients with COVID-19 who may be particularly poised to benefit from IVIG are those who are younger, have fewer comorbidities, and are treated early.8
At our institution, we selectively utilized IVIG to treat patients within 48 hours of rapidly increasing oxygen requirements due to COVID-19, targeting those younger than 70 years, with no previous irreversible end-organ damage, no significant comorbidities (renal failure, heart failure, dementia, active cancer malignancies), and no active treatment for cancer. We analyzed the costs of care of these IVIG (Privigen) recipients and compared them to costs for patients with COVID-19 matched by comorbidities, age, and illness severity who did not receive IVIG. To look for consistency, we examined the cost of care of COVID-19 patients who received IVIG (Octagam) as compared to controls from a previously published pilot trial.10
Methods
Setting and Treatment
All patients in this study were hospitalized at a single site located in San Diego, California. Treatment patients in both cohorts received IVIG 0.5 g/kg adjusted for body weight daily for 3 consecutive days.
Patient Cohort #1: Retrospective Case-Control Trial
Intravenous immunoglobulin (Privigen 10%, CSL Behring) was utilized off-label to treat moderately to severely ill non-intensive care unit (ICU) patients with COVID-19 requiring ≥3 L of oxygen by nasal cannula who were not mechanically ventilated but were considered at high risk for respiratory failure. Preset exclusion criteria for off-label use of IVIG in the treatment of COVID-19 were age >70 years, active malignancy, organ transplant recipient, renal failure, heart failure, or dementia. Controls were obtained from a list of all admitted patients with COVID-19, matched to cases 2:1 on the basis of age (±10 years), body mass index (±1), gender, comorbidities present at admission (eg, hypertension, diabetes mellitus, lung disease, or history of tobacco use), and maximum oxygen requirements within the first 48 hours of admission. In situations where more than 2 potential matched controls were identified for a patient, the 2 controls closest in age to the treatment patient were selected. One IVIG patient was excluded because only 1 matched-age control could be found. Pregnant patients who otherwise fulfilled the criteria for IVIG administration were also excluded from this analysis.
Patient Cohort #2: Prospective, Randomized, Open-Label Trial
Use of IVIG (Octagam 10%, Octapharma) in COVID-19 was studied in a previously published, prospective, open-label randomized trial.10 This pilot trial included 16 IVIG-treated patients and 17 control patients, of which 13 and 14 patients, respectively, had hospital cost data available for analysis.10 Most notably, COVID-19 patients in this study were required to have ≥4 L of oxygen via nasal cannula to maintain arterial oxygen saturationof ≤96%.
Outcomes
Cost data were independently obtained from our finance team, which provided us with the total direct cost and the total pharmaceutical cost associated with each admission. We also compared total length of stay (LOS) and ICU LOS between treatment arms, as these were presumed to be the major drivers of cost difference.
Statistics
Nonparametric comparisons of medians were performed with the Mann-Whitney U test. Comparison of means was done by Student t test. Categorical data were analyzed by Fisher exact test.
This analysis was initiated as an internal quality assessment. It received approval from the Sharp Healthcare Institutional Review Board ([email protected]), and was granted a waiver of subject authorization and consent given the retrospective nature of the study.
Results
Case-Control Analysis
A total of 10 hypoxic patients with COVID-19 received Privigen IVIG outside of clinical trial settings. None of the patients was vaccinated against SARS-CoV-2, as hospitalization occurred prior to vaccine availability. In addition, the original SARS-CoV-2 strain was circulating while these patients were hospitalized, preceding subsequent emerging variants. Oxygen requirements within the first 48 hours ranged from 3 L via nasal cannula to requiring bi-level positive pressure airway therapy with 100% oxygen; median age was 56 years and median Charlson comorbidity index was 1. These 10 patients were each matched to 2 control patients hospitalized during a comparable time period and who, based on oxygen requirements, did not receive IVIG. The 20 control patients had a median age of 58.5 years and a Charlson comorbidity index of 1 (Table 1). Rates of comorbidities, such as hypertension, diabetes mellitus, and obesity, were identical in the 2 groups. None of the patients in either group died during the index hospitalization. Fewer control patients received glucocorticoids, which was reflective of lower illness severity/degree of hypoxia in some controls.

Health care utilization in terms of costs and hospital LOS between the 2 groups are shown in Table 2. The mean total direct hospital cost per case, including IVIG and other drug costs, for the 10 IVIG-treated COVID-19 patients was $21,982 vs $42,431 for the matched controls, a reduction of $20,449 (48%) per case (P = .6187) with IVIG. This difference was heavily driven by 4 control patients (20%) with hospital costs >$80,000, marked by need for ICU transfer, mechanical ventilation during admission, and longer hospital stays. This reduction in progression to mechanical ventilation was consistent with our previously published, open-label, randomized prospective IVIG study, the financial assessment of which is reviewed below. While total direct costs were lower in the treatment arm, the mean drug cost for the treatment arm was $3122 greater than the mean drug cost in the control arm (P = .001622), consistent with the high cost of IVIG therapy (Table 2).
 Recipients vs a Non-IVIG Matched Case-Control Group")
LOS information was obtained, as this was thought to be a primary driver of direct costs. The average LOS in the IVIG arm was 8.4 days, and the average LOS in the control arm was 13.6 days (P = NS). The average ICU LOS in the IVIG arm was 0 days, while the average ICU LOS in the control arm was 5.3 days (P = .04). As with the differences in cost, the differences in LOS were primarily driven by the 4 outlier cases in our control arm, who each had a LOS >25 days, as well as an ICU LOS >20 days.
Randomized, Open-Label, Patient Cohort Analysis
Patient characteristics, LOS, and rates of mechanical ventilation for the IVIG and control patients were previously published and showed a reduction in mechanical ventilation and hospital LOS with IVIG treatment.10 In this group of patients, 1 patient treated with IVIG (6%) and 3 patients not treated with IVIG (18%) died. To determine the consistency of these results from the case-control patients with a set of patients obtained from clinical trial randomization, we examined the health care costs of patients from the prior study.10 As with the case-control group, patients in this portion of the analysis were hospitalized before vaccines were available and prior to any identified variants.
Comparing the hospital cost of the IVIG-treated patients to the control patients from this trial revealed results similar to the matched case-control analysis discussed earlier. Average total direct cost per case, including IVIG, for the IVIG treatment group was $28,268, vs $62,707 per case for non-IVIG controls. This represented a net cost reduction of $34,439 (55%) per case, very similar to that of the prior cohort.
IVIG Reduces Costly Outlier Cases
The case-control and randomized trial groups, yielding a combined 23 IVIG and 34 control patients, showed a median cost per case of $22,578 (range $10,115-$70,929) and $22,645 (range $4723-$279,797) for the IVIG and control groups, respectively. Cases with a cost >$80,000 were 0/23 (0%) vs 8/34 (24%) in the IVIG and control groups, respectively (P = .016, Fisher exact test).
Improving care while simultaneously keeping care costs below reimbursement payment levels received from third-party payers is paramount to the financial survival of health care systems. IVIG appears to do this by reducing the number of patients with COVID-19 who progress to ICU care. We compared the costs of care of our combined case-control and randomized trial cohorts to published data on average reimbursements hospitals receive for COVID-19 care from Medicaid, Medicare, and private insurance (Figure).15 IVIG demonstrated a reduction in cases where costs exceed reimbursement. Indeed, a comparison of net revenue per case of the case-control group showed significantly higher revenue for the IVIG group compared to controls ($52,704 vs $34,712, P = .0338, Table 2).
 and control COVID-19 cases with respect to average reimbursement by Medicaid (solid line, bottom), Medicare (dashed line, middle), and commercial insurance (dotted line, top)")
Discussion
As reflected in at least 1 other study,16 our hospital had been successfully utilizing IVIG in the treatment of viral acute respiratory distress syndrome (ARDS) prior to COVID-19. Therefore, we moved quickly to perform a randomized, open-label pilot study of IVIG (Octagam 10%) in COVID-19, and noted significant clinical benefit that might translate into hospital cost savings.10 Over the course of the pandemic, evidence has accumulated that IVIG may play an important role in COVID-19 therapeutics, as summarized in a recent review.17 However, despite promising but inconsistent results, the relatively high acquisition costs of IVIG raised questions as to its pharmacoeconomic value, particularly with such a high volume of COVID-19 patients with hypoxia, in light of limited clinical data.
COVID-19 therapeutics data can be categorized into either high-quality trials showing marginal benefit for some agents or low-quality trials showing greater benefit for other agents, with IVIG studies falling into the latter category.18 This phenomenon may speak to the pathophysiological heterogeneity of the COVID-19 patient population. High-quality trials enrolling broad patient types lack the granularity to capture and single out relevant patient subsets who would derive maximal therapeutic benefit, with those subsets diluted by other patient types for which no benefit is seen. Meanwhile, the more granular low-quality trials are criticized as underpowered and lacking in translatability to practice.
Positive results from our pilot trial allowed the use of IVIG (Privigen) off-label in hospitalized COVID-19 patients restricted to specific criteria. Patients had to be moderately to severely ill, requiring >3 L of oxygen via nasal cannula; show high risk of clinical deterioration based on respiratory rate and decline in respiratory status; and have underlying comorbidities (such as hypertension, obesity, or diabetes mellitus). However, older patients (>age 70 years) and those with underlying comorbidities marked by organ failure (such as heart failure, renal failure, dementia, or receipt of organ transplant) and active malignancy were excluded, as their clinical outcome in COVID-19 may be considered less modifiable by therapeutics, while simultaneously carrying potentially a higher risk of adverse events from IVIG (volume overload, renal failure). These exclusions are reflected in the overall low Charlson comorbidity index (mean of 1) of the patients in the case-control study arm. As anticipated, we found a net cost reduction: $20,449 (48%) per case among the 10 IVIG-treated patients compared to the 20 matched controls.
We then went back to the patients from the randomized prospective trial and compared costs for the 13 of 16 IVIG patients and 14 of 17 of the control patients for whom data were available. Among untreated controls, we found a net cost reduction of $34,439 (55%) per case. The higher costs seen in the randomized patient cohort compared to the latter case-control group may be due to a combination of the fact that the treated patients had slightly higher comorbidity indices than the case-control group (median Charlson comorbidity index of 2 in both groups) and the fact that they were treated earlier in the pandemic (May/June 2020), as opposed to the case-control group patients, who were treated in November/December 2020.
It was notable that the cost savings across both groups were derived largely from the reduction in the approximately 20% to 25% of control patients who went on to critical illness, including mechanical ventilation, extracorporeal membrane oxygenation (ECMO), and prolonged ICU stays. Indeed, 8 of 34 of the control patients—but none of the 23 IVIG-treated patients—generated hospital costs in excess of $80,000, a difference that was statistically significant even for such a small sample size. Therefore, reducing these very costly outlier events translated into net savings across the board.
In addition to lowering costs, reducing progression to critical illness is extremely important during heavy waves of COVID-19, when the sheer volume of patients results in severe strain due to the relative scarcity of ICU beds, mechanical ventilators, and ECMO. Therefore, reducing the need for these resources would have a vital role that cannot be measured economically.
The major limitations of this study include the small sample size and the potential lack of generalizability of these results to all hospital centers and treating providers. Our group has considerable experience in IVIG utilization in COVID-19 and, as a result, has identified a “sweet spot,” where benefits were seen clinically and economically. However, it remains to be determined whether IVIG will benefit patients with greater illness severity, such as those in the ICU, on mechanical ventilation, or ECMO. Furthermore, while a significant morbidity and mortality burden of COVID-19 rests in extremely elderly patients and those with end-organ comorbidities such as renal failure and heart failure, it is uncertain whether their COVID-19 adverse outcomes can be improved with IVIG or other therapies. We believe such patients may limit the pharmacoeconomic value of IVIG due to their generally poorer prognosis, regardless of intervention. On the other hand, COVID-19 patients who are not that severely ill, with minimal to no hypoxia, generally will do well regardless of therapy. Therefore, IVIG intervention may be an unnecessary treatment expense. Evidence for this was suggested in our pilot trial10 and supported in a recent meta-analysis of IVIG therapy in COVID-19.19
Several other therapeutic options with high acquisition costs have seen an increase in use during the COVID-19 pandemic despite relatively lukewarm data. Remdesivir, the first drug found to have a beneficial effect on hospitalized patients with COVID-19, is priced at $3120 for a complete 5-day treatment course in the United States. This was in line with initial pricing models from the Institute for Clinical and Economic Review (ICER) in May 2020, assuming a mortality benefit with remdesivir use. After the SOLIDARITY trial was published, which showed no mortality benefit associated with remdesivir, ICER updated their pricing models in June 2020 and released a statement that the price of remdesivir was too high to align with demonstrated benefits.20,21 More recent data demonstrate that remdesivir may be beneficial, but only if administered to patients with fewer than 6 days of symptoms.22 However, only a minority of patients present to the hospital early enough in their illness for remdesivir to be beneficial.22
Tocilizumab, an interleukin-6 inhibitor, saw an increase in use during the pandemic. An 800-mg treatment course for COVID-19 costs $3584. The efficacy of this treatment option came into question after the COVACTA trial failed to show a difference in clinical status or mortality in COVID-19 patients who received tocilizumab vs placebo.23,24 A more recent study pointed to a survival benefit of tocilizumab in COVID-19, driven by a very large sample size (>4000), yielding statistically significant, but perhaps clinically less significant, effects on survival.25 This latter study points to the extremely large sample sizes required to capture statistically significant benefits of expensive interventions in COVID-19, which our data demonstrate may benefit only a fraction of patients (20%-25% of patients in the case of IVIG). A more granular clinical assessment of these other interventions is needed to be able to capture the patient subtypes where tocilizumab, remdesivir, and other therapies will be cost effective in the treatment of COVID-19 or other virally mediated cases of ARDS.
Conclusion
While IVIG has a high acquisition cost, the drug’s use in hypoxic COVID-19 patients resulted in reduced costs per COVID-19 case of approximately 50% and use of less critical care resources. The difference was consistent between 2 cohorts (randomized trial vs off-label use in prespecified COVID-19 patient types), IVIG products used (Octagam 10% and Privigen), and time period in the pandemic (waves 1 and 2 in May/June 2020 vs wave 3 in November/December 2020), thereby adjusting for potential differences in circulating viral strains. Furthermore, patients from both groups predated SARS-CoV-2 vaccine availability and major circulating viral variants (eg, delta, omicron), thereby eliminating confounding on outcomes posed by these factors. Control patients’ higher costs of care were driven largely by the approximately 25% of patients who required costly hospital critical care resources, a group mitigated by IVIG. When allocated to the appropriate patient type (patients with moderate-to-severe but not critical illness, <age 70 without preexisting comorbidities of end-organ failure or active cancer), IVIG can reduce hospital costs for COVID-19 care. Identification of specific patient populations where IVIG has the most anticipated benefits in viral illness is needed.
Corresponding author: George Sakoulas, MD, Sharp Rees-Stealy Medical Group, 2020 Genesee Avenue, 2nd Floor, San Diego, CA 92123; [email protected]
Disclosures: Dr Sakoulas has worked as a consultant for Abbvie, Paratek, and Octapharma, has served as a speaker for Abbvie and Paratek, and has received research funding from Octapharma. The other authors did not report any disclosures.
1. Galeotti C, Kaveri SV, Bayry J. IVIG-mediated effector functions in autoimmune and inflammatory diseases. Int Immunol. 2017;29(11):491-498. doi:10.1093/intimm/dxx039
2. Verdoni L, Mazza A, Gervasoni A, et al. An outbreak of severe Kawasaki-like disease at the Italian epicentre of the SARS-CoV-2 epidemic: an observational cohort study. Lancet. 2020;395(10239):1771-1778. doi:10.1016/S0140-6736(20)31103-X
3. Belhadjer Z, Méot M, Bajolle F, et al. Acute heart failure in multisystem inflammatory syndrome in children in the context of global SARS-CoV-2 pandemic. Circulation. 2020;142(5):429-436. doi:10.1161/CIRCULATIONAHA.120.048360
4. Shao Z, Feng Y, Zhong L, et al. Clinical efficacy of intravenous immunoglobulin therapy in critical ill patients with COVID-19: a multicenter retrospective cohort study. Clin Transl Immunology. 2020;9(10):e1192. doi:10.1002/cti2.1192
5. Xie Y, Cao S, Dong H, et al. Effect of regular intravenous immunoglobulin therapy on prognosis of severe pneumonia in patients with COVID-19. J Infect. 2020;81(2):318-356. doi:10.1016/j.jinf.2020.03.044
6. Zhou ZG, Xie SM, Zhang J, et al. Short-term moderate-dose corticosteroid plus immunoglobulin effectively reverses COVID-19 patients who have failed low-dose therapy. Preprints. 2020:2020030065. doi:10.20944/preprints202003.0065.v1
7. Cao W, Liu X, Bai T, et al. High-dose intravenous immunoglobulin as a therapeutic option for deteriorating patients with coronavirus disease 2019. Open Forum Infect Dis. 2020;7(3):ofaa102. doi:10.1093/ofid/ofaa102
8. Cao W, Liu X, Hong K, et al. High-dose intravenous immunoglobulin in severe coronavirus disease 2019: a multicenter retrospective study in China. Front Immunol. 2021;12:627844. doi:10.3389/fimmu.2021.627844
9. Gharebaghi N, Nejadrahim R, Mousavi SJ, Sadat-Ebrahimi SR, Hajizadeh R. The use of intravenous immunoglobulin gamma for the treatment of severe coronavirus disease 2019: a randomized placebo-controlled double-blind clinical trial. BMC Infect Dis. 2020;20(1):786. doi:10.1186/s12879-020-05507-4
10. Sakoulas G, Geriak M, Kullar R, et al. Intravenous immunoglobulin plus methylprednisolone mitigate respiratory morbidity in coronavirus disease 2019. Crit Care Explor. 2020;2(11):e0280. doi:10.1097/CCE.0000000000000280
11. Raman RS, Bhagwan Barge V, Anil Kumar D, et al. A phase II safety and efficacy study on prognosis of moderate pneumonia in coronavirus disease 2019 patients with regular intravenous immunoglobulin therapy. J Infect Dis. 2021;223(9):1538-1543. doi:10.1093/infdis/jiab098
12. Mazeraud A, Jamme M, Mancusi RL, et al. Intravenous immunoglobulins in patients with COVID-19-associated moderate-to-severe acute respiratory distress syndrome (ICAR): multicentre, double-blind, placebo-controlled, phase 3 trial. Lancet Respir Med. 2022;10(2):158-166. doi:10.1016/S2213-2600(21)00440-9
13. Kindgen-Milles D, Feldt T, Jensen BEO, Dimski T, Brandenburger T. Why the application of IVIG might be beneficial in patients with COVID-19. Lancet Respir Med. 2022;10(2):e15. doi:10.1016/S2213-2600(21)00549-X
14. Wilfong EM, Matthay MA. Intravenous immunoglobulin therapy for COVID-19 ARDS. Lancet Respir Med. 2022;10(2):123-125. doi:10.1016/S2213-2600(21)00450-1
15. Bazell C, Kramer M, Mraz M, Silseth S. How much are hospitals paid for inpatient COVID-19 treatment? June 2020. https://us.milliman.com/-/media/milliman/pdfs/articles/how-much-hospitals-paid-for-inpatient-covid19-treatment.ashx
16. Liu X, Cao W, Li T. High-dose intravenous immunoglobulins in the treatment of severe acute viral pneumonia: the known mechanisms and clinical effects. Front Immunol. 2020;11:1660. doi:10.3389/fimmu.2020.01660
17. Danieli MG, Piga MA, Paladini A, et al. Intravenous immunoglobulin as an important adjunct in prevention and therapy of coronavirus 19 disease. Scand J Immunol. 2021;94(5):e13101. doi:10.1111/sji.13101
18. Starshinova A, Malkova A, Zinchenko U, et al. Efficacy of different types of therapy for COVID-19: a comprehensive review. Life (Basel). 2021;11(8):753. doi:10.3390/life11080753
19. Xiang HR, Cheng X, Li Y, Luo WW, Zhang QZ, Peng WX. Efficacy of IVIG (intravenous immunoglobulin) for corona virus disease 2019 (COVID-19): a meta-analysis. Int Immunopharmacol. 2021;96:107732. doi:10.1016/j.intimp.2021.107732
20. ICER’s second update to pricing models of remdesivir for COVID-19. PharmacoEcon Outcomes News. 2020;867(1):2. doi:10.1007/s40274-020-7299-y
21. Pan H, Peto R, Henao-Restrepo AM, et al. Repurposed antiviral drugs for Covid-19—interim WHO solidarity trial results. N Engl J Med. 2021;384(6):497-511. doi:10.1056/NEJMoa2023184
22. Garcia-Vidal C, Alonso R, Camon AM, et al. Impact of remdesivir according to the pre-admission symptom duration in patients with COVID-19. J Antimicrob Chemother. 2021;76(12):3296-3302. doi:10.1093/jac/dkab321
23. Golimumab (Simponi) IV: In combination with methotrexate (MTX) for the treatment of adult patients with moderately to severely active rheumatoid arthritis [Internet]. Canadian Agency for Drugs and Technologies in Health; 2015. Table 1: Cost comparison table for biologic disease-modifying antirheumatic drugs. https://www.ncbi.nlm.nih.gov/books/NBK349397/table/T34/
24. Rosas IO, Bräu N, Waters M, et al. Tocilizumab in hospitalized patients with severe Covid-19 pneumonia. N Engl J Med. 2021;384(16):1503-1516. doi:10.1056/NEJMoa2028700
25. RECOVERY Collaborative Group. Tocilizumab in patients admitted to hospital with COVID-19 (RECOVERY): a randomised, controlled, open-label, platform trial. Lancet. 2021;397(10285):1637-1645. doi:10.1016/S0140-6736(21)00676-0
From Sharp Memorial Hospital, San Diego, CA (Drs. Poremba, Dehner, Perreiter, Semma, and Mills), Sharp Rees-Stealy Medical Group, San Diego, CA (Dr. Sakoulas), and Collaborative to Halt Antibiotic-Resistant Microbes (CHARM), Department of Pediatrics, University of California San Diego School of Medicine, La Jolla, CA (Dr. Sakoulas).
Abstract
Objective: To compare the costs of hospitalization of patients with moderate-to-severe COVID-19 who received intravenous immunoglobulin (IVIG) with those of patients of similar comorbidity and illness severity who did not.
Design: Analysis 1 was a case-control study of 10 nonventilated, moderately to severely hypoxic patients with COVID-19 who received IVIG (Privigen [CSL Behring]) matched 1:2 with 20 control patients of similar age, body mass index, degree of hypoxemia, and comorbidities. Analysis 2 consisted of patients enrolled in a previously published, randomized, open-label prospective study of 14 patients with COVID-19 receiving standard of care vs 13 patients who received standard of care plus IVIG (Octagam 10% [Octapharma]).
Setting and participants: Patients with COVID-19 with moderate-to-severe hypoxemia hospitalized at a single site located in San Diego, California.
Measurements: Direct cost of hospitalization.
Results: In the first (case-control) population, mean total direct costs, including IVIG, for the treatment group were $21,982 per IVIG-treated case vs $42,431 per case for matched non-IVIG-receiving controls, representing a net cost reduction of $20,449 (48%) per case. For the second (randomized) group, mean total direct costs, including IVIG, for the treatment group were $28,268 per case vs $62,707 per case for untreated controls, representing a net cost reduction of $34,439 (55%) per case. Of the patients who did not receive IVIG, 24% had hospital costs exceeding $80,000; none of the IVIG-treated patients had costs exceeding this amount (P = .016, Fisher exact test).
Conclusion: If allocated early to the appropriate patient type (moderate-to-severe illness without end-organ comorbidities and age <70 years), IVIG can significantly reduce hospital costs in COVID-19 care. More important, in our study it reduced the demand for scarce critical care resources during the COVID-19 pandemic.
Keywords: IVIG, SARS-CoV-2, cost saving, direct hospital costs.
Intravenous immunoglobulin (IVIG) has been available in most hospitals for 4 decades, with broad therapeutic applications in the treatment of Kawasaki disease and a variety of inflammatory, infectious, autoimmune, and viral diseases, via multifactorial mechanisms of immune modulation.1 Reports of COVID-19−associated multisystem inflammatory syndrome in adults and children have supported the use of IVIG in treatment.2,3 Previous studies of IVIG treatment for COVID-19 have produced mixed results. Although retrospective studies have largely been positive,4-8 prospective clinical trials have been mixed, with some favorable results9-11 and another, more recent study showing no benefit.12 However, there is still considerable debate regarding whether some subgroups of patients with COVID-19 may benefit from IVIG; the studies that support this argument, however, have been diluted by broad clinical trials that lack granularity among the heterogeneity of patient characteristics and the timing of IVIG administration.13,14 One study suggests that patients with COVID-19 who may be particularly poised to benefit from IVIG are those who are younger, have fewer comorbidities, and are treated early.8
At our institution, we selectively utilized IVIG to treat patients within 48 hours of rapidly increasing oxygen requirements due to COVID-19, targeting those younger than 70 years, with no previous irreversible end-organ damage, no significant comorbidities (renal failure, heart failure, dementia, active cancer malignancies), and no active treatment for cancer. We analyzed the costs of care of these IVIG (Privigen) recipients and compared them to costs for patients with COVID-19 matched by comorbidities, age, and illness severity who did not receive IVIG. To look for consistency, we examined the cost of care of COVID-19 patients who received IVIG (Octagam) as compared to controls from a previously published pilot trial.10
Methods
Setting and Treatment
All patients in this study were hospitalized at a single site located in San Diego, California. Treatment patients in both cohorts received IVIG 0.5 g/kg adjusted for body weight daily for 3 consecutive days.
Patient Cohort #1: Retrospective Case-Control Trial
Intravenous immunoglobulin (Privigen 10%, CSL Behring) was utilized off-label to treat moderately to severely ill non-intensive care unit (ICU) patients with COVID-19 requiring ≥3 L of oxygen by nasal cannula who were not mechanically ventilated but were considered at high risk for respiratory failure. Preset exclusion criteria for off-label use of IVIG in the treatment of COVID-19 were age >70 years, active malignancy, organ transplant recipient, renal failure, heart failure, or dementia. Controls were obtained from a list of all admitted patients with COVID-19, matched to cases 2:1 on the basis of age (±10 years), body mass index (±1), gender, comorbidities present at admission (eg, hypertension, diabetes mellitus, lung disease, or history of tobacco use), and maximum oxygen requirements within the first 48 hours of admission. In situations where more than 2 potential matched controls were identified for a patient, the 2 controls closest in age to the treatment patient were selected. One IVIG patient was excluded because only 1 matched-age control could be found. Pregnant patients who otherwise fulfilled the criteria for IVIG administration were also excluded from this analysis.
Patient Cohort #2: Prospective, Randomized, Open-Label Trial
Use of IVIG (Octagam 10%, Octapharma) in COVID-19 was studied in a previously published, prospective, open-label randomized trial.10 This pilot trial included 16 IVIG-treated patients and 17 control patients, of which 13 and 14 patients, respectively, had hospital cost data available for analysis.10 Most notably, COVID-19 patients in this study were required to have ≥4 L of oxygen via nasal cannula to maintain arterial oxygen saturationof ≤96%.
Outcomes
Cost data were independently obtained from our finance team, which provided us with the total direct cost and the total pharmaceutical cost associated with each admission. We also compared total length of stay (LOS) and ICU LOS between treatment arms, as these were presumed to be the major drivers of cost difference.
Statistics
Nonparametric comparisons of medians were performed with the Mann-Whitney U test. Comparison of means was done by Student t test. Categorical data were analyzed by Fisher exact test.
This analysis was initiated as an internal quality assessment. It received approval from the Sharp Healthcare Institutional Review Board ([email protected]), and was granted a waiver of subject authorization and consent given the retrospective nature of the study.
Results
Case-Control Analysis
A total of 10 hypoxic patients with COVID-19 received Privigen IVIG outside of clinical trial settings. None of the patients was vaccinated against SARS-CoV-2, as hospitalization occurred prior to vaccine availability. In addition, the original SARS-CoV-2 strain was circulating while these patients were hospitalized, preceding subsequent emerging variants. Oxygen requirements within the first 48 hours ranged from 3 L via nasal cannula to requiring bi-level positive pressure airway therapy with 100% oxygen; median age was 56 years and median Charlson comorbidity index was 1. These 10 patients were each matched to 2 control patients hospitalized during a comparable time period and who, based on oxygen requirements, did not receive IVIG. The 20 control patients had a median age of 58.5 years and a Charlson comorbidity index of 1 (Table 1). Rates of comorbidities, such as hypertension, diabetes mellitus, and obesity, were identical in the 2 groups. None of the patients in either group died during the index hospitalization. Fewer control patients received glucocorticoids, which was reflective of lower illness severity/degree of hypoxia in some controls.
Health care utilization in terms of costs and hospital LOS between the 2 groups are shown in Table 2. The mean total direct hospital cost per case, including IVIG and other drug costs, for the 10 IVIG-treated COVID-19 patients was $21,982 vs $42,431 for the matched controls, a reduction of $20,449 (48%) per case (P = .6187) with IVIG. This difference was heavily driven by 4 control patients (20%) with hospital costs >$80,000, marked by need for ICU transfer, mechanical ventilation during admission, and longer hospital stays. This reduction in progression to mechanical ventilation was consistent with our previously published, open-label, randomized prospective IVIG study, the financial assessment of which is reviewed below. While total direct costs were lower in the treatment arm, the mean drug cost for the treatment arm was $3122 greater than the mean drug cost in the control arm (P = .001622), consistent with the high cost of IVIG therapy (Table 2).
LOS information was obtained, as this was thought to be a primary driver of direct costs. The average LOS in the IVIG arm was 8.4 days, and the average LOS in the control arm was 13.6 days (P = NS). The average ICU LOS in the IVIG arm was 0 days, while the average ICU LOS in the control arm was 5.3 days (P = .04). As with the differences in cost, the differences in LOS were primarily driven by the 4 outlier cases in our control arm, who each had a LOS >25 days, as well as an ICU LOS >20 days.
Randomized, Open-Label, Patient Cohort Analysis
Patient characteristics, LOS, and rates of mechanical ventilation for the IVIG and control patients were previously published and showed a reduction in mechanical ventilation and hospital LOS with IVIG treatment.10 In this group of patients, 1 patient treated with IVIG (6%) and 3 patients not treated with IVIG (18%) died. To determine the consistency of these results from the case-control patients with a set of patients obtained from clinical trial randomization, we examined the health care costs of patients from the prior study.10 As with the case-control group, patients in this portion of the analysis were hospitalized before vaccines were available and prior to any identified variants.
Comparing the hospital cost of the IVIG-treated patients to the control patients from this trial revealed results similar to the matched case-control analysis discussed earlier. Average total direct cost per case, including IVIG, for the IVIG treatment group was $28,268, vs $62,707 per case for non-IVIG controls. This represented a net cost reduction of $34,439 (55%) per case, very similar to that of the prior cohort.
IVIG Reduces Costly Outlier Cases
The case-control and randomized trial groups, yielding a combined 23 IVIG and 34 control patients, showed a median cost per case of $22,578 (range $10,115-$70,929) and $22,645 (range $4723-$279,797) for the IVIG and control groups, respectively. Cases with a cost >$80,000 were 0/23 (0%) vs 8/34 (24%) in the IVIG and control groups, respectively (P = .016, Fisher exact test).
Improving care while simultaneously keeping care costs below reimbursement payment levels received from third-party payers is paramount to the financial survival of health care systems. IVIG appears to do this by reducing the number of patients with COVID-19 who progress to ICU care. We compared the costs of care of our combined case-control and randomized trial cohorts to published data on average reimbursements hospitals receive for COVID-19 care from Medicaid, Medicare, and private insurance (Figure).15 IVIG demonstrated a reduction in cases where costs exceed reimbursement. Indeed, a comparison of net revenue per case of the case-control group showed significantly higher revenue for the IVIG group compared to controls ($52,704 vs $34,712, P = .0338, Table 2).
Discussion
As reflected in at least 1 other study,16 our hospital had been successfully utilizing IVIG in the treatment of viral acute respiratory distress syndrome (ARDS) prior to COVID-19. Therefore, we moved quickly to perform a randomized, open-label pilot study of IVIG (Octagam 10%) in COVID-19, and noted significant clinical benefit that might translate into hospital cost savings.10 Over the course of the pandemic, evidence has accumulated that IVIG may play an important role in COVID-19 therapeutics, as summarized in a recent review.17 However, despite promising but inconsistent results, the relatively high acquisition costs of IVIG raised questions as to its pharmacoeconomic value, particularly with such a high volume of COVID-19 patients with hypoxia, in light of limited clinical data.
COVID-19 therapeutics data can be categorized into either high-quality trials showing marginal benefit for some agents or low-quality trials showing greater benefit for other agents, with IVIG studies falling into the latter category.18 This phenomenon may speak to the pathophysiological heterogeneity of the COVID-19 patient population. High-quality trials enrolling broad patient types lack the granularity to capture and single out relevant patient subsets who would derive maximal therapeutic benefit, with those subsets diluted by other patient types for which no benefit is seen. Meanwhile, the more granular low-quality trials are criticized as underpowered and lacking in translatability to practice.
Positive results from our pilot trial allowed the use of IVIG (Privigen) off-label in hospitalized COVID-19 patients restricted to specific criteria. Patients had to be moderately to severely ill, requiring >3 L of oxygen via nasal cannula; show high risk of clinical deterioration based on respiratory rate and decline in respiratory status; and have underlying comorbidities (such as hypertension, obesity, or diabetes mellitus). However, older patients (>age 70 years) and those with underlying comorbidities marked by organ failure (such as heart failure, renal failure, dementia, or receipt of organ transplant) and active malignancy were excluded, as their clinical outcome in COVID-19 may be considered less modifiable by therapeutics, while simultaneously carrying potentially a higher risk of adverse events from IVIG (volume overload, renal failure). These exclusions are reflected in the overall low Charlson comorbidity index (mean of 1) of the patients in the case-control study arm. As anticipated, we found a net cost reduction: $20,449 (48%) per case among the 10 IVIG-treated patients compared to the 20 matched controls.
We then went back to the patients from the randomized prospective trial and compared costs for the 13 of 16 IVIG patients and 14 of 17 of the control patients for whom data were available. Among untreated controls, we found a net cost reduction of $34,439 (55%) per case. The higher costs seen in the randomized patient cohort compared to the latter case-control group may be due to a combination of the fact that the treated patients had slightly higher comorbidity indices than the case-control group (median Charlson comorbidity index of 2 in both groups) and the fact that they were treated earlier in the pandemic (May/June 2020), as opposed to the case-control group patients, who were treated in November/December 2020.
It was notable that the cost savings across both groups were derived largely from the reduction in the approximately 20% to 25% of control patients who went on to critical illness, including mechanical ventilation, extracorporeal membrane oxygenation (ECMO), and prolonged ICU stays. Indeed, 8 of 34 of the control patients—but none of the 23 IVIG-treated patients—generated hospital costs in excess of $80,000, a difference that was statistically significant even for such a small sample size. Therefore, reducing these very costly outlier events translated into net savings across the board.
In addition to lowering costs, reducing progression to critical illness is extremely important during heavy waves of COVID-19, when the sheer volume of patients results in severe strain due to the relative scarcity of ICU beds, mechanical ventilators, and ECMO. Therefore, reducing the need for these resources would have a vital role that cannot be measured economically.
The major limitations of this study include the small sample size and the potential lack of generalizability of these results to all hospital centers and treating providers. Our group has considerable experience in IVIG utilization in COVID-19 and, as a result, has identified a “sweet spot,” where benefits were seen clinically and economically. However, it remains to be determined whether IVIG will benefit patients with greater illness severity, such as those in the ICU, on mechanical ventilation, or ECMO. Furthermore, while a significant morbidity and mortality burden of COVID-19 rests in extremely elderly patients and those with end-organ comorbidities such as renal failure and heart failure, it is uncertain whether their COVID-19 adverse outcomes can be improved with IVIG or other therapies. We believe such patients may limit the pharmacoeconomic value of IVIG due to their generally poorer prognosis, regardless of intervention. On the other hand, COVID-19 patients who are not that severely ill, with minimal to no hypoxia, generally will do well regardless of therapy. Therefore, IVIG intervention may be an unnecessary treatment expense. Evidence for this was suggested in our pilot trial10 and supported in a recent meta-analysis of IVIG therapy in COVID-19.19
Several other therapeutic options with high acquisition costs have seen an increase in use during the COVID-19 pandemic despite relatively lukewarm data. Remdesivir, the first drug found to have a beneficial effect on hospitalized patients with COVID-19, is priced at $3120 for a complete 5-day treatment course in the United States. This was in line with initial pricing models from the Institute for Clinical and Economic Review (ICER) in May 2020, assuming a mortality benefit with remdesivir use. After the SOLIDARITY trial was published, which showed no mortality benefit associated with remdesivir, ICER updated their pricing models in June 2020 and released a statement that the price of remdesivir was too high to align with demonstrated benefits.20,21 More recent data demonstrate that remdesivir may be beneficial, but only if administered to patients with fewer than 6 days of symptoms.22 However, only a minority of patients present to the hospital early enough in their illness for remdesivir to be beneficial.22
Tocilizumab, an interleukin-6 inhibitor, saw an increase in use during the pandemic. An 800-mg treatment course for COVID-19 costs $3584. The efficacy of this treatment option came into question after the COVACTA trial failed to show a difference in clinical status or mortality in COVID-19 patients who received tocilizumab vs placebo.23,24 A more recent study pointed to a survival benefit of tocilizumab in COVID-19, driven by a very large sample size (>4000), yielding statistically significant, but perhaps clinically less significant, effects on survival.25 This latter study points to the extremely large sample sizes required to capture statistically significant benefits of expensive interventions in COVID-19, which our data demonstrate may benefit only a fraction of patients (20%-25% of patients in the case of IVIG). A more granular clinical assessment of these other interventions is needed to be able to capture the patient subtypes where tocilizumab, remdesivir, and other therapies will be cost effective in the treatment of COVID-19 or other virally mediated cases of ARDS.
Conclusion
While IVIG has a high acquisition cost, the drug’s use in hypoxic COVID-19 patients resulted in reduced costs per COVID-19 case of approximately 50% and use of less critical care resources. The difference was consistent between 2 cohorts (randomized trial vs off-label use in prespecified COVID-19 patient types), IVIG products used (Octagam 10% and Privigen), and time period in the pandemic (waves 1 and 2 in May/June 2020 vs wave 3 in November/December 2020), thereby adjusting for potential differences in circulating viral strains. Furthermore, patients from both groups predated SARS-CoV-2 vaccine availability and major circulating viral variants (eg, delta, omicron), thereby eliminating confounding on outcomes posed by these factors. Control patients’ higher costs of care were driven largely by the approximately 25% of patients who required costly hospital critical care resources, a group mitigated by IVIG. When allocated to the appropriate patient type (patients with moderate-to-severe but not critical illness, <age 70 without preexisting comorbidities of end-organ failure or active cancer), IVIG can reduce hospital costs for COVID-19 care. Identification of specific patient populations where IVIG has the most anticipated benefits in viral illness is needed.
Corresponding author: George Sakoulas, MD, Sharp Rees-Stealy Medical Group, 2020 Genesee Avenue, 2nd Floor, San Diego, CA 92123; [email protected]
Disclosures: Dr Sakoulas has worked as a consultant for Abbvie, Paratek, and Octapharma, has served as a speaker for Abbvie and Paratek, and has received research funding from Octapharma. The other authors did not report any disclosures.
1. Galeotti C, Kaveri SV, Bayry J. IVIG-mediated effector functions in autoimmune and inflammatory diseases. Int Immunol. 2017;29(11):491-498. doi:10.1093/intimm/dxx039
2. Verdoni L, Mazza A, Gervasoni A, et al. An outbreak of severe Kawasaki-like disease at the Italian epicentre of the SARS-CoV-2 epidemic: an observational cohort study. Lancet. 2020;395(10239):1771-1778. doi:10.1016/S0140-6736(20)31103-X
3. Belhadjer Z, Méot M, Bajolle F, et al. Acute heart failure in multisystem inflammatory syndrome in children in the context of global SARS-CoV-2 pandemic. Circulation. 2020;142(5):429-436. doi:10.1161/CIRCULATIONAHA.120.048360
4. Shao Z, Feng Y, Zhong L, et al. Clinical efficacy of intravenous immunoglobulin therapy in critical ill patients with COVID-19: a multicenter retrospective cohort study. Clin Transl Immunology. 2020;9(10):e1192. doi:10.1002/cti2.1192
5. Xie Y, Cao S, Dong H, et al. Effect of regular intravenous immunoglobulin therapy on prognosis of severe pneumonia in patients with COVID-19. J Infect. 2020;81(2):318-356. doi:10.1016/j.jinf.2020.03.044
6. Zhou ZG, Xie SM, Zhang J, et al. Short-term moderate-dose corticosteroid plus immunoglobulin effectively reverses COVID-19 patients who have failed low-dose therapy. Preprints. 2020:2020030065. doi:10.20944/preprints202003.0065.v1
7. Cao W, Liu X, Bai T, et al. High-dose intravenous immunoglobulin as a therapeutic option for deteriorating patients with coronavirus disease 2019. Open Forum Infect Dis. 2020;7(3):ofaa102. doi:10.1093/ofid/ofaa102
8. Cao W, Liu X, Hong K, et al. High-dose intravenous immunoglobulin in severe coronavirus disease 2019: a multicenter retrospective study in China. Front Immunol. 2021;12:627844. doi:10.3389/fimmu.2021.627844
9. Gharebaghi N, Nejadrahim R, Mousavi SJ, Sadat-Ebrahimi SR, Hajizadeh R. The use of intravenous immunoglobulin gamma for the treatment of severe coronavirus disease 2019: a randomized placebo-controlled double-blind clinical trial. BMC Infect Dis. 2020;20(1):786. doi:10.1186/s12879-020-05507-4
10. Sakoulas G, Geriak M, Kullar R, et al. Intravenous immunoglobulin plus methylprednisolone mitigate respiratory morbidity in coronavirus disease 2019. Crit Care Explor. 2020;2(11):e0280. doi:10.1097/CCE.0000000000000280
11. Raman RS, Bhagwan Barge V, Anil Kumar D, et al. A phase II safety and efficacy study on prognosis of moderate pneumonia in coronavirus disease 2019 patients with regular intravenous immunoglobulin therapy. J Infect Dis. 2021;223(9):1538-1543. doi:10.1093/infdis/jiab098
12. Mazeraud A, Jamme M, Mancusi RL, et al. Intravenous immunoglobulins in patients with COVID-19-associated moderate-to-severe acute respiratory distress syndrome (ICAR): multicentre, double-blind, placebo-controlled, phase 3 trial. Lancet Respir Med. 2022;10(2):158-166. doi:10.1016/S2213-2600(21)00440-9
13. Kindgen-Milles D, Feldt T, Jensen BEO, Dimski T, Brandenburger T. Why the application of IVIG might be beneficial in patients with COVID-19. Lancet Respir Med. 2022;10(2):e15. doi:10.1016/S2213-2600(21)00549-X
14. Wilfong EM, Matthay MA. Intravenous immunoglobulin therapy for COVID-19 ARDS. Lancet Respir Med. 2022;10(2):123-125. doi:10.1016/S2213-2600(21)00450-1
15. Bazell C, Kramer M, Mraz M, Silseth S. How much are hospitals paid for inpatient COVID-19 treatment? June 2020. https://us.milliman.com/-/media/milliman/pdfs/articles/how-much-hospitals-paid-for-inpatient-covid19-treatment.ashx
16. Liu X, Cao W, Li T. High-dose intravenous immunoglobulins in the treatment of severe acute viral pneumonia: the known mechanisms and clinical effects. Front Immunol. 2020;11:1660. doi:10.3389/fimmu.2020.01660
17. Danieli MG, Piga MA, Paladini A, et al. Intravenous immunoglobulin as an important adjunct in prevention and therapy of coronavirus 19 disease. Scand J Immunol. 2021;94(5):e13101. doi:10.1111/sji.13101
18. Starshinova A, Malkova A, Zinchenko U, et al. Efficacy of different types of therapy for COVID-19: a comprehensive review. Life (Basel). 2021;11(8):753. doi:10.3390/life11080753
19. Xiang HR, Cheng X, Li Y, Luo WW, Zhang QZ, Peng WX. Efficacy of IVIG (intravenous immunoglobulin) for corona virus disease 2019 (COVID-19): a meta-analysis. Int Immunopharmacol. 2021;96:107732. doi:10.1016/j.intimp.2021.107732
20. ICER’s second update to pricing models of remdesivir for COVID-19. PharmacoEcon Outcomes News. 2020;867(1):2. doi:10.1007/s40274-020-7299-y
21. Pan H, Peto R, Henao-Restrepo AM, et al. Repurposed antiviral drugs for Covid-19—interim WHO solidarity trial results. N Engl J Med. 2021;384(6):497-511. doi:10.1056/NEJMoa2023184
22. Garcia-Vidal C, Alonso R, Camon AM, et al. Impact of remdesivir according to the pre-admission symptom duration in patients with COVID-19. J Antimicrob Chemother. 2021;76(12):3296-3302. doi:10.1093/jac/dkab321
23. Golimumab (Simponi) IV: In combination with methotrexate (MTX) for the treatment of adult patients with moderately to severely active rheumatoid arthritis [Internet]. Canadian Agency for Drugs and Technologies in Health; 2015. Table 1: Cost comparison table for biologic disease-modifying antirheumatic drugs. https://www.ncbi.nlm.nih.gov/books/NBK349397/table/T34/
24. Rosas IO, Bräu N, Waters M, et al. Tocilizumab in hospitalized patients with severe Covid-19 pneumonia. N Engl J Med. 2021;384(16):1503-1516. doi:10.1056/NEJMoa2028700
25. RECOVERY Collaborative Group. Tocilizumab in patients admitted to hospital with COVID-19 (RECOVERY): a randomised, controlled, open-label, platform trial. Lancet. 2021;397(10285):1637-1645. doi:10.1016/S0140-6736(21)00676-0
Skin Cancer Education in the Medical School Curriculum
To the Editor:
Skin cancer represents a notable health care burden of rising incidence.1-3 Nondermatologist health care providers play a key role in skin cancer screening through the use of skin cancer examination (SCE)1,4; however, several factors including poor diagnostic accuracy, low confidence, and lack of training have contributed to limited use of the SCE by these providers.4,5 Therefore, it is important to identify and implement changes in the medical school curriculum that can facilitate improved use of SCE in clinical practice. We sought to examine factors in the medical school curriculum that influence skin cancer education.
A voluntary electronic survey was distributed through class email and social media to all medical student classes at 4 medical schools (Figure). Responses were collected between March 2 and April 20, 2020. Survey items assessed demographics and curricular factors that influence skin cancer education.

Knowledge of the clinical features of melanoma was assessed by asking participants to correctly identify at least 5 of 6 pigmented lesions as concerning or not concerning for melanoma. Confidence in performing the SCE—the primary outcome—was measured by dichotomizing a 4-point Likert-type scale (“very confident” and “moderately confident” against “slightly confident” and “not at all confident”).
Logistic regression was used to examine curricular factors associated with confidence; descriptive statistics were used for remaining analyses. Analyses were performed using SAS 9.4 statistical software. Prior to analysis, responses from the University of South Carolina School of Medicine Greenville were excluded because the response rate was less than 20%.
The survey was distributed to 1524 students; 619 (40.6%) answered at least 1 question, with a variable response rate to each item (eTable 1). Most respondents were female (351 [56.7%]); 438 (70.8%) were White.


Most respondents said that they received 3 hours or less of general skin cancer (74.9%) or SCE-specific (93.0%) education by the end of their fourth year of medical training. Lecture was the most common method of instruction. Education was provided most often by dermatologists (48.6%), followed by general practice physicians (21.2%). Numerous (26.9%) fourth-year respondents reported that they had never observed SCE; even more (47.6%) had never performed SCE. Almost half of second- and third-year students (43.2% and 44.8%, respectively) considered themselves knowledgeable about the clinical features of melanoma, but only 31.9% of fourth-year students considered themselves knowledgeable.
Only 24.1% of fourth-year students reported confidence performing SCE (eTable 1). Students who received most of their instruction through real clinical encounters were 4.14 times more likely to be confident performing SCE than students who had been given lecture-based learning. Students who performed 1 to 3 SCE or 4 or more SCE were 3.02 and 32.25 times, respectively, more likely to be confident than students who had never performed SCE (eTable 2).


Consistent with a recent study,6 our results reflect the discrepancy between the burden and education of skin cancer. This is especially demonstrated by our cohort’s low confidence in performing SCE, a metric associated with both intention to perform and actual performance of SCE in practice.4,5 We also observed a downward trend in knowledge among students who were about to enter residency, potentially indicating the need for longitudinal training.
Given curricular time constraints, it is essential that medical schools implement changes in learning that will have the greatest impact. Although our results strongly support the efficacy of hands-on clinical training, exposure to dermatology in the second half of medical school training is limited nationwide.6 Concentrated efforts to increase clinical exposure might help prepare future physicians in all specialties to combat the burden of this disease.
Limitations of our study include the potential for selection and recall biases. Although our survey spanned multiple institutions in different regions of the United States, results might not be universally representative.
Acknowledgments—We thank Dirk Elston, MD, and Amy Wahlquist, MS (both from Charleston, South Carolina), who helped facilitate the survey on which our research is based. We also acknowledge the assistance of Philip Carmon, MD (Columbia, South Carolina); Julie Flugel (Columbia, South Carolina); Algimantas Simpson, MD (Columbia, South Carolina); Nathan Jasperse, MD (Irvine, California); Jeremy Teruel, MD (Charleston, South Carolina); Alan Snyder, MD, MSCR (Charleston, South Carolina); John Bosland (Charleston, South Carolina); and Daniel Spangler (Greenville, South Carolina).
- Guy GP Jr, Machlin SR, Ekwueme DU, et al. Prevalence and costs of skin cancer treatment in the U.S., 2002–2006 and 2007-2011. Am J Prev Med. 2015;48:183-187. doi:10.1016/j.amepre.2014.08.036
- Paulson KG, Gupta D, Kim TS, et al. Age-specific incidence of melanoma in the United States. JAMA Dermatol. 2020;156:57-64. doi:10.1001/jamadermatol.2019.3353
- Lim HW, Collins SAB, Resneck JS Jr, et al. Contribution of health care factors to the burden of skin disease in the United States. J Am Acad Dermatol. 2017;76:1151-1160.e21. doi:10.1016/j.jaad.2017.03.006
- Garg A, Wang J, Reddy SB, et al; Integrated Skin Exam Consortium. Curricular factors associated with medical students’ practice of the skin cancer examination: an educational enhancement initiative by the Integrated Skin Exam Consortium. JAMA Dermatol. 2014;150:850-855. doi:10.1001/jamadermatol.2013.8723
- Oliveria SA, Heneghan MK, Cushman LF, et al. Skin cancer screening by dermatologists, family practitioners, and internists: barriers and facilitating factors. Arch Dermatol. 2011;147:39-44. doi:10.1001/archdermatol.2010.414
- Cahn BA, Harper HE, Halverstam CP, et al. Current status of dermatologic education in US medical schools. JAMA Dermatol. 2020;156:468-470. doi:10.1001/jamadermatol.2020.0006
To the Editor:
Skin cancer represents a notable health care burden of rising incidence.1-3 Nondermatologist health care providers play a key role in skin cancer screening through the use of skin cancer examination (SCE)1,4; however, several factors including poor diagnostic accuracy, low confidence, and lack of training have contributed to limited use of the SCE by these providers.4,5 Therefore, it is important to identify and implement changes in the medical school curriculum that can facilitate improved use of SCE in clinical practice. We sought to examine factors in the medical school curriculum that influence skin cancer education.
A voluntary electronic survey was distributed through class email and social media to all medical student classes at 4 medical schools (Figure). Responses were collected between March 2 and April 20, 2020. Survey items assessed demographics and curricular factors that influence skin cancer education.
Knowledge of the clinical features of melanoma was assessed by asking participants to correctly identify at least 5 of 6 pigmented lesions as concerning or not concerning for melanoma. Confidence in performing the SCE—the primary outcome—was measured by dichotomizing a 4-point Likert-type scale (“very confident” and “moderately confident” against “slightly confident” and “not at all confident”).
Logistic regression was used to examine curricular factors associated with confidence; descriptive statistics were used for remaining analyses. Analyses were performed using SAS 9.4 statistical software. Prior to analysis, responses from the University of South Carolina School of Medicine Greenville were excluded because the response rate was less than 20%.
The survey was distributed to 1524 students; 619 (40.6%) answered at least 1 question, with a variable response rate to each item (eTable 1). Most respondents were female (351 [56.7%]); 438 (70.8%) were White.
Most respondents said that they received 3 hours or less of general skin cancer (74.9%) or SCE-specific (93.0%) education by the end of their fourth year of medical training. Lecture was the most common method of instruction. Education was provided most often by dermatologists (48.6%), followed by general practice physicians (21.2%). Numerous (26.9%) fourth-year respondents reported that they had never observed SCE; even more (47.6%) had never performed SCE. Almost half of second- and third-year students (43.2% and 44.8%, respectively) considered themselves knowledgeable about the clinical features of melanoma, but only 31.9% of fourth-year students considered themselves knowledgeable.
Only 24.1% of fourth-year students reported confidence performing SCE (eTable 1). Students who received most of their instruction through real clinical encounters were 4.14 times more likely to be confident performing SCE than students who had been given lecture-based learning. Students who performed 1 to 3 SCE or 4 or more SCE were 3.02 and 32.25 times, respectively, more likely to be confident than students who had never performed SCE (eTable 2).
Consistent with a recent study,6 our results reflect the discrepancy between the burden and education of skin cancer. This is especially demonstrated by our cohort’s low confidence in performing SCE, a metric associated with both intention to perform and actual performance of SCE in practice.4,5 We also observed a downward trend in knowledge among students who were about to enter residency, potentially indicating the need for longitudinal training.
Given curricular time constraints, it is essential that medical schools implement changes in learning that will have the greatest impact. Although our results strongly support the efficacy of hands-on clinical training, exposure to dermatology in the second half of medical school training is limited nationwide.6 Concentrated efforts to increase clinical exposure might help prepare future physicians in all specialties to combat the burden of this disease.
Limitations of our study include the potential for selection and recall biases. Although our survey spanned multiple institutions in different regions of the United States, results might not be universally representative.
Acknowledgments—We thank Dirk Elston, MD, and Amy Wahlquist, MS (both from Charleston, South Carolina), who helped facilitate the survey on which our research is based. We also acknowledge the assistance of Philip Carmon, MD (Columbia, South Carolina); Julie Flugel (Columbia, South Carolina); Algimantas Simpson, MD (Columbia, South Carolina); Nathan Jasperse, MD (Irvine, California); Jeremy Teruel, MD (Charleston, South Carolina); Alan Snyder, MD, MSCR (Charleston, South Carolina); John Bosland (Charleston, South Carolina); and Daniel Spangler (Greenville, South Carolina).
- Guy GP Jr, Machlin SR, Ekwueme DU, et al. Prevalence and costs of skin cancer treatment in the U.S., 2002–2006 and 2007-2011. Am J Prev Med. 2015;48:183-187. doi:10.1016/j.amepre.2014.08.036
- Paulson KG, Gupta D, Kim TS, et al. Age-specific incidence of melanoma in the United States. JAMA Dermatol. 2020;156:57-64. doi:10.1001/jamadermatol.2019.3353
- Lim HW, Collins SAB, Resneck JS Jr, et al. Contribution of health care factors to the burden of skin disease in the United States. J Am Acad Dermatol. 2017;76:1151-1160.e21. doi:10.1016/j.jaad.2017.03.006
- Garg A, Wang J, Reddy SB, et al; Integrated Skin Exam Consortium. Curricular factors associated with medical students’ practice of the skin cancer examination: an educational enhancement initiative by the Integrated Skin Exam Consortium. JAMA Dermatol. 2014;150:850-855. doi:10.1001/jamadermatol.2013.8723
- Oliveria SA, Heneghan MK, Cushman LF, et al. Skin cancer screening by dermatologists, family practitioners, and internists: barriers and facilitating factors. Arch Dermatol. 2011;147:39-44. doi:10.1001/archdermatol.2010.414
- Cahn BA, Harper HE, Halverstam CP, et al. Current status of dermatologic education in US medical schools. JAMA Dermatol. 2020;156:468-470. doi:10.1001/jamadermatol.2020.0006
Practice Points
- Nondermatologist practitioners play a notable role in mitigating the health care burden of skin cancer by screening with the skin cancer examination.
- Exposure to the skin cancer examination should occur during medical school prior to graduates’ entering diverse specialties.
- Most medical students received relatively few hours of skin cancer education, and many never performed or even observed a skin cancer examination prior to graduating medical school.
- Increasing hands-on training and clinical exposure during medical school is imperative to adequately prepare future physicians.
Applicability of the USPSTF Lung Cancer Screening Guidelines in a Predominantly Black Veteran Population
Lung cancer is the leading cause of cancer death in the United States.1 The 2011 National Lung Screening Trial (NLST) demonstrated that low-dose computed tomography (LDCT) screening provided a 20% relative reduction in lung cancer–specific mortality.2 Based on these findings, the United States Preventive Services Task Force (USPSTF) published lung cancer screening guidelines in 2013 recommending an annual LDCT of the thorax in patients aged 55 to 80 years with a 30 pack-year smoking history and who currently smoke or quit within the past 15 years.
In 2021, the USPSTF updated its recommendations by reducing the qualifications for annual screening to a 20 pack-year smoking history.3 The updated guidelines recognized the increased risk of lung cancer for Black individuals.4,5 Evidence suggests the 2013 screening criteria was too conservative for this population.6,7
Similarly, US Department of Veteran Affairs (VA) patients are a population at higher risk for lung cancer due to a male predominance, presence of comorbidities, exposure to carcinogenic agents, and possibly a higher prevalence of tobacco smoking.8 This study sought to examine the applicability of the USPSTF guidelines in a VA health care system with a predominantly Black population.
Methods
A retrospective chart review of adult patients who were diagnosed and treated with early-stage small cell or non–small cell lung cancer (stage I or II) was performed within the Southeast Louisiana Veterans Health Care System (SLVHCS) in New Orleans. The review used data from the VA Cancer Registry from January 1, 2005, through December 31, 2017. Patients were grouped by whether they met 2013 USPSTF screening criteria at time of diagnosis vs those that did not. Data collected included type and stage of lung cancer at time of diagnosis, context of diagnosis (incidental, screening, symptomatic), diagnostic method, smoking history, and presence of chronic obstructive pulmonary disease (COPD). Patients without a clear smoking history documented in the health record were excluded.
Statistical analyses were performed with GraphPad Prism 8.0. Student t test and Fischer exact test were performed for most of the statistical analyses, with differences between groups noted to be statistically significant at a P < .05.
Results
A total of 182 patient charts were reviewed and 13 patients were excluded for missing information related to the USPSTF screening criteria. Of the 169 patients included, 122 (72%) met USPSTF screening criteria while 47 (28%) patients did not. The reasons for not meeting screening criteria were 14 patients were too young at and 9 patients were too old at time of diagnosis, 7 had a < 20 pack-year smoking history, 7 patients had quit > 15 years previously, and 12 patients met multiple exclusion criteria. The study population was 96% male and there was an overall predominance of Black patients (58%) within the sample (Table).
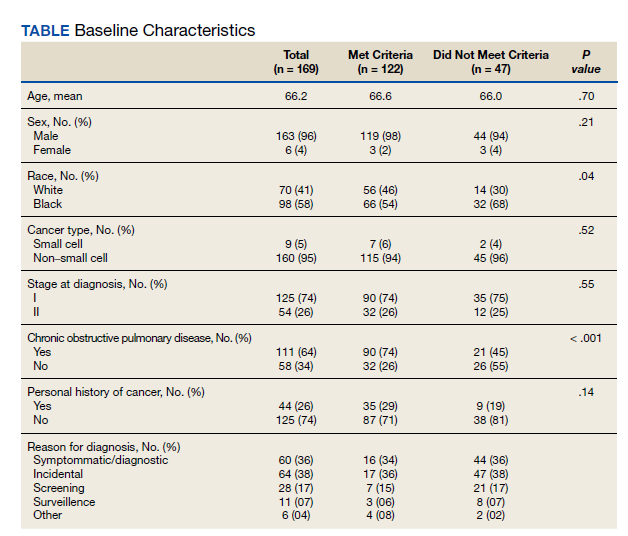
There was a significantly higher proportion of Black patients in the group that did not meet screening criteria compared with the group that met screening criteria (68% vs 54%, P = .04). Cancer type and stage at diagnosis were similar in both patient populations. There was a statistically significant difference in COPD diagnosis between the groups, with a larger proportion of COPD patients in the met screening criteria group (74% vs 45%, P < .001). The mean smoking history was 61.4 pack-years in the met criteria group and 43.3 pack-years in the did not meet criteria group.
Five additional patients in the group that did not meet the 2013 USPSTF screening criteria would have met criteria if the 2021 USPSTF guidelines were applied. All 5 were Black patients. Using the 2021 guidelines, Black patients would have made up 56% of the patients who met screening criteria and 54% of the patients who did not meet screening criteria at time of diagnosis.
Discussion
This study sought to determine the hypothetical effectiveness of national lung cancer screening guidelines in detecting early-stage lung cancer for a high-risk population. Patients diagnosed with early-stage lung cancer were selected as these patients have improved outcomes with treatment, and thus would theoretically benefit from early detection through screening. As expected, the study population had a majority of Black veterans (58%), with a higher proportion of Black patients in the did not meet screening criteria group compared with the met screening criteria group (68% vs 54%, P = .04). This difference highlights the concern that Black individuals were being underscreened with the 2013 USPSTF guidelines.7 This is not all surprising as the NLST, from which the initial screening guidelines were based, included a majority White population with only 4.4% of their population being Black.2 The USPSTF also cites the NELSON trial as evidence to support annual lung cancer screening, a trial that was performed in the Netherlands with a very different population compared with that of southeast Louisiana.9
Given concern that the old criteria were underscreening certain populations, the updated 2021 USPSTF guidelines sought to expand the screening population. In this study, the implementation of these new guidelines resulted in more Black patients meeting screening criteria.
Racial and ethnic disparities in health care in the US are no secret, as Black individuals consistently have increased disease and death rates, higher rates of unemployment, and decreased access to preventive medical care compared to White individuals.10 Despite the updated USPSTF guidelines, additional modifications to the screening criteria could improve the ability to identify high-risk patients. A modified model using data from the Prostate, Lung, Colorectal, and Ovarian Screening Trial (PLCO) incorporating COPD history, race and ethnicity, and personal history of cancer increased the sensitivity for high-risk Black ever-smokers.11 Additional models and analyses also support the utility of incorporating race and ethnicity in lung cancer screening criteria.7,12 Using race and ethnicity to guide screening criteria for cancer is not unheard of; in 2017, the US Multi-Society Task Force recommended that Black individuals start colon cancer screening at age 45 years rather than the typical age of 50 years, before updating the guidelines again in 2021 to recommend that all adults start at age 45 years.13,14
Limitations
This study had the inherent weakness of being a retrospective study at a single institution. Additionally, the 7th edition of the International Association for the Study of Lung Cancer was published in 2010, during the 2005 to 2017 time frame from which our data was collected, leading to possible inconsistencies in staging between patients before and after 2010.15 However, these changes in staging are unlikely to significantly impact the results for in this study, since the vast majority of the patients diagnosed with lung cancer stage I or II before 2010 would still be in the those 2 stages in the 2010 edition. Finally, specific to our patient population, it was often difficult to ascertain an accurate smoking history for each patient, especially in the early years of the data set, likely due to the disruption of care caused by Hurricane Katrina.
Conclusions
In this retrospective study performed at the SLVHCS in New Orleans, a significantly higher proportion of Black patients compared with White patients with early-stage lung cancer did not meet the 2013 USPSTF lung cancer screening guidelines at time of diagnosis, highlighting the concern that this population was being underscreened. These findings demonstrate the challenges and failures of applying national guidelines to a unique, high-risk population. An individualized, risk-based screening model incorporating race and ethnicity could be more effective at diagnosing early-stage lung cancer and requires more investigation. Centralized lung cancer screening programs within the VA system could also be beneficial for early detection and treatment, as well as provide insight into the increased risk within the veteran population.
1. Siegel RL, Miller KD, Jemal A. Cancer statistics, 2020. CA Cancer J Clin 2020;70:7-30. doi:10.3322/caac.21590
2. National Lung Screening Trial Research Team, Aberle DR, Adams AM, et al. Reduced lung-cancer mortality with low-dose computed tomographic screening. N Engl J Med. 2011;365(5):395-409. doi:10.1056/NEJMoa110287
3. US Preventive Services Task Force, Krist AH, Davidson KW, et al. Screening for lung cancer: US Preventive Services Task Force recommendation statement. JAMA. 2021;325(10):962-970. doi:10.1001/jama.2021.1117
4. Jonas DE, Reuland DS, Reddy SM, et al. Screening for lung cancer with low-dose computed tomography: updated evidence report and systematic review for the US Preventive Services Task Force. JAMA. 2021;325(10):971-987. doi:10.1001/jama.2021.0377
5. Haiman CA, Stram DO, Wilkens LR, et al. Ethnic and racial differences in the smoking-related risk of lung cancer. N Engl J Med. 2006;354(4):333-342. doi:10.1056/NEJMoa033250
6. DeSantis CE, Miller KD, Goding Sauer A, Jemal A, Siegel RL. Cancer statistics for African Americans, 2019. CA Cancer J Clin. 2019;69(3):211-233. doi:10.3322/caac.21555
7. Aldrich MC, Mercaldo SF, Sandler KL, Blot WJ, Grogan EL, Blume JD. Evaluation of USPSTF Lung Cancer Screening Guidelines among African American adult smokers. JAMA Oncol. 2019;5(9):1318-1324. doi:10.1001/jamaoncol.2019.1402
8. Brown DW. Smoking prevalence among US veterans. J Gen Intern Med. 2010;25(2):147-149. doi:10.1007/s11606-009-1160-0
9. de Koning HJ, van der Aalst CM, de Jong PA, et al. Reduced lung-cancer mortality with volume CT screening in a randomized trial. N Engl J Med. 2020;382(6):503-513. doi:10.1056/NEJMoa1911793
10. Williams DR, Rucker TD. Understanding and addressing racial disparities in health care. Health Care Financ Rev. 2000;21(4):75-90.
11. Pasquinelli MM, Tammemägi MC, Kovitz KL, et al. Risk prediction model versus United States Preventive Services Task Force lung cancer screening eligibility criteria: reducing race disparities. J Thorac Oncol. 2020;15(11):1738-1747. doi:10.1016/j.jtho.2020.08.006
12. Ten Haaf K, Bastani M, Cao P, et al. A comparative modeling analysis of risk-based lung cancer screening strategies. J Natl Cancer Inst. 2020;112(5):466-479. doi:10.1093/jnci/djz164
13. Rex DK, Boland CR, Dominitz JA, et al. Colorectal cancer screening: recommendations for physicians and patients from the US Multi-Society Task Force on Colorectal Cancer. Gastroenterology. 2017;153(1):307-323. doi:10.1053/j.gastro.2017.05.013
14. US Preventive Services Task Force, Davidson KW, Barry MJ, et al. Screening for colorectal cancer: US Preventive Services Task Force recommendation statement. JAMA. 2021;325(19):1965-1977. doi:10.1001/jama.2021.6238
15. Mirsadraee S, Oswal D, Alizadeh Y, Caulo A, van Beek E Jr. The 7th lung cancer TNM classification and staging system: review of the changes and implications. World J Radiol. 2012;4(4):128-134. doi:10.4329/wjr.v4.i4.128
Lung cancer is the leading cause of cancer death in the United States.1 The 2011 National Lung Screening Trial (NLST) demonstrated that low-dose computed tomography (LDCT) screening provided a 20% relative reduction in lung cancer–specific mortality.2 Based on these findings, the United States Preventive Services Task Force (USPSTF) published lung cancer screening guidelines in 2013 recommending an annual LDCT of the thorax in patients aged 55 to 80 years with a 30 pack-year smoking history and who currently smoke or quit within the past 15 years.
In 2021, the USPSTF updated its recommendations by reducing the qualifications for annual screening to a 20 pack-year smoking history.3 The updated guidelines recognized the increased risk of lung cancer for Black individuals.4,5 Evidence suggests the 2013 screening criteria was too conservative for this population.6,7
Similarly, US Department of Veteran Affairs (VA) patients are a population at higher risk for lung cancer due to a male predominance, presence of comorbidities, exposure to carcinogenic agents, and possibly a higher prevalence of tobacco smoking.8 This study sought to examine the applicability of the USPSTF guidelines in a VA health care system with a predominantly Black population.
Methods
A retrospective chart review of adult patients who were diagnosed and treated with early-stage small cell or non–small cell lung cancer (stage I or II) was performed within the Southeast Louisiana Veterans Health Care System (SLVHCS) in New Orleans. The review used data from the VA Cancer Registry from January 1, 2005, through December 31, 2017. Patients were grouped by whether they met 2013 USPSTF screening criteria at time of diagnosis vs those that did not. Data collected included type and stage of lung cancer at time of diagnosis, context of diagnosis (incidental, screening, symptomatic), diagnostic method, smoking history, and presence of chronic obstructive pulmonary disease (COPD). Patients without a clear smoking history documented in the health record were excluded.
Statistical analyses were performed with GraphPad Prism 8.0. Student t test and Fischer exact test were performed for most of the statistical analyses, with differences between groups noted to be statistically significant at a P < .05.
Results
A total of 182 patient charts were reviewed and 13 patients were excluded for missing information related to the USPSTF screening criteria. Of the 169 patients included, 122 (72%) met USPSTF screening criteria while 47 (28%) patients did not. The reasons for not meeting screening criteria were 14 patients were too young at and 9 patients were too old at time of diagnosis, 7 had a < 20 pack-year smoking history, 7 patients had quit > 15 years previously, and 12 patients met multiple exclusion criteria. The study population was 96% male and there was an overall predominance of Black patients (58%) within the sample (Table).
There was a significantly higher proportion of Black patients in the group that did not meet screening criteria compared with the group that met screening criteria (68% vs 54%, P = .04). Cancer type and stage at diagnosis were similar in both patient populations. There was a statistically significant difference in COPD diagnosis between the groups, with a larger proportion of COPD patients in the met screening criteria group (74% vs 45%, P < .001). The mean smoking history was 61.4 pack-years in the met criteria group and 43.3 pack-years in the did not meet criteria group.
Five additional patients in the group that did not meet the 2013 USPSTF screening criteria would have met criteria if the 2021 USPSTF guidelines were applied. All 5 were Black patients. Using the 2021 guidelines, Black patients would have made up 56% of the patients who met screening criteria and 54% of the patients who did not meet screening criteria at time of diagnosis.
Discussion
This study sought to determine the hypothetical effectiveness of national lung cancer screening guidelines in detecting early-stage lung cancer for a high-risk population. Patients diagnosed with early-stage lung cancer were selected as these patients have improved outcomes with treatment, and thus would theoretically benefit from early detection through screening. As expected, the study population had a majority of Black veterans (58%), with a higher proportion of Black patients in the did not meet screening criteria group compared with the met screening criteria group (68% vs 54%, P = .04). This difference highlights the concern that Black individuals were being underscreened with the 2013 USPSTF guidelines.7 This is not all surprising as the NLST, from which the initial screening guidelines were based, included a majority White population with only 4.4% of their population being Black.2 The USPSTF also cites the NELSON trial as evidence to support annual lung cancer screening, a trial that was performed in the Netherlands with a very different population compared with that of southeast Louisiana.9
Given concern that the old criteria were underscreening certain populations, the updated 2021 USPSTF guidelines sought to expand the screening population. In this study, the implementation of these new guidelines resulted in more Black patients meeting screening criteria.
Racial and ethnic disparities in health care in the US are no secret, as Black individuals consistently have increased disease and death rates, higher rates of unemployment, and decreased access to preventive medical care compared to White individuals.10 Despite the updated USPSTF guidelines, additional modifications to the screening criteria could improve the ability to identify high-risk patients. A modified model using data from the Prostate, Lung, Colorectal, and Ovarian Screening Trial (PLCO) incorporating COPD history, race and ethnicity, and personal history of cancer increased the sensitivity for high-risk Black ever-smokers.11 Additional models and analyses also support the utility of incorporating race and ethnicity in lung cancer screening criteria.7,12 Using race and ethnicity to guide screening criteria for cancer is not unheard of; in 2017, the US Multi-Society Task Force recommended that Black individuals start colon cancer screening at age 45 years rather than the typical age of 50 years, before updating the guidelines again in 2021 to recommend that all adults start at age 45 years.13,14
Limitations
This study had the inherent weakness of being a retrospective study at a single institution. Additionally, the 7th edition of the International Association for the Study of Lung Cancer was published in 2010, during the 2005 to 2017 time frame from which our data was collected, leading to possible inconsistencies in staging between patients before and after 2010.15 However, these changes in staging are unlikely to significantly impact the results for in this study, since the vast majority of the patients diagnosed with lung cancer stage I or II before 2010 would still be in the those 2 stages in the 2010 edition. Finally, specific to our patient population, it was often difficult to ascertain an accurate smoking history for each patient, especially in the early years of the data set, likely due to the disruption of care caused by Hurricane Katrina.
Conclusions
In this retrospective study performed at the SLVHCS in New Orleans, a significantly higher proportion of Black patients compared with White patients with early-stage lung cancer did not meet the 2013 USPSTF lung cancer screening guidelines at time of diagnosis, highlighting the concern that this population was being underscreened. These findings demonstrate the challenges and failures of applying national guidelines to a unique, high-risk population. An individualized, risk-based screening model incorporating race and ethnicity could be more effective at diagnosing early-stage lung cancer and requires more investigation. Centralized lung cancer screening programs within the VA system could also be beneficial for early detection and treatment, as well as provide insight into the increased risk within the veteran population.
1. Siegel RL, Miller KD, Jemal A. Cancer statistics, 2020. CA Cancer J Clin 2020;70:7-30. doi:10.3322/caac.21590
2. National Lung Screening Trial Research Team, Aberle DR, Adams AM, et al. Reduced lung-cancer mortality with low-dose computed tomographic screening. N Engl J Med. 2011;365(5):395-409. doi:10.1056/NEJMoa110287
3. US Preventive Services Task Force, Krist AH, Davidson KW, et al. Screening for lung cancer: US Preventive Services Task Force recommendation statement. JAMA. 2021;325(10):962-970. doi:10.1001/jama.2021.1117
4. Jonas DE, Reuland DS, Reddy SM, et al. Screening for lung cancer with low-dose computed tomography: updated evidence report and systematic review for the US Preventive Services Task Force. JAMA. 2021;325(10):971-987. doi:10.1001/jama.2021.0377
5. Haiman CA, Stram DO, Wilkens LR, et al. Ethnic and racial differences in the smoking-related risk of lung cancer. N Engl J Med. 2006;354(4):333-342. doi:10.1056/NEJMoa033250
6. DeSantis CE, Miller KD, Goding Sauer A, Jemal A, Siegel RL. Cancer statistics for African Americans, 2019. CA Cancer J Clin. 2019;69(3):211-233. doi:10.3322/caac.21555
7. Aldrich MC, Mercaldo SF, Sandler KL, Blot WJ, Grogan EL, Blume JD. Evaluation of USPSTF Lung Cancer Screening Guidelines among African American adult smokers. JAMA Oncol. 2019;5(9):1318-1324. doi:10.1001/jamaoncol.2019.1402
8. Brown DW. Smoking prevalence among US veterans. J Gen Intern Med. 2010;25(2):147-149. doi:10.1007/s11606-009-1160-0
9. de Koning HJ, van der Aalst CM, de Jong PA, et al. Reduced lung-cancer mortality with volume CT screening in a randomized trial. N Engl J Med. 2020;382(6):503-513. doi:10.1056/NEJMoa1911793
10. Williams DR, Rucker TD. Understanding and addressing racial disparities in health care. Health Care Financ Rev. 2000;21(4):75-90.
11. Pasquinelli MM, Tammemägi MC, Kovitz KL, et al. Risk prediction model versus United States Preventive Services Task Force lung cancer screening eligibility criteria: reducing race disparities. J Thorac Oncol. 2020;15(11):1738-1747. doi:10.1016/j.jtho.2020.08.006
12. Ten Haaf K, Bastani M, Cao P, et al. A comparative modeling analysis of risk-based lung cancer screening strategies. J Natl Cancer Inst. 2020;112(5):466-479. doi:10.1093/jnci/djz164
13. Rex DK, Boland CR, Dominitz JA, et al. Colorectal cancer screening: recommendations for physicians and patients from the US Multi-Society Task Force on Colorectal Cancer. Gastroenterology. 2017;153(1):307-323. doi:10.1053/j.gastro.2017.05.013
14. US Preventive Services Task Force, Davidson KW, Barry MJ, et al. Screening for colorectal cancer: US Preventive Services Task Force recommendation statement. JAMA. 2021;325(19):1965-1977. doi:10.1001/jama.2021.6238
15. Mirsadraee S, Oswal D, Alizadeh Y, Caulo A, van Beek E Jr. The 7th lung cancer TNM classification and staging system: review of the changes and implications. World J Radiol. 2012;4(4):128-134. doi:10.4329/wjr.v4.i4.128
Psychosocial Barriers and Their Impact on Hepatocellular Carcinoma Care in US Veterans: Tumor Board Model of Care
Hepatocellular carcinoma (HCC) remains a major global health problem and is the third leading cause of cancer-related mortality worldwide.1 Management of HCC is complex; as it largely occurs in the background of chronic liver disease, its management must simultaneously address challenges related to the patient’s tumor burden, as well as their underlying liver dysfunction and performance status. HCC is universally fatal without treatment, with a 5-year survival < 10%.2 However, if detected early HCC is potentially curable, with treatments such as hepatic resection, ablation, and/or liver transplantation, which are associated with 5-year survival rates as high as 70%.2 HCC-specific palliative treatments, including intra-arterial therapies (eg, trans-arterial chemoembolization, radioembolization) and systemic chemotherapy, have also been shown to prolong survival in patients with advanced HCC. Therefore, a key driver of patient survival is receipt of HCC-specific therapy.
There is rising incidence and mortality related to HCC in the US veteran population, largely attributed to acquisition of chronic hepatitis C virus (HCV) infection decades prior.3 There is also a high prevalence of psychosocial barriers in this population, such as low socioeconomic status, homelessness, alcohol and substance use disorders, and psychiatric disorders which can negatively influence receipt of medical treatment, including cancer care.4,5 Given the complexity of managing HCC, as well as the plethora of potential treatment options available, it is widely accepted that a multidisciplinary team approach, such as the multidisciplinary tumor board (MDTB) provides optimal care to patients with HCC.2,6 The aim of the present study was to identify in a population of veterans diagnosed with HCC the prevalence of psychosocial barriers to care and assess their impact and the role of an MDTB on receipt of HCC-specific care.
Methods
In June 2007, a joint institutional MDTB was established for patients with primary liver tumors receiving care at the William S. Middleton Memorial Veterans’ Hospital (WSMMVH) in Madison, Wisconsin. As we have described elsewhere, individual cases with their corresponding imaging studies were reviewed at a weekly conference attended by transplant hepatologists, medical oncologists, hepatobiliary and transplant surgeons, pathologists, diagnostic and interventional radiologists, and nurse coordinators.6 Potential therapies offered included surgical resection, liver transplantation (LT), thermal ablation, intra-arterial therapies (chemo and/or radioembolization), systemic chemotherapy, stereotactic radiation, and best supportive care. Decisions regarding the appropriate treatment modality were made based on patient factors, review of their cross-sectional imaging studies and/or histopathology, and context of their underlying liver dysfunction. The tumor board discussion was summarized in meeting minutes as well as tumor board encounters recorded in each patient’s health record. Although patients with benign tumors were presented at the MDTB, only patients with a diagnosis of HCC were included in this study.
A database analysis was conducted of all veteran patients with HCC managed through the WSMMVH MDTB, since its inception up to December 31, 2016, with follow-up until December 31, 2018. Data for analysis included demographics, laboratory parameters at time of diagnosis and treatment, imaging findings, histopathology and/or surgical pathology, treatment rendered, and follow-up information. The primary outcome measured in this study included receipt of any therapy and secondarily, patient survival.
Discrete variables were analyzed with χ2 statistics or Fisher exact test and continuous variables with the student t test. Multivariable analyses were carried out with logistic regression. Variables with a P < .05 were considered statistically significant. Analyses were carried out using IBM SPSS v24.0.
As a quality-improvement initiative for the care and management of veterans with HCC, this study was determined to be exempt from review by the WSMMVH and University of Wisconsin School of Medicine and Public Health Institutional Review Board.
Results
From January 1, 2007, through December 31, 2016, 149 patients with HCC were managed through the MDTB. Baseline demographic data, Model for End-stage Liver Disease (MELD) score and Child-Turcotte-Pugh class, and baseline HCC characteristics of the cohort are shown in Tables 1 and 2.

There was a high prevalence of psychosocial barriers in our study cohort, including alcohol or substance use disorder, mental illness diagnosis, and low socioeconomic status (Table 3). The mean distance traveled to WSMMVH for HCC-specific care was 206 km. Fifty patients in the cohort utilized travel assistance and 33 patients accessed lodging assistance.
HCC Treatments
There was a high rate of receipt of treatment in our study cohort with 127 (85%) patients receiving at least one HCC-specific therapy. Care was individualized and coordinated through our institutional MDTB, with both curative and palliative treatment modalities utilized (Table 4).
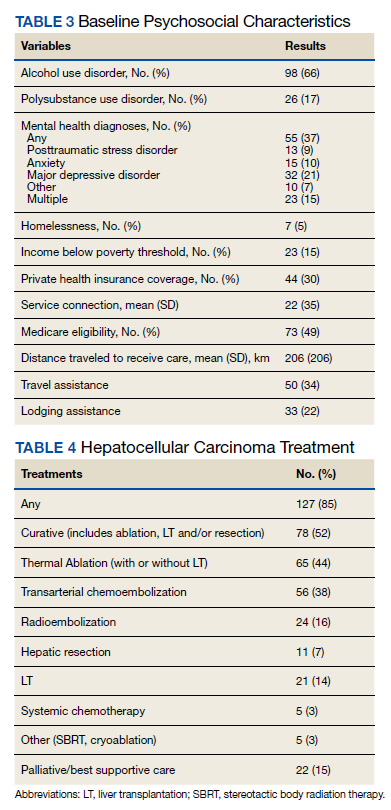
Curative treatment, which includes LT, ablation, or resection, was offered to 78 (52%) patients who were within T2 stage. Of these 78 patients who were potential candidates for LT as a curative treatment for HCC, 31 were not deemed suitable transplant candidates. Psychosocial barriers precluded consideration for LT in 7 of the 31 patients due to active substance use, homelessness in 1 patient, and severe mental illness in 3 patients. Medical comorbidities, advanced patient age, and patient preference accounted for the remainder.
In a univariate analysis of the cohort of 149 patients, factors that decreased the likelihood of receipt of curative HCC therapy included T2 stage or higher at diagnosis and a diagnosis of depression, whereas provision for lodging was associated with increased likelihood of receiving HCC-specific care (Table 5). Other factors that influenced receipt of any treatment included patient’s MELD score, total bilirubin, and serum α-fetoprotein, a surrogate marker for tumor stage. In the multivariable analysis, predictors of receiving curative therapy included absence of substance use, within T2 stage of tumor, and Child-Turcotte-Pugh class A cirrhosis. The presence of psychosocial barriers apart from substance use did not predict a lower chance of receiving curative HCC therapy (including homelessness, distance traveled to center, mental health disorder, and low income).
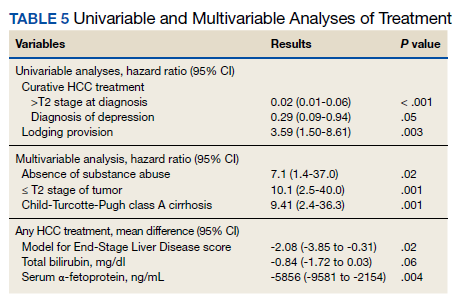
Median survival was 727 (95% CI, 488-966) days from diagnosis. Survival from HCC diagnosis in study cohort was 72% at 1 year, 50% at 2 years, 39% at 3 years, and 36% at 5 years. Death occurred in 71 (48%) patients; HCC accounted for death in 52 (73%) patients, complications of end-stage liver disease in 13 (18%) patients, and other causes for the remainder of patients.
Discussion
Increases in prevalence and mortality related to cirrhosis and HCC have been reported among the US veteran population.3 This is in large part attributable to the burden of chronic HCV infection in this population. As mirrored in the US population in general, we may be at a turning point regarding the gradual increase in prevalence in HCC.7 The prevalence of cirrhosis and viral-related HCC related to HCV infection will decline with availability of effective antiviral therapy. Alcoholic liver disease remains a main etiological factor for development of cirrhosis and HCC. Nonalcoholic fatty liver disease is becoming a more prevalent cause for development of cirrhosis, indication for liver transplantation, and development of HCC, and indeed may lead to HCC even in the absence of cirrhosis.8
HCC remains a challenging clinical problem.2 As the vast majority of cases arise in the context of cirrhosis, management of HCC not only must address the cancer stage at diagnosis, but also the patient’s underlying liver dysfunction and performance status. Receipt of HCC-specific therapy is a key driver of patient outcome, with curative therapies available for those diagnosed with early-stage disease. We and others have shown that a multidisciplinary approach to coordinate, individualize, and optimize care for these complex patients can improve the rate of treatment utilization, reduce treatment delays, and improve patient survival.6,9,10
Patient psychosocial barriers, such as low socioeconomic status, homelessness, alcohol and substance use, and psychiatric disorders, are more prevalent among the veteran population and have the potential to negatively influence successful health care delivery. One retrospective study of 100 veterans at a US Department of Veterans Affairs (VA) medical center treated for HCC from 2009 to 2014 showed a majority of the patients lived on a meager income, a high prevalence of homelessness, substance use history in 96% of their cohort, and psychiatric illness in 65% of patients.11 Other studies have documented similar findings in the veteran population, with alcohol, substance use, as well as other uncontrolled comorbidities as barriers to providing care, such as antiviral therapy for chronic HCV infection.12
Herein, we present a cohort of veterans with HCC managed through our MDTB from 2007 to 2016, for whom chronic HCV infection and/or alcoholic liver disease were the main causes of cirrhosis. Our cohort had a high burden of alcohol and substance use disorders while other psychiatric illnesses were also common. Our cohort includes patients who were poor, and even some veterans who lacked a stable home. This profile of poverty and social deprivation among veterans is matched in national data.13-15 Using a tumor board model of nurse navigation and multidisciplinary care, we were able to provide travel and lodging assistance to 50 (34%) and 33 (22%) patients, respectively, in order to facilitate their care.
Our data demonstrate that the impact of psychosocial barriers on our capacity to deliver care varies with the nature of the treatment under consideration: curative vs cancer control. For example, active substance use disorder, homelessness, and severe established mental illness were often considered insurmountable when the treatment in question was LT. Nevertheless, despite the high prevalence in our study group of barriers, such as lack of transport while living far from a VA medical center, or alcohol use disorder, a curative treatment with either LT, tumor ablation, or resection could be offered to over half of our cohort. When noncurative therapies are included, most patients (85%) received HCC-specific care, with good relative survival.
Our reported high receipt of HCC-specific care and patient survival is in contrast to previously reported low rates of HCC-specific care in in a national survey of management of 1296 veteran patients infected with HCV who developed HCC from 1998 to 2006. In this population, HCC-specific treatment was provided to 34%.16 However our data are consistent with our previously published data of patients with HCC managed through an institutional MDTB.6 Indeed, as shown by a univariate analysis in our present study, individualizing care to address modifiable patient barriers, such as providing provisions for lodging if needed, was associated with an increased likelihood of receiving HCC-specific care. On the other hand, advanced tumor stage (> T2) at diagnosis and a diagnosis of depression, which was the most common psychiatric diagnosis in our cohort, were both associated with decreased likelihood of receiving HCC-specific care. Clinical factors such as MELD score, total bilirubin, and serum AFP all affected the likelihood of providing HCC-specific care. In a multivariate analysis, factors that predicted ability to receive curative therapy included absence of substance use, T2 stage of tumor, and Child-Turcotte-Pugh class A cirrhosis. This is expected as patients with HCC within T2 stage (or Milan criteria) with compensated cirrhosis are most likely to receive curative therapies, such as resection, ablation, or LT.2
Conclusions
Our study demonstrates a high burden of psychosocial challenges in veterans with HCC. These accounted for a significant barrier to receive HCC-specific care. Despite the presence of these patient barriers, high rates of HCC-specific treatment are attainable through individualization and coordination of patient care in the context of a MDTB model with nurse navigation. Provision of targeted social support to ameliorate these modifiable factors improves patient outcomes.
1. McGlynn KA, Petrick JL, El-Serag HB. Epidemiology of hepatocellular carcinoma. Hepatology. 2021;73(suppl 1):4-13. doi:10.1002/hep.31288.
2. Marrero JA, Kulik LM, Sirlin CB, et al. Diagnosis, staging, and management of hepatocellular carcinoma: 2018 practice guidance by the American Association for the Study of Liver Diseases. Hepatology. 2018;68(2):723-750. doi:10.1002/hep.29913
3. Beste LA, Leipertz SL, Green PK, Dominitz JA, Ross D, Ioannou GN. Trends in burden of cirrhosis and hepatocellular carcinoma by underlying liver disease in US veterans, 2001-2013. Gastroenterology. 2015;149(6):1471-e18. doi:10.1053/j.gastro.2015.07.056
4. Kazis LE, Miller DR, Clark J, et al. Health-related quality of life in patients served by the Department of Veterans Affairs: results from the Veterans Health Study. Arch Intern Med. 1998;158(6):626-632. doi:10.1001/archinte.158.6.626
5. Slind LM, Keating TM, Fisher AG, Rose TG. A patient navigation model for veterans traveling for cancer care. Fed Pract. 2016;33(suppl 1):40S-45S.
6. Agarwal PD, Phillips P, Hillman L, et al. Multidisciplinary management of hepatocellular carcinoma improves access to therapy and patient survival. J Clin Gastroenterol. 2017;51(9):845-849. doi:10.1097/MCG.0000000000000825
7. White DL, Thrift AP, Kanwal F, Davila J, El-Serag HB. Incidence of hepatocellular carcinoma in all 50 United States, From 2000 Through 2012. Gastroenterology. 2017;152(4):812-820.e5. doi:10.1053/j.gastro.2016.11.020
8. Kanwal F, Kramer JR, Mapakshi S, et al. Risk of hepatocellular cancer in patients with non-alcoholic fatty liver disease. Gastroenterology. 2018;155(6):1828-1837.e2. doi:10.1053/j.gastro.2018.08.024
9. Yopp AC, Mansour JC, Beg MS, et al. Establishment of a multidisciplinary hepatocellular carcinoma clinic is associated with improved clinical outcome. Ann Surg Oncol. 2014;21(4):1287-1295. doi:10.1245/s10434-013-3413-8
10. Chang TT, Sawhney R, Monto A, et al. Implementation of a multidisciplinary treatment team for hepatocellular cancer at a Veterans Affairs Medical Center improves survival. HPB (Oxford). 2008;10(6):405-411. doi:10.1080/13651820802356572
11. Hwa KJ, Dua MM, Wren SM, Visser BC. Missing the obvious: psychosocial obstacles in veterans with hepatocellular carcinoma. HPB (Oxford). 2015;17(12):1124-1129. doi:10.1111/hpb.12508
12. Taylor J, Carr-Lopez S, Robinson A, et al. Determinants of treatment eligibility in veterans with hepatitis C viral infection. Clin Ther. 2017;39(1):130-137. doi:10.1016/j.clinthera.2016.11.019
13. Fargo J, Metraux S, Byrne T, et al. Prevalence and risk of homelessness among US veterans. Prev Chronic Dis. 2012;9:E45.
14. Tsai J, Rosenheck RA. Risk factors for homelessness among US veterans. Epidemiol Rev. 2015;37:177-195. doi:10.1093/epirev/mxu004
15. Tsai J, Link B, Rosenheck RA, Pietrzak RH. Homelessness among a nationally representative sample of US veterans: prevalence, service utilization, and correlates. Soc Psychiatry Psychiatr Epidemiol. 2016;51(6):907-916. doi:10.1007/s00127-016-1210-y
16. Davila JA, Kramer JR, Duan Z, et al. Referral and receipt of treatment for hepatocellular carcinoma in United States veterans: effect of patient and nonpatient factors. Hepatology. 2013;57(5):1858-1868. doi:10.1002/hep.26287
Hepatocellular carcinoma (HCC) remains a major global health problem and is the third leading cause of cancer-related mortality worldwide.1 Management of HCC is complex; as it largely occurs in the background of chronic liver disease, its management must simultaneously address challenges related to the patient’s tumor burden, as well as their underlying liver dysfunction and performance status. HCC is universally fatal without treatment, with a 5-year survival < 10%.2 However, if detected early HCC is potentially curable, with treatments such as hepatic resection, ablation, and/or liver transplantation, which are associated with 5-year survival rates as high as 70%.2 HCC-specific palliative treatments, including intra-arterial therapies (eg, trans-arterial chemoembolization, radioembolization) and systemic chemotherapy, have also been shown to prolong survival in patients with advanced HCC. Therefore, a key driver of patient survival is receipt of HCC-specific therapy.
There is rising incidence and mortality related to HCC in the US veteran population, largely attributed to acquisition of chronic hepatitis C virus (HCV) infection decades prior.3 There is also a high prevalence of psychosocial barriers in this population, such as low socioeconomic status, homelessness, alcohol and substance use disorders, and psychiatric disorders which can negatively influence receipt of medical treatment, including cancer care.4,5 Given the complexity of managing HCC, as well as the plethora of potential treatment options available, it is widely accepted that a multidisciplinary team approach, such as the multidisciplinary tumor board (MDTB) provides optimal care to patients with HCC.2,6 The aim of the present study was to identify in a population of veterans diagnosed with HCC the prevalence of psychosocial barriers to care and assess their impact and the role of an MDTB on receipt of HCC-specific care.
Methods
In June 2007, a joint institutional MDTB was established for patients with primary liver tumors receiving care at the William S. Middleton Memorial Veterans’ Hospital (WSMMVH) in Madison, Wisconsin. As we have described elsewhere, individual cases with their corresponding imaging studies were reviewed at a weekly conference attended by transplant hepatologists, medical oncologists, hepatobiliary and transplant surgeons, pathologists, diagnostic and interventional radiologists, and nurse coordinators.6 Potential therapies offered included surgical resection, liver transplantation (LT), thermal ablation, intra-arterial therapies (chemo and/or radioembolization), systemic chemotherapy, stereotactic radiation, and best supportive care. Decisions regarding the appropriate treatment modality were made based on patient factors, review of their cross-sectional imaging studies and/or histopathology, and context of their underlying liver dysfunction. The tumor board discussion was summarized in meeting minutes as well as tumor board encounters recorded in each patient’s health record. Although patients with benign tumors were presented at the MDTB, only patients with a diagnosis of HCC were included in this study.
A database analysis was conducted of all veteran patients with HCC managed through the WSMMVH MDTB, since its inception up to December 31, 2016, with follow-up until December 31, 2018. Data for analysis included demographics, laboratory parameters at time of diagnosis and treatment, imaging findings, histopathology and/or surgical pathology, treatment rendered, and follow-up information. The primary outcome measured in this study included receipt of any therapy and secondarily, patient survival.
Discrete variables were analyzed with χ2 statistics or Fisher exact test and continuous variables with the student t test. Multivariable analyses were carried out with logistic regression. Variables with a P < .05 were considered statistically significant. Analyses were carried out using IBM SPSS v24.0.
As a quality-improvement initiative for the care and management of veterans with HCC, this study was determined to be exempt from review by the WSMMVH and University of Wisconsin School of Medicine and Public Health Institutional Review Board.
Results
From January 1, 2007, through December 31, 2016, 149 patients with HCC were managed through the MDTB. Baseline demographic data, Model for End-stage Liver Disease (MELD) score and Child-Turcotte-Pugh class, and baseline HCC characteristics of the cohort are shown in Tables 1 and 2.
There was a high prevalence of psychosocial barriers in our study cohort, including alcohol or substance use disorder, mental illness diagnosis, and low socioeconomic status (Table 3). The mean distance traveled to WSMMVH for HCC-specific care was 206 km. Fifty patients in the cohort utilized travel assistance and 33 patients accessed lodging assistance.
HCC Treatments
There was a high rate of receipt of treatment in our study cohort with 127 (85%) patients receiving at least one HCC-specific therapy. Care was individualized and coordinated through our institutional MDTB, with both curative and palliative treatment modalities utilized (Table 4).
Curative treatment, which includes LT, ablation, or resection, was offered to 78 (52%) patients who were within T2 stage. Of these 78 patients who were potential candidates for LT as a curative treatment for HCC, 31 were not deemed suitable transplant candidates. Psychosocial barriers precluded consideration for LT in 7 of the 31 patients due to active substance use, homelessness in 1 patient, and severe mental illness in 3 patients. Medical comorbidities, advanced patient age, and patient preference accounted for the remainder.
In a univariate analysis of the cohort of 149 patients, factors that decreased the likelihood of receipt of curative HCC therapy included T2 stage or higher at diagnosis and a diagnosis of depression, whereas provision for lodging was associated with increased likelihood of receiving HCC-specific care (Table 5). Other factors that influenced receipt of any treatment included patient’s MELD score, total bilirubin, and serum α-fetoprotein, a surrogate marker for tumor stage. In the multivariable analysis, predictors of receiving curative therapy included absence of substance use, within T2 stage of tumor, and Child-Turcotte-Pugh class A cirrhosis. The presence of psychosocial barriers apart from substance use did not predict a lower chance of receiving curative HCC therapy (including homelessness, distance traveled to center, mental health disorder, and low income).
Median survival was 727 (95% CI, 488-966) days from diagnosis. Survival from HCC diagnosis in study cohort was 72% at 1 year, 50% at 2 years, 39% at 3 years, and 36% at 5 years. Death occurred in 71 (48%) patients; HCC accounted for death in 52 (73%) patients, complications of end-stage liver disease in 13 (18%) patients, and other causes for the remainder of patients.
Discussion
Increases in prevalence and mortality related to cirrhosis and HCC have been reported among the US veteran population.3 This is in large part attributable to the burden of chronic HCV infection in this population. As mirrored in the US population in general, we may be at a turning point regarding the gradual increase in prevalence in HCC.7 The prevalence of cirrhosis and viral-related HCC related to HCV infection will decline with availability of effective antiviral therapy. Alcoholic liver disease remains a main etiological factor for development of cirrhosis and HCC. Nonalcoholic fatty liver disease is becoming a more prevalent cause for development of cirrhosis, indication for liver transplantation, and development of HCC, and indeed may lead to HCC even in the absence of cirrhosis.8
HCC remains a challenging clinical problem.2 As the vast majority of cases arise in the context of cirrhosis, management of HCC not only must address the cancer stage at diagnosis, but also the patient’s underlying liver dysfunction and performance status. Receipt of HCC-specific therapy is a key driver of patient outcome, with curative therapies available for those diagnosed with early-stage disease. We and others have shown that a multidisciplinary approach to coordinate, individualize, and optimize care for these complex patients can improve the rate of treatment utilization, reduce treatment delays, and improve patient survival.6,9,10
Patient psychosocial barriers, such as low socioeconomic status, homelessness, alcohol and substance use, and psychiatric disorders, are more prevalent among the veteran population and have the potential to negatively influence successful health care delivery. One retrospective study of 100 veterans at a US Department of Veterans Affairs (VA) medical center treated for HCC from 2009 to 2014 showed a majority of the patients lived on a meager income, a high prevalence of homelessness, substance use history in 96% of their cohort, and psychiatric illness in 65% of patients.11 Other studies have documented similar findings in the veteran population, with alcohol, substance use, as well as other uncontrolled comorbidities as barriers to providing care, such as antiviral therapy for chronic HCV infection.12
Herein, we present a cohort of veterans with HCC managed through our MDTB from 2007 to 2016, for whom chronic HCV infection and/or alcoholic liver disease were the main causes of cirrhosis. Our cohort had a high burden of alcohol and substance use disorders while other psychiatric illnesses were also common. Our cohort includes patients who were poor, and even some veterans who lacked a stable home. This profile of poverty and social deprivation among veterans is matched in national data.13-15 Using a tumor board model of nurse navigation and multidisciplinary care, we were able to provide travel and lodging assistance to 50 (34%) and 33 (22%) patients, respectively, in order to facilitate their care.
Our data demonstrate that the impact of psychosocial barriers on our capacity to deliver care varies with the nature of the treatment under consideration: curative vs cancer control. For example, active substance use disorder, homelessness, and severe established mental illness were often considered insurmountable when the treatment in question was LT. Nevertheless, despite the high prevalence in our study group of barriers, such as lack of transport while living far from a VA medical center, or alcohol use disorder, a curative treatment with either LT, tumor ablation, or resection could be offered to over half of our cohort. When noncurative therapies are included, most patients (85%) received HCC-specific care, with good relative survival.
Our reported high receipt of HCC-specific care and patient survival is in contrast to previously reported low rates of HCC-specific care in in a national survey of management of 1296 veteran patients infected with HCV who developed HCC from 1998 to 2006. In this population, HCC-specific treatment was provided to 34%.16 However our data are consistent with our previously published data of patients with HCC managed through an institutional MDTB.6 Indeed, as shown by a univariate analysis in our present study, individualizing care to address modifiable patient barriers, such as providing provisions for lodging if needed, was associated with an increased likelihood of receiving HCC-specific care. On the other hand, advanced tumor stage (> T2) at diagnosis and a diagnosis of depression, which was the most common psychiatric diagnosis in our cohort, were both associated with decreased likelihood of receiving HCC-specific care. Clinical factors such as MELD score, total bilirubin, and serum AFP all affected the likelihood of providing HCC-specific care. In a multivariate analysis, factors that predicted ability to receive curative therapy included absence of substance use, T2 stage of tumor, and Child-Turcotte-Pugh class A cirrhosis. This is expected as patients with HCC within T2 stage (or Milan criteria) with compensated cirrhosis are most likely to receive curative therapies, such as resection, ablation, or LT.2
Conclusions
Our study demonstrates a high burden of psychosocial challenges in veterans with HCC. These accounted for a significant barrier to receive HCC-specific care. Despite the presence of these patient barriers, high rates of HCC-specific treatment are attainable through individualization and coordination of patient care in the context of a MDTB model with nurse navigation. Provision of targeted social support to ameliorate these modifiable factors improves patient outcomes.
1. McGlynn KA, Petrick JL, El-Serag HB. Epidemiology of hepatocellular carcinoma. Hepatology. 2021;73(suppl 1):4-13. doi:10.1002/hep.31288.
2. Marrero JA, Kulik LM, Sirlin CB, et al. Diagnosis, staging, and management of hepatocellular carcinoma: 2018 practice guidance by the American Association for the Study of Liver Diseases. Hepatology. 2018;68(2):723-750. doi:10.1002/hep.29913
3. Beste LA, Leipertz SL, Green PK, Dominitz JA, Ross D, Ioannou GN. Trends in burden of cirrhosis and hepatocellular carcinoma by underlying liver disease in US veterans, 2001-2013. Gastroenterology. 2015;149(6):1471-e18. doi:10.1053/j.gastro.2015.07.056
4. Kazis LE, Miller DR, Clark J, et al. Health-related quality of life in patients served by the Department of Veterans Affairs: results from the Veterans Health Study. Arch Intern Med. 1998;158(6):626-632. doi:10.1001/archinte.158.6.626
5. Slind LM, Keating TM, Fisher AG, Rose TG. A patient navigation model for veterans traveling for cancer care. Fed Pract. 2016;33(suppl 1):40S-45S.
6. Agarwal PD, Phillips P, Hillman L, et al. Multidisciplinary management of hepatocellular carcinoma improves access to therapy and patient survival. J Clin Gastroenterol. 2017;51(9):845-849. doi:10.1097/MCG.0000000000000825
7. White DL, Thrift AP, Kanwal F, Davila J, El-Serag HB. Incidence of hepatocellular carcinoma in all 50 United States, From 2000 Through 2012. Gastroenterology. 2017;152(4):812-820.e5. doi:10.1053/j.gastro.2016.11.020
8. Kanwal F, Kramer JR, Mapakshi S, et al. Risk of hepatocellular cancer in patients with non-alcoholic fatty liver disease. Gastroenterology. 2018;155(6):1828-1837.e2. doi:10.1053/j.gastro.2018.08.024
9. Yopp AC, Mansour JC, Beg MS, et al. Establishment of a multidisciplinary hepatocellular carcinoma clinic is associated with improved clinical outcome. Ann Surg Oncol. 2014;21(4):1287-1295. doi:10.1245/s10434-013-3413-8
10. Chang TT, Sawhney R, Monto A, et al. Implementation of a multidisciplinary treatment team for hepatocellular cancer at a Veterans Affairs Medical Center improves survival. HPB (Oxford). 2008;10(6):405-411. doi:10.1080/13651820802356572
11. Hwa KJ, Dua MM, Wren SM, Visser BC. Missing the obvious: psychosocial obstacles in veterans with hepatocellular carcinoma. HPB (Oxford). 2015;17(12):1124-1129. doi:10.1111/hpb.12508
12. Taylor J, Carr-Lopez S, Robinson A, et al. Determinants of treatment eligibility in veterans with hepatitis C viral infection. Clin Ther. 2017;39(1):130-137. doi:10.1016/j.clinthera.2016.11.019
13. Fargo J, Metraux S, Byrne T, et al. Prevalence and risk of homelessness among US veterans. Prev Chronic Dis. 2012;9:E45.
14. Tsai J, Rosenheck RA. Risk factors for homelessness among US veterans. Epidemiol Rev. 2015;37:177-195. doi:10.1093/epirev/mxu004
15. Tsai J, Link B, Rosenheck RA, Pietrzak RH. Homelessness among a nationally representative sample of US veterans: prevalence, service utilization, and correlates. Soc Psychiatry Psychiatr Epidemiol. 2016;51(6):907-916. doi:10.1007/s00127-016-1210-y
16. Davila JA, Kramer JR, Duan Z, et al. Referral and receipt of treatment for hepatocellular carcinoma in United States veterans: effect of patient and nonpatient factors. Hepatology. 2013;57(5):1858-1868. doi:10.1002/hep.26287
Stories of the Heart: Illness Narratives of Veterans Living With Heart Failure
Heart failure (HF) is a costly and burdensome illness and is the top reason for hospital admissions for the US Department of Veterans Affairs (VA) and Medicare.1 The cost of HF to the United States is estimated to grow to $3 billion annually by 2030.2 People living with HF have a high symptom burden and poor quality of life.3,4 Symptoms include shortness of breath, fatigue, depression, and decreases in psychosocial, existential, and spiritual well-being.5-9
Veterans in the US are a unique cultural group with distinct contextual considerations around their experiences.10 Different groups of veterans require unique cultural considerations, such as the experiences of veterans who served during the Vietnam war and during Operation Iraqi Freedom/Operation Enduring Freedom (OIF/OEF). The extent of unmet needs of people living with HF, the number of veterans living with this illness, and the unique contextual components related to living with HF among veterans require further exploration into this illness experience for this distinct population. Research should explore innovative ways of managing both the number of people living with the illness and the significant impact of HF in people’s lives due to the high symptom burden and poor quality of life.3
This study used the model of adjustment to illness to explore the psychosocial adjustment to illness and the experience of US veterans living with HF, with a focus on the domains of meaning creation, self-schema, and world schema.11 The model of adjustment to illness describes how people learn to adjust to living with an illness, which can lead to positive health outcomes. Meaning creation is defined as the process in which people create meaning from their experience living with illness. Self-schema is how people living with illness see themselves, and world schema is how people living with chronic illness see their place in the world. These domains shift as part of the adjustment to living with an illness described in this model.11 This foundation allowed the investigators to explore the experience of living with HF among veterans with a focus on these domains. Our study aimed to cocreate illness narratives among veterans living with HF and to explore components of psychosocial adjustment informed by the model.
Methods
This study used narrative inquiry with a focus on illness narratives.12-17 Narrative inquiry as defined by Catherine Riessman involves the generation of socially constructed and cocreated meanings between the researcher and narrator. The researcher is an active participant in narrative creation as the narrator chooses which events to include in the stories based on the social, historical, and cultural context of both the narrator (study participant) and audience (researcher). Riessman describes the importance of contextual factors and meaning creation as an important aspect of narrative inquiry.12-14,16,17 It is important in narrative inquiry to consider how cultural, social, and historical factors influence narrative creation, constriction, and/or elimination.
This study prospectively created and collected data at a single time point. Semi-structured interviews explored psychosocial adjustment for people living with HF using an opening question modified from previous illness narrative research: Why do you think you got heart failure?18 Probes included the domains of psychosocial adjustment informed by the model of adjustment to illness domains (Figure). Emergent probes were used to illicit additional data around psychosocial adjustment to illness. Data were created and collected in accordance with narrative inquiry during the cocreation of the illness narratives between the researcher and study participants. This interview guide was tested by the first author in preliminary work to prepare for this study.
Allowing for emergent probes and acknowledging the role of the researcher as audience is key to the cocreation of narratives using this methodological framework. Narrators shape their narrative with the audience in mind; they cocreate their narrative with their audience using this type of narrative inquiry.12,16 What the narrator chooses to include and exclude from their story provides a window into how they see themselves and their world.19 Audio recordings were used to capture data, allowing for the researcher to take contemporaneous notes exploring contextual considerations to the narrative cocreation process and to be used later in analysis. Analytic notes were completed during the interviews as well as later in analysis as part of the contextual reflection.
Setting
Research was conducted in the Rocky Mountain Regional VA Medical Center, Aurora, Colorado. Participants were recruited through the outpatient cardiology clinic where the interviews also took place. This study was approved through the Colorado Institutional Review Board and Rocky Mountain Regional VA Medical Center (IRB: 19-1064). Participants were identified by the treating cardiologist who was a part of the study team. Interested veterans were introduced to the first author who was stationed in an empty clinic room. The study cardiologist screened to ensure all participants were ≥ 18 years of age and had a diagnosis of HF for > 1 year. Persons with an impairment that could interfere with their ability to construct a narrative were also excluded.
Recruitment took place from October 2019 to January 2020. Three veterans refused participation. Five study participants provided informed consent and were enrolled and interviewed. All interviews were completed in the clinic at the time of consent per participant preference. One-hour long semi-structured interviews were conducted and audio recorded. A demographic form was administered at the end of each interview to capture contextual data. The researcher also kept a reflexive journal and audit trail.
Narrative Analysis
Riessman described general steps to conduct narrative analysis, including transcription, narrative clean-up, consideration of contextual factors, exploration of thematic threads, consideration of larger social narratives, and positioning.12 The first author read transcripts while listening to the audio recordings to ensure accuracy. With narrative clean-up each narrative was organized to cocreate overall meaning, changed to protect anonymity, and refined to only include the illness narrative. For example, if a narrator told a story about childhood and then later in the interview remembered another detail to add to their story, narrative clean-up reordered events to make cohesive sense of the story. Demographic, historical, cultural, and social contexts of both the narrator and audience were reflected on during analysis to explore how these components may have shaped and influenced cocreation. Context was also considered within the larger VA setting.
Emergent themes were explored for convergence, divergence, and points of tension within and across each narrative. Larger social narratives were also considered for their influence on possible inclusion/exclusion of experience, such as how gender identity may have influenced study participants’ descriptions of their roles in social systems. These themes and narratives were then shared with our team, and we worked through decision points during the analysis process and discussed interpretation of the data to reach consensus.
Results
Five veterans living with HF were recruited and consented to participate in the study. Demographics of the participants and first author are included in the Table. Five illness narratives were cocreated, entitled: Blame the Cheese: Frank’s Illness Narrative; Love is Love: Bob’s Illness Narrative; The Brighter Things in Life is My Family: George’s Illness Narrative; We Never Know When Our Time is Coming: Bill’s Illness Narrative; and A Dream Deferred: Henry’s Illness Narrative.
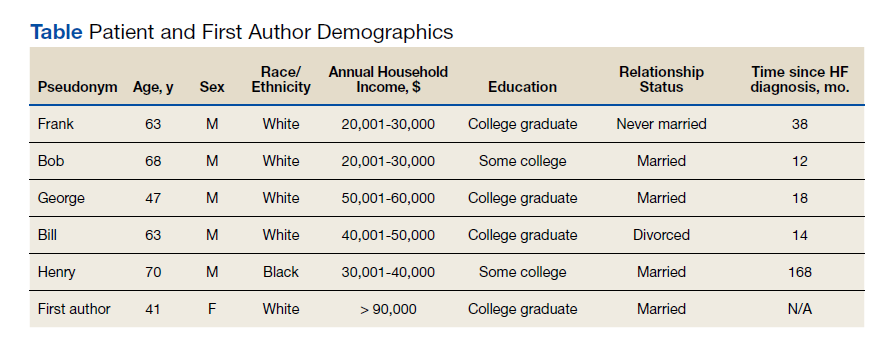
Each narrative was explored focusing on the domains of the model of adjustment to illness. An emergent theme was also identified with multiple subthemes: being a veteran is unique. Related subthemes included: financial benefits, intersectionality of government and health care, the intersectionality of masculinity and military service, and the dichotomy of military experience.
The search for meaning creation after the experience of chronic illness emerged across interviews. One example of meaning creation was in Frank's illness narrative. Frank was unsure why he got HF: “Probably because I ate too much cheese…I mean, that’s gotta be it. It can’t be anything else.” By tying HF to his diet, he found meaning through his health behaviors.
Model of Adjustment to Illness
The narratives illustrate components of the model of adjustment to illness and describe how each of the participants either shifted their self-schema and world schema or reinforced their previously established schemas. It also demonstrates how people use narratives to create meaning and illness understanding from their illness experience, reflecting, and emphasizing different parts creating meaning from their experience.
A commonality across the narratives was a shift in self-schema, including the shift from being a provider to being reliant on others. In accordance with the dominant social narrative around men as providers, each narrator talked about their identity as a provider for themselves and their families. Often keeping their provider identity required modifications of the definition, from physical abilities and employment to financial security and stability. George made all his health care decisions based on his goal of providing for his family and protecting them from having to care for him: “I’m always thinking about the future, always trying to figure out how my family, if something should happen to me, how my family would cope, and how my family would be able to support themselves.” Bob’s health care goals were to stay alive long enough for his wife to get financial benefits as a surviving spouse: “That’s why I’m trying to make everything for her, you know. I’m not worried about myself. I’m not. Her I am, you know. And love is love.” Both of their health care decisions are shaped by their identity as a provider shifting to financial support.
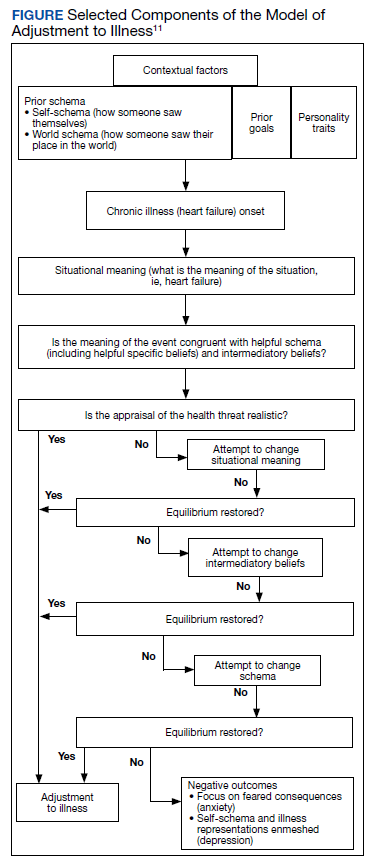
Some narrators changed the way they saw their world, or world schema, while others felt their illness experience just reinforced the way they had already experienced the world. Frank was able to reprioritize what was important to him after his diagnosis and accept his own mortality: “I might as well chill out, no more stress, and just enjoy things ’cause you could die…” For Henry, getting HF was only part of the experience of systemic oppression that had impacted his and his family’s lives for generations. He saw how his oppression by the military and US government led to his father’s exposure to chemicals that Henry believed he inherited and caused his illness. Henry’s illness experience reinforced his distrust in the institutions that were oppressed him and his family.
Veteran Status
Being a veteran in the Veterans Health Administration (VHA) system impacted how a narrative understanding of illness was created. Veterans are a unique cultural population with aspects of their illness experience that are important to understand.10 Institutions such as the VA also enable and constrain components of narrative creation.20 The illness narratives in this study were cocreated within the institutional setting of the VA. Part of the analysis included exploring how the institutional setting impacted the narrative creation. Emergent subthemes of the uniqueness of the veteran experience include financial benefits, intersectionality of government and health care, intersectionality of masculinity and military service, and the dichotomy of military experience.
In the US it is unique to the VA that the government both treats and assesses the severity of medical conditions to determine eligibility for health care and financial benefits. The VA’s financial benefits are intended to help compensate veterans who are experiencing illness as a result of their military experience.21 However, because the VA administers them the Veterans Benefits Administration and the VHA, veterans see both as interconnected. The perceived tie between illness severity and financial compensation could influence or bias how veterans understand their illness severity and experience. This may inadvertently encourage veterans to see their illness as being tied to their military service. This shaping of narratives should be considered as a contextual component as veterans obtain financial compensation and health insurance from the same larger organization that provides their health care and management.
George was a young man who during his service had chest pains and felt tired during physical training. He was surprised when his cardiologist explained his heart was enlarged. “All I know is when I initially joined the military, I was perfectly fine, you know, and when I was in the military, graduating, all that stuff, there was a glitch on the [electrocardiogram] they gave me after one day of doing [physical training] and then they’re like, oh, that’s fine. Come to find out it was mitral valve prolapse. And the doctors didn’t catch it then.” George feels the stress of the military caused his heart problems: “It wasn’t there before… so I’d have to say the strain from the military had to have caused it.” George’s medical history noted that he has a genetic connective tissue disorder that can lead to HF and likely was underlying cause of his illness. This example of how George pruned his narrative experience to highlight the cause as his military experience instead of a genetic disorder could have multiple financial and health benefits. The financial incentive for George to see his illness as caused by his military service could potentially bias his illness narrative to find his illness cause as tied to his service.
Government/Health Care Intersectionality
Veterans who may have experienced trust-breaking events with the government, like Agent Orange exposure or intergenerational racial trauma, may apply that experience to all government agencies. Bob felt the government had purposefully used him to create a military weapon. The army “knew I was angry and they used that for their advantage,” he said. Bob learned that he was exposed to Agent Orange in Vietnam, which is presumed to be associated with HF. Bob felt betrayed that the VHA had not figured out his health problems earlier. “I didn’t know anything about it until 6 months ago… Our government knew about it when they used it, and they didn’t care. They just wanted to win the war, and a whole lot of GIs like me suffered because of that, and I was like my government killed me? And I was fighting for them?”
Henry learned to distrust the government and the health care system because of a long history of systematic oppression and exploitation. These institutions’ erosion of trust has impact beyond the trust-breaking event itself but reverberates into how communities view organizations and institutions for generations. For Black Americans, who have historically been experimented on without consent by the US government and health care systems, this can make it especially hard to trust and build working relationships with those institutions. Health care professionals (HCPs) need to build collaborative partnerships with patients to provide effective care while understanding why some patients may have difficulty trusting health care systems, especially government-led systems.
The nature of HF as an illness can also make it difficult to predict and manage.22 This uncertainty and difficulty in managing HF can make it especially hard for people to establish trust with their HCPs whom they want to see as experts in their illness. HCPs in these narratives were often portrayed as incompetent or neglectful. The unpredictable nature of the illness itself was not reflected in the narrator’s experience.
Masculinity/Military Service Intersectionality
For the veteran narrators, tied into the identity of being a provider are social messages about masculinity. There is a unique intersectionality of being a man, the military culture, and living with chronic illnesses. Dominant social messages around being a man include being tough, not expressing emotion, self-reliance, and having power. This overlaps with social messages on military culture, including self-reliance, toughness, persistence in the face of adversity, limited expression of emotions, and the recognition of power and respect.23
People who internalize these social messages on masculinity may be less likely to access mental health treatment.23 This stigmatizing barrier to mental health treatment could impact how positive narratives are constructed around the experience of chronic illness for narrators who identify as masculine. Military and masculine identity could exclude or constrain stories about a veteran who did not “solider on” or who had to rely on others in a team to get things done. This shift can especially impact veterans experiencing chronic illnesses like HF, which often impact their physical abilities. Veterans may feel pressured to think of and portray themselves as being strong by limiting their expression of pain and other symptoms to remain in alignment with the dominant narrative. By not being open about the full experience of their illness both positive and negative, veterans may have unaddressed aspects of their illness experience or HCPs may not be able have all the information they need before the concern becomes a more serious health problem.
Dichotomy of Military Experience
Some narrators in this study talked about their military experience as both traumatic and beneficial. These dichotomous viewpoints can be difficult for veterans to construct a narrative understanding around. How can an inherently painful potentially traumatic experience, such as war, have benefits? This way of looking at the world may require a large narrative shift in their world and self-schemas to accept.
Bob hurt people in Vietnam as part of his job. “I did a lot of killing.” Bob met a village elder who stopped him from hurting people in the village and “in my spare time, I would go back to the village and he would teach me, how to be a better man,” Bob shared. “He taught me about life and everything, and he was awesome, just to this day, he’s like a father to me.” Bob tried to change his life and learned how to live a life full of love and care because of his experience in Vietnam. Though Bob hurt a lot of people in Vietnam, which still haunts him, he found meaning through his life lessons from the village elder. “I’m ashamed of what I did in Vietnam. I did some really bad stuff, but ever since then, I’ve always tried to do good to help people.”
Discussion
Exploring a person’s illness experience from a truly holistic pathway allows HCPs to see how the ripples of illness echo into the interconnection of surrounding systems and even across time. These stories suggest that veterans may experience their illness and construct their illness narratives based on the distinct contextual considerations of veteran culture.10 Research exploring how veterans see their illness and its potential impact on their health care access and choices could benefit from exploration into narrative understanding and meaning creation as a potentially contributing factor to health care decision making. As veterans are treated across health care systems, this has implications not only for VHA care, but community care as well.
These narratives also demonstrate how veterans create health care goals woven into their narrative understanding of their illness and its cause, lending insight into understanding health care decision making. This change in self-schema shapes how veterans see themselves and their role which shapes other aspects of their health care. These findings also contribute to our understanding of meaning creation. By exploring meaning making and narrative understanding, this work adds to our knowledge of the importance of spirituality as a component of the holistic experience of illness. There have been previous studies exploring the spiritual aspects of HF and the importance of meaning making.24,25 Exploring meaning making as an aspect of illness narratives can have important implications. Future research could explore the connections between meaning creation and illness narratives.
Limitations
The sample of veterans who participated in this study and are not generalizable to all veteran populations. The sample also only reflects people who were willing to participate and may exclude experience of people who may not have felt comfortable talking to a VA employee about their experience. It is also important to note that the small sample size included primarily male and White participants. In narrative inquiry, the number of participants is not as essential as diving into the depth of the interviews with the participants.
It is also important to note the position of the interviewer. As a White cisgender, heterosexual, middle-aged, middle class female who was raised in rural Kansas in a predominantly Protestant community, the positionality of the interviewer as a cocreator of the data inherently shaped and influenced the narratives created during this study. This contextual understanding of narratives created within the research relationship is an essential component to narrative inquiry and understanding.
Conclusions
Exploring these veterans’ narrative understanding of their experience of illness has many potential implications for health care systems, HCPs, and our military and veteran populations described in this article. Thinking about how the impact of racism, the influence of incentives to remain ill, and the complex intersection of identity and health brings light to how these domains may influence how people see themselves and engage in health care. These domains from these stories of the heart may help millions of people living with chronic illnesses like HF to not only live with their illness but inform how their experience is shaped by the systems surrounding them, including health care, government, and systems of power and oppression.
1. Ashton CM, Bozkurt B, Colucci WB, et al. Veterans Affairs quality enhancement research initiative in chronic heart failure. Medical care. 2000;38(6):I-26-I-37.
2. Writing Group Members, Mozaffarian D, Benjamin EJ, et al. Heart disease and stroke statistics-2016 update: a report from the American Heart Association. Circulation. 2016;133(4):e38-e360. doi:10.1161/CIR.0000000000000350
3. Blinderman CD, Homel P, Billings JA, Portenoy RK, Tennstedt SL. Symptom distress and quality of life in patients with advanced congestive heart failure. J Pain Symptom Manage. 2008;35(6):594-603. doi:10.1016/j.jpainsymman.2007.06.007
4. Zambroski CH. Qualitative analysis of living with heart failure. Heart Lung. 2003;32(1):32-40. doi:10.1067/mhl.2003.10
5. Walthall H, Jenkinson C, Boulton M. Living with breathlessness in chronic heart failure: a qualitative study. J Clin Nurs. 2017;26(13-14):2036-2044. doi:10.1111/jocn.13615
6. Francis GS, Greenberg BH, Hsu DT, et al. ACCF/AHA/ACP/HFSA/ISHLT 2010 clinical competence statement on management of patients with advanced heart failure and cardiac transplant: a report of the ACCF/AHA/ACP Task Force on Clinical Competence and Training. J Am Coll Cardiol. 2010;56(5):424-453. doi:10.1016/j.jacc.2010.04.014
7. Rumsfeld JS, Havranek E, Masoudi FA, et al. Depressive symptoms are the strongest predictors of short-term declines in health status in patients with heart failure. J Am Coll Cardiol. 2003;42(10):1811-1817. doi:10.1016/j.jacc.2003.07.013
8. Leeming A, Murray SA, Kendall M. The impact of advanced heart failure on social, psychological and existential aspects and personhood. Eur J Cardiovasc Nurs. 2014;13(2):162-167. doi:10.1177/1474515114520771
9. Bekelman DB, Havranek EP, Becker DM, et al. Symptoms, depression, and quality of life in patients with heart failure. J Card Fail. 2007;13(8):643-648. doi:10.1016/j.cardfail.2007.05.005
10. Weiss E, Coll JE. The influence of military culture and veteran worldviews on mental health treatment: practice implications for combat veteran help-seeking and wellness. Int J Health, Wellness Society. 2011;1(2):75-86. doi:10.18848/2156-8960/CGP/v01i02/41168
11. Sharpe L, Curran L. Understanding the process of adjustment to illness. Soc Sci Med. 2006;62(5):1153-1166. doi:10.1016/j.socscimed.2005.07.010
12. Riessman CK. Narrative Methods for the Human Sciences. SAGE Publications; 2008.
13. Riessman CK. Performing identities in illness narrative: masculinity and multiple sclerosis. Qualitative Research. 2003;3(1):5-33. doi:10.1177/146879410300300101
14. Riessman CK. Strategic uses of narrative in the presentation of self and illness: a research note. Soc Sci Med. 1990;30(11):1195-1200. doi:10.1016/0277-9536(90)90259-U
15. Riessman CK. Analysis of personal narratives. In: Handbook of Interview Research. Sage; 2002:695-710.
16. Riessman CK. Illness Narratives: Positioned Identities. Invited Annual Lecture. Cardiff University. May 2002. Accessed April 14 2022. https://www.researchgate.net/publication/241501264_Illness_Narratives_Positioned_Identities
17. Riessman CK. Performing identities in illness narrative: masculinity and multiple sclerosis. Qual Res. 2003;3(1):5-33. doi:10.1177/146879410300300101
18. Williams G. The genesis of chronic illness: narrative re‐construction. Sociol Health Illn. 1984;6(2):175-200. doi:10.1111/1467-9566.ep10778250
19. White M, Epston D. Narrative Means to Therapeutic Ends. WW Norton & Company; 1990.
20. Burchardt M. Illness Narratives as Theory and Method. SAGE Publications; 2020.
21. Sayer NA, Spoont M, Nelson D. Veterans seeking disability benefits for post-traumatic stress disorder: who applies and the self-reported meaning of disability compensation. Soc Sci Med. 2004;58(11):2133-2143. doi:10.1016/j.socscimed.2003.08.009
22. Winters CA. Heart failure: living with uncertainty. Prog Cardiovasc Nurs. 1999;14(3):85.
23. Plys E, Smith R, Jacobs ML. Masculinity and military culture in VA hospice and palliative care: a narrative review with clinical recommendations. J Palliat Care. 2020;35(2):120-126. doi:10.1177/0825859719851483
24. Johnson LS. Facilitating spiritual meaning‐making for the individual with a diagnosis of a terminal illness. Counseling and Values. 2003;47(3):230-240. doi:10.1002/j.2161-007X.2003.tb00269.x
25. Shahrbabaki PM, Nouhi E, Kazemi M, Ahmadi F. Defective support network: a major obstacle to coping for patients with heart failure: a qualitative study. Glob Health Action. 2016;9:30767. Published 2016 Apr 1. doi:10.3402/gha.v9.30767
Heart failure (HF) is a costly and burdensome illness and is the top reason for hospital admissions for the US Department of Veterans Affairs (VA) and Medicare.1 The cost of HF to the United States is estimated to grow to $3 billion annually by 2030.2 People living with HF have a high symptom burden and poor quality of life.3,4 Symptoms include shortness of breath, fatigue, depression, and decreases in psychosocial, existential, and spiritual well-being.5-9
Veterans in the US are a unique cultural group with distinct contextual considerations around their experiences.10 Different groups of veterans require unique cultural considerations, such as the experiences of veterans who served during the Vietnam war and during Operation Iraqi Freedom/Operation Enduring Freedom (OIF/OEF). The extent of unmet needs of people living with HF, the number of veterans living with this illness, and the unique contextual components related to living with HF among veterans require further exploration into this illness experience for this distinct population. Research should explore innovative ways of managing both the number of people living with the illness and the significant impact of HF in people’s lives due to the high symptom burden and poor quality of life.3
This study used the model of adjustment to illness to explore the psychosocial adjustment to illness and the experience of US veterans living with HF, with a focus on the domains of meaning creation, self-schema, and world schema.11 The model of adjustment to illness describes how people learn to adjust to living with an illness, which can lead to positive health outcomes. Meaning creation is defined as the process in which people create meaning from their experience living with illness. Self-schema is how people living with illness see themselves, and world schema is how people living with chronic illness see their place in the world. These domains shift as part of the adjustment to living with an illness described in this model.11 This foundation allowed the investigators to explore the experience of living with HF among veterans with a focus on these domains. Our study aimed to cocreate illness narratives among veterans living with HF and to explore components of psychosocial adjustment informed by the model.
Methods
This study used narrative inquiry with a focus on illness narratives.12-17 Narrative inquiry as defined by Catherine Riessman involves the generation of socially constructed and cocreated meanings between the researcher and narrator. The researcher is an active participant in narrative creation as the narrator chooses which events to include in the stories based on the social, historical, and cultural context of both the narrator (study participant) and audience (researcher). Riessman describes the importance of contextual factors and meaning creation as an important aspect of narrative inquiry.12-14,16,17 It is important in narrative inquiry to consider how cultural, social, and historical factors influence narrative creation, constriction, and/or elimination.
This study prospectively created and collected data at a single time point. Semi-structured interviews explored psychosocial adjustment for people living with HF using an opening question modified from previous illness narrative research: Why do you think you got heart failure?18 Probes included the domains of psychosocial adjustment informed by the model of adjustment to illness domains (Figure). Emergent probes were used to illicit additional data around psychosocial adjustment to illness. Data were created and collected in accordance with narrative inquiry during the cocreation of the illness narratives between the researcher and study participants. This interview guide was tested by the first author in preliminary work to prepare for this study.
Allowing for emergent probes and acknowledging the role of the researcher as audience is key to the cocreation of narratives using this methodological framework. Narrators shape their narrative with the audience in mind; they cocreate their narrative with their audience using this type of narrative inquiry.12,16 What the narrator chooses to include and exclude from their story provides a window into how they see themselves and their world.19 Audio recordings were used to capture data, allowing for the researcher to take contemporaneous notes exploring contextual considerations to the narrative cocreation process and to be used later in analysis. Analytic notes were completed during the interviews as well as later in analysis as part of the contextual reflection.
Setting
Research was conducted in the Rocky Mountain Regional VA Medical Center, Aurora, Colorado. Participants were recruited through the outpatient cardiology clinic where the interviews also took place. This study was approved through the Colorado Institutional Review Board and Rocky Mountain Regional VA Medical Center (IRB: 19-1064). Participants were identified by the treating cardiologist who was a part of the study team. Interested veterans were introduced to the first author who was stationed in an empty clinic room. The study cardiologist screened to ensure all participants were ≥ 18 years of age and had a diagnosis of HF for > 1 year. Persons with an impairment that could interfere with their ability to construct a narrative were also excluded.
Recruitment took place from October 2019 to January 2020. Three veterans refused participation. Five study participants provided informed consent and were enrolled and interviewed. All interviews were completed in the clinic at the time of consent per participant preference. One-hour long semi-structured interviews were conducted and audio recorded. A demographic form was administered at the end of each interview to capture contextual data. The researcher also kept a reflexive journal and audit trail.
Narrative Analysis
Riessman described general steps to conduct narrative analysis, including transcription, narrative clean-up, consideration of contextual factors, exploration of thematic threads, consideration of larger social narratives, and positioning.12 The first author read transcripts while listening to the audio recordings to ensure accuracy. With narrative clean-up each narrative was organized to cocreate overall meaning, changed to protect anonymity, and refined to only include the illness narrative. For example, if a narrator told a story about childhood and then later in the interview remembered another detail to add to their story, narrative clean-up reordered events to make cohesive sense of the story. Demographic, historical, cultural, and social contexts of both the narrator and audience were reflected on during analysis to explore how these components may have shaped and influenced cocreation. Context was also considered within the larger VA setting.
Emergent themes were explored for convergence, divergence, and points of tension within and across each narrative. Larger social narratives were also considered for their influence on possible inclusion/exclusion of experience, such as how gender identity may have influenced study participants’ descriptions of their roles in social systems. These themes and narratives were then shared with our team, and we worked through decision points during the analysis process and discussed interpretation of the data to reach consensus.
Results
Five veterans living with HF were recruited and consented to participate in the study. Demographics of the participants and first author are included in the Table. Five illness narratives were cocreated, entitled: Blame the Cheese: Frank’s Illness Narrative; Love is Love: Bob’s Illness Narrative; The Brighter Things in Life is My Family: George’s Illness Narrative; We Never Know When Our Time is Coming: Bill’s Illness Narrative; and A Dream Deferred: Henry’s Illness Narrative.
Each narrative was explored focusing on the domains of the model of adjustment to illness. An emergent theme was also identified with multiple subthemes: being a veteran is unique. Related subthemes included: financial benefits, intersectionality of government and health care, the intersectionality of masculinity and military service, and the dichotomy of military experience.
The search for meaning creation after the experience of chronic illness emerged across interviews. One example of meaning creation was in Frank's illness narrative. Frank was unsure why he got HF: “Probably because I ate too much cheese…I mean, that’s gotta be it. It can’t be anything else.” By tying HF to his diet, he found meaning through his health behaviors.
Model of Adjustment to Illness
The narratives illustrate components of the model of adjustment to illness and describe how each of the participants either shifted their self-schema and world schema or reinforced their previously established schemas. It also demonstrates how people use narratives to create meaning and illness understanding from their illness experience, reflecting, and emphasizing different parts creating meaning from their experience.
A commonality across the narratives was a shift in self-schema, including the shift from being a provider to being reliant on others. In accordance with the dominant social narrative around men as providers, each narrator talked about their identity as a provider for themselves and their families. Often keeping their provider identity required modifications of the definition, from physical abilities and employment to financial security and stability. George made all his health care decisions based on his goal of providing for his family and protecting them from having to care for him: “I’m always thinking about the future, always trying to figure out how my family, if something should happen to me, how my family would cope, and how my family would be able to support themselves.” Bob’s health care goals were to stay alive long enough for his wife to get financial benefits as a surviving spouse: “That’s why I’m trying to make everything for her, you know. I’m not worried about myself. I’m not. Her I am, you know. And love is love.” Both of their health care decisions are shaped by their identity as a provider shifting to financial support.
Some narrators changed the way they saw their world, or world schema, while others felt their illness experience just reinforced the way they had already experienced the world. Frank was able to reprioritize what was important to him after his diagnosis and accept his own mortality: “I might as well chill out, no more stress, and just enjoy things ’cause you could die…” For Henry, getting HF was only part of the experience of systemic oppression that had impacted his and his family’s lives for generations. He saw how his oppression by the military and US government led to his father’s exposure to chemicals that Henry believed he inherited and caused his illness. Henry’s illness experience reinforced his distrust in the institutions that were oppressed him and his family.
Veteran Status
Being a veteran in the Veterans Health Administration (VHA) system impacted how a narrative understanding of illness was created. Veterans are a unique cultural population with aspects of their illness experience that are important to understand.10 Institutions such as the VA also enable and constrain components of narrative creation.20 The illness narratives in this study were cocreated within the institutional setting of the VA. Part of the analysis included exploring how the institutional setting impacted the narrative creation. Emergent subthemes of the uniqueness of the veteran experience include financial benefits, intersectionality of government and health care, intersectionality of masculinity and military service, and the dichotomy of military experience.
In the US it is unique to the VA that the government both treats and assesses the severity of medical conditions to determine eligibility for health care and financial benefits. The VA’s financial benefits are intended to help compensate veterans who are experiencing illness as a result of their military experience.21 However, because the VA administers them the Veterans Benefits Administration and the VHA, veterans see both as interconnected. The perceived tie between illness severity and financial compensation could influence or bias how veterans understand their illness severity and experience. This may inadvertently encourage veterans to see their illness as being tied to their military service. This shaping of narratives should be considered as a contextual component as veterans obtain financial compensation and health insurance from the same larger organization that provides their health care and management.
George was a young man who during his service had chest pains and felt tired during physical training. He was surprised when his cardiologist explained his heart was enlarged. “All I know is when I initially joined the military, I was perfectly fine, you know, and when I was in the military, graduating, all that stuff, there was a glitch on the [electrocardiogram] they gave me after one day of doing [physical training] and then they’re like, oh, that’s fine. Come to find out it was mitral valve prolapse. And the doctors didn’t catch it then.” George feels the stress of the military caused his heart problems: “It wasn’t there before… so I’d have to say the strain from the military had to have caused it.” George’s medical history noted that he has a genetic connective tissue disorder that can lead to HF and likely was underlying cause of his illness. This example of how George pruned his narrative experience to highlight the cause as his military experience instead of a genetic disorder could have multiple financial and health benefits. The financial incentive for George to see his illness as caused by his military service could potentially bias his illness narrative to find his illness cause as tied to his service.
Government/Health Care Intersectionality
Veterans who may have experienced trust-breaking events with the government, like Agent Orange exposure or intergenerational racial trauma, may apply that experience to all government agencies. Bob felt the government had purposefully used him to create a military weapon. The army “knew I was angry and they used that for their advantage,” he said. Bob learned that he was exposed to Agent Orange in Vietnam, which is presumed to be associated with HF. Bob felt betrayed that the VHA had not figured out his health problems earlier. “I didn’t know anything about it until 6 months ago… Our government knew about it when they used it, and they didn’t care. They just wanted to win the war, and a whole lot of GIs like me suffered because of that, and I was like my government killed me? And I was fighting for them?”
Henry learned to distrust the government and the health care system because of a long history of systematic oppression and exploitation. These institutions’ erosion of trust has impact beyond the trust-breaking event itself but reverberates into how communities view organizations and institutions for generations. For Black Americans, who have historically been experimented on without consent by the US government and health care systems, this can make it especially hard to trust and build working relationships with those institutions. Health care professionals (HCPs) need to build collaborative partnerships with patients to provide effective care while understanding why some patients may have difficulty trusting health care systems, especially government-led systems.
The nature of HF as an illness can also make it difficult to predict and manage.22 This uncertainty and difficulty in managing HF can make it especially hard for people to establish trust with their HCPs whom they want to see as experts in their illness. HCPs in these narratives were often portrayed as incompetent or neglectful. The unpredictable nature of the illness itself was not reflected in the narrator’s experience.
Masculinity/Military Service Intersectionality
For the veteran narrators, tied into the identity of being a provider are social messages about masculinity. There is a unique intersectionality of being a man, the military culture, and living with chronic illnesses. Dominant social messages around being a man include being tough, not expressing emotion, self-reliance, and having power. This overlaps with social messages on military culture, including self-reliance, toughness, persistence in the face of adversity, limited expression of emotions, and the recognition of power and respect.23
People who internalize these social messages on masculinity may be less likely to access mental health treatment.23 This stigmatizing barrier to mental health treatment could impact how positive narratives are constructed around the experience of chronic illness for narrators who identify as masculine. Military and masculine identity could exclude or constrain stories about a veteran who did not “solider on” or who had to rely on others in a team to get things done. This shift can especially impact veterans experiencing chronic illnesses like HF, which often impact their physical abilities. Veterans may feel pressured to think of and portray themselves as being strong by limiting their expression of pain and other symptoms to remain in alignment with the dominant narrative. By not being open about the full experience of their illness both positive and negative, veterans may have unaddressed aspects of their illness experience or HCPs may not be able have all the information they need before the concern becomes a more serious health problem.
Dichotomy of Military Experience
Some narrators in this study talked about their military experience as both traumatic and beneficial. These dichotomous viewpoints can be difficult for veterans to construct a narrative understanding around. How can an inherently painful potentially traumatic experience, such as war, have benefits? This way of looking at the world may require a large narrative shift in their world and self-schemas to accept.
Bob hurt people in Vietnam as part of his job. “I did a lot of killing.” Bob met a village elder who stopped him from hurting people in the village and “in my spare time, I would go back to the village and he would teach me, how to be a better man,” Bob shared. “He taught me about life and everything, and he was awesome, just to this day, he’s like a father to me.” Bob tried to change his life and learned how to live a life full of love and care because of his experience in Vietnam. Though Bob hurt a lot of people in Vietnam, which still haunts him, he found meaning through his life lessons from the village elder. “I’m ashamed of what I did in Vietnam. I did some really bad stuff, but ever since then, I’ve always tried to do good to help people.”
Discussion
Exploring a person’s illness experience from a truly holistic pathway allows HCPs to see how the ripples of illness echo into the interconnection of surrounding systems and even across time. These stories suggest that veterans may experience their illness and construct their illness narratives based on the distinct contextual considerations of veteran culture.10 Research exploring how veterans see their illness and its potential impact on their health care access and choices could benefit from exploration into narrative understanding and meaning creation as a potentially contributing factor to health care decision making. As veterans are treated across health care systems, this has implications not only for VHA care, but community care as well.
These narratives also demonstrate how veterans create health care goals woven into their narrative understanding of their illness and its cause, lending insight into understanding health care decision making. This change in self-schema shapes how veterans see themselves and their role which shapes other aspects of their health care. These findings also contribute to our understanding of meaning creation. By exploring meaning making and narrative understanding, this work adds to our knowledge of the importance of spirituality as a component of the holistic experience of illness. There have been previous studies exploring the spiritual aspects of HF and the importance of meaning making.24,25 Exploring meaning making as an aspect of illness narratives can have important implications. Future research could explore the connections between meaning creation and illness narratives.
Limitations
The sample of veterans who participated in this study and are not generalizable to all veteran populations. The sample also only reflects people who were willing to participate and may exclude experience of people who may not have felt comfortable talking to a VA employee about their experience. It is also important to note that the small sample size included primarily male and White participants. In narrative inquiry, the number of participants is not as essential as diving into the depth of the interviews with the participants.
It is also important to note the position of the interviewer. As a White cisgender, heterosexual, middle-aged, middle class female who was raised in rural Kansas in a predominantly Protestant community, the positionality of the interviewer as a cocreator of the data inherently shaped and influenced the narratives created during this study. This contextual understanding of narratives created within the research relationship is an essential component to narrative inquiry and understanding.
Conclusions
Exploring these veterans’ narrative understanding of their experience of illness has many potential implications for health care systems, HCPs, and our military and veteran populations described in this article. Thinking about how the impact of racism, the influence of incentives to remain ill, and the complex intersection of identity and health brings light to how these domains may influence how people see themselves and engage in health care. These domains from these stories of the heart may help millions of people living with chronic illnesses like HF to not only live with their illness but inform how their experience is shaped by the systems surrounding them, including health care, government, and systems of power and oppression.
1. Ashton CM, Bozkurt B, Colucci WB, et al. Veterans Affairs quality enhancement research initiative in chronic heart failure. Medical care. 2000;38(6):I-26-I-37.
2. Writing Group Members, Mozaffarian D, Benjamin EJ, et al. Heart disease and stroke statistics-2016 update: a report from the American Heart Association. Circulation. 2016;133(4):e38-e360. doi:10.1161/CIR.0000000000000350
3. Blinderman CD, Homel P, Billings JA, Portenoy RK, Tennstedt SL. Symptom distress and quality of life in patients with advanced congestive heart failure. J Pain Symptom Manage. 2008;35(6):594-603. doi:10.1016/j.jpainsymman.2007.06.007
4. Zambroski CH. Qualitative analysis of living with heart failure. Heart Lung. 2003;32(1):32-40. doi:10.1067/mhl.2003.10
5. Walthall H, Jenkinson C, Boulton M. Living with breathlessness in chronic heart failure: a qualitative study. J Clin Nurs. 2017;26(13-14):2036-2044. doi:10.1111/jocn.13615
6. Francis GS, Greenberg BH, Hsu DT, et al. ACCF/AHA/ACP/HFSA/ISHLT 2010 clinical competence statement on management of patients with advanced heart failure and cardiac transplant: a report of the ACCF/AHA/ACP Task Force on Clinical Competence and Training. J Am Coll Cardiol. 2010;56(5):424-453. doi:10.1016/j.jacc.2010.04.014
7. Rumsfeld JS, Havranek E, Masoudi FA, et al. Depressive symptoms are the strongest predictors of short-term declines in health status in patients with heart failure. J Am Coll Cardiol. 2003;42(10):1811-1817. doi:10.1016/j.jacc.2003.07.013
8. Leeming A, Murray SA, Kendall M. The impact of advanced heart failure on social, psychological and existential aspects and personhood. Eur J Cardiovasc Nurs. 2014;13(2):162-167. doi:10.1177/1474515114520771
9. Bekelman DB, Havranek EP, Becker DM, et al. Symptoms, depression, and quality of life in patients with heart failure. J Card Fail. 2007;13(8):643-648. doi:10.1016/j.cardfail.2007.05.005
10. Weiss E, Coll JE. The influence of military culture and veteran worldviews on mental health treatment: practice implications for combat veteran help-seeking and wellness. Int J Health, Wellness Society. 2011;1(2):75-86. doi:10.18848/2156-8960/CGP/v01i02/41168
11. Sharpe L, Curran L. Understanding the process of adjustment to illness. Soc Sci Med. 2006;62(5):1153-1166. doi:10.1016/j.socscimed.2005.07.010
12. Riessman CK. Narrative Methods for the Human Sciences. SAGE Publications; 2008.
13. Riessman CK. Performing identities in illness narrative: masculinity and multiple sclerosis. Qualitative Research. 2003;3(1):5-33. doi:10.1177/146879410300300101
14. Riessman CK. Strategic uses of narrative in the presentation of self and illness: a research note. Soc Sci Med. 1990;30(11):1195-1200. doi:10.1016/0277-9536(90)90259-U
15. Riessman CK. Analysis of personal narratives. In: Handbook of Interview Research. Sage; 2002:695-710.
16. Riessman CK. Illness Narratives: Positioned Identities. Invited Annual Lecture. Cardiff University. May 2002. Accessed April 14 2022. https://www.researchgate.net/publication/241501264_Illness_Narratives_Positioned_Identities
17. Riessman CK. Performing identities in illness narrative: masculinity and multiple sclerosis. Qual Res. 2003;3(1):5-33. doi:10.1177/146879410300300101
18. Williams G. The genesis of chronic illness: narrative re‐construction. Sociol Health Illn. 1984;6(2):175-200. doi:10.1111/1467-9566.ep10778250
19. White M, Epston D. Narrative Means to Therapeutic Ends. WW Norton & Company; 1990.
20. Burchardt M. Illness Narratives as Theory and Method. SAGE Publications; 2020.
21. Sayer NA, Spoont M, Nelson D. Veterans seeking disability benefits for post-traumatic stress disorder: who applies and the self-reported meaning of disability compensation. Soc Sci Med. 2004;58(11):2133-2143. doi:10.1016/j.socscimed.2003.08.009
22. Winters CA. Heart failure: living with uncertainty. Prog Cardiovasc Nurs. 1999;14(3):85.
23. Plys E, Smith R, Jacobs ML. Masculinity and military culture in VA hospice and palliative care: a narrative review with clinical recommendations. J Palliat Care. 2020;35(2):120-126. doi:10.1177/0825859719851483
24. Johnson LS. Facilitating spiritual meaning‐making for the individual with a diagnosis of a terminal illness. Counseling and Values. 2003;47(3):230-240. doi:10.1002/j.2161-007X.2003.tb00269.x
25. Shahrbabaki PM, Nouhi E, Kazemi M, Ahmadi F. Defective support network: a major obstacle to coping for patients with heart failure: a qualitative study. Glob Health Action. 2016;9:30767. Published 2016 Apr 1. doi:10.3402/gha.v9.30767