User login
Is There a Relationship Between Facility Peer Review Findings and Quality in the Veterans Health Administration?
Hospital leaders report the most common aim of peer review (PR) is to improve quality and patient safety, thus it is a potentially powerful quality improvement (QI) driver.1 “When conducted systematically and credibly, peer review for quality management can result in both short-term and long-term improvements in patient care by revealing areas for improvement in the provision of care,” Veterans Health Administration (VHA) Directive 1190 states. “This ultimately contributes to organizational improvements.” At the same time, there are anecdotal concerns that PR may be used punitively and driven by case outcomes rather than by accepted best practices supporting QI.
Studies of the PR process suggest these concerns are valid. A key tenet of QI is standardization. PR is problematic in that regard; studies show poor interrater reliability for judgments on care, as well as hindsight bias—the fact that raters are strongly influenced by the outcome of care, not the process of care.2-5 There are concerns that case selection or review process when not standardized may be wielded as punitive too.6 In this study, we sought to identify the relationship between PR findings and subsequent institution quality metrics. If PR does lead to an improvement in quality, or if quality concerns are managed within the PR committee, it should be possible to identify a measurable relationship between the PR process and a facility’s subsequent quality measures.
A handful of studies describe the association between PR and quality of care. Itri and colleagues noted that random, not standardized PR in radiology does not achieve reductions in diagnostic error rate.7 However, adoption of just culture principles in PR resulted in a significant improvement in facility leaders’ self-reports of quality measures at surveyed institutions.8 The same author reported that increases in PR standardization and integration with performance improvement activities could explain up to 18% of objective quality measure variation.9
We sought to determine whether a specific aspect of the PR process, the PR committee judgment of quality of care by clinicians, was related to medical center quality in a cross-sectional study of 136 Veterans Health Administration (VHA) medical centers. The VHA is a good source of study because there are standardized PR processes and training for committee members and reviewers. Our hypothesis was that medical centers with a higher number of Level 2 (“most experienced and competent clinicians might have managed the case differently”) and Level 3 (“most experienced and competent providers would have managed the case differently”) PR findings would also have lower quality metric scores for processes and outcomes of care.
Methods
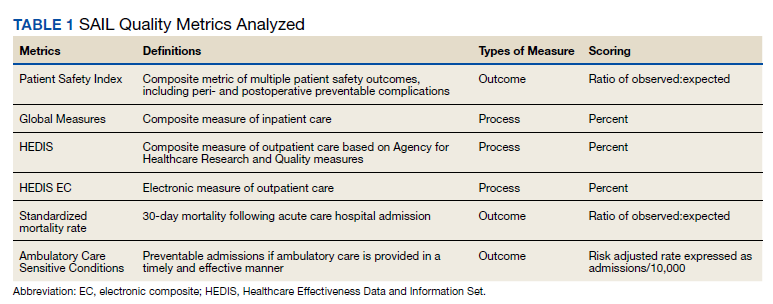
We used PR data from fiscal year 2018 and 2019. VHA PR data are available quarterly and are self-reported by each facility to the VHA Office of Clinical Risk Management. These data are broken down by facility. The following data, when available in both fiscal years 2018 and 2019, were used for this analysis: percent and number of PR that are ranked as level 1, 2, or 3; medical center group (MCG) acuity measure assigned by the VHA (1 is highest, 3 is lowest); and number of PR per 100,000 unique veteran encounters in 2019. Measures of facility quality are drawn from Strategic Analytics for Improvement and Learning (SAIL) data from 2019, which are available quarterly by facility and are rolling for 12 months. SAIL measures processes and outcomes of care. Table 1 indicates which measures are focused on outcomes vs quality processes.
SAS Version 9.2 was used to perform statistical analyses. We used Spearman correlation to estimate the PR and quality relationship.
Results
There were 136 facilities with 2 years of PR data available. The majority of these facilities (89) were highest complexity MCG 1 facilities; 19 were MCG 2, and 28 were MCG 3. Of 13,515 PRs, most of the 9555 PR findings were level 1 (70.7%). The between-facility range of level 2 and 3 findings was large, varying from 3.5% to nearly 70% in 2019 (Table 2). Findings were similar in 2018; facilities level 2 and 3 ratings ranged from 3.6% to 73.5% of all PR findings.
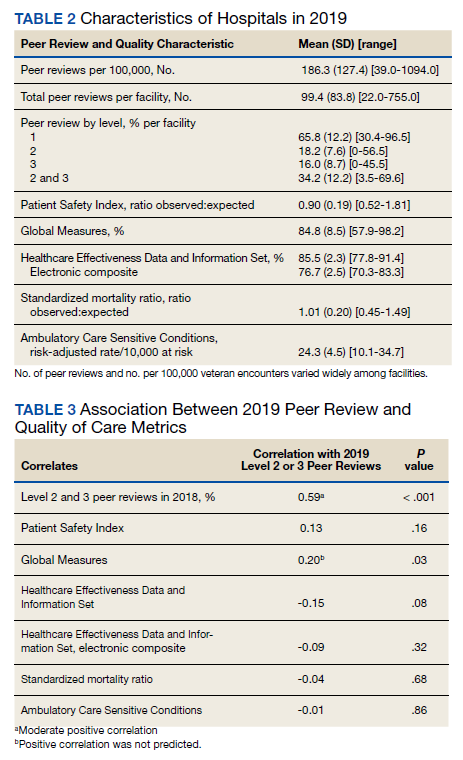
There was no correlation between most quality measures and facility PR findings (Table 3). The only exception was for Global Measures (GM90), an inpatient process of care measure. Unexpectedly, the correlation was positive—facilities with a higher percentage of level 2 and 3 PR findings had better inpatient processes of care SAIL score. The strongest correlation was between 2018 and 2019 PR findings.
Discussion
We hypothesized that a high percentage of level 2 and 3 PR findings would be negatively associated with objective facility measures of care processes in SAIL but we did not see this association. The only quality measure associated with PR findings was GM90, a score of inpatient care processes. However, the association was positive, with better performance associated with more level 2 and 3 PR findings.
The best predictor of the proportion of a facility’s PR findings is the previous year’s PR findings. With an R = 0.59, the previous year findings explain about 35% of the variability in level assignment. Our analysis may describe a new bias in PR, in which committees consistently assign either low or high proportions of level 2 and 3 findings. This correlation could be due to individual PR committee culture or composition, but it does not relate to objective quality measures.
Strengths
For this study we use objective measures of PR processes, the assignment of levels of care.
Limitations
Facilities self-report PR outcomes, so there could be errors in reporting. In addition, this study was cross sectional and not longitudinal and it is possible that change in quality measures over time are correlated with PR findings. Future studies using the VHA PR and SAIL data could evaluate whether changes over time, and perhaps in response to level 2 and 3 findings, would be a more sensitive indicator of the impact of the PR process on quality metrics. Future studies could incorporate the relationship between findings from the All Employee Survey, which is conducted annually, such as psychologic safety, as well as the distance the facility has gone on the high reliability organization journey, with PR findings and SAIL metrics. Finally, PR is focused on the practice of an individual clinician, while SAIL quality metrics reflect facility performance. Interventions possibly stay at the clinician level and do not drive subsequent QI processes.
What does this mean for PR? Since the early 1990s, there have been exhortations from experts to improve PR, by adopting a QI model, or for a deeper integration of PR and QI.1,2,10 Just culture tools, which include QI, are promoted as a means to improve PR.8,11,12 Other studies show PR remains problematic in terms of standardization, incorporation of best practices, redesigning systems of care, or demonstrable improvements to facility safety and care quality.1,4,6,8 Several publications have described interventions to improve PR. Deyo-Svedson discussed a program with standardized training and triggers, much like VHA.13 Itri and colleagues standardized PR in radiology to target areas of known diagnostic error, as well as use the issues assessed in PR to perform QI and education. One example of a successful QI effort involved changing the radiology reporting template to make sure areas that are prone to diagnostic error are addressed.7
Conclusions
Since 35% of PR level variance is correlated with prior year’s results, PR committees should look at increased standardization in reviews and findings. We endorse a strong focus on standardization, application of just culture tools to case reviews, and tighter linkage between process and outcome metrics measured by SAIL and PR case finding. Studies should be performed to pilot interventions to improve the linkage between PR and quality, so that greater and faster gains can be made in quality processes and, leading from this, outcomes. Additionally, future research should investigate why some facilities consistently choose higher or lower PR ratings.
Acknowledgments
We acknowledge Dr. George “Web” Ross for his helpful edits.
1. Edwards MT. In pursuit of quality and safety: an 8-year study of clinical peer review best practices in US hospitals. Int J Qual Health Care. 2018;30(8):602-607. doi:10.1093/intqhc/mzy069
2. Dans PE. Clinical peer Review: burnishing a tarnished icon. Ann Intern Med. 1993;118(7):566-568. doi:10.7326/0003-4819-118-7-199304010-00014
3. Goldman RL. The reliability of peer assessments of quality of care. JAMA. 1992;267(7):958-960. doi:10.1001/jama.1992.03480070074034
4. Swaroop R. Disrupting physician clinical practice peer review. Perm J. 2019;23:18-207. doi:10.7812/TPP/18-207
5. Caplan RA, Posner KL, Cheney FW. Effect of outcome on physician judgments of appropriateness of care. JAMA. 1991;265(15):1957–1960. doi:10.1001/jama.1991.03460150061024
6. Vyas D, Hozain AE. Clinical peer review in the United States: history, legal development and subsequent abuse. World J Gastroenterol. 2014;20(21):6357-6363. doi:10.3748/wjg.v20.i21.6357
7. Itri JN, Donithan A, Patel SH. Random versus nonrandom peer review: a case for more meaningful peer review. J Am Coll Radiol. 2018;15(7):1045-1052. doi:10.1016/j.jacr.2018.03.054
8. Edwards MT. An assessment of the impact of just culture on quality and safety in US hospitals. Am J Med Qual. 2018; 33(5):502-508. doi:10.1177/1062860618768057
9. Edwards MT. The objective impact of clinical peer review on hospital quality and safety. Am J Med Qual. 2011;26(2);110-119. doi:10.1177/1062860610380732
10. Berwick DM. Peer review and quality management: are they compatible?. QRB Qual Rev Bull. 1990;16(7):246-251. doi:10.1016/s0097-5990(16)30377-3
11. Volkar JK, Phrampus P, English D, et al. Institution of just culture physician peer review in an academic medical center. J Patient Saf. 2021;17(7):e689-e693. doi:10.1097/PTS.0000000000000449
12. Burns J, Miller T, Weiss JM, Erdfarb A, Silber D, Goldberg-Stein S. Just culture: practical implementation for radiologist peer review. J Am Coll Radiol. 2019;16(3):384-388. doi:10.1016/j.jacr.2018.10.021
13. Deyo-Svendsen ME, Phillips MR, Albright JK, et al. A systematic approach to clinical peer review in a critical access hospital. Qual Manag Health Care. 2016;25(4):213-218. doi:10.1097/QMH.0000000000000113
Hospital leaders report the most common aim of peer review (PR) is to improve quality and patient safety, thus it is a potentially powerful quality improvement (QI) driver.1 “When conducted systematically and credibly, peer review for quality management can result in both short-term and long-term improvements in patient care by revealing areas for improvement in the provision of care,” Veterans Health Administration (VHA) Directive 1190 states. “This ultimately contributes to organizational improvements.” At the same time, there are anecdotal concerns that PR may be used punitively and driven by case outcomes rather than by accepted best practices supporting QI.
Studies of the PR process suggest these concerns are valid. A key tenet of QI is standardization. PR is problematic in that regard; studies show poor interrater reliability for judgments on care, as well as hindsight bias—the fact that raters are strongly influenced by the outcome of care, not the process of care.2-5 There are concerns that case selection or review process when not standardized may be wielded as punitive too.6 In this study, we sought to identify the relationship between PR findings and subsequent institution quality metrics. If PR does lead to an improvement in quality, or if quality concerns are managed within the PR committee, it should be possible to identify a measurable relationship between the PR process and a facility’s subsequent quality measures.
A handful of studies describe the association between PR and quality of care. Itri and colleagues noted that random, not standardized PR in radiology does not achieve reductions in diagnostic error rate.7 However, adoption of just culture principles in PR resulted in a significant improvement in facility leaders’ self-reports of quality measures at surveyed institutions.8 The same author reported that increases in PR standardization and integration with performance improvement activities could explain up to 18% of objective quality measure variation.9
We sought to determine whether a specific aspect of the PR process, the PR committee judgment of quality of care by clinicians, was related to medical center quality in a cross-sectional study of 136 Veterans Health Administration (VHA) medical centers. The VHA is a good source of study because there are standardized PR processes and training for committee members and reviewers. Our hypothesis was that medical centers with a higher number of Level 2 (“most experienced and competent clinicians might have managed the case differently”) and Level 3 (“most experienced and competent providers would have managed the case differently”) PR findings would also have lower quality metric scores for processes and outcomes of care.
Methods
We used PR data from fiscal year 2018 and 2019. VHA PR data are available quarterly and are self-reported by each facility to the VHA Office of Clinical Risk Management. These data are broken down by facility. The following data, when available in both fiscal years 2018 and 2019, were used for this analysis: percent and number of PR that are ranked as level 1, 2, or 3; medical center group (MCG) acuity measure assigned by the VHA (1 is highest, 3 is lowest); and number of PR per 100,000 unique veteran encounters in 2019. Measures of facility quality are drawn from Strategic Analytics for Improvement and Learning (SAIL) data from 2019, which are available quarterly by facility and are rolling for 12 months. SAIL measures processes and outcomes of care. Table 1 indicates which measures are focused on outcomes vs quality processes.
SAS Version 9.2 was used to perform statistical analyses. We used Spearman correlation to estimate the PR and quality relationship.
Results
There were 136 facilities with 2 years of PR data available. The majority of these facilities (89) were highest complexity MCG 1 facilities; 19 were MCG 2, and 28 were MCG 3. Of 13,515 PRs, most of the 9555 PR findings were level 1 (70.7%). The between-facility range of level 2 and 3 findings was large, varying from 3.5% to nearly 70% in 2019 (Table 2). Findings were similar in 2018; facilities level 2 and 3 ratings ranged from 3.6% to 73.5% of all PR findings.
There was no correlation between most quality measures and facility PR findings (Table 3). The only exception was for Global Measures (GM90), an inpatient process of care measure. Unexpectedly, the correlation was positive—facilities with a higher percentage of level 2 and 3 PR findings had better inpatient processes of care SAIL score. The strongest correlation was between 2018 and 2019 PR findings.
Discussion
We hypothesized that a high percentage of level 2 and 3 PR findings would be negatively associated with objective facility measures of care processes in SAIL but we did not see this association. The only quality measure associated with PR findings was GM90, a score of inpatient care processes. However, the association was positive, with better performance associated with more level 2 and 3 PR findings.
The best predictor of the proportion of a facility’s PR findings is the previous year’s PR findings. With an R = 0.59, the previous year findings explain about 35% of the variability in level assignment. Our analysis may describe a new bias in PR, in which committees consistently assign either low or high proportions of level 2 and 3 findings. This correlation could be due to individual PR committee culture or composition, but it does not relate to objective quality measures.
Strengths
For this study we use objective measures of PR processes, the assignment of levels of care.
Limitations
Facilities self-report PR outcomes, so there could be errors in reporting. In addition, this study was cross sectional and not longitudinal and it is possible that change in quality measures over time are correlated with PR findings. Future studies using the VHA PR and SAIL data could evaluate whether changes over time, and perhaps in response to level 2 and 3 findings, would be a more sensitive indicator of the impact of the PR process on quality metrics. Future studies could incorporate the relationship between findings from the All Employee Survey, which is conducted annually, such as psychologic safety, as well as the distance the facility has gone on the high reliability organization journey, with PR findings and SAIL metrics. Finally, PR is focused on the practice of an individual clinician, while SAIL quality metrics reflect facility performance. Interventions possibly stay at the clinician level and do not drive subsequent QI processes.
What does this mean for PR? Since the early 1990s, there have been exhortations from experts to improve PR, by adopting a QI model, or for a deeper integration of PR and QI.1,2,10 Just culture tools, which include QI, are promoted as a means to improve PR.8,11,12 Other studies show PR remains problematic in terms of standardization, incorporation of best practices, redesigning systems of care, or demonstrable improvements to facility safety and care quality.1,4,6,8 Several publications have described interventions to improve PR. Deyo-Svedson discussed a program with standardized training and triggers, much like VHA.13 Itri and colleagues standardized PR in radiology to target areas of known diagnostic error, as well as use the issues assessed in PR to perform QI and education. One example of a successful QI effort involved changing the radiology reporting template to make sure areas that are prone to diagnostic error are addressed.7
Conclusions
Since 35% of PR level variance is correlated with prior year’s results, PR committees should look at increased standardization in reviews and findings. We endorse a strong focus on standardization, application of just culture tools to case reviews, and tighter linkage between process and outcome metrics measured by SAIL and PR case finding. Studies should be performed to pilot interventions to improve the linkage between PR and quality, so that greater and faster gains can be made in quality processes and, leading from this, outcomes. Additionally, future research should investigate why some facilities consistently choose higher or lower PR ratings.
Acknowledgments
We acknowledge Dr. George “Web” Ross for his helpful edits.
1. Edwards MT. In pursuit of quality and safety: an 8-year study of clinical peer review best practices in US hospitals. Int J Qual Health Care. 2018;30(8):602-607. doi:10.1093/intqhc/mzy069
2. Dans PE. Clinical peer Review: burnishing a tarnished icon. Ann Intern Med. 1993;118(7):566-568. doi:10.7326/0003-4819-118-7-199304010-00014
3. Goldman RL. The reliability of peer assessments of quality of care. JAMA. 1992;267(7):958-960. doi:10.1001/jama.1992.03480070074034
4. Swaroop R. Disrupting physician clinical practice peer review. Perm J. 2019;23:18-207. doi:10.7812/TPP/18-207
5. Caplan RA, Posner KL, Cheney FW. Effect of outcome on physician judgments of appropriateness of care. JAMA. 1991;265(15):1957–1960. doi:10.1001/jama.1991.03460150061024
6. Vyas D, Hozain AE. Clinical peer review in the United States: history, legal development and subsequent abuse. World J Gastroenterol. 2014;20(21):6357-6363. doi:10.3748/wjg.v20.i21.6357
7. Itri JN, Donithan A, Patel SH. Random versus nonrandom peer review: a case for more meaningful peer review. J Am Coll Radiol. 2018;15(7):1045-1052. doi:10.1016/j.jacr.2018.03.054
8. Edwards MT. An assessment of the impact of just culture on quality and safety in US hospitals. Am J Med Qual. 2018; 33(5):502-508. doi:10.1177/1062860618768057
9. Edwards MT. The objective impact of clinical peer review on hospital quality and safety. Am J Med Qual. 2011;26(2);110-119. doi:10.1177/1062860610380732
10. Berwick DM. Peer review and quality management: are they compatible?. QRB Qual Rev Bull. 1990;16(7):246-251. doi:10.1016/s0097-5990(16)30377-3
11. Volkar JK, Phrampus P, English D, et al. Institution of just culture physician peer review in an academic medical center. J Patient Saf. 2021;17(7):e689-e693. doi:10.1097/PTS.0000000000000449
12. Burns J, Miller T, Weiss JM, Erdfarb A, Silber D, Goldberg-Stein S. Just culture: practical implementation for radiologist peer review. J Am Coll Radiol. 2019;16(3):384-388. doi:10.1016/j.jacr.2018.10.021
13. Deyo-Svendsen ME, Phillips MR, Albright JK, et al. A systematic approach to clinical peer review in a critical access hospital. Qual Manag Health Care. 2016;25(4):213-218. doi:10.1097/QMH.0000000000000113
BRAF V600E Expression in Primary Melanoma and Its Association With Death: A Population-Based, Retrospective, Cross-Sectional Study
Approximately 50% of melanomas contain BRAF mutations, which occur in a greater proportion of melanomas found on sites of intermittent sun exposure.1BRAF-mutated melanomas have been associated with high levels of early-life ambient UV exposure, especially between ages 0 and 20 years.2 In addition, studies have shown that BRAF-mutated melanomas commonly are found on the trunk and extremities.1-3BRAF mutations also have been associated with younger age, superficial spreading subtype and low tumor thickness, absence of dermal melanocyte mitosis, low Ki-67 score, low phospho-histone H3 score, pigmented melanoma, advanced melanoma stage, and conjunctival melanoma.4-7BRAF mutations are found more frequently in metastatic melanoma lesions than primary melanomas, suggesting that BRAF mutations may be acquired during metastasis.8 Studies have shown different conclusions on the effect of BRAF mutation on melanoma-related death.5,9,10
The aim of this study was to identify trends in BRAF V600E–mutated melanoma according to age, sex, and melanoma-specific survival among Olmsted County, Minnesota, residents with a first diagnosis of melanoma at 18 to 60 years of age.
Methods
In total, 638 patients aged 18 to 60 years who resided in Olmsted County and had a first lifetime diagnosis of cutaneous melanoma between 1970 and 2009 were retrospectively identified as a part of the Rochester Epidemiology Project (REP). The REP is a health records linkage system that encompasses almost all sources of medical care available to the local population of Olmsted County.11 This study was approved by the Mayo Clinic Institutional Review Board (Rochester, Minnesota).
Of the 638 individuals identified in the REP, 536 had been seen at Mayo Clinic and thus potentially had tissue blocks available for the study of BRAF mutation expression. Of these 536 patients, 156 did not have sufficient residual tissue available. As a result, 380 (60%) of the original 638 patients had available blocks with sufficient tissue for immunohistochemical analysis of BRAF expression. Only primary cutaneous melanomas were included in the present study.
All specimens were reviewed by a board-certified dermatopathologist (J.S.L.) for appropriateness of inclusion, which involved confirmation of the diagnosis of melanoma, histologic type of melanoma, and presence of sufficient residual tissue for immunohistochemical stains.
All specimens were originally diagnosed as malignant melanoma at the time of clinical care by at least 2 board-certified dermatopathologists. For the purposes of this study, all specimens were rereviewed for diagnostic accuracy. We required that specimens exhibit severe cytologic and architectural atypia as well as other features favoring melanoma, such as consumption of rete pegs, pagetosis, confluence of junctional melanocytes, evidence of regression, lack of maturation of melanocytes with descent into the dermis, or mitotic figures among the dermal melanocyte population.
The available tissue blocks were retrieved, sectioned, confirmed as melanoma, and stained with a mouse antihuman BRAF V600E monoclonal antibody (clone VE1; Spring Bioscience) to determine the presence of a BRAF V600E mutation. BRAF staining was evaluated in conjunction with a review of the associated slides stained with hematoxylin and eosin. Cytoplasmic staining of melanocytes for BRAF was graded as negative, focal or partial positive (<50% of tumor), or diffuse positive (>50% of tumor)(Figure 1). When a melanoma arose in association with a nevus, we considered only the melanoma component for BRAF staining. We categorized the histologic type as superficial spreading, nodular, or lentigo maligna, and the location as head and neck, trunk, or extremities.

Patient characteristics and survival outcomes were gathered through the health record and included age, Breslow thickness, location, decade of diagnosis, histologic type, stage (ie, noninvasive, invasive, or advanced), and follow-up. Pathologic stage 0 was considered noninvasive; stages IA and IB, invasive; and stages IIA or higher, advanced.
Statistical Analysis—Comparisons between the group of patients in the study (n=380) and the group of patients excluded for the reasons stated above (n=258) as well as associations of mutant BRAF status (positive [partial positive and diffuse positive] vs negative) with patient age (young adults [age range, 18–39 years] and middle-aged adults [age range, 40–60 years]), sex, decade of diagnosis, location, histologic type, and stage were evaluated with Wilcoxon rank sum, χ2, Fisher exact, or Cochran-Armitage trend tests. Disease-specific survival and overall survival rates were estimated with the Kaplan-Meier method, and the duration of follow-up was calculated from the date of melanoma diagnosis to the date of death or the last follow-up. Associations of mutant BRAF expression status with death from melanoma and death from any cause were evaluated with Cox proportional hazard regression models and summarized with hazard ratio (HR) and 95% CI. Survival analyses were limited to patients with invasive or advanced disease. Statistical analyses were performed with SAS statistical software (SAS version 9.4). All tests were 2-sided, and P<.05 was considered statistically significant.
Results
Clinical and Tumor Characteristics—Of the 380 tissue specimens that underwent BRAF V600E analysis, 247 had negative staining; 106 had diffuse strong staining; and 27 had focal or partial staining. In total, 133 (35%) were positive, either partially or diffusely. The median age for patients who had negative staining was 45 years; for those with positive staining, it was 41 years (P=.07).
The patients who met inclusion criteria (n=380) were compared with those who were excluded (n=258)(eTable 1). The groups were similar on the basis of sex; age; and melanoma location, stage, and histologic subtype. However, some evidence showed that patients included in the study received the diagnosis of melanoma more recently (1970-1989, 13.2%; 1990-1999, 28.7%; 2000-2009, 58.2%) than those who were excluded (1970-1989, 24.7%; 1990-1999, 23.5%; 2000-2009, 51.8%)(P=.02).
BRAF V600E expression was more commonly found in superficial spreading (37.7%) and nodular melanomas (35.0%) than in situ melanomas (17.1%)(P=.01). Other characteristics of BRAF V600E expression are described in eTable 2. Overall, invasive and advanced melanomas were significantly more likely to harbor BRAF V600E expression than noninvasive melanomas (39.6% and 37.9%, respectively, vs 17.9%; P=.003). However, advanced melanomas more commonly expressed BRAF positivity among women, and invasive melanomas more commonly expressed BRAF positivity among men (eTable 2).
Survival—Survival analyses were limited to 297 patients with confirmed invasive or advanced disease. Of these, 180 (61%) had no BRAF V600E staining; 25 (8%) had partial staining; and 92 (31%) had diffuse positive staining. In total, 117 patients (39%) had a BRAF-mutated melanoma.
Among the patients still alive, the median (interquartile range [IQR]) duration of follow-up was 10.2 (7.0-16.8) years. Thirty-nine patients with invasive or advanced disease had died of any cause at a median (IQR) of 3.0 (1.3-10.2) years after diagnosis. In total, 26 patients died of melanoma at a median (IQR) follow-up of 2.5 (1.3-7.4) years after diagnosis. Eight women and 18 men died of malignant melanoma. Five deaths occurred because of malignant melanoma among patients aged 18 to 39 years, and 21 occurred among patients aged 40 to 60 years. In the 18- to 39-year-old group, all 5 deaths were among patients with a BRAF-positive melanoma. Estimated disease-specific survival rate (95% CI; number still at risk) at 5, 10, 15, and 20 years after diagnosis was 94% (91%-97%; 243), 91% (87%-95%; 142), 89% (85%-94%; 87), and 88% (83%-93%; 45), respectively.
In a univariable analysis, the HR for association of positive mutant BRAF expression with death of malignant melanoma was 1.84 (95% CI, 0.85-3.98; P=.12). No statistically significant interaction was observed between decade of diagnosis and BRAF expression (P=.60). However, the interaction between sex and BRAF expression was significant (P=.04), with increased risk of death from melanoma among women with BRAF-mutated melanoma (HR, 10.88; 95% CI, 1.34-88.41; P=.026) but not among men (HR 1.02; 95% CI, 0.40-2.64; P=.97)(Figures 2A and 2B). The HR for death from malignant melanoma among young adults aged 18 to 39 years with a BRAF-mutated melanoma was 16.4 (95% CI, 0.81-330.10; P=.068), whereas the HR among adults aged 40 to 60 years with a BRAF-mutated melanoma was 1.24 (95% CI, 0.52-2.98; P=.63)(Figures 2C and 2D).
(P=.97). B, Melanoma disease-specific survival rate by sex (female)(P=.026). C, Melanoma disease-specific survival rate by 18 to 39 years of age (P=.068). D, Melanoma disease-specific survival rate")
BRAF V600E expression was not significantly associated with death from any cause (HR, 1.39; 95% CI, 0.74-2.61; P=.31) or with decade of diagnosis (P=.13). Similarly, BRAF expression was not associated with death from any cause according to sex (P=.31). However, a statistically significant interaction was seen between age at diagnosis and BRAF expression (P=.003). BRAF expression was significantly associated with death from any cause for adults aged 18 to 39 years (HR, 9.60; 95% CI, 1.15-80.00; P=.04). In comparison, no association of BRAF expression with death was observed for adults aged 40 to 60 years (HR, 0.99; 95% CI, 0.48-2.03; P=.98).
Comment
We found that melanomas with BRAF mutations were more likely in advanced and invasive melanoma. The frequency of BRAF mutations among melanomas that were considered advanced was higher in women than men. Although the number of deaths was limited, women with a melanoma with BRAF expression were more likely to die of melanoma, young adults with a BRAF-mutated melanoma had an almost 10-fold increased risk of dying from any cause, and middle-aged adults showed no increased risk of death. These findings suggest that young adults who are genetically prone to a BRAF-mutated melanoma could be at a disadvantage for all-cause mortality. Although this finding was significant, the 95% CI was large, and further studies would be warranted before sound conclusions could be made.
Melanoma has been increasing in incidence across all age groups in Olmsted County over the last 4 decades.12-14 However, our results show that the percentage of BRAF-mutated melanomas in this population has been stable over time, with no statistically significant difference by age or sex. Other confounding factors may have an influence, such as increased rates of early detection and diagnosis of melanoma in contemporary times. Our data suggest that patients included in the BRAF-mutation analysis study had received the diagnosis of melanoma more recently than those who were excluded from the study, which could be due to older melanomas being less likely to have adequate tissue specimens available for immunohistochemical staining/evaluation.
Prior research has shown that BRAF-mutated melanomas typically occur on the trunk and are more likely in individuals with more than 14 nevi on the back.2 In the present cohort, BRAF-positive melanomas had a predisposition toward the trunk but also were found on the head, neck, and extremities—areas that are more likely to have long-term sun damage. One suggestion is that 2 distinct pathways for melanoma development exist: one associated with a large number of melanocytic nevi (that is more prone to genetic mutations in melanocytes) and the other associated with long-term sun exposure.15,16 The combination of these hypotheses suggests that individuals who are prone to the development of large numbers of nevi may require sun exposure for the initial insult, but the development of melanoma may be carried out by other factors after this initial sun exposure insult, whereas individuals without large numbers of nevi who may have less genetic risk may require continued long-term sun exposure for melanoma to develop.17
Our study had limitations, including the small numbers of deaths overall and cause-specific deaths of metastatic melanoma, which limited our ability to conduct more extensive multivariable modeling. Also, the retrospective nature and time frame of looking back 4 decades did not allow us to have information sufficient to categorize some patients as having dysplastic nevus syndrome or not, which would be a potentially interesting variable to include in the analysis. Because the number of deaths in the 18- to 39-year-old cohort was only 5, further statistical comparison regarding tumor type and other variables pertaining to BRAF positivity were not possible. In addition, our data were collected from patients residing in a single geographic county (Olmsted County, Minnesota), which may limit generalizability. Lastly, BRAF V600E mutations were identified through immunostaining only, not molecular data, so it is possible some patients had false-negative immunohistochemistry findings and thus were not identified.
Conclusion
BRAF-mutated melanomas were found in 35% of our cohort, with no significant change in the percentage of melanomas with BRAF V600E mutations over the last 4 decades in this population. In addition, no differences or significant trends existed according to sex and BRAF-mutated melanoma development. Women with BRAF-mutated melanomas were more likely to die of metastatic melanoma than men, and young adults with BRAF-mutated melanomas had a higher all-cause mortality risk. Further research is needed to decipher what effect BRAF-mutated melanomas have on metastasis and cause-specific death in women as well as all-cause mortality in young adults.
Acknowledgment—The authors are indebted to Scientific Publications, Mayo Clinic (Rochester, Minnesota).
- Grimaldi AM, Cassidy PB, Leachmann S, et al. Novel approaches in melanoma prevention and therapy. Cancer Treat Res. 2014;159: 443-455.
- Thomas NE, Edmiston SN, Alexander A, et al. Number of nevi and early-life ambient UV exposure are associated with BRAF-mutant melanoma. Cancer Epidemiol Biomarkers Prev. 2007;16:991-997.
- Curtin JA, Fridlyand J, Kageshita T, et al. Distinct sets of genetic alterations in melanoma. N Engl J Med. 2005;353:2135-2147.
- Thomas NE, Edmiston SN, Alexander A, et al. Association between NRAS and BRAF mutational status and melanoma-specific survival among patients with higher-risk primary melanoma. JAMA Oncol. 2015;1:359-368.
- Liu W, Kelly JW, Trivett M, et al. Distinct clinical and pathological features are associated with the BRAF(T1799A(V600E)) mutation in primary melanoma. J Invest Dermatol. 2007;127:900-905.
- Kim SY, Kim SN, Hahn HJ, et al. Metaanalysis of BRAF mutations and clinicopathologic characteristics in primary melanoma. J Am Acad Dermatol. 2015;72:1036-1046.e2.
- Larsen AC, Dahl C, Dahmcke CM, et al. BRAF mutations in conjunctival melanoma: investigation of incidence, clinicopathological features, prognosis and paired premalignant lesions. Acta Ophthalmol. 2016;94:463-470.
- Shinozaki M, Fujimoto A, Morton DL, et al. Incidence of BRAF oncogene mutation and clinical relevance for primary cutaneous melanomas. Clin Cancer Res. 2004;10:1753-1757.
- Heppt MV, Siepmann T, Engel J, et al. Prognostic significance of BRAF and NRAS mutations in melanoma: a German study from routine care. BMC Cancer. 2017;17:536.
- Mar VJ, Liu W, Devitt B, et al. The role of BRAF mutations in primary melanoma growth rate and survival. Br J Dermatol. 2015;173:76-82.
- Rocca WA, Yawn BP, St Sauver JL, et al. History of the Rochester Epidemiology Project: half a century of medical records linkage in a US population. Mayo Clin Proc. 2012;87:1202-1213.
- Reed KB, Brewer JD, Lohse CM, et al. Increasing incidence of melanoma among young adults: an epidemiological study in Olmsted County, Minnesota. Mayo Clin Proc. 2012;87:328-334.
- Olazagasti Lourido JM, Ma JE, Lohse CM, et al. Increasing incidence of melanoma in the elderly: an epidemiological study in Olmsted County, Minnesota. Mayo Clin Proc. 2016;91:1555-1562.
- Lowe GC, Saavedra A, Reed KB, et al. Increasing incidence of melanoma among middle-aged adults: an epidemiologic study in Olmsted County, Minnesota. Mayo Clin Proc. 2014;89:52-59.
- Whiteman DC, Parsons PG, Green AC. p53 expression and risk factors for cutaneous melanoma: a case-control study. Int J Cancer. 1998;77:843-848.
- Whiteman DC, Watt P, Purdie DM, et al. Melanocytic nevi, solar keratoses, and divergent pathways to cutaneous melanoma. J Natl Cancer Inst. 2003;95:806-812.
- Olsen CM, Zens MS, Green AC, et al. Biologic markers of sun exposure and melanoma risk in women: pooled case-control analysis. Int J Cancer. 2011;129:713-723.
Approximately 50% of melanomas contain BRAF mutations, which occur in a greater proportion of melanomas found on sites of intermittent sun exposure.1BRAF-mutated melanomas have been associated with high levels of early-life ambient UV exposure, especially between ages 0 and 20 years.2 In addition, studies have shown that BRAF-mutated melanomas commonly are found on the trunk and extremities.1-3BRAF mutations also have been associated with younger age, superficial spreading subtype and low tumor thickness, absence of dermal melanocyte mitosis, low Ki-67 score, low phospho-histone H3 score, pigmented melanoma, advanced melanoma stage, and conjunctival melanoma.4-7BRAF mutations are found more frequently in metastatic melanoma lesions than primary melanomas, suggesting that BRAF mutations may be acquired during metastasis.8 Studies have shown different conclusions on the effect of BRAF mutation on melanoma-related death.5,9,10
The aim of this study was to identify trends in BRAF V600E–mutated melanoma according to age, sex, and melanoma-specific survival among Olmsted County, Minnesota, residents with a first diagnosis of melanoma at 18 to 60 years of age.
Methods
In total, 638 patients aged 18 to 60 years who resided in Olmsted County and had a first lifetime diagnosis of cutaneous melanoma between 1970 and 2009 were retrospectively identified as a part of the Rochester Epidemiology Project (REP). The REP is a health records linkage system that encompasses almost all sources of medical care available to the local population of Olmsted County.11 This study was approved by the Mayo Clinic Institutional Review Board (Rochester, Minnesota).
Of the 638 individuals identified in the REP, 536 had been seen at Mayo Clinic and thus potentially had tissue blocks available for the study of BRAF mutation expression. Of these 536 patients, 156 did not have sufficient residual tissue available. As a result, 380 (60%) of the original 638 patients had available blocks with sufficient tissue for immunohistochemical analysis of BRAF expression. Only primary cutaneous melanomas were included in the present study.
All specimens were reviewed by a board-certified dermatopathologist (J.S.L.) for appropriateness of inclusion, which involved confirmation of the diagnosis of melanoma, histologic type of melanoma, and presence of sufficient residual tissue for immunohistochemical stains.
All specimens were originally diagnosed as malignant melanoma at the time of clinical care by at least 2 board-certified dermatopathologists. For the purposes of this study, all specimens were rereviewed for diagnostic accuracy. We required that specimens exhibit severe cytologic and architectural atypia as well as other features favoring melanoma, such as consumption of rete pegs, pagetosis, confluence of junctional melanocytes, evidence of regression, lack of maturation of melanocytes with descent into the dermis, or mitotic figures among the dermal melanocyte population.
The available tissue blocks were retrieved, sectioned, confirmed as melanoma, and stained with a mouse antihuman BRAF V600E monoclonal antibody (clone VE1; Spring Bioscience) to determine the presence of a BRAF V600E mutation. BRAF staining was evaluated in conjunction with a review of the associated slides stained with hematoxylin and eosin. Cytoplasmic staining of melanocytes for BRAF was graded as negative, focal or partial positive (<50% of tumor), or diffuse positive (>50% of tumor)(Figure 1). When a melanoma arose in association with a nevus, we considered only the melanoma component for BRAF staining. We categorized the histologic type as superficial spreading, nodular, or lentigo maligna, and the location as head and neck, trunk, or extremities.
Patient characteristics and survival outcomes were gathered through the health record and included age, Breslow thickness, location, decade of diagnosis, histologic type, stage (ie, noninvasive, invasive, or advanced), and follow-up. Pathologic stage 0 was considered noninvasive; stages IA and IB, invasive; and stages IIA or higher, advanced.
Statistical Analysis—Comparisons between the group of patients in the study (n=380) and the group of patients excluded for the reasons stated above (n=258) as well as associations of mutant BRAF status (positive [partial positive and diffuse positive] vs negative) with patient age (young adults [age range, 18–39 years] and middle-aged adults [age range, 40–60 years]), sex, decade of diagnosis, location, histologic type, and stage were evaluated with Wilcoxon rank sum, χ2, Fisher exact, or Cochran-Armitage trend tests. Disease-specific survival and overall survival rates were estimated with the Kaplan-Meier method, and the duration of follow-up was calculated from the date of melanoma diagnosis to the date of death or the last follow-up. Associations of mutant BRAF expression status with death from melanoma and death from any cause were evaluated with Cox proportional hazard regression models and summarized with hazard ratio (HR) and 95% CI. Survival analyses were limited to patients with invasive or advanced disease. Statistical analyses were performed with SAS statistical software (SAS version 9.4). All tests were 2-sided, and P<.05 was considered statistically significant.
Results
Clinical and Tumor Characteristics—Of the 380 tissue specimens that underwent BRAF V600E analysis, 247 had negative staining; 106 had diffuse strong staining; and 27 had focal or partial staining. In total, 133 (35%) were positive, either partially or diffusely. The median age for patients who had negative staining was 45 years; for those with positive staining, it was 41 years (P=.07).
The patients who met inclusion criteria (n=380) were compared with those who were excluded (n=258)(eTable 1). The groups were similar on the basis of sex; age; and melanoma location, stage, and histologic subtype. However, some evidence showed that patients included in the study received the diagnosis of melanoma more recently (1970-1989, 13.2%; 1990-1999, 28.7%; 2000-2009, 58.2%) than those who were excluded (1970-1989, 24.7%; 1990-1999, 23.5%; 2000-2009, 51.8%)(P=.02).
BRAF V600E expression was more commonly found in superficial spreading (37.7%) and nodular melanomas (35.0%) than in situ melanomas (17.1%)(P=.01). Other characteristics of BRAF V600E expression are described in eTable 2. Overall, invasive and advanced melanomas were significantly more likely to harbor BRAF V600E expression than noninvasive melanomas (39.6% and 37.9%, respectively, vs 17.9%; P=.003). However, advanced melanomas more commonly expressed BRAF positivity among women, and invasive melanomas more commonly expressed BRAF positivity among men (eTable 2).
Survival—Survival analyses were limited to 297 patients with confirmed invasive or advanced disease. Of these, 180 (61%) had no BRAF V600E staining; 25 (8%) had partial staining; and 92 (31%) had diffuse positive staining. In total, 117 patients (39%) had a BRAF-mutated melanoma.
Among the patients still alive, the median (interquartile range [IQR]) duration of follow-up was 10.2 (7.0-16.8) years. Thirty-nine patients with invasive or advanced disease had died of any cause at a median (IQR) of 3.0 (1.3-10.2) years after diagnosis. In total, 26 patients died of melanoma at a median (IQR) follow-up of 2.5 (1.3-7.4) years after diagnosis. Eight women and 18 men died of malignant melanoma. Five deaths occurred because of malignant melanoma among patients aged 18 to 39 years, and 21 occurred among patients aged 40 to 60 years. In the 18- to 39-year-old group, all 5 deaths were among patients with a BRAF-positive melanoma. Estimated disease-specific survival rate (95% CI; number still at risk) at 5, 10, 15, and 20 years after diagnosis was 94% (91%-97%; 243), 91% (87%-95%; 142), 89% (85%-94%; 87), and 88% (83%-93%; 45), respectively.
In a univariable analysis, the HR for association of positive mutant BRAF expression with death of malignant melanoma was 1.84 (95% CI, 0.85-3.98; P=.12). No statistically significant interaction was observed between decade of diagnosis and BRAF expression (P=.60). However, the interaction between sex and BRAF expression was significant (P=.04), with increased risk of death from melanoma among women with BRAF-mutated melanoma (HR, 10.88; 95% CI, 1.34-88.41; P=.026) but not among men (HR 1.02; 95% CI, 0.40-2.64; P=.97)(Figures 2A and 2B). The HR for death from malignant melanoma among young adults aged 18 to 39 years with a BRAF-mutated melanoma was 16.4 (95% CI, 0.81-330.10; P=.068), whereas the HR among adults aged 40 to 60 years with a BRAF-mutated melanoma was 1.24 (95% CI, 0.52-2.98; P=.63)(Figures 2C and 2D).
BRAF V600E expression was not significantly associated with death from any cause (HR, 1.39; 95% CI, 0.74-2.61; P=.31) or with decade of diagnosis (P=.13). Similarly, BRAF expression was not associated with death from any cause according to sex (P=.31). However, a statistically significant interaction was seen between age at diagnosis and BRAF expression (P=.003). BRAF expression was significantly associated with death from any cause for adults aged 18 to 39 years (HR, 9.60; 95% CI, 1.15-80.00; P=.04). In comparison, no association of BRAF expression with death was observed for adults aged 40 to 60 years (HR, 0.99; 95% CI, 0.48-2.03; P=.98).
Comment
We found that melanomas with BRAF mutations were more likely in advanced and invasive melanoma. The frequency of BRAF mutations among melanomas that were considered advanced was higher in women than men. Although the number of deaths was limited, women with a melanoma with BRAF expression were more likely to die of melanoma, young adults with a BRAF-mutated melanoma had an almost 10-fold increased risk of dying from any cause, and middle-aged adults showed no increased risk of death. These findings suggest that young adults who are genetically prone to a BRAF-mutated melanoma could be at a disadvantage for all-cause mortality. Although this finding was significant, the 95% CI was large, and further studies would be warranted before sound conclusions could be made.
Melanoma has been increasing in incidence across all age groups in Olmsted County over the last 4 decades.12-14 However, our results show that the percentage of BRAF-mutated melanomas in this population has been stable over time, with no statistically significant difference by age or sex. Other confounding factors may have an influence, such as increased rates of early detection and diagnosis of melanoma in contemporary times. Our data suggest that patients included in the BRAF-mutation analysis study had received the diagnosis of melanoma more recently than those who were excluded from the study, which could be due to older melanomas being less likely to have adequate tissue specimens available for immunohistochemical staining/evaluation.
Prior research has shown that BRAF-mutated melanomas typically occur on the trunk and are more likely in individuals with more than 14 nevi on the back.2 In the present cohort, BRAF-positive melanomas had a predisposition toward the trunk but also were found on the head, neck, and extremities—areas that are more likely to have long-term sun damage. One suggestion is that 2 distinct pathways for melanoma development exist: one associated with a large number of melanocytic nevi (that is more prone to genetic mutations in melanocytes) and the other associated with long-term sun exposure.15,16 The combination of these hypotheses suggests that individuals who are prone to the development of large numbers of nevi may require sun exposure for the initial insult, but the development of melanoma may be carried out by other factors after this initial sun exposure insult, whereas individuals without large numbers of nevi who may have less genetic risk may require continued long-term sun exposure for melanoma to develop.17
Our study had limitations, including the small numbers of deaths overall and cause-specific deaths of metastatic melanoma, which limited our ability to conduct more extensive multivariable modeling. Also, the retrospective nature and time frame of looking back 4 decades did not allow us to have information sufficient to categorize some patients as having dysplastic nevus syndrome or not, which would be a potentially interesting variable to include in the analysis. Because the number of deaths in the 18- to 39-year-old cohort was only 5, further statistical comparison regarding tumor type and other variables pertaining to BRAF positivity were not possible. In addition, our data were collected from patients residing in a single geographic county (Olmsted County, Minnesota), which may limit generalizability. Lastly, BRAF V600E mutations were identified through immunostaining only, not molecular data, so it is possible some patients had false-negative immunohistochemistry findings and thus were not identified.
Conclusion
BRAF-mutated melanomas were found in 35% of our cohort, with no significant change in the percentage of melanomas with BRAF V600E mutations over the last 4 decades in this population. In addition, no differences or significant trends existed according to sex and BRAF-mutated melanoma development. Women with BRAF-mutated melanomas were more likely to die of metastatic melanoma than men, and young adults with BRAF-mutated melanomas had a higher all-cause mortality risk. Further research is needed to decipher what effect BRAF-mutated melanomas have on metastasis and cause-specific death in women as well as all-cause mortality in young adults.
Acknowledgment—The authors are indebted to Scientific Publications, Mayo Clinic (Rochester, Minnesota).
- Grimaldi AM, Cassidy PB, Leachmann S, et al. Novel approaches in melanoma prevention and therapy. Cancer Treat Res. 2014;159: 443-455.
- Thomas NE, Edmiston SN, Alexander A, et al. Number of nevi and early-life ambient UV exposure are associated with BRAF-mutant melanoma. Cancer Epidemiol Biomarkers Prev. 2007;16:991-997.
- Curtin JA, Fridlyand J, Kageshita T, et al. Distinct sets of genetic alterations in melanoma. N Engl J Med. 2005;353:2135-2147.
- Thomas NE, Edmiston SN, Alexander A, et al. Association between NRAS and BRAF mutational status and melanoma-specific survival among patients with higher-risk primary melanoma. JAMA Oncol. 2015;1:359-368.
- Liu W, Kelly JW, Trivett M, et al. Distinct clinical and pathological features are associated with the BRAF(T1799A(V600E)) mutation in primary melanoma. J Invest Dermatol. 2007;127:900-905.
- Kim SY, Kim SN, Hahn HJ, et al. Metaanalysis of BRAF mutations and clinicopathologic characteristics in primary melanoma. J Am Acad Dermatol. 2015;72:1036-1046.e2.
- Larsen AC, Dahl C, Dahmcke CM, et al. BRAF mutations in conjunctival melanoma: investigation of incidence, clinicopathological features, prognosis and paired premalignant lesions. Acta Ophthalmol. 2016;94:463-470.
- Shinozaki M, Fujimoto A, Morton DL, et al. Incidence of BRAF oncogene mutation and clinical relevance for primary cutaneous melanomas. Clin Cancer Res. 2004;10:1753-1757.
- Heppt MV, Siepmann T, Engel J, et al. Prognostic significance of BRAF and NRAS mutations in melanoma: a German study from routine care. BMC Cancer. 2017;17:536.
- Mar VJ, Liu W, Devitt B, et al. The role of BRAF mutations in primary melanoma growth rate and survival. Br J Dermatol. 2015;173:76-82.
- Rocca WA, Yawn BP, St Sauver JL, et al. History of the Rochester Epidemiology Project: half a century of medical records linkage in a US population. Mayo Clin Proc. 2012;87:1202-1213.
- Reed KB, Brewer JD, Lohse CM, et al. Increasing incidence of melanoma among young adults: an epidemiological study in Olmsted County, Minnesota. Mayo Clin Proc. 2012;87:328-334.
- Olazagasti Lourido JM, Ma JE, Lohse CM, et al. Increasing incidence of melanoma in the elderly: an epidemiological study in Olmsted County, Minnesota. Mayo Clin Proc. 2016;91:1555-1562.
- Lowe GC, Saavedra A, Reed KB, et al. Increasing incidence of melanoma among middle-aged adults: an epidemiologic study in Olmsted County, Minnesota. Mayo Clin Proc. 2014;89:52-59.
- Whiteman DC, Parsons PG, Green AC. p53 expression and risk factors for cutaneous melanoma: a case-control study. Int J Cancer. 1998;77:843-848.
- Whiteman DC, Watt P, Purdie DM, et al. Melanocytic nevi, solar keratoses, and divergent pathways to cutaneous melanoma. J Natl Cancer Inst. 2003;95:806-812.
- Olsen CM, Zens MS, Green AC, et al. Biologic markers of sun exposure and melanoma risk in women: pooled case-control analysis. Int J Cancer. 2011;129:713-723.
Practice Points
- Approximately 50% of melanomas contain BRAF mutations; the effects on survival are unclear.
- Women with BRAF-mutated melanoma are at increased risk for death from melanoma.
- BRAF expression is associated with death of any cause for adults aged 18 to 39 years.
 cytoplasmic staining of melanoma melanocytes")
Impact of the COVID-19 Pandemic on Characteristics of Cutaneous Tumors Treated by Mohs Micrographic Surgery
The COVID-19 pandemic has brought about unprecedented changes and challenges to medical practice, including new public health measure legislation, local and national medical authority recommendations, nursing home and other ancillary health center protocols, and novel clinical decision-making considerations.1-3 In July 2020, the American Academy of Dermatology (AAD) addressed the changing landscape in dermatologic surgery, in part, by publishing recommendations on practice protocols during the COVID-19 pandemic.4 The guidelines recommended deferred treatment of superficial basal cell carcinomas (BCCs) for 6 months and all other BCC subtypes for 3 to 6 months. Furthermore, the guidelines recommended deferring treatment of all actinic keratoses and squamous cell carcinomas (SCCs) in situ “for now.” Squamous cell carcinoma treatment was to be guided by prognostic variables, such as location, size, depth, differentiation, perineural or lymphovascular invasion, recurrence, and immunosuppression. The guidelines recommended melanoma in situ (MIS) treatment be deferred for 3 months and invasive melanoma with histologic clearance obtained on excisional biopsy for 3 months. Other general recommendations included triaging clinics, rebooking according to clinical priority, using telehealth where possible, screening patients for COVID-19 signs and symptoms, staggering appointment times, spacing patient chairs, limiting support persons to 1, removing possible sources of infection in the waiting room, ensuring all patients sanitized their hands on arrival, rationing personal protective equipment, considering N95 masks for periorificial surgery, and using dissolving sutures to minimize multiple presentations.4
The American College of Mohs Surgery (ACMS), with guidance from its sister societies and the National Comprehensive Cancer Network, also communicated COVID-19–related recommendations to its members via intermittent newsletters during the initial peak of the pandemic in March and June 2020.5 General social distancing and office recommendations were similar to those released by the AAD. Recommendations for skin cancer treatment included deferring all BCCs for up to 3 months, with exceptions for highly symptomatic cancers and those with potential for substantial rapid growth. Squamous cell carcinoma in situ and small, well-differentiated SCCs were deferred, with priority placed on SCCs that were rapidly enlarging, poorly differentiated, demonstrated perineural invasion, were ulcerated, or were symptomatic. Patients with major risk factors were prioritized for treatment. Melanoma in situ was deferred for 2 to 3 months.5
State-level guidance from the Texas Dermatological Society (TDS) communicated in April 2020 stated that skin cancers with a potential for rapid progression and metastasis, such as melanoma and SCC, may require treatment as determined by the physician.6 The potential risk of serious adverse medical outcomes from not treating these cancers should be carefully documented. General practice measures for preventing the spread of COVID-19 were also recommended.6
In the setting of emerging novel recommendations, the practice of Mohs micrographic surgery (MMS) was notably impacted by the COVID-19 pandemic. According to one survey study from the United Kingdom conducted in April and May 2020, 49% of MMS services ceased and 36% were reduced during the infancy of the COVID-19 pandemic.7 Mohs micrographic surgery was largely suspended because of a lack of personal protective equipment and safety concerns, according to respondents. Additionally, respondents reported 77% of departments experienced redeployment of physicians and nurses to intensive care and medical wards. Thirty-five percent reported a reduction in the proportion of flaps/grafts to primary closures performed, 74% reported a decrease in outside referrals for repair by other specialties, 81% reported increased usage of dissolvable sutures, and 29% reported an increase in prophylactic antibiotic prescriptions.7 Another study from Italy reported a 46.5% reduction in dermatologic surgeries performed during the initial lockdown of the COVID-19 pandemic. Patients canceled 52.9% of procedures, and 12.5% were cancelled because of confirmed or suspected COVID-19 infection.8 Patient perceptions of MMS have also been impacted by the COVID-19 pandemic. According to a survey study of patients in the United Kingdom undergoing MMS during the pandemic, 47% were worried the hospital would cancel their surgery, 54% were anxious about using public transportation to attend their appointment, 30% were concerned about transmitting COVID-19 to household or family members, and 19% were worried about their ability to socially distance in the hospital.9
Evidence is also emerging that suggests the potential negative impact of the COVID-19 pandemic on morbidity and mortality outcomes in patients with skin cancer. One European study found an increase in Breslow thickness in primary melanomas diagnosed following the initial COVID-19 lockdown (0.88-mm average thickness prelockdown vs 1.96-mm average thickness postlockdown).10 An Italian study observed similar results—an increase in median Breslow thickness during the initial COVID-19 lockdown period of 0.5 mm from 0.4 mm during the prelockdown time period.11 Also providing evidence for potentially poor patient outcomes, one study modeled the impact of backlog in cutaneous melanoma referrals in the United Kingdom on patient survival and predicted 138 attributable lives lost for a 1-month delay and 1171 lives lost for a 6-month delay. The model further predicted a 3.1% to 12.5% reduction in 10-year net survival incurred from a 3-month delay in melanoma treatment, with the largest reduction seen in the patient population older than 80 years.12
Although the COVID-19 pandemic has been observed to impact MMS practice, patient perceptions, and clinical outcomes, it is unknown how the COVID-19 pandemic and corresponding rapidly evolving recommendations in dermatologic surgery have impacted the characteristics of cutaneous tumors treated by MMS.
Our study sought to determine the characteristics of skin cancers treated by MMS during the peak of government-mandated medical practice restrictions and business shutdowns in response to the COVID-19 pandemic and to compare them with characteristics of skin cancers treated during a prepandemic control period.
Methods
A retrospective chart review was conducted with approval from our institutional review board at the University of Texas Medical Branch (Galveston, Texas). Included in the chart review were all cutaneous malignancies treated by MMS at our outpatient, office-based surgical center from March 15, 2020, to April 30, 2020; this period corresponded to the peak of the COVID-19–related government-mandated medical and business shutdowns in our geographic region (southeast Texas). All cases performed were in compliance with national- and state-level guidance. Data were also collected for all cutaneous malignancies treated by MMS at our office from March 15, 2019, to April 30, 2019, as well as March 15, 2018, to April 30, 2018; these periods represented prepandemic control periods.
Data were collected for 516 surgeries performed on 458 patients and included patient age, preoperative clinical size, postoperative defect size, number of Mohs stages to achieve clearance, MMS appropriate use criteria (AUC) location (categorized as high-, medium-, or low-risk tumor location),13 and tumor type (categorized as BCC, SCC, or MIS). All variables were examined for unusual or missing values. Five patients with rare tumor types were observed and removed from the data set.
Statistical Analysis—An a priori power analysis for a power set at 0.85 determined sample sizes of 105 per group. Bivariate analyses were performed to compare variables for patients undergoing MMS during the pandemic vs prepandemic periods. Continuous outcome variables—Mohs stages, preoperative size, postoperative size, and patient age—were categorized for the analysis. Preoperative tumor size was dichotomized, with less than 2 cm2 as the referent category vs 2 cm2 or greater, and postoperative defect size was dichotomized with less than 3.6 cm2 as the referent category vs 3.6 cm2 or greater. Mohs stage was dichotomized as 1 stage (referent) vs more than 1 stage, and patient age was dichotomized as younger than 65 years (referent) vs 65 years or older.
Multivariate analyses were also performed to compare preoperative and postoperative sizes for patients undergoing MMS during the pandemic vs prepandemic periods, controlling for Mohs AUC location. Bivariate unadjusted and multivariate analyses were performed using a GENMOD logistic regression procedure in SAS (SAS Institute) to account for correlation in clustered data because a patient could be included for more than 1 surgery in the data set. Data were analyzed using SAS 9.4 for Windows. Because outcome variables tended to be skewed and not distributed normally, outcome variables were recorded as medians with interquartile ranges where possible to give a more accurate representation of the data than could be demonstrated with means with standard deviations.
Results
One hundred thirty-eight skin cancers were treated during the COVID-19 pandemic from March 15, 2020, to April 30, 2020, and 378 skin cancers were treated during the prepandemic control periods of March 15, 2019, to April 30, 2019, and March 15, 2018, to April 30, 2018. Tumor type treated during the pandemic period was more likely to be SCC or MIS (representing generally more severe tumor types) vs BCC when compared with the prepandemic periods, with an odds ratio (OR) of 1.763 (95% CI, 1.17-2.66). This outcome was statistically significant (P=.01).
Tumors treated during the pandemic period were more likely to have necessitated more than one Mohs stage for clearance compared to the prepandemic periods, though this difference was not statistically significant (OR, 1.461; 95% CI, 0.97-2.19; P=.056). Neither AUC location of treated tumors nor age were significantly different between prepandemic and pandemic periods (P=.58 and P=.84, respectively). Table 1 includes all bivariate analysis results.

Additionally, although mean preoperative and postoperative sizes were larger for each AUC location during the pandemic vs prepandemic periods, these differences did not reach statistical significance on multivariate analysis (P=.71 and P=.50, respectively)(Table 2).

Comment
Our practice has followed best practice guidelines dictated by our governing professional societies during the COVID-19 pandemic in the treatment of skin cancers by MMS, specifically highly symptomatic BCCs (in accordance with ACMS guidance), SCCs with high-risk features (in accordance with AAD, ACMS, and TDS guidance), and tumors with high risk for progression and metastasis such as melanomas (in accordance with TDS guidance). Melanoma in situ was also treated during the COVID-19 pandemic in accordance with the latter TDS guidance, particularly in light of the potential for upstaging to melanoma following resection (a phenomenon demonstrated to occur in 5%–29% of biopsied MIS lesions).14
In following best practice guidelines, our results suggested tumors treated by MMS were more severe, as evidenced by a statistically significant higher proportion of SCC and MIS tumors (representing more severe tumor types) vs BCC when compared to the prepandemic period. Supporting this conclusion, we observed larger pretreatment and posttreatment tumor sizes for all AUC locations and more tumors necessitating 2 or more stages for clearance during the pandemic vs prepandemic periods, though these differences did not reach statistical significance. We postulate these findings may be attributed to allocation of finite medical resources to the treatment of larger and more aggressive skin cancers. Additionally, these findings may be explained, in part, by limitations on patient case load imposed by social distancing measures and governing body regulations in effect during the study period, including those put forth by the AAD, ACMS, and TDS. Of note, our practice observed no hospitalizations or 911 calls during the studied period. This suggests no allocation of precious hospital resources away from patients with COVID-19 in our treatment of high-risk skin cancers.
The changing characteristics of cutaneous tumors treated by MMS during the pandemic are of clinical relevance. Larger postoperative wound sizes as observed during the pandemic, albeit not statistically significant, presumably affect reconstructive decisions. With larger wounds tending to necessitate repair by techniques higher on the reconstructive ladder, greater patient morbidity and cost are expected.15 As the cost-effectiveness of dermatology services remains a critical issue, this is an area ripe for future follow-up research. Furthermore, our observation that tumors tended to necessitate 2 or more stages for clearance during the pandemic more often than prepandemic periods, though not statistically significant, presumably affected operating times. Longer operating times during the pandemic may be of importance when making clinical decisions for patients for whom limiting health care exposure may be of particular concern. With more SCC and MIS tumors being treated relative to BCCs during the pandemic, one might expect greater size and severity of the BCCs we observe in the proceeding months to years.
As the ongoing COVID-19 pandemic continues to impact the landscape of cutaneous oncology, the need for adaptability is imperative. With 3- and 6-month skin cancer treatment deferrals lapsed, uncertainty surrounds ideal management of existing and new skin cancers arising during the pandemic. This study adds to a growing body of literature elucidating the impact of the COVID-19 pandemic on MMS practice; however, further studies and a tincture of time are needed to guide future best practice standards.
Acknowledgment—The authors acknowledge Gwen Baillargeon, MS (Galveston, Texas), who was the statistician for this article.
- Gostin LO, Hodge JH. US emergency legal responses to novel coronavirus: balancing public health and civil liberties. JAMA. 2020;323:131-32.
- Barnett ML, Grabowski DC. Nursing homes are ground zero for COVID-19 pandemic. JAMA Health Forum. 2020;1:E200369.
- Perlis RH. Exercising heart and head in managing coronavirus disease 2019 in Wuhan. JAMA Netw Open. 2020;3:E204006.
- Sarkissian SA, Kim L, Veness M, et al. Recommendations on dermatologic surgery during the COVID-19 pandemic. J Am Acad Dermatol. 2020;83:29-30.
- Billingsley EM. President’s message: COVID-19 (coronavirus) preparedness. American College of Mohs Surgery. March 30, 2020. Accessed April 14, 2022. https://www.mohscollege.org/UserFiles/AM20/Member%20Alert/COVIDAlert3March20.pdf
- Texas Dermatological Society Board of Directors. TDS Best Practice Recommendations—COVID-19. TDS Board Message. Texas Dermatologic Society. April 7, 2020.
- Nicholson P, Ali FR, Mallipeddi R. Impact of COVID‐19 on Mohs micrographic surgery: UK‐wide survey and recommendations for practice. Clin Exp Dermatol. 2020;45:901-902.
- Gironi LC, Boggio P, Giorgione R, et al. The impact of COVID-19 pandemics on dermatologic surgery: real-life data from the Italian Red-Zone [published online July 7, 2020]. J Dermatol Treat. doi:10.1080/09546634.2020.1789044
- Nicholson P, Ali FR, Craythorne E, et al. Patient perceptions of Mohs micrographic surgery during the COVID-19 pandemic and lessons for the next outbreak. Clin Exp Dermatol. 2021;46:179-180.
- Ricci F, Fania L, Paradisi A, et al. Delayed melanoma diagnosis in the COVID-19 era: increased breslow thickness in primary melanomas seen after the COVID-19 lockdown. J Eur Acad Dermatol Venereol. 2020;34:E778-E779.
- Gualdi G, Porreca A, Amoruso GF, et al. The effect of the COVID-19 lockdown on melanoma diagnosis in Italy. Clin Dermatol. 2021;39:911-919.
- Sud A, Torr B, Jones ME, et al. Effect of delays in the 2-week-wait cancer referral pathway during the COVID-19 pandemic on cancer survival in the UK: a modelling study. Lancet Oncol. 2020;21:1035-1044.
- Connolly SM, Baker DR, Coldiron BM, et al. AAD/ACMS/ASDSA/ASMS 2012 appropriate use criteria for Mohs micrographic surgery: a report of the American Academy of Dermatology, American College of Mohs Surgery, American Society for Dermatologic Surgery Association, and the American Society for Mohs Surgery. J Am Acad Dermatol. 2012;67:531-550.
- Higgins HW, Lee KC, Galan A, et al. Melanoma in situ: part II. histopathology, treatment, and clinical management. J Am Acad Dermatol. 2015;73:193-203.
- Cook J, Zitelli JA. Mohs micrographic surgery: a cost analysis. J Am Acad Dermatol. 1998;39:698-703.
The COVID-19 pandemic has brought about unprecedented changes and challenges to medical practice, including new public health measure legislation, local and national medical authority recommendations, nursing home and other ancillary health center protocols, and novel clinical decision-making considerations.1-3 In July 2020, the American Academy of Dermatology (AAD) addressed the changing landscape in dermatologic surgery, in part, by publishing recommendations on practice protocols during the COVID-19 pandemic.4 The guidelines recommended deferred treatment of superficial basal cell carcinomas (BCCs) for 6 months and all other BCC subtypes for 3 to 6 months. Furthermore, the guidelines recommended deferring treatment of all actinic keratoses and squamous cell carcinomas (SCCs) in situ “for now.” Squamous cell carcinoma treatment was to be guided by prognostic variables, such as location, size, depth, differentiation, perineural or lymphovascular invasion, recurrence, and immunosuppression. The guidelines recommended melanoma in situ (MIS) treatment be deferred for 3 months and invasive melanoma with histologic clearance obtained on excisional biopsy for 3 months. Other general recommendations included triaging clinics, rebooking according to clinical priority, using telehealth where possible, screening patients for COVID-19 signs and symptoms, staggering appointment times, spacing patient chairs, limiting support persons to 1, removing possible sources of infection in the waiting room, ensuring all patients sanitized their hands on arrival, rationing personal protective equipment, considering N95 masks for periorificial surgery, and using dissolving sutures to minimize multiple presentations.4
The American College of Mohs Surgery (ACMS), with guidance from its sister societies and the National Comprehensive Cancer Network, also communicated COVID-19–related recommendations to its members via intermittent newsletters during the initial peak of the pandemic in March and June 2020.5 General social distancing and office recommendations were similar to those released by the AAD. Recommendations for skin cancer treatment included deferring all BCCs for up to 3 months, with exceptions for highly symptomatic cancers and those with potential for substantial rapid growth. Squamous cell carcinoma in situ and small, well-differentiated SCCs were deferred, with priority placed on SCCs that were rapidly enlarging, poorly differentiated, demonstrated perineural invasion, were ulcerated, or were symptomatic. Patients with major risk factors were prioritized for treatment. Melanoma in situ was deferred for 2 to 3 months.5
State-level guidance from the Texas Dermatological Society (TDS) communicated in April 2020 stated that skin cancers with a potential for rapid progression and metastasis, such as melanoma and SCC, may require treatment as determined by the physician.6 The potential risk of serious adverse medical outcomes from not treating these cancers should be carefully documented. General practice measures for preventing the spread of COVID-19 were also recommended.6
In the setting of emerging novel recommendations, the practice of Mohs micrographic surgery (MMS) was notably impacted by the COVID-19 pandemic. According to one survey study from the United Kingdom conducted in April and May 2020, 49% of MMS services ceased and 36% were reduced during the infancy of the COVID-19 pandemic.7 Mohs micrographic surgery was largely suspended because of a lack of personal protective equipment and safety concerns, according to respondents. Additionally, respondents reported 77% of departments experienced redeployment of physicians and nurses to intensive care and medical wards. Thirty-five percent reported a reduction in the proportion of flaps/grafts to primary closures performed, 74% reported a decrease in outside referrals for repair by other specialties, 81% reported increased usage of dissolvable sutures, and 29% reported an increase in prophylactic antibiotic prescriptions.7 Another study from Italy reported a 46.5% reduction in dermatologic surgeries performed during the initial lockdown of the COVID-19 pandemic. Patients canceled 52.9% of procedures, and 12.5% were cancelled because of confirmed or suspected COVID-19 infection.8 Patient perceptions of MMS have also been impacted by the COVID-19 pandemic. According to a survey study of patients in the United Kingdom undergoing MMS during the pandemic, 47% were worried the hospital would cancel their surgery, 54% were anxious about using public transportation to attend their appointment, 30% were concerned about transmitting COVID-19 to household or family members, and 19% were worried about their ability to socially distance in the hospital.9
Evidence is also emerging that suggests the potential negative impact of the COVID-19 pandemic on morbidity and mortality outcomes in patients with skin cancer. One European study found an increase in Breslow thickness in primary melanomas diagnosed following the initial COVID-19 lockdown (0.88-mm average thickness prelockdown vs 1.96-mm average thickness postlockdown).10 An Italian study observed similar results—an increase in median Breslow thickness during the initial COVID-19 lockdown period of 0.5 mm from 0.4 mm during the prelockdown time period.11 Also providing evidence for potentially poor patient outcomes, one study modeled the impact of backlog in cutaneous melanoma referrals in the United Kingdom on patient survival and predicted 138 attributable lives lost for a 1-month delay and 1171 lives lost for a 6-month delay. The model further predicted a 3.1% to 12.5% reduction in 10-year net survival incurred from a 3-month delay in melanoma treatment, with the largest reduction seen in the patient population older than 80 years.12
Although the COVID-19 pandemic has been observed to impact MMS practice, patient perceptions, and clinical outcomes, it is unknown how the COVID-19 pandemic and corresponding rapidly evolving recommendations in dermatologic surgery have impacted the characteristics of cutaneous tumors treated by MMS.
Our study sought to determine the characteristics of skin cancers treated by MMS during the peak of government-mandated medical practice restrictions and business shutdowns in response to the COVID-19 pandemic and to compare them with characteristics of skin cancers treated during a prepandemic control period.
Methods
A retrospective chart review was conducted with approval from our institutional review board at the University of Texas Medical Branch (Galveston, Texas). Included in the chart review were all cutaneous malignancies treated by MMS at our outpatient, office-based surgical center from March 15, 2020, to April 30, 2020; this period corresponded to the peak of the COVID-19–related government-mandated medical and business shutdowns in our geographic region (southeast Texas). All cases performed were in compliance with national- and state-level guidance. Data were also collected for all cutaneous malignancies treated by MMS at our office from March 15, 2019, to April 30, 2019, as well as March 15, 2018, to April 30, 2018; these periods represented prepandemic control periods.
Data were collected for 516 surgeries performed on 458 patients and included patient age, preoperative clinical size, postoperative defect size, number of Mohs stages to achieve clearance, MMS appropriate use criteria (AUC) location (categorized as high-, medium-, or low-risk tumor location),13 and tumor type (categorized as BCC, SCC, or MIS). All variables were examined for unusual or missing values. Five patients with rare tumor types were observed and removed from the data set.
Statistical Analysis—An a priori power analysis for a power set at 0.85 determined sample sizes of 105 per group. Bivariate analyses were performed to compare variables for patients undergoing MMS during the pandemic vs prepandemic periods. Continuous outcome variables—Mohs stages, preoperative size, postoperative size, and patient age—were categorized for the analysis. Preoperative tumor size was dichotomized, with less than 2 cm2 as the referent category vs 2 cm2 or greater, and postoperative defect size was dichotomized with less than 3.6 cm2 as the referent category vs 3.6 cm2 or greater. Mohs stage was dichotomized as 1 stage (referent) vs more than 1 stage, and patient age was dichotomized as younger than 65 years (referent) vs 65 years or older.
Multivariate analyses were also performed to compare preoperative and postoperative sizes for patients undergoing MMS during the pandemic vs prepandemic periods, controlling for Mohs AUC location. Bivariate unadjusted and multivariate analyses were performed using a GENMOD logistic regression procedure in SAS (SAS Institute) to account for correlation in clustered data because a patient could be included for more than 1 surgery in the data set. Data were analyzed using SAS 9.4 for Windows. Because outcome variables tended to be skewed and not distributed normally, outcome variables were recorded as medians with interquartile ranges where possible to give a more accurate representation of the data than could be demonstrated with means with standard deviations.
Results
One hundred thirty-eight skin cancers were treated during the COVID-19 pandemic from March 15, 2020, to April 30, 2020, and 378 skin cancers were treated during the prepandemic control periods of March 15, 2019, to April 30, 2019, and March 15, 2018, to April 30, 2018. Tumor type treated during the pandemic period was more likely to be SCC or MIS (representing generally more severe tumor types) vs BCC when compared with the prepandemic periods, with an odds ratio (OR) of 1.763 (95% CI, 1.17-2.66). This outcome was statistically significant (P=.01).
Tumors treated during the pandemic period were more likely to have necessitated more than one Mohs stage for clearance compared to the prepandemic periods, though this difference was not statistically significant (OR, 1.461; 95% CI, 0.97-2.19; P=.056). Neither AUC location of treated tumors nor age were significantly different between prepandemic and pandemic periods (P=.58 and P=.84, respectively). Table 1 includes all bivariate analysis results.
Additionally, although mean preoperative and postoperative sizes were larger for each AUC location during the pandemic vs prepandemic periods, these differences did not reach statistical significance on multivariate analysis (P=.71 and P=.50, respectively)(Table 2).
Comment
Our practice has followed best practice guidelines dictated by our governing professional societies during the COVID-19 pandemic in the treatment of skin cancers by MMS, specifically highly symptomatic BCCs (in accordance with ACMS guidance), SCCs with high-risk features (in accordance with AAD, ACMS, and TDS guidance), and tumors with high risk for progression and metastasis such as melanomas (in accordance with TDS guidance). Melanoma in situ was also treated during the COVID-19 pandemic in accordance with the latter TDS guidance, particularly in light of the potential for upstaging to melanoma following resection (a phenomenon demonstrated to occur in 5%–29% of biopsied MIS lesions).14
In following best practice guidelines, our results suggested tumors treated by MMS were more severe, as evidenced by a statistically significant higher proportion of SCC and MIS tumors (representing more severe tumor types) vs BCC when compared to the prepandemic period. Supporting this conclusion, we observed larger pretreatment and posttreatment tumor sizes for all AUC locations and more tumors necessitating 2 or more stages for clearance during the pandemic vs prepandemic periods, though these differences did not reach statistical significance. We postulate these findings may be attributed to allocation of finite medical resources to the treatment of larger and more aggressive skin cancers. Additionally, these findings may be explained, in part, by limitations on patient case load imposed by social distancing measures and governing body regulations in effect during the study period, including those put forth by the AAD, ACMS, and TDS. Of note, our practice observed no hospitalizations or 911 calls during the studied period. This suggests no allocation of precious hospital resources away from patients with COVID-19 in our treatment of high-risk skin cancers.
The changing characteristics of cutaneous tumors treated by MMS during the pandemic are of clinical relevance. Larger postoperative wound sizes as observed during the pandemic, albeit not statistically significant, presumably affect reconstructive decisions. With larger wounds tending to necessitate repair by techniques higher on the reconstructive ladder, greater patient morbidity and cost are expected.15 As the cost-effectiveness of dermatology services remains a critical issue, this is an area ripe for future follow-up research. Furthermore, our observation that tumors tended to necessitate 2 or more stages for clearance during the pandemic more often than prepandemic periods, though not statistically significant, presumably affected operating times. Longer operating times during the pandemic may be of importance when making clinical decisions for patients for whom limiting health care exposure may be of particular concern. With more SCC and MIS tumors being treated relative to BCCs during the pandemic, one might expect greater size and severity of the BCCs we observe in the proceeding months to years.
As the ongoing COVID-19 pandemic continues to impact the landscape of cutaneous oncology, the need for adaptability is imperative. With 3- and 6-month skin cancer treatment deferrals lapsed, uncertainty surrounds ideal management of existing and new skin cancers arising during the pandemic. This study adds to a growing body of literature elucidating the impact of the COVID-19 pandemic on MMS practice; however, further studies and a tincture of time are needed to guide future best practice standards.
Acknowledgment—The authors acknowledge Gwen Baillargeon, MS (Galveston, Texas), who was the statistician for this article.
- Gostin LO, Hodge JH. US emergency legal responses to novel coronavirus: balancing public health and civil liberties. JAMA. 2020;323:131-32.
- Barnett ML, Grabowski DC. Nursing homes are ground zero for COVID-19 pandemic. JAMA Health Forum. 2020;1:E200369.
- Perlis RH. Exercising heart and head in managing coronavirus disease 2019 in Wuhan. JAMA Netw Open. 2020;3:E204006.
- Sarkissian SA, Kim L, Veness M, et al. Recommendations on dermatologic surgery during the COVID-19 pandemic. J Am Acad Dermatol. 2020;83:29-30.
- Billingsley EM. President’s message: COVID-19 (coronavirus) preparedness. American College of Mohs Surgery. March 30, 2020. Accessed April 14, 2022. https://www.mohscollege.org/UserFiles/AM20/Member%20Alert/COVIDAlert3March20.pdf
- Texas Dermatological Society Board of Directors. TDS Best Practice Recommendations—COVID-19. TDS Board Message. Texas Dermatologic Society. April 7, 2020.
- Nicholson P, Ali FR, Mallipeddi R. Impact of COVID‐19 on Mohs micrographic surgery: UK‐wide survey and recommendations for practice. Clin Exp Dermatol. 2020;45:901-902.
- Gironi LC, Boggio P, Giorgione R, et al. The impact of COVID-19 pandemics on dermatologic surgery: real-life data from the Italian Red-Zone [published online July 7, 2020]. J Dermatol Treat. doi:10.1080/09546634.2020.1789044
- Nicholson P, Ali FR, Craythorne E, et al. Patient perceptions of Mohs micrographic surgery during the COVID-19 pandemic and lessons for the next outbreak. Clin Exp Dermatol. 2021;46:179-180.
- Ricci F, Fania L, Paradisi A, et al. Delayed melanoma diagnosis in the COVID-19 era: increased breslow thickness in primary melanomas seen after the COVID-19 lockdown. J Eur Acad Dermatol Venereol. 2020;34:E778-E779.
- Gualdi G, Porreca A, Amoruso GF, et al. The effect of the COVID-19 lockdown on melanoma diagnosis in Italy. Clin Dermatol. 2021;39:911-919.
- Sud A, Torr B, Jones ME, et al. Effect of delays in the 2-week-wait cancer referral pathway during the COVID-19 pandemic on cancer survival in the UK: a modelling study. Lancet Oncol. 2020;21:1035-1044.
- Connolly SM, Baker DR, Coldiron BM, et al. AAD/ACMS/ASDSA/ASMS 2012 appropriate use criteria for Mohs micrographic surgery: a report of the American Academy of Dermatology, American College of Mohs Surgery, American Society for Dermatologic Surgery Association, and the American Society for Mohs Surgery. J Am Acad Dermatol. 2012;67:531-550.
- Higgins HW, Lee KC, Galan A, et al. Melanoma in situ: part II. histopathology, treatment, and clinical management. J Am Acad Dermatol. 2015;73:193-203.
- Cook J, Zitelli JA. Mohs micrographic surgery: a cost analysis. J Am Acad Dermatol. 1998;39:698-703.
Practice Points
- Mohs surgeons should follow best practice guidelines dictated by our governing professional societies in selecting skin cancers for treatment by Mohs micrographic surgery (MMS) during the COVID-19 pandemic and beyond.
- The COVID-19 pandemic has impacted the characteristics of skin cancers treated by MMS, largely driven by new guidelines.
- Changing characteristics of skin cancers treated by MMS are of clinical significance, potentially affecting the extent of reconstructive surgery, cost, operating time, and future tumor characteristics.
Impact of Clinical Pharmacists on Access to Care in an Epilepsy Clinic
Epilepsy affects about 1% of the world population and is one of the most burdensome in terms of disability-adjusted life-years.1,2 Veterans are at increased risk of developing epilepsy when compared with the general population due to a variety of factors, including a higher frequency of traumatic brain injuries.3 A recent study from the US Centers for Disease Control and Prevention found that veterans who developed epilepsy during their service not only had a higher rate of mental and physical comorbidities, but also were 2.6 times more likely to die compared with veterans without epilepsy.4
Oral antiseizure medications (ASM) remain the mainstay of outpatient epilepsy treatment. Patterns of ASM use are complex within the US Department of Veterans Affairs (VA) patient population, particularly within patients at the Epilepsy Centers of Excellence (ECoE). For example, many patients are transitioned from older ASMs with greater adverse effects (AEs) to better tolerated newer generation ASMs or polytherapy regimens with complex pharmacokinetic profiles and drug interactions.5 Multiple factors are considered when choosing an ASM, including age, sex, epilepsy/seizure type, comorbidities, past medication trials, AEs, and drug interactions. The complex pharmacologic profile of both older and newer ASMs can confound the optimal management of epilepsy, and suboptimal management can lead to neurologic, psychological, physical, and social consequences, including sudden unexplained death in epilepsy.6,7 Psychiatric and behavioral problems are seen in up to 30% of patients with newly diagnosed epilepsy and 50% in those with pharmacoresistant epilepsy.8 Early screening, detection, and treatment for psychiatric comorbidities are an integral part of evidence-based care in epilepsy.
Being familiar with ASM AEs and comorbid conditions such as anxiety and depression can allow for quick identification and intervention to improve safety and quality of life. A 2007 population-based study found that measures of suicidality had a strong association with epilepsy, and performing mental health screenings, such as the Patient Health Questionnaire (PHQ-9), Generalized Anxiety Disorder Screener (GAD-7), and the Brief Irritability Test (BITe), can assist in identifying those patients at risk.9
During the COVID-19 pandemic, it has become increasingly clear that the health care sector is facing increasing pressure. The combination of patient acuity as well as critical health care professional (HCP) shortages may be of particular concern in certain specialty clinics where access to practitioners may already be limited. While this is a multifaceted problem, a pragmatic approach would be to increase the use of clinicians, such as clinical pharmacist practitioners (CPPs).
The William S. Middleton Memorial Veterans Hospital (WSMVH) in Madison, Wisconsin, is 1 of 17 VA ECoE sites. The VA ECoE provides high-quality, comprehensive epilepsy evaluation and care to veterans. In fiscal year (FY) 2020, the 17 sites provided care to 5544 veterans.10 The WSMVH epilepsy clinic sees about 400 veterans each year, receiving referrals from other VA medical centers, and prescribes ASMs, neuromodulation devices, and resective surgeries for epilepsy. The multidisciplinary team consists of an epileptologist, neurophysiology fellow, psychiatrist, nurse practitioner, CPP, and neurology residents. The WSMVH epilepsy clinic has employed CPPs at their highest level of clinical practice authority since 1991.
The WSMVH epilepsy clinic is open 4 hours once weekly. The clinic offers fourteen 30-minute appointment slots either in person or via telehealth. The epileptologist reviews patient charts prior to clinic and assigns each patient to the appropriate HCP. When making the determination to assign a patient to a CPP or pharmacy resident, the epileptologist considers current treatment response, mental health issues as well as medication-related concerns (eg, potential pharmacokinetic/pharmacodynamic interactions, AEs, adherence). The CPP can independently lead routine follow-up appointments and address acute as well as ongoing ASM therapy needs. Pharmacy residents are fully integrated into the clinic workflow, seeing assigned patients independently when appropriate but ensuring that each patient has access to either the epileptologist, CPP, or psychiatrist prior to finalizing the treatment plan. The epilepsy clinic rotation is required for first-year pharmacy residents and is an elective rotation in the second year.
While this level of service has been in place at WSMVH for more than 3 decades, a systematic evaluation on workload and clinical impact has not been conducted.11 The purpose of this analysis is to evaluate and quantify the breadth and impact of CPPs in this specialty setting. The WSMVH/University of Wisconsin-Madison institutional review board deemed this quality improvement study exempt from review.
Methods
This study was a single-center, retrospective, quality improvement project evaluating the impact of a CPP and clinical pharmacy resident have within the WSMVH epilepsy clinic on access to epilepsy care and medication management. The secondary outcomes were the types of interventions made by the CPP and mental health screening performed.
Between October 2019 and May 2021, 591 appointments were scheduled at the epilepsy clinic for medical, psychiatry, neurosurgery, and pharmacy residents; the epileptologist; CPP; psychiatrist; epilepsy fellow; or nurse practitioner. A retrospective chart review of the 446 patients seen by either a CPP or clinical pharmacy resident from October 2017 to June 2021 assessed pharmacist-led interventions made during each appointment. The following treatment interventions were assessed: medication initiations/discontinuations, dose changes, and nonpharmacologic interventions, including education. Additionally, any mental health screenings completed, consultations to other specialties placed, or laboratory tests ordered were documented.
Results
In the epilepsy clinic, 591 appointments were completed from October 1, 2019, to May 31, 2021. Of those appointments, 255 (43.2%) were led by pharmacists; 156 (26.4%) by pharmacy residents and 99 (16.8%) by CPPs (16.8%) (Table 1). Appointments held by other HCPs included 139 (23.5%) by nurse practitioner, 108 (18.3%) by the attending epileptologist, 41 (6.9%) by fellows, 22 (3.7%) by psychiatrists, 19 (3.2) by medical residents, 4 (0.7%) by neurosurgery residents, and 3 (0.5%) by psychiatry residents. Medication interventions included 55 (11.8%) dose increases, 52 (11.1%) medication initiations, and 32 (6.9%) dose decreases (Table 2). Mental health screening was conducted for 229 (49.1%) patients with PHQ-9, 225 (48.3%) with GAD-7, and 111 (23.8) with BITe. Some veterans received multiple screeners at a clinic visit, and others received none (most commonly during telephone follow-up appointments). The mean time spent with each patient was 27 minutes.
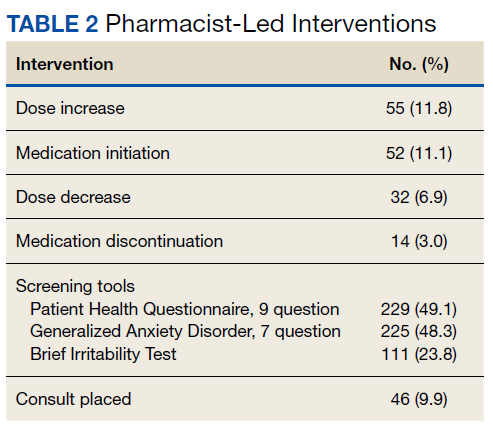
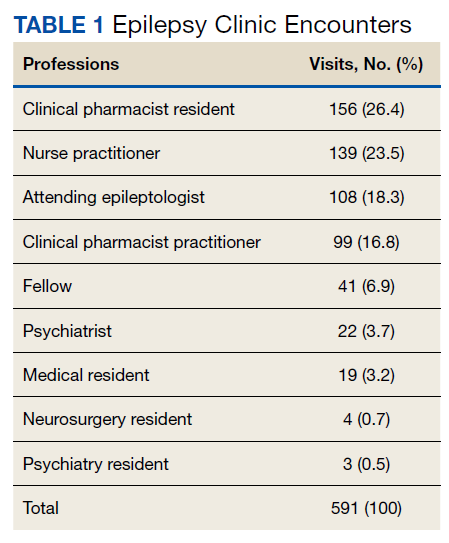
Discussion
Within the private sector, access to a neurologist or epileptologist is limited, and the US Health Resources and Services Administration National Center for Workforce Analysis projected that the demand for these specialists would exceed supply by 2025.12 In 2017, Kobau and colleagues found that only 1 in 10 adults with epilepsy saw a neurologist within the year, similar to previous years. As demand for specialty care exceeds capacity, additional members of the health care team are needed to ensure timely, effective, and safe care for patients with epilepsy.
One way to increase health care access is to use an interdisciplinary model of care, integrating pharmacists in the management of epilepsy in collaboration with other HCPs, a strategy that has been endorsed by the American Epilepsy Society (AES).13 As experts in pharmacotherapy, pharmacists can uniquely provide medication management for this complex disease as ASMs continue to remain the first-line treatment.14
In addition to increased demand for specialty services, there also is an increase in health care spending with a push to limit additional spending. In 2016, despite similar health care use in other high-income countries, health care costs are approximately twice as much in the US, mostly driven by prices of pharmaceuticals and administrative costs.15 Bond and colleagues evaluated 9380 Medicare patients with epilepsy or seizure disorders throughout US hospitals in 1998.16 They found that hospitals without pharmacist-managed ASM therapy had Medicare charges that were 11.2% higher than hospitals with pharmacist-managed therapy. Many factors contribute to the rise in cost, including an increase in laboratory charges for serum drug assays, legal litigations related to drug AEs, and an increase in hospital length of stay (about 14 additional days). Similar to pharmacist-managed anticoagulation, vancomycin, and aminoglycoside therapy, direct involvement of pharmacists with ASM management decreases health care costs.14
The American Academy of Neurology (AAN) developed 8 epilepsy quality measures: seizure type and frequency, etiology or epilepsy syndrome, review of electroencephalogram and imaging findings, counseling of ASM AEs, consideration of surgical treatment of intractable epilepsy, epilepsy-specific safety issues, and counseling for women of childbearing potential on contraception and pregnancy. These measures serve as a guide for evidence-based therapy and standardization of epilepsy care.17 Additionally, bone health, depression, and awareness of sudden unexplained death in epilepsy are increasing in importance when providing quality epilepsy care. Wasade and colleagues surveyed Michigan neurologists and found that only 37% of the respondents addressed ASM AEs at every clinic visit. They also found that just 26% of responding neurologists inquire about depression at every clinic visit, and 17% inquire only once a year. In our practice, screening for depression, suicidality, and counseling on ASM AEs are routinely provided by CPPs during each clinic visit.
Within the VA, CPPs are granted a scope of practice that allows them to perform comprehensive medication management, including but not limited to, prescribing medication regimens, ordering laboratory tests and diagnostic studies, and performing physical assessments. In our practice, the most common interventions made by CPPs were patient-focused counseling, bone health screening, mental health triage and referral, and ASM regimen adjustments. Assessment of ASM adherence also was noted to be an active area of CPP-patient engagement. These most common interventions align well with the AAN quality measures. It is now well recognized that nonadherence in patients with epilepsy not only can lead to loss of seizure control, but injury and death as well.18,19 Malek and colleagues found that patients with epilepsy who are nonadherent to their ASM regimens have a 3-times greater risk of mortality compared with those who were adherent.20 Adherence to the appropriate medication regimen in epilepsy can result in seizure-freedom in 70% of patients; therefore, exploring nonadherence in this population is crucial.21
The COVID-19 pandemic precipitated changes to the health care industry, including the heavy reliance on telehealth. Following the Wisconsin stay-at-home order on March 25, 2020, all nonessential face-to-face appointments at the WSMVH halted. The epilepsy clinic transitioned the majority of appointments to either telephone or VA Video Connect (VVC), which is a program on the veteran’s computer, tablet, or mobile device upon which the appointment is held. Although it became more challenging to obtain a mental health screening during virtual appointments and the frequency did decrease, patients were asked for a subjective report of their mood during each telephone or video appointment. The AES has since put forth a statement of support for the continuation of telehealth following the COVID-19 pandemic due to the flexibility that telehealth provides people with epilepsy. Additionally, the AES taskforce provided suggestions for continued pharmacist engagement within the epilepsy care team, including the triaging of patients, management of ASMs, and involvement in the delivery of telehealth.
Limitations
There is limited research available on the impact that a CPP has on medication management and access to care within an epilepsy clinic, especially those with a scope of practice. One limitation of this retrospective chart review is that the appropriateness of each medication intervention was not assessed; therefore, the impact of each intervention was not captured. Additionally, this single-site study of veterans may not reflect the general population. However, we believe that this model could be adapted to nonspecialty neurology practices. Of note the scope of this study did not include a comparison of medication interventions for the other specialties within the clinic.
Conclusions
The integration of a CPP and pharmacy residents into the WSMVH epilepsy clinic has allowed for greater and more timely access to care, managing 43.2% of all patients within the clinic during the study. Pharmacy scope of practice allows for collaborative autonomy with ASM adjustments and for the epileptologist time to focus on higher acuity cases. In settings where pharmacists do not have prescriptive status, medication management services, such as comprehensive medication reviews, identifying drug-drug and drug-disease interactions, recognizing adherence barriers, and medication safety surveillance, can still be performed to improve management of epilepsy.
Acknowledgments
Ellina S. Seckel, PharmD, BCACP, DPLA; Anita Kashyap, PharmD, BCACP; Brooke Keenan, NP; Leigh Heffner, PharmD
1. Stafstrom CE, Carmant L. Seizures and epilepsy: an overview for neuroscientists. Cold Spring Harb Perspect Med. 2015;5(6):a022426. doi:10.1101/cshperspect.a022426
2. GBD 2017 US Neurological Disorders Collaborators, Feigin VL, Vos T, et al. Burden of neurological disorders across the US from 1990-2017: a global burden of disease study. JAMA Neurol. 2021;78(2):165-176. doi:10.1001/jamaneurol.2020.4152
3. Rehman R, Kelly PR, Husain AM, Tran TT. Characteristics of veterans diagnosed with seizures within Veterans Health Administration. J Rehabil Res Dev. 2015;52(7):751-762. doi:10.1682/JRRD.2014.10.0241
4. Pugh MJ, Van Cott AC, Amuan M, et al. Epilepsy among Iraq and Afghanistan War veterans - United States, 2002-2015. MMWR Morb Mortal Wkly Rep. 2016;65(44):1224-1227. doi:10.15585/mmwr.mm6544a5
5. Rohde NN, Baca CB, Van Cott AC, Parko KL, Amuan ME, Pugh MJ. Antiepileptic drug prescribing patterns in Iraq and Afghanistan war veterans with epilepsy. Epilepsy Behav. 2015;46:133-139. doi:10.1016/j.yebeh.2015.03.027
6. Laxer KD, Trinka E, Hirsch LJ, et al. The consequences of refractory epilepsy and its treatment. Epilepsy Behav. 2014;37:59-70. doi:10.1016/j.yebeh.2014.05.031
7. Devinsky O, Hesdorffer DC, Thurman DJ, Lhatoo S, Richerson G. Sudden unexpected death in epilepsy: epidemiology, mechanisms, and prevention. Lancet Neurol. 2016;15(10):1075-1088. doi:10.1016/S1474-4422(16)30158-2
8. Tolchin B, Hirsch LJ, LaFrance WC Jr. Neuropsychiatric aspects of epilepsy. Psychiatr Clin North Am. 2020;43(2):275-290. doi:10.1016/j.psc.2020.02.002
9. Rai D, Kerr MP, McManus S, Jordanova V, Lewis G, Brugha TS. Epilepsy and psychiatric comorbidity: a nationally representative population-based study. Epilepsia. 2012;53(6):1095-1103. doi:10.1111/j.1528-1167.2012.03500.x
10. US Department of Veterans Affairs. Epilepsy Centers of Excellence. Annual report fiscal year 2020. Accessed March 11, 2022. https://www.epilepsy.va.gov/docs/ECoENational_AnnualReportFY20_web_508c.pdf
11. Fogg A, Staufenberg EF, Small I, Bhattacharya D. An exploratory study of primary care pharmacist-led epilepsy consultations. Int J Pharm Pract. 2012;20(5):294-302. doi:10.1111/j.2042-7174.2012.00207.x
12. Kobau R, Sapkota S, Pennell PB, Croft JB. Epilepsy by the numbers - from the US Centers for Disease Control and Prevention: six in 10 adults with active epilepsy saw a neurologist or epilepsy specialist in the past year, United States, 2017. Epilepsy Behav. 2020;112:107348. doi:10.1016/j.yebeh.2020.107348
13. Shawahna R. Development of key performance indicators to capture in measuring the impact of pharmacists in caring for patients with epilepsy in primary healthcare: A Delphi consensual study. Epilepsy Behav. 2019;98(pt A):129-138. doi:10.1016/j.yebeh.2019.07.034
14. Asadi-Pooya AA, Beniczky S, Rubboli G, Sperling MR, Rampp S, Perucca E. A pragmatic algorithm to select appropriate antiseizure medications in patients with epilepsy. Epilepsia. 2020;61(8):1668-1677. doi:10.1111/epi.16610
15. Papanicolas I, Woskie LR, Jha AK. Health Care Spending in the United States and Other High-Income Countries. JAMA. 2018;319(10):1024-1039. doi:10.1001/jama.2018.1150
16. Bond CA, Raehl CL. Clinical and economic outcomes of pharmacist-managed aminoglycoside or vancomycin therapy. Am J Health Syst Pharm. 2005;62(15):1596-1605. doi:10.2146/ajhp040555
17. Wasade VS, Spanaki M, Iyengar R, Barkley GL, Schultz L. AAN Epilepsy Quality Measures in clinical practice: a survey of neurologists. Epilepsy Behav. 2012;24(4):468-473. doi:10.1016/j.yebeh.2012.05.017
18. Hovinga CA, Asato MR, Manjunath R, et al. Association of non-adherence to antiepileptic drugs and seizures, quality of life, and productivity: survey of patients with epilepsy and physicians. Epilepsy Behav. 2008;13(2):316-322. doi:10.1016/j.yebeh.2008.03.009
19. Faught RE, Weiner JR, Guérin A, Cunnington MC, Duh MS. Impact of nonadherence to antiepileptic drugs on health care utilization and costs: findings from the RANSOM study. Epilepsia. 2009;50(3):501-509. doi:10.1111/j.1528-1167.2008.01794.x
20. Malek N, Heath CA, Greene J. A review of medication adherence in people with epilepsy. Acta Neurol Scand. 2017;135(5):507-515. doi:10.1111/ane.12703
21. O’ Rourke G, O’ Brien JJ. Identifying the barriers to antiepileptic drug adherence among adults with epilepsy. Seizure. 2017;45:160-168. doi:10.1016/j.seizure.2016.12.006
Epilepsy affects about 1% of the world population and is one of the most burdensome in terms of disability-adjusted life-years.1,2 Veterans are at increased risk of developing epilepsy when compared with the general population due to a variety of factors, including a higher frequency of traumatic brain injuries.3 A recent study from the US Centers for Disease Control and Prevention found that veterans who developed epilepsy during their service not only had a higher rate of mental and physical comorbidities, but also were 2.6 times more likely to die compared with veterans without epilepsy.4
Oral antiseizure medications (ASM) remain the mainstay of outpatient epilepsy treatment. Patterns of ASM use are complex within the US Department of Veterans Affairs (VA) patient population, particularly within patients at the Epilepsy Centers of Excellence (ECoE). For example, many patients are transitioned from older ASMs with greater adverse effects (AEs) to better tolerated newer generation ASMs or polytherapy regimens with complex pharmacokinetic profiles and drug interactions.5 Multiple factors are considered when choosing an ASM, including age, sex, epilepsy/seizure type, comorbidities, past medication trials, AEs, and drug interactions. The complex pharmacologic profile of both older and newer ASMs can confound the optimal management of epilepsy, and suboptimal management can lead to neurologic, psychological, physical, and social consequences, including sudden unexplained death in epilepsy.6,7 Psychiatric and behavioral problems are seen in up to 30% of patients with newly diagnosed epilepsy and 50% in those with pharmacoresistant epilepsy.8 Early screening, detection, and treatment for psychiatric comorbidities are an integral part of evidence-based care in epilepsy.
Being familiar with ASM AEs and comorbid conditions such as anxiety and depression can allow for quick identification and intervention to improve safety and quality of life. A 2007 population-based study found that measures of suicidality had a strong association with epilepsy, and performing mental health screenings, such as the Patient Health Questionnaire (PHQ-9), Generalized Anxiety Disorder Screener (GAD-7), and the Brief Irritability Test (BITe), can assist in identifying those patients at risk.9
During the COVID-19 pandemic, it has become increasingly clear that the health care sector is facing increasing pressure. The combination of patient acuity as well as critical health care professional (HCP) shortages may be of particular concern in certain specialty clinics where access to practitioners may already be limited. While this is a multifaceted problem, a pragmatic approach would be to increase the use of clinicians, such as clinical pharmacist practitioners (CPPs).
The William S. Middleton Memorial Veterans Hospital (WSMVH) in Madison, Wisconsin, is 1 of 17 VA ECoE sites. The VA ECoE provides high-quality, comprehensive epilepsy evaluation and care to veterans. In fiscal year (FY) 2020, the 17 sites provided care to 5544 veterans.10 The WSMVH epilepsy clinic sees about 400 veterans each year, receiving referrals from other VA medical centers, and prescribes ASMs, neuromodulation devices, and resective surgeries for epilepsy. The multidisciplinary team consists of an epileptologist, neurophysiology fellow, psychiatrist, nurse practitioner, CPP, and neurology residents. The WSMVH epilepsy clinic has employed CPPs at their highest level of clinical practice authority since 1991.
The WSMVH epilepsy clinic is open 4 hours once weekly. The clinic offers fourteen 30-minute appointment slots either in person or via telehealth. The epileptologist reviews patient charts prior to clinic and assigns each patient to the appropriate HCP. When making the determination to assign a patient to a CPP or pharmacy resident, the epileptologist considers current treatment response, mental health issues as well as medication-related concerns (eg, potential pharmacokinetic/pharmacodynamic interactions, AEs, adherence). The CPP can independently lead routine follow-up appointments and address acute as well as ongoing ASM therapy needs. Pharmacy residents are fully integrated into the clinic workflow, seeing assigned patients independently when appropriate but ensuring that each patient has access to either the epileptologist, CPP, or psychiatrist prior to finalizing the treatment plan. The epilepsy clinic rotation is required for first-year pharmacy residents and is an elective rotation in the second year.
While this level of service has been in place at WSMVH for more than 3 decades, a systematic evaluation on workload and clinical impact has not been conducted.11 The purpose of this analysis is to evaluate and quantify the breadth and impact of CPPs in this specialty setting. The WSMVH/University of Wisconsin-Madison institutional review board deemed this quality improvement study exempt from review.
Methods
This study was a single-center, retrospective, quality improvement project evaluating the impact of a CPP and clinical pharmacy resident have within the WSMVH epilepsy clinic on access to epilepsy care and medication management. The secondary outcomes were the types of interventions made by the CPP and mental health screening performed.
Between October 2019 and May 2021, 591 appointments were scheduled at the epilepsy clinic for medical, psychiatry, neurosurgery, and pharmacy residents; the epileptologist; CPP; psychiatrist; epilepsy fellow; or nurse practitioner. A retrospective chart review of the 446 patients seen by either a CPP or clinical pharmacy resident from October 2017 to June 2021 assessed pharmacist-led interventions made during each appointment. The following treatment interventions were assessed: medication initiations/discontinuations, dose changes, and nonpharmacologic interventions, including education. Additionally, any mental health screenings completed, consultations to other specialties placed, or laboratory tests ordered were documented.
Results
In the epilepsy clinic, 591 appointments were completed from October 1, 2019, to May 31, 2021. Of those appointments, 255 (43.2%) were led by pharmacists; 156 (26.4%) by pharmacy residents and 99 (16.8%) by CPPs (16.8%) (Table 1). Appointments held by other HCPs included 139 (23.5%) by nurse practitioner, 108 (18.3%) by the attending epileptologist, 41 (6.9%) by fellows, 22 (3.7%) by psychiatrists, 19 (3.2) by medical residents, 4 (0.7%) by neurosurgery residents, and 3 (0.5%) by psychiatry residents. Medication interventions included 55 (11.8%) dose increases, 52 (11.1%) medication initiations, and 32 (6.9%) dose decreases (Table 2). Mental health screening was conducted for 229 (49.1%) patients with PHQ-9, 225 (48.3%) with GAD-7, and 111 (23.8) with BITe. Some veterans received multiple screeners at a clinic visit, and others received none (most commonly during telephone follow-up appointments). The mean time spent with each patient was 27 minutes.
Discussion
Within the private sector, access to a neurologist or epileptologist is limited, and the US Health Resources and Services Administration National Center for Workforce Analysis projected that the demand for these specialists would exceed supply by 2025.12 In 2017, Kobau and colleagues found that only 1 in 10 adults with epilepsy saw a neurologist within the year, similar to previous years. As demand for specialty care exceeds capacity, additional members of the health care team are needed to ensure timely, effective, and safe care for patients with epilepsy.
One way to increase health care access is to use an interdisciplinary model of care, integrating pharmacists in the management of epilepsy in collaboration with other HCPs, a strategy that has been endorsed by the American Epilepsy Society (AES).13 As experts in pharmacotherapy, pharmacists can uniquely provide medication management for this complex disease as ASMs continue to remain the first-line treatment.14
In addition to increased demand for specialty services, there also is an increase in health care spending with a push to limit additional spending. In 2016, despite similar health care use in other high-income countries, health care costs are approximately twice as much in the US, mostly driven by prices of pharmaceuticals and administrative costs.15 Bond and colleagues evaluated 9380 Medicare patients with epilepsy or seizure disorders throughout US hospitals in 1998.16 They found that hospitals without pharmacist-managed ASM therapy had Medicare charges that were 11.2% higher than hospitals with pharmacist-managed therapy. Many factors contribute to the rise in cost, including an increase in laboratory charges for serum drug assays, legal litigations related to drug AEs, and an increase in hospital length of stay (about 14 additional days). Similar to pharmacist-managed anticoagulation, vancomycin, and aminoglycoside therapy, direct involvement of pharmacists with ASM management decreases health care costs.14
The American Academy of Neurology (AAN) developed 8 epilepsy quality measures: seizure type and frequency, etiology or epilepsy syndrome, review of electroencephalogram and imaging findings, counseling of ASM AEs, consideration of surgical treatment of intractable epilepsy, epilepsy-specific safety issues, and counseling for women of childbearing potential on contraception and pregnancy. These measures serve as a guide for evidence-based therapy and standardization of epilepsy care.17 Additionally, bone health, depression, and awareness of sudden unexplained death in epilepsy are increasing in importance when providing quality epilepsy care. Wasade and colleagues surveyed Michigan neurologists and found that only 37% of the respondents addressed ASM AEs at every clinic visit. They also found that just 26% of responding neurologists inquire about depression at every clinic visit, and 17% inquire only once a year. In our practice, screening for depression, suicidality, and counseling on ASM AEs are routinely provided by CPPs during each clinic visit.
Within the VA, CPPs are granted a scope of practice that allows them to perform comprehensive medication management, including but not limited to, prescribing medication regimens, ordering laboratory tests and diagnostic studies, and performing physical assessments. In our practice, the most common interventions made by CPPs were patient-focused counseling, bone health screening, mental health triage and referral, and ASM regimen adjustments. Assessment of ASM adherence also was noted to be an active area of CPP-patient engagement. These most common interventions align well with the AAN quality measures. It is now well recognized that nonadherence in patients with epilepsy not only can lead to loss of seizure control, but injury and death as well.18,19 Malek and colleagues found that patients with epilepsy who are nonadherent to their ASM regimens have a 3-times greater risk of mortality compared with those who were adherent.20 Adherence to the appropriate medication regimen in epilepsy can result in seizure-freedom in 70% of patients; therefore, exploring nonadherence in this population is crucial.21
The COVID-19 pandemic precipitated changes to the health care industry, including the heavy reliance on telehealth. Following the Wisconsin stay-at-home order on March 25, 2020, all nonessential face-to-face appointments at the WSMVH halted. The epilepsy clinic transitioned the majority of appointments to either telephone or VA Video Connect (VVC), which is a program on the veteran’s computer, tablet, or mobile device upon which the appointment is held. Although it became more challenging to obtain a mental health screening during virtual appointments and the frequency did decrease, patients were asked for a subjective report of their mood during each telephone or video appointment. The AES has since put forth a statement of support for the continuation of telehealth following the COVID-19 pandemic due to the flexibility that telehealth provides people with epilepsy. Additionally, the AES taskforce provided suggestions for continued pharmacist engagement within the epilepsy care team, including the triaging of patients, management of ASMs, and involvement in the delivery of telehealth.
Limitations
There is limited research available on the impact that a CPP has on medication management and access to care within an epilepsy clinic, especially those with a scope of practice. One limitation of this retrospective chart review is that the appropriateness of each medication intervention was not assessed; therefore, the impact of each intervention was not captured. Additionally, this single-site study of veterans may not reflect the general population. However, we believe that this model could be adapted to nonspecialty neurology practices. Of note the scope of this study did not include a comparison of medication interventions for the other specialties within the clinic.
Conclusions
The integration of a CPP and pharmacy residents into the WSMVH epilepsy clinic has allowed for greater and more timely access to care, managing 43.2% of all patients within the clinic during the study. Pharmacy scope of practice allows for collaborative autonomy with ASM adjustments and for the epileptologist time to focus on higher acuity cases. In settings where pharmacists do not have prescriptive status, medication management services, such as comprehensive medication reviews, identifying drug-drug and drug-disease interactions, recognizing adherence barriers, and medication safety surveillance, can still be performed to improve management of epilepsy.
Acknowledgments
Ellina S. Seckel, PharmD, BCACP, DPLA; Anita Kashyap, PharmD, BCACP; Brooke Keenan, NP; Leigh Heffner, PharmD
1. Stafstrom CE, Carmant L. Seizures and epilepsy: an overview for neuroscientists. Cold Spring Harb Perspect Med. 2015;5(6):a022426. doi:10.1101/cshperspect.a022426
2. GBD 2017 US Neurological Disorders Collaborators, Feigin VL, Vos T, et al. Burden of neurological disorders across the US from 1990-2017: a global burden of disease study. JAMA Neurol. 2021;78(2):165-176. doi:10.1001/jamaneurol.2020.4152
3. Rehman R, Kelly PR, Husain AM, Tran TT. Characteristics of veterans diagnosed with seizures within Veterans Health Administration. J Rehabil Res Dev. 2015;52(7):751-762. doi:10.1682/JRRD.2014.10.0241
4. Pugh MJ, Van Cott AC, Amuan M, et al. Epilepsy among Iraq and Afghanistan War veterans - United States, 2002-2015. MMWR Morb Mortal Wkly Rep. 2016;65(44):1224-1227. doi:10.15585/mmwr.mm6544a5
5. Rohde NN, Baca CB, Van Cott AC, Parko KL, Amuan ME, Pugh MJ. Antiepileptic drug prescribing patterns in Iraq and Afghanistan war veterans with epilepsy. Epilepsy Behav. 2015;46:133-139. doi:10.1016/j.yebeh.2015.03.027
6. Laxer KD, Trinka E, Hirsch LJ, et al. The consequences of refractory epilepsy and its treatment. Epilepsy Behav. 2014;37:59-70. doi:10.1016/j.yebeh.2014.05.031
7. Devinsky O, Hesdorffer DC, Thurman DJ, Lhatoo S, Richerson G. Sudden unexpected death in epilepsy: epidemiology, mechanisms, and prevention. Lancet Neurol. 2016;15(10):1075-1088. doi:10.1016/S1474-4422(16)30158-2
8. Tolchin B, Hirsch LJ, LaFrance WC Jr. Neuropsychiatric aspects of epilepsy. Psychiatr Clin North Am. 2020;43(2):275-290. doi:10.1016/j.psc.2020.02.002
9. Rai D, Kerr MP, McManus S, Jordanova V, Lewis G, Brugha TS. Epilepsy and psychiatric comorbidity: a nationally representative population-based study. Epilepsia. 2012;53(6):1095-1103. doi:10.1111/j.1528-1167.2012.03500.x
10. US Department of Veterans Affairs. Epilepsy Centers of Excellence. Annual report fiscal year 2020. Accessed March 11, 2022. https://www.epilepsy.va.gov/docs/ECoENational_AnnualReportFY20_web_508c.pdf
11. Fogg A, Staufenberg EF, Small I, Bhattacharya D. An exploratory study of primary care pharmacist-led epilepsy consultations. Int J Pharm Pract. 2012;20(5):294-302. doi:10.1111/j.2042-7174.2012.00207.x
12. Kobau R, Sapkota S, Pennell PB, Croft JB. Epilepsy by the numbers - from the US Centers for Disease Control and Prevention: six in 10 adults with active epilepsy saw a neurologist or epilepsy specialist in the past year, United States, 2017. Epilepsy Behav. 2020;112:107348. doi:10.1016/j.yebeh.2020.107348
13. Shawahna R. Development of key performance indicators to capture in measuring the impact of pharmacists in caring for patients with epilepsy in primary healthcare: A Delphi consensual study. Epilepsy Behav. 2019;98(pt A):129-138. doi:10.1016/j.yebeh.2019.07.034
14. Asadi-Pooya AA, Beniczky S, Rubboli G, Sperling MR, Rampp S, Perucca E. A pragmatic algorithm to select appropriate antiseizure medications in patients with epilepsy. Epilepsia. 2020;61(8):1668-1677. doi:10.1111/epi.16610
15. Papanicolas I, Woskie LR, Jha AK. Health Care Spending in the United States and Other High-Income Countries. JAMA. 2018;319(10):1024-1039. doi:10.1001/jama.2018.1150
16. Bond CA, Raehl CL. Clinical and economic outcomes of pharmacist-managed aminoglycoside or vancomycin therapy. Am J Health Syst Pharm. 2005;62(15):1596-1605. doi:10.2146/ajhp040555
17. Wasade VS, Spanaki M, Iyengar R, Barkley GL, Schultz L. AAN Epilepsy Quality Measures in clinical practice: a survey of neurologists. Epilepsy Behav. 2012;24(4):468-473. doi:10.1016/j.yebeh.2012.05.017
18. Hovinga CA, Asato MR, Manjunath R, et al. Association of non-adherence to antiepileptic drugs and seizures, quality of life, and productivity: survey of patients with epilepsy and physicians. Epilepsy Behav. 2008;13(2):316-322. doi:10.1016/j.yebeh.2008.03.009
19. Faught RE, Weiner JR, Guérin A, Cunnington MC, Duh MS. Impact of nonadherence to antiepileptic drugs on health care utilization and costs: findings from the RANSOM study. Epilepsia. 2009;50(3):501-509. doi:10.1111/j.1528-1167.2008.01794.x
20. Malek N, Heath CA, Greene J. A review of medication adherence in people with epilepsy. Acta Neurol Scand. 2017;135(5):507-515. doi:10.1111/ane.12703
21. O’ Rourke G, O’ Brien JJ. Identifying the barriers to antiepileptic drug adherence among adults with epilepsy. Seizure. 2017;45:160-168. doi:10.1016/j.seizure.2016.12.006
Medical assistants identify strategies and barriers to clinic efficiency
ABSTRACT
Background: Medical assistant (MA) roles have expanded rapidly as primary care has evolved and MAs take on new patient care duties. Research that looks at the MA experience and factors that enhance or reduce efficiency among MAs is limited.
Methods: We surveyed all MAs working in 6 clinics run by a large academic family medicine department in Ann Arbor, Michigan. MAs deemed by peers as “most efficient” were selected for follow-up interviews. We evaluated personal strategies for efficiency, barriers to efficient care, impact of physician actions on efficiency, and satisfaction.
Results: A total of 75/86 MAs (87%) responded to at least some survey questions and 61/86 (71%) completed the full survey. We interviewed 18 MAs face to face. Most saw their role as essential to clinic functioning and viewed health care as a personal calling. MAs identified common strategies to improve efficiency and described the MA role to orchestrate the flow of the clinic day. Staff recognized differing priorities of patients, staff, and physicians and articulated frustrations with hierarchy and competing priorities as well as behaviors that impeded clinic efficiency. Respondents emphasized the importance of feeling valued by others on their team.
Conclusions: With the evolving demands made on MAs’ time, it is critical to understand how the most effective staff members manage their role and highlight the strategies they employ to provide efficient clinical care. Understanding factors that increase or decrease MA job satisfaction can help identify high-efficiency practices and promote a clinic culture that values and supports all staff.
As primary care continues to evolve into more team-based practice, the role of the medical assistant (MA) has rapidly transformed.1 Staff may assist with patient management, documentation in the electronic medical record, order entry, pre-visit planning, and fulfillment of quality metrics, particularly in a Primary Care Medical Home (PCMH).2 From 2012 through 2014, MA job postings per graduate increased from 1.3 to 2.3, suggesting twice as many job postings as graduates.3 As the demand for experienced MAs increases, the ability to recruit and retain high-performing staff members will be critical.
MAs are referenced in medical literature as early as the 1800s.4 The American Association of Medical Assistants was founded in 1956, which led to educational standardization and certifications.5 Despite the important role that MAs have long played in the proper functioning of a medical clinic—and the knowledge that team configurations impact a clinic’s efficiency and quality6,7—few investigations have sought out the MA’s perspective.8,9 Given the increasing clinical demands placed on all members of the primary care team (and the burnout that often results), it seems that MA insights into clinic efficiency could be valuable.
METHODS
This cross-sectional study was conducted from February to April 2019 at a large academic institution with 6 regional ambulatory care family medicine clinics, each one with 11,000 to 18,000 patient visits annually. Faculty work at all 6 clinics and residents at 2 of them. All MAs are hired, paid, and managed by a central administrative department rather than by the family medicine department. The family medicine clinics are currently PCMH certified, with a mix of fee-for-service and capitated reimbursement.
Continue to: We developed and piloted...
We developed and piloted a voluntary, anonymous 39-question (29 closed-ended and 10 brief open-ended) online Qualtrics survey, which we distributed via an email link to all the MAs in the department. The survey included clinic site, years as an MA, perceptions of the clinic environment, perception of teamwork at their site, identification of efficient practices, and feedback for physicians to improve efficiency and flow. Most questions were Likert-style with 5 choices ranging from “strongly agree” to “strongly disagree” or short answer. Age and gender were omitted to protect confidentiality, as most MAs in the department are female. Participants could opt to enter in a drawing for three $25 gift cards. The survey was reviewed by the University of Michigan Institutional Review Board and deemed exempt.
We asked MAs to nominate peers in their clinic who were “especially efficient and do their jobs well—people that others can learn from.” The staff members who were nominated most frequently by their peers were invited to share additional perspectives via a 10- to 30-minute semi-structured interview with the first author. Interviews covered highly efficient practices, barriers and facilitators to efficient care, and physician behaviors that impaired efficiency. We interviewed a minimum of 2 MAs per clinic and increased the number of interviews through snowball sampling, as needed, to reach data saturation (eg, the point at which we were no longer hearing new content). MAs were assured that all comments would be anonymized. There was no monetary incentive for the interviews. The interviewer had previously met only 3 of the 18 MAs interviewed.
Analysis. Summary statistics were calculated for quantitative data. To compare subgroups (such as individual clinics), a chi-square test was used. In cases when there were small cell sizes (< 5 subjects), we used the Fisher’s Exact test. Qualitative data was collected with real-time typewritten notes during the interviews to capture ideas and verbatim quotes when possible. We also included open-ended comments shared on the Qualtrics survey. Data were organized by theme using a deductive coding approach. Both authors reviewed and discussed observations, and coding was conducted by the first author. Reporting followed the STROBE Statement checklist for cross-sectional studies.10 Results were shared with MAs, supervisory staff, and physicians, which allowed for feedback and comments and served as “member-checking.” MAs reported that the data reflected their lived experiences.
RESULTS
Surveys were distributed to all 86 MAs working in family medicine clinics. A total of 75 (87%) responded to at least some questions (typically just demographics). We used those who completed the full survey (n = 61; 71%) for data analysis. Eighteen MAs participated in face-to-face interviews. Among respondents, 35 (47%) had worked at least 10 years as an MA and 21 (28%) had worked at least a decade in the family medicine department.
Perception of role
All respondents (n = 61; 100%) somewhat or strongly agreed that the MA role was “very important to keep the clinic functioning” and 58 (95%) reported that working in health care was “a calling” for them. Only 7 (11%) agreed that family medicine was an easier environment for MAs compared to a specialty clinic; 30 (49%) disagreed with this. Among respondents, 32 (53%) strongly or somewhat agreed that their work was very stressful and just half (n = 28; 46%) agreed there were adequate MA staff at their clinic.
Continue to: Efficiency and competing priorities
Efficiency and competing priorities
MAs described important work values that increased their efficiency. These included clinic culture (good communication and strong teamwork), as well as individual strategies such as multitasking, limiting patient conversations, and doing tasks in a consistent way to improve accuracy. (See TABLE 1.) They identified ways physicians bolster or hurt efficiency and ways in which the relationship between the physician and the MA shapes the MA’s perception of their value in clinic.

Communication was emphasized as critical for efficient care, and MAs encouraged the use of preclinic huddles and communication as priorities. Seventy-five percent of MAs reported preclinic huddles to plan for patient care were helpful, but only half said huddles took place “always” or “most of the time.” Many described reviewing the schedule and completing tasks ahead of patient arrival as critical to efficiency.
Participants described the tension between their identified role of orchestrating clinic flow and responding to directives by others that disrupted the flow. Several MAs found it challenging when physicians agreed to see very late patients and felt frustrated when decisions that changed the flow were made by the physician or front desk staff without including the MA. MAs were also able to articulate how they managed competing priorities within the clinic, such as when a patient- or physician-driven need to extend appointments was at odds with maintaining a timely schedule. They were eager to share personal tips for time management and prided themselves on careful and accurate performance and skills they had learned on the job. MAs also described how efficiency could be adversely affected by the behaviors or attitudes of physicians. (See TABLE 2.)

Clinic environment
Thirty-six MAs (59%) reported that other MAs on their team were willing to help them out in clinic “a great deal” or “a lot” of the time, by helping to room a patient, acting as a chaperone for an exam, or doing a point-of-care lab. This sense of support varied across clinics (38% to 91% reported good support), suggesting that cultures vary by site. Some MAs expressed frustration at peers they saw as resistant to helping, exemplified by this verbatim quote from an interview:
“ Some don’t want to help out. They may sigh. It’s how they react—you just know.” (Clinic #1, MA #2 interview)
Efficient MAs stressed the need for situational awareness to recognize when co-workers need help:
“ [Peers often] are not aware that another MA is drowning. There’s 5 people who could have done that, and here I am running around and nobody budged.” (Clinic #5, MA #2 interview)
Continue to: A minority of staff...
A minority of staff used the open-ended survey sections to describe clinic hierarchy. When asked about “pet peeves,” a few advised that physicians should not “talk down” to staff and should try to teach rather than criticize. Another asked that physicians not “bark orders” or have “low gratitude” for staff work. MAs found micromanaging stressful—particularly when the physician prompted the MA about patient arrivals:
“[I don’t like] when providers will make a comment about a patient arriving when you already know this information. You then rush to put [the] patient in [a] room, then [the] provider ends up making [the] patient wait an extensive amount of time. I’m perfectly capable of knowing when a patient arrives.” (Clinic #6, survey)
MAs did not like physicians “talking bad about us” or blaming the MA if the clinic is running behind.
Despite these concerns, most MAs reported feeling appreciated for the job they do. Only 10 (16%) reported that the people they work with rarely say “thank you,” and 2 (3%) stated they were not well supported by the physicians in clinic. Most (n = 38; 62%) strongly agreed or agreed that they felt part of the team and that their opinions matter. In the interviews, many expanded on this idea:
“I really feel like I’m valued, so I want to do everything I can to make [my doctor’s] day go better. If you want a good clinic, the best thing a doc can do is make the MA feel valued.” (Clinic #1, MA #1 interview)
DISCUSSION
Participants described their role much as an orchestra director, with MAs as the key to clinic flow and timeliness.9 Respondents articulated multiple common strategies used to increase their own efficiency and clinic flow; these may be considered best practices and incorporated as part of the basic training. Most MAs reported their day-to-day jobs were stressful and believed this was underrecognized, so efficiency strategies are critical. With staff completing multiple time-sensitive tasks during clinic, consistent co-worker support is crucial and may impact efficiency.8 Proper training of managers to provide that support and ensure equitable workloads may be one strategy to ensure that staff members feel the workplace is fair and collegial.
Several comments reflected the power differential within medical offices. One study reported that MAs and physicians “occupy roles at opposite ends of social and occupational hierarchies.”11 It’s important for physicians to be cognizant of these patterns and clinic culture, as reducing a hierarchy-based environment will be appreciated by MAs.9 Prior research has found that MAs have higher perceptions of their own competence than do the physicians working with them.12 If there is a fundamental lack of trust between the 2 groups, this will undoubtedly hinder team-building. Attention to this issue is key to a more favorable work environment.
Continue to: Almost all respondents...
Almost all respondents reported health care was a “calling,” which mirrors physician research that suggests seeing work as a “calling” is protective against burnout.13,14 Open-ended comments indicated great pride in contributions, and most staff members felt appreciated by their teams. Many described the working relationships with physicians as critical to their satisfaction at work and indicated that strong partnerships motivated them to do their best to make the physician’s day easier. Staff job satisfaction is linked to improved quality of care, so treating staff well contributes to high-value care for patients.15 We also uncovered some MA “pet peeves” that hinder efficiency and could be shared with physicians to emphasize the importance of patience and civility.
One barrier to expansion of MA roles within PCMH practices is the limited pay and career ladder for MAs who adopt new job responsibilities that require advanced skills or training.1,2 The mean MA salary at our institution ($37,372) is higher than in our state overall ($33,760), which may impact satisfaction.16 In addition, 93% of MAs are women; thus, they may continue to struggle more with lower pay than do workers in male-dominated professions.17,18 Expected job growth from 2018-2028 is predicted at 23%, which may help to boost salaries.19 Prior studies describe the lack of a job ladder or promotion opportunities as a challenge1,20; this was not formally assessed in our study.
MAs see work in family medicine as much harder than it is in other specialty clinics. Being trusted with more responsibility, greater autonomy,21-23 and expanded patient care roles can boost MA self-efficacy, which can reduce burnout for both physicians and MAs.8,24 However, new responsibilities should include appropriate training, support, and compensation, and match staff interests.7
Study limitations. The study was limited to 6 clinics in 1 department at a large academic medical center. Interviewed participants were selected by convenience and snowball sampling and thus, the results cannot be generalized to the population of MAs as a whole. As the initial interview goal was simply to gather efficiency tips, the project was not designed to be formal qualitative research. However, the discussions built on open-ended comments from the written survey helped contextualize our quantitative findings about efficiency. Notes were documented in real time by a single interviewer with rapid typing skills, which allowed capture of quotes verbatim. Subsequent studies would benefit from more formal qualitative research methods (recording and transcribing interviews, multiple coders to reduce risk of bias, and more complex thematic analysis).
Our research demonstrated how MAs perceive their roles in primary care and the facilitators and barriers to high efficiency in the workplace, which begins to fill an important knowledge gap in primary care. Disseminating practices that staff members themselves have identified as effective, and being attentive to how staff members are treated, may increase individual efficiency while improving staff retention and satisfaction.
CORRESPONDENCE
Katherine J. Gold, MD, MSW, MS, Department of Family Medicine and Department of Obstetrics and Gynecology, University of Michigan, 1018 Fuller Street, Ann Arbor, MI 48104-1213; [email protected]
1. Chapman SA, Blash LK. New roles for medical assistants in innovative primary care practices. Health Serv Res. 2017;52(suppl 1):383-406.
2. Ferrante JM, Shaw EK, Bayly JE, et al. Barriers and facilitators to expanding roles of medical assistants in patient-centered medical homes (PCMHs). J Am Board Fam Med. 2018;31:226-235.
3. Atkins B. The outlook for medical assisting in 2016 and beyond. Accessed January 27, 2022. www.medicalassistantdegrees.net/articles/medical-assisting-trends/
4. Unqualified medical “assistants.” Hospital (Lond 1886). 1897;23:163-164.
5. Ameritech College of Healthcare. The origins of the AAMA. Accessed January 27, 2022. www.ameritech.edu/blog/medical-assisting-history/
6. Dai M, Willard-Grace R, Knox M, et al. Team configurations, efficiency, and family physician burnout. J Am Board Fam Med. 2020;33:368-377.
7. Harper PG, Van Riper K, Ramer T, et al. Team-based care: an expanded medical assistant role—enhanced rooming and visit assistance. J Interprof Care. 2018:1-7.
8. Sheridan B, Chien AT, Peters AS, et al. Team-based primary care: the medical assistant perspective. Health Care Manage Rev. 2018;43:115-125.
9. Tache S, Hill-Sakurai L. Medical assistants: the invisible “glue” of primary health care practices in the United States? J Health Organ Manag. 2010;24:288-305.
10. STROBE checklist for cohort, case-control, and cross-sectional studies. Accessed January 27, 2022. www.strobe-statement.org/fileadmin/Strobe/uploads/checklists/STROBE_checklist_v4_combined.pdf
11. Gray CP, Harrison MI, Hung D. Medical assistants as flow managers in primary care: challenges and recommendations. J Healthc Manag. 2016;61:181-191.
12. Elder NC, Jacobson CJ, Bolon SK, et al. Patterns of relating between physicians and medical assistants in small family medicine offices. Ann Fam Med. 2014;12:150-157.
13. Jager AJ, Tutty MA, Kao AC. Association between physician burnout and identification with medicine as a calling. Mayo Clinic Proc. 2017;92:415-422.
14. Yoon JD, Daley BM, Curlin FA. The association between a sense of calling and physician well-being: a national study of primary care physicians and psychiatrists. Acad Psychiatry. 2017;41:167-173.
15. Mohr DC, Young GJ, Meterko M, et al. Job satisfaction of primary care team members and quality of care. Am J Med Qual. 2011;26:18-25.
16. US Bureau of Labor Statistics. Occupational employment and wage statistics. Accessed January 27, 2022. https://www.bls.gov/oes/current/oes319092.htm
17. Chapman SA, Marks A, Dower C. Positioning medical assistants for a greater role in the era of health reform. Acad Med. 2015;90:1347-1352.
18. Mandel H. The role of occupational attributes in gender earnings inequality, 1970-2010. Soc Sci Res. 2016;55:122-138.
19. US Bureau of Labor Statistics. Occupational outlook handbook: medical assistants. Accessed January 27, 2022. www.bls.gov/ooh/healthcare/medical-assistants.htm
20. Skillman SM, Dahal A, Frogner BK, et al. Frontline workers’ career pathways: a detailed look at Washington state’s medical assistant workforce. Med Care Res Rev. 2018:1077558718812950.
21. Morse G, Salyers MP, Rollins AL, et al. Burnout in mental health services: a review of the problem and its remediation. Adm Policy Ment Health. 2012;39:341-352.
22. Dubois CA, Bentein K, Ben Mansour JB, et al. Why some employees adopt or resist reorganization of work practices in health care: associations between perceived loss of resources, burnout, and attitudes to change. Int J Environ Res Pub Health. 2014;11:187-201.
23. Aronsson G, Theorell T, Grape T, et al. A systematic review including meta-analysis of work environment and burnout symptoms. BMC Public Health. 2017;17:264.
24. O’Malley AS, Gourevitch R, Draper K, et al. Overcoming challenges to teamwork in patient-centered medical homes: a qualitative study. J Gen Intern Med. 2015;30:183-192.
ABSTRACT
Background: Medical assistant (MA) roles have expanded rapidly as primary care has evolved and MAs take on new patient care duties. Research that looks at the MA experience and factors that enhance or reduce efficiency among MAs is limited.
Methods: We surveyed all MAs working in 6 clinics run by a large academic family medicine department in Ann Arbor, Michigan. MAs deemed by peers as “most efficient” were selected for follow-up interviews. We evaluated personal strategies for efficiency, barriers to efficient care, impact of physician actions on efficiency, and satisfaction.
Results: A total of 75/86 MAs (87%) responded to at least some survey questions and 61/86 (71%) completed the full survey. We interviewed 18 MAs face to face. Most saw their role as essential to clinic functioning and viewed health care as a personal calling. MAs identified common strategies to improve efficiency and described the MA role to orchestrate the flow of the clinic day. Staff recognized differing priorities of patients, staff, and physicians and articulated frustrations with hierarchy and competing priorities as well as behaviors that impeded clinic efficiency. Respondents emphasized the importance of feeling valued by others on their team.
Conclusions: With the evolving demands made on MAs’ time, it is critical to understand how the most effective staff members manage their role and highlight the strategies they employ to provide efficient clinical care. Understanding factors that increase or decrease MA job satisfaction can help identify high-efficiency practices and promote a clinic culture that values and supports all staff.
As primary care continues to evolve into more team-based practice, the role of the medical assistant (MA) has rapidly transformed.1 Staff may assist with patient management, documentation in the electronic medical record, order entry, pre-visit planning, and fulfillment of quality metrics, particularly in a Primary Care Medical Home (PCMH).2 From 2012 through 2014, MA job postings per graduate increased from 1.3 to 2.3, suggesting twice as many job postings as graduates.3 As the demand for experienced MAs increases, the ability to recruit and retain high-performing staff members will be critical.
MAs are referenced in medical literature as early as the 1800s.4 The American Association of Medical Assistants was founded in 1956, which led to educational standardization and certifications.5 Despite the important role that MAs have long played in the proper functioning of a medical clinic—and the knowledge that team configurations impact a clinic’s efficiency and quality6,7—few investigations have sought out the MA’s perspective.8,9 Given the increasing clinical demands placed on all members of the primary care team (and the burnout that often results), it seems that MA insights into clinic efficiency could be valuable.
METHODS
This cross-sectional study was conducted from February to April 2019 at a large academic institution with 6 regional ambulatory care family medicine clinics, each one with 11,000 to 18,000 patient visits annually. Faculty work at all 6 clinics and residents at 2 of them. All MAs are hired, paid, and managed by a central administrative department rather than by the family medicine department. The family medicine clinics are currently PCMH certified, with a mix of fee-for-service and capitated reimbursement.
Continue to: We developed and piloted...
We developed and piloted a voluntary, anonymous 39-question (29 closed-ended and 10 brief open-ended) online Qualtrics survey, which we distributed via an email link to all the MAs in the department. The survey included clinic site, years as an MA, perceptions of the clinic environment, perception of teamwork at their site, identification of efficient practices, and feedback for physicians to improve efficiency and flow. Most questions were Likert-style with 5 choices ranging from “strongly agree” to “strongly disagree” or short answer. Age and gender were omitted to protect confidentiality, as most MAs in the department are female. Participants could opt to enter in a drawing for three $25 gift cards. The survey was reviewed by the University of Michigan Institutional Review Board and deemed exempt.
We asked MAs to nominate peers in their clinic who were “especially efficient and do their jobs well—people that others can learn from.” The staff members who were nominated most frequently by their peers were invited to share additional perspectives via a 10- to 30-minute semi-structured interview with the first author. Interviews covered highly efficient practices, barriers and facilitators to efficient care, and physician behaviors that impaired efficiency. We interviewed a minimum of 2 MAs per clinic and increased the number of interviews through snowball sampling, as needed, to reach data saturation (eg, the point at which we were no longer hearing new content). MAs were assured that all comments would be anonymized. There was no monetary incentive for the interviews. The interviewer had previously met only 3 of the 18 MAs interviewed.
Analysis. Summary statistics were calculated for quantitative data. To compare subgroups (such as individual clinics), a chi-square test was used. In cases when there were small cell sizes (< 5 subjects), we used the Fisher’s Exact test. Qualitative data was collected with real-time typewritten notes during the interviews to capture ideas and verbatim quotes when possible. We also included open-ended comments shared on the Qualtrics survey. Data were organized by theme using a deductive coding approach. Both authors reviewed and discussed observations, and coding was conducted by the first author. Reporting followed the STROBE Statement checklist for cross-sectional studies.10 Results were shared with MAs, supervisory staff, and physicians, which allowed for feedback and comments and served as “member-checking.” MAs reported that the data reflected their lived experiences.
RESULTS
Surveys were distributed to all 86 MAs working in family medicine clinics. A total of 75 (87%) responded to at least some questions (typically just demographics). We used those who completed the full survey (n = 61; 71%) for data analysis. Eighteen MAs participated in face-to-face interviews. Among respondents, 35 (47%) had worked at least 10 years as an MA and 21 (28%) had worked at least a decade in the family medicine department.
Perception of role
All respondents (n = 61; 100%) somewhat or strongly agreed that the MA role was “very important to keep the clinic functioning” and 58 (95%) reported that working in health care was “a calling” for them. Only 7 (11%) agreed that family medicine was an easier environment for MAs compared to a specialty clinic; 30 (49%) disagreed with this. Among respondents, 32 (53%) strongly or somewhat agreed that their work was very stressful and just half (n = 28; 46%) agreed there were adequate MA staff at their clinic.
Continue to: Efficiency and competing priorities
Efficiency and competing priorities
MAs described important work values that increased their efficiency. These included clinic culture (good communication and strong teamwork), as well as individual strategies such as multitasking, limiting patient conversations, and doing tasks in a consistent way to improve accuracy. (See TABLE 1.) They identified ways physicians bolster or hurt efficiency and ways in which the relationship between the physician and the MA shapes the MA’s perception of their value in clinic.
Communication was emphasized as critical for efficient care, and MAs encouraged the use of preclinic huddles and communication as priorities. Seventy-five percent of MAs reported preclinic huddles to plan for patient care were helpful, but only half said huddles took place “always” or “most of the time.” Many described reviewing the schedule and completing tasks ahead of patient arrival as critical to efficiency.
Participants described the tension between their identified role of orchestrating clinic flow and responding to directives by others that disrupted the flow. Several MAs found it challenging when physicians agreed to see very late patients and felt frustrated when decisions that changed the flow were made by the physician or front desk staff without including the MA. MAs were also able to articulate how they managed competing priorities within the clinic, such as when a patient- or physician-driven need to extend appointments was at odds with maintaining a timely schedule. They were eager to share personal tips for time management and prided themselves on careful and accurate performance and skills they had learned on the job. MAs also described how efficiency could be adversely affected by the behaviors or attitudes of physicians. (See TABLE 2.)
Clinic environment
Thirty-six MAs (59%) reported that other MAs on their team were willing to help them out in clinic “a great deal” or “a lot” of the time, by helping to room a patient, acting as a chaperone for an exam, or doing a point-of-care lab. This sense of support varied across clinics (38% to 91% reported good support), suggesting that cultures vary by site. Some MAs expressed frustration at peers they saw as resistant to helping, exemplified by this verbatim quote from an interview:
“ Some don’t want to help out. They may sigh. It’s how they react—you just know.” (Clinic #1, MA #2 interview)
Efficient MAs stressed the need for situational awareness to recognize when co-workers need help:
“ [Peers often] are not aware that another MA is drowning. There’s 5 people who could have done that, and here I am running around and nobody budged.” (Clinic #5, MA #2 interview)
Continue to: A minority of staff...
A minority of staff used the open-ended survey sections to describe clinic hierarchy. When asked about “pet peeves,” a few advised that physicians should not “talk down” to staff and should try to teach rather than criticize. Another asked that physicians not “bark orders” or have “low gratitude” for staff work. MAs found micromanaging stressful—particularly when the physician prompted the MA about patient arrivals:
“[I don’t like] when providers will make a comment about a patient arriving when you already know this information. You then rush to put [the] patient in [a] room, then [the] provider ends up making [the] patient wait an extensive amount of time. I’m perfectly capable of knowing when a patient arrives.” (Clinic #6, survey)
MAs did not like physicians “talking bad about us” or blaming the MA if the clinic is running behind.
Despite these concerns, most MAs reported feeling appreciated for the job they do. Only 10 (16%) reported that the people they work with rarely say “thank you,” and 2 (3%) stated they were not well supported by the physicians in clinic. Most (n = 38; 62%) strongly agreed or agreed that they felt part of the team and that their opinions matter. In the interviews, many expanded on this idea:
“I really feel like I’m valued, so I want to do everything I can to make [my doctor’s] day go better. If you want a good clinic, the best thing a doc can do is make the MA feel valued.” (Clinic #1, MA #1 interview)
DISCUSSION
Participants described their role much as an orchestra director, with MAs as the key to clinic flow and timeliness.9 Respondents articulated multiple common strategies used to increase their own efficiency and clinic flow; these may be considered best practices and incorporated as part of the basic training. Most MAs reported their day-to-day jobs were stressful and believed this was underrecognized, so efficiency strategies are critical. With staff completing multiple time-sensitive tasks during clinic, consistent co-worker support is crucial and may impact efficiency.8 Proper training of managers to provide that support and ensure equitable workloads may be one strategy to ensure that staff members feel the workplace is fair and collegial.
Several comments reflected the power differential within medical offices. One study reported that MAs and physicians “occupy roles at opposite ends of social and occupational hierarchies.”11 It’s important for physicians to be cognizant of these patterns and clinic culture, as reducing a hierarchy-based environment will be appreciated by MAs.9 Prior research has found that MAs have higher perceptions of their own competence than do the physicians working with them.12 If there is a fundamental lack of trust between the 2 groups, this will undoubtedly hinder team-building. Attention to this issue is key to a more favorable work environment.
Continue to: Almost all respondents...
Almost all respondents reported health care was a “calling,” which mirrors physician research that suggests seeing work as a “calling” is protective against burnout.13,14 Open-ended comments indicated great pride in contributions, and most staff members felt appreciated by their teams. Many described the working relationships with physicians as critical to their satisfaction at work and indicated that strong partnerships motivated them to do their best to make the physician’s day easier. Staff job satisfaction is linked to improved quality of care, so treating staff well contributes to high-value care for patients.15 We also uncovered some MA “pet peeves” that hinder efficiency and could be shared with physicians to emphasize the importance of patience and civility.
One barrier to expansion of MA roles within PCMH practices is the limited pay and career ladder for MAs who adopt new job responsibilities that require advanced skills or training.1,2 The mean MA salary at our institution ($37,372) is higher than in our state overall ($33,760), which may impact satisfaction.16 In addition, 93% of MAs are women; thus, they may continue to struggle more with lower pay than do workers in male-dominated professions.17,18 Expected job growth from 2018-2028 is predicted at 23%, which may help to boost salaries.19 Prior studies describe the lack of a job ladder or promotion opportunities as a challenge1,20; this was not formally assessed in our study.
MAs see work in family medicine as much harder than it is in other specialty clinics. Being trusted with more responsibility, greater autonomy,21-23 and expanded patient care roles can boost MA self-efficacy, which can reduce burnout for both physicians and MAs.8,24 However, new responsibilities should include appropriate training, support, and compensation, and match staff interests.7
Study limitations. The study was limited to 6 clinics in 1 department at a large academic medical center. Interviewed participants were selected by convenience and snowball sampling and thus, the results cannot be generalized to the population of MAs as a whole. As the initial interview goal was simply to gather efficiency tips, the project was not designed to be formal qualitative research. However, the discussions built on open-ended comments from the written survey helped contextualize our quantitative findings about efficiency. Notes were documented in real time by a single interviewer with rapid typing skills, which allowed capture of quotes verbatim. Subsequent studies would benefit from more formal qualitative research methods (recording and transcribing interviews, multiple coders to reduce risk of bias, and more complex thematic analysis).
Our research demonstrated how MAs perceive their roles in primary care and the facilitators and barriers to high efficiency in the workplace, which begins to fill an important knowledge gap in primary care. Disseminating practices that staff members themselves have identified as effective, and being attentive to how staff members are treated, may increase individual efficiency while improving staff retention and satisfaction.
CORRESPONDENCE
Katherine J. Gold, MD, MSW, MS, Department of Family Medicine and Department of Obstetrics and Gynecology, University of Michigan, 1018 Fuller Street, Ann Arbor, MI 48104-1213; [email protected]
1. Chapman SA, Blash LK. New roles for medical assistants in innovative primary care practices. Health Serv Res. 2017;52(suppl 1):383-406.
2. Ferrante JM, Shaw EK, Bayly JE, et al. Barriers and facilitators to expanding roles of medical assistants in patient-centered medical homes (PCMHs). J Am Board Fam Med. 2018;31:226-235.
3. Atkins B. The outlook for medical assisting in 2016 and beyond. Accessed January 27, 2022. www.medicalassistantdegrees.net/articles/medical-assisting-trends/
4. Unqualified medical “assistants.” Hospital (Lond 1886). 1897;23:163-164.
5. Ameritech College of Healthcare. The origins of the AAMA. Accessed January 27, 2022. www.ameritech.edu/blog/medical-assisting-history/
6. Dai M, Willard-Grace R, Knox M, et al. Team configurations, efficiency, and family physician burnout. J Am Board Fam Med. 2020;33:368-377.
7. Harper PG, Van Riper K, Ramer T, et al. Team-based care: an expanded medical assistant role—enhanced rooming and visit assistance. J Interprof Care. 2018:1-7.
8. Sheridan B, Chien AT, Peters AS, et al. Team-based primary care: the medical assistant perspective. Health Care Manage Rev. 2018;43:115-125.
9. Tache S, Hill-Sakurai L. Medical assistants: the invisible “glue” of primary health care practices in the United States? J Health Organ Manag. 2010;24:288-305.
10. STROBE checklist for cohort, case-control, and cross-sectional studies. Accessed January 27, 2022. www.strobe-statement.org/fileadmin/Strobe/uploads/checklists/STROBE_checklist_v4_combined.pdf
11. Gray CP, Harrison MI, Hung D. Medical assistants as flow managers in primary care: challenges and recommendations. J Healthc Manag. 2016;61:181-191.
12. Elder NC, Jacobson CJ, Bolon SK, et al. Patterns of relating between physicians and medical assistants in small family medicine offices. Ann Fam Med. 2014;12:150-157.
13. Jager AJ, Tutty MA, Kao AC. Association between physician burnout and identification with medicine as a calling. Mayo Clinic Proc. 2017;92:415-422.
14. Yoon JD, Daley BM, Curlin FA. The association between a sense of calling and physician well-being: a national study of primary care physicians and psychiatrists. Acad Psychiatry. 2017;41:167-173.
15. Mohr DC, Young GJ, Meterko M, et al. Job satisfaction of primary care team members and quality of care. Am J Med Qual. 2011;26:18-25.
16. US Bureau of Labor Statistics. Occupational employment and wage statistics. Accessed January 27, 2022. https://www.bls.gov/oes/current/oes319092.htm
17. Chapman SA, Marks A, Dower C. Positioning medical assistants for a greater role in the era of health reform. Acad Med. 2015;90:1347-1352.
18. Mandel H. The role of occupational attributes in gender earnings inequality, 1970-2010. Soc Sci Res. 2016;55:122-138.
19. US Bureau of Labor Statistics. Occupational outlook handbook: medical assistants. Accessed January 27, 2022. www.bls.gov/ooh/healthcare/medical-assistants.htm
20. Skillman SM, Dahal A, Frogner BK, et al. Frontline workers’ career pathways: a detailed look at Washington state’s medical assistant workforce. Med Care Res Rev. 2018:1077558718812950.
21. Morse G, Salyers MP, Rollins AL, et al. Burnout in mental health services: a review of the problem and its remediation. Adm Policy Ment Health. 2012;39:341-352.
22. Dubois CA, Bentein K, Ben Mansour JB, et al. Why some employees adopt or resist reorganization of work practices in health care: associations between perceived loss of resources, burnout, and attitudes to change. Int J Environ Res Pub Health. 2014;11:187-201.
23. Aronsson G, Theorell T, Grape T, et al. A systematic review including meta-analysis of work environment and burnout symptoms. BMC Public Health. 2017;17:264.
24. O’Malley AS, Gourevitch R, Draper K, et al. Overcoming challenges to teamwork in patient-centered medical homes: a qualitative study. J Gen Intern Med. 2015;30:183-192.

Developing and Measuring Effectiveness of a Distance Learning Dermatology Course: A Prospective Observational Study
Medical education has seen major changes over the last decade. The allotted time for preclinical education has decreased from 24 months to 18 months or less at most institutions, with an increased focus on content associated with health care delivery and health system science.1,2 Many schools now include at least some blended learning with online delivery of preclinical education.3 On the other hand, the clinical portion of medical education has remained largely unchanged prior to the COVID-19 pandemic, with the apprenticeship framework allowing the experienced physician to observe, mentor, and pass on practical knowledge so that the apprentice can one day gain independence after demonstrating adequate proficiency.4
With respect to dermatology education, skin disorders are in the top 5 reported reasons for visits to primary care5; however, a 2009 survey found that only 0.24% to 0.30% of medical schools’ curricula are spent on dermatology.6 Moreover, one institution found that fourth-year medical students received an average of 46.6% on a 15-item quiz designed to assess the ability to diagnose and treat common dermatologic conditions, and within that same cohort, 87.6% of students felt that they received inadequate training in dermatology during medical school.7
COVID-19 caused an unprecedented paradigm shift when medical schools throughout the country, including our own, canceled clinical rotations at the end of March 2020 to protect students and control the spread of infection. To enable clinical and preclinical learning to continue, institutions around the globe turned to either online learning or participation in telehealth as a substitute for clinical rotations.8-10 At the Uniformed Services University of the Health Sciences (Bethesda, Maryland), one of the many online clinical courses offered included a distance learning (DL) dermatology course. Herein, we describe the results of a prospective study evaluating short-term information recall and comprehension as well as students’ confidence in their ability to apply course objectives over 3 months of an online DL dermatology course.
Methods
Between April and July 2020, 14 students at the Uniformed Services University of the Health Sciences (Table 1) enrolled in 1 of 3 four-week DL dermatology classes. The students independently completed the Basic Dermatology Curriculum, a set of online modules with demonstrated efficacy from the American Academy of Dermatology, over 4 weeks.11 Additionally, students were instructed to review an hour of clinical dermatology images daily from online dermatology atlases and e-books accessed through our medical school’s virtual library. Optional Free Open Access Meducation resources also were provided. The course syllabus provided the students with clear expectations, links to the resources, and a recommended daily schedule.

An online video conferencing platform was utilized for an orientation session and 4 subsequent weekly 1.5-hour virtual meetings. The weekly DL meetings focused on a discussion of clinical images pertinent to the American Academy of Dermatology modules covered for the week. These interactive analytic sessions were referred to as Clinpic sessions. With instructor guidance, the students learned to describe images, and they provided differential diagnoses, workup, and treatments for various skin diseases. The virtual meetings included supplemental lectures detailing the use of teledermatology and laser therapy in the Military Health System and a journal review on the cutaneous manifestations of COVID-19.
A 40-question, image-based pretest and posttest utilized during clinical rotations evaluated knowledge recall and comprehension. A precourse and postcourse survey using a 5-point Likert scale (1=not confident; 5=extremely confident) assessed students’ confidence levels across course objectives: general knowledge of dermatology, working knowledge of teledermatology, ability to accurately describe skin lesions, generate sound differential diagnoses, and formulate a reasonable treatment plan. Statistical analysis was performed using free online statistical software at statskingdom.com.12
Results
All 14 student enrollees completed the precourse and postcourse tests and surveys. Pretest and posttest scores followed a normal distribution and therefore met criteria for utilization of a parametric test. The precourse test average of 67% (range, 40%–90%) improved to 84% postcourse (range, 70%–98%; P<.001; 95% CI, 11-23 by paired t test). Not surprisingly, the 2 students who had completed a dermatology rotation had higher average pretest and posttest scores (pretest, 87%; posttest, 94%). Students’ confidence with the course objectives were mostly at the somewhat confident level on the 5-point Likert scale precourse survey. By the end of the course, student survey responses increased to confident and very confident levels, corresponding to an overall improvement of 1.3 points (P<.001 by paired t test)(Table 2) when the mean of the survey results was aggregated across every question. Instructor evaluation of student performance mirrored student assessments.

Comment
The DL dermatology course succeeded in helping the enrolled students attain course objectives and offered a reasonable solution when in-person interaction was restricted. The students in the DL course made notable improvements in their dermatology knowledge and improved their communication, diagnosis, and management skills. Although a blended dermatology curriculum with e-learning combined with clinical experience has been shown to increase knowledge acquisition,13,14 our results suggest that an online-only program also can increase comprehension as well as students’ confidence in their abilities.
A major challenge for the DL course was the lack of opportunity to perform common dermatology procedures. The addition of a hands-on skin procedure module would have been a great supplement to the course but was not possible due to social distancing guidelines during the COVID-19 pandemic. The small sample size and voluntary enrollment were limitations to this study.
Conclusion
Although the traditional dermatology rotation remains the gold standard for clinical instruction, a well-organized DL teaching environment allowed for a more controlled learning experience with a broader coverage of topics to include potentially greater exposure to rare skin disorders not typically encountered in everyday practice. A DL dermatology course may serve as an enduring curriculum for those who wish to learn dermatology more broadly and are not interested in performing skin procedures or direct patient exposure (eg, those pursuing non–primary care specialties, pathology, or radiology). It also may be attractive to students who have had a prior clinical dermatology rotation and desire a different learning experience with a wide coverage of topics.
Acknowledgments—The authors thank Thomas Darling, MD, PhD (Bethesda, Maryland), for coining the term Clinpic and providing critical feedback throughout the course. The authors also thank Sorana Raiciulescu, MS (Bethesda, Maryland), for assistance with the statistical analysis.
- Emanuel EJ. The inevitable reimagining of medical education. JAMA. 2020;323:1127-1128.
- Skochelak SE, Stack SJ. Creating the medical schools of the future. Acad Med. 2017;92:16-19.
- Vallée A, Blacher J, Cariou A, et al. Blended learning compared to traditional learning in medical education: systematic review and meta-analysis. J Med Internet Res. 2020;22:E16504.
- Rangachari D, Brown LE, Kern DE, et al. Clinical coaching: evolving the apprenticeship model for modern housestaff. Med Teach. 2017;39:780-782.
- Finley CR, Chan DS, Garrison S, et al. What are the most common conditions in primary care? Can Fam Physician. 2018;64:832-840.
- McCleskey PE, Gilson RT, DeVillez RL. Medical student core curriculum in dermatology survey. J Am Acad Dermatol. 2009;61:30-35.e4.
- Ulman CA, Binder SB, Borges NJ. Assessment of medical students’ proficiency in dermatology: are medical students adequately prepared to diagnose and treat common dermatologic conditions in the United States? J Educ Eval Health Prof. 2015;12:18.
- Loh TY, Hsiao JL, Shi VY. COVID-19 and its effect on medical student education in dermatology. J Am Acad Dermatol. 2020;83:E163-E164.
- Hilburg R, Patel N, Ambruso S, et al. Medical education during the coronavirus disease-2019 pandemic: learning from a distance. Adv Chronic Kidney Dis. 2020;27:412-417.
- Rose S. Medical student education in the time of COVID-19. JAMA. 2020;323:2131-2132.
- McCleskey PE. Clinic teaching made easy: a prospective study of the American Academy of Dermatology core curriculum in primary care learners. J Am Acad Dermatol. 2013;69:273-279.e1.
- Paired T Test calculator. Statistics Kingdom website. Accessed February 7, 2022. http://www.statskingdom.com/160MeanT2pair.html
- Fransen F, Martens H, Nagtzaam I, et al. Use of e-learning in clinical clerkships: effects on acquisition of dermatological knowledge and learning processes. Int J Med Educ. 2018;9:11-17.
- Silva CS, Souza MB, Silva Filho RS, et al. E-learning program for medical students in dermatology. Clinics. 2011;66:619-622.
Medical education has seen major changes over the last decade. The allotted time for preclinical education has decreased from 24 months to 18 months or less at most institutions, with an increased focus on content associated with health care delivery and health system science.1,2 Many schools now include at least some blended learning with online delivery of preclinical education.3 On the other hand, the clinical portion of medical education has remained largely unchanged prior to the COVID-19 pandemic, with the apprenticeship framework allowing the experienced physician to observe, mentor, and pass on practical knowledge so that the apprentice can one day gain independence after demonstrating adequate proficiency.4
With respect to dermatology education, skin disorders are in the top 5 reported reasons for visits to primary care5; however, a 2009 survey found that only 0.24% to 0.30% of medical schools’ curricula are spent on dermatology.6 Moreover, one institution found that fourth-year medical students received an average of 46.6% on a 15-item quiz designed to assess the ability to diagnose and treat common dermatologic conditions, and within that same cohort, 87.6% of students felt that they received inadequate training in dermatology during medical school.7
COVID-19 caused an unprecedented paradigm shift when medical schools throughout the country, including our own, canceled clinical rotations at the end of March 2020 to protect students and control the spread of infection. To enable clinical and preclinical learning to continue, institutions around the globe turned to either online learning or participation in telehealth as a substitute for clinical rotations.8-10 At the Uniformed Services University of the Health Sciences (Bethesda, Maryland), one of the many online clinical courses offered included a distance learning (DL) dermatology course. Herein, we describe the results of a prospective study evaluating short-term information recall and comprehension as well as students’ confidence in their ability to apply course objectives over 3 months of an online DL dermatology course.
Methods
Between April and July 2020, 14 students at the Uniformed Services University of the Health Sciences (Table 1) enrolled in 1 of 3 four-week DL dermatology classes. The students independently completed the Basic Dermatology Curriculum, a set of online modules with demonstrated efficacy from the American Academy of Dermatology, over 4 weeks.11 Additionally, students were instructed to review an hour of clinical dermatology images daily from online dermatology atlases and e-books accessed through our medical school’s virtual library. Optional Free Open Access Meducation resources also were provided. The course syllabus provided the students with clear expectations, links to the resources, and a recommended daily schedule.
An online video conferencing platform was utilized for an orientation session and 4 subsequent weekly 1.5-hour virtual meetings. The weekly DL meetings focused on a discussion of clinical images pertinent to the American Academy of Dermatology modules covered for the week. These interactive analytic sessions were referred to as Clinpic sessions. With instructor guidance, the students learned to describe images, and they provided differential diagnoses, workup, and treatments for various skin diseases. The virtual meetings included supplemental lectures detailing the use of teledermatology and laser therapy in the Military Health System and a journal review on the cutaneous manifestations of COVID-19.
A 40-question, image-based pretest and posttest utilized during clinical rotations evaluated knowledge recall and comprehension. A precourse and postcourse survey using a 5-point Likert scale (1=not confident; 5=extremely confident) assessed students’ confidence levels across course objectives: general knowledge of dermatology, working knowledge of teledermatology, ability to accurately describe skin lesions, generate sound differential diagnoses, and formulate a reasonable treatment plan. Statistical analysis was performed using free online statistical software at statskingdom.com.12
Results
All 14 student enrollees completed the precourse and postcourse tests and surveys. Pretest and posttest scores followed a normal distribution and therefore met criteria for utilization of a parametric test. The precourse test average of 67% (range, 40%–90%) improved to 84% postcourse (range, 70%–98%; P<.001; 95% CI, 11-23 by paired t test). Not surprisingly, the 2 students who had completed a dermatology rotation had higher average pretest and posttest scores (pretest, 87%; posttest, 94%). Students’ confidence with the course objectives were mostly at the somewhat confident level on the 5-point Likert scale precourse survey. By the end of the course, student survey responses increased to confident and very confident levels, corresponding to an overall improvement of 1.3 points (P<.001 by paired t test)(Table 2) when the mean of the survey results was aggregated across every question. Instructor evaluation of student performance mirrored student assessments.
Comment
The DL dermatology course succeeded in helping the enrolled students attain course objectives and offered a reasonable solution when in-person interaction was restricted. The students in the DL course made notable improvements in their dermatology knowledge and improved their communication, diagnosis, and management skills. Although a blended dermatology curriculum with e-learning combined with clinical experience has been shown to increase knowledge acquisition,13,14 our results suggest that an online-only program also can increase comprehension as well as students’ confidence in their abilities.
A major challenge for the DL course was the lack of opportunity to perform common dermatology procedures. The addition of a hands-on skin procedure module would have been a great supplement to the course but was not possible due to social distancing guidelines during the COVID-19 pandemic. The small sample size and voluntary enrollment were limitations to this study.
Conclusion
Although the traditional dermatology rotation remains the gold standard for clinical instruction, a well-organized DL teaching environment allowed for a more controlled learning experience with a broader coverage of topics to include potentially greater exposure to rare skin disorders not typically encountered in everyday practice. A DL dermatology course may serve as an enduring curriculum for those who wish to learn dermatology more broadly and are not interested in performing skin procedures or direct patient exposure (eg, those pursuing non–primary care specialties, pathology, or radiology). It also may be attractive to students who have had a prior clinical dermatology rotation and desire a different learning experience with a wide coverage of topics.
Acknowledgments—The authors thank Thomas Darling, MD, PhD (Bethesda, Maryland), for coining the term Clinpic and providing critical feedback throughout the course. The authors also thank Sorana Raiciulescu, MS (Bethesda, Maryland), for assistance with the statistical analysis.
- Emanuel EJ. The inevitable reimagining of medical education. JAMA. 2020;323:1127-1128.
- Skochelak SE, Stack SJ. Creating the medical schools of the future. Acad Med. 2017;92:16-19.
- Vallée A, Blacher J, Cariou A, et al. Blended learning compared to traditional learning in medical education: systematic review and meta-analysis. J Med Internet Res. 2020;22:E16504.
- Rangachari D, Brown LE, Kern DE, et al. Clinical coaching: evolving the apprenticeship model for modern housestaff. Med Teach. 2017;39:780-782.
- Finley CR, Chan DS, Garrison S, et al. What are the most common conditions in primary care? Can Fam Physician. 2018;64:832-840.
- McCleskey PE, Gilson RT, DeVillez RL. Medical student core curriculum in dermatology survey. J Am Acad Dermatol. 2009;61:30-35.e4.
- Ulman CA, Binder SB, Borges NJ. Assessment of medical students’ proficiency in dermatology: are medical students adequately prepared to diagnose and treat common dermatologic conditions in the United States? J Educ Eval Health Prof. 2015;12:18.
- Loh TY, Hsiao JL, Shi VY. COVID-19 and its effect on medical student education in dermatology. J Am Acad Dermatol. 2020;83:E163-E164.
- Hilburg R, Patel N, Ambruso S, et al. Medical education during the coronavirus disease-2019 pandemic: learning from a distance. Adv Chronic Kidney Dis. 2020;27:412-417.
- Rose S. Medical student education in the time of COVID-19. JAMA. 2020;323:2131-2132.
- McCleskey PE. Clinic teaching made easy: a prospective study of the American Academy of Dermatology core curriculum in primary care learners. J Am Acad Dermatol. 2013;69:273-279.e1.
- Paired T Test calculator. Statistics Kingdom website. Accessed February 7, 2022. http://www.statskingdom.com/160MeanT2pair.html
- Fransen F, Martens H, Nagtzaam I, et al. Use of e-learning in clinical clerkships: effects on acquisition of dermatological knowledge and learning processes. Int J Med Educ. 2018;9:11-17.
- Silva CS, Souza MB, Silva Filho RS, et al. E-learning program for medical students in dermatology. Clinics. 2011;66:619-622.
Practice Points
- An e-learning distance learning (DL) dermatology course can substantially improve clinically relevant skills and knowledge in dermatology.
- A DL dermatology course may serve as an alternative to clinical rotations for those who wish to learn dermatology more broadly and are not interested in performing skin procedures or direct patient exposure.
Outcomes After Injection-Based Therapy: A Pain Outcomes Questionnaire for Veterans Univariate Analysis
Chronic pain is persistent or recurring pain lasting more than 3 months past normal healing time. Primary care professionals usually refer patients experiencing chronic pain to pain specialists to better identify, treat, and manage the pain. Chronic noncancer-related pain affects more Americans than diabetes mellitus, cardiac disease, and cancer combined.1 Veterans are no exception. The prevalence of severe pain was significantly higher in veterans compared with that of nonveterans who had back pain (21.6 vs 16.7%, respectively), jaw pain (37.5 vs 22.9%, respectively), severe headaches or migraine (26.4 vs 15.9%, respectively), and neck pain (27.7 vs 21.4%, respectively).2 At an individual level, those who experience chronic pain can expect impaired functional capacity, reduced ability to work, sleep disturbance, reduced social interactions, and considerable psychological distress. At a societal level, the cost of treating chronic pain is exorbitant, exceeding $600 billion annually, yet treatment outcomes remain variable at best.3 Greater efforts are needed to improve and standardize patient outcomes.
Interventional pain procedures performed under fluoroscopic or ultrasound guidance by specialist physicians have shown mixed responses in previous studies. Past systematic reviews demonstrate reductions in pain scores after lumbar or caudal epidural steroid injections (ESIs) and radiofrequency ablation of nerves supplying lumbar and thoracic facet joints.4-7 However, one review found insufficient evidence to support injection therapy for chronic low back pain.8 Unfortunately, the majority of the included studies evaluated outcomes using the visual analogue scale (VAS) or other limited factors, such as physical examination findings. Current biopsychosocial conceptualizations of chronic pain are beginning to recognize the complex nature of the experience of pain and highlighting the significance of multimodal management.9 It is vital that our assessment of chronic pain, like our treatment options, be multidimensional and reflect these underpinning principles.
The Pain Outcomes Questionnaire-For Veterans (POQ-VA) was developed within the Veterans Health Administration (VHA) by Clark and colleagues in 2003. It represents a brief but psychometrically sound pain outcomes instrument that assesses all key domains and meets accreditation body standards. The POQ-VA is valid and reliable for evaluating effectiveness of treatment of chronic noncancer pain in veterans in routine clinical practice.10 This review is the first study to use the POQ-VA to assess the impact of interventional pain procedures on veterans with chronic noncancer pain.
The aim of this study was to perform a retrospective review of POQ-VA scores before and after injection-based interventional treatment for chronic pain to determine whether the procedure affected patient outcomes. We hypothesized that POQ-VA scores would improve across multiple domains in the veteran population postprocedure. This study was approved by the Institutional Review Board (IRB-2018-053) at the Providence Veterans Affairs Medical Center (VAMC) in Rhode Island.
Methods
Using the Computerized Patient Record System, all adult veteran patients who had attended at least 2 appointments between April 1, 2009, and April 1, 2019 at the Providence VAMC interventional pain clinic were identified. POQ-VA reports were extracted provided the following criteria were met: (1) the veteran received an injection-based interventional treatment for chronic pain, including trigger point injections, ESIs, nerve blocks, and radiofrequency ablations; (2) the veteran completed POQ-VA both pre- and posttreatment; and (3) posttreatment POQ-VA reports were completed within 6 months of treatment. All patients who did not fit these criteria were excluded from the study.
After deidentification, 112 pre- and posttreatment POQ-VA reports were identified. All subsequent statistical analyses were conducted using Stata SE version 15. Descriptive statistics including mean, range, SD, and percent change were computed for POQ-VA domain—pain, mobility, activities of daily living (ADL), vitality, negative affect, fear, and total raw score—as well as for each POQ-VA question. Given that POQ-VA domain scores were found to be approximately normally distributed without outliers, domain scores were treated as continuous variables, and a paired samples t test was conducted to compare means among POQ-VA domains. Individual question responses were analyzed using nonparametric testing methods to account for the lack of normal distribution in each question, treating the range of 0 to 10 as an ordinal variable. A Wilcoxon matched-pairs signed-rank test was conducted to compare means among individual question responses before and after treatment.
Results
Of 112 included patients, 102 (91%) were male and 10 (9%) were female. The mean age was 62 years (range, 35-90). Diagnosis and procedures varied due to patient symptoms varying from muscle pain, nerve pain, degenerative disc disease, and osteoarthritis.


POQ-VA scores across all domains, including total raw score, showed statistically significant improvement after treatment (Table 1). Directionally, the POQ-VA scores for all 20 questions reflect a positive treatment response and 17 had statistically significant changes (P < .05) (Table 2). The changes in self-perceived energy level, safety, and feelings of tension were not statistically significant. Esteem had the greatest magnitude decrease, falling from 5.2 preprocedure to 3.8 postprocedure (P < .001). Other similarly significant magnitudes of improvement were seen from pre- to postprocedure in questions pertaining to grooming (2.2 to 1.6, P = .003) and the ability to use the bathroom (3.4 to 2.6, P < .001).
Discussion
The most important finding of this study was the ability of the POQ-VA to detect statistically significant positive responses to injection therapy across all domains. The largest improvements were in self-reported pain intensity, pain-related impairment in mobility and ADLs, and self-reported dysphoric effects. The single largest improvement posttreatment was a reduction in scores related to low self-esteem.
Chronic pain can be assessed in a variety of ways ranging from physical examination findings and subjective numerical ratings to extensive patient-reported questionnaires. The International Association for the Study of Pain acknowledges that pain is a complex experience and recommends assessment should be comprehensive.11 Many patient-reported questionnaires are available to clinicians, including some that address pain in a specific body part, such as the Oswestry Low Back Pain Disability Questionnaire, or those that focus on depression or quality-of-life measures, such as the SF-36.12,13
One major benefit of using the POQ-VA is its potential to demonstrate benefits across multiple domains, reflecting the complex nature of chronic pain. The POQ-VA also separates domain or scale scores, allowing clinicians to identify individuals with different patterns of dysfunction across domains.10 This separation also provides insight into which treatment options are best for chronic pain patients with predominant patterns or lower scores in certain domains. The use of a single summary score, as seen in other questionnaires such as the Roland-Morris Activity Scale, may conceal treatment-induced changes in specific outcome domains.14 Additionally, like many other similar instruments, the POQ-VA is easy to understand and use, requires no special training, takes little time to complete, and can be completed in person or over the phone.
As chronic pain has been studied further and its complexity recognized, more instruments have been developed and modified to reflect these new elements. There is no one scale applicable to all populations. A discussion about the strengths and weaknesses of each available assessment tool is outside the scope of this review. However, to date, the POQ-VA is the only instrument that has been validated to detect change following treatment of chronic pain in an exclusively veteran population.10 This validation emphasizes the importance of this study as it supports the use of this outcome measure to monitor treatment of pain in VA facilities.
One of the secondary findings indicated that injection therapy improved veterans’ physical activity levels and self-esteem and lowered pain scores as well as kinesiophobia and anxiety. The role of interventional procedures has been well established in the field of chronic pain, but their efficacy has been less clear. Injections are costly and not without risk, and these factors relegate them to fourth-line treatment options in most situations.15 Several meta-analyses have demonstrated small improvements in pain scores and patient-reported questionnaires after medial branch blocks, and lumbar or caudal ESIs for chronic back pain.5-7 However, an updated Cochrane Review concluded that there was insufficient evidence to support the use of injection therapy in subacute and chronic low back pain.8 The review acknowledged the limited methodologic quality of the trials and could not definitively report that injection therapy did not have benefits for certain subgroups of patients. The ability of researchers to detect benefit from an intervention is intrinsically linked to how outcomes are determined. The most interesting finding of our study was the patient-reported improved self-esteem scores. Many trials included in the systematic reviews discussed used outcome measures that did not have the multidimensional scope to demonstrate such a potential benefit.
Limitations
Our relatively small sample size represents the main shortcoming of this study. Because many posttreatment questionnaires were never collected, unfortunately, much potential data was lost. Most procedures performed were corticosteroid injections for the treatment of low back pain. This represented a combination of lumbar ESI, caudal ESI, medial branch blocks, and sacroiliac joint injections. The limited numbers meant that a further regression analysis of each injection type was not possible. Since few interventions treated pain in other areas of the body, it is difficult to determine whether procedures such as hip joint injections and ilioinguinal nerve blocks provided overall benefit. In the same vein, there is an inability to comment on which injection for chronic low back pain was the most efficacious.
The veteran population, while similar to the general population experiencing chronic pain, is more likely to experience PTSD and other mental health conditions.2 According to medical literature, no randomized controlled trials have been published examining pain interventions exclusively in veterans, so the applicability of these results needs further investigation. This study suggests there are potential benefits for the veteran population, not solely perhaps from receiving injection therapy, but to having access to an interventional pain clinic led by a pain physician within a network of other specialties. While limited by the inherent biases of a retrospective review, this study highlights the potential value in continuing to study this subgroup of patients, especially in the setting of an interdisciplinary approach.
Recent literature suggests interdisciplinary chronic pain management represents the best outcomes for patients’ physical, emotional, and social health, though these kinds of focused outpatient programs have not been studied on a large scale.16 The evolution of pain management in recent years to incorporating a biopsychosocial model has revolutionized how pain is treated and assessed, with multiple studies suggesting the greatest benefits lie in a multipronged approach.16,17 Past studies assessing individual interventions for chronic pain tend not to show strongly positive results, further reinforcing the idea that the answer does not lie in a specific treatment. Many veterans who were included in this study possibly had received or were receiving adjunct therapies such as physical therapy, cognitive behavioral therapy, and acupuncture for pain management, as well as oral and topical medications. Unfortunately, due to the selected methodology, it was not possible for us to gather those data. In turn, we were unable to determine how much these additional factors played a role in changing patient scores, alongside injection therapy. This inability to control variables in this type of research continues to present a challenge to data interpretation, even in the highest quality of research, as acknowledged by Staal and colleagues.8
Future research may be best focused by expanding our knowledge of outpatient interdisciplinary pain management programs. Some interventions may be more relevant for a particular group within a program, and this information can be useful to direct resources.18 Future prospects will require an appropriate multidimensional assessment tool, and the POQ-VA is an example of a valid and reliable option for monitoring progress in pain management in the veteran population.
Conclusions
The POQ-VA is the only instrument to date that has been validated to detect change following treatment of chronic pain in an exclusively veteran population. Our study is the first univariate analysis since the instrument’s validation in 2003. Our descriptive and inferential statistics suggest that the majority of veterans undergoing injection therapy for chronic pain had statistically significant improvements in POQ-VA measures within a 6-month period following treatment. In order to conduct more rigorous, multivariate studies, continued and more widespread use of the POQ-VA instrument is warranted.
1. Johannes CB, Le TK, Zhou X, Johnston JA, Dworkin RH. The prevalence of chronic pain in United States adults: results of an Internet-based survey. J Pain. 2010;11(11):1230-1239. doi:10.1016/j.jpain.2010.07.002
2. Nahin RL. Severe Pain in Veterans: The effect of age and sex, and comparisons with the general population. J Pain. 2017;18(3):247-254. doi:10.1016/j.jpain.2016.10.021
3. Witkin LR, Farrar JT, Ashburn MA. Can assessing chronic pain outcomes data improve outcomes?. Pain Med. 2013;14(6):779-791. doi:10.1111/pme.12075
4. Benyamin RM, Manchikanti L, Parr AT, et al. The effectiveness of lumbar interlaminar epidural injections in managing chronic low back and lower extremity pain. Pain Physician. 2012;15(4):E363-E404.
5. Zhai J, Zhang L, Li M, et al. Epidural injection with or without steroid in managing chronic low-back and lower extremity pain: a meta-analysis of 10 randomized controlled trials. Am J Ther. 2017;24(3):e259-e269. doi:10.1097/MJT.0000000000000265
6. Parr AT, Manchikanti L, Hameed H, et al. Caudal epidural injections in the management of chronic low back pain: a systematic appraisal of the literature. Pain Physician. 2012;15(3):E159-E198.
7. Lee CH, Chung CK, Kim CH. The efficacy of conventional radiofrequency denervation in patients with chronic low back pain originating from the facet joints: a meta-analysis of randomized controlled trials. Spine J. 2017;17(11):1770-1780. doi:10.1016/j.spinee.2017.05.006
8. Staal JB, de Bie R, de Vet HC, Hildebrandt J, Nelemans P. Injection therapy for subacute and chronic low-back pain. Cochrane Database Syst Rev. 2008;2008(3):CD001824. Published 2008 Jul 16. doi:10.1002/14651858.CD001824.pub3
9. Gironda RJ, Clark ME. Cluster analysis of the pain outcomes questionnaire. Pain Med. 2008;9(7):813-823. doi:10.1111/j.1526-4637.2007.00397.x
10. Clark ME, Gironda RJ, Young RW. Development and validation of the Pain Outcomes Questionnaire-VA. J Rehabil Res Dev. 2003;40(5):381-395. doi:10.1682/jrrd.2003.09.0381
11. Watt-Watson J, McGillion M, Lax L, et al. Evaluating an Innovative eLearning Pain Education Interprofessional Resource: A Pre-Post Study. Pain Med. 2019;20(1):37-49. doi:10.1093/pm/pny105
12. Fairbank JC, Couper J, Davies JB, O’Brien JP. The Oswestry low back pain disability questionnaire. Physiotherapy. 1980;66(8):271-273.
13. Ware JE Jr, Sherbourne CD. The MOS 36-item short-form health survey (SF-36). I. Conceptual framework and item selection. Med Care. 1992;30(6):473-483.
14. Jensen MP, Strom SE, Turner JA, Romano JM. Validity of the Sickness Impact Profile Roland scale as a measure of dysfunction in chronic pain patients. Pain. 1992;50(2):157-162. doi:10.1016/0304-3959(92)90156-6
15. Hylands-White N, Duarte RV, Raphael JH. An overview of treatment approaches for chronic pain management. Rheumatol Int. 2017;37(1):29-42. doi:10.1007/s00296-016-3481-8
16. Bujak BK, Regan E, Beattie PF, Harrington S. The effectiveness of interdisciplinary intensive outpatient programs in a population with diverse chronic pain conditions: a systematic review and meta-analysis. Pain Manag. 2019;9(4):417-429. doi:10.2217/pmt-2018-0087
17. Guzmán J, Esmail R, Karjalainen K, Malmivaara A, Irvin E, Bombardier C. Multidisciplinary bio-psycho-social rehabilitation for chronic low back pain. Cochrane Database Syst Rev. 2002;(1):CD000963. doi:10.1002/14651858.CD000963
18. Wilson IR. Management of chronic pain through pain management programmes. Br Med Bull. 2017;124(1):55-64. doi:10.1093/bmb/ldx032
Chronic pain is persistent or recurring pain lasting more than 3 months past normal healing time. Primary care professionals usually refer patients experiencing chronic pain to pain specialists to better identify, treat, and manage the pain. Chronic noncancer-related pain affects more Americans than diabetes mellitus, cardiac disease, and cancer combined.1 Veterans are no exception. The prevalence of severe pain was significantly higher in veterans compared with that of nonveterans who had back pain (21.6 vs 16.7%, respectively), jaw pain (37.5 vs 22.9%, respectively), severe headaches or migraine (26.4 vs 15.9%, respectively), and neck pain (27.7 vs 21.4%, respectively).2 At an individual level, those who experience chronic pain can expect impaired functional capacity, reduced ability to work, sleep disturbance, reduced social interactions, and considerable psychological distress. At a societal level, the cost of treating chronic pain is exorbitant, exceeding $600 billion annually, yet treatment outcomes remain variable at best.3 Greater efforts are needed to improve and standardize patient outcomes.
Interventional pain procedures performed under fluoroscopic or ultrasound guidance by specialist physicians have shown mixed responses in previous studies. Past systematic reviews demonstrate reductions in pain scores after lumbar or caudal epidural steroid injections (ESIs) and radiofrequency ablation of nerves supplying lumbar and thoracic facet joints.4-7 However, one review found insufficient evidence to support injection therapy for chronic low back pain.8 Unfortunately, the majority of the included studies evaluated outcomes using the visual analogue scale (VAS) or other limited factors, such as physical examination findings. Current biopsychosocial conceptualizations of chronic pain are beginning to recognize the complex nature of the experience of pain and highlighting the significance of multimodal management.9 It is vital that our assessment of chronic pain, like our treatment options, be multidimensional and reflect these underpinning principles.
The Pain Outcomes Questionnaire-For Veterans (POQ-VA) was developed within the Veterans Health Administration (VHA) by Clark and colleagues in 2003. It represents a brief but psychometrically sound pain outcomes instrument that assesses all key domains and meets accreditation body standards. The POQ-VA is valid and reliable for evaluating effectiveness of treatment of chronic noncancer pain in veterans in routine clinical practice.10 This review is the first study to use the POQ-VA to assess the impact of interventional pain procedures on veterans with chronic noncancer pain.
The aim of this study was to perform a retrospective review of POQ-VA scores before and after injection-based interventional treatment for chronic pain to determine whether the procedure affected patient outcomes. We hypothesized that POQ-VA scores would improve across multiple domains in the veteran population postprocedure. This study was approved by the Institutional Review Board (IRB-2018-053) at the Providence Veterans Affairs Medical Center (VAMC) in Rhode Island.
Methods
Using the Computerized Patient Record System, all adult veteran patients who had attended at least 2 appointments between April 1, 2009, and April 1, 2019 at the Providence VAMC interventional pain clinic were identified. POQ-VA reports were extracted provided the following criteria were met: (1) the veteran received an injection-based interventional treatment for chronic pain, including trigger point injections, ESIs, nerve blocks, and radiofrequency ablations; (2) the veteran completed POQ-VA both pre- and posttreatment; and (3) posttreatment POQ-VA reports were completed within 6 months of treatment. All patients who did not fit these criteria were excluded from the study.
After deidentification, 112 pre- and posttreatment POQ-VA reports were identified. All subsequent statistical analyses were conducted using Stata SE version 15. Descriptive statistics including mean, range, SD, and percent change were computed for POQ-VA domain—pain, mobility, activities of daily living (ADL), vitality, negative affect, fear, and total raw score—as well as for each POQ-VA question. Given that POQ-VA domain scores were found to be approximately normally distributed without outliers, domain scores were treated as continuous variables, and a paired samples t test was conducted to compare means among POQ-VA domains. Individual question responses were analyzed using nonparametric testing methods to account for the lack of normal distribution in each question, treating the range of 0 to 10 as an ordinal variable. A Wilcoxon matched-pairs signed-rank test was conducted to compare means among individual question responses before and after treatment.
Results
Of 112 included patients, 102 (91%) were male and 10 (9%) were female. The mean age was 62 years (range, 35-90). Diagnosis and procedures varied due to patient symptoms varying from muscle pain, nerve pain, degenerative disc disease, and osteoarthritis.
POQ-VA scores across all domains, including total raw score, showed statistically significant improvement after treatment (Table 1). Directionally, the POQ-VA scores for all 20 questions reflect a positive treatment response and 17 had statistically significant changes (P < .05) (Table 2). The changes in self-perceived energy level, safety, and feelings of tension were not statistically significant. Esteem had the greatest magnitude decrease, falling from 5.2 preprocedure to 3.8 postprocedure (P < .001). Other similarly significant magnitudes of improvement were seen from pre- to postprocedure in questions pertaining to grooming (2.2 to 1.6, P = .003) and the ability to use the bathroom (3.4 to 2.6, P < .001).
Discussion
The most important finding of this study was the ability of the POQ-VA to detect statistically significant positive responses to injection therapy across all domains. The largest improvements were in self-reported pain intensity, pain-related impairment in mobility and ADLs, and self-reported dysphoric effects. The single largest improvement posttreatment was a reduction in scores related to low self-esteem.
Chronic pain can be assessed in a variety of ways ranging from physical examination findings and subjective numerical ratings to extensive patient-reported questionnaires. The International Association for the Study of Pain acknowledges that pain is a complex experience and recommends assessment should be comprehensive.11 Many patient-reported questionnaires are available to clinicians, including some that address pain in a specific body part, such as the Oswestry Low Back Pain Disability Questionnaire, or those that focus on depression or quality-of-life measures, such as the SF-36.12,13
One major benefit of using the POQ-VA is its potential to demonstrate benefits across multiple domains, reflecting the complex nature of chronic pain. The POQ-VA also separates domain or scale scores, allowing clinicians to identify individuals with different patterns of dysfunction across domains.10 This separation also provides insight into which treatment options are best for chronic pain patients with predominant patterns or lower scores in certain domains. The use of a single summary score, as seen in other questionnaires such as the Roland-Morris Activity Scale, may conceal treatment-induced changes in specific outcome domains.14 Additionally, like many other similar instruments, the POQ-VA is easy to understand and use, requires no special training, takes little time to complete, and can be completed in person or over the phone.
As chronic pain has been studied further and its complexity recognized, more instruments have been developed and modified to reflect these new elements. There is no one scale applicable to all populations. A discussion about the strengths and weaknesses of each available assessment tool is outside the scope of this review. However, to date, the POQ-VA is the only instrument that has been validated to detect change following treatment of chronic pain in an exclusively veteran population.10 This validation emphasizes the importance of this study as it supports the use of this outcome measure to monitor treatment of pain in VA facilities.
One of the secondary findings indicated that injection therapy improved veterans’ physical activity levels and self-esteem and lowered pain scores as well as kinesiophobia and anxiety. The role of interventional procedures has been well established in the field of chronic pain, but their efficacy has been less clear. Injections are costly and not without risk, and these factors relegate them to fourth-line treatment options in most situations.15 Several meta-analyses have demonstrated small improvements in pain scores and patient-reported questionnaires after medial branch blocks, and lumbar or caudal ESIs for chronic back pain.5-7 However, an updated Cochrane Review concluded that there was insufficient evidence to support the use of injection therapy in subacute and chronic low back pain.8 The review acknowledged the limited methodologic quality of the trials and could not definitively report that injection therapy did not have benefits for certain subgroups of patients. The ability of researchers to detect benefit from an intervention is intrinsically linked to how outcomes are determined. The most interesting finding of our study was the patient-reported improved self-esteem scores. Many trials included in the systematic reviews discussed used outcome measures that did not have the multidimensional scope to demonstrate such a potential benefit.
Limitations
Our relatively small sample size represents the main shortcoming of this study. Because many posttreatment questionnaires were never collected, unfortunately, much potential data was lost. Most procedures performed were corticosteroid injections for the treatment of low back pain. This represented a combination of lumbar ESI, caudal ESI, medial branch blocks, and sacroiliac joint injections. The limited numbers meant that a further regression analysis of each injection type was not possible. Since few interventions treated pain in other areas of the body, it is difficult to determine whether procedures such as hip joint injections and ilioinguinal nerve blocks provided overall benefit. In the same vein, there is an inability to comment on which injection for chronic low back pain was the most efficacious.
The veteran population, while similar to the general population experiencing chronic pain, is more likely to experience PTSD and other mental health conditions.2 According to medical literature, no randomized controlled trials have been published examining pain interventions exclusively in veterans, so the applicability of these results needs further investigation. This study suggests there are potential benefits for the veteran population, not solely perhaps from receiving injection therapy, but to having access to an interventional pain clinic led by a pain physician within a network of other specialties. While limited by the inherent biases of a retrospective review, this study highlights the potential value in continuing to study this subgroup of patients, especially in the setting of an interdisciplinary approach.
Recent literature suggests interdisciplinary chronic pain management represents the best outcomes for patients’ physical, emotional, and social health, though these kinds of focused outpatient programs have not been studied on a large scale.16 The evolution of pain management in recent years to incorporating a biopsychosocial model has revolutionized how pain is treated and assessed, with multiple studies suggesting the greatest benefits lie in a multipronged approach.16,17 Past studies assessing individual interventions for chronic pain tend not to show strongly positive results, further reinforcing the idea that the answer does not lie in a specific treatment. Many veterans who were included in this study possibly had received or were receiving adjunct therapies such as physical therapy, cognitive behavioral therapy, and acupuncture for pain management, as well as oral and topical medications. Unfortunately, due to the selected methodology, it was not possible for us to gather those data. In turn, we were unable to determine how much these additional factors played a role in changing patient scores, alongside injection therapy. This inability to control variables in this type of research continues to present a challenge to data interpretation, even in the highest quality of research, as acknowledged by Staal and colleagues.8
Future research may be best focused by expanding our knowledge of outpatient interdisciplinary pain management programs. Some interventions may be more relevant for a particular group within a program, and this information can be useful to direct resources.18 Future prospects will require an appropriate multidimensional assessment tool, and the POQ-VA is an example of a valid and reliable option for monitoring progress in pain management in the veteran population.
Conclusions
The POQ-VA is the only instrument to date that has been validated to detect change following treatment of chronic pain in an exclusively veteran population. Our study is the first univariate analysis since the instrument’s validation in 2003. Our descriptive and inferential statistics suggest that the majority of veterans undergoing injection therapy for chronic pain had statistically significant improvements in POQ-VA measures within a 6-month period following treatment. In order to conduct more rigorous, multivariate studies, continued and more widespread use of the POQ-VA instrument is warranted.
1. Johannes CB, Le TK, Zhou X, Johnston JA, Dworkin RH. The prevalence of chronic pain in United States adults: results of an Internet-based survey. J Pain. 2010;11(11):1230-1239. doi:10.1016/j.jpain.2010.07.002
2. Nahin RL. Severe Pain in Veterans: The effect of age and sex, and comparisons with the general population. J Pain. 2017;18(3):247-254. doi:10.1016/j.jpain.2016.10.021
3. Witkin LR, Farrar JT, Ashburn MA. Can assessing chronic pain outcomes data improve outcomes?. Pain Med. 2013;14(6):779-791. doi:10.1111/pme.12075
4. Benyamin RM, Manchikanti L, Parr AT, et al. The effectiveness of lumbar interlaminar epidural injections in managing chronic low back and lower extremity pain. Pain Physician. 2012;15(4):E363-E404.
5. Zhai J, Zhang L, Li M, et al. Epidural injection with or without steroid in managing chronic low-back and lower extremity pain: a meta-analysis of 10 randomized controlled trials. Am J Ther. 2017;24(3):e259-e269. doi:10.1097/MJT.0000000000000265
6. Parr AT, Manchikanti L, Hameed H, et al. Caudal epidural injections in the management of chronic low back pain: a systematic appraisal of the literature. Pain Physician. 2012;15(3):E159-E198.
7. Lee CH, Chung CK, Kim CH. The efficacy of conventional radiofrequency denervation in patients with chronic low back pain originating from the facet joints: a meta-analysis of randomized controlled trials. Spine J. 2017;17(11):1770-1780. doi:10.1016/j.spinee.2017.05.006
8. Staal JB, de Bie R, de Vet HC, Hildebrandt J, Nelemans P. Injection therapy for subacute and chronic low-back pain. Cochrane Database Syst Rev. 2008;2008(3):CD001824. Published 2008 Jul 16. doi:10.1002/14651858.CD001824.pub3
9. Gironda RJ, Clark ME. Cluster analysis of the pain outcomes questionnaire. Pain Med. 2008;9(7):813-823. doi:10.1111/j.1526-4637.2007.00397.x
10. Clark ME, Gironda RJ, Young RW. Development and validation of the Pain Outcomes Questionnaire-VA. J Rehabil Res Dev. 2003;40(5):381-395. doi:10.1682/jrrd.2003.09.0381
11. Watt-Watson J, McGillion M, Lax L, et al. Evaluating an Innovative eLearning Pain Education Interprofessional Resource: A Pre-Post Study. Pain Med. 2019;20(1):37-49. doi:10.1093/pm/pny105
12. Fairbank JC, Couper J, Davies JB, O’Brien JP. The Oswestry low back pain disability questionnaire. Physiotherapy. 1980;66(8):271-273.
13. Ware JE Jr, Sherbourne CD. The MOS 36-item short-form health survey (SF-36). I. Conceptual framework and item selection. Med Care. 1992;30(6):473-483.
14. Jensen MP, Strom SE, Turner JA, Romano JM. Validity of the Sickness Impact Profile Roland scale as a measure of dysfunction in chronic pain patients. Pain. 1992;50(2):157-162. doi:10.1016/0304-3959(92)90156-6
15. Hylands-White N, Duarte RV, Raphael JH. An overview of treatment approaches for chronic pain management. Rheumatol Int. 2017;37(1):29-42. doi:10.1007/s00296-016-3481-8
16. Bujak BK, Regan E, Beattie PF, Harrington S. The effectiveness of interdisciplinary intensive outpatient programs in a population with diverse chronic pain conditions: a systematic review and meta-analysis. Pain Manag. 2019;9(4):417-429. doi:10.2217/pmt-2018-0087
17. Guzmán J, Esmail R, Karjalainen K, Malmivaara A, Irvin E, Bombardier C. Multidisciplinary bio-psycho-social rehabilitation for chronic low back pain. Cochrane Database Syst Rev. 2002;(1):CD000963. doi:10.1002/14651858.CD000963
18. Wilson IR. Management of chronic pain through pain management programmes. Br Med Bull. 2017;124(1):55-64. doi:10.1093/bmb/ldx032
Prevalence and Predictors of Lower Limb Amputation in the Spinal Cord Injury Population
At the James A. Haley Veterans’ Hospital (JAHVH) in Tampa, Florida, the prevalence of amputations among patients at the spinal cord injury (SCI) center seems high. Despite limited data demonstrating altered hemodynamics in the lower extremities (LEs) among the SCI population and increased frequency of peripheral arterial disease (PAD), amputations among patients with SCI have received little attention in research.1-3
In the United States, most amputations are caused by vascular disease related to peripheral arterial disease (PAD) and diabetes mellitus (DM).4 PAD primarily affects the LEs and is caused by atherosclerotic obstruction leading to insufficient blood flow. PAD can present clinically as LE pain, nonhealing ulcers, nonpalpable distal pulses, shiny or cold skin, absence of hair on the LE, or distal extremity pallor when the affected extremity is elevated. However, PAD is often asymptomatic. The diagnosis of PAD is typically made with an ankle-brachial index (ABI) ≤ 0.9.5 The prevalence of PAD is about 4.3% in Americans aged ≥ 40 years, increases with age, and is almost twice as common among Black Americans compared with that of White Americans.6 Many studies in SCI populations have documented an increased prevalence of DM, dyslipidemia, obesity, hypertension (HTN), and cigarette smoking.7-9 PAD shares these risk factors with coronary artery disease (CAD), but relative to CAD, tobacco smoking was a more substantial causative factor for PAD.10 Given the preponderance of associated risk factors in this population, PAD is likely more prevalent among patients with SCI than in the population without disabilities. Beyond these known risk factors, researchers hypothesized that SCI contributes to vascular disease by altering arterial function. However, this is still a topic of debate.11-13 Trauma also is a common cause of amputation, accounting for 45% of amputations in 2005.4 Patients with SCI may experience traumatic amputations simultaneously as their SCI, but they may also be predisposed to traumatic amputations related to osteopenia and impaired sensation.
Since amputation is an invasive surgery, knowing the severity of this issue is important in the SCI population. This study quantifies the prevalence of amputations of the LEs among the patients at our SCI center. It then characterizes these amputations’ etiology, their relationship with medical comorbidities, and certain SCI classifications.
Methods
This retrospective cohort study used the US Department of Veterans Affairs (VA) Computerized Patient Record System. The cohort was defined as all patients who received an annual examination at our SCI center over 4 years from October 1, 2009 to September 30, 2013. Annual examination includes a physical examination, relevant surveillance laboratory tests, and imaging, such as renal ultrasound for those with indwelling urinary catheters. One characteristic of the patient population in the VA system is that diagnoses, such as multiple sclerosis (MS) and amyotrophic lateral sclerosis (ALS), that involve spinal cord lesions causing symptoms are included in the registry, besides those with other traumatic or nontraumatic SCI. October 1 to September 30 was chosen based on the VA fiscal year (FY).
During this period, 1678 patients had an annual examination. Of those, 299 patients had an SCI etiology of ALS or MS, and 41 had nonfocal SCI etiology that could not be assessed using the American Spinal Injury Association Impairment Scale (AIS) and were excluded. Also excluded were 283 patients who did not have an annual examination during the specified time span. Some patients do not have an annual examination every year; for those with multiple annual examinations during that time frame, the most recent was used.
One thousand fifty-five patients were included in the statistical analysis. Date of birth, sex, race, ethnicity, date of death, smoking status, DM diagnosis, HTN diagnosis, use of an antiplatelet, antihypertensive, or lipid-lowering agent, blood pressure, hemoglobin A1c, and lipid panel were collected. The amputation level and etiology were noted. The levels of amputation were classified as toe/partial foot,
Statistical Analysis
Descriptive data were summarized as the median and IQR for continuous variables or the number and percentage for categorical variables. The χ2 test was used to analyze the association between categorical variables and amputation status. A nonparametric Wilcoxon test was used to investigate the distribution of continuous variables across patients with amputation and patients without amputation. Binary logistic regression analysis was used to investigate amputation risk factors. We report goodness of fit using the Hosmer and Lemeshow test and the area under the curve (AUC) for the multivariate model. Statistical significance was prespecified at a 2-sided P < .05. SAS version 9.4 was used for all statistical analyses.
Results
Mean age was approximately 61 years for the 91 patients at the time of the most recent amputation (Table 1). Among those with amputation, 63% were paraplegic and 37% were tetraplegic.
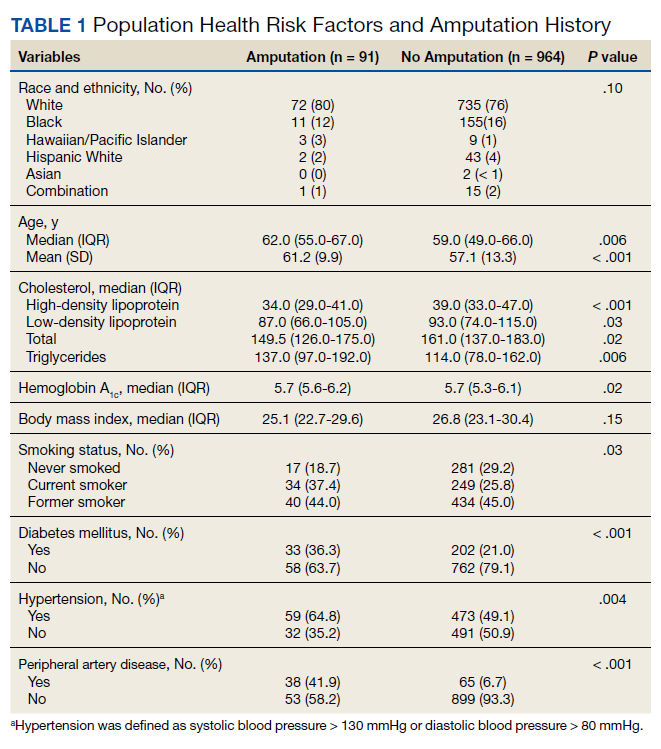
Of 1055 patients with SCI, 91 (8.6%) patients had an amputation. Of those, 70 (76.1%) were from nontraumatic causes (dysvascular), 17 (18.5%) were traumatic, 4 (4.3%) were from other causes (ie, cancer), and only 1 (1.1%) was of unknown cause.
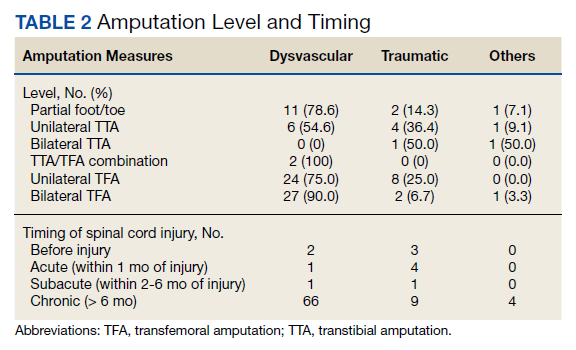
Of the 91 patients with amputation, 64 (69.6%) had at least 1 TFA—33 were unilateral and 31 were bilateral. Two patients had a TFA on one side and a TTA on the other. Partial foot/toe and TTA were less common amputation levels with 14 (15.4%) and 13 (14.3%), respectively. Most amputations (86.8%) occurred over 6 months from the day of initial SCI, and were most commonly dysvascular (Table 2). Traumatic amputation occurred more evenly at various stages, pre-SCI, during acute SCI, subacute SCI, and chronic SCI.
Injury by Impairment Scale Level
Forty-nine (11.5%) of 426 patients with AIS level A SCI had undergone amputation. In order of prevalence, 23 (46.9%) were unilateral TFA, 17 (34.6%) were bilateral TFA, 10.2% were partial foot/toe, 4.1% were unilateral TTA, and 4.1% were a TTA/TFA combination. Both hip and knee disarticulations were classified in the TFA category.
Sixteen (13.0%) of 123 patients with AIS level B SCI had undergone amputation; 5 (31.3%) of those amputations were unilateral TFA, 6 (37.5%) were bilateral TFA, 3 (18.8%) were partial toe or foot, and 1 (6.3%) was for unilateral and bilateral TTA each.
Twelve (8.4%) of 143 patients with AIS level C SCI had undergone amputation: 6 (50.0%) were bilateral TFA; 3 (25.0%) were unilateral TFA; and 3 (25.0%) were unilateral TTA.
Fourteen (3.9%) of 356 patients with AIS level D SCI had undergone amputation. Of those 6 (42.9%) underwent a partial foot/toe amputation; 5 (35.7%) had undergone a unilateral TTA, and 1 (7.1%) underwent amputation in each of the following categories: bilateral TTA, unilateral TFA, and bilateral TFA each.
None of the 7 individuals with AIS E level SCI had undergone amputation.
Health Risk Factors
Of the 91 patients with amputation, the majority (81.3%) were either former or current smokers. Thirty-six percent of those who had undergone amputation had a diagnosis of DM, while only 21% of those who had not undergone amputation had a diagnosis of DM.
At the time of their annual examination 532 patients had a diagnosis of HTN while 523 patients did not. Among patients with amputations, 59 (64.8%) had HTN, while 32 (35.2%) did not. Of the 964 patients without amputation, the prevalence of HTN was 50.9%
.Of 1055 patients with SCI, only 103 (9.8%) had a PAD diagnosis, including 38 (41.9%) patients with amputation. Just 65 (6.7%) patients with SCI without amputation had PAD (P < .001). PAD is highly correlated with dysvascular causes of amputation. Among those with amputations due to dysvascular etiology, 50.0% (35/70) had PAD, but for the 21 amputations due to nondysvascular etiology, only 3 (14.3%) had PAD (P = .004).
Amputation Predictive Model
A multivariate logistic regression analysis was used to build a predictive model for amputation among patients with SCI while controlling for covariates. In our multivariate analysis, high-density lipoprotein cholesterol (HDL-C), tetraplegia, and PAD were predictive factors for amputation. Patients with SCI who had PAD were 8.6 times more likely to undergo amputation compared to those without PAD (odds ratio [OR], 9.8; P < .001; 95% CI, 5.9-16.3). Every unit of HDL-C decreased the odds of amputation by 5% (OR, 0.95; P < .001; 95% CI, 0.93-0.98).
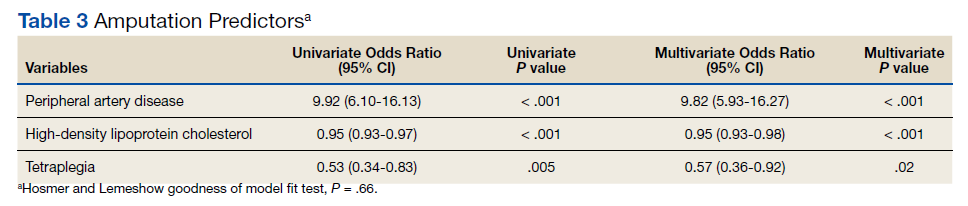
Having tetraplegia decreased the odds of amputation by 43%, compared with those with paraplegia (OR, 0.57; P = .02; 95% CI, 0.36 - 0.92). AUC was 0.76, and the Hosmer and Lemeshow goodness of model fit test P value was .66, indicating the good predictive power of the model (Table 3).
Discussion
In the US, 54 to 82% of amputations occur secondary to chronic vascular disease. Our study showed similar results: 76.1% of amputations were dysvascular.4,16 Even in a 2019 systematic review, the most recent prevalence of amputation data was in 2005.17 The study concluded that among the general population in the US, prevalence of amputation was estimated to be 1 in 190 people, or about 0.5% of the population.4 We found that the prevalence of amputation among the SCI population in this study was 8.7%. This result is consistent with our initial hypothesis that the prevalence of amputation would be higher among the people with SCI. Using a different case acquisition method, Svircev and colleagues reported that about a 4% prevalence of LE amputation among veterans with chronic SCI (over 1 year from the initial SCI), with an emphasis that it was not a study of amputation incidence.18 In comparison, we calculated a 7.5% prevalence of amputation during the chronic SCI stage, which showed institutional variation and a consistent observation that LE amputations occurred more frequently in the SCI population.
Our results showed a positive correlation between the completeness of injury and the prevalence of amputation. Those individuals with a motor complete injury, AIS A (40.3%) or AIS B (11.7%) account for approximately half of all amputations in our population with SCI. Another finding was that proximal amputations were more frequent with more neurologically complete SCIs. Of those with an injury classified as AIS A and an amputation, 42 of 49 subjects underwent at least 1 TFA (23 were unilateral TFA, 17 were bilateral TFA, 2 were a TFA/TTA combination). Of those with an AIS B injury and an amputation, 11 of 16 subjects (68.8%) had at least 1 TFA (5 unilateral TFA and 6 bilateral TFA). Among patients with AIS C injury and amputation, 75% had a TFA. At the same time, only 13.3% of all amputations were at the transfemoral level in those with an AIS D injury. None of the participants with an injury classified as AIS E had undergone an amputation.
Given a paucity of literature available regarding amputation levels in patients with SCI, a discussion with a JAHVH vascular surgeon helped explain the rationale behind different levels of amputation among the SCI population—TFA was performed in 64 of 91 cases (70%). Institutionally, TFAs were performed more often because this level had the greatest chance of healing, avoiding infection, and eliminating knee contracture issues, which may affect quality of life. This was believed to be the best option in those individuals who were already nonambulatory. Although this study did not collect data on ambulatory status, this helps explain why those with an SCI classification of AIS D were more likely to have had a more distal amputation to preserve current or a future chance of ambulation, provided that whether the limb is salvageable is the priority of surgical decision.
The prevalence of PAD among veterans is generally higher than it is in the nonveteran population. Studies show that the prevalence of PAD risk factors in the veteran population exceeds national estimates. Nearly two-thirds of veterans have HTN, 1 in 4 has DM, and 1 in 4 is a current smoker, placing veterans at a significantly increased risk of PADand, therefore, amputation.19,20 These rates were about the same or greater in our SCI population: 50.4% had HTN, 22.3% had a diagnosis of DM, and 71.8% smoked previously or currently smoked. In 3 large studies, HTN was second only to current smoking as the most attributable risk factor for PAD.21
Ongoing research by JAHVH vascular surgeons suggests that patients with SCI were younger and less likely to have HTN, PAD, and/or CAD compared with patients undergoing TFA without SCI. Additionally, patients with SCI had better postoperative outcomes in terms of 30-day mortality, 3-year mortality, and had no increased rate of surgical revisions, strokes, or wound-healing complications. This supports the previous thought that the AIS classification plays a large role in determining amputation levels.
One result in this study is that paraplegia is one of the predictors of future amputation compared with tetraplegia. To our knowledge, there is no literature that supports or explains this finding. A hypothetical factor that could explain this observation is the difference in duration of survival—those with paraplegia who live longer are more likely to experience end-stage consequence of vascular diseases. Another proposed factor is that those with paraplegia are generally more active and have a higher likelihood of sustaining a traumatic cause of amputation, even though this etiology of amputation is minor.An unexpected finding in our study was that of 1055 patients with SCI, only 9.8% had a PAD diagnosis. In contrast, 41.3% of those with amputation had a PAD diagnosis. JAHVH does not screen for PAD, so this likely represents only the symptomatic cases.
Diagnosing PAD in patients with SCI is challenging as they may lack classic clinical symptoms, such as pain with ambulation and impotence, secondary to their neurologic injury. Instead, the health care practitioner must rely on physical signs, such as necrosis.22 Of note given the undetermined utility of diagnosing PAD in patients with SCI, early endovascular interventions are not typically performed. We could not find literature regarding when intervention for PAD in patients with SCI should be performed or how frequently those with SCI should be assessed for PAD. One study showed impaired ambulation prior to limb salvage procedures was associated with poor functional outcomes in terms of survival, independent living, and ambulatory status.23 This could help explain why endovascular procedures are done relatively infrequently in this population. With the lack of studies regarding PAD in the SCI population, outcomes analysis of these patients, including the rate of initial interventions, re-intervention for re-amputation (possibly at a higher level), or vascular inflow procedures, are needed.
It would be beneficial for future studies to examine whether inflammatory markers, such as C-reactive protein (CRP), were more elevated in patients with SCI who underwent amputation compared with those who did not. Chronic underlying inflammation has been shown to be a risk factor for PAD. One study showed that, independently of other risk factors, elevated CRP levels roughly tripled the risk of developing PAD.24 This study suggested that there is an increased risk of dysvascular amputation among the SCI population at this center. This information is significant because it can help influence JAHVH clinical practice for veterans with SCI and vascular diseases.
Limitations
As a single-center study carried out at an SCI specialized center of a VA hospital, this study's finding may not be generalizable. Incomplete documentation in the health record may have led to underreporting of amputations and other information. The practice of the vascular surgeons at JAHVH may not represent the approach of vascular surgeons nationwide. Another limitation of this study is that the duration of SCI was not considered when looking at health risk factors associated with amputation in the SCI population (ie, total cholesterol, hemoglobin A1c, etc). Finally, the medication regimens were not reviewed to determine whether they meet the standard of care in relation to eventual diagnosis of PAD.
A prospective study comparing the prevalence of amputation between veterans with SCI vs veterans without SCI could better investigate the difference in amputation risks. This study only compared our veterans with SCI in reference to the general population. Veterans are more likely to be smokers than the general population, contributing to PAD.17 In addition, data regarding patients’ functional status in regard to transferring and ambulation before and after amputation were not collected, which would have contributed to an understanding of how amputation affects functional status in this population.
Conclusions
There is an increased prevalence of amputation among veterans with SCI compared with that of the nationwide population and a plurality were TFAs. This data suggest that those with a motor complete SCI are more likely to undergo a more proximal amputation. This is likely secondary to a lower likelihood of ambulation with more neurologically complete injuries along with a greater chance of healing with a more proximal amputation. It is challenging to correlate any variables specific to SCI (ie, immobility, time since injury, level of injury, etc) with an increased risk of amputation as the known comorbidities associated with PAD are highly prevalent in this population. Having PAD, low HDL-C (< 40 mg/dL), and paraplegia instead of tetraplegia were independent predictors of amputation.
Health care professionals need to be aware of the high prevalence of amputation in the SCI population. Comorbidities should be aggressively treated as PAD, in addition to being associated with amputation, has been linked with increased mortality.25 Studies using a larger population and multiple centers are needed to confirm such a concerning finding.
Acknowledgments
This material is based on work supported (or supported in part) with resources and the use of facilities at the James A. Haley Veterans’ Hospital (JAHVH). Authors gratefully acknowledge the inputs and support of Dr. James Brooks, MD, RPVI, assistant professor of surgery, University of South Florida (USF), and attending surgeon, vascular surgery service, medical director of the peripheral vascular laboratory, JAHVH; and Dr. Kevin White, MD, assistant professor, USF, and Chief of Spinal Cord Injury Center, JAHVH.
1. Hopman MT, Nommensen E, van Asten WN, Oeseburg B, Binkhorst RA. Properties of the venous vascular system in the lower extremities of individuals with paraplegia. Paraplegia. 1994;32(12):810-816. doi:10.1038/sc.1994.128
2. Theisen D, Vanlandewijck Y, Sturbois X, Francaux M. Central and peripheral haemodynamics in individuals with paraplegia during light and heavy exercise. J Rehabil Med. 2001;33(1):16-20. doi:10.1080/165019701300006489
3. Bell JW, Chen D, Bahls M, Newcomer SC. Evidence for greater burden of peripheral arterial disease in lower extremity arteries of spinal cord-injured individuals. Am J Physiol Heart Circ Physiol. 2011;301(3):H766-H772. doi:10.1152/ajpheart.00507.2011
4. Ziegler-Graham K, MacKenzie EJ, Ephraim PL, Travison TG, Brookmeyer R. Estimating the prevalence of limb loss in the United States: 2005 to 2050. Arch Phys Med Rehabil. 2008;89(3):422-429. doi:10.1016/j.apmr.2007.11.005
5. Hennion DR, Siano KA. Diagnosis and treatment of peripheral arterial disease. Am Fam Physician. 2013;88(5):306-310.
6. Selvin E, Erlinger TP. Prevalence of and risk factors for peripheral arterial disease in the United States: results from the National Health and Nutrition Examination Survey, 1999-2000. Circulation. 2004;110(6):738-743. doi:10.1161/01.CIR.0000137913.26087.F0
7. Bauman WA, Spungen AM. Disorders of carbohydrate and lipid metabolism in veterans with paraplegia or quadriplegia: a model of premature aging. Metabolism. 1994;43(6):749-756. doi:10.1016/0026-0495(94)90126-0
8. Jörgensen S, Hill M, Lexell J. Cardiovascular risk factors among older adults with long-term spinal cord injury. PM R. 2019;11(1):8-16. doi:10.1016/j.pmrj.2018.06.008
9. Wu JC, Chen YC, Liu L, et al. Increased risk of stroke after spinal cord injury: a nationwide 4-year follow-up cohort study. Neurology. 2012;78(14):1051-1057. doi:10.1212/WNL.0b013e31824e8eaa
10. Price JF, Mowbray PI, Lee AJ, Rumley A, Lowe GD, Fowkes FG. Relationship between smoking and cardiovascular risk factors in the development of peripheral arterial disease and coronary artery disease: Edinburgh Artery Study. Eur Heart J. 1999;20(5):344-353. doi:10.1053/euhj.1998.1194
11. Bell JW, Chen D, Bahls M, Newcomer SC. Altered resting hemodynamics in lower-extremity arteries of individuals with spinal cord injury. J Spinal Cord Med. 2013;36(2):104-111. doi:10.1179/2045772312Y.0000000052
12. Miyatani M, Masani K, Oh PI, Miyachi M, Popovic MR, Craven BC. Pulse wave velocity for assessment of arterial stiffness among people with spinal cord injury: a pilot study. J Spinal Cord Med. 2009;32(1):72-78. doi:10.1080/10790268.2009.11760755
13. Oliver JJ, Webb DJ. Noninvasive assessment of arterial stiffness and risk of atherosclerotic events. Arterioscler Thromb Vasc Biol. 2003;23(4):554-566. doi:10.1161/01.ATV.0000060460.52916.D6
14. Ephraim PL, Dillifngham TR, Sector M, Pezzin LE, MacKenzie EJ. Epidemiology of limb loss and congenital limb deficiency: a review of the literature. Arch Phys Med Rehabil. 2003;84(5): 747-761. doi:10.1016/s0003-9993(02)04932-8.15. Levin ME. Preventing amputation in the patient with diabetes. Diabetes Care. 1995;18(10)1383-1394. doi:10.2337/diacare.18.10.1383
16. Dillingham TR, Pezzin LE, MacKenzie EJ. Limb amputation and limb deficiency: epidemiology and recent trends in the United States. South Med J. 2002;95(8):875-883. doi:10.1097/00007611- 200208000-00018
17. Lo J, Chan L, Flynn S. A systematic review of the incidence, prevalence, costs, and activity and work limitations of amputation, osteoarthritis, rheumatoid arthritis, back pain, multiple sclerosis, spinal cord injury, stroke, and traumatic brain injury in the United States: a 2019 update. Arch Phys Med Rehabil. 2021;102:115-131. doi:10.1016/j.apmr.2020.04.001
18. Svircev, J, Tan D, Garrison A, Pennelly, B, Burns SP. Limb loss in individuals with chronic spinal cord injury. J Spinal Cord Med. doi:10.1080/10790268.2020.1800964
19. Brown DW. Smoking prevalence among US veterans. J Gen Intern Med. 2010;25(2):147-149. doi:10.1007/s11606-009-1160-0
20. Selim AJ, Berlowitz DR, Fincke G, et al. The health status of elderly veteran enrollees in the Veterans Health Administration. J Am Geriatr Soc. 2004;52(8):1271-1276. doi:10.1111/j.1532-5415.2004.52355.x
21. Criqui MH, Aboyans V. Epidemiology of peripheral artery disease. Circ Res. 2015;116(9):1509-1526. doi:10.1161/CIRCRESAHA.116.303849
22. Yokoo KM, Kronon M, Lewis VL Jr, McCarthy WJ, McMillan WD, Meyer PR Jr. Peripheral vascular disease in spinal cord injury patients: a difficult diagnosis. Ann Plast Surg. 1996;37(5):495-499. doi:10.1097/00000637-199611000-00007
23. Taylor SM, Kalbaugh CA, Blackhurst DW, Cass, et al. Determinants of functional outcome after revascularization for critical limb ischemia: an analysis of 1000 consecutive vascular interventions. J Vasc Surg. 2006;44(4):747–756. doi:10.1016/j.jvs.2006.06.015
24. Abdellaoui A, Al-Khaffaf H. C-reactive protein (CRP) as a marker in peripheral vascular disease. Eur J Vasc Endovasc Surg. 2007;34(1):18-22. doi:10.1016/j.ejvs.2006.10.040
25. Caro J, Migliaccio-Walle K, Ishak KJ, Proskorovsky I. The morbidity and mortality following a diagnosis of peripheral arterial disease: long-term follow-up of a large database. BMC Cardiovasc Disord. 2005;5:14. doi:10.1186/1471-2261-5-14
At the James A. Haley Veterans’ Hospital (JAHVH) in Tampa, Florida, the prevalence of amputations among patients at the spinal cord injury (SCI) center seems high. Despite limited data demonstrating altered hemodynamics in the lower extremities (LEs) among the SCI population and increased frequency of peripheral arterial disease (PAD), amputations among patients with SCI have received little attention in research.1-3
In the United States, most amputations are caused by vascular disease related to peripheral arterial disease (PAD) and diabetes mellitus (DM).4 PAD primarily affects the LEs and is caused by atherosclerotic obstruction leading to insufficient blood flow. PAD can present clinically as LE pain, nonhealing ulcers, nonpalpable distal pulses, shiny or cold skin, absence of hair on the LE, or distal extremity pallor when the affected extremity is elevated. However, PAD is often asymptomatic. The diagnosis of PAD is typically made with an ankle-brachial index (ABI) ≤ 0.9.5 The prevalence of PAD is about 4.3% in Americans aged ≥ 40 years, increases with age, and is almost twice as common among Black Americans compared with that of White Americans.6 Many studies in SCI populations have documented an increased prevalence of DM, dyslipidemia, obesity, hypertension (HTN), and cigarette smoking.7-9 PAD shares these risk factors with coronary artery disease (CAD), but relative to CAD, tobacco smoking was a more substantial causative factor for PAD.10 Given the preponderance of associated risk factors in this population, PAD is likely more prevalent among patients with SCI than in the population without disabilities. Beyond these known risk factors, researchers hypothesized that SCI contributes to vascular disease by altering arterial function. However, this is still a topic of debate.11-13 Trauma also is a common cause of amputation, accounting for 45% of amputations in 2005.4 Patients with SCI may experience traumatic amputations simultaneously as their SCI, but they may also be predisposed to traumatic amputations related to osteopenia and impaired sensation.
Since amputation is an invasive surgery, knowing the severity of this issue is important in the SCI population. This study quantifies the prevalence of amputations of the LEs among the patients at our SCI center. It then characterizes these amputations’ etiology, their relationship with medical comorbidities, and certain SCI classifications.
Methods
This retrospective cohort study used the US Department of Veterans Affairs (VA) Computerized Patient Record System. The cohort was defined as all patients who received an annual examination at our SCI center over 4 years from October 1, 2009 to September 30, 2013. Annual examination includes a physical examination, relevant surveillance laboratory tests, and imaging, such as renal ultrasound for those with indwelling urinary catheters. One characteristic of the patient population in the VA system is that diagnoses, such as multiple sclerosis (MS) and amyotrophic lateral sclerosis (ALS), that involve spinal cord lesions causing symptoms are included in the registry, besides those with other traumatic or nontraumatic SCI. October 1 to September 30 was chosen based on the VA fiscal year (FY).
During this period, 1678 patients had an annual examination. Of those, 299 patients had an SCI etiology of ALS or MS, and 41 had nonfocal SCI etiology that could not be assessed using the American Spinal Injury Association Impairment Scale (AIS) and were excluded. Also excluded were 283 patients who did not have an annual examination during the specified time span. Some patients do not have an annual examination every year; for those with multiple annual examinations during that time frame, the most recent was used.
One thousand fifty-five patients were included in the statistical analysis. Date of birth, sex, race, ethnicity, date of death, smoking status, DM diagnosis, HTN diagnosis, use of an antiplatelet, antihypertensive, or lipid-lowering agent, blood pressure, hemoglobin A1c, and lipid panel were collected. The amputation level and etiology were noted. The levels of amputation were classified as toe/partial foot,
Statistical Analysis
Descriptive data were summarized as the median and IQR for continuous variables or the number and percentage for categorical variables. The χ2 test was used to analyze the association between categorical variables and amputation status. A nonparametric Wilcoxon test was used to investigate the distribution of continuous variables across patients with amputation and patients without amputation. Binary logistic regression analysis was used to investigate amputation risk factors. We report goodness of fit using the Hosmer and Lemeshow test and the area under the curve (AUC) for the multivariate model. Statistical significance was prespecified at a 2-sided P < .05. SAS version 9.4 was used for all statistical analyses.
Results
Mean age was approximately 61 years for the 91 patients at the time of the most recent amputation (Table 1). Among those with amputation, 63% were paraplegic and 37% were tetraplegic.
Of 1055 patients with SCI, 91 (8.6%) patients had an amputation. Of those, 70 (76.1%) were from nontraumatic causes (dysvascular), 17 (18.5%) were traumatic, 4 (4.3%) were from other causes (ie, cancer), and only 1 (1.1%) was of unknown cause.
Of the 91 patients with amputation, 64 (69.6%) had at least 1 TFA—33 were unilateral and 31 were bilateral. Two patients had a TFA on one side and a TTA on the other. Partial foot/toe and TTA were less common amputation levels with 14 (15.4%) and 13 (14.3%), respectively. Most amputations (86.8%) occurred over 6 months from the day of initial SCI, and were most commonly dysvascular (Table 2). Traumatic amputation occurred more evenly at various stages, pre-SCI, during acute SCI, subacute SCI, and chronic SCI.
Injury by Impairment Scale Level
Forty-nine (11.5%) of 426 patients with AIS level A SCI had undergone amputation. In order of prevalence, 23 (46.9%) were unilateral TFA, 17 (34.6%) were bilateral TFA, 10.2% were partial foot/toe, 4.1% were unilateral TTA, and 4.1% were a TTA/TFA combination. Both hip and knee disarticulations were classified in the TFA category.
Sixteen (13.0%) of 123 patients with AIS level B SCI had undergone amputation; 5 (31.3%) of those amputations were unilateral TFA, 6 (37.5%) were bilateral TFA, 3 (18.8%) were partial toe or foot, and 1 (6.3%) was for unilateral and bilateral TTA each.
Twelve (8.4%) of 143 patients with AIS level C SCI had undergone amputation: 6 (50.0%) were bilateral TFA; 3 (25.0%) were unilateral TFA; and 3 (25.0%) were unilateral TTA.
Fourteen (3.9%) of 356 patients with AIS level D SCI had undergone amputation. Of those 6 (42.9%) underwent a partial foot/toe amputation; 5 (35.7%) had undergone a unilateral TTA, and 1 (7.1%) underwent amputation in each of the following categories: bilateral TTA, unilateral TFA, and bilateral TFA each.
None of the 7 individuals with AIS E level SCI had undergone amputation.
Health Risk Factors
Of the 91 patients with amputation, the majority (81.3%) were either former or current smokers. Thirty-six percent of those who had undergone amputation had a diagnosis of DM, while only 21% of those who had not undergone amputation had a diagnosis of DM.
At the time of their annual examination 532 patients had a diagnosis of HTN while 523 patients did not. Among patients with amputations, 59 (64.8%) had HTN, while 32 (35.2%) did not. Of the 964 patients without amputation, the prevalence of HTN was 50.9%
.Of 1055 patients with SCI, only 103 (9.8%) had a PAD diagnosis, including 38 (41.9%) patients with amputation. Just 65 (6.7%) patients with SCI without amputation had PAD (P < .001). PAD is highly correlated with dysvascular causes of amputation. Among those with amputations due to dysvascular etiology, 50.0% (35/70) had PAD, but for the 21 amputations due to nondysvascular etiology, only 3 (14.3%) had PAD (P = .004).
Amputation Predictive Model
A multivariate logistic regression analysis was used to build a predictive model for amputation among patients with SCI while controlling for covariates. In our multivariate analysis, high-density lipoprotein cholesterol (HDL-C), tetraplegia, and PAD were predictive factors for amputation. Patients with SCI who had PAD were 8.6 times more likely to undergo amputation compared to those without PAD (odds ratio [OR], 9.8; P < .001; 95% CI, 5.9-16.3). Every unit of HDL-C decreased the odds of amputation by 5% (OR, 0.95; P < .001; 95% CI, 0.93-0.98).
Having tetraplegia decreased the odds of amputation by 43%, compared with those with paraplegia (OR, 0.57; P = .02; 95% CI, 0.36 - 0.92). AUC was 0.76, and the Hosmer and Lemeshow goodness of model fit test P value was .66, indicating the good predictive power of the model (Table 3).
Discussion
In the US, 54 to 82% of amputations occur secondary to chronic vascular disease. Our study showed similar results: 76.1% of amputations were dysvascular.4,16 Even in a 2019 systematic review, the most recent prevalence of amputation data was in 2005.17 The study concluded that among the general population in the US, prevalence of amputation was estimated to be 1 in 190 people, or about 0.5% of the population.4 We found that the prevalence of amputation among the SCI population in this study was 8.7%. This result is consistent with our initial hypothesis that the prevalence of amputation would be higher among the people with SCI. Using a different case acquisition method, Svircev and colleagues reported that about a 4% prevalence of LE amputation among veterans with chronic SCI (over 1 year from the initial SCI), with an emphasis that it was not a study of amputation incidence.18 In comparison, we calculated a 7.5% prevalence of amputation during the chronic SCI stage, which showed institutional variation and a consistent observation that LE amputations occurred more frequently in the SCI population.
Our results showed a positive correlation between the completeness of injury and the prevalence of amputation. Those individuals with a motor complete injury, AIS A (40.3%) or AIS B (11.7%) account for approximately half of all amputations in our population with SCI. Another finding was that proximal amputations were more frequent with more neurologically complete SCIs. Of those with an injury classified as AIS A and an amputation, 42 of 49 subjects underwent at least 1 TFA (23 were unilateral TFA, 17 were bilateral TFA, 2 were a TFA/TTA combination). Of those with an AIS B injury and an amputation, 11 of 16 subjects (68.8%) had at least 1 TFA (5 unilateral TFA and 6 bilateral TFA). Among patients with AIS C injury and amputation, 75% had a TFA. At the same time, only 13.3% of all amputations were at the transfemoral level in those with an AIS D injury. None of the participants with an injury classified as AIS E had undergone an amputation.
Given a paucity of literature available regarding amputation levels in patients with SCI, a discussion with a JAHVH vascular surgeon helped explain the rationale behind different levels of amputation among the SCI population—TFA was performed in 64 of 91 cases (70%). Institutionally, TFAs were performed more often because this level had the greatest chance of healing, avoiding infection, and eliminating knee contracture issues, which may affect quality of life. This was believed to be the best option in those individuals who were already nonambulatory. Although this study did not collect data on ambulatory status, this helps explain why those with an SCI classification of AIS D were more likely to have had a more distal amputation to preserve current or a future chance of ambulation, provided that whether the limb is salvageable is the priority of surgical decision.
The prevalence of PAD among veterans is generally higher than it is in the nonveteran population. Studies show that the prevalence of PAD risk factors in the veteran population exceeds national estimates. Nearly two-thirds of veterans have HTN, 1 in 4 has DM, and 1 in 4 is a current smoker, placing veterans at a significantly increased risk of PADand, therefore, amputation.19,20 These rates were about the same or greater in our SCI population: 50.4% had HTN, 22.3% had a diagnosis of DM, and 71.8% smoked previously or currently smoked. In 3 large studies, HTN was second only to current smoking as the most attributable risk factor for PAD.21
Ongoing research by JAHVH vascular surgeons suggests that patients with SCI were younger and less likely to have HTN, PAD, and/or CAD compared with patients undergoing TFA without SCI. Additionally, patients with SCI had better postoperative outcomes in terms of 30-day mortality, 3-year mortality, and had no increased rate of surgical revisions, strokes, or wound-healing complications. This supports the previous thought that the AIS classification plays a large role in determining amputation levels.
One result in this study is that paraplegia is one of the predictors of future amputation compared with tetraplegia. To our knowledge, there is no literature that supports or explains this finding. A hypothetical factor that could explain this observation is the difference in duration of survival—those with paraplegia who live longer are more likely to experience end-stage consequence of vascular diseases. Another proposed factor is that those with paraplegia are generally more active and have a higher likelihood of sustaining a traumatic cause of amputation, even though this etiology of amputation is minor.An unexpected finding in our study was that of 1055 patients with SCI, only 9.8% had a PAD diagnosis. In contrast, 41.3% of those with amputation had a PAD diagnosis. JAHVH does not screen for PAD, so this likely represents only the symptomatic cases.
Diagnosing PAD in patients with SCI is challenging as they may lack classic clinical symptoms, such as pain with ambulation and impotence, secondary to their neurologic injury. Instead, the health care practitioner must rely on physical signs, such as necrosis.22 Of note given the undetermined utility of diagnosing PAD in patients with SCI, early endovascular interventions are not typically performed. We could not find literature regarding when intervention for PAD in patients with SCI should be performed or how frequently those with SCI should be assessed for PAD. One study showed impaired ambulation prior to limb salvage procedures was associated with poor functional outcomes in terms of survival, independent living, and ambulatory status.23 This could help explain why endovascular procedures are done relatively infrequently in this population. With the lack of studies regarding PAD in the SCI population, outcomes analysis of these patients, including the rate of initial interventions, re-intervention for re-amputation (possibly at a higher level), or vascular inflow procedures, are needed.
It would be beneficial for future studies to examine whether inflammatory markers, such as C-reactive protein (CRP), were more elevated in patients with SCI who underwent amputation compared with those who did not. Chronic underlying inflammation has been shown to be a risk factor for PAD. One study showed that, independently of other risk factors, elevated CRP levels roughly tripled the risk of developing PAD.24 This study suggested that there is an increased risk of dysvascular amputation among the SCI population at this center. This information is significant because it can help influence JAHVH clinical practice for veterans with SCI and vascular diseases.
Limitations
As a single-center study carried out at an SCI specialized center of a VA hospital, this study's finding may not be generalizable. Incomplete documentation in the health record may have led to underreporting of amputations and other information. The practice of the vascular surgeons at JAHVH may not represent the approach of vascular surgeons nationwide. Another limitation of this study is that the duration of SCI was not considered when looking at health risk factors associated with amputation in the SCI population (ie, total cholesterol, hemoglobin A1c, etc). Finally, the medication regimens were not reviewed to determine whether they meet the standard of care in relation to eventual diagnosis of PAD.
A prospective study comparing the prevalence of amputation between veterans with SCI vs veterans without SCI could better investigate the difference in amputation risks. This study only compared our veterans with SCI in reference to the general population. Veterans are more likely to be smokers than the general population, contributing to PAD.17 In addition, data regarding patients’ functional status in regard to transferring and ambulation before and after amputation were not collected, which would have contributed to an understanding of how amputation affects functional status in this population.
Conclusions
There is an increased prevalence of amputation among veterans with SCI compared with that of the nationwide population and a plurality were TFAs. This data suggest that those with a motor complete SCI are more likely to undergo a more proximal amputation. This is likely secondary to a lower likelihood of ambulation with more neurologically complete injuries along with a greater chance of healing with a more proximal amputation. It is challenging to correlate any variables specific to SCI (ie, immobility, time since injury, level of injury, etc) with an increased risk of amputation as the known comorbidities associated with PAD are highly prevalent in this population. Having PAD, low HDL-C (< 40 mg/dL), and paraplegia instead of tetraplegia were independent predictors of amputation.
Health care professionals need to be aware of the high prevalence of amputation in the SCI population. Comorbidities should be aggressively treated as PAD, in addition to being associated with amputation, has been linked with increased mortality.25 Studies using a larger population and multiple centers are needed to confirm such a concerning finding.
Acknowledgments
This material is based on work supported (or supported in part) with resources and the use of facilities at the James A. Haley Veterans’ Hospital (JAHVH). Authors gratefully acknowledge the inputs and support of Dr. James Brooks, MD, RPVI, assistant professor of surgery, University of South Florida (USF), and attending surgeon, vascular surgery service, medical director of the peripheral vascular laboratory, JAHVH; and Dr. Kevin White, MD, assistant professor, USF, and Chief of Spinal Cord Injury Center, JAHVH.
1. Hopman MT, Nommensen E, van Asten WN, Oeseburg B, Binkhorst RA. Properties of the venous vascular system in the lower extremities of individuals with paraplegia. Paraplegia. 1994;32(12):810-816. doi:10.1038/sc.1994.128
2. Theisen D, Vanlandewijck Y, Sturbois X, Francaux M. Central and peripheral haemodynamics in individuals with paraplegia during light and heavy exercise. J Rehabil Med. 2001;33(1):16-20. doi:10.1080/165019701300006489
3. Bell JW, Chen D, Bahls M, Newcomer SC. Evidence for greater burden of peripheral arterial disease in lower extremity arteries of spinal cord-injured individuals. Am J Physiol Heart Circ Physiol. 2011;301(3):H766-H772. doi:10.1152/ajpheart.00507.2011
4. Ziegler-Graham K, MacKenzie EJ, Ephraim PL, Travison TG, Brookmeyer R. Estimating the prevalence of limb loss in the United States: 2005 to 2050. Arch Phys Med Rehabil. 2008;89(3):422-429. doi:10.1016/j.apmr.2007.11.005
5. Hennion DR, Siano KA. Diagnosis and treatment of peripheral arterial disease. Am Fam Physician. 2013;88(5):306-310.
6. Selvin E, Erlinger TP. Prevalence of and risk factors for peripheral arterial disease in the United States: results from the National Health and Nutrition Examination Survey, 1999-2000. Circulation. 2004;110(6):738-743. doi:10.1161/01.CIR.0000137913.26087.F0
7. Bauman WA, Spungen AM. Disorders of carbohydrate and lipid metabolism in veterans with paraplegia or quadriplegia: a model of premature aging. Metabolism. 1994;43(6):749-756. doi:10.1016/0026-0495(94)90126-0
8. Jörgensen S, Hill M, Lexell J. Cardiovascular risk factors among older adults with long-term spinal cord injury. PM R. 2019;11(1):8-16. doi:10.1016/j.pmrj.2018.06.008
9. Wu JC, Chen YC, Liu L, et al. Increased risk of stroke after spinal cord injury: a nationwide 4-year follow-up cohort study. Neurology. 2012;78(14):1051-1057. doi:10.1212/WNL.0b013e31824e8eaa
10. Price JF, Mowbray PI, Lee AJ, Rumley A, Lowe GD, Fowkes FG. Relationship between smoking and cardiovascular risk factors in the development of peripheral arterial disease and coronary artery disease: Edinburgh Artery Study. Eur Heart J. 1999;20(5):344-353. doi:10.1053/euhj.1998.1194
11. Bell JW, Chen D, Bahls M, Newcomer SC. Altered resting hemodynamics in lower-extremity arteries of individuals with spinal cord injury. J Spinal Cord Med. 2013;36(2):104-111. doi:10.1179/2045772312Y.0000000052
12. Miyatani M, Masani K, Oh PI, Miyachi M, Popovic MR, Craven BC. Pulse wave velocity for assessment of arterial stiffness among people with spinal cord injury: a pilot study. J Spinal Cord Med. 2009;32(1):72-78. doi:10.1080/10790268.2009.11760755
13. Oliver JJ, Webb DJ. Noninvasive assessment of arterial stiffness and risk of atherosclerotic events. Arterioscler Thromb Vasc Biol. 2003;23(4):554-566. doi:10.1161/01.ATV.0000060460.52916.D6
14. Ephraim PL, Dillifngham TR, Sector M, Pezzin LE, MacKenzie EJ. Epidemiology of limb loss and congenital limb deficiency: a review of the literature. Arch Phys Med Rehabil. 2003;84(5): 747-761. doi:10.1016/s0003-9993(02)04932-8.15. Levin ME. Preventing amputation in the patient with diabetes. Diabetes Care. 1995;18(10)1383-1394. doi:10.2337/diacare.18.10.1383
16. Dillingham TR, Pezzin LE, MacKenzie EJ. Limb amputation and limb deficiency: epidemiology and recent trends in the United States. South Med J. 2002;95(8):875-883. doi:10.1097/00007611- 200208000-00018
17. Lo J, Chan L, Flynn S. A systematic review of the incidence, prevalence, costs, and activity and work limitations of amputation, osteoarthritis, rheumatoid arthritis, back pain, multiple sclerosis, spinal cord injury, stroke, and traumatic brain injury in the United States: a 2019 update. Arch Phys Med Rehabil. 2021;102:115-131. doi:10.1016/j.apmr.2020.04.001
18. Svircev, J, Tan D, Garrison A, Pennelly, B, Burns SP. Limb loss in individuals with chronic spinal cord injury. J Spinal Cord Med. doi:10.1080/10790268.2020.1800964
19. Brown DW. Smoking prevalence among US veterans. J Gen Intern Med. 2010;25(2):147-149. doi:10.1007/s11606-009-1160-0
20. Selim AJ, Berlowitz DR, Fincke G, et al. The health status of elderly veteran enrollees in the Veterans Health Administration. J Am Geriatr Soc. 2004;52(8):1271-1276. doi:10.1111/j.1532-5415.2004.52355.x
21. Criqui MH, Aboyans V. Epidemiology of peripheral artery disease. Circ Res. 2015;116(9):1509-1526. doi:10.1161/CIRCRESAHA.116.303849
22. Yokoo KM, Kronon M, Lewis VL Jr, McCarthy WJ, McMillan WD, Meyer PR Jr. Peripheral vascular disease in spinal cord injury patients: a difficult diagnosis. Ann Plast Surg. 1996;37(5):495-499. doi:10.1097/00000637-199611000-00007
23. Taylor SM, Kalbaugh CA, Blackhurst DW, Cass, et al. Determinants of functional outcome after revascularization for critical limb ischemia: an analysis of 1000 consecutive vascular interventions. J Vasc Surg. 2006;44(4):747–756. doi:10.1016/j.jvs.2006.06.015
24. Abdellaoui A, Al-Khaffaf H. C-reactive protein (CRP) as a marker in peripheral vascular disease. Eur J Vasc Endovasc Surg. 2007;34(1):18-22. doi:10.1016/j.ejvs.2006.10.040
25. Caro J, Migliaccio-Walle K, Ishak KJ, Proskorovsky I. The morbidity and mortality following a diagnosis of peripheral arterial disease: long-term follow-up of a large database. BMC Cardiovasc Disord. 2005;5:14. doi:10.1186/1471-2261-5-14
Exercise to Reduce Posttraumatic Stress Disorder Symptoms in Veterans
Physical exercise offers preventative and therapeutic benefits for a range of chronic health conditions, including cardiovascular disease, type 2 diabetes mellitus, Alzheimer disease, and depression.1,2 Exercise has been well studied for its antidepressant effects, its ability to reduce risk of aging-related dementia, and favorable effects on a range of cognitive functions.2 Lesser evidence exists regarding the impact of exercise on other mental health concerns. Therefore, an accurate understanding of whether physical exercise may ameliorate other conditions is important.
A small meta-analysis by Rosenbaum and colleagues found that exercise interventions were superior to control conditions for symptom reduction in study participants with posttraumatic stress disorder (PTSD).3 This meta-analysis included 4 randomized clinical trials representing 200 cases. The trial included a variety of physical activities (eg, yoga, aerobic, and strength-building exercises) and control conditions, and participants recruited from online, community, inpatient, and outpatient settings. The standardized mean difference (SMD) produced by the analysis indicated a small-to-medium effect (Hedges g, -0.35), with the authors reporting no evidence of publication bias, although an assessment of potential bias associated with individual trial design characteristics was not conducted. Of note, a meta-analysis by Watts and colleagues found that effect sizes for PTSD treatments tend to be smaller in veteran populations.4 Therefore, how much the mean effect size estimate in the study is applicable to veterans with PTSD is unknown.3
Veterans represent a unique subpopulation in which PTSD is common, although no meta-analysis yet published has synthesized the effects of exercise interventions from trials of veterans with PTSD.5 A recent systematic review by Whitworth and Ciccolo concluded that exercise may be associated with reduced risk of PTSD, a briefer course of PTSD symptoms, and/or reduced sleep- and depression-related difficulties.6 However, that review primarily included observational, cross-sectional, and qualitative works. No trials included in our meta-analysis were included in that review.6
Evidence-based psychotherapies like cognitive processing therapy and prolonged exposure have been shown to be effective for treating PTSD in veterans; however, these modalities are accompanied by high rates of dropout (eg, 40-60%), thereby limiting their clinical utility.7 The use of complementary and alternative approaches for treatment in the United States has increased in recent years, and exercise represents an important complementary treatment option.8 In a study by Baldwin and colleagues, nearly 50% of veterans reported using complementary or alternative approaches, and veterans with PTSD were among those likely to use such approaches.9 However, current studies of the effects of exercise interventions on PTSD symptom reduction are mostly small and varied, making determinations difficult regarding the potential utility of exercise for treating this condition in veterans.
Literature Search
No previous research has synthesized the literature on the effects of exercise on PTSD in the veteran population. The current meta-analysis aims to provide a synthesis of systematically selected studies on this topic to determine whether exercise-based interventions are effective at reducing veterans’ symptoms of PTSD. Our hypothesis was that, when used as a primary or adjuvant intervention for PTSD, physical exercise would be associated with a reduction of PTSD symptom scale scores. We planned a priori to produce separate estimates for single-arm and multi-arm trials. We also wanted to conduct a careful risk of bias assessment—or evaluation of study features that may have systematically influenced results—for included trials, not only to provide context for interpretation of results, but also to inform suggestions for research to advance this field of inquiry.10
Methods
This study was preregistered on PROSPERO and followed PRISMA guidelines for meta-analyses and systematic reviews.11 Supplementary materials, such as the PRISMA checklist, study data, and funnel plots, are available online (doi.org/10.6084/m9.figshare.c.5618437.v1). Conference abstracts were omitted due to a lack of necessary information. We decided early in the planning process to include both randomized and single-arm trials, expecting the number of completed studies in the area of exercise for PTSD symptom reduction in veterans, and particularly randomized trials of such, would be relatively small.
Studies were included if they met the following criteria: (1) the study was a single- or multi-arm interventional trial; (2) participants were veterans; (3) participants had a current diagnosis of PTSD or exhibited subthreshold PTSD symptoms, as established by authors of the individual studies and supported by a structured clinical interview, semistructured interview, or elevated scores on PTSD symptom self-report measures; (4) the study included an intervention in which exercise (physical activity that is planned, structured, repetitive, and purposive in the sense that improvement or maintenance of physical fitness or health is an objective) was the primary component; (5) PTSD symptom severity was by a clinician-rated or self-report measure; and (6) the study was published in a peer-reviewed journal.12 Studies were excluded if means, standard deviations, and sample sizes were not available or the full text of the study was not available in English.

The systematic review was conducted using PubMed, PsycINFO, and Cochrane Library databases, from the earliest record to February 2021. The following search phrase was used, without additional limits, to acquire a list of potential studies: (“PTSD” or “post-traumatic stress disorder” or “posttraumatic stress disorder” or “post traumatic stress disorder”) and (“veteran” or “veterans”) and (“exercise” or “aerobic” or “activity” or “physical activity”). The references of identified publications also were searched for additional studies. Then, study titles and abstracts were evaluated and finally, full texts were evaluated to determine study inclusion. All screening, study selection, and risk of bias and data extraction activities were performed by 2 independent reviewers (DR and MJ) with disagreements resolved through discussion and consensus (Figure 1). A list of studies excluded during full-text review and rationales can be viewed online (doi.org/10.6084/m9.figshare.c.5618437.v1).
Data Collection
Data were extracted from included studies using custom forms and included the following information based on PRISMA guidelines: (1) study design characteristics; (2) intervention details; and (3) PTSD outcome information.11 PTSD symptom severity was the primary outcome of interest. Outcome data were included if they were derived from a measure of PTSD symptoms—equivalency across measures was assumed for meta-analyses. Potential study bias for each outcome was evaluated using the ROBINS-I and Cochrane Collaboration’s RoB 2 tools for single-arm and multi-arm trials, respectively.13,14 These tools evaluate domains related to the design, conduct, and analysis of studies that are associated with bias (ie, systematic error in findings, such as under- or overestimation of results).10 Examples include how well authors performed and concealed randomization procedures, addressed missing data, and measured study outcomes.13,14 The risk of bias (eg, low, moderate, serious) associated with each domain is rated and, based on the domain ratings, each study is then given an overall rating regarding how much risk influences bias.13,14 Broadly, lower risk of bias corresponds to higher confidence in the validity of results.
Finally, 4 authors (associated with 2 single- and 2 multi-arm studies) were contacted and asked to provide further information. Data for 1 additional multi-arm study were obtained from these communications and included in the final study selection.15 These authors were also asked for information about any unpublished works of which they were aware, although no additional works were identified.
Statistical Analyses
Analyses were performed with R Studio R 3.6.0 software.16 An SMD (also known as Hedges g) was calculated for each study outcome: for single-arm trials, this was the SMD between pre- and postintervention scores, whereas for multi-arm trials, this was the SMD between postintervention outcome scores across groups. CIs for each SMD were calculated using a standard normal distribution. Combined SMDs were estimated separately for single- and multi-arm studies, using random-effects meta-analyses. In order to include multiple relevant outcomes from a single trial (ie, for studies using multiple PTSD symptom measures), robust variance estimation was used.17 Precision was used to weight SMDs.
Correlations between pre- and postintervention scores were not available for 1 single-arm study.18 A correlation coefficient of 0.8 was imputed to calculate the standard error of the of the SMDs for the Clinician-Administered PTSD Scale (CAPS) and the PTSD Checklist (PCL), as this value is consistent with past findings regarding the test-retest reliability of these measures.19-22 A sensitivity analysis, using several alternative correlational values, revealed that the choice of correlation coefficient did not impact the overall results of the meta-analysis.
I2 was used to evaluate between-study heterogeneity. Values of I2 > 25%, 50%, and 75% were selected to reflect low, moderate, and high heterogeneity, respectively, in accordance with guidelines described by Higgins and colleagues.23 Potential publication bias was assessed via funnel plot and Egger test.24 Finally, although collection of depressive symptom scores was proposed as a secondary outcome in the study protocol, such data were available only for 1 multi-arm study. As a result, this outcome was not evaluated.
Results
Six studies with 101 total participants were included in the single-arm analyses (Table 1).18,25-29 Participants consisted of veterans with chronic pain, post-9/11 veterans, female veterans of childbearing age, veterans with a history of trauma therapy, and other veterans. Types of exercise included moderate aerobic exercise and yoga. PTSD symptom measures included the CAPS and the PCL (PCL-5 or PCL-M versions). Reported financial sources for included studies included federal grant funding, nonprofit material support, outside organization support, use of US Department of Veterans Affairs (VA) resources, and no reported financial support.
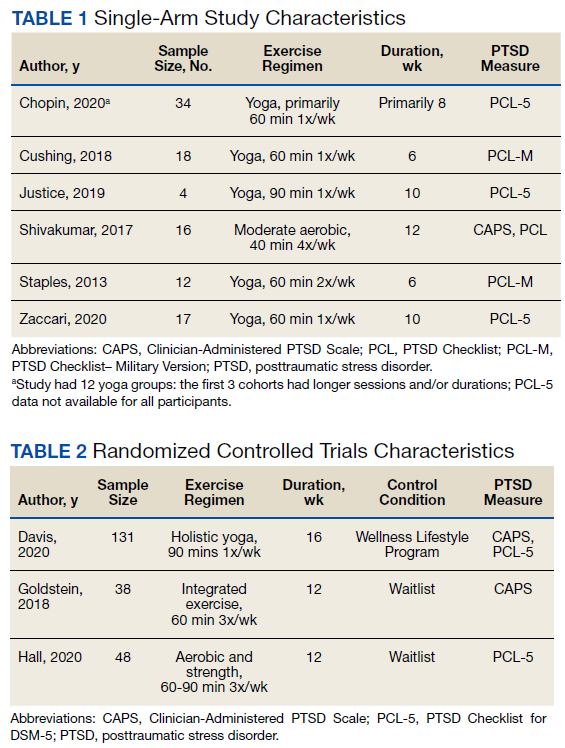
With respect to individual studies, Shivakumar and colleagues found that completion of an aerobic exercise program was associated with reduced scores on 2 different PTSD symptom scales (PCL and CAPS) in 16 women veterans.18 A trauma-informed yoga intervention study with 18 participants by Cushing and colleagues demonstrated veteran participation to be associated with large reductions in PTSD, anxiety, and depression scale scores.25 In a study with 34 veterans, Chopin and colleagues found that a trauma-informed yoga intervention was associated with a statistically significant reduction in PTSD symptoms, as did a study by Zaccari and colleagues with 17 veterans.26,29 Justice and Brems also found some evidence that trauma-informed yoga interventions helped PTSD symptoms in a small sample of 4 veterans, although these results were not quantitatively analyzed.27 In contrast, a small pilot study (n = 12) by Staples and colleagues testing a biweekly, 6-week yoga program did not show a significant effect on PTSD symptoms.28
Three studies with 217 total veteran participants were included in the multi-arm analyses (Table 2).15,30,31 As all multi-arm trials incorporated randomization, they will be referred to as randomized controlled trials (RCTs). On contact, Davis and colleagues provided veteran-specific results for their trial; as such, our data differ from those within the published article.15 Participants from all included studies were veterans currently experiencing symptoms of PTSD. Types of exercise included yoga and combined methods (eg, aerobic and strength training).15,30,31 PTSD symptom measures included the CAPS or the PCL-5.15,30,31 Reported financial sources for included studies included federal grant funding, as well as nonprofit support, private donations, and VA and Department of Defense resources.
Davis and colleagues conducted a recently concluded RCT with > 130 veteran participants and found that a novel manualized yoga program was superior to an attention control in reducing PTSD symptom scale scores for veterans.15 Goldstein and colleagues found that a program consisting of both aerobic and resistance exercises reduced PTSD symptoms to a greater extent than a waitlist control condition, with 47 veterans randomized in this trial.30 Likewise, Hall and colleagues conducted a pilot RCT in which an intervention that integrated exercise and cognitive behavioral techniques was compared to a waitlist control condition.31 For the 48 veterans included in the analyses, the authors reported greater PTSD symptom reduction associated with integrated exercise than that of the control condition; however, the study was not powered to detect statistically significant differences between groups.
Bias Assessment
Results for the risk of bias assessments can be viewed in Tables 3 and 4. For single-arm studies, overall risk of bias was serious for all included trials. Serious risk of bias was found in 2 domains: confounding, due to a lack of accounting for potential preexisting baseline trends (eg, regression to the mean) that could have impacted study results; and measurement, due to the use of a self-report symptom measure (PCL) or CAPS with unblinded assessors. Multiple studies also showed moderate risk in the missing data domain due to participant dropout without appropriate analytic methods to address potential bias.
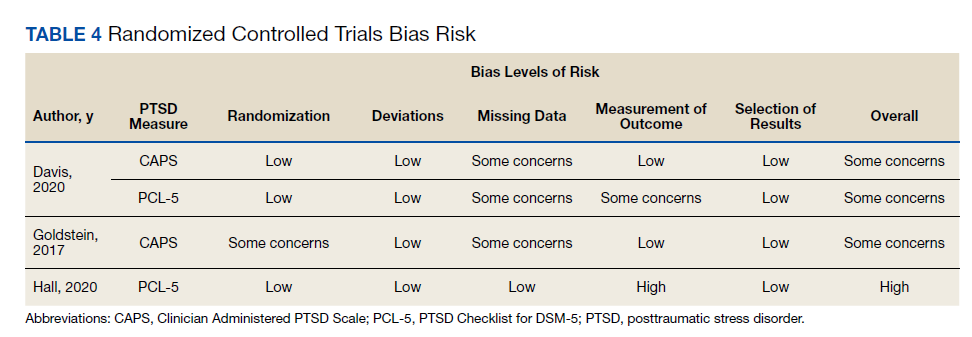
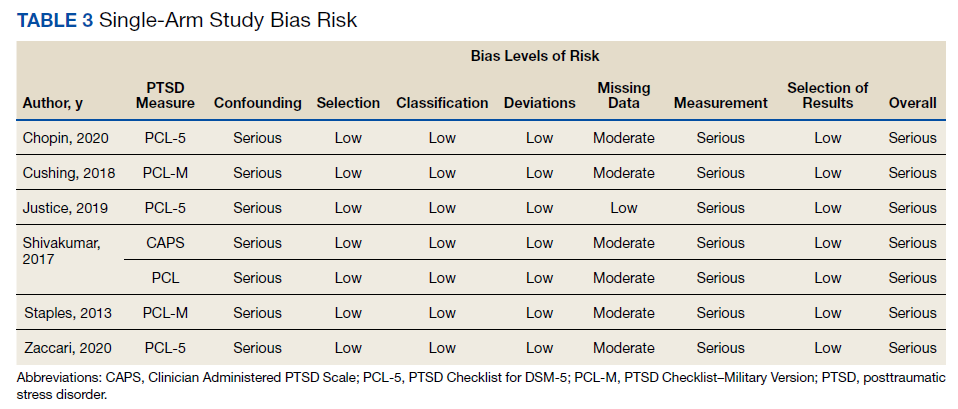
For RCTs, overall risk of bias ranged from some concerns to high risk. High risk of bias was found in 1 domain, measurement of outcome, due to use of a self-report symptom measure (PCL) with unblinded groups.31 The other 2 studies all had some concern of bias in at least 1 of the following domains: randomization, missing data, and measurement of outcome.
Pooled Standardized Mean Differences
Meta-analytic results can be viewed in Figure 2. The pooled SMD for the 6 single-arm studies was -0.60 (df = 4.41, 95% CI, -1.08 to -0.12, P = .03), indicating a statistically significant reduction in PTSD symptoms over the course of an exercise intervention. Combining SMDs for the 3 included RCTs revealed a pooled SMD of -0.40 (df = 1.57, 95% CI, -0.86 to 0.06, P = .06), indicating that exercise did not result in a statistically significant reduction in PTSD symptoms compared with control conditions.
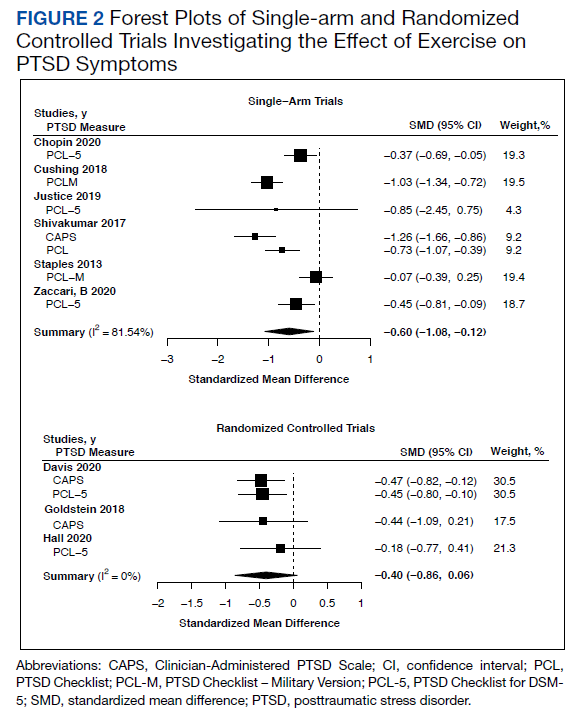
Publication Bias and Heterogeneity
Visual inspection funnel plots and Egger test did not suggest the presence of publication bias for RCTs (t = 1.21, df = 2, P = .35) or single-arm studies (t = -0.36, df = 5, P = .73).
Single-arm studies displayed a high degree of heterogeneity (I2 = 81.5%). Including sample size or exercise duration as variables in meta-regressions did not reduce heterogeneity (I2 = 85.2% and I2 = 83.8%, respectively). Performing a subgroup analysis only on studies using yoga as an intervention also did not reduce heterogeneity (I2 = 79.2%). Due to the small number of studies, no further exploration of heterogeneity was conducted on single-arm studies. RCTs did not display any heterogeneity (I2 = 0%).
Discussion
Our report represents an early synthesis of the first prospective studies of physical exercise interventions for PTSD in veterans. Results from meta-analyses of 6 single-arm studies (101 participants) and 3 RCTs (217 participants) provide early evidence that exercise may reduce PTSD symptoms in veterans. Yoga was the most common form of exercise used in single-arm studies, whereas RCTs used a wider range of interventions. The pooled SMD of -0.60 for single-arm longitudinal studies suggest a medium decrease in PTSD symptoms for veterans who engage in exercise interventions. Analysis of the RCTs supported this finding, with a pooled SMD of -0.40 reflecting a small-to-medium effect of exercise on PTSD symptoms over control conditions, although this result did not achieve statistical significance. Of note, while the nonsignificant finding for RCTs may have been due to insufficient power caused by the limited number of included studies, possibly exercise was not more efficacious than were the control conditions.
Although RCTs represented a variety of exercise types, PTSD symptom measures, and veteran subgroups, statistical results were not indicative of heterogeneity. However, only the largest and most comprehensive study of exercise for PTSD in veterans to date by Davis and colleagues had a statistically significant SMD.15 Of note, one of the other 2 RCTs displayed an SMD of a similar magnitude, but this study had a much smaller sample size and was underpowered to detect significance.30 Additionally, risk of bias assessments for single-arm studies and RCTs revealed study characteristics that suggest possible inflation of absolute effect sizes for individual studies. Therefore, the pooled SMDs we report are interpretable but may exceed the true effect of exercise for PTSD symptom reduction in veterans.
Based on results of our analyses, it is reasonable, albeit preliminary, to conclude that exercise interventions may result in reduced PTSD symptoms among veterans. At the very least, these findings support the continued investigation of such interventions for veterans. Given the unique and salubrious characteristics of physical exercise, such results, if supported by further research, suggest that exercise-based interventions may be particularly valuable within the trauma treatment realm. For example, exercise can be less expensive and more convenient than attending traditional treatment, and for veterans reluctant to engage in standard treatment approaches such as psychiatric and psychosocial modalities, complementary approaches entailing exercise may be viewed as particularly acceptable or enjoyable.32 In addition to possibly reducing PTSD symptoms, exercise is a well-established treatment for conditions commonly comorbid with PTSD, including depression, anxiety disorders, cognitive difficulties, and certain chronic pain conditions.6 As such, exercise represents a holistic treatment option that has the potential to augment standard PTSD care.
Limitations
The present study has several important limitations. First, few studies were found that met the broad eligibility criteria and those that did often had a small sample size. Besides highlighting a gap in the extant research, the limited studies available for meta-analysis means that caution must be taken when interpreting results. Fortunately, this issue will likely resolve once additional studies investigating the impact of exercise on PTSD symptoms in veterans are available for synthesis.
Relatedly, the included study interventions varied considerably, both in the types of exercise used and the characteristics of the exercises (eg, frequency, duration, and intensity), which is relevant as different exercise modalities are associated with differential physical effects.33 Including such a mixture of exercises may have given an incomplete picture of their potential therapeutic effects. Also, none of the RCTs compared exercise against first-line treatments for PTSD, such as prolonged exposure or cognitive processing therapy, which would have provided further insight into the role exercise could play in clinical settings.7
Another limitation is the elevated risk of bias found in most studies, particularly present in the longitudinal single-arm studies, all of which were rated at serious risk. For instance, no single-arm study controlled for preexisting baseline trends: without such (and lacking a comparison control group like in RCTs), it is possible that the observed effects were due to extraneous factors, rather than the exercise intervention. Although not as severe, the multi-arm RCTs also displayed at least moderate risk of bias. Therefore, SMDs may have been overestimated for each group of studies.
Finally, the results of the single-arm meta-analysis displayed high statistical heterogeneity, reducing the generalizability of the results. One possible cause of this heterogeneity may have been the yoga interventions, as a separate analysis removing the only nonyoga study did not reduce heterogeneity. This result was surprising, as the included yoga interventions seemed similar across studies. While the presence of high heterogeneity does require some caution when applying these results to outside interventions, the present study made use of random-effects meta-analysis, a technique that incorporates study heterogeneity into the statistical model, thereby strengthening the findings compared with that of a traditional fixed-effects approach.10
Future Steps
Several future steps are warranted to improve knowledge of exercise as a treatment for PTSD in veterans and in the general population. With current meta-analyses limited to small numbers of studies, additional studies of the efficacy of exercise for treating PTSD could help in several ways. A larger pool of studies would enable future meta-analyses to explore related questions, such as those regarding the impact of exercise on quality of life or depressive symptom reduction among veterans with PTSD. A greater number of studies also would enable meta-analysts to explore potentially critical moderators. For example, the duration, frequency, or type of exercise may moderate the effect of exercise on PTSD symptom reduction. Moderators related to patient or study design characteristics also should be explored in future studies.
Future work also should evaluate the impact that specific features of exercise regimens have on PTSD. Knowing whether the type or structure of exercise affects its clinical use would be invaluable in developing and implementing efficient exercise-based interventions. For example, if facilitated exercise was found to be significantly more effective at reducing PTSD symptoms than exercise completed independently, the development of exercise intervention programs in the VA and other facilities that commonly treat PTSD may be warranted. Additionally, it may be useful to identify specific mechanisms through which exercise reduces PTSD symptoms. For example, in addition to its beneficial biological effects, exercise also promotes psychological health through behavioral activation and alterations within reinforcement/reward systems, suggesting that exercise regularity may be more important than intensity.34,35 Understanding which mechanisms contribute most to change will aid in the development of more efficient interventions.
Given that veterans are demonstrating considerable interest in complementary and alternative PTSD treatments, it is critical that researchers focus on high-quality randomized tests of these interventions. Therefore, in addition to greater quality of exercise intervention studies, future efforts should be focused on RCTs that are designed in such a way as to limit potential introduction of bias. For example, assessment data should be completed by blinded assessors using standardized measures, and analyses should account for missing data and unequal participant attrition between groups. Ideally, pre-intervention trends across multiple baseline datapoints also would be collected in single-arm studies to avoid confounding related to regression to the mean. It is also recommended that future meta-analyses use risk of bias assessments and consider how the results of such assessments may impact the interpretation of results.
Conclusions
Findings from both single-arm studies and RCTs suggest possible benefit of exercise on PTSD symptom reduction, although confirmation of findings is needed. No study found increased symptoms following exercise intervention. Thus, it is reasonable to consider physical exercise, such as yoga, as an adjunct, whole-health consistent treatment. HCPs working with veterans with past traumatic experiences should consider incorporating exercise into patient care. Enhanced educational efforts emphasizing the psychotherapeutic impact of exercise may also have value for the veteran population. Furthermore, the current risk of bias assessments highlights the need for additional high-quality RCTs evaluating the specific impact of exercise on PTSD symptom reduction in veterans. In particular, this field of inquiry would benefit from larger samples and design characteristics to reduce bias (eg, blinding when possible, use of CAPS vs only self-report symptom measures, reducing problematic attrition, corrections for missing data, etc).
Acknowledgments
This research is the result of work supported with resources and the use of facilities at the VA Eastern Kansas Healthcare System (Dwight D. Eisenhower VA Medical Center). It was also supported by the Department of Veterans Affairs Office of Academic Affiliations Advanced Fellowship Program in Mental Illness Research and Treatment, as well as the Rocky Mountain Mental Illness Research, Education, and Clinical Center. Since Dr. Reis and Dr. Gaddy are employees of the US Government and contributed to this manuscript as part of their official duties, the work is not subject to US copyright. This study was preregistered on PROSPERO (https://www.crd.york.ac.uk/prospero/; ID: CRD42020153419).
1. Reiner M, Niermann C, Jekauc D, Woll A. Long-term health benefits of physical activity—a systematic review of longitudinal studies. BMC Public Health. 2013;13:813. doi:10.1186/1471-2458-13-813
2. Walsh R. Lifestyle and mental health. Am Psychol. 2011;66(7):579-592. doi:10.1037/a0021769
3. Rosenbaum S, Vancampfort D, Steel Z, Newby J, Ward PB, Stubbs B. Physical activity in the treatment of posttraumatic stress disorder: a systematic review and meta-analysis. Psychiatry Res. 2015;230(2):130-136. doi:10.1016/j.psychres.2015.10.017
4. Watts BV, Schnurr PP, Mayo L, Young-Xu Y, Weeks WB, Friedman MJ. Meta-analysis of the efficacy of treatments for posttraumatic stress disorder. J Clin Psychiatry. 2013;74(6):e541-550. doi:10.4088/JCP.12r08225
5. Tanielian T, Jaycox L, eds. Invisible Wounds of War: Psychological and Cognitive Injuries, Their Consequences, and Services to Assist Recovery. RAND Corporation; 2008
6. Whitworth JW, Ciccolo JT. Exercise and post-traumatic stress disorder in military veterans: a systematic review. Mil Med. 2016;181(9):953-960. doi:10.7205/MILMED-D-15-00488
7. Rutt BT, Oehlert ME, Krieshok TS, Lichtenberg JW. Effectiveness of cognitive processing therapy and prolonged exposure in the Department of Veterans Affairs. Psychol Rep. 2018;121(2):282-302. doi:10.1177/0033294117727746
8. Clarke TC, Black LI, Stussman BJ, Barnes PM, Nahin RL. Trends in the use of complementary health approaches among adults: United States, 2002-2012. Natl Health Stat Report. 2015(79):1-16.
9. Baldwin CM, Long K, Kroesen K, Brooks AJ, Bell IR. A profile of military veterans in the southwestern United States who use complementary and alternative medicine: Implications for integrated care. Arch Intern Med. 2002;162(15):1697-1704. doi:10.1001/archinte.162.15.1697
10. Higgins JPT, Thomas J, Chanlder J, et al, eds. Cochrane Handbook for Systematic Reviews of Interventions. Version 6.2 (updated February 2021). Cochrane; 2021.
11. Liberati A, Altman DG, Tetzlaff J, et al. The PRISMA statement for reporting systematic reviews and meta-analyses of studies that evaluate health care interventions: explanation and elaboration. PLoS Med. 2009;6(7):e1000100. doi:10.1371/journal.pmed.1000100
12. Caspersen CJ, Powell KE, Christenson GM. Physical activity, exercise, and physical fitness: definitions and distinctions for health-related research. Public Health Rep. 1985;100(2):126-131.
13. Sterne JAC, Hernán MA, Reeves BC, et al. ROBINS-I: a tool for assessing risk of bias in non-randomised studies of interventions. BMJ. 2016;355:i4919. doi:10.1136/bmj.i4919
14. Sterne JAC, Savovic´ J, Page MJ, et al. RoB 2: a revised tool for assessing risk of bias in randomised trials. BMJ. 2019;366:l4898. doi:10.1136/bmj.l4898
15. Davis LW, Schmid AA, Daggy JK, et al. Symptoms improve after a yoga program designed for PTSD in a randomized controlled trial with veterans and civilians. Psychol Trauma. 2020;12(8):904-912. doi:10.1037/tra0000564
16. R Core Team. R: a language and environment for statistical computing. R Foundation for Statistical Computing; 2019.
17. Tipton E. Small sample adjustments for robust variance estimation with meta-regression. Psychol Methods .2015;20(3):375-393. doi:10.1037/met0000011
18. Shivakumar G, Anderson EH, Surís AM, North CS. Exercise for PTSD in women veterans: a proof-of-concept study. Mil Med. 2017;182(11):e1809-e1814. doi:10.7205/MILMED-D-16-00440
19. Blake DD, Weathers FW, Nagy LM, et al. The development of a Clinician-Administered PTSD Scale. J Trauma Stress. 1995;8(1):75-90. doi:10.1007/BF02105408
20. Blanchard EB, Jones-Alexander J, Buckley TC, Forneris CA. Psychometric properties of the PTSD Checklist (PCL). Behav Res Ther. 1996;34(8):669-673. doi:10.1016/0005-7967(96)00033-2
21. Weathers FW, Bovin MJ, Lee DJ, et al. The Clinician- Administered PTSD Scale for DSM-5 (CAPS- 5): Development and initial psychometric evaluation in military veterans. Psychol Assess. 2018;30(3):383-395.doi:10.1037/pas0000486
22. Wilkins KC, Lang AJ, Norman SB. Synthesis of the psychometric properties of the PTSD checklist (PCL) military, civilian, and specific versions. Depress Anxiety. 2011;28(7):596-606. doi:10.1002/da.20837
23. Higgins JP, Thompson SG, Deeks JJ, Altman DG. Measuring inconsistency in meta-analyses. BMJ. 2003;327(7414):557-560. doi:10.1136/bmj.327.7414.557
24. Egger M, Davey Smith G, Schneider M, Minder C. Bias in meta-analysis detected by a simple, graphical test. BMJ. 1997;315(7109):629-634. doi:10.1136/bmj.315.7109.629
25. Cushing RE, Braun KL, Alden CISW, Katz AR. Military- tailored yoga for veterans with post-traumatic stress disorder. Mil Med. 2018;183(5-6):e223-e231. doi:10.1093/milmed/usx071
26. Chopin SM, Sheerin CM, Meyer BL. Yoga for warriors: An intervention for veterans with comorbid chronic pain and PTSD. Psychol Trauma. 2020;12(8):888-896. doi:10.1037/tra0000649
27. Justice L, Brems C. Bridging body and mind: case series of a 10-week trauma-informed yoga protocol for veterans. Int J Yoga Therap. 2019;29(1):65-79. doi:10.17761/D-17-2019-00029
28. Staples JK, Hamilton MF, Uddo M. A yoga program for the symptoms of post-traumatic stress disorder in veterans. Mil Med. 2013;178(8):854-860. doi:10.7205/MILMED-D-12-00536
29. Zaccari B, Callahan ML, Storzbach D, McFarlane N, Hudson R, Loftis JM. Yoga for veterans with PTSD: Cognitive functioning, mental health, and salivary cortisol. Psychol Trauma. 2020;12(8):913-917. doi:10.1037/tra0000909
30. Goldstein LA, Mehling WE, Metzler TJ, et al. Veterans Group Exercise: A randomized pilot trial of an Integrative Exercise program for veterans with posttraumatic stress. J Affect Disord. 2018;227:345-352. doi:10.1016/j.jad.2017.11.002
31. Hall KS, Morey MC, Bosworth HB, et al. Pilot randomized controlled trial of exercise training for older veterans with PTSD. J Behav Med. 2020;43(4):648-659. doi:10.1007/s10865-019-00073-w
32. Gaddy MA. Implementation of an integrative medicine treatment program at a Veterans Health Administration residential mental health facility. Psychol Serv. 2018;15(4):503- 509. doi:10.1037/ser0000189
33. Werner CM, Hecksteden A, Morsch A, et al. Differential effects of endurance, interval, and resistance training on telomerase activity and telomere length in a randomized, controlled study. Eur Heart J. 2019;40(1):34- 46. doi:10.1093/eurheartj/ehy585
34. Silverman MN, Deuster PA. Biological mechanisms underlying the role of physical fitness in health and resilience. Interface Focus. 2014;4(5):20140040. doi:10.1098/rsfs.2014.0040
35. Smith PJ, Merwin RM. The role of exercise in management of mental health disorders: an integrative review. Annu Rev Med. 2021;72:45-62. doi:10.1146/annurev-med-060619-022943.
Physical exercise offers preventative and therapeutic benefits for a range of chronic health conditions, including cardiovascular disease, type 2 diabetes mellitus, Alzheimer disease, and depression.1,2 Exercise has been well studied for its antidepressant effects, its ability to reduce risk of aging-related dementia, and favorable effects on a range of cognitive functions.2 Lesser evidence exists regarding the impact of exercise on other mental health concerns. Therefore, an accurate understanding of whether physical exercise may ameliorate other conditions is important.
A small meta-analysis by Rosenbaum and colleagues found that exercise interventions were superior to control conditions for symptom reduction in study participants with posttraumatic stress disorder (PTSD).3 This meta-analysis included 4 randomized clinical trials representing 200 cases. The trial included a variety of physical activities (eg, yoga, aerobic, and strength-building exercises) and control conditions, and participants recruited from online, community, inpatient, and outpatient settings. The standardized mean difference (SMD) produced by the analysis indicated a small-to-medium effect (Hedges g, -0.35), with the authors reporting no evidence of publication bias, although an assessment of potential bias associated with individual trial design characteristics was not conducted. Of note, a meta-analysis by Watts and colleagues found that effect sizes for PTSD treatments tend to be smaller in veteran populations.4 Therefore, how much the mean effect size estimate in the study is applicable to veterans with PTSD is unknown.3
Veterans represent a unique subpopulation in which PTSD is common, although no meta-analysis yet published has synthesized the effects of exercise interventions from trials of veterans with PTSD.5 A recent systematic review by Whitworth and Ciccolo concluded that exercise may be associated with reduced risk of PTSD, a briefer course of PTSD symptoms, and/or reduced sleep- and depression-related difficulties.6 However, that review primarily included observational, cross-sectional, and qualitative works. No trials included in our meta-analysis were included in that review.6
Evidence-based psychotherapies like cognitive processing therapy and prolonged exposure have been shown to be effective for treating PTSD in veterans; however, these modalities are accompanied by high rates of dropout (eg, 40-60%), thereby limiting their clinical utility.7 The use of complementary and alternative approaches for treatment in the United States has increased in recent years, and exercise represents an important complementary treatment option.8 In a study by Baldwin and colleagues, nearly 50% of veterans reported using complementary or alternative approaches, and veterans with PTSD were among those likely to use such approaches.9 However, current studies of the effects of exercise interventions on PTSD symptom reduction are mostly small and varied, making determinations difficult regarding the potential utility of exercise for treating this condition in veterans.
Literature Search
No previous research has synthesized the literature on the effects of exercise on PTSD in the veteran population. The current meta-analysis aims to provide a synthesis of systematically selected studies on this topic to determine whether exercise-based interventions are effective at reducing veterans’ symptoms of PTSD. Our hypothesis was that, when used as a primary or adjuvant intervention for PTSD, physical exercise would be associated with a reduction of PTSD symptom scale scores. We planned a priori to produce separate estimates for single-arm and multi-arm trials. We also wanted to conduct a careful risk of bias assessment—or evaluation of study features that may have systematically influenced results—for included trials, not only to provide context for interpretation of results, but also to inform suggestions for research to advance this field of inquiry.10
Methods
This study was preregistered on PROSPERO and followed PRISMA guidelines for meta-analyses and systematic reviews.11 Supplementary materials, such as the PRISMA checklist, study data, and funnel plots, are available online (doi.org/10.6084/m9.figshare.c.5618437.v1). Conference abstracts were omitted due to a lack of necessary information. We decided early in the planning process to include both randomized and single-arm trials, expecting the number of completed studies in the area of exercise for PTSD symptom reduction in veterans, and particularly randomized trials of such, would be relatively small.
Studies were included if they met the following criteria: (1) the study was a single- or multi-arm interventional trial; (2) participants were veterans; (3) participants had a current diagnosis of PTSD or exhibited subthreshold PTSD symptoms, as established by authors of the individual studies and supported by a structured clinical interview, semistructured interview, or elevated scores on PTSD symptom self-report measures; (4) the study included an intervention in which exercise (physical activity that is planned, structured, repetitive, and purposive in the sense that improvement or maintenance of physical fitness or health is an objective) was the primary component; (5) PTSD symptom severity was by a clinician-rated or self-report measure; and (6) the study was published in a peer-reviewed journal.12 Studies were excluded if means, standard deviations, and sample sizes were not available or the full text of the study was not available in English.
The systematic review was conducted using PubMed, PsycINFO, and Cochrane Library databases, from the earliest record to February 2021. The following search phrase was used, without additional limits, to acquire a list of potential studies: (“PTSD” or “post-traumatic stress disorder” or “posttraumatic stress disorder” or “post traumatic stress disorder”) and (“veteran” or “veterans”) and (“exercise” or “aerobic” or “activity” or “physical activity”). The references of identified publications also were searched for additional studies. Then, study titles and abstracts were evaluated and finally, full texts were evaluated to determine study inclusion. All screening, study selection, and risk of bias and data extraction activities were performed by 2 independent reviewers (DR and MJ) with disagreements resolved through discussion and consensus (Figure 1). A list of studies excluded during full-text review and rationales can be viewed online (doi.org/10.6084/m9.figshare.c.5618437.v1).
Data Collection
Data were extracted from included studies using custom forms and included the following information based on PRISMA guidelines: (1) study design characteristics; (2) intervention details; and (3) PTSD outcome information.11 PTSD symptom severity was the primary outcome of interest. Outcome data were included if they were derived from a measure of PTSD symptoms—equivalency across measures was assumed for meta-analyses. Potential study bias for each outcome was evaluated using the ROBINS-I and Cochrane Collaboration’s RoB 2 tools for single-arm and multi-arm trials, respectively.13,14 These tools evaluate domains related to the design, conduct, and analysis of studies that are associated with bias (ie, systematic error in findings, such as under- or overestimation of results).10 Examples include how well authors performed and concealed randomization procedures, addressed missing data, and measured study outcomes.13,14 The risk of bias (eg, low, moderate, serious) associated with each domain is rated and, based on the domain ratings, each study is then given an overall rating regarding how much risk influences bias.13,14 Broadly, lower risk of bias corresponds to higher confidence in the validity of results.
Finally, 4 authors (associated with 2 single- and 2 multi-arm studies) were contacted and asked to provide further information. Data for 1 additional multi-arm study were obtained from these communications and included in the final study selection.15 These authors were also asked for information about any unpublished works of which they were aware, although no additional works were identified.
Statistical Analyses
Analyses were performed with R Studio R 3.6.0 software.16 An SMD (also known as Hedges g) was calculated for each study outcome: for single-arm trials, this was the SMD between pre- and postintervention scores, whereas for multi-arm trials, this was the SMD between postintervention outcome scores across groups. CIs for each SMD were calculated using a standard normal distribution. Combined SMDs were estimated separately for single- and multi-arm studies, using random-effects meta-analyses. In order to include multiple relevant outcomes from a single trial (ie, for studies using multiple PTSD symptom measures), robust variance estimation was used.17 Precision was used to weight SMDs.
Correlations between pre- and postintervention scores were not available for 1 single-arm study.18 A correlation coefficient of 0.8 was imputed to calculate the standard error of the of the SMDs for the Clinician-Administered PTSD Scale (CAPS) and the PTSD Checklist (PCL), as this value is consistent with past findings regarding the test-retest reliability of these measures.19-22 A sensitivity analysis, using several alternative correlational values, revealed that the choice of correlation coefficient did not impact the overall results of the meta-analysis.
I2 was used to evaluate between-study heterogeneity. Values of I2 > 25%, 50%, and 75% were selected to reflect low, moderate, and high heterogeneity, respectively, in accordance with guidelines described by Higgins and colleagues.23 Potential publication bias was assessed via funnel plot and Egger test.24 Finally, although collection of depressive symptom scores was proposed as a secondary outcome in the study protocol, such data were available only for 1 multi-arm study. As a result, this outcome was not evaluated.
Results
Six studies with 101 total participants were included in the single-arm analyses (Table 1).18,25-29 Participants consisted of veterans with chronic pain, post-9/11 veterans, female veterans of childbearing age, veterans with a history of trauma therapy, and other veterans. Types of exercise included moderate aerobic exercise and yoga. PTSD symptom measures included the CAPS and the PCL (PCL-5 or PCL-M versions). Reported financial sources for included studies included federal grant funding, nonprofit material support, outside organization support, use of US Department of Veterans Affairs (VA) resources, and no reported financial support.
With respect to individual studies, Shivakumar and colleagues found that completion of an aerobic exercise program was associated with reduced scores on 2 different PTSD symptom scales (PCL and CAPS) in 16 women veterans.18 A trauma-informed yoga intervention study with 18 participants by Cushing and colleagues demonstrated veteran participation to be associated with large reductions in PTSD, anxiety, and depression scale scores.25 In a study with 34 veterans, Chopin and colleagues found that a trauma-informed yoga intervention was associated with a statistically significant reduction in PTSD symptoms, as did a study by Zaccari and colleagues with 17 veterans.26,29 Justice and Brems also found some evidence that trauma-informed yoga interventions helped PTSD symptoms in a small sample of 4 veterans, although these results were not quantitatively analyzed.27 In contrast, a small pilot study (n = 12) by Staples and colleagues testing a biweekly, 6-week yoga program did not show a significant effect on PTSD symptoms.28
Three studies with 217 total veteran participants were included in the multi-arm analyses (Table 2).15,30,31 As all multi-arm trials incorporated randomization, they will be referred to as randomized controlled trials (RCTs). On contact, Davis and colleagues provided veteran-specific results for their trial; as such, our data differ from those within the published article.15 Participants from all included studies were veterans currently experiencing symptoms of PTSD. Types of exercise included yoga and combined methods (eg, aerobic and strength training).15,30,31 PTSD symptom measures included the CAPS or the PCL-5.15,30,31 Reported financial sources for included studies included federal grant funding, as well as nonprofit support, private donations, and VA and Department of Defense resources.
Davis and colleagues conducted a recently concluded RCT with > 130 veteran participants and found that a novel manualized yoga program was superior to an attention control in reducing PTSD symptom scale scores for veterans.15 Goldstein and colleagues found that a program consisting of both aerobic and resistance exercises reduced PTSD symptoms to a greater extent than a waitlist control condition, with 47 veterans randomized in this trial.30 Likewise, Hall and colleagues conducted a pilot RCT in which an intervention that integrated exercise and cognitive behavioral techniques was compared to a waitlist control condition.31 For the 48 veterans included in the analyses, the authors reported greater PTSD symptom reduction associated with integrated exercise than that of the control condition; however, the study was not powered to detect statistically significant differences between groups.
Bias Assessment
Results for the risk of bias assessments can be viewed in Tables 3 and 4. For single-arm studies, overall risk of bias was serious for all included trials. Serious risk of bias was found in 2 domains: confounding, due to a lack of accounting for potential preexisting baseline trends (eg, regression to the mean) that could have impacted study results; and measurement, due to the use of a self-report symptom measure (PCL) or CAPS with unblinded assessors. Multiple studies also showed moderate risk in the missing data domain due to participant dropout without appropriate analytic methods to address potential bias.
For RCTs, overall risk of bias ranged from some concerns to high risk. High risk of bias was found in 1 domain, measurement of outcome, due to use of a self-report symptom measure (PCL) with unblinded groups.31 The other 2 studies all had some concern of bias in at least 1 of the following domains: randomization, missing data, and measurement of outcome.
Pooled Standardized Mean Differences
Meta-analytic results can be viewed in Figure 2. The pooled SMD for the 6 single-arm studies was -0.60 (df = 4.41, 95% CI, -1.08 to -0.12, P = .03), indicating a statistically significant reduction in PTSD symptoms over the course of an exercise intervention. Combining SMDs for the 3 included RCTs revealed a pooled SMD of -0.40 (df = 1.57, 95% CI, -0.86 to 0.06, P = .06), indicating that exercise did not result in a statistically significant reduction in PTSD symptoms compared with control conditions.
Publication Bias and Heterogeneity
Visual inspection funnel plots and Egger test did not suggest the presence of publication bias for RCTs (t = 1.21, df = 2, P = .35) or single-arm studies (t = -0.36, df = 5, P = .73).
Single-arm studies displayed a high degree of heterogeneity (I2 = 81.5%). Including sample size or exercise duration as variables in meta-regressions did not reduce heterogeneity (I2 = 85.2% and I2 = 83.8%, respectively). Performing a subgroup analysis only on studies using yoga as an intervention also did not reduce heterogeneity (I2 = 79.2%). Due to the small number of studies, no further exploration of heterogeneity was conducted on single-arm studies. RCTs did not display any heterogeneity (I2 = 0%).
Discussion
Our report represents an early synthesis of the first prospective studies of physical exercise interventions for PTSD in veterans. Results from meta-analyses of 6 single-arm studies (101 participants) and 3 RCTs (217 participants) provide early evidence that exercise may reduce PTSD symptoms in veterans. Yoga was the most common form of exercise used in single-arm studies, whereas RCTs used a wider range of interventions. The pooled SMD of -0.60 for single-arm longitudinal studies suggest a medium decrease in PTSD symptoms for veterans who engage in exercise interventions. Analysis of the RCTs supported this finding, with a pooled SMD of -0.40 reflecting a small-to-medium effect of exercise on PTSD symptoms over control conditions, although this result did not achieve statistical significance. Of note, while the nonsignificant finding for RCTs may have been due to insufficient power caused by the limited number of included studies, possibly exercise was not more efficacious than were the control conditions.
Although RCTs represented a variety of exercise types, PTSD symptom measures, and veteran subgroups, statistical results were not indicative of heterogeneity. However, only the largest and most comprehensive study of exercise for PTSD in veterans to date by Davis and colleagues had a statistically significant SMD.15 Of note, one of the other 2 RCTs displayed an SMD of a similar magnitude, but this study had a much smaller sample size and was underpowered to detect significance.30 Additionally, risk of bias assessments for single-arm studies and RCTs revealed study characteristics that suggest possible inflation of absolute effect sizes for individual studies. Therefore, the pooled SMDs we report are interpretable but may exceed the true effect of exercise for PTSD symptom reduction in veterans.
Based on results of our analyses, it is reasonable, albeit preliminary, to conclude that exercise interventions may result in reduced PTSD symptoms among veterans. At the very least, these findings support the continued investigation of such interventions for veterans. Given the unique and salubrious characteristics of physical exercise, such results, if supported by further research, suggest that exercise-based interventions may be particularly valuable within the trauma treatment realm. For example, exercise can be less expensive and more convenient than attending traditional treatment, and for veterans reluctant to engage in standard treatment approaches such as psychiatric and psychosocial modalities, complementary approaches entailing exercise may be viewed as particularly acceptable or enjoyable.32 In addition to possibly reducing PTSD symptoms, exercise is a well-established treatment for conditions commonly comorbid with PTSD, including depression, anxiety disorders, cognitive difficulties, and certain chronic pain conditions.6 As such, exercise represents a holistic treatment option that has the potential to augment standard PTSD care.
Limitations
The present study has several important limitations. First, few studies were found that met the broad eligibility criteria and those that did often had a small sample size. Besides highlighting a gap in the extant research, the limited studies available for meta-analysis means that caution must be taken when interpreting results. Fortunately, this issue will likely resolve once additional studies investigating the impact of exercise on PTSD symptoms in veterans are available for synthesis.
Relatedly, the included study interventions varied considerably, both in the types of exercise used and the characteristics of the exercises (eg, frequency, duration, and intensity), which is relevant as different exercise modalities are associated with differential physical effects.33 Including such a mixture of exercises may have given an incomplete picture of their potential therapeutic effects. Also, none of the RCTs compared exercise against first-line treatments for PTSD, such as prolonged exposure or cognitive processing therapy, which would have provided further insight into the role exercise could play in clinical settings.7
Another limitation is the elevated risk of bias found in most studies, particularly present in the longitudinal single-arm studies, all of which were rated at serious risk. For instance, no single-arm study controlled for preexisting baseline trends: without such (and lacking a comparison control group like in RCTs), it is possible that the observed effects were due to extraneous factors, rather than the exercise intervention. Although not as severe, the multi-arm RCTs also displayed at least moderate risk of bias. Therefore, SMDs may have been overestimated for each group of studies.
Finally, the results of the single-arm meta-analysis displayed high statistical heterogeneity, reducing the generalizability of the results. One possible cause of this heterogeneity may have been the yoga interventions, as a separate analysis removing the only nonyoga study did not reduce heterogeneity. This result was surprising, as the included yoga interventions seemed similar across studies. While the presence of high heterogeneity does require some caution when applying these results to outside interventions, the present study made use of random-effects meta-analysis, a technique that incorporates study heterogeneity into the statistical model, thereby strengthening the findings compared with that of a traditional fixed-effects approach.10
Future Steps
Several future steps are warranted to improve knowledge of exercise as a treatment for PTSD in veterans and in the general population. With current meta-analyses limited to small numbers of studies, additional studies of the efficacy of exercise for treating PTSD could help in several ways. A larger pool of studies would enable future meta-analyses to explore related questions, such as those regarding the impact of exercise on quality of life or depressive symptom reduction among veterans with PTSD. A greater number of studies also would enable meta-analysts to explore potentially critical moderators. For example, the duration, frequency, or type of exercise may moderate the effect of exercise on PTSD symptom reduction. Moderators related to patient or study design characteristics also should be explored in future studies.
Future work also should evaluate the impact that specific features of exercise regimens have on PTSD. Knowing whether the type or structure of exercise affects its clinical use would be invaluable in developing and implementing efficient exercise-based interventions. For example, if facilitated exercise was found to be significantly more effective at reducing PTSD symptoms than exercise completed independently, the development of exercise intervention programs in the VA and other facilities that commonly treat PTSD may be warranted. Additionally, it may be useful to identify specific mechanisms through which exercise reduces PTSD symptoms. For example, in addition to its beneficial biological effects, exercise also promotes psychological health through behavioral activation and alterations within reinforcement/reward systems, suggesting that exercise regularity may be more important than intensity.34,35 Understanding which mechanisms contribute most to change will aid in the development of more efficient interventions.
Given that veterans are demonstrating considerable interest in complementary and alternative PTSD treatments, it is critical that researchers focus on high-quality randomized tests of these interventions. Therefore, in addition to greater quality of exercise intervention studies, future efforts should be focused on RCTs that are designed in such a way as to limit potential introduction of bias. For example, assessment data should be completed by blinded assessors using standardized measures, and analyses should account for missing data and unequal participant attrition between groups. Ideally, pre-intervention trends across multiple baseline datapoints also would be collected in single-arm studies to avoid confounding related to regression to the mean. It is also recommended that future meta-analyses use risk of bias assessments and consider how the results of such assessments may impact the interpretation of results.
Conclusions
Findings from both single-arm studies and RCTs suggest possible benefit of exercise on PTSD symptom reduction, although confirmation of findings is needed. No study found increased symptoms following exercise intervention. Thus, it is reasonable to consider physical exercise, such as yoga, as an adjunct, whole-health consistent treatment. HCPs working with veterans with past traumatic experiences should consider incorporating exercise into patient care. Enhanced educational efforts emphasizing the psychotherapeutic impact of exercise may also have value for the veteran population. Furthermore, the current risk of bias assessments highlights the need for additional high-quality RCTs evaluating the specific impact of exercise on PTSD symptom reduction in veterans. In particular, this field of inquiry would benefit from larger samples and design characteristics to reduce bias (eg, blinding when possible, use of CAPS vs only self-report symptom measures, reducing problematic attrition, corrections for missing data, etc).
Acknowledgments
This research is the result of work supported with resources and the use of facilities at the VA Eastern Kansas Healthcare System (Dwight D. Eisenhower VA Medical Center). It was also supported by the Department of Veterans Affairs Office of Academic Affiliations Advanced Fellowship Program in Mental Illness Research and Treatment, as well as the Rocky Mountain Mental Illness Research, Education, and Clinical Center. Since Dr. Reis and Dr. Gaddy are employees of the US Government and contributed to this manuscript as part of their official duties, the work is not subject to US copyright. This study was preregistered on PROSPERO (https://www.crd.york.ac.uk/prospero/; ID: CRD42020153419).
1. Reiner M, Niermann C, Jekauc D, Woll A. Long-term health benefits of physical activity—a systematic review of longitudinal studies. BMC Public Health. 2013;13:813. doi:10.1186/1471-2458-13-813
2. Walsh R. Lifestyle and mental health. Am Psychol. 2011;66(7):579-592. doi:10.1037/a0021769
3. Rosenbaum S, Vancampfort D, Steel Z, Newby J, Ward PB, Stubbs B. Physical activity in the treatment of posttraumatic stress disorder: a systematic review and meta-analysis. Psychiatry Res. 2015;230(2):130-136. doi:10.1016/j.psychres.2015.10.017
4. Watts BV, Schnurr PP, Mayo L, Young-Xu Y, Weeks WB, Friedman MJ. Meta-analysis of the efficacy of treatments for posttraumatic stress disorder. J Clin Psychiatry. 2013;74(6):e541-550. doi:10.4088/JCP.12r08225
5. Tanielian T, Jaycox L, eds. Invisible Wounds of War: Psychological and Cognitive Injuries, Their Consequences, and Services to Assist Recovery. RAND Corporation; 2008
6. Whitworth JW, Ciccolo JT. Exercise and post-traumatic stress disorder in military veterans: a systematic review. Mil Med. 2016;181(9):953-960. doi:10.7205/MILMED-D-15-00488
7. Rutt BT, Oehlert ME, Krieshok TS, Lichtenberg JW. Effectiveness of cognitive processing therapy and prolonged exposure in the Department of Veterans Affairs. Psychol Rep. 2018;121(2):282-302. doi:10.1177/0033294117727746
8. Clarke TC, Black LI, Stussman BJ, Barnes PM, Nahin RL. Trends in the use of complementary health approaches among adults: United States, 2002-2012. Natl Health Stat Report. 2015(79):1-16.
9. Baldwin CM, Long K, Kroesen K, Brooks AJ, Bell IR. A profile of military veterans in the southwestern United States who use complementary and alternative medicine: Implications for integrated care. Arch Intern Med. 2002;162(15):1697-1704. doi:10.1001/archinte.162.15.1697
10. Higgins JPT, Thomas J, Chanlder J, et al, eds. Cochrane Handbook for Systematic Reviews of Interventions. Version 6.2 (updated February 2021). Cochrane; 2021.
11. Liberati A, Altman DG, Tetzlaff J, et al. The PRISMA statement for reporting systematic reviews and meta-analyses of studies that evaluate health care interventions: explanation and elaboration. PLoS Med. 2009;6(7):e1000100. doi:10.1371/journal.pmed.1000100
12. Caspersen CJ, Powell KE, Christenson GM. Physical activity, exercise, and physical fitness: definitions and distinctions for health-related research. Public Health Rep. 1985;100(2):126-131.
13. Sterne JAC, Hernán MA, Reeves BC, et al. ROBINS-I: a tool for assessing risk of bias in non-randomised studies of interventions. BMJ. 2016;355:i4919. doi:10.1136/bmj.i4919
14. Sterne JAC, Savovic´ J, Page MJ, et al. RoB 2: a revised tool for assessing risk of bias in randomised trials. BMJ. 2019;366:l4898. doi:10.1136/bmj.l4898
15. Davis LW, Schmid AA, Daggy JK, et al. Symptoms improve after a yoga program designed for PTSD in a randomized controlled trial with veterans and civilians. Psychol Trauma. 2020;12(8):904-912. doi:10.1037/tra0000564
16. R Core Team. R: a language and environment for statistical computing. R Foundation for Statistical Computing; 2019.
17. Tipton E. Small sample adjustments for robust variance estimation with meta-regression. Psychol Methods .2015;20(3):375-393. doi:10.1037/met0000011
18. Shivakumar G, Anderson EH, Surís AM, North CS. Exercise for PTSD in women veterans: a proof-of-concept study. Mil Med. 2017;182(11):e1809-e1814. doi:10.7205/MILMED-D-16-00440
19. Blake DD, Weathers FW, Nagy LM, et al. The development of a Clinician-Administered PTSD Scale. J Trauma Stress. 1995;8(1):75-90. doi:10.1007/BF02105408
20. Blanchard EB, Jones-Alexander J, Buckley TC, Forneris CA. Psychometric properties of the PTSD Checklist (PCL). Behav Res Ther. 1996;34(8):669-673. doi:10.1016/0005-7967(96)00033-2
21. Weathers FW, Bovin MJ, Lee DJ, et al. The Clinician- Administered PTSD Scale for DSM-5 (CAPS- 5): Development and initial psychometric evaluation in military veterans. Psychol Assess. 2018;30(3):383-395.doi:10.1037/pas0000486
22. Wilkins KC, Lang AJ, Norman SB. Synthesis of the psychometric properties of the PTSD checklist (PCL) military, civilian, and specific versions. Depress Anxiety. 2011;28(7):596-606. doi:10.1002/da.20837
23. Higgins JP, Thompson SG, Deeks JJ, Altman DG. Measuring inconsistency in meta-analyses. BMJ. 2003;327(7414):557-560. doi:10.1136/bmj.327.7414.557
24. Egger M, Davey Smith G, Schneider M, Minder C. Bias in meta-analysis detected by a simple, graphical test. BMJ. 1997;315(7109):629-634. doi:10.1136/bmj.315.7109.629
25. Cushing RE, Braun KL, Alden CISW, Katz AR. Military- tailored yoga for veterans with post-traumatic stress disorder. Mil Med. 2018;183(5-6):e223-e231. doi:10.1093/milmed/usx071
26. Chopin SM, Sheerin CM, Meyer BL. Yoga for warriors: An intervention for veterans with comorbid chronic pain and PTSD. Psychol Trauma. 2020;12(8):888-896. doi:10.1037/tra0000649
27. Justice L, Brems C. Bridging body and mind: case series of a 10-week trauma-informed yoga protocol for veterans. Int J Yoga Therap. 2019;29(1):65-79. doi:10.17761/D-17-2019-00029
28. Staples JK, Hamilton MF, Uddo M. A yoga program for the symptoms of post-traumatic stress disorder in veterans. Mil Med. 2013;178(8):854-860. doi:10.7205/MILMED-D-12-00536
29. Zaccari B, Callahan ML, Storzbach D, McFarlane N, Hudson R, Loftis JM. Yoga for veterans with PTSD: Cognitive functioning, mental health, and salivary cortisol. Psychol Trauma. 2020;12(8):913-917. doi:10.1037/tra0000909
30. Goldstein LA, Mehling WE, Metzler TJ, et al. Veterans Group Exercise: A randomized pilot trial of an Integrative Exercise program for veterans with posttraumatic stress. J Affect Disord. 2018;227:345-352. doi:10.1016/j.jad.2017.11.002
31. Hall KS, Morey MC, Bosworth HB, et al. Pilot randomized controlled trial of exercise training for older veterans with PTSD. J Behav Med. 2020;43(4):648-659. doi:10.1007/s10865-019-00073-w
32. Gaddy MA. Implementation of an integrative medicine treatment program at a Veterans Health Administration residential mental health facility. Psychol Serv. 2018;15(4):503- 509. doi:10.1037/ser0000189
33. Werner CM, Hecksteden A, Morsch A, et al. Differential effects of endurance, interval, and resistance training on telomerase activity and telomere length in a randomized, controlled study. Eur Heart J. 2019;40(1):34- 46. doi:10.1093/eurheartj/ehy585
34. Silverman MN, Deuster PA. Biological mechanisms underlying the role of physical fitness in health and resilience. Interface Focus. 2014;4(5):20140040. doi:10.1098/rsfs.2014.0040
35. Smith PJ, Merwin RM. The role of exercise in management of mental health disorders: an integrative review. Annu Rev Med. 2021;72:45-62. doi:10.1146/annurev-med-060619-022943.