User login
Oxygen Therapies and Clinical Outcomes for Patients Hospitalized With COVID-19: First Surge vs Second Surge
From Lahey Hospital and Medical Center, Burlington, MA (Drs. Liesching and Lei), and Tufts University School of Medicine, Boston, MA (Dr. Liesching)
ABSTRACT
Objective: To compare the utilization of oxygen therapies and clinical outcomes of patients admitted for COVID-19 during the second surge of the pandemic to that of patients admitted during the first surge.
Design: Observational study using a registry database.
Setting: Three hospitals (791 inpatient beds and 76 intensive care unit [ICU] beds) within the Beth Israel Lahey Health system in Massachusetts.
Participants: We included 3183 patients with COVID-19 admitted to hospitals.
Measurements: Baseline data included demographics and comorbidities. Treatments included low-flow supplemental oxygen (2-6 L/min), high-flow oxygen via nasal cannula, and invasive mechanical ventilation. Outcomes included ICU admission, length of stay, ventilator days, and mortality.
Results: A total of 3183 patients were included: 1586 during the first surge and 1597 during the second surge. Compared to the first surge, patients admitted during the second surge had a similar rate of receiving low-flow supplemental oxygen (65.8% vs 64.1%, P = .3), a higher rate of receiving high-flow nasal cannula (15.4% vs 10.8%, P = .0001), and a lower ventilation rate (5.6% vs 9.7%, P < .0001). The outcomes during the second surge were better than those during the first surge: lower ICU admission rate (8.1% vs 12.7%, P < .0001), shorter length of hospital stay (5 vs 6 days, P < .0001), fewer ventilator days (10 vs 16, P = .01), and lower mortality (8.3% vs 19.2%, P < .0001). Among ventilated patients, those who received high-flow nasal cannula had lower mortality.
Conclusion: Compared to the first surge of the COVID-19 pandemic, patients admitted during the second surge had similar likelihood of receiving low-flow supplemental oxygen, were more likely to receive high-flow nasal cannula, were less likely to be ventilated, and had better outcomes.
Keywords: supplemental oxygen, high-flow nasal cannula, ventilator.
The respiratory system receives the major impact of SARS-CoV-2 virus, and hypoxemia has been the predominant diagnosis for patients hospitalized with COVID-19.1,2 During the initial stage of the pandemic, oxygen therapies and mechanical ventilation were the only choices for these patients.3-6 Standard-of-care treatment for patients with COVID-19 during the initial surge included oxygen therapies and mechanical ventilation for hypoxemia and medications for comorbidities and COVID-19–associated sequelae, such as multi-organ dysfunction and failure. A report from New York during the first surge (May 2020) showed that among 5700 hospitalized patients with COVID-19, 27.8% received supplemental oxygen and 12.2% received invasive mechanical ventilation.7 High-flow nasal cannula (HFNC) oxygen delivery has been utilized widely throughout the pandemic due to its superiority over other noninvasive respiratory support techniques.8-12 Mechanical ventilation is always necessary for critically ill patients with acute respiratory distress syndrome. However, ventilator scarcity has become a bottleneck in caring for severely ill patients with COVID-19 during the pandemic.13
The clinical outcomes of hospitalized COVID-19 patients include a high intubation rate, long length of hospital and intensive care unit (ICU) stay, and high mortality.14,15 As the pandemic evolved, new medications, including remdesivir, hydroxychloroquine, lopinavir, or interferon β-1a, were used in addition to the standard of care, but these did not result in significantly different mortality from standard of care.16 Steroids are becoming foundational to the treatment of severe COVID-19 pneumonia, but evidence from high-quality randomized controlled clinical trials is lacking.17
During the first surge from March to May 2020, Massachusetts had the third highest number of COVID-19 cases among states in the United States.18 In early 2021, COVID-19 cases were climbing close to the peak of the second surge in Massachusetts. In this study, we compared utilization of low-flow supplemental oxygen, HFNC, and mechanical ventilation and clinical outcomes of patients admitted to 3 hospitals in Massachusetts during the second surge of the pandemic to that of patients admitted during the first surge.
Methods
Setting
Beth Israel Lahey Health is a system of academic and teaching hospitals with primary care and specialty care providers. We included 3 centers within the Beth Israel Lahey Health system in Massachusetts: Lahey Hospital and Medical Center, with 335 inpatient hospital beds and 52 critical care beds; Beverly Hospital, with 227 beds and 14 critical care beds; and Winchester Hospital, with 229 beds and 10 ICU beds.
Participants
We included patients admitted to the 3 hospitals with COVID-19 as a primary or secondary diagnosis during the first surge of the pandemic (March 1, 2020 to June 15, 2020) and the second surge (November 15, 2020 to January 27, 2021). The timeframe of the first surge was defined as the window between the start date and the end date of data collection. During the time window of the first surge, 1586 patients were included. The start time of the second surge was defined as the date when the data collection was restarted; the end date was set when the number of patients (1597) accumulated was close to the number of patients in the first surge (1586), so that the two groups had similar sample size.
Study Design
A data registry of COVID-19 patients was created by our institution, and the data were prospectively collected starting in March 2020. We retrospectively extracted data on the following from the registry database for this observational study: demographics and baseline comorbidities; the use of low-flow supplemental oxygen, HFNC, and invasive mechanical ventilator; and ICU admission, length of hospital stay, length of ICU stay, and hospital discharge disposition. Start and end times for each oxygen therapy were not entered in the registry. Data about other oxygen therapies, such as noninvasive positive-pressure ventilation, were not collected in the registry database, and therefore were not included in the analysis.
Statistical Analysis
Continuous variables (eg, age) were tested for data distribution normality using the Shapiro-Wilk test. Normally distributed data were tested using unpaired t-tests and displayed as mean (SD). The skewed data were tested using the Wilcoxon rank sum test and displayed as median (interquartile range [IQR]). The categorical variables were compared using chi-square test. Comparisons with P ≤ .05 were considered significantly different. Statistical analysis for this study was generated using Statistical Analysis Software (SAS), version 9.4 for Windows (SAS Institute Inc.).
Results
Baseline Characteristics
We included 3183 patients: 1586 admitted during the first surge and 1597 admitted during the second surge. Baseline characteristics of patients with COVID-19 admitted during the first and second surges are shown in Table 1. Patients admitted during the second surge were older (73 years vs 71 years, P = .01) and had higher rates of hypertension (64.8% vs 59.6%, P = .003) and asthma (12.9% vs 10.7%, P = .049) but a lower rate of interstitial lung disease (3.3% vs 7.7%, P < .001). Sequential organ failure assessment scores at admission and the rates of other comorbidities were not significantly different between the 2 surges.

Oxygen Therapies
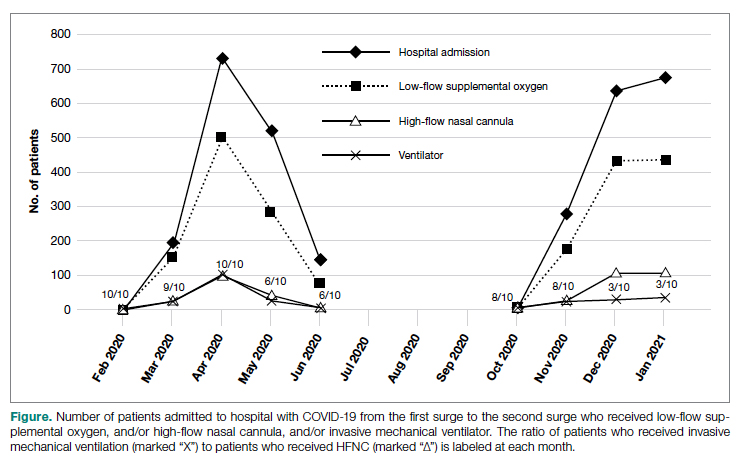
The number of patients who were hospitalized and received low-flow supplemental oxygen, and/or HFNC, and/or ventilator in the first surge and the second surge is shown in the Figure. Of all patients included, 2067 (64.9%) received low-flow supplemental oxygen; of these, 374 (18.1%) subsequently received HFNC, and 85 (22.7%) of these subsequently received mechanical ventilation. Of all 3183 patients, 417 (13.1%) received HFNC; 43 of these patients received HFNC without receiving low-flow supplemental oxygen, and 98 (23.5%) subsequently received mechanical ventilation. Out of all 3183 patients, 244 (7.7%) received mechanical ventilation; 98 (40.2%) of these received HFNC while the remaining 146 (59.8%) did not. At the beginning of the first surge, the ratio of patients who received invasive mechanical ventilation to patients who received HFNC was close to 1:1 (10/10); the ratio decreased to 6:10 in May and June 2020. At the beginning of the second surge, the ratio was 8:10 and then decreased to 3:10 in December 2020 and January 2021.
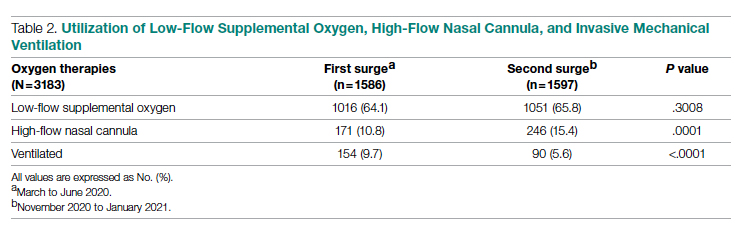
As shown in Table 2, the proportion of patients who received low-flow supplemental oxygen during the second surge was similar to that during the first surge (65.8% vs 64.1%, P = .3). Patients admitted during the second surge were more likely to receive HFNC than patients admitted during the first surge (15.4% vs 10.8%, P = .0001). Patients admitted during the second surge were less likely to be ventilated than the patients admitted during the first surge (5.6% vs 9.7%, P < .0001).
Clinical Outcomes
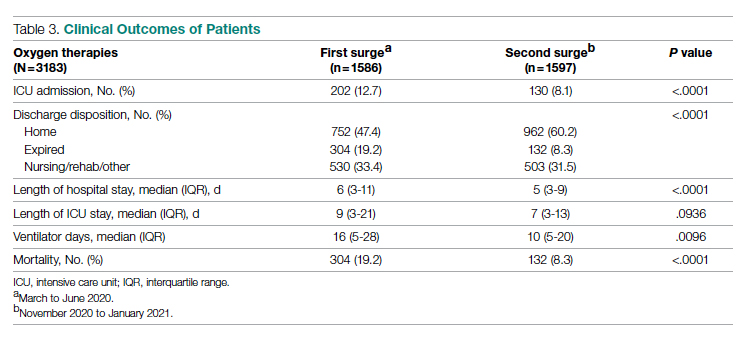
As shown in Table 3, second surge outcomes were much better than first surge outcomes: the ICU admission rate was lower (8.1% vs 12.7%, P < .0001); patients were more likely to be discharged to home (60.2% vs 47.4%, P < .0001), had a shorter length of hospital stay (5 vs 6 days, P < .0001), and had fewer ventilator days (10 vs 16, P = .01); and mortality was lower (8.3% vs 19.2%, P < .0001). There was a trend that length of ICU stay was shorter during the second surge than during the first surge (7 days vs 9 days, P = .09).
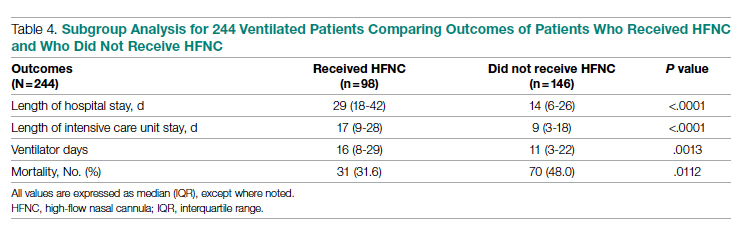
As noted (Figure), the ratio of patients who received invasive mechanical ventilation to patients who received HFNC was decreasing during both the first surge and the second surge. To further analyze the relation between ventilator and HFNC, we performed a subgroup analysis for 244 ventilated patients during both surges to compare outcomes between patients who received HFNC and those who did not receive HFNC (Table 4). Ninety-eight (40%) patients received HFNC. Ventilated patients who received HFNC had lower mortality than those patients who did not receive HFNC (31.6% vs 48%, P = .01), but had a longer length of hospital stay (29 days vs 14 days, P < .0001), longer length of ICU stay (17 days vs 9 days, P < .0001), and a higher number of ventilator days (16 vs 11, P = .001).
Discussion
Our study compared the baseline patient characteristics; utilization of low-flow supplemental oxygen therapy, HFNC, and mechanical ventilation; and clinical outcomes between the first surge (n = 1586) and the second surge (n = 1597) of the COVID-19 pandemic. During both surges, about two-thirds of admitted patients received low-flow supplemental oxygen. A higher proportion of the admitted patients received HFNC during the second surge than during the first surge, while the intubation rate was lower during the second surge than during the first surge.
Reported low-flow supplemental oxygen use ranged from 28% to 63% depending on the cohort characteristics and location during the first surge.6,7,19 A report from New York during the first surge (March 1 to April 4, 2020) showed that among 5700 hospitalized patients with COVID-19, 27.8% received low-flow supplemental oxygen.7 HFNC is recommended in guidelines on management of patients with acute respiratory failure due to COVID-19.20 In our study, HFNC was utilized in a higher proportion of patients admitted for COVID-19 during the second surge (15.5% vs 10.8%, P = .0001). During the early pandemic period in Wuhan, China, 11% to 21% of admitted COVID-19 patients received HFNC.21,22 Utilization of HFNC in New York during the first surge (March to May 2020) varied from 5% to 14.3% of patients admitted with COVID-19.23,24 Our subgroup analysis of the ventilated patients showed that patients who received HFNC had lower mortality than those who did not (31.6% vs 48.0%, P = .011). Comparably, a report from Paris, France, showed that among patients admitted to ICUs for acute hypoxemic respiratory failure, those who received HFNC had lower mortality at day 60 than those who did not (21% vs 31%, P = .052).25 Our recent analysis showed that patients treated with HFNC prior to mechanical ventilation had lower mortality than those treated with only conventional oxygen (30% vs 52%, P = .05).26 In this subgroup analysis, we could not determine if HFNC treatment was administered before or after ventilation because HFNC was entered as dichotomous data (“Yes” or “No”) in the registry database. We merely showed the beneficial effect of HFNC on reducing mortality for ventilated COVID-19 patients, but did not mean to focus on how and when to apply HFNC.
We observed that the patients admitted during the second surge were less likely to be ventilated than the patients admitted during the first surge (5.6% vs 9.7%, P < .0001). During the first surge in New York, among 5700 patients admitted with COVID-19, 12.2% received invasive mechanical ventilation.7 In another report, also from New York during the first surge, 26.1% of 2015 hospitalized COVID-19 patients received mechanical ventilation.27 In our study, the ventilation rate of 9.7% during the first surge was lower.
Outcomes during the second surge were better than during the first surge, including ICU admission rate, hospital and ICU length of stay, ventilator days, and mortality. The mortality was 19.2% during the first surge vs 8.3% during the second surge (P < .0001). The mortality of 19.2% was lower than the 30.6% mortality reported for 2015 hospitalized COVID-19 patients in New York during the first surge.27 A retrospective study showed that early administration of remdesivir was associated with reduced ICU admission, ventilation use, and mortality.28 The RECOVERY clinical trial showed that dexamethasone improved mortality for COVID-19 patients who received respiratory support, but not for patients who did not receive any respiratory support.29 Perhaps some, if not all, of the improvement in ICU admission and mortality during the second surge was attributed to the new medications, such as antivirals and steroids.
The length of hospital stay for patients with moderate to severe COVID-19 varied from 4 to 53 days at different locations of the world, as shown in a meta-analysis by Rees and colleagues.30 Our results showing a length of stay of 6 days during the first surge and 5 days during the second surge fell into the shorter end of this range. In a retrospective analysis of 1643 adults with severe COVID-19 admitted to hospitals in New York City between March 9, 2020 and April 23, 2020, median hospital length of stay was 7 (IQR, 3-14) days.31 For the ventilated patients in our study, the length of stay of 14 days (did not receive HFNC) and 29 days (received HFNC) was much longer. This longer length of stay might be attributed to the patients in our study being older and having more severe comorbidities.
The main purpose of this study was to compare the oxygen therapies and outcomes between 2 surges. It is difficult to associate the clinical outcomes with the oxygen therapies because new therapies and medications were available after the first surge. It was not possible to adjust the outcomes with confounders (other therapies and medications) because the registry data did not include the new therapies and medications.
A strength of this study was that we included a large, balanced number of patients in the first surge and the second surge. We did not plan the sample size in both groups as we could not predict the number of admissions. We set the end date of data collection for analysis as the time when the number of patients admitted during the second surge was similar to the number of patients admitted during the first surge. A limitation was that the registry database was created by the institution and was not designed solely for this study. The data for oxygen therapies were limited to low-flow supplemental oxygen, HFNC, and invasive mechanical ventilation; data for noninvasive ventilation were not included.
Conclusion
At our centers, during the second surge of COVID-19 pandemic, patients hospitalized with COVID-19 infection were more likely to receive HFNC but less likely to be ventilated. Compared to the first surge, the hospitalized patients with COVID-19 infection had a lower ICU admission rate, shorter length of hospital stay, fewer ventilator days, and lower mortality. For ventilated patients, those who received HFNC had lower mortality than those who did not.
Corresponding author: Timothy N. Liesching, MD, 41 Mall Road, Burlington, MA 01805; [email protected]
Disclosures: None reported.
doi:10.12788/jcom.0086
1. Xie J, Covassin N, Fan Z, et al. Association between hypoxemia and mortality in patients with COVID-19. Mayo Clin Proc. 2020;95(6):1138-1147. doi:10.1016/j.mayocp.2020.04.006
2. Asleh R, Asher E, Yagel O, et al. Predictors of hypoxemia and related adverse outcomes in patients hospitalized with COVID-19: a double-center retrospective study. J Clin Med. 2021;10(16):3581. doi:10.3390/jcm10163581
3. Choi KJ, Hong HL, Kim EJ. Association between oxygen saturation/fraction of inhaled oxygen and mortality in patients with COVID-19 associated pneumonia requiring oxygen therapy. Tuberc Respir Dis (Seoul). 2021;84(2):125-133. doi:10.4046/trd.2020.0126
4. Dixit SB. Role of noninvasive oxygen therapy strategies in COVID-19 patients: Where are we going? Indian J Crit Care Med. 2020;24(10):897-898. doi:10.5005/jp-journals-10071-23625
5. Gonzalez-Castro A, Fajardo Campoverde A, Medina A, et al. Non-invasive mechanical ventilation and high-flow oxygen therapy in the COVID-19 pandemic: the value of a draw. Med Intensiva (Engl Ed). 2021;45(5):320-321. doi:10.1016/j.medine.2021.04.001
6. Pan W, Li J, Ou Y, et al. Clinical outcome of standardized oxygen therapy nursing strategy in COVID-19. Ann Palliat Med. 2020;9(4):2171-2177. doi:10.21037/apm-20-1272
7. Richardson S, Hirsch JS, Narasimhan M, et al. Presenting characteristics, comorbidities, and outcomes among 5700 patients hospitalized with COVID-19 in the New York City area. JAMA. 2020;323(20):2052-2059. doi:10.1001/jama.2020.6775
8. He G, Han Y, Fang Q, et al. Clinical experience of high-flow nasal cannula oxygen therapy in severe COVID-19 patients. Article in Chinese. Zhejiang Da Xue Xue Bao Yi Xue Ban. 2020;49(2):232-239. doi:10.3785/j.issn.1008-9292.2020.03.13
9. Lalla U, Allwood BW, Louw EH, et al. The utility of high-flow nasal cannula oxygen therapy in the management of respiratory failure secondary to COVID-19 pneumonia. S Afr Med J. 2020;110(6):12941.
10. Zhang TT, Dai B, Wang W. Should the high-flow nasal oxygen therapy be used or avoided in COVID-19? J Transl Int Med. 2020;8(2):57-58. doi:10.2478/jtim-2020-0018
11. Agarwal A, Basmaji J, Muttalib F, et al. High-flow nasal cannula for acute hypoxemic respiratory failure in patients with COVID-19: systematic reviews of effectiveness and its risks of aerosolization, dispersion, and infection transmission. Can J Anaesth. 2020;67(9):1217-1248. doi:10.1007/s12630-020-01740-2
12. Geng S, Mei Q, Zhu C, et al. High flow nasal cannula is a good treatment option for COVID-19. Heart Lung. 2020;49(5):444-445. doi:10.1016/j.hrtlng.2020.03.018
13. Feinstein MM, Niforatos JD, Hyun I, et al. Considerations for ventilator triage during the COVID-19 pandemic. Lancet Respir Med. 2020;8(6):e53. doi:10.1016/S2213-2600(20)30192-2
14. Wu Z, McGoogan JM. Characteristics of and important lessons from the coronavirus disease 2019 (COVID-19) outbreak in China: summary of a report of 72314 cases from the Chinese Center for Disease Control and Prevention. JAMA. 2020;323(13):1239-1242. doi:10.1001/jama.2020.2648
15. Rojas-Marte G, Hashmi AT, Khalid M, et al. Outcomes in patients with COVID-19 disease and high oxygen requirements. J Clin Med Res. 2021;13(1):26-37. doi:10.14740/jocmr4405
16. Zhang R, Mylonakis E. In inpatients with COVID-19, none of remdesivir, hydroxychloroquine, lopinavir, or interferon β-1a differed from standard care for in-hospital mortality. Ann Intern Med. 2021;174(2):JC17. doi:10.7326/ACPJ202102160-017
17. Rello J, Waterer GW, Bourdiol A, Roquilly A. COVID-19, steroids and other immunomodulators: The jigsaw is not complete. Anaesth Crit Care Pain Med. 2020;39(6):699-701. doi:10.1016/j.accpm.2020.10.011
18. Dargin J, Stempek S, Lei Y, Gray Jr. A, Liesching T. The effect of a tiered provider staffing model on patient outcomes during the coronavirus disease 2019 pandemic: A single-center observational study. Int J Crit Illn Inj Sci. 2021;11(3). doi:10.4103/ijciis.ijciis_37_21
19. Ni YN, Wang T, Liang BM, Liang ZA. The independent factors associated with oxygen therapy in COVID-19 patients under 65 years old. PLoS One. 2021;16(1):e0245690. doi:10.1371/journal.pone.0245690
20. Alhazzani W, Moller MH, Arabi YM, et al. Surviving Sepsis Campaign: guidelines on the management of critically ill adults with coronavirus disease 2019 (COVID-19). Crit Care Med. 2020;48(6):e440-e469. doi:10.1097/CCM.0000000000004363
21. Wang D, Hu B, Hu C, et al. Clinical characteristics of 138 hospitalized patients with 2019 novel coronavirus-infected pneumonia in Wuhan, China. JAMA. 2020;323(11):1061-1069. doi:10.1001/jama.2020.1585
22. Zhou F, Yu T, Du R, et al. Clinical course and risk factors for mortality of adult inpatients with COVID-19 in Wuhan, China: a retrospective cohort study. Lancet. 2020;395(10229):1054-1062. doi:10.1016/S0140-6736(20)30566-3
23. Argenziano MG, Bruce SL, Slater CL, et al. Characterization and clinical course of 1000 patients with coronavirus disease 2019 in New York: retrospective case series. BMJ. 2020;369:m1996. doi:10.1136/bmj.m1996
24. Cummings MJ, Baldwin MR, Abrams D, et al. Epidemiology, clinical course, and outcomes of critically ill adults with COVID-19 in New York City: a prospective cohort study. Lancet. 2020;395(10239):1763-1770. doi:10.1016/S0140-6736(20)31189-2
25. Demoule A, Vieillard Baron A, Darmon M, et al. High-flow nasal cannula in critically ill patients with severe COVID-19. Am J Respir Crit Care Med. 2020;202(7):1039-1042. doi:10.1164/rccm.202005-2007LE
26. Hansen CK, Stempek S, Liesching T, Lei Y, Dargin J. Characteristics and outcomes of patients receiving high flow nasal cannula therapy prior to mechanical ventilation in COVID-19 respiratory failure: a prospective observational study. Int J Crit Illn Inj Sci. 2021;11(2):56-60. doi:10.4103/IJCIIS.IJCIIS_181_20
27. van Gerwen M, Alsen M, Little C, et al. Risk factors and outcomes of COVID-19 in New York City; a retrospective cohort study. J Med Virol. 2021;93(2):907-915. doi:10.1002/jmv.26337
28. Hussain Alsayed HA, Saheb Sharif-Askari F, Saheb Sharif-Askari N, Hussain AAS, Hamid Q, Halwani R. Early administration of remdesivir to COVID-19 patients associates with higher recovery rate and lower need for ICU admission: A retrospective cohort study. PLoS One. 2021;16(10):e0258643. doi:10.1371/journal.pone.0258643
29. RECOVERY Collaborative Group, Horby P, Lim WS, et al. Dexamethasone in hospitalized patients with Covid-19. N Engl J Med. 2021;384(8):693-704. doi:10.1056/NEJMoa2021436
30. Rees EM, Nightingale ES, Jafari Y, et al. COVID-19 length of hospital stay: a systematic review and data synthesis. BMC Med. 2020;18(1):270. doi:10.1186/s12916-020-01726-3
31. Anderson M, Bach P, Baldwin MR. Hospital length of stay for severe COVID-19: implications for Remdesivir’s value. medRxiv. 2020;2020.08.10.20171637. doi:10.1101/2020.08.10.20171637
From Lahey Hospital and Medical Center, Burlington, MA (Drs. Liesching and Lei), and Tufts University School of Medicine, Boston, MA (Dr. Liesching)
ABSTRACT
Objective: To compare the utilization of oxygen therapies and clinical outcomes of patients admitted for COVID-19 during the second surge of the pandemic to that of patients admitted during the first surge.
Design: Observational study using a registry database.
Setting: Three hospitals (791 inpatient beds and 76 intensive care unit [ICU] beds) within the Beth Israel Lahey Health system in Massachusetts.
Participants: We included 3183 patients with COVID-19 admitted to hospitals.
Measurements: Baseline data included demographics and comorbidities. Treatments included low-flow supplemental oxygen (2-6 L/min), high-flow oxygen via nasal cannula, and invasive mechanical ventilation. Outcomes included ICU admission, length of stay, ventilator days, and mortality.
Results: A total of 3183 patients were included: 1586 during the first surge and 1597 during the second surge. Compared to the first surge, patients admitted during the second surge had a similar rate of receiving low-flow supplemental oxygen (65.8% vs 64.1%, P = .3), a higher rate of receiving high-flow nasal cannula (15.4% vs 10.8%, P = .0001), and a lower ventilation rate (5.6% vs 9.7%, P < .0001). The outcomes during the second surge were better than those during the first surge: lower ICU admission rate (8.1% vs 12.7%, P < .0001), shorter length of hospital stay (5 vs 6 days, P < .0001), fewer ventilator days (10 vs 16, P = .01), and lower mortality (8.3% vs 19.2%, P < .0001). Among ventilated patients, those who received high-flow nasal cannula had lower mortality.
Conclusion: Compared to the first surge of the COVID-19 pandemic, patients admitted during the second surge had similar likelihood of receiving low-flow supplemental oxygen, were more likely to receive high-flow nasal cannula, were less likely to be ventilated, and had better outcomes.
Keywords: supplemental oxygen, high-flow nasal cannula, ventilator.
The respiratory system receives the major impact of SARS-CoV-2 virus, and hypoxemia has been the predominant diagnosis for patients hospitalized with COVID-19.1,2 During the initial stage of the pandemic, oxygen therapies and mechanical ventilation were the only choices for these patients.3-6 Standard-of-care treatment for patients with COVID-19 during the initial surge included oxygen therapies and mechanical ventilation for hypoxemia and medications for comorbidities and COVID-19–associated sequelae, such as multi-organ dysfunction and failure. A report from New York during the first surge (May 2020) showed that among 5700 hospitalized patients with COVID-19, 27.8% received supplemental oxygen and 12.2% received invasive mechanical ventilation.7 High-flow nasal cannula (HFNC) oxygen delivery has been utilized widely throughout the pandemic due to its superiority over other noninvasive respiratory support techniques.8-12 Mechanical ventilation is always necessary for critically ill patients with acute respiratory distress syndrome. However, ventilator scarcity has become a bottleneck in caring for severely ill patients with COVID-19 during the pandemic.13
The clinical outcomes of hospitalized COVID-19 patients include a high intubation rate, long length of hospital and intensive care unit (ICU) stay, and high mortality.14,15 As the pandemic evolved, new medications, including remdesivir, hydroxychloroquine, lopinavir, or interferon β-1a, were used in addition to the standard of care, but these did not result in significantly different mortality from standard of care.16 Steroids are becoming foundational to the treatment of severe COVID-19 pneumonia, but evidence from high-quality randomized controlled clinical trials is lacking.17
During the first surge from March to May 2020, Massachusetts had the third highest number of COVID-19 cases among states in the United States.18 In early 2021, COVID-19 cases were climbing close to the peak of the second surge in Massachusetts. In this study, we compared utilization of low-flow supplemental oxygen, HFNC, and mechanical ventilation and clinical outcomes of patients admitted to 3 hospitals in Massachusetts during the second surge of the pandemic to that of patients admitted during the first surge.
Methods
Setting
Beth Israel Lahey Health is a system of academic and teaching hospitals with primary care and specialty care providers. We included 3 centers within the Beth Israel Lahey Health system in Massachusetts: Lahey Hospital and Medical Center, with 335 inpatient hospital beds and 52 critical care beds; Beverly Hospital, with 227 beds and 14 critical care beds; and Winchester Hospital, with 229 beds and 10 ICU beds.
Participants
We included patients admitted to the 3 hospitals with COVID-19 as a primary or secondary diagnosis during the first surge of the pandemic (March 1, 2020 to June 15, 2020) and the second surge (November 15, 2020 to January 27, 2021). The timeframe of the first surge was defined as the window between the start date and the end date of data collection. During the time window of the first surge, 1586 patients were included. The start time of the second surge was defined as the date when the data collection was restarted; the end date was set when the number of patients (1597) accumulated was close to the number of patients in the first surge (1586), so that the two groups had similar sample size.
Study Design
A data registry of COVID-19 patients was created by our institution, and the data were prospectively collected starting in March 2020. We retrospectively extracted data on the following from the registry database for this observational study: demographics and baseline comorbidities; the use of low-flow supplemental oxygen, HFNC, and invasive mechanical ventilator; and ICU admission, length of hospital stay, length of ICU stay, and hospital discharge disposition. Start and end times for each oxygen therapy were not entered in the registry. Data about other oxygen therapies, such as noninvasive positive-pressure ventilation, were not collected in the registry database, and therefore were not included in the analysis.
Statistical Analysis
Continuous variables (eg, age) were tested for data distribution normality using the Shapiro-Wilk test. Normally distributed data were tested using unpaired t-tests and displayed as mean (SD). The skewed data were tested using the Wilcoxon rank sum test and displayed as median (interquartile range [IQR]). The categorical variables were compared using chi-square test. Comparisons with P ≤ .05 were considered significantly different. Statistical analysis for this study was generated using Statistical Analysis Software (SAS), version 9.4 for Windows (SAS Institute Inc.).
Results
Baseline Characteristics
We included 3183 patients: 1586 admitted during the first surge and 1597 admitted during the second surge. Baseline characteristics of patients with COVID-19 admitted during the first and second surges are shown in Table 1. Patients admitted during the second surge were older (73 years vs 71 years, P = .01) and had higher rates of hypertension (64.8% vs 59.6%, P = .003) and asthma (12.9% vs 10.7%, P = .049) but a lower rate of interstitial lung disease (3.3% vs 7.7%, P < .001). Sequential organ failure assessment scores at admission and the rates of other comorbidities were not significantly different between the 2 surges.
Oxygen Therapies
The number of patients who were hospitalized and received low-flow supplemental oxygen, and/or HFNC, and/or ventilator in the first surge and the second surge is shown in the Figure. Of all patients included, 2067 (64.9%) received low-flow supplemental oxygen; of these, 374 (18.1%) subsequently received HFNC, and 85 (22.7%) of these subsequently received mechanical ventilation. Of all 3183 patients, 417 (13.1%) received HFNC; 43 of these patients received HFNC without receiving low-flow supplemental oxygen, and 98 (23.5%) subsequently received mechanical ventilation. Out of all 3183 patients, 244 (7.7%) received mechanical ventilation; 98 (40.2%) of these received HFNC while the remaining 146 (59.8%) did not. At the beginning of the first surge, the ratio of patients who received invasive mechanical ventilation to patients who received HFNC was close to 1:1 (10/10); the ratio decreased to 6:10 in May and June 2020. At the beginning of the second surge, the ratio was 8:10 and then decreased to 3:10 in December 2020 and January 2021.
As shown in Table 2, the proportion of patients who received low-flow supplemental oxygen during the second surge was similar to that during the first surge (65.8% vs 64.1%, P = .3). Patients admitted during the second surge were more likely to receive HFNC than patients admitted during the first surge (15.4% vs 10.8%, P = .0001). Patients admitted during the second surge were less likely to be ventilated than the patients admitted during the first surge (5.6% vs 9.7%, P < .0001).
Clinical Outcomes
As shown in Table 3, second surge outcomes were much better than first surge outcomes: the ICU admission rate was lower (8.1% vs 12.7%, P < .0001); patients were more likely to be discharged to home (60.2% vs 47.4%, P < .0001), had a shorter length of hospital stay (5 vs 6 days, P < .0001), and had fewer ventilator days (10 vs 16, P = .01); and mortality was lower (8.3% vs 19.2%, P < .0001). There was a trend that length of ICU stay was shorter during the second surge than during the first surge (7 days vs 9 days, P = .09).
As noted (Figure), the ratio of patients who received invasive mechanical ventilation to patients who received HFNC was decreasing during both the first surge and the second surge. To further analyze the relation between ventilator and HFNC, we performed a subgroup analysis for 244 ventilated patients during both surges to compare outcomes between patients who received HFNC and those who did not receive HFNC (Table 4). Ninety-eight (40%) patients received HFNC. Ventilated patients who received HFNC had lower mortality than those patients who did not receive HFNC (31.6% vs 48%, P = .01), but had a longer length of hospital stay (29 days vs 14 days, P < .0001), longer length of ICU stay (17 days vs 9 days, P < .0001), and a higher number of ventilator days (16 vs 11, P = .001).
Discussion
Our study compared the baseline patient characteristics; utilization of low-flow supplemental oxygen therapy, HFNC, and mechanical ventilation; and clinical outcomes between the first surge (n = 1586) and the second surge (n = 1597) of the COVID-19 pandemic. During both surges, about two-thirds of admitted patients received low-flow supplemental oxygen. A higher proportion of the admitted patients received HFNC during the second surge than during the first surge, while the intubation rate was lower during the second surge than during the first surge.
Reported low-flow supplemental oxygen use ranged from 28% to 63% depending on the cohort characteristics and location during the first surge.6,7,19 A report from New York during the first surge (March 1 to April 4, 2020) showed that among 5700 hospitalized patients with COVID-19, 27.8% received low-flow supplemental oxygen.7 HFNC is recommended in guidelines on management of patients with acute respiratory failure due to COVID-19.20 In our study, HFNC was utilized in a higher proportion of patients admitted for COVID-19 during the second surge (15.5% vs 10.8%, P = .0001). During the early pandemic period in Wuhan, China, 11% to 21% of admitted COVID-19 patients received HFNC.21,22 Utilization of HFNC in New York during the first surge (March to May 2020) varied from 5% to 14.3% of patients admitted with COVID-19.23,24 Our subgroup analysis of the ventilated patients showed that patients who received HFNC had lower mortality than those who did not (31.6% vs 48.0%, P = .011). Comparably, a report from Paris, France, showed that among patients admitted to ICUs for acute hypoxemic respiratory failure, those who received HFNC had lower mortality at day 60 than those who did not (21% vs 31%, P = .052).25 Our recent analysis showed that patients treated with HFNC prior to mechanical ventilation had lower mortality than those treated with only conventional oxygen (30% vs 52%, P = .05).26 In this subgroup analysis, we could not determine if HFNC treatment was administered before or after ventilation because HFNC was entered as dichotomous data (“Yes” or “No”) in the registry database. We merely showed the beneficial effect of HFNC on reducing mortality for ventilated COVID-19 patients, but did not mean to focus on how and when to apply HFNC.
We observed that the patients admitted during the second surge were less likely to be ventilated than the patients admitted during the first surge (5.6% vs 9.7%, P < .0001). During the first surge in New York, among 5700 patients admitted with COVID-19, 12.2% received invasive mechanical ventilation.7 In another report, also from New York during the first surge, 26.1% of 2015 hospitalized COVID-19 patients received mechanical ventilation.27 In our study, the ventilation rate of 9.7% during the first surge was lower.
Outcomes during the second surge were better than during the first surge, including ICU admission rate, hospital and ICU length of stay, ventilator days, and mortality. The mortality was 19.2% during the first surge vs 8.3% during the second surge (P < .0001). The mortality of 19.2% was lower than the 30.6% mortality reported for 2015 hospitalized COVID-19 patients in New York during the first surge.27 A retrospective study showed that early administration of remdesivir was associated with reduced ICU admission, ventilation use, and mortality.28 The RECOVERY clinical trial showed that dexamethasone improved mortality for COVID-19 patients who received respiratory support, but not for patients who did not receive any respiratory support.29 Perhaps some, if not all, of the improvement in ICU admission and mortality during the second surge was attributed to the new medications, such as antivirals and steroids.
The length of hospital stay for patients with moderate to severe COVID-19 varied from 4 to 53 days at different locations of the world, as shown in a meta-analysis by Rees and colleagues.30 Our results showing a length of stay of 6 days during the first surge and 5 days during the second surge fell into the shorter end of this range. In a retrospective analysis of 1643 adults with severe COVID-19 admitted to hospitals in New York City between March 9, 2020 and April 23, 2020, median hospital length of stay was 7 (IQR, 3-14) days.31 For the ventilated patients in our study, the length of stay of 14 days (did not receive HFNC) and 29 days (received HFNC) was much longer. This longer length of stay might be attributed to the patients in our study being older and having more severe comorbidities.
The main purpose of this study was to compare the oxygen therapies and outcomes between 2 surges. It is difficult to associate the clinical outcomes with the oxygen therapies because new therapies and medications were available after the first surge. It was not possible to adjust the outcomes with confounders (other therapies and medications) because the registry data did not include the new therapies and medications.
A strength of this study was that we included a large, balanced number of patients in the first surge and the second surge. We did not plan the sample size in both groups as we could not predict the number of admissions. We set the end date of data collection for analysis as the time when the number of patients admitted during the second surge was similar to the number of patients admitted during the first surge. A limitation was that the registry database was created by the institution and was not designed solely for this study. The data for oxygen therapies were limited to low-flow supplemental oxygen, HFNC, and invasive mechanical ventilation; data for noninvasive ventilation were not included.
Conclusion
At our centers, during the second surge of COVID-19 pandemic, patients hospitalized with COVID-19 infection were more likely to receive HFNC but less likely to be ventilated. Compared to the first surge, the hospitalized patients with COVID-19 infection had a lower ICU admission rate, shorter length of hospital stay, fewer ventilator days, and lower mortality. For ventilated patients, those who received HFNC had lower mortality than those who did not.
Corresponding author: Timothy N. Liesching, MD, 41 Mall Road, Burlington, MA 01805; [email protected]
Disclosures: None reported.
doi:10.12788/jcom.0086
1. Xie J, Covassin N, Fan Z, et al. Association between hypoxemia and mortality in patients with COVID-19. Mayo Clin Proc. 2020;95(6):1138-1147. doi:10.1016/j.mayocp.2020.04.006
2. Asleh R, Asher E, Yagel O, et al. Predictors of hypoxemia and related adverse outcomes in patients hospitalized with COVID-19: a double-center retrospective study. J Clin Med. 2021;10(16):3581. doi:10.3390/jcm10163581
3. Choi KJ, Hong HL, Kim EJ. Association between oxygen saturation/fraction of inhaled oxygen and mortality in patients with COVID-19 associated pneumonia requiring oxygen therapy. Tuberc Respir Dis (Seoul). 2021;84(2):125-133. doi:10.4046/trd.2020.0126
4. Dixit SB. Role of noninvasive oxygen therapy strategies in COVID-19 patients: Where are we going? Indian J Crit Care Med. 2020;24(10):897-898. doi:10.5005/jp-journals-10071-23625
5. Gonzalez-Castro A, Fajardo Campoverde A, Medina A, et al. Non-invasive mechanical ventilation and high-flow oxygen therapy in the COVID-19 pandemic: the value of a draw. Med Intensiva (Engl Ed). 2021;45(5):320-321. doi:10.1016/j.medine.2021.04.001
6. Pan W, Li J, Ou Y, et al. Clinical outcome of standardized oxygen therapy nursing strategy in COVID-19. Ann Palliat Med. 2020;9(4):2171-2177. doi:10.21037/apm-20-1272
7. Richardson S, Hirsch JS, Narasimhan M, et al. Presenting characteristics, comorbidities, and outcomes among 5700 patients hospitalized with COVID-19 in the New York City area. JAMA. 2020;323(20):2052-2059. doi:10.1001/jama.2020.6775
8. He G, Han Y, Fang Q, et al. Clinical experience of high-flow nasal cannula oxygen therapy in severe COVID-19 patients. Article in Chinese. Zhejiang Da Xue Xue Bao Yi Xue Ban. 2020;49(2):232-239. doi:10.3785/j.issn.1008-9292.2020.03.13
9. Lalla U, Allwood BW, Louw EH, et al. The utility of high-flow nasal cannula oxygen therapy in the management of respiratory failure secondary to COVID-19 pneumonia. S Afr Med J. 2020;110(6):12941.
10. Zhang TT, Dai B, Wang W. Should the high-flow nasal oxygen therapy be used or avoided in COVID-19? J Transl Int Med. 2020;8(2):57-58. doi:10.2478/jtim-2020-0018
11. Agarwal A, Basmaji J, Muttalib F, et al. High-flow nasal cannula for acute hypoxemic respiratory failure in patients with COVID-19: systematic reviews of effectiveness and its risks of aerosolization, dispersion, and infection transmission. Can J Anaesth. 2020;67(9):1217-1248. doi:10.1007/s12630-020-01740-2
12. Geng S, Mei Q, Zhu C, et al. High flow nasal cannula is a good treatment option for COVID-19. Heart Lung. 2020;49(5):444-445. doi:10.1016/j.hrtlng.2020.03.018
13. Feinstein MM, Niforatos JD, Hyun I, et al. Considerations for ventilator triage during the COVID-19 pandemic. Lancet Respir Med. 2020;8(6):e53. doi:10.1016/S2213-2600(20)30192-2
14. Wu Z, McGoogan JM. Characteristics of and important lessons from the coronavirus disease 2019 (COVID-19) outbreak in China: summary of a report of 72314 cases from the Chinese Center for Disease Control and Prevention. JAMA. 2020;323(13):1239-1242. doi:10.1001/jama.2020.2648
15. Rojas-Marte G, Hashmi AT, Khalid M, et al. Outcomes in patients with COVID-19 disease and high oxygen requirements. J Clin Med Res. 2021;13(1):26-37. doi:10.14740/jocmr4405
16. Zhang R, Mylonakis E. In inpatients with COVID-19, none of remdesivir, hydroxychloroquine, lopinavir, or interferon β-1a differed from standard care for in-hospital mortality. Ann Intern Med. 2021;174(2):JC17. doi:10.7326/ACPJ202102160-017
17. Rello J, Waterer GW, Bourdiol A, Roquilly A. COVID-19, steroids and other immunomodulators: The jigsaw is not complete. Anaesth Crit Care Pain Med. 2020;39(6):699-701. doi:10.1016/j.accpm.2020.10.011
18. Dargin J, Stempek S, Lei Y, Gray Jr. A, Liesching T. The effect of a tiered provider staffing model on patient outcomes during the coronavirus disease 2019 pandemic: A single-center observational study. Int J Crit Illn Inj Sci. 2021;11(3). doi:10.4103/ijciis.ijciis_37_21
19. Ni YN, Wang T, Liang BM, Liang ZA. The independent factors associated with oxygen therapy in COVID-19 patients under 65 years old. PLoS One. 2021;16(1):e0245690. doi:10.1371/journal.pone.0245690
20. Alhazzani W, Moller MH, Arabi YM, et al. Surviving Sepsis Campaign: guidelines on the management of critically ill adults with coronavirus disease 2019 (COVID-19). Crit Care Med. 2020;48(6):e440-e469. doi:10.1097/CCM.0000000000004363
21. Wang D, Hu B, Hu C, et al. Clinical characteristics of 138 hospitalized patients with 2019 novel coronavirus-infected pneumonia in Wuhan, China. JAMA. 2020;323(11):1061-1069. doi:10.1001/jama.2020.1585
22. Zhou F, Yu T, Du R, et al. Clinical course and risk factors for mortality of adult inpatients with COVID-19 in Wuhan, China: a retrospective cohort study. Lancet. 2020;395(10229):1054-1062. doi:10.1016/S0140-6736(20)30566-3
23. Argenziano MG, Bruce SL, Slater CL, et al. Characterization and clinical course of 1000 patients with coronavirus disease 2019 in New York: retrospective case series. BMJ. 2020;369:m1996. doi:10.1136/bmj.m1996
24. Cummings MJ, Baldwin MR, Abrams D, et al. Epidemiology, clinical course, and outcomes of critically ill adults with COVID-19 in New York City: a prospective cohort study. Lancet. 2020;395(10239):1763-1770. doi:10.1016/S0140-6736(20)31189-2
25. Demoule A, Vieillard Baron A, Darmon M, et al. High-flow nasal cannula in critically ill patients with severe COVID-19. Am J Respir Crit Care Med. 2020;202(7):1039-1042. doi:10.1164/rccm.202005-2007LE
26. Hansen CK, Stempek S, Liesching T, Lei Y, Dargin J. Characteristics and outcomes of patients receiving high flow nasal cannula therapy prior to mechanical ventilation in COVID-19 respiratory failure: a prospective observational study. Int J Crit Illn Inj Sci. 2021;11(2):56-60. doi:10.4103/IJCIIS.IJCIIS_181_20
27. van Gerwen M, Alsen M, Little C, et al. Risk factors and outcomes of COVID-19 in New York City; a retrospective cohort study. J Med Virol. 2021;93(2):907-915. doi:10.1002/jmv.26337
28. Hussain Alsayed HA, Saheb Sharif-Askari F, Saheb Sharif-Askari N, Hussain AAS, Hamid Q, Halwani R. Early administration of remdesivir to COVID-19 patients associates with higher recovery rate and lower need for ICU admission: A retrospective cohort study. PLoS One. 2021;16(10):e0258643. doi:10.1371/journal.pone.0258643
29. RECOVERY Collaborative Group, Horby P, Lim WS, et al. Dexamethasone in hospitalized patients with Covid-19. N Engl J Med. 2021;384(8):693-704. doi:10.1056/NEJMoa2021436
30. Rees EM, Nightingale ES, Jafari Y, et al. COVID-19 length of hospital stay: a systematic review and data synthesis. BMC Med. 2020;18(1):270. doi:10.1186/s12916-020-01726-3
31. Anderson M, Bach P, Baldwin MR. Hospital length of stay for severe COVID-19: implications for Remdesivir’s value. medRxiv. 2020;2020.08.10.20171637. doi:10.1101/2020.08.10.20171637
Characterizing Opioid Response in Older Veterans in the Post-Acute Setting
Older adults admitted to post-acute settings frequently have complex rehabilitation needs and multimorbidity, which predisposes them to pain management challenges.1,2 The prevalence of pain in post-acute and long-term care is as high as 65%, and opioid use is common among this population with 1 in 7 residents receiving long-term opioids.3,4
Opioids that do not adequately control pain represent a missed opportunity for deprescribing. There is limited evidence regarding efficacy of long-term opioid use (> 90 days) for improving pain and physical functioning.5 In addition, long-term opioid use carries significant risks, including overdose-related death, dependence, and increased emergency department visits.5 These risks are likely to be pronounced among veterans receiving post-acute care (PAC) who are older, have comorbid psychiatric disorders, are prescribed several centrally acting medications, and experience substance use disorder (SUD).6
Older adults are at increased risk for opioid toxicity because of reduced drug clearance and smaller therapeutic window.5 Centers for Disease Control and Prevention (CDC) guidelines recommend frequently assessing patients for benefit in terms of sustained improvement in pain as well as physical function.5 If pain and functional improvements are minimal, opioid use and nonopioid pain management strategies should be considered. Some patients will struggle with this approach. Directly asking patients about the effectiveness of opioids is challenging. Opioid users with chronic pain frequently report problems with opioids even as they describe them as indispensable for pain management.7,8
Earlier studies have assessed patient perspectives regarding opioid difficulties as well as their helpfulness, which could introduce recall bias. Patient-level factors that contribute to a global sense of distress, in addition to the presence of painful physical conditions, also could contribute to patients requesting opioids without experiencing adequate pain relief. One study in veterans residing in PAC facilities found that individuals with depression, posttraumatic stress disorder (PTSD), and SUD were more likely to report pain and receive scheduled analgesics; this effect persisted in individuals with PTSD even after adjusting for demographic and functional status variables.9 The study looked only at analgesics as a class and did not examine opioids specifically. It is possible that distressed individuals, such as those with uncontrolled depression, PTSD, and SUD, might be more likely to report high pain levels and receive opioids with inadequate benefit and increased risk. Identifying the primary condition causing distress and targeting treatment to that condition (ie, depression) is preferable to escalating opioids in an attempt to treat pain in the context of nonresponse. Assessing an individual’s aggregate response to opioids rather than relying on a single self-report is a useful addition to current pain management strategies.
The goal of this study was to pilot a method of identifying opioid-nonresponsive pain using administrative data, measure its prevalence in a PAC population of veterans, and explore clinical and demographic correlates with particular attention to variates that could indicate high levels of psychological and physical distress. Identifying pain that is poorly responsive to opioids would give clinicians the opportunity to avoid or minimize opioid use and prioritize treatments that are likely to improve the resident’s pain, quality of life, and physical function while minimizing recall bias. We hypothesized that pain that responds poorly to opioids would be prevalent among veterans residing in a PAC unit. We considered that veterans with pain poorly responsive to opioids would be more likely to have factors that would place them at increased risk of adverse effects, such as comorbid psychiatric conditions, history of SUD, and multimorbidity, providing further rationale for clinical equipoise in that population.6
Methods
This was a small, retrospective cross-sectional study using administrative data and chart review. The study included veterans who were administered opioids while residing in a single US Department of Veterans Affairs (VA) community living center PAC (CLC-PAC) unit during at least 1 of 4 nonconsecutive, random days in 2016 and 2017. The study was approved by the institutional review board of the Ann Arbor VA Health System (#2017-1034) as part of a larger project involving models of care in vulnerable older veterans.
Inclusion criteria were the presence of at least moderate pain (≥ 4 on a 0 to 10 scale); receiving ≥ 2 opioids ordered as needed over the prespecified 24-hour observation period; and having ≥ 2 pre-and postopioid administration pain scores during the observation period. Veterans who did not meet these criteria were excluded. At the time of initial sample selection, we did not capture information related to coprescribed analgesics, including a standing order of opioids. To obtain the sample, we initially characterized all veterans on the 4 days residing in the CLC-PAC unit as those reporting at least moderate pain (≥ 4) and those who reported no or mild pain (< 4). The cut point of 4 of 10 is consistent with moderate pain based on earlier work showing higher likelihood of pain that interferes with physical function.10 We then restricted the sample to veterans who received ≥ 2 opioids ordered as needed for pain and had ≥ 2 pre- and postopioid administration numeric pain rating scores during the 24-hour observation period. This methodology was chosen to enrich our sample for those who received opioids regularly for ongoing pain. Opioids were defined as full µ-opioid receptor agonists and included hydrocodone, oxycodone, morphine, hydromorphone, fentanyl, tramadol, and methadone.
Medication administration data were obtained from the VA corporate data warehouse, which houses all barcode medication administration data collected at the point of care. The dataset includes pain scores gathered by nursing staff before and after administering an as-needed analgesic. The corporate data warehouse records data/time of pain scores and the analgesic name, dosage, formulation, and date/time of administration. Using a standardized assessment form developed iteratively, we calculated opioid dosage in oral morphine equivalents (OME) for comparison.11,12 All abstracted data were reexamined for accuracy. Data initially were collected in an anonymized, blinded fashion. Participants were then unblinded for chart review. Initial data was captured in resident-days instead of unique residents because an individual resident might have been admitted on several observation days. We were primarily interested in how pain responded to opioids administered in response to resident request; therefore, we did not examine response to opioids that were continuously ordered (ie, scheduled). We did consider scheduled opioids when calculating total daily opioid dosage during the chart review.
Outcome of Interest
The primary outcome of interest was an individual’s response to as-needed opioids, which we defined as change in the pain score after opioid administration. The pre-opioid pain score was the score that immediately preceded administration of an as-needed opioid. The postopioid administration pain score was the first score after opioid administration if obtained within 3 hours of administration. Scores collected > 3 hours after opioid administration were excluded because they no longer accurately reflected the impact of the opioid due to the short half-lives. Observations were excluded if an opioid was administered without a recorded pain score; this occurred once for 6 individuals. Observations also were excluded if an opioid was administered but the data were captured on the following day (outside of the 24-hour window); this occurred once for 3 individuals.
We calculated a ∆ score by subtracting the postopioid pain rating score from the pre-opioid score. Individual ∆ scores were then averaged over the 24-hour period (range, 2-5 opioid doses). For example, if an individual reported a pre-opioid pain score of 10, and a postopioid pain score of 2, the ∆ was recorded as 8. If the individual’s next pre-opioid score was 10, and post-opioid score was 6, the ∆ was recorded as 4. ∆ scores over the 24-hour period were averaged together to determine that individual’s response to as-needed opioids. In the previous example, the mean ∆ score is 6. Lower mean ∆ scores reflect decreased responsiveness to opioids’ analgesic effect.
Demographic and clinical data were obtained from electronic health record review using a standardized assessment form. These data included information about medical and psychiatric comorbidities, specialist consultations, and CLC-PAC unit admission indications and diagnoses. Medications of interest were categorized as antidepressants, antipsychotics, benzodiazepines, muscle relaxants, hypnotics, stimulants, antiepileptic drugs/mood stabilizers (including gabapentin and pregabalin), and all adjuvant analgesics. Adjuvant analgesics were defined as medications administered for pain as documented by chart notes or those ordered as needed for pain, and analyzed as a composite variable. Antidepressants with analgesic properties (serotonin-norepinephrine reuptake inhibitors and tricyclic antidepressants) were considered adjuvant analgesics. Psychiatric information collected included presence of mood, anxiety, and psychotic disorders, and PTSD. SUD information was collected separately from other psychiatric disorders.
Analyses
The study population was described using tabulations for categorical data and means and standard deviations for continuous data. Responsiveness to opioids was analyzed as a continuous variable. Those with higher mean ∆ scores were considered to have pain relatively more responsive to opioids, while lower mean ∆ scores indicated pain less responsive to opioids. We constructed linear regression models controlling for average pre-opioid pain rating scores to explore associations between opioid responsiveness and variables of interest. All analyses were completed using Stata version 15. This study was not adequately powered to detect differences across the spectrum of opioid responsiveness, although the authors have reported differences in this article.
Results
Over the 4-day observational period there were 146 resident-days. Of these, 88 (60.3%) reported at least 1 pain score of ≥ 4. Of those, 61 (41.8%) received ≥ 1 as-needed opioid for pain. We identified 46 resident-days meeting study criteria of ≥ 2 pre- and postanalgesic scores. We identified 41 unique individuals (Figure 1). Two individuals were admitted to the CLC-PAC unit on 2 of the 4 observation days, and 1 individual was admitted to the CLC-PAC unit on 3 of the 4 observation days. For individuals admitted several days, we included data only from the initial observation day.
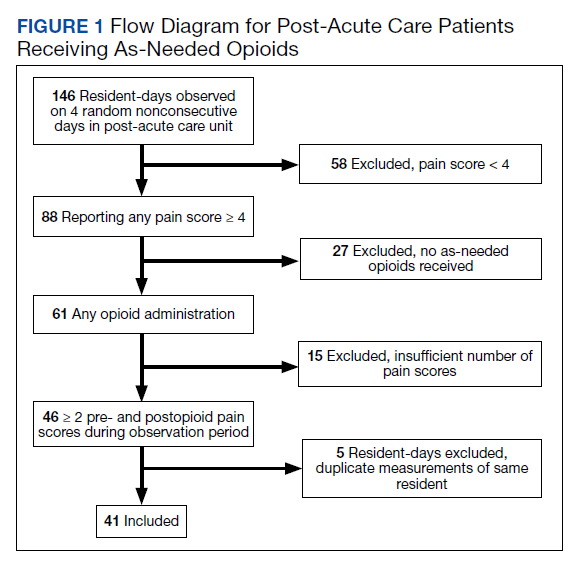
Response to opioids varied greatly in this sample. The mean (SD) ∆ pain score was 3.4 (1.6) and ranged from 0.5 to 6.3. Using linear regression, we found no relationship between admission indication, medical comorbidities (including active cancer), and opioid responsiveness (Table).
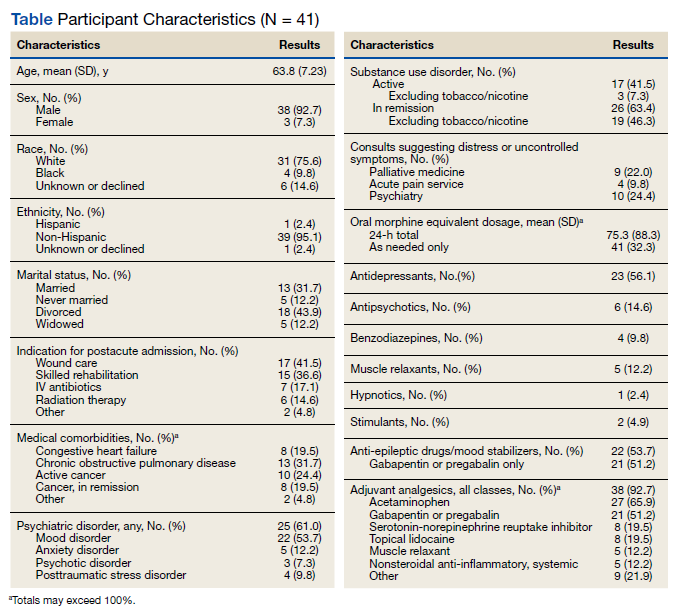
Psychiatric disorders were highly prevalent, with 25 individuals (61.0%) having ≥ 1 any psychiatric diagnosis identified on chart review. The presence of any psychiatric diagnosis was significantly associated with reduced responsiveness to opioids (β = −1.08; 95% CI, −2.04 to −0.13; P = .03). SUDs also were common, with 17 individuals (41.5%) having an active SUD; most were tobacco/nicotine. Twenty-six veterans (63.4%) had documentation of SUD in remission with 19 (46.3%) for substances other than tobacco/nicotine. There was no indication that any veteran in the sample was prescribed medication for opioid use disorder (OUD) at the time of observation. There was no relationship between opioid responsiveness and SUDs, neither active or in remission. Consults to other services that suggested distress or difficult-to-control symptoms also were frequent. Consults to the pain service were significantly associated with reduced responsiveness to opioids (β = −1.75; 95% CI, −3.33 to −0.17; P = .03). Association between psychiatry consultation and reduced opioid responsiveness trended toward significance (β = −0.95; 95% CI, −2.06 to 0.17; P = .09) (Figures 2 and 3). There was no significant association with palliative medicine consultation and opioid responsiveness.
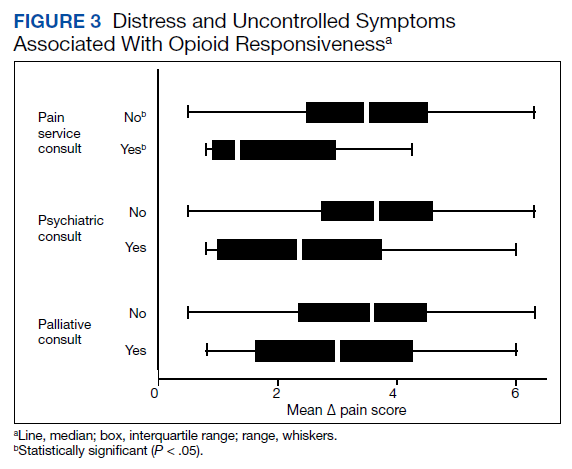
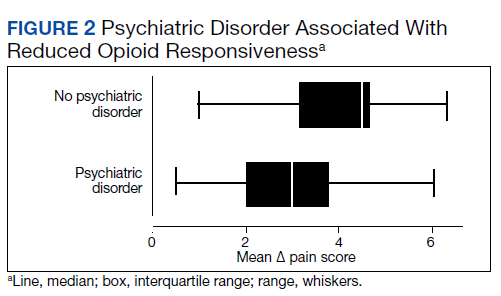
A poorer response to opioids was associated with a significantly higher as-needed opioid dosage (β = −0.02; 95% CI, −0.04 to −0.01; P = .002) as well as a trend toward higher total opioid dosage (β = −0.005; 95% CI, −0.01 to 0.0003; P = .06) (Figure 4). Thirty-eight (92.7%) participants received nonopioid adjuvant analgesics for pain. More than half (56.1%) received antidepressants or gabapentinoids (51.2%), although we did not assess whether they were prescribed for pain or another indication. We did not identify a relationship between any specific psychoactive drug class and opioid responsiveness in this sample.
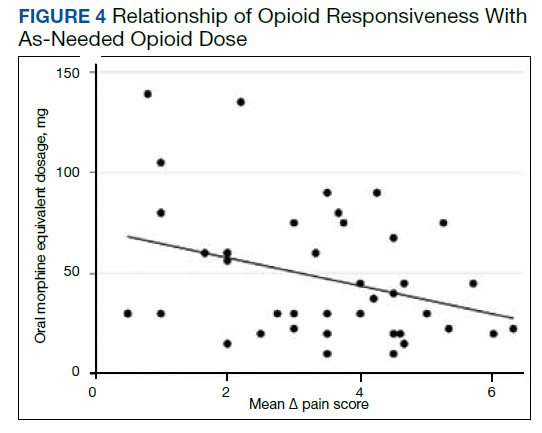
Discussion
This exploratory study used readily available administrative data in a CLC-PAC unit to assess responsiveness to opioids via a numeric mean ∆ score, with higher values indicating more pain relief in response to opioids. We then constructed linear regression models to characterize the relationship between the mean ∆ score and factors known to be associated with difficult-to-control pain and psychosocial distress. As expected, opioid responsiveness was highly variable among residents; some residents experienced essentially no reduction in pain, on average, despite receiving opioids. Psychiatric comorbidity, higher dosage in OMEs, and the presence of a pain service consult significantly correlated with poorer response to opioids. To our knowledge, this is the first study to quantify opioid responsiveness and describe the relationship with clinical correlates in the understudied PAC population.
Earlier research has demonstrated a relationship between the presence of psychiatric disorders and increased likelihood of receiving any analgesics among veterans residing in PAC.9 Our study adds to the literature by quantifying opioid response using readily available administrative data and examining associations with psychiatric diagnoses. These findings highlight the possibility that attempting to treat high levels of pain by escalating the opioid dosage in patients with a comorbid psychiatric diagnosis should be re-addressed, particularly if there is no meaningful pain reduction at lower opioid dosages. Our sample had a variety of admission diagnoses and medical comorbidities, however, we did not identify a relationship with opioid responsiveness, including an active cancer diagnosis. Although SUDs were highly prevalent in our sample, there was no relationship with opioid responsiveness. This suggests that lack of response to opioids is not merely a matter of drug tolerance or an indication of drug-seeking behavior.
Factors Impacting Response
Many factors could affect whether an individual obtains an adequate analgesic response to opioids or other pain medications, including variations in genes encoding opioid receptors and hepatic enzymes involved in drug metabolism and an individual’s opioid exposure history.13 The phenomenon of requiring more drug to produce the same relief after repeated exposures (ie, tolerance) is well known.14 Opioid-induced hyperalgesia is a phenomenon whereby a patient’s overall pain increases while receiving opioids, but each opioid dose might be perceived as beneficial.15 Increasingly, psychosocial distress is an important factor in opioid response. Adverse selection is the process culminating in those with psychosocial distress and/or SUDs being prescribed more opioids for longer durations.16 Our data suggests that this process could play a role in PAC settings. In addition, exaggerating pain to obtain additional opioids for nonmedical purposes, such as euphoria or relaxation, also is possible.17
When clinically assessing an individual whose pain is not well controlled despite escalating opioid dosages, prescribers must consider which of these factors likely is predominant. However, the first step of determining who has a poor opioid response is not straightforward. Directly asking patients is challenging; many individuals perceive opioids to be helpful while simultaneously reporting inadequately controlled pain.7,8 The primary value of this study is the possibility of providing prescribers a quick, simple method of assessing a patient’s response to opioids. Using this method, individuals who are responding poorly to opioids, including those who might exaggerate pain for secondary gain, could be identified. Health care professionals could consider revisiting pain management strategies, assess for the presence of OUD, or evaluate other contributors to inadequately controlled pain. Although we only collected data regarding response to opioids in this study, any pain medication administered as needed (ie, nonsteroidal anti-inflammatory drugs, acetaminophen) could be analyzed using this methodology, allowing identification of other helpful pain management strategies. We began the validation process with extensive chart review, but further validation is required before this method can be applied to routine clinical practice.
Patients who report uncontrolled pain despite receiving opioids are a clinically challenging population. The traditional strategy has been to escalate opioids, which is recommended by the World Health Organization stepladder approach for patients with cancer pain and limited life expectancy.18 Applying this approach to a general population of patients with chronic pain is ineffective and dangerous.19 The CDC and the VA/US Department of Defense (VA/DoD) guidelines both recommend carefully reassessing risks and benefits at total daily dosages > 50 OME and avoid increasing dosages to > 90 OME daily in most circumstances.5,20 Our finding that participants taking higher dosages of opioids were not more likely to have better control over their pain supports this recommendation.
Limitations
This study has several limitations, the most significant is its small sample size because of the exploratory nature of the project. Results are based on a small pilot sample enriched to include individuals with at least moderate pain who receive opioids frequently at 1 VA CLC-PAC unit; therefore, the results might not be representative of all veterans or a more general population. Our small sample size limits power to detect small differences. Data collected should be used to inform formal power calculations before subsequent larger studies to select adequate sample size. Validation studies, including samples from the same population using different dates, which reproduce findings are an important step. Moreover, we only had data on a single dimension of pain (intensity/severity), as measured by the pain scale, which nursing staff used to make a real-time clinical decision of whether to administer an as-needed opioid. Future studies should consider using pain measures that provide multidimensional assessment (ie, severity, functional interference) and/or were developed specifically for veterans, such as the Defense and Veterans Pain Rating Scale.21
Our study was cross-sectional in nature and addressed a single 24-hour period of data per participant. The years of data collection (2016 and 2017) followed a decline in overall opioid prescribing that has continued, likely influenced by CDC and VA/DoD guidelines.22 It is unclear whether our observations are an accurate reflection of individuals’ response over time or whether prescribing practices in PAC have shifted.
We did not consider the type of pain being treated or explore clinicians’ reasons for prescribing opioids, therefore limiting our ability to know whether opioids were indicated. Information regarding OUD and other SUDs was limited to what was documented in the chart during the CLC-PAC unit admission. We did not have information on length of exposure to opioids. It is possible that opioid tolerance could play a role in reducing opioid responsiveness. However, simple tolerance would not be expected to explain robust correlations with psychiatric comorbidities. Also, simple tolerance would be expected to be overcome with higher opioid dosages, whereas our study demonstrates less responsiveness. These data suggests that some individuals’ pain might be poorly opioid responsive, and psychiatric factors could increase this risk. We used a novel data source in combination with chart review; to our knowledge, barcode medication administration data have not been used in this manner previously. Future work needs to validate this method, using larger sample sizes and several clinical sites. Finally, we used regression models that controlled for average pre-opioid pain rating scores, which is only 1 covariate important for examining effects. Larger studies with adequate power should control for multiple covariates known to be associated with pain and opioid response.
Conclusions
Opioid responsiveness is important clinically yet challenging to assess. This pilot study identifies a way of classifying pain as relatively opioid nonresponsive using administrative data but requires further validation before considering scaling for more general use. The possibility that a substantial percentage of residents in a CLC-PAC unit could be receiving increasing dosages of opioids without adequate benefit justifies the need for more research and underscores the need for prescribers to assess individuals frequently for ongoing benefit of opioids regardless of diagnosis or mechanism of pain.
Acknowledgments
The authors thank Andrzej Galecki, Corey Powell, and the University of Michigan Consulting for Statistics, Computing and Analytics Research Center for assistance with statistical analysis.
1. Marshall TL, Reinhardt JP. Pain management in the last 6 months of life: predictors of opioid and non-opioid use. J Am Med Dir Assoc. 2019;20(6):789-790. doi:10.1016/j.jamda.2019.02.026
2. Tait RC, Chibnall JT. Pain in older subacute care patients: associations with clinical status and treatment. Pain Med. 2002;3(3):231-239. doi:10.1046/j.1526-4637.2002.02031.x
3. Pimentel CB, Briesacher BA, Gurwitz JH, Rosen AB, Pimentel MT, Lapane KL. Pain management in nursing home residents with cancer. J Am Geriatr Soc. 2015;63(4):633-641. doi:10.1111/jgs.13345
4. Hunnicutt JN, Tjia J, Lapane KL. Hospice use and pain management in elderly nursing home residents with cancer. J Pain Symptom Manage. 2017;53(3):561-570. doi:10.1016/j.jpainsymman.2016.10.369
5. Dowell D, Haegerich TM, Chou R. CDC guideline for prescribing opioids for chronic pain — United States, 2016. MMWR Recomm Rep. 2016;65(No. RR-1):1-49. doi:10.15585/mmwr.rr6501e1
6. Oliva EM, Bowe T, Tavakoli S, et al. Development and applications of the Veterans Health Administration’s Stratification Tool for Opioid Risk Mitigation (STORM) to improve opioid safety and prevent overdose and suicide. Psychol Serv. 2017;14(1):34-49. doi:10.1037/ser0000099
7. Goesling J, Moser SE, Lin LA, Hassett AL, Wasserman RA, Brummett CM. Discrepancies between perceived benefit of opioids and self-reported patient outcomes. Pain Med. 2018;19(2):297-306. doi:10.1093/pm/pnw263
8. Sullivan M, Von Korff M, Banta-Green C. Problems and concerns of patients receiving chronic opioid therapy for chronic non-cancer pain. Pain. 2010;149(2):345-353. doi:10.1016/j.pain.2010.02.037
9. Brennan PL, Greenbaum MA, Lemke S, Schutte KK. Mental health disorder, pain, and pain treatment among long-term care residents: evidence from the Minimum Data Set 3.0. Aging Ment Health. 2019;23(9):1146-1155. doi:10.1080/13607863.2018.1481922
10. Woo A, Lechner B, Fu T, et al. Cut points for mild, moderate, and severe pain among cancer and non-cancer patients: a literature review. Ann Palliat Med. 2015;4(4):176-183. doi:10.3978/j.issn.2224-5820.2015.09.04
11. Centers for Disease Control and Prevention. Calculating total daily dose of opioids for safer dosage. 2017. Accessed December 15, 2021. https://www.cdc.gov/drugoverdose/pdf/calculating_total_daily_dose-a.pdf
12. Nielsen S, Degenhardt L, Hoban B, Gisev N. Comparing opioids: a guide to estimating oral morphine equivalents (OME) in research. NDARC Technical Report No. 329. National Drug and Alcohol Research Centre; 2014. Accessed December 15, 2021. http://www.drugsandalcohol.ie/22703/1/NDARC Comparing opioids.pdf
13. Smith HS. Variations in opioid responsiveness. Pain Physician. 2008;11(2):237-248.
14. Collin E, Cesselin F. Neurobiological mechanisms of opioid tolerance and dependence. Clin Neuropharmacol. 1991;14(6):465-488. doi:10.1097/00002826-199112000-00001
15. Higgins C, Smith BH, Matthews K. Evidence of opioid-induced hyperalgesia in clinical populations after chronic opioid exposure: a systematic review and meta-analysis. Br J Anaesth. 2019;122(6):e114-e126. doi:10.1016/j.bja.2018.09.019
16. Howe CQ, Sullivan MD. The missing ‘P’ in pain management: how the current opioid epidemic highlights the need for psychiatric services in chronic pain care. Gen Hosp Psychiatry. 2014;36(1):99-104. doi:10.1016/j.genhosppsych.2013.10.003
17. Substance Abuse and Mental Health Services Administration. Key substance use and mental health indicators in the United States: results from the 2018 National Survey on Drug Use and Health. HHS Publ No PEP19-5068, NSDUH Ser H-54. 2019;170:51-58. Accessed December 15, 2021. https://www.samhsa.gov/data/sites/default/files/cbhsq-reports/NSDUHNationalFindingsReport2018/NSDUHNationalFindingsReport2018.pdf
18. World Health Organization. WHO’s cancer pain ladder for adults. Accessed September 21, 2018. www.who.int/ncds/management/palliative-care/Infographic-cancer-pain-lowres.pdf
19. Ballantyne JC, Kalso E, Stannard C. WHO analgesic ladder: a good concept gone astray. BMJ. 2016;352:i20. doi:10.1136/bmj.i20
20. The Opioid Therapy for Chronic Pain Work Group. VA/DoD clinical practice guideline for opioid therapy for chronic pain. US Dept of Veterans Affairs and Dept of Defense; 2017. Accessed December 15, 2021. https://www.healthquality.va.gov/guidelines/Pain/cot/VADoDOTCPG022717.pdf
21. Defense & Veterans Pain Rating Scale (DVPRS). Defense & Veterans Center for Integrative Pain Management. Accessed July 21, 2021. https://www.dvcipm.org/clinical-resources/defense-veterans-pain-rating-scale-dvprs/
22. Guy GP Jr, Zhang K, Bohm MK, et al. Vital signs: changes in opioid prescribing in the United States, 2006–2015. MMWR Morb Mortal Wkly Rep. 2017;66(26):697-704. doi:10.15585/mmwr.mm6626a4
Older adults admitted to post-acute settings frequently have complex rehabilitation needs and multimorbidity, which predisposes them to pain management challenges.1,2 The prevalence of pain in post-acute and long-term care is as high as 65%, and opioid use is common among this population with 1 in 7 residents receiving long-term opioids.3,4
Opioids that do not adequately control pain represent a missed opportunity for deprescribing. There is limited evidence regarding efficacy of long-term opioid use (> 90 days) for improving pain and physical functioning.5 In addition, long-term opioid use carries significant risks, including overdose-related death, dependence, and increased emergency department visits.5 These risks are likely to be pronounced among veterans receiving post-acute care (PAC) who are older, have comorbid psychiatric disorders, are prescribed several centrally acting medications, and experience substance use disorder (SUD).6
Older adults are at increased risk for opioid toxicity because of reduced drug clearance and smaller therapeutic window.5 Centers for Disease Control and Prevention (CDC) guidelines recommend frequently assessing patients for benefit in terms of sustained improvement in pain as well as physical function.5 If pain and functional improvements are minimal, opioid use and nonopioid pain management strategies should be considered. Some patients will struggle with this approach. Directly asking patients about the effectiveness of opioids is challenging. Opioid users with chronic pain frequently report problems with opioids even as they describe them as indispensable for pain management.7,8
Earlier studies have assessed patient perspectives regarding opioid difficulties as well as their helpfulness, which could introduce recall bias. Patient-level factors that contribute to a global sense of distress, in addition to the presence of painful physical conditions, also could contribute to patients requesting opioids without experiencing adequate pain relief. One study in veterans residing in PAC facilities found that individuals with depression, posttraumatic stress disorder (PTSD), and SUD were more likely to report pain and receive scheduled analgesics; this effect persisted in individuals with PTSD even after adjusting for demographic and functional status variables.9 The study looked only at analgesics as a class and did not examine opioids specifically. It is possible that distressed individuals, such as those with uncontrolled depression, PTSD, and SUD, might be more likely to report high pain levels and receive opioids with inadequate benefit and increased risk. Identifying the primary condition causing distress and targeting treatment to that condition (ie, depression) is preferable to escalating opioids in an attempt to treat pain in the context of nonresponse. Assessing an individual’s aggregate response to opioids rather than relying on a single self-report is a useful addition to current pain management strategies.
The goal of this study was to pilot a method of identifying opioid-nonresponsive pain using administrative data, measure its prevalence in a PAC population of veterans, and explore clinical and demographic correlates with particular attention to variates that could indicate high levels of psychological and physical distress. Identifying pain that is poorly responsive to opioids would give clinicians the opportunity to avoid or minimize opioid use and prioritize treatments that are likely to improve the resident’s pain, quality of life, and physical function while minimizing recall bias. We hypothesized that pain that responds poorly to opioids would be prevalent among veterans residing in a PAC unit. We considered that veterans with pain poorly responsive to opioids would be more likely to have factors that would place them at increased risk of adverse effects, such as comorbid psychiatric conditions, history of SUD, and multimorbidity, providing further rationale for clinical equipoise in that population.6
Methods
This was a small, retrospective cross-sectional study using administrative data and chart review. The study included veterans who were administered opioids while residing in a single US Department of Veterans Affairs (VA) community living center PAC (CLC-PAC) unit during at least 1 of 4 nonconsecutive, random days in 2016 and 2017. The study was approved by the institutional review board of the Ann Arbor VA Health System (#2017-1034) as part of a larger project involving models of care in vulnerable older veterans.
Inclusion criteria were the presence of at least moderate pain (≥ 4 on a 0 to 10 scale); receiving ≥ 2 opioids ordered as needed over the prespecified 24-hour observation period; and having ≥ 2 pre-and postopioid administration pain scores during the observation period. Veterans who did not meet these criteria were excluded. At the time of initial sample selection, we did not capture information related to coprescribed analgesics, including a standing order of opioids. To obtain the sample, we initially characterized all veterans on the 4 days residing in the CLC-PAC unit as those reporting at least moderate pain (≥ 4) and those who reported no or mild pain (< 4). The cut point of 4 of 10 is consistent with moderate pain based on earlier work showing higher likelihood of pain that interferes with physical function.10 We then restricted the sample to veterans who received ≥ 2 opioids ordered as needed for pain and had ≥ 2 pre- and postopioid administration numeric pain rating scores during the 24-hour observation period. This methodology was chosen to enrich our sample for those who received opioids regularly for ongoing pain. Opioids were defined as full µ-opioid receptor agonists and included hydrocodone, oxycodone, morphine, hydromorphone, fentanyl, tramadol, and methadone.
Medication administration data were obtained from the VA corporate data warehouse, which houses all barcode medication administration data collected at the point of care. The dataset includes pain scores gathered by nursing staff before and after administering an as-needed analgesic. The corporate data warehouse records data/time of pain scores and the analgesic name, dosage, formulation, and date/time of administration. Using a standardized assessment form developed iteratively, we calculated opioid dosage in oral morphine equivalents (OME) for comparison.11,12 All abstracted data were reexamined for accuracy. Data initially were collected in an anonymized, blinded fashion. Participants were then unblinded for chart review. Initial data was captured in resident-days instead of unique residents because an individual resident might have been admitted on several observation days. We were primarily interested in how pain responded to opioids administered in response to resident request; therefore, we did not examine response to opioids that were continuously ordered (ie, scheduled). We did consider scheduled opioids when calculating total daily opioid dosage during the chart review.
Outcome of Interest
The primary outcome of interest was an individual’s response to as-needed opioids, which we defined as change in the pain score after opioid administration. The pre-opioid pain score was the score that immediately preceded administration of an as-needed opioid. The postopioid administration pain score was the first score after opioid administration if obtained within 3 hours of administration. Scores collected > 3 hours after opioid administration were excluded because they no longer accurately reflected the impact of the opioid due to the short half-lives. Observations were excluded if an opioid was administered without a recorded pain score; this occurred once for 6 individuals. Observations also were excluded if an opioid was administered but the data were captured on the following day (outside of the 24-hour window); this occurred once for 3 individuals.
We calculated a ∆ score by subtracting the postopioid pain rating score from the pre-opioid score. Individual ∆ scores were then averaged over the 24-hour period (range, 2-5 opioid doses). For example, if an individual reported a pre-opioid pain score of 10, and a postopioid pain score of 2, the ∆ was recorded as 8. If the individual’s next pre-opioid score was 10, and post-opioid score was 6, the ∆ was recorded as 4. ∆ scores over the 24-hour period were averaged together to determine that individual’s response to as-needed opioids. In the previous example, the mean ∆ score is 6. Lower mean ∆ scores reflect decreased responsiveness to opioids’ analgesic effect.
Demographic and clinical data were obtained from electronic health record review using a standardized assessment form. These data included information about medical and psychiatric comorbidities, specialist consultations, and CLC-PAC unit admission indications and diagnoses. Medications of interest were categorized as antidepressants, antipsychotics, benzodiazepines, muscle relaxants, hypnotics, stimulants, antiepileptic drugs/mood stabilizers (including gabapentin and pregabalin), and all adjuvant analgesics. Adjuvant analgesics were defined as medications administered for pain as documented by chart notes or those ordered as needed for pain, and analyzed as a composite variable. Antidepressants with analgesic properties (serotonin-norepinephrine reuptake inhibitors and tricyclic antidepressants) were considered adjuvant analgesics. Psychiatric information collected included presence of mood, anxiety, and psychotic disorders, and PTSD. SUD information was collected separately from other psychiatric disorders.
Analyses
The study population was described using tabulations for categorical data and means and standard deviations for continuous data. Responsiveness to opioids was analyzed as a continuous variable. Those with higher mean ∆ scores were considered to have pain relatively more responsive to opioids, while lower mean ∆ scores indicated pain less responsive to opioids. We constructed linear regression models controlling for average pre-opioid pain rating scores to explore associations between opioid responsiveness and variables of interest. All analyses were completed using Stata version 15. This study was not adequately powered to detect differences across the spectrum of opioid responsiveness, although the authors have reported differences in this article.
Results
Over the 4-day observational period there were 146 resident-days. Of these, 88 (60.3%) reported at least 1 pain score of ≥ 4. Of those, 61 (41.8%) received ≥ 1 as-needed opioid for pain. We identified 46 resident-days meeting study criteria of ≥ 2 pre- and postanalgesic scores. We identified 41 unique individuals (Figure 1). Two individuals were admitted to the CLC-PAC unit on 2 of the 4 observation days, and 1 individual was admitted to the CLC-PAC unit on 3 of the 4 observation days. For individuals admitted several days, we included data only from the initial observation day.
Response to opioids varied greatly in this sample. The mean (SD) ∆ pain score was 3.4 (1.6) and ranged from 0.5 to 6.3. Using linear regression, we found no relationship between admission indication, medical comorbidities (including active cancer), and opioid responsiveness (Table).
Psychiatric disorders were highly prevalent, with 25 individuals (61.0%) having ≥ 1 any psychiatric diagnosis identified on chart review. The presence of any psychiatric diagnosis was significantly associated with reduced responsiveness to opioids (β = −1.08; 95% CI, −2.04 to −0.13; P = .03). SUDs also were common, with 17 individuals (41.5%) having an active SUD; most were tobacco/nicotine. Twenty-six veterans (63.4%) had documentation of SUD in remission with 19 (46.3%) for substances other than tobacco/nicotine. There was no indication that any veteran in the sample was prescribed medication for opioid use disorder (OUD) at the time of observation. There was no relationship between opioid responsiveness and SUDs, neither active or in remission. Consults to other services that suggested distress or difficult-to-control symptoms also were frequent. Consults to the pain service were significantly associated with reduced responsiveness to opioids (β = −1.75; 95% CI, −3.33 to −0.17; P = .03). Association between psychiatry consultation and reduced opioid responsiveness trended toward significance (β = −0.95; 95% CI, −2.06 to 0.17; P = .09) (Figures 2 and 3). There was no significant association with palliative medicine consultation and opioid responsiveness.
A poorer response to opioids was associated with a significantly higher as-needed opioid dosage (β = −0.02; 95% CI, −0.04 to −0.01; P = .002) as well as a trend toward higher total opioid dosage (β = −0.005; 95% CI, −0.01 to 0.0003; P = .06) (Figure 4). Thirty-eight (92.7%) participants received nonopioid adjuvant analgesics for pain. More than half (56.1%) received antidepressants or gabapentinoids (51.2%), although we did not assess whether they were prescribed for pain or another indication. We did not identify a relationship between any specific psychoactive drug class and opioid responsiveness in this sample.
Discussion
This exploratory study used readily available administrative data in a CLC-PAC unit to assess responsiveness to opioids via a numeric mean ∆ score, with higher values indicating more pain relief in response to opioids. We then constructed linear regression models to characterize the relationship between the mean ∆ score and factors known to be associated with difficult-to-control pain and psychosocial distress. As expected, opioid responsiveness was highly variable among residents; some residents experienced essentially no reduction in pain, on average, despite receiving opioids. Psychiatric comorbidity, higher dosage in OMEs, and the presence of a pain service consult significantly correlated with poorer response to opioids. To our knowledge, this is the first study to quantify opioid responsiveness and describe the relationship with clinical correlates in the understudied PAC population.
Earlier research has demonstrated a relationship between the presence of psychiatric disorders and increased likelihood of receiving any analgesics among veterans residing in PAC.9 Our study adds to the literature by quantifying opioid response using readily available administrative data and examining associations with psychiatric diagnoses. These findings highlight the possibility that attempting to treat high levels of pain by escalating the opioid dosage in patients with a comorbid psychiatric diagnosis should be re-addressed, particularly if there is no meaningful pain reduction at lower opioid dosages. Our sample had a variety of admission diagnoses and medical comorbidities, however, we did not identify a relationship with opioid responsiveness, including an active cancer diagnosis. Although SUDs were highly prevalent in our sample, there was no relationship with opioid responsiveness. This suggests that lack of response to opioids is not merely a matter of drug tolerance or an indication of drug-seeking behavior.
Factors Impacting Response
Many factors could affect whether an individual obtains an adequate analgesic response to opioids or other pain medications, including variations in genes encoding opioid receptors and hepatic enzymes involved in drug metabolism and an individual’s opioid exposure history.13 The phenomenon of requiring more drug to produce the same relief after repeated exposures (ie, tolerance) is well known.14 Opioid-induced hyperalgesia is a phenomenon whereby a patient’s overall pain increases while receiving opioids, but each opioid dose might be perceived as beneficial.15 Increasingly, psychosocial distress is an important factor in opioid response. Adverse selection is the process culminating in those with psychosocial distress and/or SUDs being prescribed more opioids for longer durations.16 Our data suggests that this process could play a role in PAC settings. In addition, exaggerating pain to obtain additional opioids for nonmedical purposes, such as euphoria or relaxation, also is possible.17
When clinically assessing an individual whose pain is not well controlled despite escalating opioid dosages, prescribers must consider which of these factors likely is predominant. However, the first step of determining who has a poor opioid response is not straightforward. Directly asking patients is challenging; many individuals perceive opioids to be helpful while simultaneously reporting inadequately controlled pain.7,8 The primary value of this study is the possibility of providing prescribers a quick, simple method of assessing a patient’s response to opioids. Using this method, individuals who are responding poorly to opioids, including those who might exaggerate pain for secondary gain, could be identified. Health care professionals could consider revisiting pain management strategies, assess for the presence of OUD, or evaluate other contributors to inadequately controlled pain. Although we only collected data regarding response to opioids in this study, any pain medication administered as needed (ie, nonsteroidal anti-inflammatory drugs, acetaminophen) could be analyzed using this methodology, allowing identification of other helpful pain management strategies. We began the validation process with extensive chart review, but further validation is required before this method can be applied to routine clinical practice.
Patients who report uncontrolled pain despite receiving opioids are a clinically challenging population. The traditional strategy has been to escalate opioids, which is recommended by the World Health Organization stepladder approach for patients with cancer pain and limited life expectancy.18 Applying this approach to a general population of patients with chronic pain is ineffective and dangerous.19 The CDC and the VA/US Department of Defense (VA/DoD) guidelines both recommend carefully reassessing risks and benefits at total daily dosages > 50 OME and avoid increasing dosages to > 90 OME daily in most circumstances.5,20 Our finding that participants taking higher dosages of opioids were not more likely to have better control over their pain supports this recommendation.
Limitations
This study has several limitations, the most significant is its small sample size because of the exploratory nature of the project. Results are based on a small pilot sample enriched to include individuals with at least moderate pain who receive opioids frequently at 1 VA CLC-PAC unit; therefore, the results might not be representative of all veterans or a more general population. Our small sample size limits power to detect small differences. Data collected should be used to inform formal power calculations before subsequent larger studies to select adequate sample size. Validation studies, including samples from the same population using different dates, which reproduce findings are an important step. Moreover, we only had data on a single dimension of pain (intensity/severity), as measured by the pain scale, which nursing staff used to make a real-time clinical decision of whether to administer an as-needed opioid. Future studies should consider using pain measures that provide multidimensional assessment (ie, severity, functional interference) and/or were developed specifically for veterans, such as the Defense and Veterans Pain Rating Scale.21
Our study was cross-sectional in nature and addressed a single 24-hour period of data per participant. The years of data collection (2016 and 2017) followed a decline in overall opioid prescribing that has continued, likely influenced by CDC and VA/DoD guidelines.22 It is unclear whether our observations are an accurate reflection of individuals’ response over time or whether prescribing practices in PAC have shifted.
We did not consider the type of pain being treated or explore clinicians’ reasons for prescribing opioids, therefore limiting our ability to know whether opioids were indicated. Information regarding OUD and other SUDs was limited to what was documented in the chart during the CLC-PAC unit admission. We did not have information on length of exposure to opioids. It is possible that opioid tolerance could play a role in reducing opioid responsiveness. However, simple tolerance would not be expected to explain robust correlations with psychiatric comorbidities. Also, simple tolerance would be expected to be overcome with higher opioid dosages, whereas our study demonstrates less responsiveness. These data suggests that some individuals’ pain might be poorly opioid responsive, and psychiatric factors could increase this risk. We used a novel data source in combination with chart review; to our knowledge, barcode medication administration data have not been used in this manner previously. Future work needs to validate this method, using larger sample sizes and several clinical sites. Finally, we used regression models that controlled for average pre-opioid pain rating scores, which is only 1 covariate important for examining effects. Larger studies with adequate power should control for multiple covariates known to be associated with pain and opioid response.
Conclusions
Opioid responsiveness is important clinically yet challenging to assess. This pilot study identifies a way of classifying pain as relatively opioid nonresponsive using administrative data but requires further validation before considering scaling for more general use. The possibility that a substantial percentage of residents in a CLC-PAC unit could be receiving increasing dosages of opioids without adequate benefit justifies the need for more research and underscores the need for prescribers to assess individuals frequently for ongoing benefit of opioids regardless of diagnosis or mechanism of pain.
Acknowledgments
The authors thank Andrzej Galecki, Corey Powell, and the University of Michigan Consulting for Statistics, Computing and Analytics Research Center for assistance with statistical analysis.
1. Marshall TL, Reinhardt JP. Pain management in the last 6 months of life: predictors of opioid and non-opioid use. J Am Med Dir Assoc. 2019;20(6):789-790. doi:10.1016/j.jamda.2019.02.026
2. Tait RC, Chibnall JT. Pain in older subacute care patients: associations with clinical status and treatment. Pain Med. 2002;3(3):231-239. doi:10.1046/j.1526-4637.2002.02031.x
3. Pimentel CB, Briesacher BA, Gurwitz JH, Rosen AB, Pimentel MT, Lapane KL. Pain management in nursing home residents with cancer. J Am Geriatr Soc. 2015;63(4):633-641. doi:10.1111/jgs.13345
4. Hunnicutt JN, Tjia J, Lapane KL. Hospice use and pain management in elderly nursing home residents with cancer. J Pain Symptom Manage. 2017;53(3):561-570. doi:10.1016/j.jpainsymman.2016.10.369
5. Dowell D, Haegerich TM, Chou R. CDC guideline for prescribing opioids for chronic pain — United States, 2016. MMWR Recomm Rep. 2016;65(No. RR-1):1-49. doi:10.15585/mmwr.rr6501e1
6. Oliva EM, Bowe T, Tavakoli S, et al. Development and applications of the Veterans Health Administration’s Stratification Tool for Opioid Risk Mitigation (STORM) to improve opioid safety and prevent overdose and suicide. Psychol Serv. 2017;14(1):34-49. doi:10.1037/ser0000099
7. Goesling J, Moser SE, Lin LA, Hassett AL, Wasserman RA, Brummett CM. Discrepancies between perceived benefit of opioids and self-reported patient outcomes. Pain Med. 2018;19(2):297-306. doi:10.1093/pm/pnw263
8. Sullivan M, Von Korff M, Banta-Green C. Problems and concerns of patients receiving chronic opioid therapy for chronic non-cancer pain. Pain. 2010;149(2):345-353. doi:10.1016/j.pain.2010.02.037
9. Brennan PL, Greenbaum MA, Lemke S, Schutte KK. Mental health disorder, pain, and pain treatment among long-term care residents: evidence from the Minimum Data Set 3.0. Aging Ment Health. 2019;23(9):1146-1155. doi:10.1080/13607863.2018.1481922
10. Woo A, Lechner B, Fu T, et al. Cut points for mild, moderate, and severe pain among cancer and non-cancer patients: a literature review. Ann Palliat Med. 2015;4(4):176-183. doi:10.3978/j.issn.2224-5820.2015.09.04
11. Centers for Disease Control and Prevention. Calculating total daily dose of opioids for safer dosage. 2017. Accessed December 15, 2021. https://www.cdc.gov/drugoverdose/pdf/calculating_total_daily_dose-a.pdf
12. Nielsen S, Degenhardt L, Hoban B, Gisev N. Comparing opioids: a guide to estimating oral morphine equivalents (OME) in research. NDARC Technical Report No. 329. National Drug and Alcohol Research Centre; 2014. Accessed December 15, 2021. http://www.drugsandalcohol.ie/22703/1/NDARC Comparing opioids.pdf
13. Smith HS. Variations in opioid responsiveness. Pain Physician. 2008;11(2):237-248.
14. Collin E, Cesselin F. Neurobiological mechanisms of opioid tolerance and dependence. Clin Neuropharmacol. 1991;14(6):465-488. doi:10.1097/00002826-199112000-00001
15. Higgins C, Smith BH, Matthews K. Evidence of opioid-induced hyperalgesia in clinical populations after chronic opioid exposure: a systematic review and meta-analysis. Br J Anaesth. 2019;122(6):e114-e126. doi:10.1016/j.bja.2018.09.019
16. Howe CQ, Sullivan MD. The missing ‘P’ in pain management: how the current opioid epidemic highlights the need for psychiatric services in chronic pain care. Gen Hosp Psychiatry. 2014;36(1):99-104. doi:10.1016/j.genhosppsych.2013.10.003
17. Substance Abuse and Mental Health Services Administration. Key substance use and mental health indicators in the United States: results from the 2018 National Survey on Drug Use and Health. HHS Publ No PEP19-5068, NSDUH Ser H-54. 2019;170:51-58. Accessed December 15, 2021. https://www.samhsa.gov/data/sites/default/files/cbhsq-reports/NSDUHNationalFindingsReport2018/NSDUHNationalFindingsReport2018.pdf
18. World Health Organization. WHO’s cancer pain ladder for adults. Accessed September 21, 2018. www.who.int/ncds/management/palliative-care/Infographic-cancer-pain-lowres.pdf
19. Ballantyne JC, Kalso E, Stannard C. WHO analgesic ladder: a good concept gone astray. BMJ. 2016;352:i20. doi:10.1136/bmj.i20
20. The Opioid Therapy for Chronic Pain Work Group. VA/DoD clinical practice guideline for opioid therapy for chronic pain. US Dept of Veterans Affairs and Dept of Defense; 2017. Accessed December 15, 2021. https://www.healthquality.va.gov/guidelines/Pain/cot/VADoDOTCPG022717.pdf
21. Defense & Veterans Pain Rating Scale (DVPRS). Defense & Veterans Center for Integrative Pain Management. Accessed July 21, 2021. https://www.dvcipm.org/clinical-resources/defense-veterans-pain-rating-scale-dvprs/
22. Guy GP Jr, Zhang K, Bohm MK, et al. Vital signs: changes in opioid prescribing in the United States, 2006–2015. MMWR Morb Mortal Wkly Rep. 2017;66(26):697-704. doi:10.15585/mmwr.mm6626a4
Morphology of Mycosis Fungoides and Sézary Syndrome in Skin of Color
Mycosis fungoides (MF) and Sézary syndrome (SS) are non-Hodgkin T-cell lymphomas that make up the majority of cutaneous T-cell lymphomas. These conditions commonly affect Black patients, with an incidence rate of 12.6 cases of cutaneous T-cell lymphomas per million individuals vs 9.8 per million individuals in non–skin of color (SoC) patients.1 However, educational resources tend to focus on the clinical manifestations of MF/SS in lighter skin types, describing MF as erythematous patches, plaques, or tumors presenting in non–sun-exposed areas of the skin and SS as generalized erythroderma.2 Skin of color, comprised of Fitzpatrick skin types (FSTs) IV to VI,3 is poorly represented across dermatology textbooks,4,5 medical student resources,6 and peer-reviewed publications,7 raising awareness for the need to address this disparity.
Skin of color patients with MF/SS display variable morphologies, including features such as hyperpigmentation and hypopigmentation,8 the latter being exceedingly rare in non-SoC patients.9 Familiarity with these differences among providers is essential to allow for equitable diagnosis and treatment across all skin types, especially in light of data predicting that by 2044 more than 50% of the US population will be people of color.10 Patients with SoC are of many ethnic and racial backgrounds, including Black, Hispanic, American Indian, Pacific Islander, and Asian.11
Along with morphologic differences, there also are several racial disparities in the prognosis and survival of patients with MF/SS. Black patients diagnosed with MF present with greater body surface area affected, and Black women with MF have reduced survival rates compared to their White counterparts.12 Given these racial disparities in survival and representation in educational resources, we aimed to quantify the frequency of various morphologic characteristics of MF/SS in patients with SoC vs non-SoC patients to facilitate better recognition of early MF/SS in SoC patients by medical providers.
Methods
We performed a retrospective chart review following approval from the institutional review board at Northwestern University (Chicago, Illinois). We identified all patients with FSTs IV to VI and biopsy-proven MF/SS who had been clinically photographed in our clinic from January 1998 to December 2019. Only photographs that were high quality enough to review morphologic features were included in our review. Fitzpatrick skin type was determined based on electronic medical record documentation. If photographs were available from multiple visits for the same patient, only those showing posttreatment nonactive lesions were included. Additionally, 36 patients with FSTs I to III (non-SoC) and biopsy-proven MF/SS were included in our review as a comparison with the SoC cohort. The primary outcomes for this study included the presence of scale, erythema, hyperpigmentation, hypopigmentation, violaceous color, lichenification, silver hue, dyschromia, alopecia, poikiloderma, atrophy, and ulceration in active lesions. Dyschromia was defined by the presence of both hypopigmentation and hyperpigmentation. Poikiloderma was defined by hypopigmentation and hyperpigmentation, telangiectasia, and atrophy. Secondary outcomes included evaluation of those same characteristics in posttreatment nonactive lesions. All photographs were independently assessed by 3 authors (M.L.E., C.J.W., J.M.M.), and discrepancies were resolved by further review of the photograph in question and discussion.
Statistical Analysis—Summary statistics were applied to describe demographic and clinical characteristics. The χ2 test was used for categorical variables. Results achieving P<.05 were considered statistically significant.

Results
We reviewed photographs of 111 patients across all skin types (8, FST I; 12, FST II; 16, FST III; 17, FST IV; 44, FST V; 14, FST VI). The cohort was 47% female, and the mean age was 49.7 years (range, 15–86 years). The majority of the cohort had early-stage MF (stage IA or IB). There were more cases of SS in the SoC cohort than the non-SoC cohort (Table). Only 5 photographs had discrepancies and required discussion among the reviewers to achieve consensus.
![Frequency of morphologic features found in skin of color (SoC [Fitzpatrick skin types IV–VI]) vs non-SoC (Fitzpatrick skin types I–III) patients with mycosis fungoides/Sézary syndrome](https://cdn.mdedge.com/files/s3fs-public/Espinosa_1.JPG "Frequency of morphologic features found in skin of color (SoC [Fitzpatrick skin types IV–VI]) vs non-SoC (Fitzpatrick skin types I–III) patients with mycosis fungoides/Sézary syndrome")
Regarding morphologic characteristics in active lesions (Figure 1), scale was present in almost all patients (99% in SoC, 94% in non-SoC). Erythema was present in nearly all non-SoC patients (94%) but only in 69% of SoC patients (P=.003). Poikiloderma also was found to be present at higher frequencies in non-SoC patients compared with SoC patients (19% and 4%, respectively [P=.008]). However, hyperpigmentation (80% vs 39%), lichenification (43% vs 17%), and silver hue (25% vs 3%) were more common in SoC patients than non-SoC patients (P<.05). There were no significant differences in the remaining features, including hypopigmentation (39% vs 25%), dyschromia (24% vs 19%), violaceous color (44% vs 25%), atrophy (11% vs 22%), alopecia (23% vs 31%), and ulceration (16% vs 8%) between SoC and non-SoC patients (P>.05). Photographs of MF in patients with SoC can be seen in Figure 2.
![Representative photographs of mycosis fungoides (MF) in skin of color (Fitzpatrick skin types [FSTs] IV–VI)](https://cdn.mdedge.com/files/s3fs-public/CT109003003_e_Fig2_ABCDE.JPG "Representative photographs of mycosis fungoides (MF) in skin of color (Fitzpatrick skin types [FSTs] IV–VI)")
Posttreatment (nonactive) photographs were available for 26 patients (6 non-SoC, 20 SoC). We found that across all FST groups, hyperpigmentation was more common than hypopigmentation in areas of previously active disease. Statistical analysis was not completed given that few non-SoC photographs were available for comparison.
Comment
This qualitative review demonstrates the heterogeneity of MF/SS in SoC patients and that these conditions do not present in this population with the classic erythematous patches and plaques found in non-SoC patients. We found that hyperpigmentation, lichenification, and silver hue were present at higher rates in patients with FSTs IV to VI compared to those with FSTs I to III, which had higher rates of erythema and poikiloderma. Familiarity with these morphologic features along with increased exposure to clinical photographs of MF/SS in SoC patients will aid in the visual recognition required for this diagnosis, since erythema is harder to identify in darker skin types. Recognizing the unique findings of MF in patients with SoC as well as in patients with lighter skin types will enable earlier diagnosis and treatment of MF/SS across all skin types. If MF is diagnosed and treated early, life expectancy is similar to that of patients without MF.13 However, the 5-year survival rate for advanced-stage MF/SS is 52% across all skin types, and studies have found that Black patients with advanced-stage disease have worse outcomes despite accounting for demographic factors and tumor stage.14,15 Given the worse outcomes in SoC patients with advanced-stage MF/SS, earlier diagnosis could help address this disparity.8,13,14 Similar morphologic features could be used in diagnosing other inflammatory conditions; studies have shown that the lack of recognition of erythema in Black children has led to delayed diagnosis of atopic dermatitis and subsequent inadequate treatment.16,17
The morphologic presentation of MF/SS in SoC patients also can influence an optimal treatment plan for this population. Hypopigmented MF responds better to phototherapy than hyperpigmented MF, as phototherapy has been shown to have decreased efficacy with increasing FST.18 Therefore, for patients with FSTs IV to VI, topical agents such as nitrogen mustard or bexarotene may be more suitable treatment options, as the efficacy of these treatments is independent of skin color.8 However, nitrogen mustard commonly leads to postinflammatory hyperpigmentation, and topical bexarotene may lead to erythema or irritation; therefore, providers must counsel patients on these possible side effects. For refractory disease, adjunct systemic treatments such as oral bexarotene, subcutaneous interferon, methotrexate, or radiation therapy may be considered.8
In addition to aiding in the prompt diagnosis and treatment of MF/SS in SoC patients, our findings may be used to better assess the extent of disease and distinguish between active MF/SS lesions vs xerosis cutis or residual dyschromia from previously treated lesions. It is important to note that these morphologic features must be taken into account with a complete history and work-up. The differential diagnosis of MF/SS includes conditions such as atopic dermatitis, psoriasis, tinea corporis, and drug reactions, which may have similar morphology in SoC.19
Limitations of our study include the single-center design and the use of photographs instead of in-person examination; however, our cutaneous lymphoma clinic serves a diverse patient population, and our 3 reviewers rated the photographs independently. Discussion amongst the reviewers to address discrepancies was only required for 5 photographs, indicating the high inter-reviewer reliability. Additionally, the original purpose of FST was to assess for the propensity of the skin to burn when undergoing phototherapy, not to serve as a marker for skin color. We recommend trainees and clinicians be mindful about the purpose of FST and to use inclusive language (eg, using the terms skin irritation, skin tenderness, or skin becoming darker from the sun instead of tanning) when determining FST in darker-skinned individuals.20 Future directions include examining if certain treatments are associated with prolonged dyschromia.
Conclusion
In our single-institution retrospective study, we found differences in the morphologic presentation of MF/SS in SoC patients vs non-SoC patients. While erythema is a common feature in non-SoC patients, clinical features of hyperpigmentation, lichenification, and silver hue should be carefully evaluated in the diagnosis of MF/SS in SoC patients. Knowledge of the heterogenous presentation of MF/SS in patients with SoC allows for expedited diagnosis and treatment, leading to better clinical outcomes. Valuable resources, including Taylor and Kelly’s Dermatology for Skin of Color, the Skin of Color Society, and VisualDx educate providers on how dermatologic conditions present in darker skin types. However, there is still work to be done to enhance diversity in educational resources in order to provide equitable care to patients of all skin types.
- Korgavkar K, Xiong M, Weinstock M. Changing incidence trends of cutaneous T-cell lymphoma. JAMA Dermatol. 2013;149:1295-1299. doi:10.1001/jamadermatol.2013.5526
- Jawed SI, Myskowski PL, Horwitz S, et al. Primary cutaneous T-cell lymphoma (mycosis fungoides and Sézary syndrome): part I. diagnosis: clinical and histopathologic features and new molecular and biologic markers. J Am Acad Dermatol. 2014;70:205.E1-E16; quiz 221-222. doi:10.1016/j.jaad.2013.07.049
- Tull RZ, Kerby E, Subash JJ, et al. Ethnic skin centers in the United States: where are we in 2020?. J Am Acad Dermatol. 2020;83:1757-1759. doi:10.1016/j.jaad.2020.03.054
- Adelekun A, Onyekaba G, Lipoff JB. Skin color in dermatology textbooks: an updated evaluation and analysis. J Am Acad Dermatol. 2021;84:194-196. doi:10.1016/j.jaad.2020.04.084
- Ebede T, Papier A. Disparities in dermatology educational resources. J Am Acad Dermatol. 2006;55:687-690. doi:10.1016/j.jaad.2005.10.068
- Jones VA, Clark KA, Shobajo MT, et al. Skin of color representation in medical education: an analysis of popular preparatory materials used for United States medical licensing examinations. J Am Acad Dermatol. 2021;85:773-775. doi:10.1016/j.jaad.2020.07.112
- Montgomery SN, Elbuluk N. A quantitative analysis of research publications focused on the top chief complaints in skin of color patients. J Am Acad Dermatol. 2021;85:241-242. doi:10.1016/j.jaad.2020.08.031
- Hinds GA, Heald P. Cutaneous T-cell lymphoma in skin of color. J Am Acad Dermatol. 2009;60:359-375; quiz 376-378. doi:10.1016/j.jaad.2008.10.031
- Ardigó M, Borroni G, Muscardin L, et al. Hypopigmented mycosis fungoides in Caucasian patients: a clinicopathologic study of 7 cases. J Am Acad Dermatol. 2003;49:264-270. doi:10.1067/s0190-9622(03)00907-1
- Colby SL, Ortman JM. Projections of the size and composition of the U.S. population: 2014 to 2060. United States Census Bureau website. Updated October 8, 2021. Accessed February 28, 2022. https://www.census.gov/library/publications/2015/demo/p25-1143.html
- Taylor SC, Kyei A. Defining skin of color. In: Kelly AP, Taylor SC, Lim HW, et al, eds. Taylor and Kelly’s Dermatology for Skin of Color. 2nd ed. McGraw-Hill Education; 2016.
- Huang AH, Kwatra SG, Khanna R, et al. Racial disparities in the clinical presentation and prognosis of patients with mycosis fungoides. J Natl Med Assoc. 2019;111:633-639. doi:10.1016/j.jnma.2019.08.006
- Kim YH, Jensen RA, Watanabe GL, et al. Clinical stage IA (limited patch and plaque) mycosis fungoides. a long-term outcome analysis. Arch Dermatol. 1996;132:1309-1313.
- Scarisbrick JJ, Prince HM, Vermeer MH, et al. Cutaneous lymphoma international consortium study of outcome in advanced stages of mycosis fungoides and Sézary syndrome: effect of specific prognostic markers on survival and development of a prognostic model. J Clin Oncol. 2015;33:3766-3773. doi:10.1200/JCO.2015.61.7142
- Nath SK, Yu JB, Wilson LD. Poorer prognosis of African-American patients with mycosis fungoides: an analysis of the SEER dataset, 1988 to 2008. Clin Lymphoma Myeloma Leuk. 2014;14:419-423. doi:10.1016/j.clml.2013.12.018
- Ben-Gashir MA, Hay RJ. Reliance on erythema scores may mask severe atopic dermatitis in black children compared with their white counterparts. Br J Dermatol. 2002;147:920-925. doi:10.1046/j.1365-2133.2002.04965.x
- Poladian K, De Souza B, McMichael AJ. Atopic dermatitis in adolescents with skin of color. Cutis. 2019;104:164-168.
- Yones SS, Palmer RA, Garibaldinos TT, et al. Randomized double-blind trial of the treatment of chronic plaque psoriasis: efficacy of psoralen-UV-A therapy vs narrowband UV-B therapy. Arch Dermatol. 2006;142:836-842. doi:10.1001/archderm.142.7.836
- Currimbhoy S, Pandya AG. Cutaneous T-cell lymphoma. In: Kelly AP, Taylor SC, Lim HW, et al, eds. Taylor and Kelly’s Dermatology for Skin of Color. 2nd ed. McGraw-Hill Education; 2016.
- Ware OR, Dawson JE, Shinohara MM, et al. Racial limitations of Fitzpatrick skin type. Cutis. 2020;105:77-80.
Mycosis fungoides (MF) and Sézary syndrome (SS) are non-Hodgkin T-cell lymphomas that make up the majority of cutaneous T-cell lymphomas. These conditions commonly affect Black patients, with an incidence rate of 12.6 cases of cutaneous T-cell lymphomas per million individuals vs 9.8 per million individuals in non–skin of color (SoC) patients.1 However, educational resources tend to focus on the clinical manifestations of MF/SS in lighter skin types, describing MF as erythematous patches, plaques, or tumors presenting in non–sun-exposed areas of the skin and SS as generalized erythroderma.2 Skin of color, comprised of Fitzpatrick skin types (FSTs) IV to VI,3 is poorly represented across dermatology textbooks,4,5 medical student resources,6 and peer-reviewed publications,7 raising awareness for the need to address this disparity.
Skin of color patients with MF/SS display variable morphologies, including features such as hyperpigmentation and hypopigmentation,8 the latter being exceedingly rare in non-SoC patients.9 Familiarity with these differences among providers is essential to allow for equitable diagnosis and treatment across all skin types, especially in light of data predicting that by 2044 more than 50% of the US population will be people of color.10 Patients with SoC are of many ethnic and racial backgrounds, including Black, Hispanic, American Indian, Pacific Islander, and Asian.11
Along with morphologic differences, there also are several racial disparities in the prognosis and survival of patients with MF/SS. Black patients diagnosed with MF present with greater body surface area affected, and Black women with MF have reduced survival rates compared to their White counterparts.12 Given these racial disparities in survival and representation in educational resources, we aimed to quantify the frequency of various morphologic characteristics of MF/SS in patients with SoC vs non-SoC patients to facilitate better recognition of early MF/SS in SoC patients by medical providers.
Methods
We performed a retrospective chart review following approval from the institutional review board at Northwestern University (Chicago, Illinois). We identified all patients with FSTs IV to VI and biopsy-proven MF/SS who had been clinically photographed in our clinic from January 1998 to December 2019. Only photographs that were high quality enough to review morphologic features were included in our review. Fitzpatrick skin type was determined based on electronic medical record documentation. If photographs were available from multiple visits for the same patient, only those showing posttreatment nonactive lesions were included. Additionally, 36 patients with FSTs I to III (non-SoC) and biopsy-proven MF/SS were included in our review as a comparison with the SoC cohort. The primary outcomes for this study included the presence of scale, erythema, hyperpigmentation, hypopigmentation, violaceous color, lichenification, silver hue, dyschromia, alopecia, poikiloderma, atrophy, and ulceration in active lesions. Dyschromia was defined by the presence of both hypopigmentation and hyperpigmentation. Poikiloderma was defined by hypopigmentation and hyperpigmentation, telangiectasia, and atrophy. Secondary outcomes included evaluation of those same characteristics in posttreatment nonactive lesions. All photographs were independently assessed by 3 authors (M.L.E., C.J.W., J.M.M.), and discrepancies were resolved by further review of the photograph in question and discussion.
Statistical Analysis—Summary statistics were applied to describe demographic and clinical characteristics. The χ2 test was used for categorical variables. Results achieving P<.05 were considered statistically significant.
Results
We reviewed photographs of 111 patients across all skin types (8, FST I; 12, FST II; 16, FST III; 17, FST IV; 44, FST V; 14, FST VI). The cohort was 47% female, and the mean age was 49.7 years (range, 15–86 years). The majority of the cohort had early-stage MF (stage IA or IB). There were more cases of SS in the SoC cohort than the non-SoC cohort (Table). Only 5 photographs had discrepancies and required discussion among the reviewers to achieve consensus.
Regarding morphologic characteristics in active lesions (Figure 1), scale was present in almost all patients (99% in SoC, 94% in non-SoC). Erythema was present in nearly all non-SoC patients (94%) but only in 69% of SoC patients (P=.003). Poikiloderma also was found to be present at higher frequencies in non-SoC patients compared with SoC patients (19% and 4%, respectively [P=.008]). However, hyperpigmentation (80% vs 39%), lichenification (43% vs 17%), and silver hue (25% vs 3%) were more common in SoC patients than non-SoC patients (P<.05). There were no significant differences in the remaining features, including hypopigmentation (39% vs 25%), dyschromia (24% vs 19%), violaceous color (44% vs 25%), atrophy (11% vs 22%), alopecia (23% vs 31%), and ulceration (16% vs 8%) between SoC and non-SoC patients (P>.05). Photographs of MF in patients with SoC can be seen in Figure 2.
Posttreatment (nonactive) photographs were available for 26 patients (6 non-SoC, 20 SoC). We found that across all FST groups, hyperpigmentation was more common than hypopigmentation in areas of previously active disease. Statistical analysis was not completed given that few non-SoC photographs were available for comparison.
Comment
This qualitative review demonstrates the heterogeneity of MF/SS in SoC patients and that these conditions do not present in this population with the classic erythematous patches and plaques found in non-SoC patients. We found that hyperpigmentation, lichenification, and silver hue were present at higher rates in patients with FSTs IV to VI compared to those with FSTs I to III, which had higher rates of erythema and poikiloderma. Familiarity with these morphologic features along with increased exposure to clinical photographs of MF/SS in SoC patients will aid in the visual recognition required for this diagnosis, since erythema is harder to identify in darker skin types. Recognizing the unique findings of MF in patients with SoC as well as in patients with lighter skin types will enable earlier diagnosis and treatment of MF/SS across all skin types. If MF is diagnosed and treated early, life expectancy is similar to that of patients without MF.13 However, the 5-year survival rate for advanced-stage MF/SS is 52% across all skin types, and studies have found that Black patients with advanced-stage disease have worse outcomes despite accounting for demographic factors and tumor stage.14,15 Given the worse outcomes in SoC patients with advanced-stage MF/SS, earlier diagnosis could help address this disparity.8,13,14 Similar morphologic features could be used in diagnosing other inflammatory conditions; studies have shown that the lack of recognition of erythema in Black children has led to delayed diagnosis of atopic dermatitis and subsequent inadequate treatment.16,17
The morphologic presentation of MF/SS in SoC patients also can influence an optimal treatment plan for this population. Hypopigmented MF responds better to phototherapy than hyperpigmented MF, as phototherapy has been shown to have decreased efficacy with increasing FST.18 Therefore, for patients with FSTs IV to VI, topical agents such as nitrogen mustard or bexarotene may be more suitable treatment options, as the efficacy of these treatments is independent of skin color.8 However, nitrogen mustard commonly leads to postinflammatory hyperpigmentation, and topical bexarotene may lead to erythema or irritation; therefore, providers must counsel patients on these possible side effects. For refractory disease, adjunct systemic treatments such as oral bexarotene, subcutaneous interferon, methotrexate, or radiation therapy may be considered.8
In addition to aiding in the prompt diagnosis and treatment of MF/SS in SoC patients, our findings may be used to better assess the extent of disease and distinguish between active MF/SS lesions vs xerosis cutis or residual dyschromia from previously treated lesions. It is important to note that these morphologic features must be taken into account with a complete history and work-up. The differential diagnosis of MF/SS includes conditions such as atopic dermatitis, psoriasis, tinea corporis, and drug reactions, which may have similar morphology in SoC.19
Limitations of our study include the single-center design and the use of photographs instead of in-person examination; however, our cutaneous lymphoma clinic serves a diverse patient population, and our 3 reviewers rated the photographs independently. Discussion amongst the reviewers to address discrepancies was only required for 5 photographs, indicating the high inter-reviewer reliability. Additionally, the original purpose of FST was to assess for the propensity of the skin to burn when undergoing phototherapy, not to serve as a marker for skin color. We recommend trainees and clinicians be mindful about the purpose of FST and to use inclusive language (eg, using the terms skin irritation, skin tenderness, or skin becoming darker from the sun instead of tanning) when determining FST in darker-skinned individuals.20 Future directions include examining if certain treatments are associated with prolonged dyschromia.
Conclusion
In our single-institution retrospective study, we found differences in the morphologic presentation of MF/SS in SoC patients vs non-SoC patients. While erythema is a common feature in non-SoC patients, clinical features of hyperpigmentation, lichenification, and silver hue should be carefully evaluated in the diagnosis of MF/SS in SoC patients. Knowledge of the heterogenous presentation of MF/SS in patients with SoC allows for expedited diagnosis and treatment, leading to better clinical outcomes. Valuable resources, including Taylor and Kelly’s Dermatology for Skin of Color, the Skin of Color Society, and VisualDx educate providers on how dermatologic conditions present in darker skin types. However, there is still work to be done to enhance diversity in educational resources in order to provide equitable care to patients of all skin types.
- Korgavkar K, Xiong M, Weinstock M. Changing incidence trends of cutaneous T-cell lymphoma. JAMA Dermatol. 2013;149:1295-1299. doi:10.1001/jamadermatol.2013.5526
- Jawed SI, Myskowski PL, Horwitz S, et al. Primary cutaneous T-cell lymphoma (mycosis fungoides and Sézary syndrome): part I. diagnosis: clinical and histopathologic features and new molecular and biologic markers. J Am Acad Dermatol. 2014;70:205.E1-E16; quiz 221-222. doi:10.1016/j.jaad.2013.07.049
- Tull RZ, Kerby E, Subash JJ, et al. Ethnic skin centers in the United States: where are we in 2020?. J Am Acad Dermatol. 2020;83:1757-1759. doi:10.1016/j.jaad.2020.03.054
- Adelekun A, Onyekaba G, Lipoff JB. Skin color in dermatology textbooks: an updated evaluation and analysis. J Am Acad Dermatol. 2021;84:194-196. doi:10.1016/j.jaad.2020.04.084
- Ebede T, Papier A. Disparities in dermatology educational resources. J Am Acad Dermatol. 2006;55:687-690. doi:10.1016/j.jaad.2005.10.068
- Jones VA, Clark KA, Shobajo MT, et al. Skin of color representation in medical education: an analysis of popular preparatory materials used for United States medical licensing examinations. J Am Acad Dermatol. 2021;85:773-775. doi:10.1016/j.jaad.2020.07.112
- Montgomery SN, Elbuluk N. A quantitative analysis of research publications focused on the top chief complaints in skin of color patients. J Am Acad Dermatol. 2021;85:241-242. doi:10.1016/j.jaad.2020.08.031
- Hinds GA, Heald P. Cutaneous T-cell lymphoma in skin of color. J Am Acad Dermatol. 2009;60:359-375; quiz 376-378. doi:10.1016/j.jaad.2008.10.031
- Ardigó M, Borroni G, Muscardin L, et al. Hypopigmented mycosis fungoides in Caucasian patients: a clinicopathologic study of 7 cases. J Am Acad Dermatol. 2003;49:264-270. doi:10.1067/s0190-9622(03)00907-1
- Colby SL, Ortman JM. Projections of the size and composition of the U.S. population: 2014 to 2060. United States Census Bureau website. Updated October 8, 2021. Accessed February 28, 2022. https://www.census.gov/library/publications/2015/demo/p25-1143.html
- Taylor SC, Kyei A. Defining skin of color. In: Kelly AP, Taylor SC, Lim HW, et al, eds. Taylor and Kelly’s Dermatology for Skin of Color. 2nd ed. McGraw-Hill Education; 2016.
- Huang AH, Kwatra SG, Khanna R, et al. Racial disparities in the clinical presentation and prognosis of patients with mycosis fungoides. J Natl Med Assoc. 2019;111:633-639. doi:10.1016/j.jnma.2019.08.006
- Kim YH, Jensen RA, Watanabe GL, et al. Clinical stage IA (limited patch and plaque) mycosis fungoides. a long-term outcome analysis. Arch Dermatol. 1996;132:1309-1313.
- Scarisbrick JJ, Prince HM, Vermeer MH, et al. Cutaneous lymphoma international consortium study of outcome in advanced stages of mycosis fungoides and Sézary syndrome: effect of specific prognostic markers on survival and development of a prognostic model. J Clin Oncol. 2015;33:3766-3773. doi:10.1200/JCO.2015.61.7142
- Nath SK, Yu JB, Wilson LD. Poorer prognosis of African-American patients with mycosis fungoides: an analysis of the SEER dataset, 1988 to 2008. Clin Lymphoma Myeloma Leuk. 2014;14:419-423. doi:10.1016/j.clml.2013.12.018
- Ben-Gashir MA, Hay RJ. Reliance on erythema scores may mask severe atopic dermatitis in black children compared with their white counterparts. Br J Dermatol. 2002;147:920-925. doi:10.1046/j.1365-2133.2002.04965.x
- Poladian K, De Souza B, McMichael AJ. Atopic dermatitis in adolescents with skin of color. Cutis. 2019;104:164-168.
- Yones SS, Palmer RA, Garibaldinos TT, et al. Randomized double-blind trial of the treatment of chronic plaque psoriasis: efficacy of psoralen-UV-A therapy vs narrowband UV-B therapy. Arch Dermatol. 2006;142:836-842. doi:10.1001/archderm.142.7.836
- Currimbhoy S, Pandya AG. Cutaneous T-cell lymphoma. In: Kelly AP, Taylor SC, Lim HW, et al, eds. Taylor and Kelly’s Dermatology for Skin of Color. 2nd ed. McGraw-Hill Education; 2016.
- Ware OR, Dawson JE, Shinohara MM, et al. Racial limitations of Fitzpatrick skin type. Cutis. 2020;105:77-80.
Practice Points
- Dermatologists should be familiar with the variable morphology of mycosis fungoides (MF)/Sézary syndrome (SS) exhibited by patients of all skin types to ensure prompt diagnosis and treatment.
- Patients with skin of color (SoC)(Fitzpatrick skin types IV–VI) with MF/SS are more likely than non-SoC patients (Fitzpatrick skin types I–III) to present with hyperpigmentation, a silver hue, and lichenification, whereas non-SoC patients commonly present with erythema and poikiloderma.
 who presented with hypopigmented scaly patches on the abdomen")
An Academic Hospitalist–Run Outpatient Paracentesis Clinic
Cirrhosis is the most common cause of ascites in the United States. In patients with compensated cirrhosis, the 10-year probability of developing ascites is 47%. Developing ascites portends a poor prognosis. Fifteen percent of patients who receive this diagnosis die within 1 year, and 44% within 5 years.1 First-line treatment of cirrhotic ascites consists of dietary sodium restriction and diuretic therapy. Refractory ascites is defined as ascites that cannot be easily mobilized despite adhering to a dietary sodium intake of ≤ 2 g daily and daily doses of spironolactone 400 mg and furosemide 160 mg.
Patients who cannot tolerate diuretics because of complications are defined as having diuretic intractable ascites. Diuretic-induced complications include hepatic encephalopathy, renal impairment, hyponatremia, and hypo- or hyperkalemia. Because these patients are either unresponsive to or intolerant of diuretics, second-line treatments, such as regular large-volume paracentesis (LVP) or the insertion of a transjugular intrahepatic portosystemic shunt (TIPS) are needed to manage their ascites. These patients also should be considered for liver transplantation unless there is a contraindication.2
Serial LVP has been shown to be safe and effective in controlling refractory ascites.3 TIPS will decrease the need for repeated LVP in patients with refractory LVP. However, given the uncertainty as to the effect of TIPS creation on survival and the increased risk of encephalopathy, the American Association for the Study of Liver Diseases (AASLD) recommends that TIPS should be used only in those patients who cannot tolerate repeated LVP.4 Repeated LVP also has been shown to be safe and effective in controlling malignant ascites.5,6
LVP can be done in different health care settings. These include the emergency department (ED), interventional radiology suite, inpatient bed, or an outpatient paracentesis clinic. There have been various descriptions of outpatient paracentesis clinics. Reports from the United Kingdom have revealed that paracenteses in these outpatient clinics can be performed safely by nurse practitioners or a liver specialist nurse, that these clinics are highly rated by the patients, and are cost effective.7-10 Gashau and colleagues describe a clinic in Great Britain run by gastroenterology (GI) fellows using an endoscopy suite.11 A nurse practitioner outpatient paracentesis clinic in the US has been described as well.12 Grabau and colleagues present a clinic run by GI endoscopy assistants (licensed practical nurses) using a dedicated paracentesis room in the endoscopy suite.13 Cheng and colleagues describe an outpatient paracentesis clinic in a radiology department run by a single advanced practitioner with assistance from an ultrasound technologist.14 Wang and colleagues present outpatient paracenteses in an outpatient transitional care program by a physician or an advanced practitioner supervised by a physician.15 Sehgal and colleagues describe (in abstract) the creation of a hospitalist-run paracentesis clinic.16
Traditionally, at Veterans Affairs Pittsburgh Healthcare System (VAPHS) in Pennsylvania, if a patient needed LVP, they were admitted to a medicine bed. LVP is not done in the ED, and interventional radiology cannot accommodate the number of patients requiring LVP because of their caseload. The procedure was done by an attending hospitalist or medical residents under the supervision of an attending hospitalist. To improve patient flow and decrease the number of patients using inpatients beds, we created an outpatient paracentesis clinic in 2014. Here, we present the logistics of the clinic, patient demographics, the amount of ascites removed, and the time required to remove the ascites. As part of ongoing quality assurance, we keep track of any complications and report these as well.
Methods
The setting of the outpatient paracentesis clinic is a room in the VAPHS endoscopy suite. The clinic operates 1 half-day per week with up to 3 patients receiving a paracentesis. We use the existing logistics in the endoscopy suite. There are 1 or 2 registered nurses (RNs) who assist the physician performing the paracentesis. The proceduralist is an academic hospitalist who at the time is not on service with residents. The patients are referred to the clinic by the ED, hepatology clinic, palliative care, primary care physicians, or at hospital discharge. In the clinic consult, patients are required to have at least an estimated 3 L of ascites and systolic blood pressure (SBP) ≥ 90. The patients can eat and take medications the morning of the procedure except diuretics. Patients are checked in to the endoscopy suite and a peripheral IV is placed. Blood tests, such as a complete blood count and coagulation studies, are not checked routinely since the AASLD guidelines state that routine prophylactic use of fresh frozen plasma or platelets before paracentesis is not recommended because bleeding is uncommon.3 The proceduralist can order blood work at their discretion.
After the procedure, patients are brought to the recovery area of the endoscopy suite and discharged. The patients are discharged usually within 15 to 30 minutes from arriving in the recovery area after it is assured that the SBP is within 10% of their baseline. Patient follow-up in the outpatient paracentesis clinic is determined by the proceduralist. Most patients need regularly scheduled paracenteses depending on how quickly they reaccumulate ascites. If a patient does not need a regularly scheduled paracentesis, the proceduralist ensures that the appropriate outpatient clinic visit has been scheduled or requested.
Procedure
Informed consent is obtained, and a time-out is performed before each paracentesis. The patient is attached to a cardiac monitor and pulse oximetry as per the endoscopy suite protocol. The proceduralist does a point-of-care ultrasound to find the optimal site and marks the site of puncture. The skin around the marked site is prepared with 3 chlorhexidine gluconate 2%/isopropyl alcohol 70% applicators. A fenestrated drape is used to form a sterile field. The Avanos Paracentesis Kit is routinely used for LVP at VAPHS. Local anesthesia with 1% lidocaine is used with a 25-gauge × 1-inch needle. Deeper anesthesia is obtained with 1% lidocaine, using a 22-gauge × 1.5-inch needle, injecting and aspirating while advancing the needle until ascites is aspirated.
A 15-gauge 3.3-inch Caldwell cannula with an inner needle is inserted into the peritoneal cavity and ascites is aspirated into a syringe. The inner needle is then removed, and the Caldwell cannula is left in the peritoneal cavity and tubing with a roller clamp is attached to the cannula. The tubing is then attached to a 1-L vacuum suction bottle by the RN. We use the CareFusion PleurX drainage bottle. The proceduralist maintains sterility and assures the cannula remains in place. The RN changes the drainage bottles after being filled with 1 L of ascites.
We drain as much ascites as possible until drainage stops on its own. The cannula is then removed, and pressure is held with a gauze pad. An adhesive bandage is then placed over the site. Consistent with AASLD guideline, 25 g of IV albumin 25% is infused for every 3 L of albumin removed provided > 5 L of ascites is removed.3 The albumin is infused during the procedure and not after to limit the time of the procedure. A sample of ascites is sent for cell count with differential and culture.
Results
Between March 2014 and May 2020, 506 paracenteses were performed on 82 patients. The mean age was 66.4 years, and 80 of 82 patients were male. The etiology of the ascites is presented in the Table. Twelve percent of the patients had concomitant hepatocellular carcinoma. Data on the amount of ascites removed were available for all patients, but data on the amount of time it took to do the LVP were available for 392 of 506 paracenteses. The mean volume removed was 7.9 L (range, 0.2-22.9 L), and the mean time of the procedure was 33.3 minutes. The time of the procedure was the time difference between entering and leaving the procedure room. This does not include IV placement or the recovery area time.
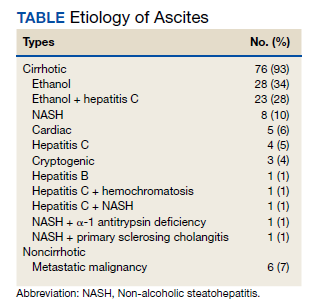
There were 5 episodes of postprocedure hypotension that required IV fluid or admission. In all these events, the patients had received the appropriate amount of IV albumin. Three patients required admission, and 1 patient required IV fluid postparacentesis on 2 occasions and then was discharged home. One abdominal wall hematoma occurred. Two patients with umbilical hernias developed incarceration after the paracentesis; both required surgical repair. There were 3 episodes of leakage at the paracentesis site; a skin adhesive was used in 2 cases, and sutures were applied in the other. There were no deaths.
Possible Infections
Ascitic fluid infection is a risk for patients needing paracentesis. Spontaneous bacterial peritonitis (SBP) is a bacterial infection of ascites in the absence of a focal contiguous source. The polymorphonuclear leukocyte (PMN) count in the ascites is ≥ 250 cells/mm3 in the presence of a single organism on culture. Culture-negative neutrocytic ascites (CNNA) is an ascitic fluid PMN count ≥ 250 cells/mm3 in the absence of culture growth obtained before the administration of antibiotics. Monomicrobial nonneutrocytic bacterascites (MNB) is an ascitic fluid PMN count < 250 cells/mm3 with growth of a single organism on culture.17 There was one occasion where a patient developed symptomatic CNNA 3 days after having a therapeutic paracentesis in the clinic at which time his ascites had a normal neutrophil count and a negative culture. He presented with abdominal pain and fever 3 days later, and a diagnostic paracentesis was done in the ED. He was treated as though he had SBP and did well.
Ascites cell count and culture are routinely sent in the clinic, and 1 case of asymptomatic SBP and 3 cases of asymptomatic ascitic fluid infection variants were diagnosed. The patient with SBP grew vancomycin-resistant Enterococcus faecium in his ascites. Two cases were CNNA. These patients were admitted to the hospital and treated with IV antibiotics. One case of MNB occurred that grew Escherichia coli. The patient refused to return to the hospital for IV antibiotics and was treated with a 5-day course of oral ciprofloxacin.
Discussion
We describe an academic hospitalist–run outpatient LVP clinic where large volumes of ascites are removed efficiently and safely. The only other description of a hospitalist-run paracentesis clinic was in abstract form.16 Without the clinic, the patients would have been admitted to the hospital to get an LVP. Based on VAPHS data from fiscal year 2021, the average cost per day of a nontelemetry medicine admission was $3394. Over 74 months, 506 admissions were prevented, which averages to 82 admissions prevented per year, an approximate annual cost savings of $278,308 in the last fiscal year alone.
Possible Complications
The complications we report are congruent with those reported in the literature. Runyon reported that the rate of an abdominal wall hematoma requiring blood transfusion was 0.9%, and the rate of an abdominal wall hematoma not requiring blood transfusion was also 0.9%.18 We had 1 patient who developed an abdominal wall hematoma (0.2% of paracenteses). This patient required 4 units of packed red blood cells. The incidence of ascitic fluid leakage after paracentesis has been reported to be between 0.4% and 2.4%.12 We had 3 episodes of leakage (0.6% of paracenteses). The Z-track technique has been purported to decrease postparacentesis leakage.2 This involves creating a pathway that is nonlinear when anesthetizing the soft tissues and inserting the paracentesis needle. The Z-track technique was not used in any of the paracenteses in our clinic.
Postparacentesis hypotension has been reported to be 0.4% to 1.8%.12,14 We report 5 episodes of hypotension (0.1% of paracenteses) of which 3 patients were admitted to the hospital. Interestingly, 4 of the 5 patients were on β-blockers. Serste and colleagues reported in a crossover trial that paracentesis-induced circulatory dysfunction (PICD) decreased from 80 to 10% when propranolol was discontinued.19 PICD is characterized by reduction of effective arterial blood volume with subsequent activation of vasoconstrictor and antinatriuretic factors that can cause rapid ascites recurrence rate, development of dilutional hyponatremia, hepatorenal syndrome, and increased mortality. IV albumin is given during LVP to prevent PICD. Discontinuing unnecessary antihypertensive medications, especially β-blockers, may mitigate postparacentesis hypotension. In a study of 515 paracenteses, De Gottardi and colleagues reported a 0.2% rate of iatrogenic percutaneous infection of ascites.20 We had 1 patient return 3 days after LVP with fever, abdominal pain, and neutrocytic ascites. His blood and ascites cultures were negative. The etiology of his infected ascites could have been either a spontaneously developed CNNA infection or an iatrogenic percutaneous infection of ascites.
Two cases of incarceration and strangulation of umbilical hernias postparacentesis that required emergent surgical intervention were unanticipated complications. Incarceration of an existing umbilical hernia postparacentesis is an uncommon but serious complication of LVP described in the past in numerous case reports but whose incidence is otherwise unknown.21-26 The fluid and pressure shifts before and after LVP are likely responsible for the hernia incarceration. When ascites is present, the umbilical hernia ring is kept patent by the pressure of the ascitic fluid, and the decrease in tension after removal of ascites may lead to decreased size of the hernia ring and trapping of contents in the hernia sac.25-27 In most reported cases, symptoms and recognition of the incarcerated hernia have occurred within 2 days of the index paracentesis procedure. Most cases were in patients who required serial paracenteses for management of ascites and had relatively regular LVPs.
In both cases, the patients had regular visits for paracentesis, and incarceration occurred 0.5 hours postprocedure, in 1 case and 6 hours in the other. Umbilical hernias are common in patients with cirrhosis, with the prevalence approaching 20%.28 The management of umbilical hernias in patients with ascites is complex and optimal guideline-based management involves elective repair when ascites is adequately controlled to prevent recurrence, with consideration of TIPS at the time of repair.3 However, patients enrolled in outpatient paracentesis clinics are unlikely to have adequate ascites control to be considered optimized for an elective repair. In addition, given the number of serial procedures that they require, it is not surprising that they may be at risk for complications that are otherwise thought to be rare. Although incarceration and strangulation of umbilical hernia is thought to be a rare complication of LVP, patients should be informed of this potential complication so that they are aware to seek medical attention should they develop signs or symptoms.
Guidelines
There are no guidelines on how much ascites can be removed and how quickly the ascites can be removed during LVP. The goal of a therapeutic paracentesis is to remove as much fluid as possible, and there are no limits on the amount that can be removed safely.1 Concerning paracentesis flow rates, Elsabaawy and colleagues showed that ascites flow rate does not correlate with PICD. They looked at 3 groups with ascites flow rates of 80 mL/min, 180 mL/min and 270 mL/min.29 We had data on the time in the procedure room in 77% of our procedures. Given our average amount of ascites removed (7.9 L) and average time in the procedure room (33.3 minutes), the average flow rate from our clinic was at least 237 mL/min (although the flow rate was likely higher because the average time from needle inserted to needle removed was < 33.3 minutes). Both the mean duration of LVP and the mean volume of ascites removed in an outpatient paracentesis clinic were reported in only 1 other study. In a study of 1100 patients, Grabau and colleagues reported the mean duration, defined as the time between when the patient entered and exited the procedure room (the same time period we reported) as 97 minutes and the mean volume of ascites removed as 8.7 L.13
The AASLD guidelines state that patients undergoing serial outpatient LVP should be tested only for cell count and differential without sending a bacterial culture. The reason given is that false positives may exceed true positives from ascites bacterial culture results in asymptomatic patients.3 Mohan and Venkataraman reported a 0.4% rate of SBP, 1.4% rate of CNNA, and 0.7% rate of MNB in asymptomatic patients undergoing LVP in an outpatient clinic.30 We had a 0.2% rate of SBP, 0.4% rate of CNNA, and 0.2% rate of MNB. Given the low rates of SBP in outpatient paracenteses clinics, we will adopt the AASLD suggestions to only send an ascites cell count and not a culture in asymptomatic patients. Noteworthy, our patient with asymptomatic SBP grew vancomycin-resistant Enterococcus faecium, which was resistant to standard SBP antibiotic therapy. However, if ascites culture was not sent, he would have been treated with antibiotics for CNNA, and if he developed symptoms, he would have had a repeat paracentesis with cell count and culture sent.
Training
In 2015, faculty at VAPHS and the University of Pittsburgh School of Medicine designed a Mastering Paracentesis for Medical Residents course based on current guidelines on the management of ascites and published procedural guides. The course is mandatory for all postgraduate year-1 internal medicine residents and begins with 2 hours of didactic and simulation-based training with an ultrasound-compatible paracentesis mannequin. In the 3 weeks following simulation-based training, residents rotate through our outpatient paracentesis clinic and perform between 1 and 3 abdominal paracentesis procedures, receiving as-needed coaching and postprocedure feedback from faculty. Since the course’s inception, more than 150 internal medicine residents have been trained in paracentesis through our clinic.
Conclusions
We present a description of a successful outpatient paracentesis clinic at our hospital run by academic hospitalists. The clinic was created to decrease the number of admissions for LVP. We were fortunate to be able to use the GI endoscopy suite and their resources as the clinic setting. To create outpatient LVP clinics at other institutions, administrative support is essential. In conclusion, we have shown that an outpatient paracentesis clinic run by academic hospitalists can safely and quickly remove large volumes of ascites.
1. Ge PS, Runyon BA. Treatment of patients with cirrhosis. N Engl J Med. 2016;375(8):767-777. doi:10.1056/NEJMra1504367
2. Wong F. Management of ascites in cirrhosis. J Gastroenterol Hepatol. 2012;27(1):11-20. doi:10.1111/j.1440-1746.2011.06925.x
3. Runyon BA; AASLD. Introduction to the revised American Association for the Study of Liver Diseases Practice Guideline management of adult patients with ascites due to cirrhosis 2012. Hepatology. 2013;57(4):1651-1653. doi:10.1002/hep.26359
4. Boyer TD, Haskal ZJ; American Association for the Study of Liver Diseases. The role of transjugular intrahepatic portosystemic shunt (TIPS) in the management of portal hypertension: update 2009. Hepatology. 2010;51(1):306. doi:10.1002/hep.23383
5. Harding V, Fenu E, Medani H, et al. Safety, cost-effectiveness and feasibility of daycase paracentesis in the management of malignant ascites with a focus on ovarian cancer. Br J Cancer. 2012;107(6):925-930. doi:10.1038/bjc.2012.343
6. Korpi S, Salminen VV, Piili RP, Paunu N, Luukkaala T, Lehto JT. Therapeutic procedures for malignant ascites in a palliative care outpatient clinic. J Palliat Med. 2018;21(6):836-841. doi:10.1089/jpm.2017.0616
7. Vaughan J. Developing a nurse-led paracentesis service in an ambulatory care unit. Nurs Stand. 2013;28(4):44-50. doi:10.7748/ns2013.09.28.4.44.e7751
8. Menon S, Thompson L-S, Tan M, et al. Development and cost-benefit analysis of a nurse-led paracentesis and infusion service. Gastrointestinal Nursing. 2016;14(9):32-38. doi:10.12968/gasn.2016.14.9.32
9. Hill S, Smalley JR, Laasch H-U. Developing a nurse-led, day-case, abdominal paracentesis service. Cancer Nursing Practice. 2013;12(5):14-20. doi:10.7748/cnp2013.06.12.5.14.e942
10. Tahir F, Hollywood C, Durrant D. PWE-134 Overview of efficacy and cost effectiveness of nurse led day case abdominal paracentesis service at Gloucestershire Hospital NHS Foundation Trust. Gut. 2014;63(suppl 1):A183.2-A183. doi:10.1136/gutjnl-2014-307263.394
11. Gashau W, Samra G, Gasser J, Rolland M, Sambaiah P, Shorrock C. PTH-075 “ascites clinic”: an outpatient service model for patients requiring large volume paracentesis. Gut. 2014;63(suppl 1):A242.2-A242. doi:10.1136/gutjnl-2014-307263.521
12. Gilani N, Patel N, Gerkin RD, Ramirez FC, Tharalson EE, Patel K. The safety and feasibility of large volume paracentesis performed by an experienced nurse practitioner. Ann Hepatol. 2009;8(4):359-363.
13. Grabau CM, Crago SF, Hoff LK, et al. Performance standards for therapeutic abdominal paracentesis. Hepatology. 2004;40(2):484-488. doi:10.1002/hep.20317
14. Cheng YW, Sandrasegaran K, Cheng K, et al. A dedicated paracentesis clinic decreases healthcare utilization for serial paracenteses in decompensated cirrhosis. Abdom Radiol (NY). 2018;43(8):2190-2197. doi:10.1007/s00261-017-1406-y
15. Wang J, Khan S, Wyer P, et al. The role of ultrasound-guided therapeutic paracentesis in an outpatient transitional care program: a case series. Am J Hosp Palliat Care. 2018;35(9):1256-1260. doi:10.1177/1049909118755378
16. Sehgal R, Dickerson J, Holcomb M. Creation of a hospitalist-run paracentesis clinic [abstract]. J Hosp Med. 2015;10(suppl 2).
17. Sheer TA, Runyon BA. Spontaneous bacterial peritonitis. Dig Dis. 2005;23(1):39-46. doi:10.1159/000084724
18. Runyon BA. Paracentesis of ascitic fluid. A safe procedure. Arch Intern Med. 1986;146(11):2259-2261.
19. Sersté T, Francoz C, Durand F, et al. Beta-blockers cause paracentesis-induced circulatory dysfunction in patients with cirrhosis and refractory ascites: a cross-over study. J Hepatol. 2011;55(4):794-799. doi:10.1016/j.jhep.2011.01.034
20. De Gottardi A, Thévenot T, Spahr L, et al. Risk of complications after abdominal paracentesis in cirrhotic patients: a prospective study. Clin Gastroenterol Hepatol. 2009;7(8):906-909. doi:10.1016/j.cgh.2009.05.004
21. Khodarahmi I, Shahid MU, Contractor S. Incarceration of umbilical hernia: a rare complication of large volume paracentesis. J Radiol Case Rep. 2015;9(9):20-25. doi:10.3941/jrcr.v9i9.2614
22. Chu KM, McCaughan GW. Iatrogenic incarceration of umbilical hernia in cirrhotic patients with ascites. Am J Gastroenterol. 1995;90(11):2058-2059.
23. Triantos CK, Kehagias I, Nikolopoulou V, Burroughs AK. Incarcerated umbilical hernia after large volume paracentesis for refractory ascites. J Gastrointestin Liver Dis. 2010;19(3):245.
24. Touze I, Asselah T, Boruchowicz A, Paris JC. Abdominal pain in a cirrhotic patient with ascites. Postgrad Med J. 1997;73(865):751-752. doi:10.1136/pgmj.73.865.751
25. Baron HC. Umbilical hernia secondary to cirrhosis of the liver. Complications of surgical correction. N Engl J Med. 1960;263:824-828. doi:10.1056/NEJM196010272631702
26. Tan HK, Chang PE. Acute abdomen secondary to incarcerated umbilical hernia after treatment of massive cirrhotic ascites. Case Reports Hepatol. 2013;2013:948172. doi:10.1155/2013/948172
27. Lemmer JH, Strodel WE, Eckhauser FE. Umbilical hernia incarceration: a complication of medical therapy of ascites. Am J Gastroenterol. 1983;78(5):295-296.
28. Belghiti J, Durand F. Abdominal wall hernias in the setting of cirrhosis. Semin Liver Dis. 1997;17(3):219-226. doi:10.1055/s-2007-1007199
29. Elsabaawy MM, Abdelhamid SR, Alsebaey A, et al. The impact of paracentesis flow rate in patients with liver cirrhosis on the development of paracentesis induced circulatory dysfunction. Clin Mol Hepatol. 2015;21(4):365-371. doi:10.3350/cmh.2015.21.4.365
30. Mohan P, Venkataraman J. Prevalence and risk factors for unsuspected spontaneous ascitic fluid infection in cirrhotics undergoing therapeutic paracentesis in an outpatient clinic. Indian J Gastroenterol. 2011;30(5):221-224. doi:10.1007/s12664-011-0131-7
Cirrhosis is the most common cause of ascites in the United States. In patients with compensated cirrhosis, the 10-year probability of developing ascites is 47%. Developing ascites portends a poor prognosis. Fifteen percent of patients who receive this diagnosis die within 1 year, and 44% within 5 years.1 First-line treatment of cirrhotic ascites consists of dietary sodium restriction and diuretic therapy. Refractory ascites is defined as ascites that cannot be easily mobilized despite adhering to a dietary sodium intake of ≤ 2 g daily and daily doses of spironolactone 400 mg and furosemide 160 mg.
Patients who cannot tolerate diuretics because of complications are defined as having diuretic intractable ascites. Diuretic-induced complications include hepatic encephalopathy, renal impairment, hyponatremia, and hypo- or hyperkalemia. Because these patients are either unresponsive to or intolerant of diuretics, second-line treatments, such as regular large-volume paracentesis (LVP) or the insertion of a transjugular intrahepatic portosystemic shunt (TIPS) are needed to manage their ascites. These patients also should be considered for liver transplantation unless there is a contraindication.2
Serial LVP has been shown to be safe and effective in controlling refractory ascites.3 TIPS will decrease the need for repeated LVP in patients with refractory LVP. However, given the uncertainty as to the effect of TIPS creation on survival and the increased risk of encephalopathy, the American Association for the Study of Liver Diseases (AASLD) recommends that TIPS should be used only in those patients who cannot tolerate repeated LVP.4 Repeated LVP also has been shown to be safe and effective in controlling malignant ascites.5,6
LVP can be done in different health care settings. These include the emergency department (ED), interventional radiology suite, inpatient bed, or an outpatient paracentesis clinic. There have been various descriptions of outpatient paracentesis clinics. Reports from the United Kingdom have revealed that paracenteses in these outpatient clinics can be performed safely by nurse practitioners or a liver specialist nurse, that these clinics are highly rated by the patients, and are cost effective.7-10 Gashau and colleagues describe a clinic in Great Britain run by gastroenterology (GI) fellows using an endoscopy suite.11 A nurse practitioner outpatient paracentesis clinic in the US has been described as well.12 Grabau and colleagues present a clinic run by GI endoscopy assistants (licensed practical nurses) using a dedicated paracentesis room in the endoscopy suite.13 Cheng and colleagues describe an outpatient paracentesis clinic in a radiology department run by a single advanced practitioner with assistance from an ultrasound technologist.14 Wang and colleagues present outpatient paracenteses in an outpatient transitional care program by a physician or an advanced practitioner supervised by a physician.15 Sehgal and colleagues describe (in abstract) the creation of a hospitalist-run paracentesis clinic.16
Traditionally, at Veterans Affairs Pittsburgh Healthcare System (VAPHS) in Pennsylvania, if a patient needed LVP, they were admitted to a medicine bed. LVP is not done in the ED, and interventional radiology cannot accommodate the number of patients requiring LVP because of their caseload. The procedure was done by an attending hospitalist or medical residents under the supervision of an attending hospitalist. To improve patient flow and decrease the number of patients using inpatients beds, we created an outpatient paracentesis clinic in 2014. Here, we present the logistics of the clinic, patient demographics, the amount of ascites removed, and the time required to remove the ascites. As part of ongoing quality assurance, we keep track of any complications and report these as well.
Methods
The setting of the outpatient paracentesis clinic is a room in the VAPHS endoscopy suite. The clinic operates 1 half-day per week with up to 3 patients receiving a paracentesis. We use the existing logistics in the endoscopy suite. There are 1 or 2 registered nurses (RNs) who assist the physician performing the paracentesis. The proceduralist is an academic hospitalist who at the time is not on service with residents. The patients are referred to the clinic by the ED, hepatology clinic, palliative care, primary care physicians, or at hospital discharge. In the clinic consult, patients are required to have at least an estimated 3 L of ascites and systolic blood pressure (SBP) ≥ 90. The patients can eat and take medications the morning of the procedure except diuretics. Patients are checked in to the endoscopy suite and a peripheral IV is placed. Blood tests, such as a complete blood count and coagulation studies, are not checked routinely since the AASLD guidelines state that routine prophylactic use of fresh frozen plasma or platelets before paracentesis is not recommended because bleeding is uncommon.3 The proceduralist can order blood work at their discretion.
After the procedure, patients are brought to the recovery area of the endoscopy suite and discharged. The patients are discharged usually within 15 to 30 minutes from arriving in the recovery area after it is assured that the SBP is within 10% of their baseline. Patient follow-up in the outpatient paracentesis clinic is determined by the proceduralist. Most patients need regularly scheduled paracenteses depending on how quickly they reaccumulate ascites. If a patient does not need a regularly scheduled paracentesis, the proceduralist ensures that the appropriate outpatient clinic visit has been scheduled or requested.
Procedure
Informed consent is obtained, and a time-out is performed before each paracentesis. The patient is attached to a cardiac monitor and pulse oximetry as per the endoscopy suite protocol. The proceduralist does a point-of-care ultrasound to find the optimal site and marks the site of puncture. The skin around the marked site is prepared with 3 chlorhexidine gluconate 2%/isopropyl alcohol 70% applicators. A fenestrated drape is used to form a sterile field. The Avanos Paracentesis Kit is routinely used for LVP at VAPHS. Local anesthesia with 1% lidocaine is used with a 25-gauge × 1-inch needle. Deeper anesthesia is obtained with 1% lidocaine, using a 22-gauge × 1.5-inch needle, injecting and aspirating while advancing the needle until ascites is aspirated.
A 15-gauge 3.3-inch Caldwell cannula with an inner needle is inserted into the peritoneal cavity and ascites is aspirated into a syringe. The inner needle is then removed, and the Caldwell cannula is left in the peritoneal cavity and tubing with a roller clamp is attached to the cannula. The tubing is then attached to a 1-L vacuum suction bottle by the RN. We use the CareFusion PleurX drainage bottle. The proceduralist maintains sterility and assures the cannula remains in place. The RN changes the drainage bottles after being filled with 1 L of ascites.
We drain as much ascites as possible until drainage stops on its own. The cannula is then removed, and pressure is held with a gauze pad. An adhesive bandage is then placed over the site. Consistent with AASLD guideline, 25 g of IV albumin 25% is infused for every 3 L of albumin removed provided > 5 L of ascites is removed.3 The albumin is infused during the procedure and not after to limit the time of the procedure. A sample of ascites is sent for cell count with differential and culture.
Results
Between March 2014 and May 2020, 506 paracenteses were performed on 82 patients. The mean age was 66.4 years, and 80 of 82 patients were male. The etiology of the ascites is presented in the Table. Twelve percent of the patients had concomitant hepatocellular carcinoma. Data on the amount of ascites removed were available for all patients, but data on the amount of time it took to do the LVP were available for 392 of 506 paracenteses. The mean volume removed was 7.9 L (range, 0.2-22.9 L), and the mean time of the procedure was 33.3 minutes. The time of the procedure was the time difference between entering and leaving the procedure room. This does not include IV placement or the recovery area time.
There were 5 episodes of postprocedure hypotension that required IV fluid or admission. In all these events, the patients had received the appropriate amount of IV albumin. Three patients required admission, and 1 patient required IV fluid postparacentesis on 2 occasions and then was discharged home. One abdominal wall hematoma occurred. Two patients with umbilical hernias developed incarceration after the paracentesis; both required surgical repair. There were 3 episodes of leakage at the paracentesis site; a skin adhesive was used in 2 cases, and sutures were applied in the other. There were no deaths.
Possible Infections
Ascitic fluid infection is a risk for patients needing paracentesis. Spontaneous bacterial peritonitis (SBP) is a bacterial infection of ascites in the absence of a focal contiguous source. The polymorphonuclear leukocyte (PMN) count in the ascites is ≥ 250 cells/mm3 in the presence of a single organism on culture. Culture-negative neutrocytic ascites (CNNA) is an ascitic fluid PMN count ≥ 250 cells/mm3 in the absence of culture growth obtained before the administration of antibiotics. Monomicrobial nonneutrocytic bacterascites (MNB) is an ascitic fluid PMN count < 250 cells/mm3 with growth of a single organism on culture.17 There was one occasion where a patient developed symptomatic CNNA 3 days after having a therapeutic paracentesis in the clinic at which time his ascites had a normal neutrophil count and a negative culture. He presented with abdominal pain and fever 3 days later, and a diagnostic paracentesis was done in the ED. He was treated as though he had SBP and did well.
Ascites cell count and culture are routinely sent in the clinic, and 1 case of asymptomatic SBP and 3 cases of asymptomatic ascitic fluid infection variants were diagnosed. The patient with SBP grew vancomycin-resistant Enterococcus faecium in his ascites. Two cases were CNNA. These patients were admitted to the hospital and treated with IV antibiotics. One case of MNB occurred that grew Escherichia coli. The patient refused to return to the hospital for IV antibiotics and was treated with a 5-day course of oral ciprofloxacin.
Discussion
We describe an academic hospitalist–run outpatient LVP clinic where large volumes of ascites are removed efficiently and safely. The only other description of a hospitalist-run paracentesis clinic was in abstract form.16 Without the clinic, the patients would have been admitted to the hospital to get an LVP. Based on VAPHS data from fiscal year 2021, the average cost per day of a nontelemetry medicine admission was $3394. Over 74 months, 506 admissions were prevented, which averages to 82 admissions prevented per year, an approximate annual cost savings of $278,308 in the last fiscal year alone.
Possible Complications
The complications we report are congruent with those reported in the literature. Runyon reported that the rate of an abdominal wall hematoma requiring blood transfusion was 0.9%, and the rate of an abdominal wall hematoma not requiring blood transfusion was also 0.9%.18 We had 1 patient who developed an abdominal wall hematoma (0.2% of paracenteses). This patient required 4 units of packed red blood cells. The incidence of ascitic fluid leakage after paracentesis has been reported to be between 0.4% and 2.4%.12 We had 3 episodes of leakage (0.6% of paracenteses). The Z-track technique has been purported to decrease postparacentesis leakage.2 This involves creating a pathway that is nonlinear when anesthetizing the soft tissues and inserting the paracentesis needle. The Z-track technique was not used in any of the paracenteses in our clinic.
Postparacentesis hypotension has been reported to be 0.4% to 1.8%.12,14 We report 5 episodes of hypotension (0.1% of paracenteses) of which 3 patients were admitted to the hospital. Interestingly, 4 of the 5 patients were on β-blockers. Serste and colleagues reported in a crossover trial that paracentesis-induced circulatory dysfunction (PICD) decreased from 80 to 10% when propranolol was discontinued.19 PICD is characterized by reduction of effective arterial blood volume with subsequent activation of vasoconstrictor and antinatriuretic factors that can cause rapid ascites recurrence rate, development of dilutional hyponatremia, hepatorenal syndrome, and increased mortality. IV albumin is given during LVP to prevent PICD. Discontinuing unnecessary antihypertensive medications, especially β-blockers, may mitigate postparacentesis hypotension. In a study of 515 paracenteses, De Gottardi and colleagues reported a 0.2% rate of iatrogenic percutaneous infection of ascites.20 We had 1 patient return 3 days after LVP with fever, abdominal pain, and neutrocytic ascites. His blood and ascites cultures were negative. The etiology of his infected ascites could have been either a spontaneously developed CNNA infection or an iatrogenic percutaneous infection of ascites.
Two cases of incarceration and strangulation of umbilical hernias postparacentesis that required emergent surgical intervention were unanticipated complications. Incarceration of an existing umbilical hernia postparacentesis is an uncommon but serious complication of LVP described in the past in numerous case reports but whose incidence is otherwise unknown.21-26 The fluid and pressure shifts before and after LVP are likely responsible for the hernia incarceration. When ascites is present, the umbilical hernia ring is kept patent by the pressure of the ascitic fluid, and the decrease in tension after removal of ascites may lead to decreased size of the hernia ring and trapping of contents in the hernia sac.25-27 In most reported cases, symptoms and recognition of the incarcerated hernia have occurred within 2 days of the index paracentesis procedure. Most cases were in patients who required serial paracenteses for management of ascites and had relatively regular LVPs.
In both cases, the patients had regular visits for paracentesis, and incarceration occurred 0.5 hours postprocedure, in 1 case and 6 hours in the other. Umbilical hernias are common in patients with cirrhosis, with the prevalence approaching 20%.28 The management of umbilical hernias in patients with ascites is complex and optimal guideline-based management involves elective repair when ascites is adequately controlled to prevent recurrence, with consideration of TIPS at the time of repair.3 However, patients enrolled in outpatient paracentesis clinics are unlikely to have adequate ascites control to be considered optimized for an elective repair. In addition, given the number of serial procedures that they require, it is not surprising that they may be at risk for complications that are otherwise thought to be rare. Although incarceration and strangulation of umbilical hernia is thought to be a rare complication of LVP, patients should be informed of this potential complication so that they are aware to seek medical attention should they develop signs or symptoms.
Guidelines
There are no guidelines on how much ascites can be removed and how quickly the ascites can be removed during LVP. The goal of a therapeutic paracentesis is to remove as much fluid as possible, and there are no limits on the amount that can be removed safely.1 Concerning paracentesis flow rates, Elsabaawy and colleagues showed that ascites flow rate does not correlate with PICD. They looked at 3 groups with ascites flow rates of 80 mL/min, 180 mL/min and 270 mL/min.29 We had data on the time in the procedure room in 77% of our procedures. Given our average amount of ascites removed (7.9 L) and average time in the procedure room (33.3 minutes), the average flow rate from our clinic was at least 237 mL/min (although the flow rate was likely higher because the average time from needle inserted to needle removed was < 33.3 minutes). Both the mean duration of LVP and the mean volume of ascites removed in an outpatient paracentesis clinic were reported in only 1 other study. In a study of 1100 patients, Grabau and colleagues reported the mean duration, defined as the time between when the patient entered and exited the procedure room (the same time period we reported) as 97 minutes and the mean volume of ascites removed as 8.7 L.13
The AASLD guidelines state that patients undergoing serial outpatient LVP should be tested only for cell count and differential without sending a bacterial culture. The reason given is that false positives may exceed true positives from ascites bacterial culture results in asymptomatic patients.3 Mohan and Venkataraman reported a 0.4% rate of SBP, 1.4% rate of CNNA, and 0.7% rate of MNB in asymptomatic patients undergoing LVP in an outpatient clinic.30 We had a 0.2% rate of SBP, 0.4% rate of CNNA, and 0.2% rate of MNB. Given the low rates of SBP in outpatient paracenteses clinics, we will adopt the AASLD suggestions to only send an ascites cell count and not a culture in asymptomatic patients. Noteworthy, our patient with asymptomatic SBP grew vancomycin-resistant Enterococcus faecium, which was resistant to standard SBP antibiotic therapy. However, if ascites culture was not sent, he would have been treated with antibiotics for CNNA, and if he developed symptoms, he would have had a repeat paracentesis with cell count and culture sent.
Training
In 2015, faculty at VAPHS and the University of Pittsburgh School of Medicine designed a Mastering Paracentesis for Medical Residents course based on current guidelines on the management of ascites and published procedural guides. The course is mandatory for all postgraduate year-1 internal medicine residents and begins with 2 hours of didactic and simulation-based training with an ultrasound-compatible paracentesis mannequin. In the 3 weeks following simulation-based training, residents rotate through our outpatient paracentesis clinic and perform between 1 and 3 abdominal paracentesis procedures, receiving as-needed coaching and postprocedure feedback from faculty. Since the course’s inception, more than 150 internal medicine residents have been trained in paracentesis through our clinic.
Conclusions
We present a description of a successful outpatient paracentesis clinic at our hospital run by academic hospitalists. The clinic was created to decrease the number of admissions for LVP. We were fortunate to be able to use the GI endoscopy suite and their resources as the clinic setting. To create outpatient LVP clinics at other institutions, administrative support is essential. In conclusion, we have shown that an outpatient paracentesis clinic run by academic hospitalists can safely and quickly remove large volumes of ascites.
1. Ge PS, Runyon BA. Treatment of patients with cirrhosis. N Engl J Med. 2016;375(8):767-777. doi:10.1056/NEJMra1504367
2. Wong F. Management of ascites in cirrhosis. J Gastroenterol Hepatol. 2012;27(1):11-20. doi:10.1111/j.1440-1746.2011.06925.x
3. Runyon BA; AASLD. Introduction to the revised American Association for the Study of Liver Diseases Practice Guideline management of adult patients with ascites due to cirrhosis 2012. Hepatology. 2013;57(4):1651-1653. doi:10.1002/hep.26359
4. Boyer TD, Haskal ZJ; American Association for the Study of Liver Diseases. The role of transjugular intrahepatic portosystemic shunt (TIPS) in the management of portal hypertension: update 2009. Hepatology. 2010;51(1):306. doi:10.1002/hep.23383
5. Harding V, Fenu E, Medani H, et al. Safety, cost-effectiveness and feasibility of daycase paracentesis in the management of malignant ascites with a focus on ovarian cancer. Br J Cancer. 2012;107(6):925-930. doi:10.1038/bjc.2012.343
6. Korpi S, Salminen VV, Piili RP, Paunu N, Luukkaala T, Lehto JT. Therapeutic procedures for malignant ascites in a palliative care outpatient clinic. J Palliat Med. 2018;21(6):836-841. doi:10.1089/jpm.2017.0616
7. Vaughan J. Developing a nurse-led paracentesis service in an ambulatory care unit. Nurs Stand. 2013;28(4):44-50. doi:10.7748/ns2013.09.28.4.44.e7751
8. Menon S, Thompson L-S, Tan M, et al. Development and cost-benefit analysis of a nurse-led paracentesis and infusion service. Gastrointestinal Nursing. 2016;14(9):32-38. doi:10.12968/gasn.2016.14.9.32
9. Hill S, Smalley JR, Laasch H-U. Developing a nurse-led, day-case, abdominal paracentesis service. Cancer Nursing Practice. 2013;12(5):14-20. doi:10.7748/cnp2013.06.12.5.14.e942
10. Tahir F, Hollywood C, Durrant D. PWE-134 Overview of efficacy and cost effectiveness of nurse led day case abdominal paracentesis service at Gloucestershire Hospital NHS Foundation Trust. Gut. 2014;63(suppl 1):A183.2-A183. doi:10.1136/gutjnl-2014-307263.394
11. Gashau W, Samra G, Gasser J, Rolland M, Sambaiah P, Shorrock C. PTH-075 “ascites clinic”: an outpatient service model for patients requiring large volume paracentesis. Gut. 2014;63(suppl 1):A242.2-A242. doi:10.1136/gutjnl-2014-307263.521
12. Gilani N, Patel N, Gerkin RD, Ramirez FC, Tharalson EE, Patel K. The safety and feasibility of large volume paracentesis performed by an experienced nurse practitioner. Ann Hepatol. 2009;8(4):359-363.
13. Grabau CM, Crago SF, Hoff LK, et al. Performance standards for therapeutic abdominal paracentesis. Hepatology. 2004;40(2):484-488. doi:10.1002/hep.20317
14. Cheng YW, Sandrasegaran K, Cheng K, et al. A dedicated paracentesis clinic decreases healthcare utilization for serial paracenteses in decompensated cirrhosis. Abdom Radiol (NY). 2018;43(8):2190-2197. doi:10.1007/s00261-017-1406-y
15. Wang J, Khan S, Wyer P, et al. The role of ultrasound-guided therapeutic paracentesis in an outpatient transitional care program: a case series. Am J Hosp Palliat Care. 2018;35(9):1256-1260. doi:10.1177/1049909118755378
16. Sehgal R, Dickerson J, Holcomb M. Creation of a hospitalist-run paracentesis clinic [abstract]. J Hosp Med. 2015;10(suppl 2).
17. Sheer TA, Runyon BA. Spontaneous bacterial peritonitis. Dig Dis. 2005;23(1):39-46. doi:10.1159/000084724
18. Runyon BA. Paracentesis of ascitic fluid. A safe procedure. Arch Intern Med. 1986;146(11):2259-2261.
19. Sersté T, Francoz C, Durand F, et al. Beta-blockers cause paracentesis-induced circulatory dysfunction in patients with cirrhosis and refractory ascites: a cross-over study. J Hepatol. 2011;55(4):794-799. doi:10.1016/j.jhep.2011.01.034
20. De Gottardi A, Thévenot T, Spahr L, et al. Risk of complications after abdominal paracentesis in cirrhotic patients: a prospective study. Clin Gastroenterol Hepatol. 2009;7(8):906-909. doi:10.1016/j.cgh.2009.05.004
21. Khodarahmi I, Shahid MU, Contractor S. Incarceration of umbilical hernia: a rare complication of large volume paracentesis. J Radiol Case Rep. 2015;9(9):20-25. doi:10.3941/jrcr.v9i9.2614
22. Chu KM, McCaughan GW. Iatrogenic incarceration of umbilical hernia in cirrhotic patients with ascites. Am J Gastroenterol. 1995;90(11):2058-2059.
23. Triantos CK, Kehagias I, Nikolopoulou V, Burroughs AK. Incarcerated umbilical hernia after large volume paracentesis for refractory ascites. J Gastrointestin Liver Dis. 2010;19(3):245.
24. Touze I, Asselah T, Boruchowicz A, Paris JC. Abdominal pain in a cirrhotic patient with ascites. Postgrad Med J. 1997;73(865):751-752. doi:10.1136/pgmj.73.865.751
25. Baron HC. Umbilical hernia secondary to cirrhosis of the liver. Complications of surgical correction. N Engl J Med. 1960;263:824-828. doi:10.1056/NEJM196010272631702
26. Tan HK, Chang PE. Acute abdomen secondary to incarcerated umbilical hernia after treatment of massive cirrhotic ascites. Case Reports Hepatol. 2013;2013:948172. doi:10.1155/2013/948172
27. Lemmer JH, Strodel WE, Eckhauser FE. Umbilical hernia incarceration: a complication of medical therapy of ascites. Am J Gastroenterol. 1983;78(5):295-296.
28. Belghiti J, Durand F. Abdominal wall hernias in the setting of cirrhosis. Semin Liver Dis. 1997;17(3):219-226. doi:10.1055/s-2007-1007199
29. Elsabaawy MM, Abdelhamid SR, Alsebaey A, et al. The impact of paracentesis flow rate in patients with liver cirrhosis on the development of paracentesis induced circulatory dysfunction. Clin Mol Hepatol. 2015;21(4):365-371. doi:10.3350/cmh.2015.21.4.365
30. Mohan P, Venkataraman J. Prevalence and risk factors for unsuspected spontaneous ascitic fluid infection in cirrhotics undergoing therapeutic paracentesis in an outpatient clinic. Indian J Gastroenterol. 2011;30(5):221-224. doi:10.1007/s12664-011-0131-7
Examining Interventions and Adverse Events After Nonfatal Opioid Overdoses in Veterans
The number of opioid-related overdose deaths in the United States is estimated to have increased 6-fold over the past 2 decades.1 In 2017, more than two-thirds of drug overdose deaths involved opioids, yielding a mortality rate of 14.9 per 100,000.2 Not only does the opioid epidemic currently pose a significant public health crisis characterized by high morbidity and mortality, but it is also projected to worsen in coming years. According to Chen and colleagues, opioid overdose deaths are estimated to increase by 147% from 2015 to 2025.3 That projects almost 82,000 US deaths annually and > 700,000 deaths in this period—even before accounting for surges in opioid overdoses and opioid-related mortality coinciding with the COVID-19 pandemic.3,4
As health systems and communities globally struggle with unprecedented losses and stressors introduced by the pandemic, emerging data warrants escalating concerns with regard to increased vulnerability to relapse and overdose among those with mental health and substance use disorders (SUDs). In a recent report, the American Medical Association estimates that opioid-related deaths have increased in more than 40 states with the COVID-19 pandemic.4
Veterans are twice as likely to experience a fatal opioid overdose compared with their civilian counterparts.5 While several risk mitigation strategies have been employed in recent years to improve opioid prescribing and safety within the US Department of Veterans Affairs (VA), veterans continue to overdose on opioids, both prescribed and obtained illicitly.6 Variables shown to be strongly associated with opioid overdose risk include presence of mental health disorders, SUDs, medical conditions involving impaired drug metabolism or excretion, respiratory disorders, higher doses of opioids, concomitant use of sedative medications, and history of overdose.6-8 Many veterans struggle with chronic pain and those prescribed high doses of opioids were more likely to have comorbid pain diagnoses, mental health disorders, and SUDs.9 Dashboards and predictive models, such as the Stratification Tool for Opioid Risk Mitigation (STORM) and the Risk Index for Overdose or Serious Opioid-induced Respiratory Depression (RIOSORD), incorporate such factors to stratify overdose risk among veterans, in an effort to prioritize high-risk individuals for review and provision of care.6,10,11 Despite recent recognition that overdose prevention likely requires a holistic approach that addresses the biopsychosocial factors contributing to opioid-related morbidity and mortality, it is unclear whether veterans are receiving adequate and appropriate treatment for contributing conditions.
There are currently no existing studies that describe health service utilization (HSU), medication interventions, and rates of opioid-related adverse events (ORAEs) among veterans after survival of a nonfatal opioid overdose (NFO). Clinical characteristics of veterans treated for opioid overdose at a VA emergency department (ED) have previously been described by Clement and Stock.12 Despite improvements that have been made in VA opioid prescribing and safety, knowledge gaps remain with regard to best practices for opioid overdose prevention. The aim of this study was to characterize HSU and medication interventions in veterans following NFO, as well as the frequency of ORAEs after overdose. The findings of this study may aid in the identification of areas for targeted improvement in the prevention and reduction of opioid overdoses and adverse opioid-related sequelae.
Methods
This retrospective descriptive study was conducted at VA San Diego Healthcare System (VASDHCS) in California. Subjects included were veterans administered naloxone in the ED for suspected opioid overdose between July 1, 2013 and April 1, 2017. The study population was identified through data retrieved from automated drug dispensing systems, which was then confirmed through manual chart review of notes associated with the index ED visit. Inclusion criteria included documented increased respiration or responsiveness following naloxone administration. Subjects were excluded if they demonstrated lack of response to naloxone, overdosed secondary to inpatient administration of opioids, received palliative or hospice care during the study period, or were lost to follow-up.
Data were collected via retrospective chart review and included date of index ED visit, demographics, active prescriptions, urine drug screen (UDS) results, benzodiazepine (BZD) use corroborated by positive UDS or mention of BZD in index visit chart notes, whether overdose was determined to be a suicide attempt, and naloxone kit dispensing. Patient data was collected for 2 years following overdose, including: ORAEs; ED visits; hospitalizations; repeat overdoses; fatal overdose; whether subjects were still alive; follow-up visits for pain management, mental health, and addiction treatment services; and visits to the psychiatric emergency clinic. Clinical characteristics, such as mental health disorder diagnoses, SUDs, and relevant medical conditions also were collected. Statistical analysis was performed using Microsoft Excel and included only descriptive statistics.
Results
Ninety-three patients received naloxone in the VASDHCS ED. Thirty-five met inclusion criteria and were included in the primary analysis. All subjects received IV naloxone with a mean 0.8 mg IV boluses (range, 0.1-4.4 mg).
Most patients were male with a mean age of 59.8 years (Table 1). Almost all overdoses were nonintentional except for 3 suicide attempts that were reviewed by the Suicide Prevention Committee. Three patients had previously been treated for opioid overdose at the VA with a documented positive clinical response to naloxone administration.
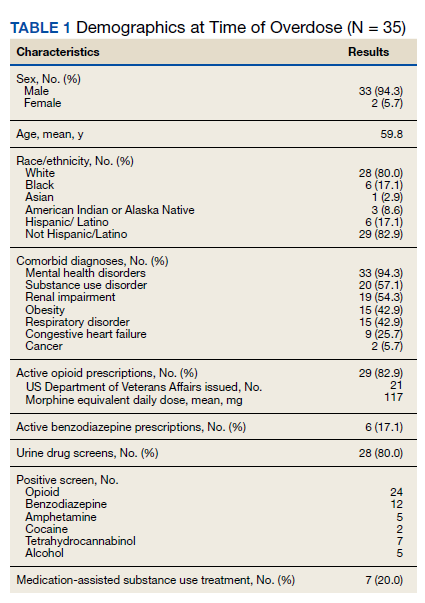
At the time of overdose, 29 patients (82.9%) had an active opioid prescription. Of these, the majority were issued through the VA with a mean 117 mg morphine equivalent daily dose (MEDD). Interestingly, only 24 of the 28 patients with a UDS collected at time of overdose tested positive for opioids, which may be attributable to the use of synthetic opioids, which are not reliably detected by traditional UDS. Concomitant BZD use was involved in 13 of the 35 index overdoses (37.1%), although only 6 patients (17.1%) had an active BZD prescription at time of overdose. Seven patients (20.0%) were prescribed medication-assisted treatment (MAT) for opioid use disorder (OUD), with all 7 using methadone. According to VA records, only 1 patient had previously been dispensed a naloxone kit at any point prior to overdosing. Mental health and SUD diagnoses frequently co-occurred, with 20 patients (57.1%) having at least 1 mental health condition and at least 1 SUD.
Rates of follow-up varied by clinician type in the 6 months after NFO (Figure). Of those with mental health disorders, 15 patients (45.5%) received mental health services before and after overdose, while 8 (40.0%) and 10 (50.0%) of those with SUDs received addiction treatment services before and after overdose, respectively. Seven patients presented to the psychiatric emergency clinic within 6 months prior to overdose and 5 patients within the 6 months following overdose.
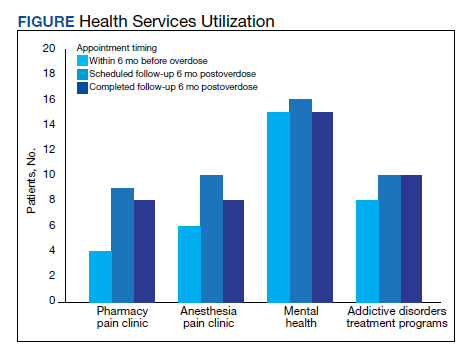
Of patients with VA opioid prescriptions, within 2 years of NFO, 9 (42.9%) had their opioids discontinued, and 18 (85.7%) had MEDD reductions ranging from 10 mg to 150 mg (12.5-71.4% reduction) with a mean of 63 mg. Two of the 4 patients with active BZD prescriptions at the time of the overdose event had their prescriptions continued. Seven patients (20.0%) were dispensed naloxone kits following overdose (Table 2).
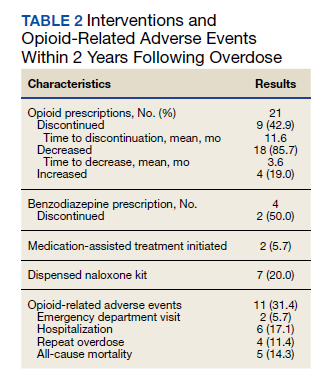
Rates of ORAEs ranged from 0% to 17% with no documented overdose fatalities. Examples of AEs observed in this study included ED visits or hospitalizations involving opioid withdrawal, opioid-related personality changes, and opioid overdose. Five patients died during the study period, yielding an all-cause mortality rate of 14.3% with a mean time to death of 10.8 months. The causes of death were largely unknown except for 1 patient, whose death was reportedly investigated as an accidental medication overdose without additional information.
Repeat overdose verified by hospital records occurred in 4 patients (11.4%) within 2 years. Patients who experienced a subsequent overdose were prescribed higher doses of opioids with a mean MEDD among VA prescriptions of 130 mg vs 114 mg for those without repeat overdose. In this group, 3 patients (75.0%) also had concomitant BZD use, which was proportionally higher than the 10 patients (32.3%) without a subsequent overdose. Of note, 2 of the 4 patients with a repeat overdose had their opioid doses increased above the MEDD prescribed at the time of index overdose. None of the 4 subjects who experienced a repeat overdose were initiated on MAT within 2 years according to VA records.
Discussions
This retrospective study is representative of many veterans receiving VA care, despite the small sample size. Clinical characteristics observed in the study population were generally consistent with those published by Clement and Stock, including high rates of medical and psychiatric comorbidities.12 Subjects in both studies were prescribed comparable dosages of opioids; among those prescribed opioids but not BZDs through the VA, the mean MEDD was 117 mg in our study compared with 126 mg in the Clement and Stock study. Since implementation of the Opioid Safety Initiative (OSI) in 2013, opioid prescribing practices have improved nationwide across VA facilities, including successful reduction in the numbers of patients prescribed high-dose opioids and concurrent BZDs.13
Despite the tools and resources available to clinicians, discontinuing opioid therapy remains a difficult process. Concerns related to mental health and/or substance-use related decompensations often exist in the setting of rapid dose reductions or abrupt discontinuation of opioids.6 Although less than half of patients in the present study with an active opioid prescription at time of index overdose had their opioids discontinued within 2 years, it is reassuring to note the much higher rate of those with subsequent decreases in their prescribed doses, as well as the 50% reduction in BZD coprescribing. Ultimately, these findings remain consistent with the VA goals of mitigating harm, improving opioid prescribing, and ensuring the safe use of opioid medications when clinically appropriate.
Moreover, recent evidence suggests that interventions focused solely on opioid prescribing practices are becoming increasingly limited in their impact on reducing opioid-related deaths and will likely be insufficient for addressing the opioid epidemic as it continues to evolve. According to Chen and colleagues, opioid overdose deaths are projected to increase over the next several years, while further reduction in the incidence of prescription opioid misuse is estimated to decrease overdose deaths by only 3% to 5.3%. In the context of recent surges in synthetic opioid use, it is projected that 80% of overdose deaths between 2016 and 2025 will be attributable to illicit opioids.3 Such predictions underscore the urgent need to adopt alternative approaches to risk-reducing measures and policy change.
The increased risk of mortality associated with opioid misuse and overdose is well established in the current literature. However, less is known regarding the rate of ORAEs after survival of an NFO. Olfson and colleagues sought to address this knowledge gap by characterizing mortality risks in 76,325 US adults within 1 year following NFO.14 Among their studied population, all-cause mortality occurred at a rate of 778.3 per 10,000 person-years, which was 24 times greater than that of the general population. This emphasizes the need for the optimization of mental health services, addiction treatment, and medical care for these individuals at higher risk.
Limitations
Certain factors and limitations should be considered when interpreting the results of this study. Given that the study included only veterans, factors such as the demographic and clinical characteristics more commonly observed among these patients should be taken into account and may in turn limit the generalizability of these findings to nonveteran populations. Another major limitation is the small sample size; the study period and by extension, the number of patients able to be included in the present study were restricted by the availability of retrievable data from automated drug dispensing systems. Patients without documented response to naloxone were excluded from the study due to low clinical suspicion for opioid overdose, although the possibility that the dose administered was too low to produce a robust clinical response cannot be definitively ruled out. The lack of reliable methods to capture events and overdoses treated outside of the VA may have resulted in underestimations of the true occurrence of ORAEs following NFO. Information regarding naloxone administration outside VA facilities, such as in transport to the hospital, self-reported, or bystander administration, was similarly limited by lack of reliable methods for retrieving such data and absence of documentation in VA records. Although all interventions and outcomes reported in the present study occurred within 2 years following NFO, further conclusions pertaining to the relative timing of specific interventions and ORAEs cannot be made. Lastly, this study did not investigate the direct impact of opioid risk mitigation initiatives implemented by the VA in the years coinciding with the study period.
Future Directions
Despite these limitations, an important strength of this study is its ability to identify potential areas for targeted improvement and to guide further efforts relating to the prevention of opioid overdose and opioid-related mortality among veterans. Identification of individuals at high risk for opioid overdose and misuse is an imperative first step that allows for the implementation of downstream risk-mitigating interventions. Within the VA, several tools have been developed in recent years to provide clinicians with additional resources and support in this regard.6,15
No more than half of those diagnosed with mental health disorders and SUDs in the present study received outpatient follow-up care for these conditions within 6 months following NFO, which may suggest high rates of inadequate treatment. Given the strong association between mental health disorders, SUDs, and increased risk of overdose, increasing engagement with mental health and addiction treatment services may be paramount to preventing subsequent ORAEs, including repeat overdose.6-9,11
Naloxone kit dispensing represents another area for targeted improvement. Interventions may include clinician education and systematic changes, such as implementing protocols that boost the likelihood of high-risk individuals being provided with naloxone at the earliest opportunity. Bystander-administered naloxone programs can also be considered for increasing naloxone access and reducing opioid-related mortality.16
Finally, despite evidence supporting the benefit of MAT in OUD treatment and reducing all-cause and opioid-related mortality after NFO, the low rates of MAT observed in this study are consistent with previous reports that these medications remain underutilized.17 Screening for OUD, in conjunction with increasing access to and utilization of OUD treatment modalities, is an established and integral component of overdose prevention efforts. For VA clinicians, the Psychotropic Drug Safety Initiative (PDSI) dashboard can be used to identify patients diagnosed with OUD who are not yet on MAT.18 Initiatives to expand MAT access through the ED have the potential to provide life-saving interventions and bridge care in the interim until patients are able to become established with a long-term health care practitioner.19
Conclusions
This is the first study to describe HSU, medication interventions, and ORAEs among veterans who survive NFO. Studies have shown that veterans with a history of NFO are at increased risk of subsequent AEs and premature death.6,7,10,14 As such, NFOs represent crucial opportunities to identify high-risk individuals and ensure provision of adequate care. Recent data supports the development of a holistic, multimodal approach focused on adequate treatment of conditions that contribute to opioid-related risks, including mental health disorders, SUDs, pain diagnoses, and medical comorbidities.3,14 Interventions designed to improve access, engagement, and retention in such care therefore play a pivotal role in overdose prevention and reducing mortality.
Although existing risk mitigation initiatives have improved opioid prescribing and safety within the VA, the findings of this study suggest that there remains room for improvement, and the need for well-coordinated efforts to reduce risks associated with both prescribed and illicit opioid use cannot be overstated. Rates of overdose deaths not only remain high but are projected to continue increasing in coming years, despite advances in clinical practice aimed at reducing harms associated with opioid use. The present findings aim to help identify processes with the potential to reduce rates of overdose, death, and adverse sequelae in high-risk populations. However, future studies are warranted to expand on these findings and contribute to ongoing efforts in reducing opioid-related harms and overdose deaths. This study may provide critical insight to inform further investigations to guide such interventions and highlight tools that health care facilities even outside the VA can consider implementing.
Acknowledgments
The authors would like to thank Jonathan Lacro, PharmD, BCPP, for his guidance with this important clinical topic and navigating IRB submissions.
1. Centers for Disease Control and Prevention. Data overview: the drug overdose epidemic: behind the numbers. Updated March 25, 2021. Accessed February 9, 2022. www.cdc.gov/drugoverdose/data/index.html
2. Scholl L, Seth P, Kariisa M, Wilson N, Baldwin G. Drug and Opioid-Involved Overdose Deaths - United States, 2013-2017. MMWR Morb Mortal Wkly Rep. 2018;67(5152):1419-1427. Published 2018 Jan 4. doi:10.15585/mmwr.mm675152e1 3. Chen Q, Larochelle MR, Weaver DT, et al. Prevention of prescription opioid misuse and projected overdose deaths in the United States. JAMA Netw Open. 2019;2(2):e187621. Published 2019 Feb 1. doi:10.1001/jamanetworkopen.2018.7621
4. American Medical Association. Issue brief: nation’s drug-related overdose and death epidemic continues to worsen. Updated November 12, 2021. Accessed February 11, 2022. https://www.ama-assn.org/system/files/issue-brief-increases-in-opioid-related-overdose.pdf
5. Bohnert AS, Ilgen MA, Galea S, McCarthy JF, Blow FC. Accidental poisoning mortality among patients in the Department of Veterans Affairs Health System. Med Care. 2011;49(4):393-396. doi:10.1097/MLR.0b013e318202aa27
6. Lewis ET, Trafton J, Oliva E. Data-based case reviews of patients with opioid related risk factors as a tool to prevent overdose and suicide. Accessed February 9, 2022. www.hsrd.research.va.gov/for_researchers/cyber_seminars/archives/2488-notes.pdf
7. Zedler B, Xie L, Wang L, et al. Risk factors for serious prescription opioid-related toxicity or overdose among Veterans Health Administration patients. Pain Med. 2014;15(11):1911-1929. doi:10.1111/pme.12480
8. Webster LR. Risk Factors for Opioid-Use Disorder and Overdose. Anesth Analg. 2017;125(5):1741-1748. doi:10.1213/ANE.0000000000002496
9. Morasco BJ, Duckart JP, Carr TP, Deyo RA, Dobscha SK. Clinical characteristics of veterans prescribed high doses of opioid medications for chronic non-cancer pain. Pain. 2010;151(3):625-632. doi:10.1016/j.pain.2010.08.002
10. Oliva EM, Bowe T, Tavakoli S, et al. Development and applications of the Veterans Health Administration’s Stratification Tool for Opioid Risk Mitigation (STORM) to improve opioid safety and prevent overdose and suicide. Psychol Serv. 2017;14(1):34-49. doi:10.1037/ser0000099
11. Zedler B, Xie L, Wang L, et al. Development of a risk index for serious prescription opioid-induced respiratory depression or overdose in Veterans’ Health Administration patients. Pain Med. 2015;16(8):1566-1579. doi:10.1111/pme.12777
12. Clement C, Stock C. Who Overdoses at a VA Emergency Department? Fed Pract. 2016;33(11):14-20.
13. Lin LA, Bohnert ASB, Kerns RD, Clay MA, Ganoczy D, Ilgen MA. Impact of the Opioid Safety Initiative on opioid-related prescribing in veterans. Pain. 2017;158(5):833-839. doi:10.1097/j.pain.0000000000000837
14. Olfson M, Crystal S, Wall M, Wang S, Liu SM, Blanco C. Causes of death after nonfatal opioid overdose [published correction appears in JAMA Psychiatry. 2018 Aug 1;75(8):867]. JAMA Psychiatry. 2018;75(8):820-827. doi:10.1001/jamapsychiatry.2018.1471
15. US Department of Veterans Affairs, Veterans Health Administration. VHA pain management – opioid safety – clinical tools. Updated November 14, 2019. Accessed February 9, 2022. https://www.va.gov/PAINMANAGEMENT/Opioid_Safety/Clinical_Tools.asp
16. Doe-Simkins M, Walley AY, Epstein A, Moyer P. Saved by the nose: bystander-administered intranasal naloxone hydrochloride for opioid overdose. Am J Public Health. 2009;99(5):788-791. doi:10.2105/AJPH.2008.146647
17. Larochelle MR, Bernson D, Land T, et al. Medication for opioid use disorder after nonfatal opioid overdose and association with mortality: a cohort study. Ann Intern Med. 2018;169(3):137-145. doi:10.7326/M17-3107
18. Wiechers I. Program focuses on safe psychiatric medication. Published April 21, 2016. Accessed February 9, 2022. https://blogs.va.gov/VAntage/27099/program-focuses-safe-psychiatric-medication/
19. Newman S; California Health Care Foundation. How to pay for it – MAT in the emergency department: FAQ. Published March 2019. Accessed February 9, 2022. https://www.chcf.org/wp-content/uploads/2019/03/HowToPayForMATinED.pdf
The number of opioid-related overdose deaths in the United States is estimated to have increased 6-fold over the past 2 decades.1 In 2017, more than two-thirds of drug overdose deaths involved opioids, yielding a mortality rate of 14.9 per 100,000.2 Not only does the opioid epidemic currently pose a significant public health crisis characterized by high morbidity and mortality, but it is also projected to worsen in coming years. According to Chen and colleagues, opioid overdose deaths are estimated to increase by 147% from 2015 to 2025.3 That projects almost 82,000 US deaths annually and > 700,000 deaths in this period—even before accounting for surges in opioid overdoses and opioid-related mortality coinciding with the COVID-19 pandemic.3,4
As health systems and communities globally struggle with unprecedented losses and stressors introduced by the pandemic, emerging data warrants escalating concerns with regard to increased vulnerability to relapse and overdose among those with mental health and substance use disorders (SUDs). In a recent report, the American Medical Association estimates that opioid-related deaths have increased in more than 40 states with the COVID-19 pandemic.4
Veterans are twice as likely to experience a fatal opioid overdose compared with their civilian counterparts.5 While several risk mitigation strategies have been employed in recent years to improve opioid prescribing and safety within the US Department of Veterans Affairs (VA), veterans continue to overdose on opioids, both prescribed and obtained illicitly.6 Variables shown to be strongly associated with opioid overdose risk include presence of mental health disorders, SUDs, medical conditions involving impaired drug metabolism or excretion, respiratory disorders, higher doses of opioids, concomitant use of sedative medications, and history of overdose.6-8 Many veterans struggle with chronic pain and those prescribed high doses of opioids were more likely to have comorbid pain diagnoses, mental health disorders, and SUDs.9 Dashboards and predictive models, such as the Stratification Tool for Opioid Risk Mitigation (STORM) and the Risk Index for Overdose or Serious Opioid-induced Respiratory Depression (RIOSORD), incorporate such factors to stratify overdose risk among veterans, in an effort to prioritize high-risk individuals for review and provision of care.6,10,11 Despite recent recognition that overdose prevention likely requires a holistic approach that addresses the biopsychosocial factors contributing to opioid-related morbidity and mortality, it is unclear whether veterans are receiving adequate and appropriate treatment for contributing conditions.
There are currently no existing studies that describe health service utilization (HSU), medication interventions, and rates of opioid-related adverse events (ORAEs) among veterans after survival of a nonfatal opioid overdose (NFO). Clinical characteristics of veterans treated for opioid overdose at a VA emergency department (ED) have previously been described by Clement and Stock.12 Despite improvements that have been made in VA opioid prescribing and safety, knowledge gaps remain with regard to best practices for opioid overdose prevention. The aim of this study was to characterize HSU and medication interventions in veterans following NFO, as well as the frequency of ORAEs after overdose. The findings of this study may aid in the identification of areas for targeted improvement in the prevention and reduction of opioid overdoses and adverse opioid-related sequelae.
Methods
This retrospective descriptive study was conducted at VA San Diego Healthcare System (VASDHCS) in California. Subjects included were veterans administered naloxone in the ED for suspected opioid overdose between July 1, 2013 and April 1, 2017. The study population was identified through data retrieved from automated drug dispensing systems, which was then confirmed through manual chart review of notes associated with the index ED visit. Inclusion criteria included documented increased respiration or responsiveness following naloxone administration. Subjects were excluded if they demonstrated lack of response to naloxone, overdosed secondary to inpatient administration of opioids, received palliative or hospice care during the study period, or were lost to follow-up.
Data were collected via retrospective chart review and included date of index ED visit, demographics, active prescriptions, urine drug screen (UDS) results, benzodiazepine (BZD) use corroborated by positive UDS or mention of BZD in index visit chart notes, whether overdose was determined to be a suicide attempt, and naloxone kit dispensing. Patient data was collected for 2 years following overdose, including: ORAEs; ED visits; hospitalizations; repeat overdoses; fatal overdose; whether subjects were still alive; follow-up visits for pain management, mental health, and addiction treatment services; and visits to the psychiatric emergency clinic. Clinical characteristics, such as mental health disorder diagnoses, SUDs, and relevant medical conditions also were collected. Statistical analysis was performed using Microsoft Excel and included only descriptive statistics.
Results
Ninety-three patients received naloxone in the VASDHCS ED. Thirty-five met inclusion criteria and were included in the primary analysis. All subjects received IV naloxone with a mean 0.8 mg IV boluses (range, 0.1-4.4 mg).
Most patients were male with a mean age of 59.8 years (Table 1). Almost all overdoses were nonintentional except for 3 suicide attempts that were reviewed by the Suicide Prevention Committee. Three patients had previously been treated for opioid overdose at the VA with a documented positive clinical response to naloxone administration.
At the time of overdose, 29 patients (82.9%) had an active opioid prescription. Of these, the majority were issued through the VA with a mean 117 mg morphine equivalent daily dose (MEDD). Interestingly, only 24 of the 28 patients with a UDS collected at time of overdose tested positive for opioids, which may be attributable to the use of synthetic opioids, which are not reliably detected by traditional UDS. Concomitant BZD use was involved in 13 of the 35 index overdoses (37.1%), although only 6 patients (17.1%) had an active BZD prescription at time of overdose. Seven patients (20.0%) were prescribed medication-assisted treatment (MAT) for opioid use disorder (OUD), with all 7 using methadone. According to VA records, only 1 patient had previously been dispensed a naloxone kit at any point prior to overdosing. Mental health and SUD diagnoses frequently co-occurred, with 20 patients (57.1%) having at least 1 mental health condition and at least 1 SUD.
Rates of follow-up varied by clinician type in the 6 months after NFO (Figure). Of those with mental health disorders, 15 patients (45.5%) received mental health services before and after overdose, while 8 (40.0%) and 10 (50.0%) of those with SUDs received addiction treatment services before and after overdose, respectively. Seven patients presented to the psychiatric emergency clinic within 6 months prior to overdose and 5 patients within the 6 months following overdose.
Of patients with VA opioid prescriptions, within 2 years of NFO, 9 (42.9%) had their opioids discontinued, and 18 (85.7%) had MEDD reductions ranging from 10 mg to 150 mg (12.5-71.4% reduction) with a mean of 63 mg. Two of the 4 patients with active BZD prescriptions at the time of the overdose event had their prescriptions continued. Seven patients (20.0%) were dispensed naloxone kits following overdose (Table 2).
Rates of ORAEs ranged from 0% to 17% with no documented overdose fatalities. Examples of AEs observed in this study included ED visits or hospitalizations involving opioid withdrawal, opioid-related personality changes, and opioid overdose. Five patients died during the study period, yielding an all-cause mortality rate of 14.3% with a mean time to death of 10.8 months. The causes of death were largely unknown except for 1 patient, whose death was reportedly investigated as an accidental medication overdose without additional information.
Repeat overdose verified by hospital records occurred in 4 patients (11.4%) within 2 years. Patients who experienced a subsequent overdose were prescribed higher doses of opioids with a mean MEDD among VA prescriptions of 130 mg vs 114 mg for those without repeat overdose. In this group, 3 patients (75.0%) also had concomitant BZD use, which was proportionally higher than the 10 patients (32.3%) without a subsequent overdose. Of note, 2 of the 4 patients with a repeat overdose had their opioid doses increased above the MEDD prescribed at the time of index overdose. None of the 4 subjects who experienced a repeat overdose were initiated on MAT within 2 years according to VA records.
Discussions
This retrospective study is representative of many veterans receiving VA care, despite the small sample size. Clinical characteristics observed in the study population were generally consistent with those published by Clement and Stock, including high rates of medical and psychiatric comorbidities.12 Subjects in both studies were prescribed comparable dosages of opioids; among those prescribed opioids but not BZDs through the VA, the mean MEDD was 117 mg in our study compared with 126 mg in the Clement and Stock study. Since implementation of the Opioid Safety Initiative (OSI) in 2013, opioid prescribing practices have improved nationwide across VA facilities, including successful reduction in the numbers of patients prescribed high-dose opioids and concurrent BZDs.13
Despite the tools and resources available to clinicians, discontinuing opioid therapy remains a difficult process. Concerns related to mental health and/or substance-use related decompensations often exist in the setting of rapid dose reductions or abrupt discontinuation of opioids.6 Although less than half of patients in the present study with an active opioid prescription at time of index overdose had their opioids discontinued within 2 years, it is reassuring to note the much higher rate of those with subsequent decreases in their prescribed doses, as well as the 50% reduction in BZD coprescribing. Ultimately, these findings remain consistent with the VA goals of mitigating harm, improving opioid prescribing, and ensuring the safe use of opioid medications when clinically appropriate.
Moreover, recent evidence suggests that interventions focused solely on opioid prescribing practices are becoming increasingly limited in their impact on reducing opioid-related deaths and will likely be insufficient for addressing the opioid epidemic as it continues to evolve. According to Chen and colleagues, opioid overdose deaths are projected to increase over the next several years, while further reduction in the incidence of prescription opioid misuse is estimated to decrease overdose deaths by only 3% to 5.3%. In the context of recent surges in synthetic opioid use, it is projected that 80% of overdose deaths between 2016 and 2025 will be attributable to illicit opioids.3 Such predictions underscore the urgent need to adopt alternative approaches to risk-reducing measures and policy change.
The increased risk of mortality associated with opioid misuse and overdose is well established in the current literature. However, less is known regarding the rate of ORAEs after survival of an NFO. Olfson and colleagues sought to address this knowledge gap by characterizing mortality risks in 76,325 US adults within 1 year following NFO.14 Among their studied population, all-cause mortality occurred at a rate of 778.3 per 10,000 person-years, which was 24 times greater than that of the general population. This emphasizes the need for the optimization of mental health services, addiction treatment, and medical care for these individuals at higher risk.
Limitations
Certain factors and limitations should be considered when interpreting the results of this study. Given that the study included only veterans, factors such as the demographic and clinical characteristics more commonly observed among these patients should be taken into account and may in turn limit the generalizability of these findings to nonveteran populations. Another major limitation is the small sample size; the study period and by extension, the number of patients able to be included in the present study were restricted by the availability of retrievable data from automated drug dispensing systems. Patients without documented response to naloxone were excluded from the study due to low clinical suspicion for opioid overdose, although the possibility that the dose administered was too low to produce a robust clinical response cannot be definitively ruled out. The lack of reliable methods to capture events and overdoses treated outside of the VA may have resulted in underestimations of the true occurrence of ORAEs following NFO. Information regarding naloxone administration outside VA facilities, such as in transport to the hospital, self-reported, or bystander administration, was similarly limited by lack of reliable methods for retrieving such data and absence of documentation in VA records. Although all interventions and outcomes reported in the present study occurred within 2 years following NFO, further conclusions pertaining to the relative timing of specific interventions and ORAEs cannot be made. Lastly, this study did not investigate the direct impact of opioid risk mitigation initiatives implemented by the VA in the years coinciding with the study period.
Future Directions
Despite these limitations, an important strength of this study is its ability to identify potential areas for targeted improvement and to guide further efforts relating to the prevention of opioid overdose and opioid-related mortality among veterans. Identification of individuals at high risk for opioid overdose and misuse is an imperative first step that allows for the implementation of downstream risk-mitigating interventions. Within the VA, several tools have been developed in recent years to provide clinicians with additional resources and support in this regard.6,15
No more than half of those diagnosed with mental health disorders and SUDs in the present study received outpatient follow-up care for these conditions within 6 months following NFO, which may suggest high rates of inadequate treatment. Given the strong association between mental health disorders, SUDs, and increased risk of overdose, increasing engagement with mental health and addiction treatment services may be paramount to preventing subsequent ORAEs, including repeat overdose.6-9,11
Naloxone kit dispensing represents another area for targeted improvement. Interventions may include clinician education and systematic changes, such as implementing protocols that boost the likelihood of high-risk individuals being provided with naloxone at the earliest opportunity. Bystander-administered naloxone programs can also be considered for increasing naloxone access and reducing opioid-related mortality.16
Finally, despite evidence supporting the benefit of MAT in OUD treatment and reducing all-cause and opioid-related mortality after NFO, the low rates of MAT observed in this study are consistent with previous reports that these medications remain underutilized.17 Screening for OUD, in conjunction with increasing access to and utilization of OUD treatment modalities, is an established and integral component of overdose prevention efforts. For VA clinicians, the Psychotropic Drug Safety Initiative (PDSI) dashboard can be used to identify patients diagnosed with OUD who are not yet on MAT.18 Initiatives to expand MAT access through the ED have the potential to provide life-saving interventions and bridge care in the interim until patients are able to become established with a long-term health care practitioner.19
Conclusions
This is the first study to describe HSU, medication interventions, and ORAEs among veterans who survive NFO. Studies have shown that veterans with a history of NFO are at increased risk of subsequent AEs and premature death.6,7,10,14 As such, NFOs represent crucial opportunities to identify high-risk individuals and ensure provision of adequate care. Recent data supports the development of a holistic, multimodal approach focused on adequate treatment of conditions that contribute to opioid-related risks, including mental health disorders, SUDs, pain diagnoses, and medical comorbidities.3,14 Interventions designed to improve access, engagement, and retention in such care therefore play a pivotal role in overdose prevention and reducing mortality.
Although existing risk mitigation initiatives have improved opioid prescribing and safety within the VA, the findings of this study suggest that there remains room for improvement, and the need for well-coordinated efforts to reduce risks associated with both prescribed and illicit opioid use cannot be overstated. Rates of overdose deaths not only remain high but are projected to continue increasing in coming years, despite advances in clinical practice aimed at reducing harms associated with opioid use. The present findings aim to help identify processes with the potential to reduce rates of overdose, death, and adverse sequelae in high-risk populations. However, future studies are warranted to expand on these findings and contribute to ongoing efforts in reducing opioid-related harms and overdose deaths. This study may provide critical insight to inform further investigations to guide such interventions and highlight tools that health care facilities even outside the VA can consider implementing.
Acknowledgments
The authors would like to thank Jonathan Lacro, PharmD, BCPP, for his guidance with this important clinical topic and navigating IRB submissions.
1. Centers for Disease Control and Prevention. Data overview: the drug overdose epidemic: behind the numbers. Updated March 25, 2021. Accessed February 9, 2022. www.cdc.gov/drugoverdose/data/index.html
2. Scholl L, Seth P, Kariisa M, Wilson N, Baldwin G. Drug and Opioid-Involved Overdose Deaths - United States, 2013-2017. MMWR Morb Mortal Wkly Rep. 2018;67(5152):1419-1427. Published 2018 Jan 4. doi:10.15585/mmwr.mm675152e1 3. Chen Q, Larochelle MR, Weaver DT, et al. Prevention of prescription opioid misuse and projected overdose deaths in the United States. JAMA Netw Open. 2019;2(2):e187621. Published 2019 Feb 1. doi:10.1001/jamanetworkopen.2018.7621
4. American Medical Association. Issue brief: nation’s drug-related overdose and death epidemic continues to worsen. Updated November 12, 2021. Accessed February 11, 2022. https://www.ama-assn.org/system/files/issue-brief-increases-in-opioid-related-overdose.pdf
5. Bohnert AS, Ilgen MA, Galea S, McCarthy JF, Blow FC. Accidental poisoning mortality among patients in the Department of Veterans Affairs Health System. Med Care. 2011;49(4):393-396. doi:10.1097/MLR.0b013e318202aa27
6. Lewis ET, Trafton J, Oliva E. Data-based case reviews of patients with opioid related risk factors as a tool to prevent overdose and suicide. Accessed February 9, 2022. www.hsrd.research.va.gov/for_researchers/cyber_seminars/archives/2488-notes.pdf
7. Zedler B, Xie L, Wang L, et al. Risk factors for serious prescription opioid-related toxicity or overdose among Veterans Health Administration patients. Pain Med. 2014;15(11):1911-1929. doi:10.1111/pme.12480
8. Webster LR. Risk Factors for Opioid-Use Disorder and Overdose. Anesth Analg. 2017;125(5):1741-1748. doi:10.1213/ANE.0000000000002496
9. Morasco BJ, Duckart JP, Carr TP, Deyo RA, Dobscha SK. Clinical characteristics of veterans prescribed high doses of opioid medications for chronic non-cancer pain. Pain. 2010;151(3):625-632. doi:10.1016/j.pain.2010.08.002
10. Oliva EM, Bowe T, Tavakoli S, et al. Development and applications of the Veterans Health Administration’s Stratification Tool for Opioid Risk Mitigation (STORM) to improve opioid safety and prevent overdose and suicide. Psychol Serv. 2017;14(1):34-49. doi:10.1037/ser0000099
11. Zedler B, Xie L, Wang L, et al. Development of a risk index for serious prescription opioid-induced respiratory depression or overdose in Veterans’ Health Administration patients. Pain Med. 2015;16(8):1566-1579. doi:10.1111/pme.12777
12. Clement C, Stock C. Who Overdoses at a VA Emergency Department? Fed Pract. 2016;33(11):14-20.
13. Lin LA, Bohnert ASB, Kerns RD, Clay MA, Ganoczy D, Ilgen MA. Impact of the Opioid Safety Initiative on opioid-related prescribing in veterans. Pain. 2017;158(5):833-839. doi:10.1097/j.pain.0000000000000837
14. Olfson M, Crystal S, Wall M, Wang S, Liu SM, Blanco C. Causes of death after nonfatal opioid overdose [published correction appears in JAMA Psychiatry. 2018 Aug 1;75(8):867]. JAMA Psychiatry. 2018;75(8):820-827. doi:10.1001/jamapsychiatry.2018.1471
15. US Department of Veterans Affairs, Veterans Health Administration. VHA pain management – opioid safety – clinical tools. Updated November 14, 2019. Accessed February 9, 2022. https://www.va.gov/PAINMANAGEMENT/Opioid_Safety/Clinical_Tools.asp
16. Doe-Simkins M, Walley AY, Epstein A, Moyer P. Saved by the nose: bystander-administered intranasal naloxone hydrochloride for opioid overdose. Am J Public Health. 2009;99(5):788-791. doi:10.2105/AJPH.2008.146647
17. Larochelle MR, Bernson D, Land T, et al. Medication for opioid use disorder after nonfatal opioid overdose and association with mortality: a cohort study. Ann Intern Med. 2018;169(3):137-145. doi:10.7326/M17-3107
18. Wiechers I. Program focuses on safe psychiatric medication. Published April 21, 2016. Accessed February 9, 2022. https://blogs.va.gov/VAntage/27099/program-focuses-safe-psychiatric-medication/
19. Newman S; California Health Care Foundation. How to pay for it – MAT in the emergency department: FAQ. Published March 2019. Accessed February 9, 2022. https://www.chcf.org/wp-content/uploads/2019/03/HowToPayForMATinED.pdf
Preliminary Observations of Veterans Without HIV Who Have Mycobacterium avium Complex Pulmonary Disease
Nontuberculous Mycobacterium (NTM) is a ubiquitous organism known to cause a variety of infections in susceptible hosts; however, pulmonary infection is the most common. Mycobacterium avium complex (MAC) is the most prevalent cause of NTM-related pulmonary disease (NTM-PD) and is associated with underlying structural lung disease, such as chronic obstructive pulmonary disease (COPD) and noncystic fibrosis bronchiectasis.1-3
Diagnosis of NTM-PD requires (1) symptoms or radiographic abnormality; and (2) at least 2 sputum cultures positive with the same organism or at least 1 positive culture result on bronchoscopy (wash, lavage, or biopsy).1 Notably, the natural history of untreated NTM-PD varies, though even mild disease may progress substantially.4-6 Progressive disease is more likely to occur in those with a positive smear or more extensive radiographic findings at the initial diagnosis.7 A nationwide Medicare-based study showed that patients with NTM-PD had a higher rate of all-cause mortality than did patients without NTM-PD.8 In a study of 123 patients from Taiwan with MAC-PD, lack of treatment was an independent predictor of mortality.9 Given the risk of progressive morbidity and mortality, recent guidelines recommend initiation of a susceptibility driven, macrolide-based, 3-drug treatment regimen over watchful waiting.10
MAC-PD is increasingly recognized among US veterans.11,12 The Jesse Brown Veterans Affairs Medical Center (JBVAMC) in south/west Chicago serves a large, predominantly Black male population of veterans many of whom are socioeconomically underresourced, and half are aged ≥ 65 years. We observed that initiation of guideline-directed therapy in veterans with MAC-PD at JBVAMC varied among health care professionals (HCPs) in the pulmonary clinic. Therefore, the purpose of this retrospective study was to describe and compare the characteristics of veterans without HIV were diagnosed with MAC-PD and managed at JBVAMC.
Methods
The hospital microbiology department identified veterans diagnosed with NTM at JBVAMC between October 2008 and July 2019. Veterans included in the study were considered to have MAC-PD per American Thoracic Society (ATS)/Infectious Diseases Society of America (ISDA) guidelines and those diagnosed with HIV were excluded from analysis. The electronic health record (EHR) was queried for pertinent demographics, smoking history, comorbidities, and symptoms at the time of a positive mycobacterial culture. Computed tomography (CT) and pulmonary function tests (PFTs) performed within 1 year of diagnosis were included. PFTs were assessed in accordance with Global Initiative for Obstructive Lung Disease (GOLD) criteria, with normal forced expiratory volume in 1 second (FEV1) and forced vital capacity (FVC) values defined as ≥ 80% and a normal FEV1/FVC ratio defined as ≥ 70. The diffusion capacity of lung for carbon monoxide (DLCO) was assessed per 2017 European Respiratory Society (ERS) technical standards and was considered reduced if below the lower limit of normal.13 Information regarding treatment decisions, initiation, and cessation were collected. All-cause mortality was recorded if available in the EHR at the time of data collection.
Statistical analysis was performed using Mann-Whitney U and Fisher exact tests where appropriate. P < .05 was considered statistically significant. The study was approved by the JBVAMC Institutional Review Board.
Results
We identified 43 veterans who had a positive culture for MAC; however, only 19 veterans met the diagnostic criteria for MAC-PD and were included in the study (Table). The cohort included predominantly Black and male veterans with a median age of 74 years at time of diagnosis (range, 45-92). Sixteen veterans had underlying lung disease (84.2%), and 16 (84.2%) were current or former smokers. Common comorbidities included COPD, obstructive sleep apnea, gastroesophageal reflux disease, and lung cancer. Respiratory symptoms were reported in 17 veterans (89.5%), 15 (78.9%) had a chronic cough, and 10 (52.6%) had dyspnea. Fifteen veterans had a chest CT scan within 1 year of diagnosis: A nodular and tree-in-bud pattern was most commonly found in 13 (86.7%) of veterans. Thirteen veterans had PFTs within 1 year of MAC-PD diagnosis, of whom 6 had a restrictive pattern with percent predicted FVC < 80%, and 9 had evidence of obstruction with FEV1/FVC < 70. DLCO was below the lower limit of normal in 18 veterans. Finally, 6 veterans were deceased at the time of the study.
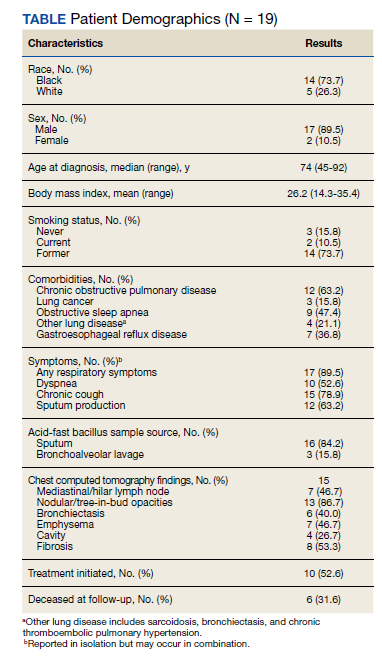
Of the 19 veterans, guideline-directed, combination antimycobacterial therapy for MAC-PD was initiated in only 10 (52.6%) patients due to presence of symptoms and/or imaging abnormalities. Treatment was deferred due to improved symptoms, concern for adverse events (AEs), or lost to follow-up. Five veterans stopped treatment prematurely due to AEs, lost to follow-up, or all-cause mortality. Assessment of differences between treated and untreated groups revealed no significant difference in race, sex, age, body mass index (BMI), symptom presence, or chest CT abnormalities. There was no statistically significant difference in all-cause mortality (40% and 22.2% in treated and untreated group, respectively).
To further understand the differences of this cohort, the 13 veterans alive at time of the study were compared with the 6 who had since died of all-cause mortality. No statistically significant differences were found.
Discussion
Consistent with previous reports in the literature, veterans in our cohort were predominantly current or former smoking males with underlying COPD and bronchiectasis.1-3,11,12 Chest CT findings varied: Most veterans presented not only with nodules and tree-in-bud opacities, but also a high frequency of fibrosis and emphysema. PFTs revealed a variety of obstruction and restrictive patterns, and most veterans had a reduced DLCO, though it is unclear whether this is reflective of underlying emphysema, fibrosis, or an alternative cardiopulmonary disease.13,14
While underlying structural lung disease may have been a risk factor for MAC-PD in this cohort, the contribution of environmental and domiciliary factors in metropolitan Chicago neighborhoods is unknown. JBVAMC serves an underresourced population who live in the west and south Chicago neighborhoods. Household factors, ambient and indoor air pollution, and potential contamination of the water supply and surface soil may contribute to the prevalence of MAC-PD in this group.15-19 Further studies are warranted to characterize MAC-PD and its treatment in veterans without HIV who reside in underresourced urban communities in the US.
Recent ATS, European Society of Clinical Microbiology and Infectious Diseases, and IDSA guidelines recommend combination antimycobacterial therapy for patients who meet clinical, radiographic, and microbiologic criteria for the diagnosis of MAC-PD.10 Patients who meet these diagnostic criteria, particularly patients with smear positivity or fibrocavitary disease, should be treated because of risk of unfavorable outcomes.15,20-22 However, we found that the initiation of guideline-recommended antimycobacterial therapy in veterans without HIV with MAC-PD were inconsistent among HCPs. The reasons underlying this phenomenon were not apparent beyond cited reasons for treatment initiation or deference. Despite this inconsistency, there was no clear difference in age, BMI, symptom burden, radiographic abnormality, or all-cause mortality between treatment groups. Existing studies support slow but substantial progression of untreated MAC-PD, and while treatment prevents deterioration of the disease, it does not prevent progression of bronchiectasis.6 The natural history of MAC-PD in this veteran cohort has yet to be fully elucidated. Furthermore, the 50% treatment dropout rate was higher than previously reported rates (11-33%).5 However, the small number of veterans in this study precludes meaningful comparison with similar reports in the literature.
Limitations
The limitations of this small, single-center, retrospective study prevent a robust, generalizable comparison between groups. Further studies are warranted to characterize MAC-PD and its treatment in veterans without HIV who reside in underresourced urban communities in the US.24-26
Conclusions
These data suggest that clinical, imaging, and treatment attributes of MAC-PD in veterans without HIV who reside in metropolitan Chicago are heterogeneous and are associated with a relatively high mortality rate. Although there was no difference in the attributes or outcomes of veterans who did and did not initiate treatment despite current recommendations, further studies are needed to better explore these relationships.
1. Griffith DE, Aksamit T, Brown-Elliott BA, et al. An official ATS/ IDSA statement: diagnosis, treatment, and prevention of nontuberculous mycobacterial diseases [published correction appears in Am J Respir Crit Care Med. 2007 Apr 1;175(7):744-5. Dosage error in article text]. Am J Respir Crit Care Med. 2007;175(4):367-416. doi:10.1164/rccm.200604-571ST
2. Prevots DR, Shaw PA, Strickland D, et al. Nontuberculous mycobacterial lung disease prevalence at four integrated health care delivery systems. Am J Respir Crit Care Med. 2010;182(7):970-976. doi:10.1164/rccm.201002-0310OC
3. Winthrop KL, Marras TK, Adjemian J, Zhang H, Wang P, Zhang Q. Incidence and prevalence of nontuberculous mycobacterial lung disease in a large U.S. managed care health plan, 2008-2015. Ann Am Thorac Soc. 2020;17(2):178-185. doi:10.1513/AnnalsATS.201804-236OC
4. Field SK, Fisher D, Cowie RL. Mycobacterium avium complex pulmonary disease in patients without HIV infection. Chest. 2004;126(2):566-581. doi:10.1378/chest.126.2.566
5. Kimizuka Y, Hoshino Y, Nishimura T, et al. Retrospective evaluation of natural course in mild cases of Mycobacterium avium complex pulmonary disease. PLoS One. 2019;14(4):e0216034. Published 2019 Apr 25. doi:10.1371/journal.pone.0216034
6. Kotilainen H, Valtonen V, Tukiainen P, Poussa T, Eskola J, Järvinen A. Clinical findings in relation to mortality in nontuberculous mycobacterial infections: patients with Mycobacterium avium complex have better survival than patients with other mycobacteria. Eur J Clin Microbiol Infect Dis. 2015;34(9):1909-1918. doi:10.1007/s10096-015-2432-8.
7. Hwang JA, Kim S, Jo KW, Shim TS. Natural history of Mycobacterium avium complex lung disease in untreated patients with stable course. Eur Respir J. 2017;49(3):1600537. Published 2017 Mar 8. doi:10.1183/13993003.00537-2016
8. Adjemian J, Olivier KN, Seitz AE, Holland SM, Prevots DR. Prevalence of nontuberculous mycobacterial lung disease in U.S. Medicare beneficiaries. Am J Respir Crit Care Med. 2012;185(8):881-886. doi:10.1164/rccm.201111-2016OC
9. Wang PH, Pan SW, Shu CC, et al. Clinical course and risk factors of mortality in Mycobacterium avium complex lung disease without initial treatment. Respir Med. 2020;171:106070. doi:10.1016/j.rmed.2020.106070
10. Daley CL, Iaccarino JM, Lange C, et al. Treatment of nontuberculous mycobacterial pulmonary disease: an official ATS/ ERS/ESCMID/IDSA Clinical Practice Guideline [published correction appears in Clin Infect Dis. 2020 Dec 31;71(11):3023]. Clin Infect Dis. 2020;71(4):e1-e36. doi:10.1093/cid/ciaa241
11. Mirsaeidi M, Hadid W, Ericsoussi B, Rodgers D, Sadikot RT. Non-tuberculous mycobacterial disease is common in patients with non-cystic fibrosis bronchiectasis. Int J Infect Dis. 2013;17(11):e1000-e1004. doi:10.1016/j.ijid.2013.03.018
12. Oda G, Winters MA, Pacheco SM, et al. Clusters of nontuberculous mycobacteria linked to water sources at three Veterans Affairs medical centers. Infect Control Hosp Epidemiol. 2020;41(3):320-330. doi:10.1017/ice.2019.342
13. Stanojevic S, Graham BL, Cooper BG, et al. Official ERS technical standards: Global Lung Function Initiative reference values for the carbon monoxide transfer factor for Caucasians [published correction appears in Eur Respir J. 2020 Oct 15;56(4):]. Eur Respir J. 2017;50(3):1700010. Published 2017 Sep 11. doi:10.1183/13993003.00010-2017
14. Macintyre N, Crapo RO, Viegi G, et al. Standardisation of the single-breath determination of carbon monoxide uptake in the lung. Eur Respir J. 2005;26(4):720-735. doi:10.1183/09031936.05.00034905
15. Chalmers JD, Balavoine C, Castellotti PF, et al. European Respiratory Society International Congress, Madrid, 2019: nontuberculous mycobacterial pulmonary disease highlights. ERJ Open Res. 2020;6(4):00317-2020. Published 2020 Oct 19. doi:10.1183/23120541.00317-2020
16. Hamilton LA, Falkinham JO. Aerosolization of Mycobacterium avium and Mycobacterium abscessus from a household ultrasonic humidifier. J Med Microbiol. 2018;67(10):1491-1495. doi:10.1099/jmm.0.000822
17. Hannah CE, Ford BA, Chung J, Ince D, Wanat KA. Characteristics of nontuberculous mycobacterial infections at a midwestern tertiary hospital: a retrospective study of 365 patients. Open Forum Infect Dis. 2020;7(6):ofaa173. Published 2020 May 25. doi:10.1093/ofid/ofaa173
18. Rautiala S, Torvinen E, Torkko P, et al. Potentially pathogenic, slow-growing mycobacteria released into workplace air during the remediation of buildings. J Occup Environ Hyg. 2004;1(1):1-6. doi:10.1080/15459620490250008
19. Tzou CL, Dirac MA, Becker AL, et al. Association between Mycobacterium avium complex pulmonary disease and mycobacteria in home water and soil. Ann Am Thorac Soc. 2020;17(1):57-62. doi:10.1513/AnnalsATS.201812-915OC
20. Daley CL, Winthrop KL. Mycobacterium avium complex: addressing gaps in diagnosis and management. J Infect Dis. 2020;222(suppl 4):S199-S211. doi:10.1093/infdis/jiaa354 21. Kwon BS, Lee JH, Koh Y, et al. The natural history of noncavitary nodular bronchiectatic Mycobacterium avium complex lung disease. Respir Med. 2019;150:45-50. doi:10.1016/j.rmed.2019.02.007
22. Nasiri MJ, Ebrahimi G, Arefzadeh S, Zamani S, Nikpor Z, Mirsaeidi M. Antibiotic therapy success rate in pulmonary Mycobacterium avium complex: a systematic review and meta-analysis. Expert Rev Anti Infect Ther. 2020;18(3):263- 273. doi:10.1080/14787210.2020.1720650
23. Diel R, Lipman M, Hoefsloot W. High mortality in patients with Mycobacterium avium complex lung disease: a systematic review. BMC Infect Dis. 2018;18(1):206. Published 2018 May 3. doi:10.1186/s12879-018-3113-x
24. Marras TK, Prevots DR, Jamieson FB, Winthrop KL; Pulmonary MAC Outcomes Group. Opinions differ by expertise in Mycobacterium avium complex disease. Ann Am Thorac Soc. 2014;11(1):17-22. doi:10.1513/AnnalsATS.201305-136OC
25. Plotinsky RN, Talbot EA, von Reyn CF. Proposed definitions for epidemiologic and clinical studies of Mycobacterium avium complex pulmonary disease. PLoS One. 2013;8(11):e77385. Published 2013 Nov 12. doi:10.1371/journal.pone.0077385
26. Swenson C, Zerbe CS, Fennelly K. Host variability in NTM disease: implications for research needs. Front Microbiol. 2018;9:2901. Published 2018 Dec 3. doi:10.3389/fmicb.2018.02901
Nontuberculous Mycobacterium (NTM) is a ubiquitous organism known to cause a variety of infections in susceptible hosts; however, pulmonary infection is the most common. Mycobacterium avium complex (MAC) is the most prevalent cause of NTM-related pulmonary disease (NTM-PD) and is associated with underlying structural lung disease, such as chronic obstructive pulmonary disease (COPD) and noncystic fibrosis bronchiectasis.1-3
Diagnosis of NTM-PD requires (1) symptoms or radiographic abnormality; and (2) at least 2 sputum cultures positive with the same organism or at least 1 positive culture result on bronchoscopy (wash, lavage, or biopsy).1 Notably, the natural history of untreated NTM-PD varies, though even mild disease may progress substantially.4-6 Progressive disease is more likely to occur in those with a positive smear or more extensive radiographic findings at the initial diagnosis.7 A nationwide Medicare-based study showed that patients with NTM-PD had a higher rate of all-cause mortality than did patients without NTM-PD.8 In a study of 123 patients from Taiwan with MAC-PD, lack of treatment was an independent predictor of mortality.9 Given the risk of progressive morbidity and mortality, recent guidelines recommend initiation of a susceptibility driven, macrolide-based, 3-drug treatment regimen over watchful waiting.10
MAC-PD is increasingly recognized among US veterans.11,12 The Jesse Brown Veterans Affairs Medical Center (JBVAMC) in south/west Chicago serves a large, predominantly Black male population of veterans many of whom are socioeconomically underresourced, and half are aged ≥ 65 years. We observed that initiation of guideline-directed therapy in veterans with MAC-PD at JBVAMC varied among health care professionals (HCPs) in the pulmonary clinic. Therefore, the purpose of this retrospective study was to describe and compare the characteristics of veterans without HIV were diagnosed with MAC-PD and managed at JBVAMC.
Methods
The hospital microbiology department identified veterans diagnosed with NTM at JBVAMC between October 2008 and July 2019. Veterans included in the study were considered to have MAC-PD per American Thoracic Society (ATS)/Infectious Diseases Society of America (ISDA) guidelines and those diagnosed with HIV were excluded from analysis. The electronic health record (EHR) was queried for pertinent demographics, smoking history, comorbidities, and symptoms at the time of a positive mycobacterial culture. Computed tomography (CT) and pulmonary function tests (PFTs) performed within 1 year of diagnosis were included. PFTs were assessed in accordance with Global Initiative for Obstructive Lung Disease (GOLD) criteria, with normal forced expiratory volume in 1 second (FEV1) and forced vital capacity (FVC) values defined as ≥ 80% and a normal FEV1/FVC ratio defined as ≥ 70. The diffusion capacity of lung for carbon monoxide (DLCO) was assessed per 2017 European Respiratory Society (ERS) technical standards and was considered reduced if below the lower limit of normal.13 Information regarding treatment decisions, initiation, and cessation were collected. All-cause mortality was recorded if available in the EHR at the time of data collection.
Statistical analysis was performed using Mann-Whitney U and Fisher exact tests where appropriate. P < .05 was considered statistically significant. The study was approved by the JBVAMC Institutional Review Board.
Results
We identified 43 veterans who had a positive culture for MAC; however, only 19 veterans met the diagnostic criteria for MAC-PD and were included in the study (Table). The cohort included predominantly Black and male veterans with a median age of 74 years at time of diagnosis (range, 45-92). Sixteen veterans had underlying lung disease (84.2%), and 16 (84.2%) were current or former smokers. Common comorbidities included COPD, obstructive sleep apnea, gastroesophageal reflux disease, and lung cancer. Respiratory symptoms were reported in 17 veterans (89.5%), 15 (78.9%) had a chronic cough, and 10 (52.6%) had dyspnea. Fifteen veterans had a chest CT scan within 1 year of diagnosis: A nodular and tree-in-bud pattern was most commonly found in 13 (86.7%) of veterans. Thirteen veterans had PFTs within 1 year of MAC-PD diagnosis, of whom 6 had a restrictive pattern with percent predicted FVC < 80%, and 9 had evidence of obstruction with FEV1/FVC < 70. DLCO was below the lower limit of normal in 18 veterans. Finally, 6 veterans were deceased at the time of the study.
Of the 19 veterans, guideline-directed, combination antimycobacterial therapy for MAC-PD was initiated in only 10 (52.6%) patients due to presence of symptoms and/or imaging abnormalities. Treatment was deferred due to improved symptoms, concern for adverse events (AEs), or lost to follow-up. Five veterans stopped treatment prematurely due to AEs, lost to follow-up, or all-cause mortality. Assessment of differences between treated and untreated groups revealed no significant difference in race, sex, age, body mass index (BMI), symptom presence, or chest CT abnormalities. There was no statistically significant difference in all-cause mortality (40% and 22.2% in treated and untreated group, respectively).
To further understand the differences of this cohort, the 13 veterans alive at time of the study were compared with the 6 who had since died of all-cause mortality. No statistically significant differences were found.
Discussion
Consistent with previous reports in the literature, veterans in our cohort were predominantly current or former smoking males with underlying COPD and bronchiectasis.1-3,11,12 Chest CT findings varied: Most veterans presented not only with nodules and tree-in-bud opacities, but also a high frequency of fibrosis and emphysema. PFTs revealed a variety of obstruction and restrictive patterns, and most veterans had a reduced DLCO, though it is unclear whether this is reflective of underlying emphysema, fibrosis, or an alternative cardiopulmonary disease.13,14
While underlying structural lung disease may have been a risk factor for MAC-PD in this cohort, the contribution of environmental and domiciliary factors in metropolitan Chicago neighborhoods is unknown. JBVAMC serves an underresourced population who live in the west and south Chicago neighborhoods. Household factors, ambient and indoor air pollution, and potential contamination of the water supply and surface soil may contribute to the prevalence of MAC-PD in this group.15-19 Further studies are warranted to characterize MAC-PD and its treatment in veterans without HIV who reside in underresourced urban communities in the US.
Recent ATS, European Society of Clinical Microbiology and Infectious Diseases, and IDSA guidelines recommend combination antimycobacterial therapy for patients who meet clinical, radiographic, and microbiologic criteria for the diagnosis of MAC-PD.10 Patients who meet these diagnostic criteria, particularly patients with smear positivity or fibrocavitary disease, should be treated because of risk of unfavorable outcomes.15,20-22 However, we found that the initiation of guideline-recommended antimycobacterial therapy in veterans without HIV with MAC-PD were inconsistent among HCPs. The reasons underlying this phenomenon were not apparent beyond cited reasons for treatment initiation or deference. Despite this inconsistency, there was no clear difference in age, BMI, symptom burden, radiographic abnormality, or all-cause mortality between treatment groups. Existing studies support slow but substantial progression of untreated MAC-PD, and while treatment prevents deterioration of the disease, it does not prevent progression of bronchiectasis.6 The natural history of MAC-PD in this veteran cohort has yet to be fully elucidated. Furthermore, the 50% treatment dropout rate was higher than previously reported rates (11-33%).5 However, the small number of veterans in this study precludes meaningful comparison with similar reports in the literature.
Limitations
The limitations of this small, single-center, retrospective study prevent a robust, generalizable comparison between groups. Further studies are warranted to characterize MAC-PD and its treatment in veterans without HIV who reside in underresourced urban communities in the US.24-26
Conclusions
These data suggest that clinical, imaging, and treatment attributes of MAC-PD in veterans without HIV who reside in metropolitan Chicago are heterogeneous and are associated with a relatively high mortality rate. Although there was no difference in the attributes or outcomes of veterans who did and did not initiate treatment despite current recommendations, further studies are needed to better explore these relationships.
1. Griffith DE, Aksamit T, Brown-Elliott BA, et al. An official ATS/ IDSA statement: diagnosis, treatment, and prevention of nontuberculous mycobacterial diseases [published correction appears in Am J Respir Crit Care Med. 2007 Apr 1;175(7):744-5. Dosage error in article text]. Am J Respir Crit Care Med. 2007;175(4):367-416. doi:10.1164/rccm.200604-571ST
2. Prevots DR, Shaw PA, Strickland D, et al. Nontuberculous mycobacterial lung disease prevalence at four integrated health care delivery systems. Am J Respir Crit Care Med. 2010;182(7):970-976. doi:10.1164/rccm.201002-0310OC
3. Winthrop KL, Marras TK, Adjemian J, Zhang H, Wang P, Zhang Q. Incidence and prevalence of nontuberculous mycobacterial lung disease in a large U.S. managed care health plan, 2008-2015. Ann Am Thorac Soc. 2020;17(2):178-185. doi:10.1513/AnnalsATS.201804-236OC
4. Field SK, Fisher D, Cowie RL. Mycobacterium avium complex pulmonary disease in patients without HIV infection. Chest. 2004;126(2):566-581. doi:10.1378/chest.126.2.566
5. Kimizuka Y, Hoshino Y, Nishimura T, et al. Retrospective evaluation of natural course in mild cases of Mycobacterium avium complex pulmonary disease. PLoS One. 2019;14(4):e0216034. Published 2019 Apr 25. doi:10.1371/journal.pone.0216034
6. Kotilainen H, Valtonen V, Tukiainen P, Poussa T, Eskola J, Järvinen A. Clinical findings in relation to mortality in nontuberculous mycobacterial infections: patients with Mycobacterium avium complex have better survival than patients with other mycobacteria. Eur J Clin Microbiol Infect Dis. 2015;34(9):1909-1918. doi:10.1007/s10096-015-2432-8.
7. Hwang JA, Kim S, Jo KW, Shim TS. Natural history of Mycobacterium avium complex lung disease in untreated patients with stable course. Eur Respir J. 2017;49(3):1600537. Published 2017 Mar 8. doi:10.1183/13993003.00537-2016
8. Adjemian J, Olivier KN, Seitz AE, Holland SM, Prevots DR. Prevalence of nontuberculous mycobacterial lung disease in U.S. Medicare beneficiaries. Am J Respir Crit Care Med. 2012;185(8):881-886. doi:10.1164/rccm.201111-2016OC
9. Wang PH, Pan SW, Shu CC, et al. Clinical course and risk factors of mortality in Mycobacterium avium complex lung disease without initial treatment. Respir Med. 2020;171:106070. doi:10.1016/j.rmed.2020.106070
10. Daley CL, Iaccarino JM, Lange C, et al. Treatment of nontuberculous mycobacterial pulmonary disease: an official ATS/ ERS/ESCMID/IDSA Clinical Practice Guideline [published correction appears in Clin Infect Dis. 2020 Dec 31;71(11):3023]. Clin Infect Dis. 2020;71(4):e1-e36. doi:10.1093/cid/ciaa241
11. Mirsaeidi M, Hadid W, Ericsoussi B, Rodgers D, Sadikot RT. Non-tuberculous mycobacterial disease is common in patients with non-cystic fibrosis bronchiectasis. Int J Infect Dis. 2013;17(11):e1000-e1004. doi:10.1016/j.ijid.2013.03.018
12. Oda G, Winters MA, Pacheco SM, et al. Clusters of nontuberculous mycobacteria linked to water sources at three Veterans Affairs medical centers. Infect Control Hosp Epidemiol. 2020;41(3):320-330. doi:10.1017/ice.2019.342
13. Stanojevic S, Graham BL, Cooper BG, et al. Official ERS technical standards: Global Lung Function Initiative reference values for the carbon monoxide transfer factor for Caucasians [published correction appears in Eur Respir J. 2020 Oct 15;56(4):]. Eur Respir J. 2017;50(3):1700010. Published 2017 Sep 11. doi:10.1183/13993003.00010-2017
14. Macintyre N, Crapo RO, Viegi G, et al. Standardisation of the single-breath determination of carbon monoxide uptake in the lung. Eur Respir J. 2005;26(4):720-735. doi:10.1183/09031936.05.00034905
15. Chalmers JD, Balavoine C, Castellotti PF, et al. European Respiratory Society International Congress, Madrid, 2019: nontuberculous mycobacterial pulmonary disease highlights. ERJ Open Res. 2020;6(4):00317-2020. Published 2020 Oct 19. doi:10.1183/23120541.00317-2020
16. Hamilton LA, Falkinham JO. Aerosolization of Mycobacterium avium and Mycobacterium abscessus from a household ultrasonic humidifier. J Med Microbiol. 2018;67(10):1491-1495. doi:10.1099/jmm.0.000822
17. Hannah CE, Ford BA, Chung J, Ince D, Wanat KA. Characteristics of nontuberculous mycobacterial infections at a midwestern tertiary hospital: a retrospective study of 365 patients. Open Forum Infect Dis. 2020;7(6):ofaa173. Published 2020 May 25. doi:10.1093/ofid/ofaa173
18. Rautiala S, Torvinen E, Torkko P, et al. Potentially pathogenic, slow-growing mycobacteria released into workplace air during the remediation of buildings. J Occup Environ Hyg. 2004;1(1):1-6. doi:10.1080/15459620490250008
19. Tzou CL, Dirac MA, Becker AL, et al. Association between Mycobacterium avium complex pulmonary disease and mycobacteria in home water and soil. Ann Am Thorac Soc. 2020;17(1):57-62. doi:10.1513/AnnalsATS.201812-915OC
20. Daley CL, Winthrop KL. Mycobacterium avium complex: addressing gaps in diagnosis and management. J Infect Dis. 2020;222(suppl 4):S199-S211. doi:10.1093/infdis/jiaa354 21. Kwon BS, Lee JH, Koh Y, et al. The natural history of noncavitary nodular bronchiectatic Mycobacterium avium complex lung disease. Respir Med. 2019;150:45-50. doi:10.1016/j.rmed.2019.02.007
22. Nasiri MJ, Ebrahimi G, Arefzadeh S, Zamani S, Nikpor Z, Mirsaeidi M. Antibiotic therapy success rate in pulmonary Mycobacterium avium complex: a systematic review and meta-analysis. Expert Rev Anti Infect Ther. 2020;18(3):263- 273. doi:10.1080/14787210.2020.1720650
23. Diel R, Lipman M, Hoefsloot W. High mortality in patients with Mycobacterium avium complex lung disease: a systematic review. BMC Infect Dis. 2018;18(1):206. Published 2018 May 3. doi:10.1186/s12879-018-3113-x
24. Marras TK, Prevots DR, Jamieson FB, Winthrop KL; Pulmonary MAC Outcomes Group. Opinions differ by expertise in Mycobacterium avium complex disease. Ann Am Thorac Soc. 2014;11(1):17-22. doi:10.1513/AnnalsATS.201305-136OC
25. Plotinsky RN, Talbot EA, von Reyn CF. Proposed definitions for epidemiologic and clinical studies of Mycobacterium avium complex pulmonary disease. PLoS One. 2013;8(11):e77385. Published 2013 Nov 12. doi:10.1371/journal.pone.0077385
26. Swenson C, Zerbe CS, Fennelly K. Host variability in NTM disease: implications for research needs. Front Microbiol. 2018;9:2901. Published 2018 Dec 3. doi:10.3389/fmicb.2018.02901
Impact of Lithium on Suicidality in the Veteran Population
Suicide is the tenth leading cause of death in the United States claiming nearly 48,000 individuals in 2019 and is the second leading cause of death among individuals aged 10 to 34 years.1 From 1999 to 2019, the suicide rate increased by 33%.1 In a retrospective study evaluating suicide risk in > 29,000 men, veterans had a greater risk for suicide in all age groups except for the oldest when compared with nonveterans.2 Another study of > 800,000 veterans found that younger veterans were most at risk for suicide.3 Veterans with completed suicides have a high incidence of affective disorders comorbid with substance use disorders, and therefore it is imperative to optimally treat these conditions to address suicidality.4 Additionally, a retrospective case-control study of veterans who died by suicide matched to controls identified that the cases had significantly higher rates of mental health conditions and suicidal ideation. Given that the veteran population is at higher risk of suicide, research of treatments to address suicidal ideation in veterans is needed.5
Lithium and Antisuicidal Properties
Lithium is the oldest treatment for bipolar disorder and is a long-standing first-line option due to its well-established efficacy as a mood stabilizer.6 Lithium’s antisuicidal properties separate it from the other pharmacologic options for bipolar disorder. A possible explanation for lithium’s unique antisuicidal properties is that these effects are mediated by its impact on aggression and impulsivity, which are both linked to an increased suicide risk.7,8 A meta-analysis by Baldessarini and colleagues demonstrated that patients with mood disorders who were prescribed lithium had a 5 times lower risk of suicide and attempts than did those not treated with lithium.9 Lithium’s current place in therapy is in the treatment of bipolar disorder and major depressive disorder augmentation.10-12Smith and colleagues found that in a cohort study of 21,194 veterans diagnosed with mental health conditions and initiated on lithium or valproate, there were no significant differences in associations with suicide observed between these agents over 365 days; however, there was a significant increased risk of suicide among patients discontinuing or modifying lithium within the first 180 days of treatment.13
Currently, lithium is thought to be underutilized at the US Department of Veterans Affairs (VA) Michael E. DeBakey VA Medical Center (MEDVAMC) in Houston, Texas, based on the number of prescriptions of lithium in the large population of veterans seen by mental health clinicians. MEDVAMC is a 538-bed academic teaching hospital serving approximately 130,000 veterans in southeast Texas. The Mental Health Care Line has 73 inpatient beds and an outpatient clinic serving > 12,000 patients annually. By retrospectively evaluating changes in suicidality in a sample of veterans prescribed lithium, we may be able to better understand the role that lithium plays in a population that has a higher suicide rate than does the general population. The primary objective of this study was to evaluate the change in number of suicide attempts from 3 months prior to lithium initiation to 3 months following a 6-month duration of lithium use. The secondary objective was to determine the change in suicidal ideation from the period prior to lithium use to the period following 6 months of lithium use.
Methods
This was a single-site, retrospective chart review conducted between October 2017 and April 2018. Prior to data collection, the MEDVAMC Research and Development committee approved the study as quality assurance research. Patients with an active lithium prescription were identified using the VA Lithium Lab Monitoring Dashboard, which includes all patients on lithium, their lithium level, and other data such as upcoming appointments.
Inclusion criteria consisted of adults who were aged ≥ 18 years, had an active lithium prescription on the date of data extraction, and had an active lithium prescription for at least 6 months. Patients were excluded if they had < 3 months of data before and/or after lithium was used for 6 months, and if they were initiated on lithium outside MEDVAMC. Cumulatively, patients had to have at least 12 months of data: 3 months prior to lithium use, at least 6 months of lithium use, and 9 months after lithium initiation.
Suicide Attempt and Suicidal Ideation Identification
When determining the number of suicide attempts, we recorded 4 data points: Veterans Crisis Line notes documenting suicide attempts, hospital admissions for suicide attempts, suicide behavior reports within the indicated time frame, and mental health progress notes documenting suicide attempts. Suicidal ideation was measured in 4 ways. First, we looked at the percentage of outpatient mental health progress notes documenting suicidal ideation. Second, using the Patient Health Questionnaire-9 (PHQ-9) depression assessments, we looked at the percentage of patients that indicated several days, more than half the days, or nearly every day to the question, “Thoughts that you would be better off dead or of hurting yourself in some way.”14 Third, we recorded the percentage of suicide risk assessments that patients responded yes to both questions on current preoccupation with suicidal thoughts and serious intent and plan to commit suicide with access to guns, stashed pills, or other means. Finally, we noted the percentage of suicide risk assessments where the assessment of risk was moderate or high.
A retrospective electronic health record (EHR) review was performed and the following information was obtained: patient demographics, lithium refill history, concomitant psychotropic medications and psychotherapy, lithium levels, comorbidities at lithium initiation, presence of a high-risk suicide flag in the EHR, suicide risk assessments, suicide behavior reports, Veteran Crisis Line notes, PHQ-9 assessments, and hospital admission and mental health outpatient notes. The lithium therapeutic range of 0.6-1.2 mmol/L is indicated for bipolar disorder and not other indications where the dose is typically titrated to effect rather than level. Medication possession ratio (MPR) was also calculated for lithium (sum of days’ supply for all fills in period ÷ number of days in period). A high-risk suicide flag alerts clinicians and staff that a mental health professional considers the veteran at risk for suicide.15 Statistical analysis was performed using the paired t test for means to assess proportional differences between variables for the primary and secondary outcomes. Descriptive statistics were used to describe the baseline characteristics.
Results
A total of 214 patients with an active prescription for lithium were identified on the Lithium Lab Monitoring Dashboard on October 31, 2017. After exclusion criteria were applied, 98 patients were included in the study (Figure 1). The 2 most common reasons for exclusion were due to patients not being on lithium for at least 6 months and being initiated on lithium at an outside facility. One patient was enrolled in a lithium research study (the medication ordered was lithium/placebo) and another patient refused all psychotropic medications according to the progress notes.
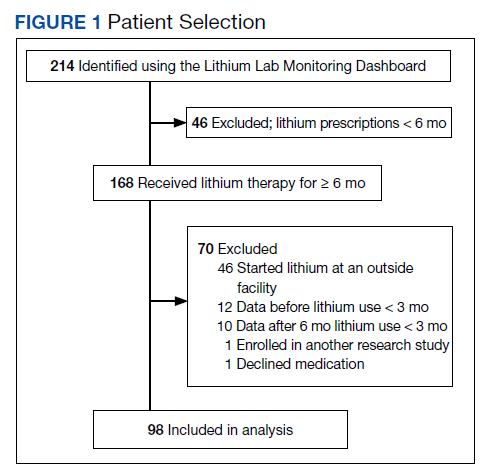
Most of the 98 patients (82.7%) were male with average age 50.5 years (Table 1). Almost half the patients (n = 47) were concomitantly participating in psychotherapy, and 50 (51.0%) patients received at least 1 antipsychotic medication. Twenty-nine patients had an active prescription for an additional mood stabilizer, and only 4 (4.1%) patients received lithium as monotherapy. Only 75 (76.5%) patients had a lithium level drawn during the 6 months of therapy, with 28 (37.3%) patients having a therapeutic lithium level (0.6 - 1.2 mmol/L). Seventy-one patients (72.4% ) were adherent to lithium therapy with a MPR > 0.8.16 Participants had 13 different psychiatric diagnoses at the time of lithium initiation; the most common were bipolar spectrum disorder (n = 38; 38.8%), depressive disorder (n = 27; 27.6%), and posttraumatic stress disorder (PTSD) (n = 26; 26.5%). Of note, 5 patients had a diagnosis of only PTSD without a concomitant mood disorder.
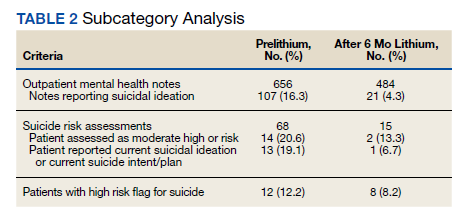
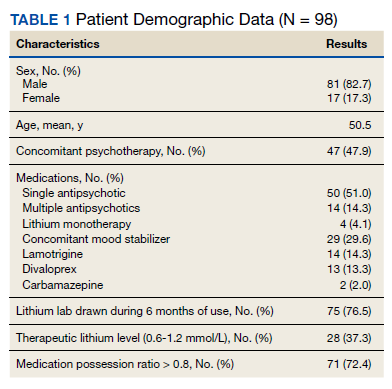
For the primary outcome, hospitalization for a suspected suicide attempt decreased from 4 (4.1%) before lithium use with a mean (SD) 0.04 (0.20) attempts per person to none within 3 months after lithium use for 6 months (t(97) = 2.03, P = .045) (Figure 2). The secondary outcome of hospitalization for suicidal ideations also decreased from 13 (13.3%) before lithium use with a mean (SD) 0.1 (0.3) ideations per person to 1 (1.0%) within 3 months after lithium use for 6 months with a mean (SD) 0.01 (0.1) ideations per person (t(97) = 3.68, P = .0004). Veteran Crisis Line calls also decreased from 4 (4.1%) with a mean (SD) 0.04 (0.2) calls per person to 1 (1.0%) within 3 months after 6 months of lithium with a mean (SD) 0.01 (0.1) calls per person (t(97) = 1.75, P = .08). The comparison of metrics from 3 months before lithium initiation and within 3 months after use saw decreases in all categories (Table 2). Outpatient notes documenting suicidal ideation decreased, as did the number of patients with a high-risk suicide flag.
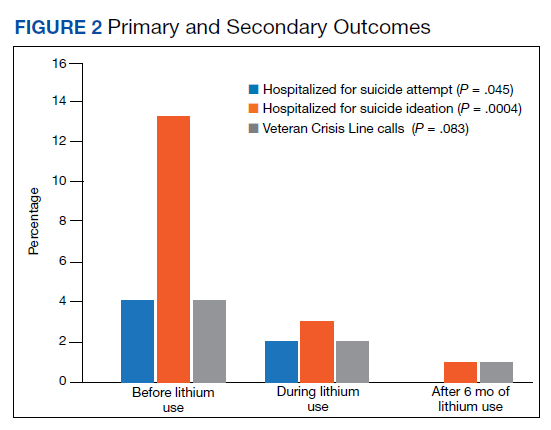
Discussion
The results of this study suggest lithium may have a role in reducing suicidality in a veteran population. There was a statistically significant reduction in hospitalizations for suicide attempt and suicidal ideation after at least 6 months of lithium use. These results are comparable with a previously published study that observed significant decreases in suicidal behavior and/or hospitalization risks among veterans taking lithium compared with those not taking lithium.17 Our study was similar in respect to the reduced hospitalizations among a veteran population; however, the previous study did not report a difference in suicide attempts and lithium use. This could be related to the longer follow-up time in the previous study (3 years) vs our study (9 months).
Our study identified a significant reduction in Veteran Crisis Line calls after at least 6 months of lithium use. While a reduction in suicidal ideations could be implicated in the decrease in crisis line calls, there may be a confounding variable. It is possible that after lithium initiation, veterans had more frequent contact with health care practitioners due to laboratory test monitoring and follow-up visits and thus had concerns/crises addressed during these interactions ultimately leading to a decreased utilization of the crisis line. Interestingly, there was a reduction in mental health outpatient notes from the prelithium period to the 3-month period that followed 6 months of lithium therapy. However, our study did not report on the number of mental health outpatient notes or visits during the 6-month lithium duration. Additionally, time of year/season could have an impact on suicidality, but this relationship was not evaluated in this study.
The presence of high-risk suicide flags also decreased from the prelithium period to the period 3 months following 6 months of lithium use. High-risk flags are reviewed by the suicide prevention coordinators and mental health professionals every 90 days; therefore, the patients with flags had multiple opportunities for review and thus renewal or discontinuation during the study period. A similar rationale can be applied to the high-risk flag as with the Veteran Crisis Line reduction, although this change could also be representative of a decrease in suicidality. Our study is different from other lithium studies because it included patients with a multitude of psychiatric diagnoses rather than just mood disorders. Five of the patients had a diagnosis of only PTSD and no documented mood disorder at the time of lithium initiation. Additional research is needed on the impact of lithium on suicidality in veterans with PTSD and psychiatric conditions other than mood disorders.
Underutilization of Lithium
Despite widespread knowledge of lithium’s antisuicidal effects, it is underutilized as a mood stabilizer in the US.18 There are various modifiable barriers that impact the prescribing as well as use of lithium. Clinicians may not be fully aware of lithium’s antisuicidal properties and may also have a low level of confidence in patients’ likelihood of adherence to laboratory monitoring.18,19 Due to the narrow therapeutic index of lithium, the consequences of nonadherence to monitoring can be dangerous, which may deter mental health professionals from prescribing this antisuicidal agent. At MEDVAMC, only 72.4% of patients with a lithium prescription had a lithium level drawn within a 6-month period. This could be attributed to patient nonadherence (eg, the test was ordered but the patient did not go) or clinician nonadherence (eg, test was not ordered).
With increased clinician education as well as clinics dedicated to lithium management that allow for closer follow-up, facilities may see an increased level of comfort with lithium use. Lithium management clinics that provide close follow-up may also help address patient-related concerns about adverse effects and allow for close monitoring. To facilitate lithium monitoring at MEDVAMC, mental health practitioners and pharmacists developed a lithium test monitoring menu that serves as a “one-stop shop” for lithium baseline and ongoing test results.
In the future, we may study the impact of this test monitoring menu on lithium prescribing. One may also consider whether lithium levels need to be monitored at different frequencies (eg, less frequently for depression than bipolar disorder) depending on the diagnoses. A better understanding of the necessity for therapeutic monitoring may potentially reduce barriers to prescribing for patients who do not have indications that have a recommended therapeutic range (eg, bipolar disorder).
Lithium Adherence
A primary patient-related concern for low lithium utilization is poor adherence. In this sample, 71 patients (72.4%) were considered fully adherent. This was higher than the rate of 54.1% reported by Sajatovic and colleagues in a study evaluating adherence to lithium and other anticonvulsants in veterans with bipolar disorder.20 Patients’ beliefs about medications and overall health as well as knowledge of the illness and treatment may impact adherence.21 The literature indicates that strategies such as cognitive behavioral therapy (CBT) and didactic lectures positively impact patients’ attitudes about lithium, which ultimately influences adherence.21-23 Involving a family member or significant other in psychotherapy may also improve lithium adherence.21 Specifically in the VA, to address knowledge deficits and improve overall adherence, the Lithium Lab Monitoring Dashboard could be used to identify and invite new lithium starts to educational groups about lithium. These groups could also serve as lithium management clinics.
Limitations
There were several limitations to this study. This was a single-site, retrospective chart review with a small sample size. We studied a cross-section of veterans with only active prescriptions, which limited the sample size. The results should be interpreted cautiously because < 40% of patients who had a level drawn were in the therapeutic range. Patients whose lithium levels were outside of the therapeutic range may have not been fully adherent to the medication. Further analysis based on reason for lithium prescription (eg, bipolar disorder vs depression vs aggression/impulsivity in PTSD) may be helpful in better understanding the results.
Additionally, while we collected data on concomitant mood stabilizers and antipsychotics, we did not collect data on concurrent antidepressant therapy and only 4% of patients were on lithium monotherapy. Data regarding veterans undergoing concurrent CBT during their lithium trial were not assessed in this study and could be considered a confounding factor for future studies. We included any Veteran Crisis Line call in our results regardless of the reason for the call, which could have led to overreporting of this suicidality marker.
Given its small sample size, this study should be considered as hypothesis-generating. Further studies are needed to address lithium’s antisuicidal effects in specific diagnoses (eg, PTSD, anxiety, schizoaffective disorder) to better understand its place in therapy. Studies evaluating the relationship between dosing and suicidality may help provide insight into whether the antisuicidal effect of lithium is dose-dependent and whether a specific dose range rather than a therapeutic level should be targeted for antisuicidal purposes.
Conclusions
People treated for an affective disorder have a 30-times greater risk of suicide than do those in the general population; however, as lithium can reduce the risk of suicide and self-harm, it should continue to have an important role in clinical practice.24 At MEDVAMC, we observed a statistically significant reduction in hospitalization for suicide attempts and suicidal ideation in veterans prescribed lithium following nonfatal suicide behavior and suicidal ideation. Prospective randomized placebo-controlled studies are needed to better understand lithium’s antisuicidal effects.
1. Centers for Disease Control and Prevention. Preventing Suicide Fact Sheet. Updated April 2021. Accessed February 16, 2022. https://www.cdc.gov/suicide/pdf/preventing-suicide-factsheet-2021-508.pdf
2. Kaplan MS, McFarland BH, Huguet N, Valenstein M. Suicide risk and precipitating circumstances among young, middle-aged, and older male veterans. Am J Public Health. 2012;102 Suppl 1(Suppl 1):S131-S137. doi:10.2105/AJPH.2011.300445
3. Zivin K, Kim HM, McCarthy JF, et al. Suicide mortality among individuals receiving treatment for depression in the Veterans Affairs health system: associations with patient and treatment setting characteristics. Am J Public Health. 2007;97(12):2193-2198. doi:10.2105/AJPH.2007.115477
4. Lehmann L, McCormick RA, McCracken L. Suicidal behavior among patients in the VA health care system. Psychiatr Serv. 1995;46(10):1069-1071. doi:10.1176/ps.46.10.1069
5. Dobscha SK, Denneson LM, Kovas AE, et al. Correlates of suicide among veterans treated in primary care: case-control study of a nationally representative sample. J Gen Intern Med. 2014;29(suppl 4):853-860. doi:10.1007/s11606-014-3028-1
6. Malhi GS, Tanious M, Das P, Coulston CM, Berk M. Potential mechanisms of action of lithium in bipolar disorder. Current understanding. CNS Drugs. 2013;27(2):135-153. doi:10.1007/s40263-013-0039-0
7. Kovacsics CE, Gottesman II, Gould TD. Lithium’s antisuicidal efficacy: elucidation of neurobiological targets using endophenotype strategies. Annu Rev Pharmacol Toxicol. 2009;49:175-198. doi:10.1146/annurev.pharmtox.011008.145557
8. Mann JJ, Waternaux C, Haas GL, Malone KM. Toward a clinical model of suicidal behavior in psychiatric patients. Am J Psychiatry. 1999;156(2):181-189. doi:10.1176/ajp.156.2.181
9. Baldessarini RJ, Tondo L, Davis P, Pompili M, Goodwin FK, Hennen J. Decreased risk of suicides and attempts during long-term lithium treatment: a meta-analytic review [published correction appears in Bipolar Disord. 2007 May;9(3):314]. Bipolar Disord. 2006;8(5 Pt 2):625-639. doi:10.1111/j.1399-5618.2006.00344.x
10. Yatham LN, Kennedy SH, Parikh SV, et al. Canadian Network for Mood and Anxiety Treatments (CANMAT) and International Society for Bipolar Disorders (ISBD) 2018 guidelines for the management of patients with bipolar disorder. Bipolar Disord. 2018;20(2):97-170. doi:10.1111/bdi.12609
11. Stein G, Bernadt M. Lithium augmentation therapy in tricyclic-resistant depression. A controlled trial using lithium in low and normal doses. Br J Psychiatry. 1993;162:634-640. doi:10.1192/bjp.162.5.634
12. Bauer M, Bschor T, Kunz D, Berghöfer A, Ströhle A, Müller-Oerlinghausen B. Double-blind, placebo-controlled trial of the use of lithium to augment antidepressant medication in continuation treatment of unipolar major depression. Am J Psychiatry. 2000;157(9):1429-1435. doi:10.1176/appi.ajp.157.9.1429
13. Smith EG, Austin KL, Kim HM, et al. Suicide risk in Veterans Health Administration patients with mental health diagnoses initiating lithium or valproate: a historical prospective cohort study. BMC Psychiatry. 2014;14:357. Published 2014 Dec 17. doi:10.1186/s12888-014-0357-x
14. Kroenke K, Spitzer RL, Williams JB. The PHQ-9: validity of a brief depression severity measure. J Gen Intern Med. 2001;16(9):606-613. doi:10.1046/j.1525-1497.2001.016009606.x
15. US Department of Veterans Affairs, Veterans Health Administration. Use of patient record flags to identify patients at high risk for suicide. VHA Directive 2008-036. Published July 18, 2008. Accessed February 7, 2022. www.va.gov/vhapublications/ViewPublication.asp?pub_ID=1719
16. Sylvia LG, Reilly-Harrington NA, Leon AC, et al. Medication adherence in a comparative effectiveness trial for bipolar disorder. Acta Psychiatr Scand. 2014;129(5):359-365. doi:10.1111/acps.12202
17. Yerevanian BI, Koek RJ, Mintz J. Bipolar pharmacotherapy and suicidal behavior. Part I: Lithium, divalproex and carbamazepine. J Affect Disord. 2007;103(1-3):5-11. doi:10.1016/j.jad.2007.05.019
18. Post RM. The New News about Lithium: An Underutilized Treatment in the United States. Neuropsychopharmacology. 2018;43(5):1174-1179. doi:10.1038/npp.2017.238
19. Öhlund L, Ott M, Oja S, et al. Reasons for lithium discontinuation in men and women with bipolar disorder: a retrospective cohort study [published correction appears in BMC Psychiatry. 2018 Oct 3;18(1):322]. BMC Psychiatry. 2018;18(1):37. Published 2018 Feb 7. doi:10.1186/s12888-018-1622-1
20. Sajatovic M, Valenstein M, Blow F, Ganoczy D, Ignacio R. Treatment adherence with lithium and anticonvulsant medications among patients with bipolar disorder. Psychiatr Serv. 2007;58(6):855-863. doi:10.1176/ps.2007.58.6.855
21. Chakrabarti S. Treatment-adherence in bipolar disorder: A patient-centred approach. World J Psychiatry. 2016;6(4):399-409. Published 2016 Dec 22. doi:10.5498/wjp.v6.i4.399
22. Gaudiano BA, Weinstock LM, Miller IW. Improving treatment adherence in bipolar disorder: a review of current psychosocial treatment efficacy and recommendations for future treatment development. Behav Modif. 2008;32(3):267-301. doi:10.1177/0145445507309023
23. Peet M, Harvey NS. Lithium maintenance: 1. A standard education programme for patients. Br J Psychiatry. 1991;158:197-200. doi:10.1192/bjp.158.2.197
24. Cipriani A, Hawton K, Stockton S, Geddes JR. Lithium in the prevention of suicide in mood disorders: updated systematic review and meta-analysis. BMJ. 2013;346:f3646. doi:10.1136/bmj.f3646
Suicide is the tenth leading cause of death in the United States claiming nearly 48,000 individuals in 2019 and is the second leading cause of death among individuals aged 10 to 34 years.1 From 1999 to 2019, the suicide rate increased by 33%.1 In a retrospective study evaluating suicide risk in > 29,000 men, veterans had a greater risk for suicide in all age groups except for the oldest when compared with nonveterans.2 Another study of > 800,000 veterans found that younger veterans were most at risk for suicide.3 Veterans with completed suicides have a high incidence of affective disorders comorbid with substance use disorders, and therefore it is imperative to optimally treat these conditions to address suicidality.4 Additionally, a retrospective case-control study of veterans who died by suicide matched to controls identified that the cases had significantly higher rates of mental health conditions and suicidal ideation. Given that the veteran population is at higher risk of suicide, research of treatments to address suicidal ideation in veterans is needed.5
Lithium and Antisuicidal Properties
Lithium is the oldest treatment for bipolar disorder and is a long-standing first-line option due to its well-established efficacy as a mood stabilizer.6 Lithium’s antisuicidal properties separate it from the other pharmacologic options for bipolar disorder. A possible explanation for lithium’s unique antisuicidal properties is that these effects are mediated by its impact on aggression and impulsivity, which are both linked to an increased suicide risk.7,8 A meta-analysis by Baldessarini and colleagues demonstrated that patients with mood disorders who were prescribed lithium had a 5 times lower risk of suicide and attempts than did those not treated with lithium.9 Lithium’s current place in therapy is in the treatment of bipolar disorder and major depressive disorder augmentation.10-12Smith and colleagues found that in a cohort study of 21,194 veterans diagnosed with mental health conditions and initiated on lithium or valproate, there were no significant differences in associations with suicide observed between these agents over 365 days; however, there was a significant increased risk of suicide among patients discontinuing or modifying lithium within the first 180 days of treatment.13
Currently, lithium is thought to be underutilized at the US Department of Veterans Affairs (VA) Michael E. DeBakey VA Medical Center (MEDVAMC) in Houston, Texas, based on the number of prescriptions of lithium in the large population of veterans seen by mental health clinicians. MEDVAMC is a 538-bed academic teaching hospital serving approximately 130,000 veterans in southeast Texas. The Mental Health Care Line has 73 inpatient beds and an outpatient clinic serving > 12,000 patients annually. By retrospectively evaluating changes in suicidality in a sample of veterans prescribed lithium, we may be able to better understand the role that lithium plays in a population that has a higher suicide rate than does the general population. The primary objective of this study was to evaluate the change in number of suicide attempts from 3 months prior to lithium initiation to 3 months following a 6-month duration of lithium use. The secondary objective was to determine the change in suicidal ideation from the period prior to lithium use to the period following 6 months of lithium use.
Methods
This was a single-site, retrospective chart review conducted between October 2017 and April 2018. Prior to data collection, the MEDVAMC Research and Development committee approved the study as quality assurance research. Patients with an active lithium prescription were identified using the VA Lithium Lab Monitoring Dashboard, which includes all patients on lithium, their lithium level, and other data such as upcoming appointments.
Inclusion criteria consisted of adults who were aged ≥ 18 years, had an active lithium prescription on the date of data extraction, and had an active lithium prescription for at least 6 months. Patients were excluded if they had < 3 months of data before and/or after lithium was used for 6 months, and if they were initiated on lithium outside MEDVAMC. Cumulatively, patients had to have at least 12 months of data: 3 months prior to lithium use, at least 6 months of lithium use, and 9 months after lithium initiation.
Suicide Attempt and Suicidal Ideation Identification
When determining the number of suicide attempts, we recorded 4 data points: Veterans Crisis Line notes documenting suicide attempts, hospital admissions for suicide attempts, suicide behavior reports within the indicated time frame, and mental health progress notes documenting suicide attempts. Suicidal ideation was measured in 4 ways. First, we looked at the percentage of outpatient mental health progress notes documenting suicidal ideation. Second, using the Patient Health Questionnaire-9 (PHQ-9) depression assessments, we looked at the percentage of patients that indicated several days, more than half the days, or nearly every day to the question, “Thoughts that you would be better off dead or of hurting yourself in some way.”14 Third, we recorded the percentage of suicide risk assessments that patients responded yes to both questions on current preoccupation with suicidal thoughts and serious intent and plan to commit suicide with access to guns, stashed pills, or other means. Finally, we noted the percentage of suicide risk assessments where the assessment of risk was moderate or high.
A retrospective electronic health record (EHR) review was performed and the following information was obtained: patient demographics, lithium refill history, concomitant psychotropic medications and psychotherapy, lithium levels, comorbidities at lithium initiation, presence of a high-risk suicide flag in the EHR, suicide risk assessments, suicide behavior reports, Veteran Crisis Line notes, PHQ-9 assessments, and hospital admission and mental health outpatient notes. The lithium therapeutic range of 0.6-1.2 mmol/L is indicated for bipolar disorder and not other indications where the dose is typically titrated to effect rather than level. Medication possession ratio (MPR) was also calculated for lithium (sum of days’ supply for all fills in period ÷ number of days in period). A high-risk suicide flag alerts clinicians and staff that a mental health professional considers the veteran at risk for suicide.15 Statistical analysis was performed using the paired t test for means to assess proportional differences between variables for the primary and secondary outcomes. Descriptive statistics were used to describe the baseline characteristics.
Results
A total of 214 patients with an active prescription for lithium were identified on the Lithium Lab Monitoring Dashboard on October 31, 2017. After exclusion criteria were applied, 98 patients were included in the study (Figure 1). The 2 most common reasons for exclusion were due to patients not being on lithium for at least 6 months and being initiated on lithium at an outside facility. One patient was enrolled in a lithium research study (the medication ordered was lithium/placebo) and another patient refused all psychotropic medications according to the progress notes.
Most of the 98 patients (82.7%) were male with average age 50.5 years (Table 1). Almost half the patients (n = 47) were concomitantly participating in psychotherapy, and 50 (51.0%) patients received at least 1 antipsychotic medication. Twenty-nine patients had an active prescription for an additional mood stabilizer, and only 4 (4.1%) patients received lithium as monotherapy. Only 75 (76.5%) patients had a lithium level drawn during the 6 months of therapy, with 28 (37.3%) patients having a therapeutic lithium level (0.6 - 1.2 mmol/L). Seventy-one patients (72.4% ) were adherent to lithium therapy with a MPR > 0.8.16 Participants had 13 different psychiatric diagnoses at the time of lithium initiation; the most common were bipolar spectrum disorder (n = 38; 38.8%), depressive disorder (n = 27; 27.6%), and posttraumatic stress disorder (PTSD) (n = 26; 26.5%). Of note, 5 patients had a diagnosis of only PTSD without a concomitant mood disorder.
For the primary outcome, hospitalization for a suspected suicide attempt decreased from 4 (4.1%) before lithium use with a mean (SD) 0.04 (0.20) attempts per person to none within 3 months after lithium use for 6 months (t(97) = 2.03, P = .045) (Figure 2). The secondary outcome of hospitalization for suicidal ideations also decreased from 13 (13.3%) before lithium use with a mean (SD) 0.1 (0.3) ideations per person to 1 (1.0%) within 3 months after lithium use for 6 months with a mean (SD) 0.01 (0.1) ideations per person (t(97) = 3.68, P = .0004). Veteran Crisis Line calls also decreased from 4 (4.1%) with a mean (SD) 0.04 (0.2) calls per person to 1 (1.0%) within 3 months after 6 months of lithium with a mean (SD) 0.01 (0.1) calls per person (t(97) = 1.75, P = .08). The comparison of metrics from 3 months before lithium initiation and within 3 months after use saw decreases in all categories (Table 2). Outpatient notes documenting suicidal ideation decreased, as did the number of patients with a high-risk suicide flag.
Discussion
The results of this study suggest lithium may have a role in reducing suicidality in a veteran population. There was a statistically significant reduction in hospitalizations for suicide attempt and suicidal ideation after at least 6 months of lithium use. These results are comparable with a previously published study that observed significant decreases in suicidal behavior and/or hospitalization risks among veterans taking lithium compared with those not taking lithium.17 Our study was similar in respect to the reduced hospitalizations among a veteran population; however, the previous study did not report a difference in suicide attempts and lithium use. This could be related to the longer follow-up time in the previous study (3 years) vs our study (9 months).
Our study identified a significant reduction in Veteran Crisis Line calls after at least 6 months of lithium use. While a reduction in suicidal ideations could be implicated in the decrease in crisis line calls, there may be a confounding variable. It is possible that after lithium initiation, veterans had more frequent contact with health care practitioners due to laboratory test monitoring and follow-up visits and thus had concerns/crises addressed during these interactions ultimately leading to a decreased utilization of the crisis line. Interestingly, there was a reduction in mental health outpatient notes from the prelithium period to the 3-month period that followed 6 months of lithium therapy. However, our study did not report on the number of mental health outpatient notes or visits during the 6-month lithium duration. Additionally, time of year/season could have an impact on suicidality, but this relationship was not evaluated in this study.
The presence of high-risk suicide flags also decreased from the prelithium period to the period 3 months following 6 months of lithium use. High-risk flags are reviewed by the suicide prevention coordinators and mental health professionals every 90 days; therefore, the patients with flags had multiple opportunities for review and thus renewal or discontinuation during the study period. A similar rationale can be applied to the high-risk flag as with the Veteran Crisis Line reduction, although this change could also be representative of a decrease in suicidality. Our study is different from other lithium studies because it included patients with a multitude of psychiatric diagnoses rather than just mood disorders. Five of the patients had a diagnosis of only PTSD and no documented mood disorder at the time of lithium initiation. Additional research is needed on the impact of lithium on suicidality in veterans with PTSD and psychiatric conditions other than mood disorders.
Underutilization of Lithium
Despite widespread knowledge of lithium’s antisuicidal effects, it is underutilized as a mood stabilizer in the US.18 There are various modifiable barriers that impact the prescribing as well as use of lithium. Clinicians may not be fully aware of lithium’s antisuicidal properties and may also have a low level of confidence in patients’ likelihood of adherence to laboratory monitoring.18,19 Due to the narrow therapeutic index of lithium, the consequences of nonadherence to monitoring can be dangerous, which may deter mental health professionals from prescribing this antisuicidal agent. At MEDVAMC, only 72.4% of patients with a lithium prescription had a lithium level drawn within a 6-month period. This could be attributed to patient nonadherence (eg, the test was ordered but the patient did not go) or clinician nonadherence (eg, test was not ordered).
With increased clinician education as well as clinics dedicated to lithium management that allow for closer follow-up, facilities may see an increased level of comfort with lithium use. Lithium management clinics that provide close follow-up may also help address patient-related concerns about adverse effects and allow for close monitoring. To facilitate lithium monitoring at MEDVAMC, mental health practitioners and pharmacists developed a lithium test monitoring menu that serves as a “one-stop shop” for lithium baseline and ongoing test results.
In the future, we may study the impact of this test monitoring menu on lithium prescribing. One may also consider whether lithium levels need to be monitored at different frequencies (eg, less frequently for depression than bipolar disorder) depending on the diagnoses. A better understanding of the necessity for therapeutic monitoring may potentially reduce barriers to prescribing for patients who do not have indications that have a recommended therapeutic range (eg, bipolar disorder).
Lithium Adherence
A primary patient-related concern for low lithium utilization is poor adherence. In this sample, 71 patients (72.4%) were considered fully adherent. This was higher than the rate of 54.1% reported by Sajatovic and colleagues in a study evaluating adherence to lithium and other anticonvulsants in veterans with bipolar disorder.20 Patients’ beliefs about medications and overall health as well as knowledge of the illness and treatment may impact adherence.21 The literature indicates that strategies such as cognitive behavioral therapy (CBT) and didactic lectures positively impact patients’ attitudes about lithium, which ultimately influences adherence.21-23 Involving a family member or significant other in psychotherapy may also improve lithium adherence.21 Specifically in the VA, to address knowledge deficits and improve overall adherence, the Lithium Lab Monitoring Dashboard could be used to identify and invite new lithium starts to educational groups about lithium. These groups could also serve as lithium management clinics.
Limitations
There were several limitations to this study. This was a single-site, retrospective chart review with a small sample size. We studied a cross-section of veterans with only active prescriptions, which limited the sample size. The results should be interpreted cautiously because < 40% of patients who had a level drawn were in the therapeutic range. Patients whose lithium levels were outside of the therapeutic range may have not been fully adherent to the medication. Further analysis based on reason for lithium prescription (eg, bipolar disorder vs depression vs aggression/impulsivity in PTSD) may be helpful in better understanding the results.
Additionally, while we collected data on concomitant mood stabilizers and antipsychotics, we did not collect data on concurrent antidepressant therapy and only 4% of patients were on lithium monotherapy. Data regarding veterans undergoing concurrent CBT during their lithium trial were not assessed in this study and could be considered a confounding factor for future studies. We included any Veteran Crisis Line call in our results regardless of the reason for the call, which could have led to overreporting of this suicidality marker.
Given its small sample size, this study should be considered as hypothesis-generating. Further studies are needed to address lithium’s antisuicidal effects in specific diagnoses (eg, PTSD, anxiety, schizoaffective disorder) to better understand its place in therapy. Studies evaluating the relationship between dosing and suicidality may help provide insight into whether the antisuicidal effect of lithium is dose-dependent and whether a specific dose range rather than a therapeutic level should be targeted for antisuicidal purposes.
Conclusions
People treated for an affective disorder have a 30-times greater risk of suicide than do those in the general population; however, as lithium can reduce the risk of suicide and self-harm, it should continue to have an important role in clinical practice.24 At MEDVAMC, we observed a statistically significant reduction in hospitalization for suicide attempts and suicidal ideation in veterans prescribed lithium following nonfatal suicide behavior and suicidal ideation. Prospective randomized placebo-controlled studies are needed to better understand lithium’s antisuicidal effects.
1. Centers for Disease Control and Prevention. Preventing Suicide Fact Sheet. Updated April 2021. Accessed February 16, 2022. https://www.cdc.gov/suicide/pdf/preventing-suicide-factsheet-2021-508.pdf
2. Kaplan MS, McFarland BH, Huguet N, Valenstein M. Suicide risk and precipitating circumstances among young, middle-aged, and older male veterans. Am J Public Health. 2012;102 Suppl 1(Suppl 1):S131-S137. doi:10.2105/AJPH.2011.300445
3. Zivin K, Kim HM, McCarthy JF, et al. Suicide mortality among individuals receiving treatment for depression in the Veterans Affairs health system: associations with patient and treatment setting characteristics. Am J Public Health. 2007;97(12):2193-2198. doi:10.2105/AJPH.2007.115477
4. Lehmann L, McCormick RA, McCracken L. Suicidal behavior among patients in the VA health care system. Psychiatr Serv. 1995;46(10):1069-1071. doi:10.1176/ps.46.10.1069
5. Dobscha SK, Denneson LM, Kovas AE, et al. Correlates of suicide among veterans treated in primary care: case-control study of a nationally representative sample. J Gen Intern Med. 2014;29(suppl 4):853-860. doi:10.1007/s11606-014-3028-1
6. Malhi GS, Tanious M, Das P, Coulston CM, Berk M. Potential mechanisms of action of lithium in bipolar disorder. Current understanding. CNS Drugs. 2013;27(2):135-153. doi:10.1007/s40263-013-0039-0
7. Kovacsics CE, Gottesman II, Gould TD. Lithium’s antisuicidal efficacy: elucidation of neurobiological targets using endophenotype strategies. Annu Rev Pharmacol Toxicol. 2009;49:175-198. doi:10.1146/annurev.pharmtox.011008.145557
8. Mann JJ, Waternaux C, Haas GL, Malone KM. Toward a clinical model of suicidal behavior in psychiatric patients. Am J Psychiatry. 1999;156(2):181-189. doi:10.1176/ajp.156.2.181
9. Baldessarini RJ, Tondo L, Davis P, Pompili M, Goodwin FK, Hennen J. Decreased risk of suicides and attempts during long-term lithium treatment: a meta-analytic review [published correction appears in Bipolar Disord. 2007 May;9(3):314]. Bipolar Disord. 2006;8(5 Pt 2):625-639. doi:10.1111/j.1399-5618.2006.00344.x
10. Yatham LN, Kennedy SH, Parikh SV, et al. Canadian Network for Mood and Anxiety Treatments (CANMAT) and International Society for Bipolar Disorders (ISBD) 2018 guidelines for the management of patients with bipolar disorder. Bipolar Disord. 2018;20(2):97-170. doi:10.1111/bdi.12609
11. Stein G, Bernadt M. Lithium augmentation therapy in tricyclic-resistant depression. A controlled trial using lithium in low and normal doses. Br J Psychiatry. 1993;162:634-640. doi:10.1192/bjp.162.5.634
12. Bauer M, Bschor T, Kunz D, Berghöfer A, Ströhle A, Müller-Oerlinghausen B. Double-blind, placebo-controlled trial of the use of lithium to augment antidepressant medication in continuation treatment of unipolar major depression. Am J Psychiatry. 2000;157(9):1429-1435. doi:10.1176/appi.ajp.157.9.1429
13. Smith EG, Austin KL, Kim HM, et al. Suicide risk in Veterans Health Administration patients with mental health diagnoses initiating lithium or valproate: a historical prospective cohort study. BMC Psychiatry. 2014;14:357. Published 2014 Dec 17. doi:10.1186/s12888-014-0357-x
14. Kroenke K, Spitzer RL, Williams JB. The PHQ-9: validity of a brief depression severity measure. J Gen Intern Med. 2001;16(9):606-613. doi:10.1046/j.1525-1497.2001.016009606.x
15. US Department of Veterans Affairs, Veterans Health Administration. Use of patient record flags to identify patients at high risk for suicide. VHA Directive 2008-036. Published July 18, 2008. Accessed February 7, 2022. www.va.gov/vhapublications/ViewPublication.asp?pub_ID=1719
16. Sylvia LG, Reilly-Harrington NA, Leon AC, et al. Medication adherence in a comparative effectiveness trial for bipolar disorder. Acta Psychiatr Scand. 2014;129(5):359-365. doi:10.1111/acps.12202
17. Yerevanian BI, Koek RJ, Mintz J. Bipolar pharmacotherapy and suicidal behavior. Part I: Lithium, divalproex and carbamazepine. J Affect Disord. 2007;103(1-3):5-11. doi:10.1016/j.jad.2007.05.019
18. Post RM. The New News about Lithium: An Underutilized Treatment in the United States. Neuropsychopharmacology. 2018;43(5):1174-1179. doi:10.1038/npp.2017.238
19. Öhlund L, Ott M, Oja S, et al. Reasons for lithium discontinuation in men and women with bipolar disorder: a retrospective cohort study [published correction appears in BMC Psychiatry. 2018 Oct 3;18(1):322]. BMC Psychiatry. 2018;18(1):37. Published 2018 Feb 7. doi:10.1186/s12888-018-1622-1
20. Sajatovic M, Valenstein M, Blow F, Ganoczy D, Ignacio R. Treatment adherence with lithium and anticonvulsant medications among patients with bipolar disorder. Psychiatr Serv. 2007;58(6):855-863. doi:10.1176/ps.2007.58.6.855
21. Chakrabarti S. Treatment-adherence in bipolar disorder: A patient-centred approach. World J Psychiatry. 2016;6(4):399-409. Published 2016 Dec 22. doi:10.5498/wjp.v6.i4.399
22. Gaudiano BA, Weinstock LM, Miller IW. Improving treatment adherence in bipolar disorder: a review of current psychosocial treatment efficacy and recommendations for future treatment development. Behav Modif. 2008;32(3):267-301. doi:10.1177/0145445507309023
23. Peet M, Harvey NS. Lithium maintenance: 1. A standard education programme for patients. Br J Psychiatry. 1991;158:197-200. doi:10.1192/bjp.158.2.197
24. Cipriani A, Hawton K, Stockton S, Geddes JR. Lithium in the prevention of suicide in mood disorders: updated systematic review and meta-analysis. BMJ. 2013;346:f3646. doi:10.1136/bmj.f3646
Oral Lichen Planus Treated With Plasma Rich in Growth Factors
Lichen planus is a chronic inflammatory mucocutaneous disease that usually affects the skin and/or the genital and oral mucosae.1,2 This disease classically presents with clinical relapses or outbreaks that alternate with periods of remission or latency. Oral lichen planus (OLP) can present with or without extraoral manifestation. It sometimes is difficult to differentiate OLP from oral lichenoid reactions, which can be related to dental materials, some drugs, and systemic conditions or can be idiopathic.1,2
Oral lichen planus is one of the most common noninfectious diseases of the oral cavity, with a reported prevalence of 1% worldwide and marked geographical differences. In Europe, the prevalence of OLP ranges from 1% to 2%.3,4 It is more frequent in women (1.5:1 to 2:1) and usually appears in the fourth and fifth decades of life.1-4
The causes of OLP have not been entirely elucidated, but it is broadly accepted that there is a deregulation on different T lymphocytes that in turn causes effects on CD8 lymphocytes in response to an external noxa. This unknown “trigger” or starting factor also produces an impact on basal keratinocytes. Therefore, the pathogenesis of lichen planus is influenced by a series of cellular events mediated by different cytokines.2,5,6 Among these, tumor necrosis factor α and IL-1 are known to have important roles in the disease. More recently, other cytokines, such as IL-4, secreted by type 2 helper T cells, also have been related to the development and progression of the oral lesions.5,6 In addition to the factors that generate the onset of the disease, there are others that may precipitate clinical outbreaks. Different factors have been related to the progression of the disease, influencing the initiation, perpetuation, and/or worsening of OLP lesions.1,2 Exactly how these factors affect disease progression is another challenging question. The list of possible or potential factors related to disease progression is long; nonetheless, in the vast majority, a clear explanation at a molecular level has not been clearly demonstrated.2,5
Conventionally, 6 clinical presentations of OLP lesions divided into 2 main groups have been described in the oral cavity: white forms (reticular, papular, and plaquelike) and red forms (erythematous, atrophic-erosive, and bullous).1,7-9
Oral lichen planus mainly is treated with topically or systemically administered steroids based on the presence of symptoms such as pain and inability to perform daily activities (eg, eating, talking).5,10 The treatment of choice often is based on the professional’s experience, as there are no broadly accepted national or international clinical practice guidelines on steroid type, administration route, dose, vehicle for administration, or maintenance.11 Despite this lack of unified criteria, different topical and systemic steroid administration protocols allow a reduction in the symptoms or even the disappearance of the red lesions to be achieved in many cases. Unfortunately, there are many patients with lesions refractory to standard treatments for OLP.12 Several alternatives for these patients have been described in the literature, though on many occasions these alternatives present substantial side effects for the patient.13 The search for an effective treatment without side effects is still challenging. One of the treatments tested under this premise has been the application of plasma rich in growth factors (PRGF) by means of infiltration or topical application, in both cases obtaining good results without side effects.14
We sought to analyze the information from a case series of patients treated at the Eduardo Anitua Clinic (Vitoria-Gasteiz, Spain) and describe the results and follow-up of patients with erosive OLP refractory to standard therapy who have been successfully treated by local infiltration of PRGF as the only treatment.
Material and Methods
Patients—We included data from the database of the clinical center with de-identified information of patients with erosive OLP diagnosed clinically and histopathologically who did not respond to conventional treatment (ie, topical and/or systemic corticosteroids [depending on the case]) as well as patients who presented with extensive erosive OLP with systemic involvement and whose systemic treatment was not effective in resolving oral manifestations.
Therapies Administered and Evaluations—Lesions refractory to conventional corticosteroid protocols had been previously treated for 30 days with 0.5% triamcinolone acetonide mouth rinse followed by a cycle of 1% triamcinolone acetonide mouth rinse. Subsequently, a cycle of oral corticosteroids (prednisone for 30 days: 1 mg/kg/d in a single morning dose with staged reduction after the first week) had been administered. One dayafter the corticosteroid treatment was suspended, the patients were treated by PRGF-Endoret (BTI Biotechnology Institute) infiltration following the protocol described by Anitua et al.15,16
Before starting the infiltrations with PRGF, the patient had been asked to rate the pain level on a visual analog scale (VAS) of 1 to 10, with 10 being the most intense imaginable pain. Pain score was subsequently rated and registered during every visit. An initial photograph of the lesion also was obtained to establish a starting point for further comparisons of clinical evolution of the lesions.
Prior to each infiltration, the plasma was separated into 2 fractions. The second fraction was the one that corresponded to the highest number of platelets and included the 2 mL of plasma just above the white series (or buffy coat). This fraction of plasma was the one used to infiltrate the lesions.
Plasma rich in growth factors was activated just before infiltration. The activation was done by adding 10% calcium chloride. Once activated, it was infiltrated into the active lesion using a 31-G × 1/6-in hypodermic needle and a 2-mL Luer-lock syringe. Infiltrations were performed without anesthesia. Four punctures were made for each ulcerative lesion, dividing the lesion into 4 points: upper, lower, right, and left. Plasma rich in growth factors was infiltrated until a slight blanching was observed in the surrounding tissue. At that moment, the infiltration was stopped and was carried out in the next infiltration site.
One treatment session was performed per week, with follow-up 1 week after treatment. In the control visit, the state of the lesions was re-evaluated, and it was decided whether new infiltrations were needed. The treatment was finished when complete epithelialization of the lesion was visualized or the associated symptoms disappeared. At each visit, photographs were taken, and the patient assessed the severity of pain on the VAS.
Statistical Analysis—A Shapiro-Wilk test was carried out with the obtained data to check the normal distribution of the sample. The evolution of pain during the study was compared by paired t test. The qualitative variables were described by means of a frequency analysis. Quantitative variables were described by the mean and the SD. The data were analyzed with SPSS V15.0 for Windows (SPSS Inc). P<.05 showed statistical significance.
Results
A total of 15 patients were included in the study, all with atrophic-erosive lichen planus. Two patients were male, and 13 were female. The mean age (SD) of the patients included in the study was 55.27 (14.19) years. The mean number of outbreaks per year (SD) was 3.2 (1.7), with a range of 1 to 8 outbreaks.
Healing of OLP Lesions—The number of treatment sessions to achieve complete healing varied among the patients (Figures 1 and 2). Ten patients (66.7%) required a single session, 2 patients (13.3%) required 2 sessions, and 3 patients (20%) required 3 sessions. The mean time (SD) without lesions for the patients who required a single session was 10.9 (5.2) months (range, 6–24 months).

Pain Assessment—The mean (SD) score obtained on the VAS before treatment with PRGF was 8.27 (1.16); this score dropped to 1.27 (1.53) after the first treatment session and was a statistically significant difference (P=.006).

For those patients requiring more than 1 session, the mean (SD) pain scores decreased by 0.75 (0.97) points and 0 points after the first and second sessions of treatment, respectively. The mean (SD) amount of PRGF infiltrated in each patient in the first session was 2.60 (0.63) mL. In the second session, the mean (SD) amount was 1.2 (0.33) mL; these differences were statistically significant (P=.008). In the last session, the mean (SD) amount was 1.1 (0.22) mL.
Follow-up and Adverse Effects—The mean (SD) follow-up time was 47.16 (15.78) months. The patients were free of symptoms, and there were no adverse effects derived from the treatment during follow-up.
Comment
The primary goal of OLP treatment is to stop the outbreaks.1,9,13 The lack of potency of corticosteroids in some patients with OLP could be due in part to the inadequate selection of the vehicle (ointment/oral rinse) for the extension and characteristics of the lesion or because of an inappropriate prescription dose, time, and/or frequency, as described by González-Moles.17 However, even when using an appropriate protocol, some lesions are resistant to topical treatment and require other therapeutic modalities.1,9,13 Previously proposed topical treatments include different immunosuppressants, such as the mammalian target of rapamycin, tacrolimus ointment 0.1%, pimecrolimus cream 1%, or cyclosporine A (50–100 mg/mL) formulations.18 Nevertheless, these drugs seem to have a greater number of side effects than topical steroids, and tacrolimus has been associated with cases of oral malignancy after continuing treatment.15
Severe and/or recalcitrant lesions and extraoral involvement have been successfully treated with systemic prednisone (40–80 mg/d).1,9,13 Nevertheless, systemic corticosteroid toxicity requires that these treatments should be used only when necessary at the lowest possible dose and for the shortest possible duration.19 Other nonpharmacologic options for treatment are photodynamic, UV, and low-level laser therapy.20,21 They have been accepted as supplementary modalities in different inflammatory skin conditions but present important technical requirements. Their effectiveness in corticosteroid-resistant cases have not been definitively assessed. Interestingly, promising results recently have been reported by Bennardo et al22 when comparing the efficacy of autologous platelet concentrates with triamcinolone injection.
In our study, the use of PRGF stopped the lesions’ evolution since the first treatment session, reducing them by 6.5-fold. The positive effects observed may have been promoted by the activity of different proteins present in PRGF (eg, platelet-derived growth factor, vascular endothelial growth factor, transforming growth factor, epidermal growth factor, fibroblast growth factor, fibronectin). These molecules contribute to collagen synthesis; angiogenesis; endothelial cell migration and proliferation; or keratinocyte cell migration, proliferation, differentiation, growth, and migration—phenomena that are essential for healing and re-epithelialization.23-25
Different studies also have supported an anti-inflammatory effect of PRGF mediated by an inhibition of the transcription of nuclear factor–κB and the expression of cyclooxygenase-2 and chemokine receptor type 4 produced by its high content of hepatocyte growth factor or the reduction of inflammatory marker expression, such as intercellular adhesion molecule 1. The development of an efficient 3-dimensional fibrin scaffold formation that occurs after PRGF administration also could facilitate healing, helping some cell populations to guide their position and function.23-25
Limitations of our study include the small number of patients and the absence of a control group. The higher number of female patients in the study did not seem to affect the results, as differences related to gender have not been reported when treating patients with OLP with autologous platelet concentrates or other modalities of treatment.
Conclusion
Results from our study indicate that the use of PRGF could be a new treatment option for OLP cases refractory to conventional therapy. No complications were observed during the treatment procedure or during the complete follow-up period. Nonetheless, new prospective studies with a greater number of patients and longer follow-up periods are needed to confirm these preliminary results.
- Al-Hashimi I, Schifter M, Lockhart PB, et al. Oral lichen planus and oral lichenoid lesions: diagnostic and therapeutic considerations. Oral Surg Oral Med Oral Pathol Oral Radiol Endod. 2007;103:1-12.
- Kurago ZB. Etiology and pathogenesis of oral lichen planus: an overview. Oral Surg Oral Med Oral Pathol Oral Radiol. 2016;122:72-80.
- McCartan BE, Healy CM. The reported prevalence of oral lichen planus: a review and critique. J Oral Pathol Med. 2008;37:447-453.
- González-Moles MÁ, Warnakulasuriya S, González-Ruiz I, et al. Worldwide prevalence of oral lichen planus: a systematic review and meta-analysis. Oral Dis. 2021;27:813-828.
- Nosratzehi T. Oral lichen planus: an overview of potential risk factors, biomarkers and treatments. Asian Pac J Cancer Prev. 2018;19:1161-1167.
- Mehrbani SP, Motahari P, Azar FP, et al. Role of interleukin-4 in pathogenesis of oral lichen planus: a systematic review. Med Oral Patol Oral Cir Bucal. 2020;25:E410-E415.
- Edwards PC, Kelsch R. Oral lichen planus: clinical presentation and management. J Can Dent Assoc. 2002;68:494-499.
- Gorouhi F, Davari P, Fazel N. Cutaneous and mucosal lichen planus: a comprehensive review of clinical subtypes, risk factors, diagnosis, and prognosis. ScientificWorldJournal. 2014;2014:742826.
- Babu A, Chellaswamy S, Muthukumar S, et al. Bullous lichen planus: case report and review. J Pharm Bioallied Sci. 2019;11(suppl 2):S499-S506.
- Thongprasom K, Carrozzo M, Furness S, et al. Interventions for treating oral lichen planus. Cochrane Database Syst Rev. 2011;7:CD001168.
- López-Jornet P, Martínez-Beneyto Y, Nicolás AV, et al. Professional attitudes toward oral lichen planus: need for national and international guidelines. J Eval Clin Pract. 2009;15:541-542.
- Yang H, Wu Y, Jiang L, et al. Possible alternative therapies for oral lichen planus cases refractory to steroid therapies. Oral Surg Oral Med Oral Pathol Oral Radiol. 2016;121:496-509.
- Ribero S, Borradori L. Re: risk of malignancy and systemic absorption after application of topical tacrolimus in oral lichen planus. J Eur Acad Dermatol Venereol. 2017;31:E85-E86.
- Piñas L, Alkhraisat MH, Fernández RS, et al. Biological therapy of refractory ulcerative oral lichen planus with plasma rich in growth factors. Am J Clin Dermatol. 2017;18:429-433.
- Anitua E, Zalduendo MM, Prado R, et al. Morphogen and proinflammatory cytokine release kinetics from PRGF-Endoret fibrin scaffolds: evaluation of the effect of leukocyte inclusion. J Biomed Mater Res A. 2015;103:1011-1020.
- Anitua E, Prado R, Sánchez M, et al. Platelet-rich plasma: preparation and formulation. Oper Tech Orthop. 2012;22:25-32.
- González-Moles MA. The use of topical corticoids in oral pathology. Med Oral Pathol Oral Cir Bucal. 2010;15:E827-E831.
- Siponen M, Huuskonen L, Kallio-Pulkkinen S, et al. Topical tacrolimus, triamcinolone acetonide, and placebo in oral lichen planus: a pilot randomized controlled trial. Oral Dis. 2017;23:660-668.
- Adami G, Saag KG. Glucocorticoid-induced osteoporosis update. Curr Opin Rheumatol. 2019;31:388-393.
- Lavaee F, Shadmanpour M. Comparison of the effect of photodynamic therapy and topical corticosteroid on oral lichen planus lesions. Oral Dis. 2019;25:1954-1963.
- Derikvand N, Ghasemi SS, Moharami M, et al. Management of oral lichen planus by 980 nm diode laser. J Lasers Med Sci. 2017;8:150-154.
- Bennardo F, Liborio F, Barone S, et al. Efficacy of platelet-rich fibrin compared with triamcinolone acetonide as injective therapy in the treatment of symptomatic oral lichen planus: a pilot study. Clin Oral Investig. 2021;25:3747-3755.
- Anitua E, Andia I, Ardanza B, et al. Autologous platelets as a source of proteins for healing and tissue regeneration. Thromb Haemost. 2004;91:4-15.
- Barrientos S, Brem H, Stojadinovic O, et al. Clinical application of growth factors and cytokines in wound healing. Wound Repair Regen. 2014;22:569-578.
- Anitua E. Plasma rich in growth factors: preliminary results of use in the preparation of future sites for implants. Int J Oral Maxillofac Implants. 1999;14:529-535.
Lichen planus is a chronic inflammatory mucocutaneous disease that usually affects the skin and/or the genital and oral mucosae.1,2 This disease classically presents with clinical relapses or outbreaks that alternate with periods of remission or latency. Oral lichen planus (OLP) can present with or without extraoral manifestation. It sometimes is difficult to differentiate OLP from oral lichenoid reactions, which can be related to dental materials, some drugs, and systemic conditions or can be idiopathic.1,2
Oral lichen planus is one of the most common noninfectious diseases of the oral cavity, with a reported prevalence of 1% worldwide and marked geographical differences. In Europe, the prevalence of OLP ranges from 1% to 2%.3,4 It is more frequent in women (1.5:1 to 2:1) and usually appears in the fourth and fifth decades of life.1-4
The causes of OLP have not been entirely elucidated, but it is broadly accepted that there is a deregulation on different T lymphocytes that in turn causes effects on CD8 lymphocytes in response to an external noxa. This unknown “trigger” or starting factor also produces an impact on basal keratinocytes. Therefore, the pathogenesis of lichen planus is influenced by a series of cellular events mediated by different cytokines.2,5,6 Among these, tumor necrosis factor α and IL-1 are known to have important roles in the disease. More recently, other cytokines, such as IL-4, secreted by type 2 helper T cells, also have been related to the development and progression of the oral lesions.5,6 In addition to the factors that generate the onset of the disease, there are others that may precipitate clinical outbreaks. Different factors have been related to the progression of the disease, influencing the initiation, perpetuation, and/or worsening of OLP lesions.1,2 Exactly how these factors affect disease progression is another challenging question. The list of possible or potential factors related to disease progression is long; nonetheless, in the vast majority, a clear explanation at a molecular level has not been clearly demonstrated.2,5
Conventionally, 6 clinical presentations of OLP lesions divided into 2 main groups have been described in the oral cavity: white forms (reticular, papular, and plaquelike) and red forms (erythematous, atrophic-erosive, and bullous).1,7-9
Oral lichen planus mainly is treated with topically or systemically administered steroids based on the presence of symptoms such as pain and inability to perform daily activities (eg, eating, talking).5,10 The treatment of choice often is based on the professional’s experience, as there are no broadly accepted national or international clinical practice guidelines on steroid type, administration route, dose, vehicle for administration, or maintenance.11 Despite this lack of unified criteria, different topical and systemic steroid administration protocols allow a reduction in the symptoms or even the disappearance of the red lesions to be achieved in many cases. Unfortunately, there are many patients with lesions refractory to standard treatments for OLP.12 Several alternatives for these patients have been described in the literature, though on many occasions these alternatives present substantial side effects for the patient.13 The search for an effective treatment without side effects is still challenging. One of the treatments tested under this premise has been the application of plasma rich in growth factors (PRGF) by means of infiltration or topical application, in both cases obtaining good results without side effects.14
We sought to analyze the information from a case series of patients treated at the Eduardo Anitua Clinic (Vitoria-Gasteiz, Spain) and describe the results and follow-up of patients with erosive OLP refractory to standard therapy who have been successfully treated by local infiltration of PRGF as the only treatment.
Material and Methods
Patients—We included data from the database of the clinical center with de-identified information of patients with erosive OLP diagnosed clinically and histopathologically who did not respond to conventional treatment (ie, topical and/or systemic corticosteroids [depending on the case]) as well as patients who presented with extensive erosive OLP with systemic involvement and whose systemic treatment was not effective in resolving oral manifestations.
Therapies Administered and Evaluations—Lesions refractory to conventional corticosteroid protocols had been previously treated for 30 days with 0.5% triamcinolone acetonide mouth rinse followed by a cycle of 1% triamcinolone acetonide mouth rinse. Subsequently, a cycle of oral corticosteroids (prednisone for 30 days: 1 mg/kg/d in a single morning dose with staged reduction after the first week) had been administered. One dayafter the corticosteroid treatment was suspended, the patients were treated by PRGF-Endoret (BTI Biotechnology Institute) infiltration following the protocol described by Anitua et al.15,16
Before starting the infiltrations with PRGF, the patient had been asked to rate the pain level on a visual analog scale (VAS) of 1 to 10, with 10 being the most intense imaginable pain. Pain score was subsequently rated and registered during every visit. An initial photograph of the lesion also was obtained to establish a starting point for further comparisons of clinical evolution of the lesions.
Prior to each infiltration, the plasma was separated into 2 fractions. The second fraction was the one that corresponded to the highest number of platelets and included the 2 mL of plasma just above the white series (or buffy coat). This fraction of plasma was the one used to infiltrate the lesions.
Plasma rich in growth factors was activated just before infiltration. The activation was done by adding 10% calcium chloride. Once activated, it was infiltrated into the active lesion using a 31-G × 1/6-in hypodermic needle and a 2-mL Luer-lock syringe. Infiltrations were performed without anesthesia. Four punctures were made for each ulcerative lesion, dividing the lesion into 4 points: upper, lower, right, and left. Plasma rich in growth factors was infiltrated until a slight blanching was observed in the surrounding tissue. At that moment, the infiltration was stopped and was carried out in the next infiltration site.
One treatment session was performed per week, with follow-up 1 week after treatment. In the control visit, the state of the lesions was re-evaluated, and it was decided whether new infiltrations were needed. The treatment was finished when complete epithelialization of the lesion was visualized or the associated symptoms disappeared. At each visit, photographs were taken, and the patient assessed the severity of pain on the VAS.
Statistical Analysis—A Shapiro-Wilk test was carried out with the obtained data to check the normal distribution of the sample. The evolution of pain during the study was compared by paired t test. The qualitative variables were described by means of a frequency analysis. Quantitative variables were described by the mean and the SD. The data were analyzed with SPSS V15.0 for Windows (SPSS Inc). P<.05 showed statistical significance.
Results
A total of 15 patients were included in the study, all with atrophic-erosive lichen planus. Two patients were male, and 13 were female. The mean age (SD) of the patients included in the study was 55.27 (14.19) years. The mean number of outbreaks per year (SD) was 3.2 (1.7), with a range of 1 to 8 outbreaks.
Healing of OLP Lesions—The number of treatment sessions to achieve complete healing varied among the patients (Figures 1 and 2). Ten patients (66.7%) required a single session, 2 patients (13.3%) required 2 sessions, and 3 patients (20%) required 3 sessions. The mean time (SD) without lesions for the patients who required a single session was 10.9 (5.2) months (range, 6–24 months).
Pain Assessment—The mean (SD) score obtained on the VAS before treatment with PRGF was 8.27 (1.16); this score dropped to 1.27 (1.53) after the first treatment session and was a statistically significant difference (P=.006).
For those patients requiring more than 1 session, the mean (SD) pain scores decreased by 0.75 (0.97) points and 0 points after the first and second sessions of treatment, respectively. The mean (SD) amount of PRGF infiltrated in each patient in the first session was 2.60 (0.63) mL. In the second session, the mean (SD) amount was 1.2 (0.33) mL; these differences were statistically significant (P=.008). In the last session, the mean (SD) amount was 1.1 (0.22) mL.
Follow-up and Adverse Effects—The mean (SD) follow-up time was 47.16 (15.78) months. The patients were free of symptoms, and there were no adverse effects derived from the treatment during follow-up.
Comment
The primary goal of OLP treatment is to stop the outbreaks.1,9,13 The lack of potency of corticosteroids in some patients with OLP could be due in part to the inadequate selection of the vehicle (ointment/oral rinse) for the extension and characteristics of the lesion or because of an inappropriate prescription dose, time, and/or frequency, as described by González-Moles.17 However, even when using an appropriate protocol, some lesions are resistant to topical treatment and require other therapeutic modalities.1,9,13 Previously proposed topical treatments include different immunosuppressants, such as the mammalian target of rapamycin, tacrolimus ointment 0.1%, pimecrolimus cream 1%, or cyclosporine A (50–100 mg/mL) formulations.18 Nevertheless, these drugs seem to have a greater number of side effects than topical steroids, and tacrolimus has been associated with cases of oral malignancy after continuing treatment.15
Severe and/or recalcitrant lesions and extraoral involvement have been successfully treated with systemic prednisone (40–80 mg/d).1,9,13 Nevertheless, systemic corticosteroid toxicity requires that these treatments should be used only when necessary at the lowest possible dose and for the shortest possible duration.19 Other nonpharmacologic options for treatment are photodynamic, UV, and low-level laser therapy.20,21 They have been accepted as supplementary modalities in different inflammatory skin conditions but present important technical requirements. Their effectiveness in corticosteroid-resistant cases have not been definitively assessed. Interestingly, promising results recently have been reported by Bennardo et al22 when comparing the efficacy of autologous platelet concentrates with triamcinolone injection.
In our study, the use of PRGF stopped the lesions’ evolution since the first treatment session, reducing them by 6.5-fold. The positive effects observed may have been promoted by the activity of different proteins present in PRGF (eg, platelet-derived growth factor, vascular endothelial growth factor, transforming growth factor, epidermal growth factor, fibroblast growth factor, fibronectin). These molecules contribute to collagen synthesis; angiogenesis; endothelial cell migration and proliferation; or keratinocyte cell migration, proliferation, differentiation, growth, and migration—phenomena that are essential for healing and re-epithelialization.23-25
Different studies also have supported an anti-inflammatory effect of PRGF mediated by an inhibition of the transcription of nuclear factor–κB and the expression of cyclooxygenase-2 and chemokine receptor type 4 produced by its high content of hepatocyte growth factor or the reduction of inflammatory marker expression, such as intercellular adhesion molecule 1. The development of an efficient 3-dimensional fibrin scaffold formation that occurs after PRGF administration also could facilitate healing, helping some cell populations to guide their position and function.23-25
Limitations of our study include the small number of patients and the absence of a control group. The higher number of female patients in the study did not seem to affect the results, as differences related to gender have not been reported when treating patients with OLP with autologous platelet concentrates or other modalities of treatment.
Conclusion
Results from our study indicate that the use of PRGF could be a new treatment option for OLP cases refractory to conventional therapy. No complications were observed during the treatment procedure or during the complete follow-up period. Nonetheless, new prospective studies with a greater number of patients and longer follow-up periods are needed to confirm these preliminary results.
- Al-Hashimi I, Schifter M, Lockhart PB, et al. Oral lichen planus and oral lichenoid lesions: diagnostic and therapeutic considerations. Oral Surg Oral Med Oral Pathol Oral Radiol Endod. 2007;103:1-12.
- Kurago ZB. Etiology and pathogenesis of oral lichen planus: an overview. Oral Surg Oral Med Oral Pathol Oral Radiol. 2016;122:72-80.
- McCartan BE, Healy CM. The reported prevalence of oral lichen planus: a review and critique. J Oral Pathol Med. 2008;37:447-453.
- González-Moles MÁ, Warnakulasuriya S, González-Ruiz I, et al. Worldwide prevalence of oral lichen planus: a systematic review and meta-analysis. Oral Dis. 2021;27:813-828.
- Nosratzehi T. Oral lichen planus: an overview of potential risk factors, biomarkers and treatments. Asian Pac J Cancer Prev. 2018;19:1161-1167.
- Mehrbani SP, Motahari P, Azar FP, et al. Role of interleukin-4 in pathogenesis of oral lichen planus: a systematic review. Med Oral Patol Oral Cir Bucal. 2020;25:E410-E415.
- Edwards PC, Kelsch R. Oral lichen planus: clinical presentation and management. J Can Dent Assoc. 2002;68:494-499.
- Gorouhi F, Davari P, Fazel N. Cutaneous and mucosal lichen planus: a comprehensive review of clinical subtypes, risk factors, diagnosis, and prognosis. ScientificWorldJournal. 2014;2014:742826.
- Babu A, Chellaswamy S, Muthukumar S, et al. Bullous lichen planus: case report and review. J Pharm Bioallied Sci. 2019;11(suppl 2):S499-S506.
- Thongprasom K, Carrozzo M, Furness S, et al. Interventions for treating oral lichen planus. Cochrane Database Syst Rev. 2011;7:CD001168.
- López-Jornet P, Martínez-Beneyto Y, Nicolás AV, et al. Professional attitudes toward oral lichen planus: need for national and international guidelines. J Eval Clin Pract. 2009;15:541-542.
- Yang H, Wu Y, Jiang L, et al. Possible alternative therapies for oral lichen planus cases refractory to steroid therapies. Oral Surg Oral Med Oral Pathol Oral Radiol. 2016;121:496-509.
- Ribero S, Borradori L. Re: risk of malignancy and systemic absorption after application of topical tacrolimus in oral lichen planus. J Eur Acad Dermatol Venereol. 2017;31:E85-E86.
- Piñas L, Alkhraisat MH, Fernández RS, et al. Biological therapy of refractory ulcerative oral lichen planus with plasma rich in growth factors. Am J Clin Dermatol. 2017;18:429-433.
- Anitua E, Zalduendo MM, Prado R, et al. Morphogen and proinflammatory cytokine release kinetics from PRGF-Endoret fibrin scaffolds: evaluation of the effect of leukocyte inclusion. J Biomed Mater Res A. 2015;103:1011-1020.
- Anitua E, Prado R, Sánchez M, et al. Platelet-rich plasma: preparation and formulation. Oper Tech Orthop. 2012;22:25-32.
- González-Moles MA. The use of topical corticoids in oral pathology. Med Oral Pathol Oral Cir Bucal. 2010;15:E827-E831.
- Siponen M, Huuskonen L, Kallio-Pulkkinen S, et al. Topical tacrolimus, triamcinolone acetonide, and placebo in oral lichen planus: a pilot randomized controlled trial. Oral Dis. 2017;23:660-668.
- Adami G, Saag KG. Glucocorticoid-induced osteoporosis update. Curr Opin Rheumatol. 2019;31:388-393.
- Lavaee F, Shadmanpour M. Comparison of the effect of photodynamic therapy and topical corticosteroid on oral lichen planus lesions. Oral Dis. 2019;25:1954-1963.
- Derikvand N, Ghasemi SS, Moharami M, et al. Management of oral lichen planus by 980 nm diode laser. J Lasers Med Sci. 2017;8:150-154.
- Bennardo F, Liborio F, Barone S, et al. Efficacy of platelet-rich fibrin compared with triamcinolone acetonide as injective therapy in the treatment of symptomatic oral lichen planus: a pilot study. Clin Oral Investig. 2021;25:3747-3755.
- Anitua E, Andia I, Ardanza B, et al. Autologous platelets as a source of proteins for healing and tissue regeneration. Thromb Haemost. 2004;91:4-15.
- Barrientos S, Brem H, Stojadinovic O, et al. Clinical application of growth factors and cytokines in wound healing. Wound Repair Regen. 2014;22:569-578.
- Anitua E. Plasma rich in growth factors: preliminary results of use in the preparation of future sites for implants. Int J Oral Maxillofac Implants. 1999;14:529-535.
Practice Points
- Treating erosive oral lichen planus lesions refractory to conventional steroid treatments can be challenging for clinicians.
- Complete re-epithelialization and total pain relief could be observed after 1 to 3 weekly perilesional infiltrations with plasma rich in growth factors.
- No relapse of the lesions in the same area or other complications could be observed during the follow-up time.

Teaching Evidence-Based Dermatology Using a Web-Based Journal Club: A Pilot Study and Survey
To the Editor:
With a steady increase in dermatology publications over recent decades, there is an expanding pool of evidence to address clinical questions.1 Residency training is the time when appraising the medical literature and practicing evidence-based medicine is most honed. Evidence-based medicine is an essential component of Practice-based Learning and Improvement, a required core competency of the Accreditation Council for Graduate Medical Education.2 Assimilation of new research evidence is traditionally taught through didactics and journal club discussions in residency.
However, at a time when the demand for information overwhelms safeguards that exist to evaluate its quality, it is more important than ever to be equipped with the proper tools to critically appraise novel literature. Beyond accepting a scientific article at face value, physicians must learn to ask targeted questions of the study design, results, and clinical relevance. These questions change based on the type of study, and organizations such as the Oxford Centre for Evidence-Based Medicine provide guidance through critical appraisal worksheets.3
To investigate the utility of using guided questions to evaluate the reliability, significance, and applicability of clinical evidence, we beta tested a novel web-based application in an academic dermatology setting to design and run a journal club for residents. Six dermatology residents participated in this institutional review board–approved study comprised of 3 phases: (1) independent article appraisal through the web-based application, (2) group discussion, and (3) anonymous postsurvey.
Using this platform, we uploaded a recent article into the interactive reader, which contained an integrated tool for appraisal based on specific questions. Because the article described the results of a randomized clinical trial, we used questions from the Centre for Evidence-Based Medicine’s Randomised Controlled Trials Critical Appraisal Worksheet, which has a series of questions to evaluate internal validity, results, and external validity and applicability.3
Residents used the platform to independently read the article, highlight areas of the text that corresponded to 8 critical appraisal questions, and answer yes or no to these questions. Based on residents’ answers, a final appraisal score (on a scale of 1% to 100%) was generated. Simultaneously, the attending dermatologist leading the journal club (C.W.) also completed the assignment to establish an expert score.
Scores from the residents’ independent appraisal ranged from 75% to 100% (mean, 85.4%). Upon discussing the article in a group setting, the residents established a consensus score of 75%. This consensus score matched the expert score, which suggested to us that both independently reviewing the article using guided questions and conducting a group debriefing were necessary to match the expert level of critical appraisal.
Of note, the residents’ average independent appraisal score was higher than both the consensus and expert scores, indicating that the residents evaluated the article less critically on their own. With more practice using this method, it is possible that the precision and accuracy of the residents’ critical appraisal of scientific articles will improve.
In the postsurvey, we asked residents about the critical appraisal of the medical literature. All residents agreed that evaluating the quality of evidence when reading a scientific article was somewhat important or very important to them; however, only 2 of 6 evaluated the quality of evidence all the time, and the other 4 did so half of the time or less than half of the time.
When critically appraising articles, 2 of 6 residents used specific rubrics half of the time; 4 of 6 less than half of the time. Most important, 5 of 6 residents agreed that the quality of evidence affected their management decisions more than half of the time or all of the time. Although it is clear that residents value evidence-based medicine and understand the importance of evaluating the quality of evidence, doing so currently might not be simple or practical.
An organized framework for appraising articles would streamline the process. Five of 6 residents agreed that the use of specific questions as a guide made it easier to appraise an article for the quality of its evidence. Four of 6 residents found that juxtaposing specific questions with the interactive reader was helpful; 5 of 6 agreed that they would use a web-based journal club platform if given the option.
Lastly, 5 of 6 residents agreed that if such a tool were available, a platform containing all major dermatology publications in an interactive reader format, along with relevant appraisal questions on the side, would be useful.
This pilot study augmented the typical journal club experience by emphasizing goal-directed reading and the importance of analyzing the quality of evidence. The combination of independent appraisal of an article using targeted questions and a group debrief led to better understanding of the evidence and its clinical applicability. The COVID-19 pandemic may be a better time than ever to explore innovative ways to teach evidence-based medicine in residency training.
- Mimouni D, Pavlovsky L, Akerman L, et al. Trends in dermatology publications over the past 15 years. Am J Clin Dermatol. 2010;11:55-58. doi:10.2165/11530190-000000000-00000.
- NEJM Knowledge+ Team. Exploring the ACGME Core Competencies: Practice-Based Learning and Improvement (part 2 of 7). Massachusetts Medical Society. NEJM Knowledge+ website. Published July 28, 2016. Accessed January 15, 2022. https://knowledgeplus.nejm.org/blog/practice-based-learning-and-improvement/
- University of Oxford. Critical appraisal tools. Centre for Evidence-Based Medicine website. Accessed January 2, 2022. www.cebm.ox.ac.uk/resources/ebm-tools/critical-appraisal-tools
To the Editor:
With a steady increase in dermatology publications over recent decades, there is an expanding pool of evidence to address clinical questions.1 Residency training is the time when appraising the medical literature and practicing evidence-based medicine is most honed. Evidence-based medicine is an essential component of Practice-based Learning and Improvement, a required core competency of the Accreditation Council for Graduate Medical Education.2 Assimilation of new research evidence is traditionally taught through didactics and journal club discussions in residency.
However, at a time when the demand for information overwhelms safeguards that exist to evaluate its quality, it is more important than ever to be equipped with the proper tools to critically appraise novel literature. Beyond accepting a scientific article at face value, physicians must learn to ask targeted questions of the study design, results, and clinical relevance. These questions change based on the type of study, and organizations such as the Oxford Centre for Evidence-Based Medicine provide guidance through critical appraisal worksheets.3
To investigate the utility of using guided questions to evaluate the reliability, significance, and applicability of clinical evidence, we beta tested a novel web-based application in an academic dermatology setting to design and run a journal club for residents. Six dermatology residents participated in this institutional review board–approved study comprised of 3 phases: (1) independent article appraisal through the web-based application, (2) group discussion, and (3) anonymous postsurvey.
Using this platform, we uploaded a recent article into the interactive reader, which contained an integrated tool for appraisal based on specific questions. Because the article described the results of a randomized clinical trial, we used questions from the Centre for Evidence-Based Medicine’s Randomised Controlled Trials Critical Appraisal Worksheet, which has a series of questions to evaluate internal validity, results, and external validity and applicability.3
Residents used the platform to independently read the article, highlight areas of the text that corresponded to 8 critical appraisal questions, and answer yes or no to these questions. Based on residents’ answers, a final appraisal score (on a scale of 1% to 100%) was generated. Simultaneously, the attending dermatologist leading the journal club (C.W.) also completed the assignment to establish an expert score.
Scores from the residents’ independent appraisal ranged from 75% to 100% (mean, 85.4%). Upon discussing the article in a group setting, the residents established a consensus score of 75%. This consensus score matched the expert score, which suggested to us that both independently reviewing the article using guided questions and conducting a group debriefing were necessary to match the expert level of critical appraisal.
Of note, the residents’ average independent appraisal score was higher than both the consensus and expert scores, indicating that the residents evaluated the article less critically on their own. With more practice using this method, it is possible that the precision and accuracy of the residents’ critical appraisal of scientific articles will improve.
In the postsurvey, we asked residents about the critical appraisal of the medical literature. All residents agreed that evaluating the quality of evidence when reading a scientific article was somewhat important or very important to them; however, only 2 of 6 evaluated the quality of evidence all the time, and the other 4 did so half of the time or less than half of the time.
When critically appraising articles, 2 of 6 residents used specific rubrics half of the time; 4 of 6 less than half of the time. Most important, 5 of 6 residents agreed that the quality of evidence affected their management decisions more than half of the time or all of the time. Although it is clear that residents value evidence-based medicine and understand the importance of evaluating the quality of evidence, doing so currently might not be simple or practical.
An organized framework for appraising articles would streamline the process. Five of 6 residents agreed that the use of specific questions as a guide made it easier to appraise an article for the quality of its evidence. Four of 6 residents found that juxtaposing specific questions with the interactive reader was helpful; 5 of 6 agreed that they would use a web-based journal club platform if given the option.
Lastly, 5 of 6 residents agreed that if such a tool were available, a platform containing all major dermatology publications in an interactive reader format, along with relevant appraisal questions on the side, would be useful.
This pilot study augmented the typical journal club experience by emphasizing goal-directed reading and the importance of analyzing the quality of evidence. The combination of independent appraisal of an article using targeted questions and a group debrief led to better understanding of the evidence and its clinical applicability. The COVID-19 pandemic may be a better time than ever to explore innovative ways to teach evidence-based medicine in residency training.
- Mimouni D, Pavlovsky L, Akerman L, et al. Trends in dermatology publications over the past 15 years. Am J Clin Dermatol. 2010;11:55-58. doi:10.2165/11530190-000000000-00000.
- NEJM Knowledge+ Team. Exploring the ACGME Core Competencies: Practice-Based Learning and Improvement (part 2 of 7). Massachusetts Medical Society. NEJM Knowledge+ website. Published July 28, 2016. Accessed January 15, 2022. https://knowledgeplus.nejm.org/blog/practice-based-learning-and-improvement/
- University of Oxford. Critical appraisal tools. Centre for Evidence-Based Medicine website. Accessed January 2, 2022. www.cebm.ox.ac.uk/resources/ebm-tools/critical-appraisal-tools
Practice Points
- A novel web-based application was beta tested in an academic dermatology setting to design and run a journal club for residents.
- Goal-directed reading was emphasized by using guided questions to critically appraise literature based on reliability, significance, and applicability.
- The combination of independent appraisal of an article using targeted questions and a group debrief led to better understanding of the evidence and its clinical applicability.
Naloxone Dispensing in Patients at Risk for Opioid Overdose After Total Knee Arthroplasty Within the Veterans Health Administration
Opioid overdose is a major public health challenge, with recent reports estimating 41 deaths per day in the United States from prescription opioid overdose.1,2 Prescribing naloxone has increasingly been advocated to reduce the risk of opioid overdose for patients identified as high risk. Naloxone distribution has been shown to decrease the incidence of opioid overdoses in the general population.3,4 The Centers for Disease Control and Prevention (CDC) Guideline for Prescribing Opioids for Chronic Pain recommends considering naloxone prescription for patients with a history of overdose or substance use disorder, opioid dosages ≥ 50 morphine equivalent daily dose (MEDD), and concurrent use of benzodiazepines.5
Although the CDC guidelines are intended for primary care clinicians in outpatient settings, naloxone prescribing is also relevant in the postsurgical setting.5 Many surgical patients are at risk for opioid overdose and data from the Veterans Health Administration (VHA) has shown that risk of opioid overdose is 11-fold higher in the 30 days following discharge from a surgical admission, when compared with the subsequent calendar year.6,7 This likely occurs due to new prescriptions or escalated doses of opioids following surgery. Overdose risk may be particularly relevant to orthopedic surgery as postoperative opioids are commonly prescribed.8 Patients undergoing total knee arthroplasty (TKA) may represent a vulnerable population to overdose as it is one of the most commonly performed surgeries for the treatment of chronic pain, and is frequently performed in older adults with medical comorbidities.9,10
Identifying patients at high risk for opioid overdose is important for targeted naloxone dispensing.5 A risk index for overdose or serious opioid-induced respiratory depression (RIOSORD) tool has been developed and validated in veteran and other populations to identify such patients.11 The RIOSORD tool classifies patients by risk level (1-10) and predicts probability of overdose or serious opioid-induced respiratory depression (OSORD). A patient’s level of risk is based on a weighted combination of the 15 independent risk factors most highly associated with OSORD, including comorbid conditions, prescription drug use, and health care utilization.12 Using the RIOSORD tool, the VHA Opioid Education and Naloxone Distribution (OEND) program is a risk mitigation initiative that aims to decrease opioid-related overdose morbidity and mortality. This is achieved via opioid overdose education for prevention, recognition, and response and includes outpatient naloxone prescription.13,14
Despite the comprehensive OEND program, there exists very little data to guide postsurgical naloxone prescribing. The prevalence of known risk factors for overdose in surgical patients remains unknown, as does the prevalence of perioperative naloxone distribution. Understanding overdose risk factors and naloxone prescribing patterns in surgical patients may identify potential targets for OEND efforts. This study retrospectively estimated RIOSORD scores for TKA patients between 2013 to 2016 and described naloxone distribution based on RIOSORD scores and risk factors.
Methods
We identified patients who had undergone primary TKA at VHA hospitals using Current Procedural Terminology (CPT), International Classification of Diseases, Ninth Revision (ICD-9) procedure codes, and data extracted from the VHA Corporate Data Warehouse (CDW) of electronic health records (EHRs). Our study was granted approval with exemption from informed consent by the Durham Veteran Affairs Healthcare System Institutional Review Board.
This retrospective cohort study included all veterans who underwent elective primary TKA from January 1, 2013 through December 31, 2016. We excluded patients who died before discharge.
Outcomes
Our primary outcome was being dispensed an outpatient naloxone prescription following TKA. Naloxone dispensing was identified by examining CDW outpatient pharmacy records with a final dispense date from 1 year before surgery through 7 days after discharge following TKA. To exclude naloxone administration that may have been given in a clinic, prescription data included only records with an outpatient prescription copay. Naloxone dispensing in the year before surgery was chosen to estimate likely preoperative possession of naloxone which could be available in the postoperative period. Naloxone dispensing until 7 days after discharge was chosen to identify any new dispensing that would be available in the postoperative period. These outcomes were examined over the study time frame on an annual basis.
Patient Factors
Demographic variables included age, sex, and race/ethnicity. Independent risk factors for overdose from RIOSORD were identified for each patient.15 These risk factors included comorbidities (opioid use disorder, schizophrenia, bipolar disorder, liver disease, chronic kidney disease, sleep apnea, or lung disease) and prescription drug use (use of opioids, benzodiazepines, long-acting opioids, ≥ 50 MEDD or ≥ 100 MEDD). ICD-9 and ICD-10 diagnosis codes were used to identify comorbidities. Risk classes on day of surgery were identified using a RIOSORD algorithm code. Consistent with the display of RIOSORD risk classes on the VHA Academic Detailing Service OEND risk report, patients were grouped into 3 groups based on their RIOSORD score: classes 1 to 4 (low risk), 5 to 7 (moderate risk), and 8 to 10 (high risk).
Descriptive statistics were used to summarize data on patient demographics, RIOSORD risk factors, overdose events, and naloxone dispensing over time.
Results
The study cohort included 38,011 veterans who underwent primary TKA in the VHA between January 1, 2013 and December 30, 2016. In this cohort, the mean age was 65 years, 93% were male, and 77% were White patients (Table 1). The most common comorbidities were lung disease in 9170 (24.1%) patients, sleep apnea in 6630 (17.4%) patients, chronic kidney disease in 4036 (10.6%) patients, liver disease in 2822 (7.4%) patients, and bipolar disorder in 1748 (4.6%) patients.
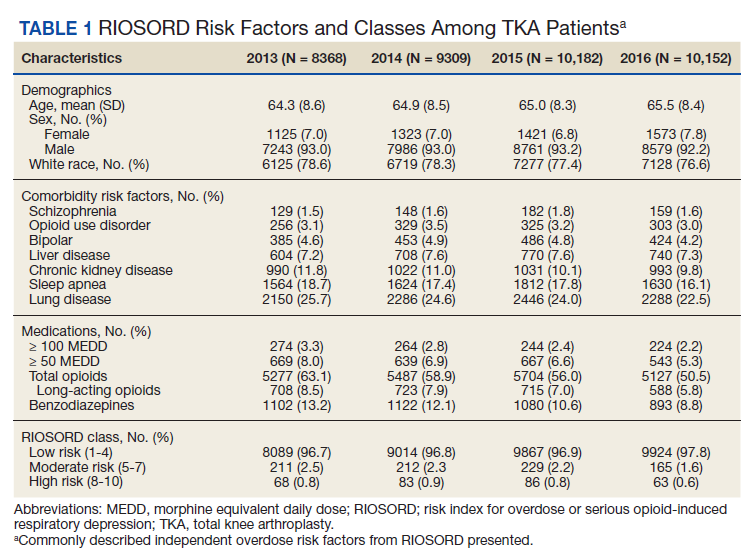
In 2013, 63.1% of patients presenting for surgery were actively prescribed opioids. By 2016, this decreased to 50.5%. Benzodiazepine use decreased from 13.2 to 8.8% and long-acting opioid use decreased from 8.5 to 5.8% over the same period. Patients taking ≥ 50 MEDD decreased from 8.0 to 5.3% and patients taking ≥ 100 MEDD decreased from 3.3 to 2.2%. The prevalence of moderate-risk patients decreased from 2.5 to 1.6% and high-risk patients decreased from 0.8 to 0.6% (Figure 1). Cumulatively, the prevalence of presenting with either moderate or high risk of overdose decreased from 3.3 to 2.2% between 2013 to 2016.
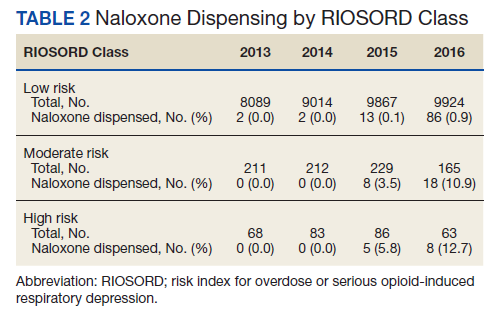
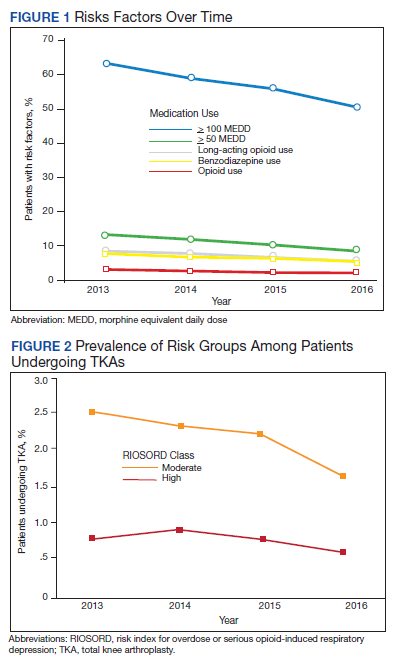
Naloxone Dispensing
In 2013, naloxone was not dispensed to any patients at moderate or high risk for overdose between 365 days prior to surgery until 7 days after discharge (Table 2 and Figure 2). Low-risk group naloxone dispensing increased to 2 (0.0%) in 2014, to 13 (0.1%), in 2015, and to 86 (0.9%) in 2016. Moderate-risk group naloxone dispensing remained at 0 (0.0%) in 2014, but increased to 8 (3.5%) in 2015, and to 18 (10.9%) in 2016. High-risk group naloxone dispensing remained at 0 (0.0%) in 2014, but increased to 5 (5.8%) in 2015, and to 8 (12.7%) in 2016 (Figure 3).
Discussion
Our data demonstrate that patients presenting for TKA between 2013 and 2016 routinely had individual risk factors for overdose related to either prescription drug use or comorbidities. We also show that, although the number of patients at moderate and high risk for opioid overdose is decreasing, 2.2% of TKA patients remain at moderate or high risk for opioid overdose based on a weighted combination of these individual risk factors using RIOSORD. As demand for primary TKA is projected to grow to 3.5 million procedures by 2030, using prevalence from 2016, we estimate that 76,560 patients may present for TKA across the US with moderate or high risk for opioid overdose.9 Following discharge, this risk may be even higher as this estimate does not yet account for postoperative opioid use. We demonstrate that through a VHA OEND initiative, naloxone distribution increased and appeared to be targeted to those most at risk using a simple validated tool like RIOSORD.
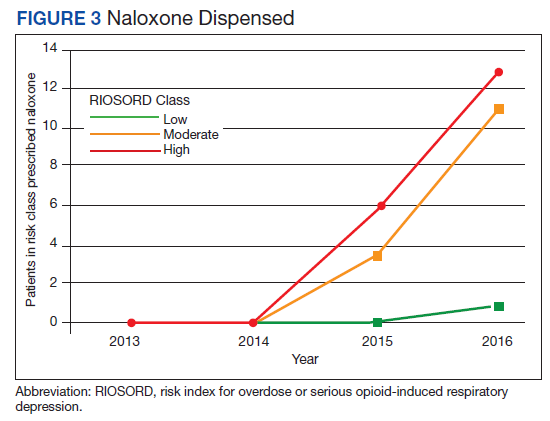
Presence of an individual risk factor for overdose was present in as many as 63.1% of patients presenting for TKA, as was seen in 2013 with preoperative opioid use. The 3 highest scoring prescription use–related risk factors in RIOSORD are use of opioids ≥ 100 MEDD (16 points), ≥ 50 MEDD (9 points), and long-acting formulations (9 points). All 3 decreased in prevalence over the study period but by 2016 were still seen in 2.2% for ≥ 100 MEDD, 5.3% for ≥ 50 MEDD, and 5.8% for long-acting opioids. This decrease was not surprising given implementation of a VHA-wide opioid safety initiative and the OEND program, but this could also be related to changes in patient selection for surgery in the context of increased awareness of the opioid epidemic. Despite the trend toward safer opioid prescribing, by 2016 over half of patients (50.5%) who presented for TKA were already taking opioids, with 10.6% (543 of 5127) on doses ≥ 50 MEDD.
We observed a decrease in RIOSORD risk each year, consistent with decreasing prescription-related risk factors over time. This was most obvious in the moderate-risk group. It is unclear why a similar decrease was not as obvious in the high-risk group, but this in part may be due to the already low numbers of patients in the high-risk group. This may also represent the high-risk group being somewhat resistant to the initiatives that shifted moderate-risk patients to the low-risk group. There were proportionately more patients in the moderate- and high-risk groups in the original RIOSORD population than in our surgical population, which may be attributed to the fewer comorbidities seen in our surgical population, as well as the higher opioid-prescribing patterns seen prior to the VA OEND initiative.12
Naloxone prescribing was rare prior to the OEND initiative and increased from 2013 to 2016. Increases were most marked in those in moderate- and high-risk groups, although naloxone prescribing also increased among the low-risk group. Integration of RIOSORD stratification into the OEND initiative likely played a role in targeting increased access to naloxone among those at highest risk of overdose. Naloxone dispensing increased for every group, although a significant proportion of moderate- and high-risk patients, 89.1% and 87.3%, respectively, were still not dispensed naloxone by 2016. Moreover, our estimates of perioperative naloxone access were likely an overestimate by including patients dispensed naloxone up to 1 year before surgery until 7 days after surgery. The aim was to include patients who may not have been prescribed naloxone postoperatively because of an existing naloxone prescription at home. Perioperative naloxone access estimates would have been even lower if a narrower window had been used to approximate perioperative access. This identifies an important gap between those who may benefit from naloxone dispensing and those who received naloxone. This in part may be because OEND has not been implemented as routinely in surgical settings as other settings (eg, primary care). OEND efforts may more effectively increase naloxone prescribing among surgical patients if these efforts were targeted at surgical and anesthesia departments. Given that the Comprehensive Addiction and Recovery Act of 2016 requires an assessment of patient risk prior to opioid prescribing and VHA efforts to increase utilization of tools like the Stratification Tool for Opioid Risk Mitigation (STORM), which estimates patient risk when initiating an opioid prescription and includes naloxone as one of many risk mitigation strategies, we anticipate that rates of naloxone prescribing will increase over time.
Limitations
Our study captures a large number of patients across VHA hospitals of varying size nationwide, including a mix of those with and without academic medical center affiliations. This veteran population may not represent the US commercially insured population (CIP). Zedler and colleagues highlighted the differences in prevalence of individual risk factors: notably, the CIP had a substantially higher proportion of females and younger patients.11 VHA had a greater prevalence of common chronic conditions associated with older age. The frequency of opioid dependence was similar among CIP and VHA. However, substance abuse and nonopioid substance dependence diagnoses were 4-fold more frequent among VHA controls as CIP controls. Prescribing of all opioids, except morphine and methadone, was substantially greater in CIP than in VHA.11 Despite a difference in individual risk factors, a CIP-specific RIOSORD has been validated and can be used outside of the VHA to obviate the limitations of the VHA-specific RIOSORD.11
Other limitations include our estimation of naloxone access. We do not know whether naloxone was administered or have a reliable estimate of overdose incidence in this postoperative TKA population. Also, it is important to note that RIOSORD was not developed for surgical patients. The use of RIOSORD in a postoperative population likely underestimates risk of opioid overdose due to the frequent prescriptions of new opioids or escalation of existing MEDD to the postoperative patient. Our study was also retrospective in nature and reliant on accurate coding of patient risk factors. It is possible that comorbidities were not accurately identified by EHR and therefore subject to inconsistency.
Conclusions
Veterans presenting for TKA routinely have risk factors for opioid overdose. We observed a trend toward decreasing overdose risk which coincided with the Opioid Safety and OEND initiatives within the VHA. We also observed an increase in naloxone prescription for moderate- and high-risk patients undergoing TKA, although most of these patients still did not receive naloxone as of 2016. More research is needed to refine and validate the RIOSORD score for surgical populations. Expanding initiatives such as OEND to include surgical patients presents an opportunity to improve access to naloxone for postoperative patients that may help reduce opioid overdose in this population.
1. Rudd RA, Seth P, David F, Scholl L. Increases in drug and opioid-involved overdose deaths - United States, 2010-2015. MMWR Morb Mortal Wkly Rep. 2016;65(50-51):1445-1452. Published 2016 Dec 30. doi:10.15585/mmwr.mm655051e1
2. Wilson N, Kariisa M, Seth P, Smith H, Davis NL. Drug and opioid-involved overdose deaths - United States, 2017-2018. MMWR Morb Mortal Wkly Rep. 2020;69(11):290-297. doi:10.15585/mmwr.mm6911a4
3. Walley AY, Xuan Z, Hackman HH, et al. Opioid overdose rates and implementation of overdose education and nasal naloxone distribution in Massachusetts: interrupted time series analysis. BMJ. Jan 30 2013;346:f174. doi:10.1136/bmj.f174
4. McClellan C, Lambdin BH, Ali MM, et al. Opioid-overdose laws association with opioid use and overdose mortality. Addict Behav. 2018;86:90-95. doi:10.1016/j.addbeh.2018.03.014
5. Dowell D, Haegerich TM, Chou R. CDC Guideline for prescribing opioids for chronic pain--United States, 2016. JAMA. 2016;315(15):1624-1645. doi:10.1001/jama.2016.1464
6. Brat GA, Agniel D, Beam A, et al. Postsurgical prescriptions for opioid naive patients and association with overdose and misuse: retrospective cohort study. BMJ. 2018;360:j5790. Published 2018 Jan 17. doi:10.1136/bmj.j5790
7. Mudumbai SC, Lewis ET, Oliva EM, et al. Overdose risk associated with opioid use upon hospital discharge in Veterans Health Administration surgical patients. Pain Med. 2019;20(5):1020-1031. doi:10.1093/pm/pny150
8. Hsia HL, Takemoto S, van de Ven T, et al. Acute pain is associated with chronic opioid use after total knee arthroplasty. Reg Anesth Pain Med. 2018;43(7):705-711. doi:10.1097/AAP.0000000000000831
9. Kurtz S, Ong K, Lau E, Mowat F, Halpern M. Projections of primary and revision hip and knee arthroplasty in the United States from 2005 to 2030. J Bone Joint Surg Am. 2007;89(4):780-785. doi:10.2106/JBJS.F.00222
10. Kurtz SM, Ong KL, Lau E, Bozic KJ. Impact of the economic downturn on total joint replacement demand in the United States: updated projections to 2021. J Bone Joint Surg Am. 2014;96(8):624-630. doi:10.2106/JBJS.M.00285
11. Zedler BK, Saunders WB, Joyce AR, Vick CC, Murrelle EL. Validation of a screening risk index for serious prescription opioid-induced respiratory depression or overdose in a US commercial health plan claims database. Pain Med. 2018;19(1):68-78. doi:10.1093/pm/pnx009
12. Zedler B, Xie L, Wang L, et al. Development of a risk index for serious prescription opioid-induced respiratory depression or overdose in Veterans Health Administration patients. Pain Med. 2015;16(8):1566-79. doi:10.1111/pme.12777
13. Oliva EM, Bowe T, Tavakoli S, et al. Development and applications of the Veterans Health Administration’s Stratification Tool for Opioid Risk Mitigation (STORM) to improve opioid safety and prevent overdose and suicide. Psychol Serv. 2017;14(1):34-49. doi:10.1037/ser0000099
14. Oliva EM, Christopher MLD, Wells D, et al. Opioid overdose education and naloxone distribution: development of the Veterans Health Administration’s national program. J Am Pharm Assoc (2003). 2017;57(2S):S168-S179.e4. doi:10.1016/j.japh.2017.01.022
15. Noël PH, Copeland LA, Perrin RA, et al. VHA Corporate Data Warehouse height and weight data: opportunities and challenges for health services research. J Rehabil Res Dev. 2010;47(8):739-750. doi:10.1682/jrrd.2009.08.0110
Opioid overdose is a major public health challenge, with recent reports estimating 41 deaths per day in the United States from prescription opioid overdose.1,2 Prescribing naloxone has increasingly been advocated to reduce the risk of opioid overdose for patients identified as high risk. Naloxone distribution has been shown to decrease the incidence of opioid overdoses in the general population.3,4 The Centers for Disease Control and Prevention (CDC) Guideline for Prescribing Opioids for Chronic Pain recommends considering naloxone prescription for patients with a history of overdose or substance use disorder, opioid dosages ≥ 50 morphine equivalent daily dose (MEDD), and concurrent use of benzodiazepines.5
Although the CDC guidelines are intended for primary care clinicians in outpatient settings, naloxone prescribing is also relevant in the postsurgical setting.5 Many surgical patients are at risk for opioid overdose and data from the Veterans Health Administration (VHA) has shown that risk of opioid overdose is 11-fold higher in the 30 days following discharge from a surgical admission, when compared with the subsequent calendar year.6,7 This likely occurs due to new prescriptions or escalated doses of opioids following surgery. Overdose risk may be particularly relevant to orthopedic surgery as postoperative opioids are commonly prescribed.8 Patients undergoing total knee arthroplasty (TKA) may represent a vulnerable population to overdose as it is one of the most commonly performed surgeries for the treatment of chronic pain, and is frequently performed in older adults with medical comorbidities.9,10
Identifying patients at high risk for opioid overdose is important for targeted naloxone dispensing.5 A risk index for overdose or serious opioid-induced respiratory depression (RIOSORD) tool has been developed and validated in veteran and other populations to identify such patients.11 The RIOSORD tool classifies patients by risk level (1-10) and predicts probability of overdose or serious opioid-induced respiratory depression (OSORD). A patient’s level of risk is based on a weighted combination of the 15 independent risk factors most highly associated with OSORD, including comorbid conditions, prescription drug use, and health care utilization.12 Using the RIOSORD tool, the VHA Opioid Education and Naloxone Distribution (OEND) program is a risk mitigation initiative that aims to decrease opioid-related overdose morbidity and mortality. This is achieved via opioid overdose education for prevention, recognition, and response and includes outpatient naloxone prescription.13,14
Despite the comprehensive OEND program, there exists very little data to guide postsurgical naloxone prescribing. The prevalence of known risk factors for overdose in surgical patients remains unknown, as does the prevalence of perioperative naloxone distribution. Understanding overdose risk factors and naloxone prescribing patterns in surgical patients may identify potential targets for OEND efforts. This study retrospectively estimated RIOSORD scores for TKA patients between 2013 to 2016 and described naloxone distribution based on RIOSORD scores and risk factors.
Methods
We identified patients who had undergone primary TKA at VHA hospitals using Current Procedural Terminology (CPT), International Classification of Diseases, Ninth Revision (ICD-9) procedure codes, and data extracted from the VHA Corporate Data Warehouse (CDW) of electronic health records (EHRs). Our study was granted approval with exemption from informed consent by the Durham Veteran Affairs Healthcare System Institutional Review Board.
This retrospective cohort study included all veterans who underwent elective primary TKA from January 1, 2013 through December 31, 2016. We excluded patients who died before discharge.
Outcomes
Our primary outcome was being dispensed an outpatient naloxone prescription following TKA. Naloxone dispensing was identified by examining CDW outpatient pharmacy records with a final dispense date from 1 year before surgery through 7 days after discharge following TKA. To exclude naloxone administration that may have been given in a clinic, prescription data included only records with an outpatient prescription copay. Naloxone dispensing in the year before surgery was chosen to estimate likely preoperative possession of naloxone which could be available in the postoperative period. Naloxone dispensing until 7 days after discharge was chosen to identify any new dispensing that would be available in the postoperative period. These outcomes were examined over the study time frame on an annual basis.
Patient Factors
Demographic variables included age, sex, and race/ethnicity. Independent risk factors for overdose from RIOSORD were identified for each patient.15 These risk factors included comorbidities (opioid use disorder, schizophrenia, bipolar disorder, liver disease, chronic kidney disease, sleep apnea, or lung disease) and prescription drug use (use of opioids, benzodiazepines, long-acting opioids, ≥ 50 MEDD or ≥ 100 MEDD). ICD-9 and ICD-10 diagnosis codes were used to identify comorbidities. Risk classes on day of surgery were identified using a RIOSORD algorithm code. Consistent with the display of RIOSORD risk classes on the VHA Academic Detailing Service OEND risk report, patients were grouped into 3 groups based on their RIOSORD score: classes 1 to 4 (low risk), 5 to 7 (moderate risk), and 8 to 10 (high risk).
Descriptive statistics were used to summarize data on patient demographics, RIOSORD risk factors, overdose events, and naloxone dispensing over time.
Results
The study cohort included 38,011 veterans who underwent primary TKA in the VHA between January 1, 2013 and December 30, 2016. In this cohort, the mean age was 65 years, 93% were male, and 77% were White patients (Table 1). The most common comorbidities were lung disease in 9170 (24.1%) patients, sleep apnea in 6630 (17.4%) patients, chronic kidney disease in 4036 (10.6%) patients, liver disease in 2822 (7.4%) patients, and bipolar disorder in 1748 (4.6%) patients.
In 2013, 63.1% of patients presenting for surgery were actively prescribed opioids. By 2016, this decreased to 50.5%. Benzodiazepine use decreased from 13.2 to 8.8% and long-acting opioid use decreased from 8.5 to 5.8% over the same period. Patients taking ≥ 50 MEDD decreased from 8.0 to 5.3% and patients taking ≥ 100 MEDD decreased from 3.3 to 2.2%. The prevalence of moderate-risk patients decreased from 2.5 to 1.6% and high-risk patients decreased from 0.8 to 0.6% (Figure 1). Cumulatively, the prevalence of presenting with either moderate or high risk of overdose decreased from 3.3 to 2.2% between 2013 to 2016.
Naloxone Dispensing
In 2013, naloxone was not dispensed to any patients at moderate or high risk for overdose between 365 days prior to surgery until 7 days after discharge (Table 2 and Figure 2). Low-risk group naloxone dispensing increased to 2 (0.0%) in 2014, to 13 (0.1%), in 2015, and to 86 (0.9%) in 2016. Moderate-risk group naloxone dispensing remained at 0 (0.0%) in 2014, but increased to 8 (3.5%) in 2015, and to 18 (10.9%) in 2016. High-risk group naloxone dispensing remained at 0 (0.0%) in 2014, but increased to 5 (5.8%) in 2015, and to 8 (12.7%) in 2016 (Figure 3).
Discussion
Our data demonstrate that patients presenting for TKA between 2013 and 2016 routinely had individual risk factors for overdose related to either prescription drug use or comorbidities. We also show that, although the number of patients at moderate and high risk for opioid overdose is decreasing, 2.2% of TKA patients remain at moderate or high risk for opioid overdose based on a weighted combination of these individual risk factors using RIOSORD. As demand for primary TKA is projected to grow to 3.5 million procedures by 2030, using prevalence from 2016, we estimate that 76,560 patients may present for TKA across the US with moderate or high risk for opioid overdose.9 Following discharge, this risk may be even higher as this estimate does not yet account for postoperative opioid use. We demonstrate that through a VHA OEND initiative, naloxone distribution increased and appeared to be targeted to those most at risk using a simple validated tool like RIOSORD.
Presence of an individual risk factor for overdose was present in as many as 63.1% of patients presenting for TKA, as was seen in 2013 with preoperative opioid use. The 3 highest scoring prescription use–related risk factors in RIOSORD are use of opioids ≥ 100 MEDD (16 points), ≥ 50 MEDD (9 points), and long-acting formulations (9 points). All 3 decreased in prevalence over the study period but by 2016 were still seen in 2.2% for ≥ 100 MEDD, 5.3% for ≥ 50 MEDD, and 5.8% for long-acting opioids. This decrease was not surprising given implementation of a VHA-wide opioid safety initiative and the OEND program, but this could also be related to changes in patient selection for surgery in the context of increased awareness of the opioid epidemic. Despite the trend toward safer opioid prescribing, by 2016 over half of patients (50.5%) who presented for TKA were already taking opioids, with 10.6% (543 of 5127) on doses ≥ 50 MEDD.
We observed a decrease in RIOSORD risk each year, consistent with decreasing prescription-related risk factors over time. This was most obvious in the moderate-risk group. It is unclear why a similar decrease was not as obvious in the high-risk group, but this in part may be due to the already low numbers of patients in the high-risk group. This may also represent the high-risk group being somewhat resistant to the initiatives that shifted moderate-risk patients to the low-risk group. There were proportionately more patients in the moderate- and high-risk groups in the original RIOSORD population than in our surgical population, which may be attributed to the fewer comorbidities seen in our surgical population, as well as the higher opioid-prescribing patterns seen prior to the VA OEND initiative.12
Naloxone prescribing was rare prior to the OEND initiative and increased from 2013 to 2016. Increases were most marked in those in moderate- and high-risk groups, although naloxone prescribing also increased among the low-risk group. Integration of RIOSORD stratification into the OEND initiative likely played a role in targeting increased access to naloxone among those at highest risk of overdose. Naloxone dispensing increased for every group, although a significant proportion of moderate- and high-risk patients, 89.1% and 87.3%, respectively, were still not dispensed naloxone by 2016. Moreover, our estimates of perioperative naloxone access were likely an overestimate by including patients dispensed naloxone up to 1 year before surgery until 7 days after surgery. The aim was to include patients who may not have been prescribed naloxone postoperatively because of an existing naloxone prescription at home. Perioperative naloxone access estimates would have been even lower if a narrower window had been used to approximate perioperative access. This identifies an important gap between those who may benefit from naloxone dispensing and those who received naloxone. This in part may be because OEND has not been implemented as routinely in surgical settings as other settings (eg, primary care). OEND efforts may more effectively increase naloxone prescribing among surgical patients if these efforts were targeted at surgical and anesthesia departments. Given that the Comprehensive Addiction and Recovery Act of 2016 requires an assessment of patient risk prior to opioid prescribing and VHA efforts to increase utilization of tools like the Stratification Tool for Opioid Risk Mitigation (STORM), which estimates patient risk when initiating an opioid prescription and includes naloxone as one of many risk mitigation strategies, we anticipate that rates of naloxone prescribing will increase over time.
Limitations
Our study captures a large number of patients across VHA hospitals of varying size nationwide, including a mix of those with and without academic medical center affiliations. This veteran population may not represent the US commercially insured population (CIP). Zedler and colleagues highlighted the differences in prevalence of individual risk factors: notably, the CIP had a substantially higher proportion of females and younger patients.11 VHA had a greater prevalence of common chronic conditions associated with older age. The frequency of opioid dependence was similar among CIP and VHA. However, substance abuse and nonopioid substance dependence diagnoses were 4-fold more frequent among VHA controls as CIP controls. Prescribing of all opioids, except morphine and methadone, was substantially greater in CIP than in VHA.11 Despite a difference in individual risk factors, a CIP-specific RIOSORD has been validated and can be used outside of the VHA to obviate the limitations of the VHA-specific RIOSORD.11
Other limitations include our estimation of naloxone access. We do not know whether naloxone was administered or have a reliable estimate of overdose incidence in this postoperative TKA population. Also, it is important to note that RIOSORD was not developed for surgical patients. The use of RIOSORD in a postoperative population likely underestimates risk of opioid overdose due to the frequent prescriptions of new opioids or escalation of existing MEDD to the postoperative patient. Our study was also retrospective in nature and reliant on accurate coding of patient risk factors. It is possible that comorbidities were not accurately identified by EHR and therefore subject to inconsistency.
Conclusions
Veterans presenting for TKA routinely have risk factors for opioid overdose. We observed a trend toward decreasing overdose risk which coincided with the Opioid Safety and OEND initiatives within the VHA. We also observed an increase in naloxone prescription for moderate- and high-risk patients undergoing TKA, although most of these patients still did not receive naloxone as of 2016. More research is needed to refine and validate the RIOSORD score for surgical populations. Expanding initiatives such as OEND to include surgical patients presents an opportunity to improve access to naloxone for postoperative patients that may help reduce opioid overdose in this population.
1. Rudd RA, Seth P, David F, Scholl L. Increases in drug and opioid-involved overdose deaths - United States, 2010-2015. MMWR Morb Mortal Wkly Rep. 2016;65(50-51):1445-1452. Published 2016 Dec 30. doi:10.15585/mmwr.mm655051e1
2. Wilson N, Kariisa M, Seth P, Smith H, Davis NL. Drug and opioid-involved overdose deaths - United States, 2017-2018. MMWR Morb Mortal Wkly Rep. 2020;69(11):290-297. doi:10.15585/mmwr.mm6911a4
3. Walley AY, Xuan Z, Hackman HH, et al. Opioid overdose rates and implementation of overdose education and nasal naloxone distribution in Massachusetts: interrupted time series analysis. BMJ. Jan 30 2013;346:f174. doi:10.1136/bmj.f174
4. McClellan C, Lambdin BH, Ali MM, et al. Opioid-overdose laws association with opioid use and overdose mortality. Addict Behav. 2018;86:90-95. doi:10.1016/j.addbeh.2018.03.014
5. Dowell D, Haegerich TM, Chou R. CDC Guideline for prescribing opioids for chronic pain--United States, 2016. JAMA. 2016;315(15):1624-1645. doi:10.1001/jama.2016.1464
6. Brat GA, Agniel D, Beam A, et al. Postsurgical prescriptions for opioid naive patients and association with overdose and misuse: retrospective cohort study. BMJ. 2018;360:j5790. Published 2018 Jan 17. doi:10.1136/bmj.j5790
7. Mudumbai SC, Lewis ET, Oliva EM, et al. Overdose risk associated with opioid use upon hospital discharge in Veterans Health Administration surgical patients. Pain Med. 2019;20(5):1020-1031. doi:10.1093/pm/pny150
8. Hsia HL, Takemoto S, van de Ven T, et al. Acute pain is associated with chronic opioid use after total knee arthroplasty. Reg Anesth Pain Med. 2018;43(7):705-711. doi:10.1097/AAP.0000000000000831
9. Kurtz S, Ong K, Lau E, Mowat F, Halpern M. Projections of primary and revision hip and knee arthroplasty in the United States from 2005 to 2030. J Bone Joint Surg Am. 2007;89(4):780-785. doi:10.2106/JBJS.F.00222
10. Kurtz SM, Ong KL, Lau E, Bozic KJ. Impact of the economic downturn on total joint replacement demand in the United States: updated projections to 2021. J Bone Joint Surg Am. 2014;96(8):624-630. doi:10.2106/JBJS.M.00285
11. Zedler BK, Saunders WB, Joyce AR, Vick CC, Murrelle EL. Validation of a screening risk index for serious prescription opioid-induced respiratory depression or overdose in a US commercial health plan claims database. Pain Med. 2018;19(1):68-78. doi:10.1093/pm/pnx009
12. Zedler B, Xie L, Wang L, et al. Development of a risk index for serious prescription opioid-induced respiratory depression or overdose in Veterans Health Administration patients. Pain Med. 2015;16(8):1566-79. doi:10.1111/pme.12777
13. Oliva EM, Bowe T, Tavakoli S, et al. Development and applications of the Veterans Health Administration’s Stratification Tool for Opioid Risk Mitigation (STORM) to improve opioid safety and prevent overdose and suicide. Psychol Serv. 2017;14(1):34-49. doi:10.1037/ser0000099
14. Oliva EM, Christopher MLD, Wells D, et al. Opioid overdose education and naloxone distribution: development of the Veterans Health Administration’s national program. J Am Pharm Assoc (2003). 2017;57(2S):S168-S179.e4. doi:10.1016/j.japh.2017.01.022
15. Noël PH, Copeland LA, Perrin RA, et al. VHA Corporate Data Warehouse height and weight data: opportunities and challenges for health services research. J Rehabil Res Dev. 2010;47(8):739-750. doi:10.1682/jrrd.2009.08.0110