User login
COVID-19 shot appears to reduce diabetes risk, even after Omicron
new data suggest.
The findings, from more than 20,000 patients in the Cedars-Sinai Health System in Los Angeles, suggest that “continued efforts to prevent COVID-19 infection may be beneficial to patient health until we develop better understanding of the effects of potential long-term effects of COVID-19,” lead author Alan C. Kwan, MD, of the department of cardiology at Cedars Sinai’s Smidt Heart Institute, said in an interview.
Several studies conducted early in the pandemic suggested increased risks for both new-onset diabetes and cardiometabolic diseases following COVID-19 infection, possibly because of persistent inflammation contributing to insulin resistance.
However, it hasn’t been clear if those risks have persisted with the more recent predominance of the less-virulent Omicron variant or whether the COVID-19 vaccine influences the risk. This new study suggests that both are the case.
“Our results verify that the risk of developing type 2 diabetes after a COVID-19 infection was not just an early observation but, in fact, a real risk that has, unfortunately, persisted through the Omicron era,” Dr. Kwan noted.
“While the level of evidence by our study and others may not reach the degree needed to affect formal guidelines at this time, we believe it is reasonable to have increased clinical suspicion for diabetes after COVID-19 infection and a lower threshold for testing,” he added.
Moreover, “we believe that our study and others suggest the potential role of COVID-19 to affect cardiovascular risk, and so both prevention of COVID-19 infection, through reasonable personal practices and vaccination, and an increased attention to cardiovascular health after COVID-19 infection is warranted.”
The findings were published online in JAMA Network Open.
Dr. Kwan and colleagues analyzed data for a total of 23,709 patients treated (inpatient and outpatient) for at least one COVID-19 infection between March 2020 and June 2022.
Rates of new-onset diabetes (using ICD-10 codes, primarily type 2 diabetes), hypertension, and hyperlipidemia were all elevated in the 90 days following COVID-19 infection compared with the 90 days prior. The same was true of two diagnoses unrelated to COVID-19, urinary tract infection and gastroesophageal reflux, used as benchmarks of health care engagement.
The highest odds for post versus preinfection were for diabetes (odds ratio, 2.35; P < .001), followed by hypertension (OR, 1.54; P < .001), the benchmark diagnoses (OR, 1.42; P < .001), and hyperlipidemia (OR, 1.22; P = .03).
Following adjustments, the risk versus the benchmark conditions for new-onset diabetes before versus after COVID-19 was significantly elevated (OR, 1.58; P < .001), while the risks for hypertension and hyperlipidemia versus benchmark diagnoses were not (OR, 1.06; P = .52 and 0.91, P = .43, respectively).
The diabetes risk after versus before COVID-19 infection was higher among those who had not been vaccinated (OR, 1.78; P < .001), compared with those who had received the vaccine (OR, 1.07; P = .80).
However, there was no significant interaction between vaccination and diabetes diagnosis (P = .08). “For this reason, we believe our data are suggestive of a protective effect in the population who received vaccination prior to infection, but [this is] not definitive,” Dr. Kwan said.
There were no apparent interactions by age, sex, or pre-existing cardiovascular risk factors, including hypertension or hyperlipidemia. Age, sex, and timing of index infection regarding the Omicron variant were not associated with an increased risk of a new cardiometabolic diagnosis before or after COVID-19 infection in any of the models.
Dr. Kwan said in an interview: “We have continued to be surprised by the evolving understanding of the SARS-CoV-2 virus and the effects on human health. In the beginning of the pandemic it was framed as a purely respiratory virus, which we now know to be a severely limited description of all of its potential effects on the human body. We believe that our research and others raise a concern for increased cardiometabolic risk after COVID infection.”
He added that, “while knowledge is incomplete on this topic, we believe that clinical providers may wish to have a higher degree of suspicion for both diabetes and risk of future cardiac events in patients after COVID infection, and that continued efforts to prevent COVID infection may be beneficial to patient health until we develop better understanding of the potential long-term effects of COVID.”
This study was funded by the Erika J. Glazer Family Foundation, the Doris Duke Charitable Foundation, and grants from the National Institutes of Health. Dr. Kwan reported receiving grants from the Doris Duke Charitable Foundation during the conduct of the study.
A version of this article originally appeared on Medscape.com.
FROM JAMA NETWORK OPEN
A Review of the Glycemia Reduction Approaches in Diabetes (GRADE) Study: Comparing the Effectiveness of Type 2 Diabetes Medications

Type 2 diabetes (T2D) is a chronic, progressive disease marked by ongoing decline in insulin sensitivity and beta-cell function over time. Clinical trials have shown that lowering A1C to ∼7.0% (53 mmol/mol), especially after an early diagnosis, can markedly reduce the long-term complications of T2D. Metformin has become the generally recommended first therapeutic agent in treating T2D due to the drug’s long-term experience, effectiveness, and avoidance of hypoglycemia or weight gain. However, it is clear that additional agents are necessary to regain glucose control when metformin eventually fails due to the progressive nature of the disease.
Insufficient data on comparative efficacy and durability of effect has led to uncertainty in recommendations for the preferred second agent. Comparative effectiveness has been reported primarily in industry-sponsored trials of relatively short duration. With this in mind, the National Institute of Diabetes and Digestive and Kidney Diseases (NIDDK) sponsored the Glycemia Reduction Approaches in Diabetes: A Comparative Effectiveness (GRADE) Study. This landmark, randomized controlled study was initiated in 2013, enrolling patients on metformin alone within 10 years of diagnosis of T2D. It involved 36 research sites in the United States with a mean follow-up of 5 years. The participants were randomized to adding a dipeptidyl peptidase 4 (DPP-4) inhibitor (sitagliptin), a sulfonylurea (glimepiride), basal insulin (glargine), or a glucagon-like peptide 1 receptor agonist (GLP-1 RA) (liraglutide), with the primary outcome being time to A1C over 7.0%.
The GRADE study was unique in several ways: its size, scope, length, and the fact that the financial support and design planning stemmed from a U34 planning grant from the NIDDK. The study population of 5047 participants was very diverse, reflecting the population affected by T2D. A mix of racial and ethnic groups were represented, including 19.8% Black participants and 18.6% Hispanic participants. It is unlikely that a similar comparative effectiveness trial of pharmacologic treatment of T2D will be performed again in the future, considering the high costs and length of time required for such a study amid the dynamic drug development environment today. In fact, the final implementation of study results is somewhat complicated by the subsequent approval of GLP-1 RAs of greater efficacy, weight loss, and convenience, as well as sodium-glucose cotransporter 2 (SGLT2) inhibitors and, most recently, a dual GLP-1/gastric inhibitory polypeptide (GIP) receptor agonist (tirzepatide). Many of these newer agents have demonstrated nonglycemic benefits, such as reduced risk of cardiovascular (CV) events or reduced progression of renal disease. The findings from the GRADE study, however, did provide important insight on the long-term management of T2D.
The GRADE study was the first to compare the efficacy of 4 US Food and Drug Administration–approved drugs for T2D in maintaining blood glucose levels for the longest amount of time in patients with T2D. It also monitored microvascular complications, CV events, and adverse drug effects.
An important message of the study that may be overlooked is that all of the studied agents’ ability to maintain an A1C under 7.0% was quite low—as 71% of all participants reached the primary outcome by 5 years; the best results for a group were 67% for glargine and 68% for liraglutide. In general, the results showed that liraglutide and insulin glargine were superior to glimepiride and sitagliptin in controlling blood sugars. They provided approximately 6 months’ more time with blood glucose levels in the desired range compared with sitagliptin, which was shown to provide the least amount of time in maintaining glucose levels. Fifty-five percent of the sitagliptin group experienced the primary outcome at 1 year. Sitagliptin was particularly ineffective for the patient subgroup with an A1C at baseline of 7.8% or higher, where 70% reached the primary outcome in 1 year. The results were uniform regarding age, race, sex, and ethnicity of the trial participants. The intention-to-treat design of the study limits the conclusions about A1C differences, as failure to maintain an A1C under 7.5% required addition of prandial insulin for the glargine group and the addition of glargine to the other 3 groups. Although subjects receiving glargine had an initial glucose-lowering effect that was less than that seen with liraglutide, the ability to keep titrating the glargine likely had an impact on the long-term benefit of that agent. When the glargine group neared or in some cases even passed the secondary outcome A1C level of 7.5%, the basal insulin was increased to lower the A1C, sometimes even when the protocol would recommend adding prandial insulin.
The study was not powered specifically for determining the relative risk of CV events. However, there was some evidence that liraglutide was associated with lower CV risk than the other 3 agents by about 30%. There was no difference in microvascular risk among the agents in this study of relatively short-term disease. Side effects were not a major problem and no different than expected. Glargine and glimepiride were associated with less weight loss, while liraglutide had a particular benefit on weight. Glimepiride is associated with significantly more frequent incidents of severe hypoglycemia, though the rates of severe hypoglycemia were quite low. Liraglutide users reported significantly higher rates of nausea and had a higher early drop-out rate, but did not show a difference in continued use by the end of the study.
In summary, the GRADE trial confirmed that glucose control in T2D is a progressive problem, as the addition of all 4 classes of medication failed to keep most patients in the target glucose range. However, basal insulin and GLP-1 RAs outperformed the other 2 classes. Sitagliptin has the poorest metabolic profile. One could argue that, based on overall metabolic control and concomitant weight benefits, less need for glucose monitoring, simple titration, apparent CV benefit, and insignificant hypoglycemia, GLP-1 RAs offer the best option as an agent to add to metformin. This conclusion is fortified by the fact that the agent used to represent this class in the study appears to be less effective in reducing glucose and weight and offers less convenience than the newer, once-weekly GLP-RAs available today.
Type 1 diabetes no longer a disease of the thin: Lifestyle advice needed
About two-thirds of people with type 1 diabetes in the United States have overweight or obesity, nearly the same proportion as Americans without diabetes, new nationwide survey data suggest.
What’s more, among people with overweight or obesity, those with type 1 diabetes are less likely to receive lifestyle recommendations from health care professionals than those with type 2 diabetes, and are less likely to actually engage in lifestyle weight management activities than others with overweight or obesity, with or without type 2 diabetes.
“Among U.S. adults with type 1 diabetes, the burden of overweight and obesity is substantial and remains poorly managed,” write Michael Fang, PhD, of the Johns Hopkins Bloomberg School of Public Health, Baltimore, and colleagues.
Their data, from the National Health Interview Survey (NHIS), were published online in Annals of Internal Medicine.
The need for insulin complicates weight management in people with type 1 diabetes because changes in diet and physical activity typically require adjustments to insulin timing and dosage to prevent hypoglycemia. There is little evidence to guide this for weight management, Dr. Fang and colleagues explain.
Consequently, “the lack of evidence for safe, effective methods of diet- and exercise-based weight control in people with type 1 diabetes may be keeping doctors from recommending such methods,” Dr. Fang said in a statement.
“Large clinical trials have been done in type 2 diabetes patients to establish guidelines for diet- and exercise-based weight management, and we now need something similar for type 1 diabetes patients.”
Asked to comment, M. Sue Kirkman, MD, told this news organization: “The days when we could teach simple concepts about diabetes type like ‘those with type 1 are lean and those with type 2 are overweight’ are long gone. … Of concern, fewer adults with type 1 diabetes and overweight/obesity report that they are engaging in physical activity or caloric restriction than those without diabetes or those with type 2 diabetes.”
There are several likely reasons for the low rates of obesity/overweight lifestyle modification advice and implementation for those with type 1 diabetes, noted Dr. Kirkman, of the University of North Carolina at Chapel Hill, who coauthored joint American/European guidance on type 1 diabetes management.
“Medical visits are often primarily focused on glycemic management and complications screening, and we know that physicians in general are not very knowledgeable about how to counsel people – even those without diabetes – on weight loss. When you add in potential worries, real or not, about hypoglycemia, ketosis with carbohydrate restriction … it’s no wonder that this may not be addressed in busy visits.”
She also observed, “In years of going to diabetes meetings, I’ve noticed occasional sessions on managing ‘elite athletes’ with type 1 diabetes, but rarely are there sessions on how to counsel people about everyday healthy living.”
Many with type 1 diabetes have overweight/obesity
Dr. Fang and colleagues analyzed NHIS data for the years 2016, 2017, 2019, 2020, and 2021, when diabetes subtype data were available, for 128,571 adults. Diabetes type and height/weight data were self-reported. In the 2016, 2017, and 2020 surveys, participants were asked whether their physicians had recommended increasing physical activity and/or reducing calorie or fat consumption, and whether they were currently engaging in those activities.
The study population comprised 733 people with type 1 diabetes, 12,397 with type 2 diabetes, and 115,441 without diabetes. The proportions with overweight (body mass index, 25 to < 30 kg/m2) or obesity (≥ 30 kg/m2) were 62% among those with type 1 diabetes and 64% among those without diabetes, compared with 86% among those with type 2 diabetes.
Among those with overweight or obesity, the proportions who reported having received lifestyle recommendations were greatest among those with type 2 diabetes and least among those without diabetes, with the type 1 diabetes group in the middle.
After adjustment for age, sex, and race/ethnicity, the adjusted prevalence of receiving a provider recommendation to increase physical activity was 60% for those with type 2 diabetes, 54% for type 1 diabetes, and 44% for those without diabetes. Proportions for receiving recommendations for reducing fat/caloric intake were similar, at 60%, 51%, and 41%, respectively.
The proportions who reported actually engaging in lifestyle activities for weight management were lowest among those with type 1 diabetes, with 52% and 56% of them reporting having increased their physical activity and reducing fat/calories, respectively, compared with proportions ranging from 56% to 63% among the other two groups.
Regarding those findings, Dr. Kirkman commented, “In addition to the factors regarding physician interactions, people with type 1 diabetes may see this as a lower-priority health issue after years of being told that glucose control is the main priority.”
“I also wonder if the many, many tasks people with type 1 diabetes must do every day to manage their diabetes – along with other life issues all adults face – mean that there is just too much on the plate to add more lifestyle changes,” she added.
Asked about the potential for off-label use of glucagonlike peptide–1 agonists for weight management for people with type 1 diabetes, Dr. Kirkman said they could probably help some patients. However, she also pointed to two clinical trials in which liraglutide added to insulin therapy helped with glycemic control and weight reduction, but also increased the risk for hypoglycemia and diabetic ketoacidosis.
“It’s really important that researchers engage with adults with type 1 diabetes to better understand the unique priorities and barriers they face in addressing body weight,” Dr. Kirkman said.
Senior study author Elizabeth Selvin, PhD, professor of epidemiology at the Bloomberg School, said in the statement: “Our study busts the myth that people with type 1 diabetes are not being affected by the global obesity epidemic. … These findings should be a wake-up call that we need to be aggressive in addressing the obesity epidemic in persons with type 1 diabetes.”
The study was funded by the U.S. National Institutes of Health. Dr. Fang and Dr. Kirkman have reported no relevant financial relationships. Dr. Selvin has reported receiving royalty payments from Wolters Kluwer for chapters and laboratory monographs in UpToDate. She also reports receiving honoraria for editorial work on journals published by the American Diabetes Association and European Association for the Study of Diabetes.
A version of this article originally appeared on Medscape.com.
FROM ANNALS OF INTERNAL MEDICINE
The 5-year survival rate for pancreatic cancer is increasing
John Whyte, MD: Hello, I’m Dr. John Whyte, the Chief Medical Officer of WebMD. One of those cancers was pancreatic cancer, which historically has had a very low survival rate. What’s going on here? Are we doing better with diagnosis, treatment, a combination?
Joining me today is Dr. Lynn Matrisian. She is PanCAN’s chief science officer. Dr. Matrisian, thanks for joining me today. It’s great to see you.
Lynn Matrisian, PhD, MBA: Great to be here. Thank you.
Dr. Whyte: Well, tell me what your first reaction was when you saw the recent data from the American Cancer Society. What one word would you use?
Dr. Matrisian: Hopeful. I think hopeful in general that survival rates are increasing, not for all cancers, but for many cancers. We continue to make progress. Research is making a difference. And we’re making progress against cancer in general.
Dr. Whyte: You’re passionate, as our viewers know, about pancreatic cancer. And that’s been one of the hardest cancers to treat, and one of the lowest survival rates. But there’s some encouraging news that we saw, didn’t we?
Dr. Matrisian: Yes. So the 5-year survival rate for pancreatic cancer went up a whole percentage. It’s at 12% now. And what’s really good is it was at 11% last year. It was at 10% the year before. So that’s 2 years in a row that we’ve had an increase in the 5-year survival rate for pancreatic cancer. So we’re hopeful that’s a trajectory that we can really capitalize on is how fast we’re making progress in this disease.
Dr. Whyte: I want to put it into context, Lynn. Because some people might be thinking, 1%? Like you’re excited about 1%? That doesn’t seem that much. But correct me if I’m wrong. A one percentage point increase means 641 more loved ones will enjoy life’s moments, as you put it, 5 years after their diagnosis that otherwise wouldn’t have. What does that practically mean to viewers?
Dr. Matrisian: That means that more than 600 people in the United States will hug a loved one 5 years after that diagnosis of pancreatic cancer. It is a very deadly disease. But we’re going to, by continuing to make progress, it gives those moments to those people. And it means that we’re making progress against the disease in general.
Dr. Whyte: So even 1%, and 1% each year, does have value.
Dr. Matrisian: It has a lot of value.
Dr. Whyte: What’s driving this improvement? Is it better screening? And we’re not so great still in screening a pancreatic cancer. Is it the innovation in cancer treatments? What do you think is accounting for what we hope is this trajectory of increases in 5-year survival?
Dr. Matrisian: Right, so the nice thing the reason that we like looking at 5-year survival rates is because it takes into account all of those things. And we have actually made progress in all of those things. So by looking at those that are diagnosed with pancreatic cancer in general as a whole, and looking at their survival, we are looking at better treatments. People who are getting pancreatic cancer later are living longer as a result of better treatments.
But it’s not just that. It’s also, if you’re diagnosed earlier, your 5-year survival rate is higher. More people who are diagnosed early live to five years than those that are diagnosed later. So within that statistic, there are more people who are diagnosed earlier. And those people also live longer. So it takes into account all of those things, which is why we really like to look at that five-year survival rate for a disease like pancreatic cancer.
Dr. Whyte: Where are we on screening? Because we always want to catch people early. That gives them that greatest chance of survival. Have we made much improvements there? And if we have, what are they?
Dr. Matrisian: Well we have made improvements there are more people that are now diagnosed with localized disease than there were 20 years ago. So that is increasing. And we’re still doing it really by being aware of the symptoms right now. Being aware that kind of chronic indigestion, lower back pain that won’t go away, these are signs and symptoms. And especially things like jaundice ...
Dr. Whyte: That yellow color that they might see.
Dr. Matrisian: Yes, that yellow colors in your eye, that’s a really important symptom that would certainly send people to the doctor in order to look at this. So some of it is being more aware and finding the disease earlier. But what we’re really hoping for is some sort of blood test or some sort of other way of looking through medical records and identifying those people that need to go and be checked.
Dr. Whyte: Now we chatted about that almost two years ago. So tell me the progress that we’ve made. How are we doing?
Dr. Matrisian: Yeah, well there’s a number of companies now that have blood tests that are available. They still need more work. They still need more studies to really understand how good they are at finding pancreatic cancer early. But we didn’t have them a couple of years ago. And so it’s really a very exciting time in the field, that there’s companies that were taking advantage of research for many years and actually turning it into a commercial product that is available for people to check.
Dr. Whyte: And then what about treatments? More treatment options today than there were just a few years ago, but still a lot of progress to be made. So when we talk about even 12% 5-year survival, we’d love to see it much more. And you talk about, I don’t want to misquote, so correct me if I’m wrong. Your goal is 20%. Five-year survival by 2030. That’s not too far. So, Lynn, how are we going to get there?
Dr. Matrisian: Okay, well this is our mission. And that’s exactly our goal, 20% by 2030. So we’ve got some work to do. And we are working at both fronts. You’re right, we need better treatments. And so we’ve set up a clinical trial platform where we can look at a lot of different treatments much more efficiently, much faster, kind of taking advantage of an infrastructure to do that. And that’s called Precision Promise. And we’re excited about that as a way to get new treatments for advanced pancreatic cancer.
And then we’re also working on the early detection end. We think an important symptom of pancreatic cancer that isn’t often recognized is new onset diabetes, sudden diabetes in those over 50 where that person did not have diabetes before. So it’s new, looks like type 2 diabetes, but it’s actually caused by pancreatic cancer.
And so we have an initiative, The Early Detection Initiative, that is taking advantage of that. And seeing if we image people right away based on that symptom, can we find pancreatic cancer early? So we think it’s important to look both at trying to diagnose it earlier, as well as trying to treat it better for advanced disease.
Dr. Whyte: Yeah. You know, at WebMD we’re always trying to empower people with better information so they can also become advocates for their health. You’re an expert in advocacy on pancreatic cancer. So what’s your advice to listeners as to how they become good advocates for themselves or advocates in general for loved ones who have pancreatic cancer?
Dr. Matrisian: Yeah. Yeah. Well certainly, knowledge is power. And so the real thing to do is to call the Pancreatic Cancer Action Network. This is what we do. We stay up on the most current information. We have very experienced case managers who can help navigate the complexities of pancreatic cancer at every stage of the journey.
Or if you have questions about pancreatic cancer, call PanCAN. Go to PanCAN.org and give us a call. Because it’s really that knowledge, knowing what it is that you need to get more knowledge about, how to advocate for yourself is very important in a disease, in any disease, but in particular a disease like pancreatic cancer.
Dr. Whyte: And I don’t want to dismiss the progress that we’ve made, that you’ve just referenced in terms of the increased survival. But there’s still a long way to go. We need a lot more dollars for research. We need a lot more clinical trials to take place. What’s your message to a viewer who’s been diagnosed with pancreatic cancer or a loved one? What’s your message, Lynn, today for them?
Dr. Matrisian: Well, first, get as much knowledge as you can. Call PanCAN, and let us help you help your loved one. But then help us. Let’s do research. Let’s do more research. Let’s understand this disease better so we can make those kinds of progress in both treatment and early detection.
And PanCAN works very hard at understanding the disease and setting up research programs that are going to make a difference, that are going to get us to that aggressive goal of 20% survival by 2030. So there is a lot of things that can be done, raise awareness to your friends and neighbors about the disease, lots of things that will help this whole field.
Dr. Whyte: What’s your feeling on second opinions? Given that this can be a difficult cancer to treat, given that there’s emerging therapies that are always developing, when you have a diagnosis of pancreatic cancer, is it important to consider getting a second opinion?
Dr. Matrisian: Yes. Yes, it is. And our case managers will help with that process. We do think it’s important.
Dr. Whyte: Because sometimes, Lynn, people just want to get started, right? Get it out of me. Get treatment. And sometimes getting a second opinion, doing some genomic testing can take time. So what’s your response to that?
Dr. Matrisian: Yeah. Yeah. Well we say, your care team is very important. Who is on your care team, and it may take a little time to find the right people on your care team. But that is an incredibly important step. Sometimes it’s not just one person. Sometimes you need more than one doctor, more than one nurse, more than one type of specialty to help you deal with this. And taking the time to do that is incredibly important.
Yes, you need to – you do need to act. But act smart. And do it with knowledge. Do it really understanding what your options are, and advocate for yourself.
Dr. Whyte: And surround yourself as you reference with that right care team for you, because that’s the most important thing when you have any type of cancer diagnosis. Dr. Lynn Matrisian, I want to thank you for taking time today.
Dr. Matrisian: Thank you so much, John.
A version of this article first appeared on Medscape.com.
‘Forever chemicals’ up type 2 diabetes risk in midlife White women
Middle-aged White women who had higher levels of some breakdown products of phthalates – a class of endocrine disrupting chemicals (EDCs), or “forever chemicals,” that act as plasticizers – had a significantly greater risk of developing type 2 diabetes over a 6-year period compared with other similar women.
However, this association was not seen among Black or Asian middle-aged women.
These findings from the Study of Women’s Health Across the Nation – Multipollutant Study (SWAN-MPS), by Mia Q. Peng, PhD, MPH, and colleagues, have been published online in the Journal of Clinical Endocrinology & Metabolism.
“Overall, our study has added some evidence to support the potential diabetogenic effects of phthalates, but it also highlights that much is still unknown about the metabolic effects of these chemicals,” the group noted.
“The apparent racial/ethnic differences in the associations between phthalates and incident diabetes should be investigated in future studies,” they cautioned.
Recruiting younger participants and observing them longer, they suggested, “will also help us understand the effects of phthalates on different stages of the diabetogenic process, including whether body fat gain is an important mediator.”
Phthalates are all around us
Low-molecular-weight phthalates are frequently added to personal care products, such as fragrance, nail polish, and some feminine hygiene products, as solvents, plasticizers, and fixatives, the researchers explained.
And high-molecular-weight phthalates are frequently added to polyvinyl chloride plastic products, such as plastic food packaging, clothing, and vinyl flooring, as plasticizers.
Phthalates have been hypothesized to contribute to the development of diabetes, but longitudinal evidence in humans was limited.
“Given widespread exposure to phthalates and the enormous costs of diabetes to individuals and societies, ongoing investments in the research on phthalates’ metabolic effects are warranted,” the researchers concluded.
Racial differences in phthalates and incident diabetes
“A new finding is that we observed some phthalates are associated with a higher risk of diabetes development, especially in White women [that] were not seen in Black or Asian women,” senior author Sung Kyun Park, ScD, MPH, of the University of Michigan, Ann Arbor, told this news organization.
“We were surprised to see the racial/ethnic differences,” added Dr. Peng, formerly of the University of Michigan and now at Lifecourse Epidemiology of Adiposity and Diabetes Center, University of Colorado Anschutz Medical Campus.
A possible explanation is that “compared to White women, Black women develop diabetes at a younger age and are exposed to higher levels of several phthalates,” and this study excluded women who already had diabetes by midlife, she noted.
“Although our study was conducted in a cohort of women,” Dr. Park stressed, “we hope that our findings are not interpreted that only women should be concerned of phthalates. Our findings add to the current literature that phthalates may be a potential risk factor for type 2 diabetes.
“Certain phthalates are prohibited in children’s toys and child care articles,” Dr. Peng noted, as explained by the U.S. Consumer Product Safety Commission. In addition, a bill has been introduced in Congress to ban phthalates in food contact substances.
“If phthalates are removed from plastics and other consumer products,” she cautioned, “we do have to be careful in the process to avoid replacing them with some other potentially harmful chemicals.”
A well-known example of this type of “regrettable substitution,” Dr. Park added, “is ‘BPA-free’ plastics that replaced bisphenol A with other bisphenols such as bisphenol-F (BPF) or bisphenol-S (BPS). The product has a label of ‘BPA-free’, but those replaced chemicals turned out to be equally toxic. Science is slow to determine if a new chemical introduced to the market is safe and can replace a regulated chemical.”
And studies have shown that a diet rich in meat, fat, and ultraprocessed foods is associated with increased exposures to some phthalates, especially when the foods are obtained away from home, such as fast foods, Dr. Peng observed. In addition, some phthalates are added to personal care products such as fragrance.
“As a first step,” she said, “I think reducing consumption of ultraprocessed foods packaged in plastics may help reduce phthalate exposure.”
A 2020 report from the Endocrine Society and the International Pollutants Elimination Network (IPEN), titled, “Plastics, EDCs, and Health,” summarizes research on bisphenol A, per- and polyfluoroalkyl substances (PFAS), phthalates, and other EDCs that leach from plastics. The Endocrine Society website also has a link to a 2-page summary.
Levels of 12 phthalate metabolites
Previously, the researchers reported how another class of “forever chemicals,” PFAS, were associated with risk of hypertension in a 17-year follow-up of middle-aged women in the SWAN study.
In the current study, they analyzed data from 1,308 women in SWAN-MPS who had been recruited at five study sites (Oakland, Calif; Los Angeles; Detroit; Pittsburgh; and Boston).
The women were between ages 42 and 52 years in 1996-1997 and self-identified as White, Black, Chinese, or Japanese.
They did not have diabetes in 1999-2000 and had sufficient urine samples for phthalate assessment then and midway through a 6-year follow-up.
The women were a median age of 49 years in 1999-2000. About half were White, 20% were Black, 13% were Chinese, and 15% were Japanese.
Researchers analyzed levels of 12 metabolites, chosen because their parent phthalates have been widely used in industry and commerce, and exposure to these phthalates is a national biomonitoring priority.
The measured phthalates were:
Three metabolites of low-molecular-weight phthalates:
- mono-ethyl phthalate (MEP)
- mono-n-butyl phthalate (MnBP)
- mono-isobutyl phthalate (MiBP)
Four metabolites of the high-molecular-weight phthalate di(2-ethylhexyl) phthalate (DEHP), which is of particular public health interest:
- mono(2-ethylhexyl) phthalate (MEHP)
- mono(2-ethyl-5-hydroxyhexyl) phthalate (MEHHP)
- mono(2-ethyl-5-oxohexyl) phthalate (MEOHP)
- mono(2-ethyl-5-carboxypentyl) phthalate (MECPP)
Five metabolites of other high-molecular-weight phthalates:
- monobenzyl phthalate (MBzP)
- monoisononyl phthalate (MiNP)
- mono-carboxyoctyl phthalate (MCOP)
- mono-carboxy-isononyl phthalate (MCNP)
- mono(3-carboxypropyl) phthalate (MCPP)
The researchers excluded MiNP from all analyses because it was detected in less than 1% of urine samples.
The different phthalate metabolites were detected in 84.8% of samples (MEHP) to 100% of samples (MnBP and MECPP).
Women who were younger, Black, current smokers, or obese generally had higher concentrations of phthalate metabolites.
Over 6 years, 61 women developed diabetes (an incidence rate of 8.1 per 1000 person-years).
Compared with other women, those with incident diabetes had significantly higher concentrations of all phthalate metabolites except DEHP metabolites and MCPP.
Phthalates were not associated with incident diabetes in Black or Asian women.
However, among White women, each doubling of the concentrations of MiBP, MBzP, MCOP, MCNP, and MCCP was associated with a 30% to 63% higher incidence of diabetes (HR 1.30 for MCNP; HR 1.63 for MiBP).
The SWAN study was supported by the National Institutes of Health, Department of Health & Human Services, National Institute on Aging, National Institute of Nursing Research, NIH Office of Research on Women’s Health, and SWAN Repository. The current study was supported by the National Center for Research Resources, National Center for Advancing Translational Sciences, NIH, National Institute of Environmental Health, and Centers for Disease Control and Prevention/National Institute for Occupational Safety and Health. Dr. Peng was supported by an Interdisciplinary Research Training on Health and Aging grant from the NIA. The authors have reported no relevant financial relationships.
A version of this article first appeared on Medscape.com.
Muscle-Related Adverse Events Associated With PCSK9 Inhibitors in a Veteran Population
HMG-CoA reductase inhibitors (statins) have been shown to effectively reduce low-density lipoprotein cholesterol (LDL-C) as well as morbidity and mortality in patients who have either atherosclerotic cardiovascular disease (ASCVD) or risk factors for ASCVD.1-12 However, research shows that up to 20% of patients are unable to tolerate statin therapy due to muscle-related adverse events (AEs).13 This presents a substantial clinical challenge, as current management strategies for patients with statin-associated muscle symptoms, such as intermittent administration of statins and ezetimibe, seldom achieve the > 50% LDL-C reduction recommended by the 2018 American Heart Association/American College of Cardiology Clinical Practice Guidelines.14 Additionally, statin-intolerant patients who have antihyperlipidemic medication lowered or discontinued are at an increased risk of future cardiovascular events.15 Observational data also show that about 70% of adult patients (primarily with genetic lipid disorders such as heterozygous familial hypercholesterolemia) do not achieve an LDL-C level < 100 mg/dL despite treatment with maximum doses of statins with or without ezetimibe.16,17
PCSK9 inhibitors (PCSK9i) have robust efficacy data to support use in patients who do not meet their LDL-C goal despite maximally tolerated lipid therapy.14 However, long-term safety data for PCSK9i are not as robust as its efficacy data. Specifically, safety data relating to muscle-related AEs, which are the most widely recognized AE associated with statins, have only been reported in a few clinical trials with varying incidence rates, levels of significance, and relatively small study populations. Furthermore, the real-world prevalence of muscle-related PCSK9i AEs is unknown. Clinical guidance for management strategies for muscle-related AEs associated with PCSK9i is largely lacking. For this study, muscle-related AEs were defined as any new or unusual muscle soreness, weakness, cramping, aches, and stiffness that persists, is generally bilateral, and typically affects the large muscles. It is important to note, that muscle-related AEs associated with statins, ezetimibe, and PCSK9i can be attributed to the nocebo effect.
According to the prescribing information for alirocumab and evolocumab, myalgia, muscle spasms, and musculoskeletal pain each occurred in < 5% of the study populations.18,19 From these data, muscle-related PCSK9i AEs are thought to be relatively rare, based on the ODYSSEY-OUTCOME and FOURIER trials, which did not enroll statin-intolerant patients.20,21 However, currently available safety data from 3 small, randomized clinical trials specifically in statin-intolerant patients taking a PCSK9i suggest that muscle-related AEs occur at a rate of 12.2% to 32.5% and discontinuation rates varied from 0% to 15.9%.22-25 As the incidence rates of muscle-related AEs in the prescribing information and clinical trials varied widely, this study will provide quantitative data on the percentage of patients that developed muscle-related PCSK9i AEs in a veteran population to help shed light on a topic that is not well studied.
Methods
This was a single-center, retrospective chart review of patients prescribed a PCSK9i between December 1, 2017, and September 1, 2021, and were managed in a pharmacy-led patient aligned care team (PACT) clinic at the Wilkes-Barre US Department of Veterans Affairs (VA) Medical Center (WBVAMC) in Pennsylvania. This study was approved by the Coatesville VA Medical Center Institutional Review Board, which oversees research conducted at WBVAMC. Veterans aged ≥ 18 years were included in the study. Patients were excluded if they had a history of serious hypersensitivity reaction to a PCSK9i or rhabdomyolysis or did not meet the VA criteria for use.26
The primary outcome was the percentage of patients who developed a muscle-related AE while on a PCSK9i in a PACT clinic. Data were further analyzed based on patients who (1) tolerated a full PCSK9i dose; (2) tolerated alternative PCSK9i following initial intolerance; (3) required a PCSK9i dose reduction, or (4) discontinued PCSK9i. A secondary outcome was the percentage of statin- and/or ezetimibe-intolerant patients in these 4 groups. Another secondary outcome was the management strategies taken for patients who were on a reduced (monthly) dose of PCSK9i who did not reach their LDL-C goal. Management strategies that were assessed included restarting weekly statin, restarting weekly ezetimibe, increasing the dose of the same PCSK9i administered monthly, and switching to an alternative PCSK9i.
Data were collected using the VA Computerized Patient Record System (CPRS) and stored in a secure, locked spreadsheet. Baseline patient demographic characteristics collected included age (at PCSK9i start); sex; race; and PCSK9i name, dose, and frequency. We recorded when a patient switched PCSK9i, whether or not it was due to a muscle-related AE, and the name of the original PCSK9i. Also collected were lipid therapy intolerances prior to PCSK9i initiation (ie, intolerance to statin, ezetimibe, or both).
Patients were considered statin intolerant due to a muscle-related AE in accordance with the VA PCSK9i Criteria for Use, which requires trial of at least 3 statins, one of which was trialed at the lowest dosage approved by the US Food and Drug Administration (FDA) and resulted in intolerable skeletal muscle AEs that worsened during treatment and resolved when the statin was stopped. For our study purposes, patients taking alternative day dosing of statins due to muscle-related AEs (ie, 2- or 3-times weekly dosing) were not considered statin intolerant; however, patients taking once-weekly statin dosing were considered statin intolerant. Patients were considered ezetimibe intolerant due to a muscle-related AE if the intolerance was due to skeletal muscle concerns that worsened during treatment and resolved when ezetimibe was stopped. Patients were considered PCSK9i intolerant due to a muscle-related AE if the intolerance was due to skeletal muscle concerns that worsened during treatment and resolved when the PCSK9i was stopped. Patients with non–muscle-related intolerances to statins, ezetimibe, and PCSK9i were not considered statin, ezetimibe, and PCSK9i intolerant.
Alirocumab was initiated at 75 mg subcutaneous (SQ) once every 2 weeks or evolocumab 140 mg SQ once every 2 weeks in our study. The protocol allowed for a dose reduction of alirocumab 75 mg SQ once monthly if a patient experienced AEs, but this dose reduction strategy was not used for any patients on evolocumab in this study. Of note, alirocumab 75 mg SQ once monthly is not an FDA-approved dosing strategy. However, it is similar in concept to the alternative statin dosing (ie, alternate day dosing, once-weekly dosing) and may avoid the need to discontinue PCSK9i therapy altogether.
A review of the CPRS also documented whether a muscle-related AE occurred while the patient was on a PCSK9i (if yes, the specific AE was recorded), the result of PCSK9i therapy (tolerated full dose, required a dose reduction, switched medication, or discontinued), and management strategies taken for patients who did not meet their LDL-C goal while on a reduced (monthly) PCSK9i dose. Prior lipid therapy intolerances, PCSK9i-related AEs, results of PCSK9i therapy, and management strategies for patients who did not meet LDL-C goal while on a reduced PCSK9i dose were obtained by reviewing the PACT pharmacist’s clinic notes and assessment, along with clinic notes and medication history listed within the CPRS.
Statistical Analysis
Descriptive statistics were used for the demographic characteristics of study patients. The primary outcome was calculated as a binary measure (yes/no) of whether the patient developed a muscle-related AE while on a PCSK9i. The secondary outcome of statin, ezetimibe, or statin and ezetimibe intolerances in subgroups also was calculated as a binary measure.
Results
For the study, 156 charts were reviewed and 137 patients were included (Figure). 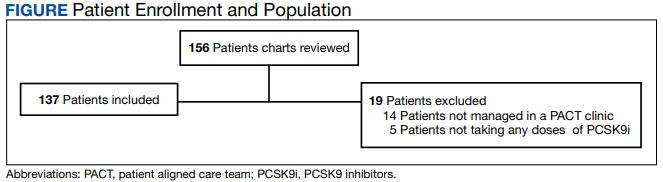
For the secondary results, 4 patients (2.9%) tolerated an alternate PCSK9i (evolocumab 140 mg SQ every 2 weeks) after initial intolerance to PCSK9i, 16 (11.7%) required a dose reduction, and 6 (4.4%) discontinued PCSK9i due to a muscle-related AE.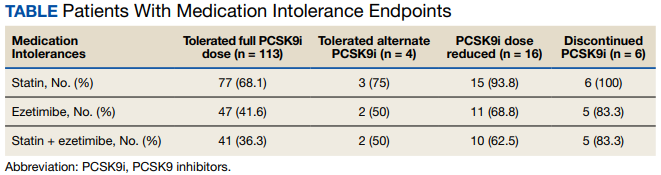
Statin intolerance was most common in all groups, followed by ezetimibe intolerance, and intolerance to statins + ezetimibe. Of the 113 patients who tolerated a full dose of PCSK9i, 77 (68.1%) had intolerance to statin, 47 (41.6%) to ezetimibe, and 41 (36.3%) to both statins and ezetimibe. Of the 6 patients who discontinued PCSK9i, all had intolerance to statins, 5 (83.3%) to ezetimibe, and 5 (83.3%) to statins and ezetimibe.
For patients who were on a reduced (monthly) dose of a PCSK9i who did not reach their LDL-C goal, we found that 16 patients (11.7%) required a PCSK9i dose reduction following muscle-related AEs. Of the patients who had their dose of PCSK9i reduced to monthly dosing, 5 (31%) met their LDL-C goal. For the 11 patients who did not meet their LDL-C goal, different management strategies were taken. Lifestyle modifications were made in 6 patients (54%), the monthly PCSK9i dose was increased to alirocumab 150 mg SQ monthly in 4 patients (36%), and 1 patient (9.1%) was switched to an alternative PCSK9i. There were no identified muscle-related AEs recorded in patients whose dose was increased to alirocumab 150 mg SQ monthly.
Discussion
This retrospective study found 17.5% of patients experienced muscle-related PCSK9i AEs. These occurred at a higher rate than reported in the prescribing information (< 5%) and were similar to the incidence rates reported in the GAUSS-2, GAUSS-3, and ODYSSEY-ALTERNATIVE clinical trials (12.0%-32.5%), which is what we hypothesized.18,19,22-25 It is important to note that the incidence rates of muscle-related AEs reported in the prescribing information for alirocumab and evolocumab were based on trials that did not include statin- and/or ezetimibe-intolerant patients; whereas many patients in our study and patients in the clinical trials were statin and/or ezetimibe intolerant.
Additionally, a new study by Donald and colleagues found an incidence rate of 32% to 36% for muscle-related PCSK9i AEs.27 Collectively, the data from clinical trials and our study indicate that patients with prior intolerances to statin and/or ezetimibe appear to have a higher likelihood of developing a muscle-related PCSK9i intolerance. In our study, 23 of 24 patients who developed a muscle-related PCSK9i AE had a prior history of statin and/or ezetimibe intolerances. This should alert clinicians prescribing PCSK9i in patients with a history of statin and/or ezetimibe intolerance to counsel their patients on the possibility of muscle-related PCSK9i AEs and management strategies. However, it is important to note that there was a substantial number of patients in our study who were statin and/or ezetimibe intolerant due to a prior muscle-related AE who tolerated the full dose of PCSK9i.
To our knowledge, this was the first trial to evaluate muscle-related PCSK9i AEs in a veteran population. Additionally, our study appears to be the first to use 2 PCSK9i dosing strategies that are not FDA approved: Dose reduction for patients who experienced a muscle-related AE on alirocumab 75 mg SQ every 2 weeks and dose escalation for patients who did not meet their LDL-C goal on alirocumab 75 mg SQ monthly following an initial intolerance to 2-week dosing. The dose-reduction strategy allowed patients who experienced a muscle-related AE to alirocumab 75 mg to reduce administration from every 2 weeks to monthly.
This strategy was only performed with alirocumab, the preferred PCSK9i at WBVAMC, but the same dose-reduction strategy can theoretically be used with evolocumab as well. Reduced monthly dosing of alirocumab allowed patients with a prior intolerance to remain on a lower dosage without discontinuation. This is important because as noted by Myers and colleagues, individuals without access to PCSK9i were found to have a significantly higher incidence ratio of cardiovascular events compared with those taking PCSK9i.15 Also of note, > 30% of patients on the reduced monthly dose of alirocumab still met their LDL-C goal. Therefore, using this dose-reduction strategy (instead of patients discontinuing therapy altogether due to a muscle-related intolerance) can lessen the risk of major adverse cardiovascular events (MACE) as well as mitigate muscle-related AEs that occurred while on 2-week PCSK9i dosing regimens. While we acknowledge that this reduced monthly dose of either alirocumab or evolocumab is not FDA approved, it is similar to alternative statin dosing that also is not FDA approved but may minimize the need to discontinue PCSK9i therapy. It would be beneficial if these dosing strategies were investigated by future research.
The dose-escalation strategy for patients who did not meet their LDL-C goal while on the reduced, monthly dose of alirocumab also was unique. Alirocumab was increased from 75 mg SQ once monthly to 150 mg SQ once monthly. Interestingly, we found that through the end of the chart review period, all patients tolerated the increase well, despite having an initial muscle-related AE to alirocumab 75 mg every 2 weeks, which is the same total monthly dosage. This approach is similar to that of once-weekly statin dosing or a drug holiday and may be explained by the long half-life of PCSK9i. Regardless of the mechanism, this finding suggests that an increased monthly dose of PCSK9i is a potential alternative for patients who cannot tolerate the FDA-approved dose. However, the ability for patients to achieve goal LDL-C on the monthly dosage requires future study.
In our study, only 6 patients (4.4%) discontinued PCSK9i therapy. This low discontinuation rate is largely attributable to our unique study design, which allowed for a dose reduction in patients who experienced muscle-related AEs. The earlier ODYSSEY-ALTERNATIVE trial evaluated the safety and efficacy of alirocumab compared with ezetimibe in confirmed statin-intolerant subjects after 24 weeks. This trial did not use a dose-reduction strategy and found 15.9% of patients discontinued alirocumab due to a muscle-related AE.24 This is notably higher than our discontinuation rate of 4.4%. If patients with a muscle-related AE discontinued PCKS9i instead of reducing the dose, they would likely return to their baseline LDL-C, which would increase the risk of MACE.
In general, myalgias due to antihyperlipidemic medications are not completely understood. One possible mechanism for statin-induced myalgias is the depletion of ubiquinone. However, this theory cannot explain muscle-related AEs associated with PCSK9i or ezetimibe, which have not been shown to deplete ubiquinone. We also found that the onset of muscle-related AEs associated with PCSK9i tends to appear later in therapy than what we know about statin therapy. Our study showed that the onset of a muscle-related PCSK9i AEs occurred a mean (SD) 8 (5.3) months after initiation (range, 1-19). Statin muscle-related AEs typically occur within the initial 4 to 8 weeks of treatment, although they can occur at any time.28
Limitations
The results of this study should be considered with the following limitations. First, this was a retrospective chart review performed over a prespecified period. Any muscle-related AEs or LDL-C lowering effects from PCSK9i that occurred outside the review period were not captured. Our study was small and only included 137 patients, though it was similar in size to the GAUSS-2, GAUSS-3, and ODYSSEY-ALTERNATIVE trials.22-24 Additionally, the study was primarily composed of White men and may not be representative of other populations. Some muscle-related PCSK9i AEs may be attributed to the nocebo. Last, our study did not capture patients on a PCSK9i who were not followed in the PACT clinic.
Conclusions
We found that muscle-related PCSK9i AEs occurred at a similar rate as those reported in previous clinical trials and exceeded the incidence rate reported in the prescribing information for alirocumab and evolocumab. It appears that patients who have a prior muscle-related intolerance to a statin and/or ezetimibe had a higher likelihood of developing a muscle-related PCSK9i AE. In our study, only 1 patient developed a muscle-related PCSK9i AE who did not have a prior history of muscle-related intolerance to either a statin or ezetimibe. However, in our study, a substantial percentage of patients with statin and/or ezetimibe intolerances tolerated the full PCSK9i dose well, proving that PCSK9i are still a reasonable alternative for patients with prior intolerances to statins and/or ezetimibe.
Acknowledgments
This material is the result of work supported with resources and the use of facilities at the US Department of Veterans Affairs Medical Center, Wilkes-Barre, Pennsylvania.
1. Randomised trial of cholesterol lowering in 4444 patients with coronary heart disease: the Scandinavian Simvastatin Survival Study (4S). Lancet. 1994;344(8934):1383-1389.
2. Sacks FM, Pfeffer MA, Moye LA, et al. The effect of pravastatin on coronary events after myocardial infarction in patients with average cholesterol levels. Cholesterol and Recurrent Events Trial investigators. N Engl J Med. 1996;335(14):1001-1009. doi:10.1056/NEJM199610033351401
3. Long-Term Intervention with Pravastatin in Ischaemic Disease (LIPID) Study Group. Prevention of cardiovascular events and death with pravastatin in patients with coronary heart disease and a broad range of initial cholesterol levels. N Engl J Med. 1998;339(19):1349-1357. doi:10.1056/NEJM199811053391902.
4. Heart Protection Study Collaborative Group. MRC/BHF Heart Protection Study of cholesterol lowering with simvastatin in 20,536 high-risk individuals: a randomised placebo-controlled trial. Lancet. 2002;360(9326):7-22. doi:10.1016/S0140-6736(02)09327-3
5. Koren MJ, Hunninghake DB; ALLIANCE Investigators. Clinical outcomes in managed-care patients with coronary heart disease treated aggressively in lipid-lowering disease management clinics: the alliance study. J Am Coll Cardiol. 2004;44(9):1772-1779. doi:10.1016/j.jacc.2004.07.053
6. Downs JR, Clearfield M, Weis S, et al. Primary prevention of acute coronary events with lovastatin in men and women with average cholesterol levels: results of AFCAPS/TexCAPS. Air Force/Texas Coronary Atherosclerosis Prevention Study. JAMA. 1998;279(20):1615-1622. doi:10.1001/jama.279.20.1615
7. ALLHAT Officers and Coordinators for the ALLHAT Collaborative Research Group. The Antihypertensive and Lipid-Lowering Treatment to Prevent Heart Attack Trial. Major outcomes in moderately hypercholesterolemic, hypertensive patients randomized to pravastatin vs usual care: The Antihypertensive and Lipid-Lowering Treatment to Prevent Heart Attack Trial (ALLHAT-LLT). JAMA. 2002;288(23):2998-3007. doi:10.1001/jama.288.23.2998
8. Sever PS, Dahlöf B, Poulter NR, et al. Prevention of coronary and stroke events with atorvastatin in hypertensive patients who have average or lower-than-average cholesterol concentrations, in the Anglo-Scandinavian Cardiac Outcomes Trial-Lipid Lowering Arm (ASCOT-LLA): a multicentre randomised controlled trial. Lancet. 2003;361(9364):1149-1158. doi:10.1016/S0140-6736(03)12948-0
9. Ridker PM, Danielson E, Fonseca FA, et al. Rosuvastatin to prevent vascular events in men and women with elevated C-reactive protein. N Engl J Med. 2008;359(21):2195-2207. doi:10.1056/NEJMoa0807646
10. Nakamura H, Arakawa K, Itakura H, et al. Primary prevention of cardiovascular disease with pravastatin in Japan (MEGA Study): a prospective randomised controlled trial. Lancet. 2006;368(9542):1155-1163. doi:10.1016/S0140-6736(06)69472-5
11. Shepherd J, Blauw GJ, Murphy MB, et al. Pravastatin in elderly individuals at risk of vascular disease (PROSPER): a randomised controlled trial. Lancet. 2002;360(9346):1623-1630. doi:10.1016/s0140-6736(02)11600-x
12. Shepherd J, Cobbe SM, Ford I, et al. Prevention of coronary heart disease with pravastatin in men with hypercholesterolemia. West of Scotland Coronary Prevention Study Group. N Engl J Med. 1995;333(20):1301-1307. doi:10.1056/NEJM199511163332001

13. Stroes ES, Thompson PD, Corsini A, et al. Statin-associated muscle symptoms: impact on statin therapy-European Atherosclerosis Society Consensus Panel Statement on Assessment, Aetiology and Management. Eur Heart J. 2015;36(17):1012-1022. doi:10.1093/eurheartj/ehv043
14. Grundy SM, Stone NJ, Bailey AL, et al. AHA/ACC/AACVPR/AAPA/ABC/ACPM/ADA/AGS/APhA/ASPC/NLA/PCNA Guideline on the Management of Blood Cholesterol: A Report of the American College of Cardiology/American Heart Association Task Force on Clinical Practice Guidelines. J Am Coll Cardiol. 2019;73(24) e285-350. doi:10.1016/j.jacc.2018.11003
15. Myers KD, Farboodi N, Mwamburi M, et al. Effect of access to prescribed PCSK9 inhibitors on cardiovascular outcomes. Circ Cardiovasc Qual Outcomes. 2019;12(8):e005404. doi:10.1161/CIRCOUTCOMES.118.005404
16. Wong ND, Chuang J, Zhao Y, Rosenblit PD. Residual dyslipidemia according to low-density lipoprotein cholesterol, non-high-density lipoprotein cholesterol, and apolipoprotein B among statin-treated US adults: National Health and Nutrition Examination Survey 2009-2010. J Clin Lipidol. 2015;9(4):525-532. doi:10.1016/j.jacl.2015.05.003
17. Della Badia LA, Elshourbagy NA, Mousa SA. Targeting PCSK9 as a promising new mechanism for lowering low-density lipoprotein cholesterol. Pharmacol Ther. 2016;164:183-194. doi:10.1016/j.pharmthera.2016.04.011
18. Praluent (alirocumab) injection. Prescribing information. Regeneron Pharmaceuticals; 2021.
19. Repatha (evolocumab) injection. Prescribing information. Amgen; 2021.
20. Schwartz GG, Steg PG, Szarek M, et al. Alirocumab and cardiovascular outcomes after acute coronary syndrome. N Engl J Med. 2018;379(22):2097-2107. doi:10.1056/NEJMoa1801174
21. Sabatine MS, Giugliano RP, Keech AC, et al. Evolocumab and clinical outcomes in patients with cardiovascular disease. N Engl J Med. 2017;376(18):1713-1722. doi:10.1056/NEJMoa1615664
22. Stroes E, Colquhoun D, Sullivan D, et al. Anti-PCSK9 antibody effectively lowers cholesterol in patients with statin intolerance: the GAUSS-2 randomized, placebo-controlled phase 3 clinical trial of evolocumab. J Am Coll Cardiol. 2014;63(23):2541-2548. doi:10.1016/j.jacc.2014.03.019
23. Nissen SE, Stroes E, Dent-Acosta RE, et al. Efficacy and tolerability of evolocumab vs ezetimibe in patients with muscle-related statin intolerance: the GAUSS-3 randomized clinical trial. JAMA. 2016;315(15):1580-1590. doi:10.1001/jama.2016.3608
24. Moriarty PM, Thompson PD, Cannon CP, et al. Efficacy and safety of alirocumab vs ezetimibe in statin-intolerant patients, with a statin rechallenge arm: the ODYSSEY ALTERNATIVE randomized trial. J Clin Lipidol. 2015;9(6):758-769. doi:10.1016/j.jacl.2015.08.006
25. Mesi O, Lin C, Ahmed H, Cho LS. Statin intolerance and new lipid-lowering treatments. Cleve Clin J Med. 2021;88(7):381-387. Published 2021 Jul 1. doi:10.3949/ccjm.88a.20165
26. US Department of Veterans Affairs. Clinical Guidance - Criteria For Use. September 2016. Accessed January 23, 2023. https://www.pbm.va.gov/clinicalguidance/criteriaforuse.asp
27. Donald DR, Reynolds VW, Hall N, DeClercq J, Choi L. Exploring rates of PCSK9 inhibitor persistence and reasons for treatment non-persistence in an integrated specialty pharmacy model. J Clin Lipidol. 2022;16(3):315-324. doi:10.1016/j.jacl.2022.03.004
28. Warden BA, Guyton JR, Kovacs AC, et al. Assessment and management of statin-associated muscle symptoms: A clinical perspective from the National Lipid Association. J Clin Lipidol. Published online September 10, 2022. doi:10.1016/j.jacl.2022.09.001
HMG-CoA reductase inhibitors (statins) have been shown to effectively reduce low-density lipoprotein cholesterol (LDL-C) as well as morbidity and mortality in patients who have either atherosclerotic cardiovascular disease (ASCVD) or risk factors for ASCVD.1-12 However, research shows that up to 20% of patients are unable to tolerate statin therapy due to muscle-related adverse events (AEs).13 This presents a substantial clinical challenge, as current management strategies for patients with statin-associated muscle symptoms, such as intermittent administration of statins and ezetimibe, seldom achieve the > 50% LDL-C reduction recommended by the 2018 American Heart Association/American College of Cardiology Clinical Practice Guidelines.14 Additionally, statin-intolerant patients who have antihyperlipidemic medication lowered or discontinued are at an increased risk of future cardiovascular events.15 Observational data also show that about 70% of adult patients (primarily with genetic lipid disorders such as heterozygous familial hypercholesterolemia) do not achieve an LDL-C level < 100 mg/dL despite treatment with maximum doses of statins with or without ezetimibe.16,17
PCSK9 inhibitors (PCSK9i) have robust efficacy data to support use in patients who do not meet their LDL-C goal despite maximally tolerated lipid therapy.14 However, long-term safety data for PCSK9i are not as robust as its efficacy data. Specifically, safety data relating to muscle-related AEs, which are the most widely recognized AE associated with statins, have only been reported in a few clinical trials with varying incidence rates, levels of significance, and relatively small study populations. Furthermore, the real-world prevalence of muscle-related PCSK9i AEs is unknown. Clinical guidance for management strategies for muscle-related AEs associated with PCSK9i is largely lacking. For this study, muscle-related AEs were defined as any new or unusual muscle soreness, weakness, cramping, aches, and stiffness that persists, is generally bilateral, and typically affects the large muscles. It is important to note, that muscle-related AEs associated with statins, ezetimibe, and PCSK9i can be attributed to the nocebo effect.
According to the prescribing information for alirocumab and evolocumab, myalgia, muscle spasms, and musculoskeletal pain each occurred in < 5% of the study populations.18,19 From these data, muscle-related PCSK9i AEs are thought to be relatively rare, based on the ODYSSEY-OUTCOME and FOURIER trials, which did not enroll statin-intolerant patients.20,21 However, currently available safety data from 3 small, randomized clinical trials specifically in statin-intolerant patients taking a PCSK9i suggest that muscle-related AEs occur at a rate of 12.2% to 32.5% and discontinuation rates varied from 0% to 15.9%.22-25 As the incidence rates of muscle-related AEs in the prescribing information and clinical trials varied widely, this study will provide quantitative data on the percentage of patients that developed muscle-related PCSK9i AEs in a veteran population to help shed light on a topic that is not well studied.
Methods
This was a single-center, retrospective chart review of patients prescribed a PCSK9i between December 1, 2017, and September 1, 2021, and were managed in a pharmacy-led patient aligned care team (PACT) clinic at the Wilkes-Barre US Department of Veterans Affairs (VA) Medical Center (WBVAMC) in Pennsylvania. This study was approved by the Coatesville VA Medical Center Institutional Review Board, which oversees research conducted at WBVAMC. Veterans aged ≥ 18 years were included in the study. Patients were excluded if they had a history of serious hypersensitivity reaction to a PCSK9i or rhabdomyolysis or did not meet the VA criteria for use.26
The primary outcome was the percentage of patients who developed a muscle-related AE while on a PCSK9i in a PACT clinic. Data were further analyzed based on patients who (1) tolerated a full PCSK9i dose; (2) tolerated alternative PCSK9i following initial intolerance; (3) required a PCSK9i dose reduction, or (4) discontinued PCSK9i. A secondary outcome was the percentage of statin- and/or ezetimibe-intolerant patients in these 4 groups. Another secondary outcome was the management strategies taken for patients who were on a reduced (monthly) dose of PCSK9i who did not reach their LDL-C goal. Management strategies that were assessed included restarting weekly statin, restarting weekly ezetimibe, increasing the dose of the same PCSK9i administered monthly, and switching to an alternative PCSK9i.
Data were collected using the VA Computerized Patient Record System (CPRS) and stored in a secure, locked spreadsheet. Baseline patient demographic characteristics collected included age (at PCSK9i start); sex; race; and PCSK9i name, dose, and frequency. We recorded when a patient switched PCSK9i, whether or not it was due to a muscle-related AE, and the name of the original PCSK9i. Also collected were lipid therapy intolerances prior to PCSK9i initiation (ie, intolerance to statin, ezetimibe, or both).
Patients were considered statin intolerant due to a muscle-related AE in accordance with the VA PCSK9i Criteria for Use, which requires trial of at least 3 statins, one of which was trialed at the lowest dosage approved by the US Food and Drug Administration (FDA) and resulted in intolerable skeletal muscle AEs that worsened during treatment and resolved when the statin was stopped. For our study purposes, patients taking alternative day dosing of statins due to muscle-related AEs (ie, 2- or 3-times weekly dosing) were not considered statin intolerant; however, patients taking once-weekly statin dosing were considered statin intolerant. Patients were considered ezetimibe intolerant due to a muscle-related AE if the intolerance was due to skeletal muscle concerns that worsened during treatment and resolved when ezetimibe was stopped. Patients were considered PCSK9i intolerant due to a muscle-related AE if the intolerance was due to skeletal muscle concerns that worsened during treatment and resolved when the PCSK9i was stopped. Patients with non–muscle-related intolerances to statins, ezetimibe, and PCSK9i were not considered statin, ezetimibe, and PCSK9i intolerant.
Alirocumab was initiated at 75 mg subcutaneous (SQ) once every 2 weeks or evolocumab 140 mg SQ once every 2 weeks in our study. The protocol allowed for a dose reduction of alirocumab 75 mg SQ once monthly if a patient experienced AEs, but this dose reduction strategy was not used for any patients on evolocumab in this study. Of note, alirocumab 75 mg SQ once monthly is not an FDA-approved dosing strategy. However, it is similar in concept to the alternative statin dosing (ie, alternate day dosing, once-weekly dosing) and may avoid the need to discontinue PCSK9i therapy altogether.
A review of the CPRS also documented whether a muscle-related AE occurred while the patient was on a PCSK9i (if yes, the specific AE was recorded), the result of PCSK9i therapy (tolerated full dose, required a dose reduction, switched medication, or discontinued), and management strategies taken for patients who did not meet their LDL-C goal while on a reduced (monthly) PCSK9i dose. Prior lipid therapy intolerances, PCSK9i-related AEs, results of PCSK9i therapy, and management strategies for patients who did not meet LDL-C goal while on a reduced PCSK9i dose were obtained by reviewing the PACT pharmacist’s clinic notes and assessment, along with clinic notes and medication history listed within the CPRS.
Statistical Analysis
Descriptive statistics were used for the demographic characteristics of study patients. The primary outcome was calculated as a binary measure (yes/no) of whether the patient developed a muscle-related AE while on a PCSK9i. The secondary outcome of statin, ezetimibe, or statin and ezetimibe intolerances in subgroups also was calculated as a binary measure.
Results
For the study, 156 charts were reviewed and 137 patients were included (Figure).
For the secondary results, 4 patients (2.9%) tolerated an alternate PCSK9i (evolocumab 140 mg SQ every 2 weeks) after initial intolerance to PCSK9i, 16 (11.7%) required a dose reduction, and 6 (4.4%) discontinued PCSK9i due to a muscle-related AE.
Statin intolerance was most common in all groups, followed by ezetimibe intolerance, and intolerance to statins + ezetimibe. Of the 113 patients who tolerated a full dose of PCSK9i, 77 (68.1%) had intolerance to statin, 47 (41.6%) to ezetimibe, and 41 (36.3%) to both statins and ezetimibe. Of the 6 patients who discontinued PCSK9i, all had intolerance to statins, 5 (83.3%) to ezetimibe, and 5 (83.3%) to statins and ezetimibe.
For patients who were on a reduced (monthly) dose of a PCSK9i who did not reach their LDL-C goal, we found that 16 patients (11.7%) required a PCSK9i dose reduction following muscle-related AEs. Of the patients who had their dose of PCSK9i reduced to monthly dosing, 5 (31%) met their LDL-C goal. For the 11 patients who did not meet their LDL-C goal, different management strategies were taken. Lifestyle modifications were made in 6 patients (54%), the monthly PCSK9i dose was increased to alirocumab 150 mg SQ monthly in 4 patients (36%), and 1 patient (9.1%) was switched to an alternative PCSK9i. There were no identified muscle-related AEs recorded in patients whose dose was increased to alirocumab 150 mg SQ monthly.
Discussion
This retrospective study found 17.5% of patients experienced muscle-related PCSK9i AEs. These occurred at a higher rate than reported in the prescribing information (< 5%) and were similar to the incidence rates reported in the GAUSS-2, GAUSS-3, and ODYSSEY-ALTERNATIVE clinical trials (12.0%-32.5%), which is what we hypothesized.18,19,22-25 It is important to note that the incidence rates of muscle-related AEs reported in the prescribing information for alirocumab and evolocumab were based on trials that did not include statin- and/or ezetimibe-intolerant patients; whereas many patients in our study and patients in the clinical trials were statin and/or ezetimibe intolerant.
Additionally, a new study by Donald and colleagues found an incidence rate of 32% to 36% for muscle-related PCSK9i AEs.27 Collectively, the data from clinical trials and our study indicate that patients with prior intolerances to statin and/or ezetimibe appear to have a higher likelihood of developing a muscle-related PCSK9i intolerance. In our study, 23 of 24 patients who developed a muscle-related PCSK9i AE had a prior history of statin and/or ezetimibe intolerances. This should alert clinicians prescribing PCSK9i in patients with a history of statin and/or ezetimibe intolerance to counsel their patients on the possibility of muscle-related PCSK9i AEs and management strategies. However, it is important to note that there was a substantial number of patients in our study who were statin and/or ezetimibe intolerant due to a prior muscle-related AE who tolerated the full dose of PCSK9i.
To our knowledge, this was the first trial to evaluate muscle-related PCSK9i AEs in a veteran population. Additionally, our study appears to be the first to use 2 PCSK9i dosing strategies that are not FDA approved: Dose reduction for patients who experienced a muscle-related AE on alirocumab 75 mg SQ every 2 weeks and dose escalation for patients who did not meet their LDL-C goal on alirocumab 75 mg SQ monthly following an initial intolerance to 2-week dosing. The dose-reduction strategy allowed patients who experienced a muscle-related AE to alirocumab 75 mg to reduce administration from every 2 weeks to monthly.
This strategy was only performed with alirocumab, the preferred PCSK9i at WBVAMC, but the same dose-reduction strategy can theoretically be used with evolocumab as well. Reduced monthly dosing of alirocumab allowed patients with a prior intolerance to remain on a lower dosage without discontinuation. This is important because as noted by Myers and colleagues, individuals without access to PCSK9i were found to have a significantly higher incidence ratio of cardiovascular events compared with those taking PCSK9i.15 Also of note, > 30% of patients on the reduced monthly dose of alirocumab still met their LDL-C goal. Therefore, using this dose-reduction strategy (instead of patients discontinuing therapy altogether due to a muscle-related intolerance) can lessen the risk of major adverse cardiovascular events (MACE) as well as mitigate muscle-related AEs that occurred while on 2-week PCSK9i dosing regimens. While we acknowledge that this reduced monthly dose of either alirocumab or evolocumab is not FDA approved, it is similar to alternative statin dosing that also is not FDA approved but may minimize the need to discontinue PCSK9i therapy. It would be beneficial if these dosing strategies were investigated by future research.
The dose-escalation strategy for patients who did not meet their LDL-C goal while on the reduced, monthly dose of alirocumab also was unique. Alirocumab was increased from 75 mg SQ once monthly to 150 mg SQ once monthly. Interestingly, we found that through the end of the chart review period, all patients tolerated the increase well, despite having an initial muscle-related AE to alirocumab 75 mg every 2 weeks, which is the same total monthly dosage. This approach is similar to that of once-weekly statin dosing or a drug holiday and may be explained by the long half-life of PCSK9i. Regardless of the mechanism, this finding suggests that an increased monthly dose of PCSK9i is a potential alternative for patients who cannot tolerate the FDA-approved dose. However, the ability for patients to achieve goal LDL-C on the monthly dosage requires future study.
In our study, only 6 patients (4.4%) discontinued PCSK9i therapy. This low discontinuation rate is largely attributable to our unique study design, which allowed for a dose reduction in patients who experienced muscle-related AEs. The earlier ODYSSEY-ALTERNATIVE trial evaluated the safety and efficacy of alirocumab compared with ezetimibe in confirmed statin-intolerant subjects after 24 weeks. This trial did not use a dose-reduction strategy and found 15.9% of patients discontinued alirocumab due to a muscle-related AE.24 This is notably higher than our discontinuation rate of 4.4%. If patients with a muscle-related AE discontinued PCKS9i instead of reducing the dose, they would likely return to their baseline LDL-C, which would increase the risk of MACE.
In general, myalgias due to antihyperlipidemic medications are not completely understood. One possible mechanism for statin-induced myalgias is the depletion of ubiquinone. However, this theory cannot explain muscle-related AEs associated with PCSK9i or ezetimibe, which have not been shown to deplete ubiquinone. We also found that the onset of muscle-related AEs associated with PCSK9i tends to appear later in therapy than what we know about statin therapy. Our study showed that the onset of a muscle-related PCSK9i AEs occurred a mean (SD) 8 (5.3) months after initiation (range, 1-19). Statin muscle-related AEs typically occur within the initial 4 to 8 weeks of treatment, although they can occur at any time.28
Limitations
The results of this study should be considered with the following limitations. First, this was a retrospective chart review performed over a prespecified period. Any muscle-related AEs or LDL-C lowering effects from PCSK9i that occurred outside the review period were not captured. Our study was small and only included 137 patients, though it was similar in size to the GAUSS-2, GAUSS-3, and ODYSSEY-ALTERNATIVE trials.22-24 Additionally, the study was primarily composed of White men and may not be representative of other populations. Some muscle-related PCSK9i AEs may be attributed to the nocebo. Last, our study did not capture patients on a PCSK9i who were not followed in the PACT clinic.
Conclusions
We found that muscle-related PCSK9i AEs occurred at a similar rate as those reported in previous clinical trials and exceeded the incidence rate reported in the prescribing information for alirocumab and evolocumab. It appears that patients who have a prior muscle-related intolerance to a statin and/or ezetimibe had a higher likelihood of developing a muscle-related PCSK9i AE. In our study, only 1 patient developed a muscle-related PCSK9i AE who did not have a prior history of muscle-related intolerance to either a statin or ezetimibe. However, in our study, a substantial percentage of patients with statin and/or ezetimibe intolerances tolerated the full PCSK9i dose well, proving that PCSK9i are still a reasonable alternative for patients with prior intolerances to statins and/or ezetimibe.
Acknowledgments
This material is the result of work supported with resources and the use of facilities at the US Department of Veterans Affairs Medical Center, Wilkes-Barre, Pennsylvania.
1. Randomised trial of cholesterol lowering in 4444 patients with coronary heart disease: the Scandinavian Simvastatin Survival Study (4S). Lancet. 1994;344(8934):1383-1389.
2. Sacks FM, Pfeffer MA, Moye LA, et al. The effect of pravastatin on coronary events after myocardial infarction in patients with average cholesterol levels. Cholesterol and Recurrent Events Trial investigators. N Engl J Med. 1996;335(14):1001-1009. doi:10.1056/NEJM199610033351401
3. Long-Term Intervention with Pravastatin in Ischaemic Disease (LIPID) Study Group. Prevention of cardiovascular events and death with pravastatin in patients with coronary heart disease and a broad range of initial cholesterol levels. N Engl J Med. 1998;339(19):1349-1357. doi:10.1056/NEJM199811053391902.
4. Heart Protection Study Collaborative Group. MRC/BHF Heart Protection Study of cholesterol lowering with simvastatin in 20,536 high-risk individuals: a randomised placebo-controlled trial. Lancet. 2002;360(9326):7-22. doi:10.1016/S0140-6736(02)09327-3
5. Koren MJ, Hunninghake DB; ALLIANCE Investigators. Clinical outcomes in managed-care patients with coronary heart disease treated aggressively in lipid-lowering disease management clinics: the alliance study. J Am Coll Cardiol. 2004;44(9):1772-1779. doi:10.1016/j.jacc.2004.07.053
6. Downs JR, Clearfield M, Weis S, et al. Primary prevention of acute coronary events with lovastatin in men and women with average cholesterol levels: results of AFCAPS/TexCAPS. Air Force/Texas Coronary Atherosclerosis Prevention Study. JAMA. 1998;279(20):1615-1622. doi:10.1001/jama.279.20.1615
7. ALLHAT Officers and Coordinators for the ALLHAT Collaborative Research Group. The Antihypertensive and Lipid-Lowering Treatment to Prevent Heart Attack Trial. Major outcomes in moderately hypercholesterolemic, hypertensive patients randomized to pravastatin vs usual care: The Antihypertensive and Lipid-Lowering Treatment to Prevent Heart Attack Trial (ALLHAT-LLT). JAMA. 2002;288(23):2998-3007. doi:10.1001/jama.288.23.2998
8. Sever PS, Dahlöf B, Poulter NR, et al. Prevention of coronary and stroke events with atorvastatin in hypertensive patients who have average or lower-than-average cholesterol concentrations, in the Anglo-Scandinavian Cardiac Outcomes Trial-Lipid Lowering Arm (ASCOT-LLA): a multicentre randomised controlled trial. Lancet. 2003;361(9364):1149-1158. doi:10.1016/S0140-6736(03)12948-0
9. Ridker PM, Danielson E, Fonseca FA, et al. Rosuvastatin to prevent vascular events in men and women with elevated C-reactive protein. N Engl J Med. 2008;359(21):2195-2207. doi:10.1056/NEJMoa0807646
10. Nakamura H, Arakawa K, Itakura H, et al. Primary prevention of cardiovascular disease with pravastatin in Japan (MEGA Study): a prospective randomised controlled trial. Lancet. 2006;368(9542):1155-1163. doi:10.1016/S0140-6736(06)69472-5
11. Shepherd J, Blauw GJ, Murphy MB, et al. Pravastatin in elderly individuals at risk of vascular disease (PROSPER): a randomised controlled trial. Lancet. 2002;360(9346):1623-1630. doi:10.1016/s0140-6736(02)11600-x
12. Shepherd J, Cobbe SM, Ford I, et al. Prevention of coronary heart disease with pravastatin in men with hypercholesterolemia. West of Scotland Coronary Prevention Study Group. N Engl J Med. 1995;333(20):1301-1307. doi:10.1056/NEJM199511163332001
13. Stroes ES, Thompson PD, Corsini A, et al. Statin-associated muscle symptoms: impact on statin therapy-European Atherosclerosis Society Consensus Panel Statement on Assessment, Aetiology and Management. Eur Heart J. 2015;36(17):1012-1022. doi:10.1093/eurheartj/ehv043
14. Grundy SM, Stone NJ, Bailey AL, et al. AHA/ACC/AACVPR/AAPA/ABC/ACPM/ADA/AGS/APhA/ASPC/NLA/PCNA Guideline on the Management of Blood Cholesterol: A Report of the American College of Cardiology/American Heart Association Task Force on Clinical Practice Guidelines. J Am Coll Cardiol. 2019;73(24) e285-350. doi:10.1016/j.jacc.2018.11003
15. Myers KD, Farboodi N, Mwamburi M, et al. Effect of access to prescribed PCSK9 inhibitors on cardiovascular outcomes. Circ Cardiovasc Qual Outcomes. 2019;12(8):e005404. doi:10.1161/CIRCOUTCOMES.118.005404
16. Wong ND, Chuang J, Zhao Y, Rosenblit PD. Residual dyslipidemia according to low-density lipoprotein cholesterol, non-high-density lipoprotein cholesterol, and apolipoprotein B among statin-treated US adults: National Health and Nutrition Examination Survey 2009-2010. J Clin Lipidol. 2015;9(4):525-532. doi:10.1016/j.jacl.2015.05.003
17. Della Badia LA, Elshourbagy NA, Mousa SA. Targeting PCSK9 as a promising new mechanism for lowering low-density lipoprotein cholesterol. Pharmacol Ther. 2016;164:183-194. doi:10.1016/j.pharmthera.2016.04.011
18. Praluent (alirocumab) injection. Prescribing information. Regeneron Pharmaceuticals; 2021.
19. Repatha (evolocumab) injection. Prescribing information. Amgen; 2021.
20. Schwartz GG, Steg PG, Szarek M, et al. Alirocumab and cardiovascular outcomes after acute coronary syndrome. N Engl J Med. 2018;379(22):2097-2107. doi:10.1056/NEJMoa1801174
21. Sabatine MS, Giugliano RP, Keech AC, et al. Evolocumab and clinical outcomes in patients with cardiovascular disease. N Engl J Med. 2017;376(18):1713-1722. doi:10.1056/NEJMoa1615664
22. Stroes E, Colquhoun D, Sullivan D, et al. Anti-PCSK9 antibody effectively lowers cholesterol in patients with statin intolerance: the GAUSS-2 randomized, placebo-controlled phase 3 clinical trial of evolocumab. J Am Coll Cardiol. 2014;63(23):2541-2548. doi:10.1016/j.jacc.2014.03.019
23. Nissen SE, Stroes E, Dent-Acosta RE, et al. Efficacy and tolerability of evolocumab vs ezetimibe in patients with muscle-related statin intolerance: the GAUSS-3 randomized clinical trial. JAMA. 2016;315(15):1580-1590. doi:10.1001/jama.2016.3608
24. Moriarty PM, Thompson PD, Cannon CP, et al. Efficacy and safety of alirocumab vs ezetimibe in statin-intolerant patients, with a statin rechallenge arm: the ODYSSEY ALTERNATIVE randomized trial. J Clin Lipidol. 2015;9(6):758-769. doi:10.1016/j.jacl.2015.08.006
25. Mesi O, Lin C, Ahmed H, Cho LS. Statin intolerance and new lipid-lowering treatments. Cleve Clin J Med. 2021;88(7):381-387. Published 2021 Jul 1. doi:10.3949/ccjm.88a.20165
26. US Department of Veterans Affairs. Clinical Guidance - Criteria For Use. September 2016. Accessed January 23, 2023. https://www.pbm.va.gov/clinicalguidance/criteriaforuse.asp
27. Donald DR, Reynolds VW, Hall N, DeClercq J, Choi L. Exploring rates of PCSK9 inhibitor persistence and reasons for treatment non-persistence in an integrated specialty pharmacy model. J Clin Lipidol. 2022;16(3):315-324. doi:10.1016/j.jacl.2022.03.004
28. Warden BA, Guyton JR, Kovacs AC, et al. Assessment and management of statin-associated muscle symptoms: A clinical perspective from the National Lipid Association. J Clin Lipidol. Published online September 10, 2022. doi:10.1016/j.jacl.2022.09.001
Dapagliflozin gets expanded heart failure indication in Europe
The European Commission has expanded the indication for dapagliflozin (Forxiga) to include heart failure across the full spectrum of left ventricular ejection fraction – including HF with mildly reduced and preserved ejection fraction, AstraZeneca has announced.
The EC nod for the sodium-glucose cotransporter 2 (SGLT2) inhibitor (known as Farxiga in the United States) follows the positive opinion of the Committee for Medicinal Products for Human Use of the European Medicines Agency in December 2022.
The committee’s decision was based on results from the DELIVER phase 3 trial, which showed clear clinical benefits of the SGLT2 inhibitor in patients with HF regardless of their left ventricular function.
The study was published in the New England Journal of Medicine and presented at the European Society of Cardiology’s annual congress.
The data support the use of SGLT2 inhibitors as “foundational agents for virtually all patients with heart failure” regardless of their ejection fraction or whether or not they have type 2 diabetes, said study presenter Scott D. Solomon, MD, of Harvard Medical School and Brigham and Women’s Hospital, both in Boston.
The Food and Drug Administration is currently reviewing AstraZeneca’s application to expand the HF indication for dapagliflozin in the United States.
A version of this article first appeared on Medscape.com.
Longer life after bariatric surgery, but suicide risk in young
Death from cardiovascular disease, cancer, and diabetes was 29%, 43%, and 72% lower, respectively, in the bariatric surgery patients versus nonsurgery peers, during a mean follow-up of 13 years (all P > .001).
However, the youngest group of bariatric surgery patients – who were 18-34 years old – had a fivefold increased risk of suicide during follow-up compared with their peers who did not undergo surgery (P = .001).
These findings are from a retrospective study in Utah that matched close to 22,000 patients with severe obesity who underwent Roux-en-Y gastric bypass, gastric banding, sleeve gastrectomy, or duodenal switch from 1982 to 2018 with an equal number of nonsurgery individuals.
The study, by Ted D. Adams, PhD, MPH, and colleagues, was published online in Obesity.
‘Impressive’ data, in men too, but psychological screening important
The overall improved survival and decreased deaths from diabetes, heart disease, and cancer over this long follow-up are “impressive,” Dr. Adams, of Intermountain Surgical Specialties/Digestive Health Clinical Program, Salt Lake City, said in an interview.
Previous studies have not shown a survival benefit from bariatric surgery versus no surgery in men, he said. However, “because we had a fair number of male patients and because of the length of follow-up, we did show that the improved mortality was not only evident for the female patients but also for the male patients,” Dr. Adams stressed.
Finding increased suicide rates among bariatric surgical patients who underwent surgery at a younger age (18-34 years) shows that “we need to try and determine who is at risk for suicide,” according to Dr. Adams.
Patients with severe obesity, especially younger ones, “may need more aggressive presurgical psychological screening and postsurgery follow-up,” wrote Dr. Adams and colleagues.
The findings may also “stimulate important research related to the discovery of physiologic and biomolecular mechanisms leading to nonsurgical treatment that results in weight loss and improved mortality similar to that achieved by bariatric surgery,” they suggested.
Close to 1 in 10 Americans has severe obesity
The prevalence of severe obesity (BMI ≥ 40 kg/m2) in the United States has increased from 4.7% during 1999-2000 to 9.2% during 2017-2018, based on National Health and Nutrition Examination Survey (NHANES) data, the researchers noted.
They previously published a study of long-term mortality in 7,925 patients who had gastric bypass surgery from 1984 to 2002 matched with patients with the same BMI who did not have bariatric surgery and were followed out to 2002.
The current study extends the follow-up through 2021, doubles the number of bypass patients, and includes three newer types of bariatric surgery.
The researchers matched 21,873 patients aged 18-80 who had Roux-en-Y gastric bypass, gastric banding, sleeve gastrectomy, or duodenal switch during 1982-2018 in Utah (from the Utah Population Database) with people of the same BMI category, age category (18-34, 35-44, 45-54, and 55-80 years), and sex (from Utah driver license data).
Most patients were women (79%) and most were White (94% and 85%). They had a mean age of 42 years and a mean BMI of 46 kg/m2.
Most patients had Roux-en-Y gastric bypass (69%), and the rest had sleeve gastrectomy (14%), gastric banding (12%), and duodenal switch (4.8%).
During follow-up, 13.5% of patients in the bariatric surgery group and 14.6% of people in the nonsurgery group died.
Overall, all-cause mortality was 16% lower in patients who had bariatric surgery versus matched nonsurgical participants; it was 14% lower in women and 21% lower in men (all P < .001).
All-cause mortality was significantly lower in patients who had bariatric surgery when they were 35-44, 45-54, and 55-80 years old compared with matched peers who did not have surgery.
However, the findings “should not imply patients necessarily postpone surgery until older age,” the researchers cautioned, “as postsurgical complications have been shown to increase with increasing age at surgery and surgical postponement may result in worsened clinical status related to certain conditions such as orthopedic joint health.”
The researchers found significantly improved all-cause mortality following either type of surgery (gastric bypass, gastric banding, and sleeve gastrectomy) compared with no surgery.
Along with fewer deaths from cardiovascular disease, cancer, and diabetes, deaths from lung disease were 39% lower in the surgery group than in the nonsurgery group.
However, in the youngest group (age 18-34), deaths from cirrhosis of the liver were significantly higher in the patients who had bariatric surgery, and rates of suicide were significantly greater for both females and males, compared with similar people who did not undergo surgery.
The study was supported by grants from Ethicon Endo-Surgery (Johnson & Johnson); the National Institute of Diabetes and Digestive and Kidney Diseases, a division of the National Institutes of Health; U.S. Public Health Service; and Intermountain Research and Medical Foundation of Intermountain Healthcare. Dr. Adams disclosed ties to Ethicon Endo-Surgery and Intermountain Healthcare. A coauthor reported ties with Biomedical Research Program at Weill Cornell Medicine in Qatar, a program funded by the Qatar Foundation. The other authors have reported no relevant financial relationships.
A version of this article originally appeared on Medscape.com.
FROM OBESITY
Keto for life? Reasons to think twice
Is the ketogenic diet the only way to lose weight? Of course not! Keep track of calories in vs. calories out and almost anyone can lose weight. The problem is keeping it off. To understand that, we need to look at metabolic adaptation and the biology of obesity.
Our bodies have a “set point” that is epigenetically latched onto the environment the brain senses, just as the fetal environment responds to the maternal environment.

If food is plentiful, our hormones force us to eat until our bodies feel that there are enough fat stores to survive. Because of environmental influences such as highly processed food, preservatives, climate change, and regulation of temperature, our brains have decided that we need more adipose tissue than we did 50-100 years ago. It could be that an element in food has caused a dysfunction of the pathways that regulate our body weight, and most of us “defend” a higher body weight in this environment.
How to counteract that? Not easily. The ketogenic diet works temporarily just like any other diet where calorie intake is lower than usual. It seems to be agreeable to many people because they say they feel full after eating protein, fat, and perhaps some vegetables. Protein and fat are certainly more satiating than simple carbohydrates.
If strictly followed, a ketogenic diet will force the body to burn fat and go into ketosis. Without a source for glucose, the brain will burn ketones from fat stores. Owen and colleagues discovered this in 1969 when they did their now-famous studies of fasting in inpatients at Brigham and Women’s hospital, using IV amino acids to protect muscle mass.
Keto for life?
Is the ketogenic diet a healthy diet for the long term? That is a different question.
Of course not – we need high-fiber carbohydrate sources such as whole grains, fruits, and vegetables to keep the colon healthy and obtain the vitamins and minerals needed to make the Krebs cycle, or citric acid cycle, work at its best.
Why, then, are we promoting ketogenic diets for those with obesity and type 2 diabetes? Ketogenic or low-carbohydrate diets are easy to teach and can rapidly help patients lose weight and return their blood glucose, blood pressure, and other metabolic parameters to normal.
The patient will be instructed to avoid all highly processed foods. Studies have shown that highly processed foods, created to maximize flavor, “coerce” people to eat more calories than when presented with the same number of calories in unprocessed foods, a way to fool the brain.
Why are we fooling the brain?
We circumvent the natural satiety mechanisms that start with the gut. When we eat, our gastric fundus and intestinal stretch receptors start the process that informs the hypothalamus about food intake. Highly processed foods are usually devoid of fiber and volume, and pack in the calories in small volumes so that the stretch receptors are not activated until more calories are ingested. The study mentioned above developed two ad lib diets with the same number of calories, sugar, fat, and carbohydrate content – one ultraprocessed and the other unprocessed.
That explanation is just the tip of the iceberg, because a lot more than primitive stretch receptors is informing the brain. There are gut hormones that are secreted before and after meals, such as ghrelin, glucagon-like peptide 1 (GLP-1), glucose-dependent insulinotropic polypeptide (GIP), and cholecystokinin (CCK), among a slew of others. These peptide hormones are all secreted from gut cells into the blood or vagus nerve, or both, and alert the brain that there is or is not enough food to maintain body weight at its set point.
It’s a highly regulated and precise system that regulates body weight for survival of the species in this environment. However, the environment has changed over the past 100 years but our genetic makeup for survival of the fittest has not. The mechanism of action for defense of a higher body weight set point in this new environment has not been elucidated as yet. Most likely, there are many players or instigators involved, such as food-supply changes, sedentary lifestyle, ambient temperature, fetal programming, air quality, and global warming and climate change, to name a few.
The goal of obesity researchers is to investigate the underlying mechanisms of the increased prevalence of obesity over the past 100 years. The goal of obesity medicine specialists is to treat obesity in adults and children, and to prevent obesity as much as possible with lifestyle change and medications that have been shown to help “reverse” the metabolic adaptation to this environment. Our newest GLP-1/GIP receptor agonists have been shown in animal models to hit several pathways that lead to obesity. They are not just appetite suppressants. Yes, they do modulate appetite and satiety, but they also affect energy expenditure. The body’s normal reaction to a lack of calorie intake is to reduce resting energy expenditure until body weight increases back to “set point levels.” These agonists prevent that metabolic adaptation. That is why they are true agents that can treat obesity – the disease.
Back to the ketogenic diet. The ketogenic diet can fool the brain temporarily by using protein and fat to elicit satiety with less food intake in calories. After a while, however, gut hormones and other factors begin to counteract the weight loss with a reduction in resting energy and total energy expenditure, and other metabolic measures, to get the body back to a certain body weight set point.
The ketogenic diet also can help dieters avoid ultra- and highly processed foods. In the end, any type of diet that lowers caloric intake will work for weight loss, but it’s the maintenance of that weight loss that makes a long-term difference, and that involves closing the metabolic gap that the body generates to defend fat mass. Understanding this pathophysiology will allow obesity medicine specialists to assist patients with obesity to lose weight and keep it off.
Dr. Apovian is in the department of medicine, division of endocrinology, diabetes, and hypertension, and codirector, Center for Weight Management and Wellness, Harvard Medical School, Boston. She disclosed ties with Altimmune, Cowen and Company, Currax Pharmaceuticals, EPG Communication Holdings, Gelesis Srl, L-Nutra, NeuroBo Pharmaceuticals, National Institutes of Health, Patient-Centered Outcomes Research Institute, GI Dynamics, and Novo Nordisk. A version of this article first appeared on Medscape.com.
Is the ketogenic diet the only way to lose weight? Of course not! Keep track of calories in vs. calories out and almost anyone can lose weight. The problem is keeping it off. To understand that, we need to look at metabolic adaptation and the biology of obesity.
Our bodies have a “set point” that is epigenetically latched onto the environment the brain senses, just as the fetal environment responds to the maternal environment.
If food is plentiful, our hormones force us to eat until our bodies feel that there are enough fat stores to survive. Because of environmental influences such as highly processed food, preservatives, climate change, and regulation of temperature, our brains have decided that we need more adipose tissue than we did 50-100 years ago. It could be that an element in food has caused a dysfunction of the pathways that regulate our body weight, and most of us “defend” a higher body weight in this environment.
How to counteract that? Not easily. The ketogenic diet works temporarily just like any other diet where calorie intake is lower than usual. It seems to be agreeable to many people because they say they feel full after eating protein, fat, and perhaps some vegetables. Protein and fat are certainly more satiating than simple carbohydrates.
If strictly followed, a ketogenic diet will force the body to burn fat and go into ketosis. Without a source for glucose, the brain will burn ketones from fat stores. Owen and colleagues discovered this in 1969 when they did their now-famous studies of fasting in inpatients at Brigham and Women’s hospital, using IV amino acids to protect muscle mass.
Keto for life?
Is the ketogenic diet a healthy diet for the long term? That is a different question.
Of course not – we need high-fiber carbohydrate sources such as whole grains, fruits, and vegetables to keep the colon healthy and obtain the vitamins and minerals needed to make the Krebs cycle, or citric acid cycle, work at its best.
Why, then, are we promoting ketogenic diets for those with obesity and type 2 diabetes? Ketogenic or low-carbohydrate diets are easy to teach and can rapidly help patients lose weight and return their blood glucose, blood pressure, and other metabolic parameters to normal.
The patient will be instructed to avoid all highly processed foods. Studies have shown that highly processed foods, created to maximize flavor, “coerce” people to eat more calories than when presented with the same number of calories in unprocessed foods, a way to fool the brain.
Why are we fooling the brain?
We circumvent the natural satiety mechanisms that start with the gut. When we eat, our gastric fundus and intestinal stretch receptors start the process that informs the hypothalamus about food intake. Highly processed foods are usually devoid of fiber and volume, and pack in the calories in small volumes so that the stretch receptors are not activated until more calories are ingested. The study mentioned above developed two ad lib diets with the same number of calories, sugar, fat, and carbohydrate content – one ultraprocessed and the other unprocessed.
That explanation is just the tip of the iceberg, because a lot more than primitive stretch receptors is informing the brain. There are gut hormones that are secreted before and after meals, such as ghrelin, glucagon-like peptide 1 (GLP-1), glucose-dependent insulinotropic polypeptide (GIP), and cholecystokinin (CCK), among a slew of others. These peptide hormones are all secreted from gut cells into the blood or vagus nerve, or both, and alert the brain that there is or is not enough food to maintain body weight at its set point.
It’s a highly regulated and precise system that regulates body weight for survival of the species in this environment. However, the environment has changed over the past 100 years but our genetic makeup for survival of the fittest has not. The mechanism of action for defense of a higher body weight set point in this new environment has not been elucidated as yet. Most likely, there are many players or instigators involved, such as food-supply changes, sedentary lifestyle, ambient temperature, fetal programming, air quality, and global warming and climate change, to name a few.
The goal of obesity researchers is to investigate the underlying mechanisms of the increased prevalence of obesity over the past 100 years. The goal of obesity medicine specialists is to treat obesity in adults and children, and to prevent obesity as much as possible with lifestyle change and medications that have been shown to help “reverse” the metabolic adaptation to this environment. Our newest GLP-1/GIP receptor agonists have been shown in animal models to hit several pathways that lead to obesity. They are not just appetite suppressants. Yes, they do modulate appetite and satiety, but they also affect energy expenditure. The body’s normal reaction to a lack of calorie intake is to reduce resting energy expenditure until body weight increases back to “set point levels.” These agonists prevent that metabolic adaptation. That is why they are true agents that can treat obesity – the disease.
Back to the ketogenic diet. The ketogenic diet can fool the brain temporarily by using protein and fat to elicit satiety with less food intake in calories. After a while, however, gut hormones and other factors begin to counteract the weight loss with a reduction in resting energy and total energy expenditure, and other metabolic measures, to get the body back to a certain body weight set point.
The ketogenic diet also can help dieters avoid ultra- and highly processed foods. In the end, any type of diet that lowers caloric intake will work for weight loss, but it’s the maintenance of that weight loss that makes a long-term difference, and that involves closing the metabolic gap that the body generates to defend fat mass. Understanding this pathophysiology will allow obesity medicine specialists to assist patients with obesity to lose weight and keep it off.
Dr. Apovian is in the department of medicine, division of endocrinology, diabetes, and hypertension, and codirector, Center for Weight Management and Wellness, Harvard Medical School, Boston. She disclosed ties with Altimmune, Cowen and Company, Currax Pharmaceuticals, EPG Communication Holdings, Gelesis Srl, L-Nutra, NeuroBo Pharmaceuticals, National Institutes of Health, Patient-Centered Outcomes Research Institute, GI Dynamics, and Novo Nordisk. A version of this article first appeared on Medscape.com.
Persistent gaps in drug use by patients with type 2 diabetes
Adults with mainly type 2 diabetes had gaps in the use of medications for managing blood glucose, hypertension, and lipids, in an analysis of nationally representative U.S. survey data.
A mean of 19.5%, 17.1%, and 43.3% of survey participants had inconsistent use of glucose-, BP-, or lipid-lowering medications, respectively, over 2 years in a series of successive 2-year surveys in 2005-2019.
A new group of participants was enrolled for each successive 2-year survey.
“We found persistent and sometimes increasing gaps in continuity of use of these [glycemia, hypertension, and lipid] treatments at the national level,” the researchers wrote.
Moreover, “this outcome was found despite long-lasting guidelines that generally recommend medications as an ongoing part of therapy for adults with type 2 diabetes to reduce macrovascular and microvascular disease risk,” they stressed.
The data did not distinguish between type 1 and type 2 diabetes, but more than 90% of diabetes diagnoses in the United States are type 2 diabetes, the researchers noted.
Therefore, it is “correct, our findings primarily reflect type 2 diabetes,” lead author Puneet Kaur Chehal, PhD, assistant professor, Emory University, Atlanta, clarified in an email.
“The clinical guidelines for treatment of type 1 diabetes are distinct,” she added, so “it is difficult to draw any conclusions from our study for this population.”
“To observe national trends in continuous use decrease at the same time that diabetes complications are increasing and physicians are guided to shift away from treat-to-target and towards individual patient needs certainly caught our attention,” she said.
“Our findings highlight the need for additional research to understand what is going on here,” according to Dr. Chehal.
“We did not observe levels of glucose (or blood pressure and lipids) to explore if the decrease in glucose-lowering drugs was warranted,” she added. “Our evidence of differences in continuity in use across subgroups (by race/ethnicity, payer, and age) does warrant further analysis of whether the decreasing trends we observe are lapses in access or deliberate changes in treatment.”
The study was published online in JAMA Network Open.
Investigating trends in medication adherence
Type 2 diabetes is a chronic condition and medications to control blood glucose, BP, and lipids lower the risk of diabetes-associated complications, Dr. Chehal and colleagues wrote.
After years of improvement, these cardiometabolic parameters plateaued and even decreased in 2013-2021, in parallel with increasing rates of diabetes complications, especially in younger adults, certain ethnic minority groups, and people with increased risks.
Suboptimal medication adherence among people with type 2 diabetes is associated with preventable complications and onset of heart disease, kidney disease, or diabetic neuropathy, which can lead to amputation.
However, previous studies of medication adherence were typically limited to patients covered by Medicare or commercial insurance, or studies only had 1-year follow-up.
Therefore, the researchers performed a cross-sectional analysis of a series of 2-year data from the Medical Expenditure Panel Survey (MEPS), in which participants reply to five interviews in 2 years and new participants are selected each year.
The researchers analyzed data from 15,237 adults aged 18 and older with type 2 diabetes who participated in 1 of 14 2-year MEPS survey panels in 2005-2019.
About half of participants (47.4%) were age 45-64 and about half (54.2%) were women. They were also racially diverse (43% non-Latino White, 25% Latino, and 24% non-Latino Black).
Participants were classified as having “inconsistent use” of glucose-lowering medication, for example, if they did not fill at least one prescription for a glucose-lowering drug in each of the 2 years.
“As long as [the medication] was some type of glucose-, blood pressure–, or lipid-lowering medication and was filled, it counted as continued use for that category,” Dr. Chehal explained.
They are preparing another paper that explores changes in medication regimens.
The current study showed continued use of glucose-lowering medication in both years decreased from 84.5% in 2005-2006 to 77.4% in 2018-2019, no use of glucose-lowering medication in either of the 2 years increased from 8.1% in 2005-2006 to 12.9% in 2018-2019, inconsistent use of glucose-lowering medication increased from 3.3% in 2005-2006 to 7.1% in 2018-2019, and new use of glucose-lowering medications in year 2 fluctuated between 2% and 4% across panels.
It also showed inconsistent use of BP-lowering medication increased from 3.9% in 2005-2006 to 9.0% in 2016-2017 and inconsistent use of lipid-lowering medication increased to a high of 9.9% in 2017-2018.
Younger and Black participants were less likely to consistently use glucose-lowering medication, Latino patients were less likely to consistently use BP-lowering medications, and Black and Latino patients were less likely to continuously use lipid-lowering medications. Uninsured adults were more likely to use no medications or use medications inconsistently.
“Changes and inconsistencies in payer formularies and out-of-pocket cost burden, especially among adults with no or insufficient insurance (i.e., Medicare Part D), remain prominent issues,” according to Dr. Chehal and colleagues.
“Decreases in continuity in use of glucose-lowering medications in recent panels may explain worsening diabetes complications,” they wrote.
This may be partly caused by recommended decreases in sulfonylurea and thiazolidinedione use and increased prescribing of new and more cost-prohibitive medications, they suggested.
Or this may be caused by the shift away from treating aggressively until a target is achieved toward individualizing treatment based on a patient’s age, phenotype, or comorbidities (for example, kidney disease).
The study was supported by a grant from MSD, a subsidiary of Merck, to Emory University. Some of the researchers received grants from Merck for the submitted work or were partially supported by a grant from the National Institute of Diabetes and Digestive and Kidney Diseases of the National Institutes of Health to the Georgia Center for Diabetes Translation Research. Dr. Chehal reported no relevant financial relationships.
A version of this article originally appeared on Medscape.com.
FROM JAMA NETWORK OPEN