In combing the genome, scientists can use genetic clues to determine a person’s risk for psychiatric disease and even identify new drug targets. But the benefits of these discoveries will be limited to people of European descent.
Nearly 90% of participants in genome-wide association studies (GWASs), which search for gene variants linked to disease, are of European ancestry. This Eurocentric focus threatens to widen existing disparities in racial and ethnic mental health.
Dr. Solomon Teferra
“If you develop certain interventions based on only a single population profile, then you’ll be leaving out the rest of the populations in the world,” says Solomon Teferra, MD, PhD, associate professor of psychiatry at Addis Ababa University, Ethiopia. In a growing trend, psychiatric researchers are diverging from the field’s European bias and are working to correct the imbalance in DNA databases.
The significant downsides of genomics’ one-track mind
One obstacle hindering therapeutic advances in psychiatry is a shallow understanding of the mechanisms of disorders. “The biggest problem in terms of advancing research for mental health conditions is that we don’t understand the underlying biology,” says Laramie Duncan, PhD, assistant professor of psychiatry and behavioral sciences at Stanford (Calif.) University. “Genetics is one of the best ways to systematically look for new clues about the underlying biology.”
At the advent of genomic research, scientists thought it best to study DNA from people of a single ancestry from one continent. “Researchers for a long time held the idea that it was going to be too complicated to include multiple ancestries in the first rounds of genetic analyses,” says Dr. Duncan.
Studying DNA from someone with ancestors from multiple parts of the world wasn’t compatible with methods used in the early days of GWASs. “Individual parts of a person’s DNA can be linked back to one region of the world or another, and most of our methods essentially assume that all of a person’s DNA came from one region of the world,” says Dr. Duncan.
Because many genes are usually involved in psychiatric disorders, scientists need large numbers of participants to detect uncommon, influential variants. Early research was concentrated in North America and Europe so that scientists could readily collect samples from people of European ancestry.
“It then went out of hand because it became routine practice to use only this one group, essentially White, European ancestry people,” says Karoline Kuchenbaecker, PhD, associate professor of psychiatry at University College London.
Yet findings from one population won’t necessarily translate to others. “And that’s exactly what has been shown,” says Dr. Teferra. Polygenic risk scores developed for schizophrenia from European samples, for example, perform poorly among people of African ancestry, although among Europeans, they are strongly effective at differentiating European individuals with and those without schizophrenia. Moreover, drugs that target a gene identified from studies in European populations may be harmful to other groups.
Studies drawn from a diverse pool of participants would benefit a wider swath of humanity. They would also allow scientists to discover small areas of overlap in genomes of different populations, which would help them close in on the true biology of diseases and ensure that “we’re all benefiting from more diverse data in genetics and psychiatric genetics,” says Dr. Kuchenbaecker.
New efforts aim at filling the gaps
Genomic studies are featuring more people of non-European ancestry, but most of that improvement comes from populations of Asian ancestry, not African, Latin American, or Indigenous ancestry.
Efforts to increase representation of persons of African ancestry have largely focused on African Americans; fewer efforts have extended to the African continent, home to the most genetically diverse populations. Even fewer have focused on mental health. “The little that was being done was on a very small scale,” says Karestan Koenen, PhD, a professor at Harvard School of Public Health, Boston.
With this in mind, researchers from institutions in Kenya, Uganda, South Africa, and Ethiopia partnered with researchers at the Broad Institute of the Massachusetts Institute of Technology and Harvard to conduct the largest GWAS of psychiatric disorders in Africa. Dr. Koenen leads the project, Neuropsychiatric Genetics of African Populations–Psychosis (NeuroGAP-Psychosis), which will analyze DNA from over 35,000 people of African ancestry in each of these four countries. Investigators will compare the half of participants who have no history of psychosis with the half with schizophrenia or bipolar disorder in the hopes of identifying the genetic determinants of psychosis.
“Then any potential intervention or therapeutics that will be developed will also be useful for Africans,” says Dr. Teferra, a NeuroGAP principal investigator. Because of the tremendous degree of genetic diversity among people on the continent, however, findings still might not translate to all African populations.
But correcting equity problems in genomics isn’t as simple as recruiting people with non-European backgrounds, especially if those people are unfamiliar with research or have been subject to scientific exploitation. “Special care needs to be taken to, first of all, provide information that’s appropriate [to participants], but also motivate people to take part and then find ways to keep these communities involved and understand what they’re interested in,” says Dr. Kuchenbaecker, who is not involved with NeuroGAP.
For NeuroGAP, the team needed to work with ethical committees at all of the institutions involved, ensure research materials were appropriate for each community’s cultural context, and gain the trust of local communities.
“One of the biggest criticisms within the scientific world is that people from more endowed countries just fly in, bully everyone, collect the data, and leave, with no credit to the local scientists or communities,” says NeuroGAP principal investigator Lukoye Atwoli, MMed, PhD, professor of psychiatry and dean of the Medical College, East Africa, at the Aga Khan University, Nairobi, Kenya. “That is one of the biggest pitfalls we had to grapple with.”
To address that concern, NeuroGAP is training local researchers and is providing them with requested resources so they can carry out similar studies in the future. “We will be looking to address a real need in the academic community and in clinical service delivery,” says Dr. Atwoli.
Dr. Kuchenbaecker says that NeuroGAP demonstrates features necessary for projects seeking to improve equity in psychiatric genomics. “What they’re doing right is recruiting really large numbers, recruiting from different African countries, and involving African investigators,” she says.
In the Americas, Janitza Montalvo-Ortiz, PhD, assistant professor in the Division of Genetics, department of psychiatry, Yale University, New Haven, Conn., and her colleagues are expanding psychiatric genomics projects in Latin America. She co-founded the Latin American Genomics Consortium in 2019, a network of scientists supporting psychiatric genomic research in the region. The consortium also involves the Neuropsychiatric Genetics in Mexican Populations project, which is similar to NeuroGAP and is also led by Dr. Koenan.
The study of Latin American populations is complicated, because genes in these populations reflect Indigenous American, European, and African ancestries. Even when investigators sampled DNA from Latin American individuals, that data often went unused. “Now with new methods emerging to allow us to properly analyze admixed populations in GWAS studies, we’re making efforts to compile different datasets scattered across different large-scale cohorts,” says Dr. Montalvo-Ortiz. “Our ultimate goal is to conduct the first large-scale LatinX GWAS of psychiatry,” she says.
With these projects, researchers hope that new psychiatric research will produce clinical advances for people historically left on the sidelines of genomic studies. By involving their communities in genomic research, “whatever is going to be developed will also benefit our community,” says Dr. Teferra. “We will not be left out.”
A version of this article first appeared on Medscape.com.
Traction alopecia (TA)--one of the most common types of hair loss in Black women (although not exclusive to Black women)--is reversible when early corrective measures are taken; if chronic tension continues, however, permanent scarring alopecia ensues. Dermatologists can prevent worsening of this distressing hair loss. Due to a dearth of training among dermatologists in conditions occurring in patients with tightly coiled hair, it is imperative to add practical methods to the body of dermatology literature, with the goal of enhancing cultural humility.
Hairstyling among Black women often is a lengthy process and often results in relationship bonding with the hair care giver, in turn imparting hair care traditions to the next generation. Therefore, a well-received discussion about TA prevention not only has an impact on the patient but potentially on a multigenerational family of women and friends. We present a memory aid for discussing TA, with a focus on cultural humility and patient-centered communication.
Factors contributing to the risk of TA are hairstyles and hair care practices commonly used in Black individuals, including braids, locs, weaves, wigs, and chemical straightening.1 These styles often are worn to increase hair manageability or as a creative expression of beauty.
Discussing TA can be distressing for physicians and patients, especially in the setting of hair texture discordance. In a study that surveyed Black patients' perception of their dermatologic care both in and outside of a skin of color clinic, 71% of respondents (12/17) said that they prefer a race-concordant dermatologist. Some respondents reported that non-skin of color clinic dermatologists examined their hair with the end of a pencil or not at all; patients interpreted these interactions as disrespectful and racially insensitive.2 Another study found that only 30.2% (19/63) of dermatology chief residents and 12.2% (5/41) of program directors reported a specific rotation during which residents gained experience treating skin of color patients.3
Due to a paucity of training in diagnosing and treating patients with tightly coiled hair who experience hair loss, some physicians might feel uncomfortable caring for patients who have tightly coiled hair. Although many Black patients prefer to see a race-concordant dermatologist because of their perceived cultural competence and shared experience, there is a paucity of Black dermatologists to see all patients who have tightly coiled hair.4 Therefore, all dermatologists should become skilled and comfortable discussing and treating TA in patients with all hair types.
METHOD FOR COUNSELING
The following scenarios are a guide to begin closing the competency gap in counseling about TA, using a "compliment, discuss, and suggest" method.
Scenario 1 A Black woman presents with a concern of "thinning edges" (a popular term on social media for TA). A hair-discordant dermatologist tells her, first, that she has TA caused by wearing tight hairstyles and, second, that the treatment is to stop wearing tight braids and weaves and to discontinue chemical relaxers. The dermatologist then leaves the room.
The Patient's Perspective It is not uncommon for the patient to have feelings of frustration about how they will style their hair, especially if they are unfamiliar with caring for their hair in its natural state.5 Also, they might have feelings of dismay that the loving childhood hair care giver, often their mother or grandmother, unintentionally harmed them with a tight style. They also might feel betrayed by their hairstylist, who might not have encouraged them to see a dermatologist, or who continued to oblige their request for a high-risk hairstyle. The patient might feel uncomfortable communicating the dermatologist's new recommendations to their hair care team, who also are part of her emotional support system. The patient also might think that the hair-discordant dermatologist has no idea what they "go through" with their hair.
"Compliment, Discuss, and Suggest" Counseling Traction alopecia is caused by tight hairstyles that often hurt when they are put in as tight braids, weaves, and ponytails.6 Risk increases if tight styles are applied to chemically straightened hair.1 Braids, sew-in weaves, and wigs with adhesive sometimes are referred to as protective styles. However, these styles can still lead to TA due to excessive tension.
Compliment: "Your hair looks great. I know that you get many compliments."
Discuss: "However, some of the styles might be increasing your risk for hair loss. Our goal is to preserve as many of your follicles as possible."
Suggest: "Let's start by loosening the hairstyle if it is painful when being applied. Pain means inflammation, which can lead to scarring of hair follicles and worsening of hair loss."
Using pronouns such as we, us, and our is intentional. Doing so signals that the dermatologist is a partner with the patient in the treatment of TA. Starting with a simple initial recommendation gives the patient time to process the common thoughts highlighted in The Patient's Perspective section.6
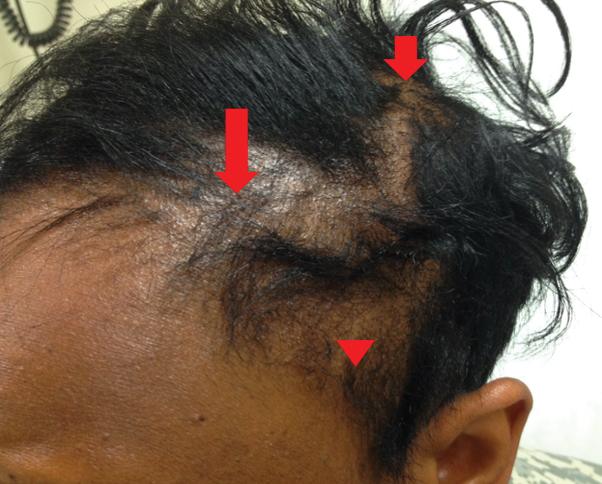
Scenario 2 A Black child (we'll call her "Janet") is accompanied by her mother for follow-up of mild atopic dermatitis on the body and scalp. When the dermatologist examines the patient's scalp, they note that she has the fringe sign--retained short hairs along the frontal hairline--that is consistent with TA. Janet's hair is adorned with 2 tight ponytails in the front with colorful decorative balls on ponytail ties, barrettes, and 6 cornrow braids in the back with plastic beads on the ends. The dermatologist counsels about the atopic dermatitis and leaves the room.
"Compliment, Discuss, and Suggest" Counseling The use of tight decorative balls on ponytail ties and numerous plastic beads increases the amount of tension and weight on the hair, which may lead to a higher risk for developing traction alopecia.6 It is quite common for children of African descent to wear hair adornments. Proper counseling regarding their use and possible implications is essential.
Compliment: "You're doing a great job controlling the atopic dermatitis, which can cause Janet's scalp to be dry. Also, her hair is beautiful--it looks like you spent a lot of time on her hair. And Janet, I like the color of your barrettes."
Discuss: "Mom, I just noticed that a few areas look tight. Let's look together." (The dermatologist points out areas where the scalp is tented upward due to traction, follicular pustules or papules, or the frontal fringe sign.) "I'm on a mission to #savetheedges because we want Janet to grow up with full edges." (Again, loss of "edges" refers to TA.)
Suggest: "When you do Janet's hair, it's OK if every hair is not in place. In fact, making styles look and feel 1 or 2 weeks old will lessen tension on the scalp. Remove Janet's hair ties to release tension when she is at home and while she's sleeping, if possible. Every minute that the hair is loose really does help."6
The Parent's Perspective
All parents take pride in their children. In some Black communities, mothers are judged by how well they manage and style their children's hair. Some people might even suggest that parents of children with nonstyled, tightly coiled hair are not fit parents. Anthropologist Sylvia Boone, PhD, found that among the Mende tribe in Sierra Leone, "unkempt, 'neglected,' or 'messy' hair implied that a woman either had loose morals or was insane."7
Braids are commonly worn by people of African heritage for a variety of reasons, including ease of manageability, to decrease daily hairstyling time, and as an expression of creativity. Intricate neat hairstyles, despite the risk of pain and TA, are perceived as a sign that the child is cared for and loved.6
FINAL THOUGHTS
Patient-centered communication is associated with the patient trusting the physician, which is especially important in race-discordant physician-patient relationships. A study found that patient-physician race discordance led to shorter visits, a lower rating of patient affect, and less shared decision-making.8 Moreover, in a study of primary care clinicians, implicit bias was found to affect communication patterns and social interactions, impacting patient outcomes. Downstream effects of racial bias resulted in less speaking, smiling, and social comments when interacting with Black patients.9
These findings highlight the need to address interpersonal barriers to effective communication in race-discordant patient-physician dyads. A history of segregated neighborhoods and schools might contribute to structural barriers, resulting in lack of familiarity with cultural norms outside one's culture, which might globally perpetuate poor communication and patient outcomes.
The "compliment, discuss, and suggest" method might lead to more positive physician-patient encounters by having the dermatologist focus on empathetically understanding the patient's perspective.10 Effective communication, understanding cultural hair care practices, and a thorough scalp examination are paramount for patients with tightly coiled hair.11 Early intervention in TA is crucial and involves partnering with patients and parents to amend high-risk hairstyling routines with cultural humility.
Dr. Grayson is from the Florida State University College of Medicine Internal Medicine Residency Program, Tallahassee. Dr. Heath is from the Department of Dermatology, Lewis Katz School of Medicine, Temple University, Philadelphia, Pennsylvania.
The authors report no conflict of interest.
Correspondence: Candrice R. Heath, MD, 3401 N Broad St, 5OB, Philadelphia, PA 19140 ([email protected]).
Author and Disclosure Information
Dr. Grayson is from the Florida State University College of Medicine Internal Medicine Residency Program, Tallahassee. Dr. Heath is from the Department of Dermatology, Lewis Katz School of Medicine, Temple University, Philadelphia, Pennsylvania.
The authors report no conflict of interest.
Correspondence: Candrice R. Heath, MD, 3401 N Broad St, 5OB, Philadelphia, PA 19140 ([email protected]).
Traction alopecia (TA)--one of the most common types of hair loss in Black women (although not exclusive to Black women)--is reversible when early corrective measures are taken; if chronic tension continues, however, permanent scarring alopecia ensues. Dermatologists can prevent worsening of this distressing hair loss. Due to a dearth of training among dermatologists in conditions occurring in patients with tightly coiled hair, it is imperative to add practical methods to the body of dermatology literature, with the goal of enhancing cultural humility.
Hairstyling among Black women often is a lengthy process and often results in relationship bonding with the hair care giver, in turn imparting hair care traditions to the next generation. Therefore, a well-received discussion about TA prevention not only has an impact on the patient but potentially on a multigenerational family of women and friends. We present a memory aid for discussing TA, with a focus on cultural humility and patient-centered communication.
Factors contributing to the risk of TA are hairstyles and hair care practices commonly used in Black individuals, including braids, locs, weaves, wigs, and chemical straightening.1 These styles often are worn to increase hair manageability or as a creative expression of beauty.
Discussing TA can be distressing for physicians and patients, especially in the setting of hair texture discordance. In a study that surveyed Black patients' perception of their dermatologic care both in and outside of a skin of color clinic, 71% of respondents (12/17) said that they prefer a race-concordant dermatologist. Some respondents reported that non-skin of color clinic dermatologists examined their hair with the end of a pencil or not at all; patients interpreted these interactions as disrespectful and racially insensitive.2 Another study found that only 30.2% (19/63) of dermatology chief residents and 12.2% (5/41) of program directors reported a specific rotation during which residents gained experience treating skin of color patients.3
Due to a paucity of training in diagnosing and treating patients with tightly coiled hair who experience hair loss, some physicians might feel uncomfortable caring for patients who have tightly coiled hair. Although many Black patients prefer to see a race-concordant dermatologist because of their perceived cultural competence and shared experience, there is a paucity of Black dermatologists to see all patients who have tightly coiled hair.4 Therefore, all dermatologists should become skilled and comfortable discussing and treating TA in patients with all hair types.
METHOD FOR COUNSELING
The following scenarios are a guide to begin closing the competency gap in counseling about TA, using a "compliment, discuss, and suggest" method.
Scenario 1 A Black woman presents with a concern of "thinning edges" (a popular term on social media for TA). A hair-discordant dermatologist tells her, first, that she has TA caused by wearing tight hairstyles and, second, that the treatment is to stop wearing tight braids and weaves and to discontinue chemical relaxers. The dermatologist then leaves the room.
The Patient's Perspective It is not uncommon for the patient to have feelings of frustration about how they will style their hair, especially if they are unfamiliar with caring for their hair in its natural state.5 Also, they might have feelings of dismay that the loving childhood hair care giver, often their mother or grandmother, unintentionally harmed them with a tight style. They also might feel betrayed by their hairstylist, who might not have encouraged them to see a dermatologist, or who continued to oblige their request for a high-risk hairstyle. The patient might feel uncomfortable communicating the dermatologist's new recommendations to their hair care team, who also are part of her emotional support system. The patient also might think that the hair-discordant dermatologist has no idea what they "go through" with their hair.
"Compliment, Discuss, and Suggest" Counseling Traction alopecia is caused by tight hairstyles that often hurt when they are put in as tight braids, weaves, and ponytails.6 Risk increases if tight styles are applied to chemically straightened hair.1 Braids, sew-in weaves, and wigs with adhesive sometimes are referred to as protective styles. However, these styles can still lead to TA due to excessive tension.
Compliment: "Your hair looks great. I know that you get many compliments."
Discuss: "However, some of the styles might be increasing your risk for hair loss. Our goal is to preserve as many of your follicles as possible."
Suggest: "Let's start by loosening the hairstyle if it is painful when being applied. Pain means inflammation, which can lead to scarring of hair follicles and worsening of hair loss."
Using pronouns such as we, us, and our is intentional. Doing so signals that the dermatologist is a partner with the patient in the treatment of TA. Starting with a simple initial recommendation gives the patient time to process the common thoughts highlighted in The Patient's Perspective section.6
Scenario 2 A Black child (we'll call her "Janet") is accompanied by her mother for follow-up of mild atopic dermatitis on the body and scalp. When the dermatologist examines the patient's scalp, they note that she has the fringe sign--retained short hairs along the frontal hairline--that is consistent with TA. Janet's hair is adorned with 2 tight ponytails in the front with colorful decorative balls on ponytail ties, barrettes, and 6 cornrow braids in the back with plastic beads on the ends. The dermatologist counsels about the atopic dermatitis and leaves the room.
"Compliment, Discuss, and Suggest" Counseling The use of tight decorative balls on ponytail ties and numerous plastic beads increases the amount of tension and weight on the hair, which may lead to a higher risk for developing traction alopecia.6 It is quite common for children of African descent to wear hair adornments. Proper counseling regarding their use and possible implications is essential.
Compliment: "You're doing a great job controlling the atopic dermatitis, which can cause Janet's scalp to be dry. Also, her hair is beautiful--it looks like you spent a lot of time on her hair. And Janet, I like the color of your barrettes."
Discuss: "Mom, I just noticed that a few areas look tight. Let's look together." (The dermatologist points out areas where the scalp is tented upward due to traction, follicular pustules or papules, or the frontal fringe sign.) "I'm on a mission to #savetheedges because we want Janet to grow up with full edges." (Again, loss of "edges" refers to TA.)
Suggest: "When you do Janet's hair, it's OK if every hair is not in place. In fact, making styles look and feel 1 or 2 weeks old will lessen tension on the scalp. Remove Janet's hair ties to release tension when she is at home and while she's sleeping, if possible. Every minute that the hair is loose really does help."6
The Parent's Perspective
All parents take pride in their children. In some Black communities, mothers are judged by how well they manage and style their children's hair. Some people might even suggest that parents of children with nonstyled, tightly coiled hair are not fit parents. Anthropologist Sylvia Boone, PhD, found that among the Mende tribe in Sierra Leone, "unkempt, 'neglected,' or 'messy' hair implied that a woman either had loose morals or was insane."7
Braids are commonly worn by people of African heritage for a variety of reasons, including ease of manageability, to decrease daily hairstyling time, and as an expression of creativity. Intricate neat hairstyles, despite the risk of pain and TA, are perceived as a sign that the child is cared for and loved.6
FINAL THOUGHTS
Patient-centered communication is associated with the patient trusting the physician, which is especially important in race-discordant physician-patient relationships. A study found that patient-physician race discordance led to shorter visits, a lower rating of patient affect, and less shared decision-making.8 Moreover, in a study of primary care clinicians, implicit bias was found to affect communication patterns and social interactions, impacting patient outcomes. Downstream effects of racial bias resulted in less speaking, smiling, and social comments when interacting with Black patients.9
These findings highlight the need to address interpersonal barriers to effective communication in race-discordant patient-physician dyads. A history of segregated neighborhoods and schools might contribute to structural barriers, resulting in lack of familiarity with cultural norms outside one's culture, which might globally perpetuate poor communication and patient outcomes.
The "compliment, discuss, and suggest" method might lead to more positive physician-patient encounters by having the dermatologist focus on empathetically understanding the patient's perspective.10 Effective communication, understanding cultural hair care practices, and a thorough scalp examination are paramount for patients with tightly coiled hair.11 Early intervention in TA is crucial and involves partnering with patients and parents to amend high-risk hairstyling routines with cultural humility.
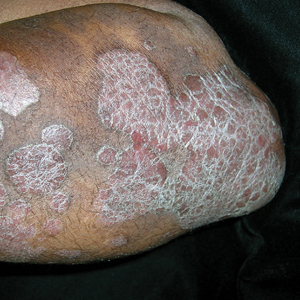
A Elbow and forearm with erythematous, well-demarcated, pink plaques with mild micaceous scale in a 42-year-old White woman.
B Elbow and forearm with violaceous, well-demarcated plaques with micaceous scale and hyperpigmented patches around the active plaques in a 58-year-old Black man.
Epidemiology Psoriasis prevalence in the United States has been estimated at 3.7%.1-3 If broken down by race or ethnicity, the prevalence of psoriasis varies: 2.5% to 3.7% in White adults1-4; 1.3% to 2% in Black adults1-4; 1.6% in Hispanics/ other adults1-3; 1% in children overall; 0.29% in White children1,5; and 0.06% in Black children.1,5
Key clinical features in people with darker skin tones include:
plaques that may appear more violaceous in color instead of pink or erythematous
higher body surface area of involvement4 and thicker, more scaly plaques6
increased likelihood of postinflammatory hyperpigmentation (PIH).
Worth noting Although individuals of all skin tones may experience the psychosocial impact of psoriasis, quality-of-life measures have been found to be worse in those with skin of color (SOC) compared to White patients.1,4 This may be due to the lingering PIH and hypopigmentation that occurs even after inflammatory plaques are treated. Of course, lack of access to care contributes to greater disease burden and more devastating psychological impact.
Health disparity highlight Psoriasis may be underreported and underdiagnosed in individuals with SOC, as factors contributing to health care disparities may play a role, such as access to health care in general,1,7 and access to clinicians proficient in diagnosing cutaneous diseases in SOC may be delayed.8
Biologic medications are used less often in Black patients than in White patients, despite biologic medications being very efficacious for treatment of psoriasis.1,9,10
References
Kaufman BP, Alexis AF. Psoriasis in skin of color: insights into the epidemiology, clinical presentation, genetics, quality-of-life impact, and treatment of psoriasis in non-white racial/ethnic groups. Am J Clin Dermatol. 2018;19:405-423.
Rachakonda TD, Schupp CW, Armstrong AW. Psoriasis prevalence among adults in the United States. J Am Acad Dermatol. 2014;70:512-516.
Helmick CG, Lee-Han H, Hirsch SC, et al. Prevalence of psoriasis among adults in the U.S.: 2003-2006 and 2009-2010 National Health and Nutrition Examination Surveys. Am J Prev Med. 2014;47:37-45.
Gelfand JM, Stern RS, Nijsten T, et al. The prevalence of psoriasis in African Americans: results from a population-based study. J Am Acad Dermatol. 2005;52:23-26.
Wu JJ, Black MH, Smith N, et al. Low prevalence of psoriasis among children and adolescents in a large multiethnic cohort in southern California. J Am Acad Dermatol. 2011;65:957-964.
Davis SA, Narahari S, Feldman SR, et al. Top dermatologic conditions in patients of color: an analysis of nationally representative data. J Drugs Dermatol. 2012;11:466-473.
Alexis AF, Blackcloud P. Psoriasis in skin of color: epidemiology, genetics, clinical presentation, and treatment nuances. J Clin Aesthet Dermatol. 2014;7:16-24.
Mundluru SN, Ramalingam ND, Tran HN. Addressing internal medicine residents’ discomfort with basic dermatology in persons of color in the primary care clinic. Am J Med Qual. 2019;34:513-513.
Kerr GS, Qaiyumi S, Richards J, et al. Psoriasis and psoriatic arthritis in African-American patients—the need to measure disease burden. Clin Rheumatol. 2015;34:1753-1759.
Takeshita J, Gelfand JM, Li P, et al. Psoriasis in the US Medicare population: prevalence, treatment, and factors associated with biologic use. J Invest Dermatol. 2015;135:2955-2963.
A Elbow and forearm with erythematous, well-demarcated, pink plaques with mild micaceous scale in a 42-year-old White woman.
B Elbow and forearm with violaceous, well-demarcated plaques with micaceous scale and hyperpigmented patches around the active plaques in a 58-year-old Black man.
Epidemiology Psoriasis prevalence in the United States has been estimated at 3.7%.1-3 If broken down by race or ethnicity, the prevalence of psoriasis varies: 2.5% to 3.7% in White adults1-4; 1.3% to 2% in Black adults1-4; 1.6% in Hispanics/ other adults1-3; 1% in children overall; 0.29% in White children1,5; and 0.06% in Black children.1,5
Key clinical features in people with darker skin tones include:
plaques that may appear more violaceous in color instead of pink or erythematous
higher body surface area of involvement4 and thicker, more scaly plaques6
increased likelihood of postinflammatory hyperpigmentation (PIH).
Worth noting Although individuals of all skin tones may experience the psychosocial impact of psoriasis, quality-of-life measures have been found to be worse in those with skin of color (SOC) compared to White patients.1,4 This may be due to the lingering PIH and hypopigmentation that occurs even after inflammatory plaques are treated. Of course, lack of access to care contributes to greater disease burden and more devastating psychological impact.
Health disparity highlight Psoriasis may be underreported and underdiagnosed in individuals with SOC, as factors contributing to health care disparities may play a role, such as access to health care in general,1,7 and access to clinicians proficient in diagnosing cutaneous diseases in SOC may be delayed.8
Biologic medications are used less often in Black patients than in White patients, despite biologic medications being very efficacious for treatment of psoriasis.1,9,10
Photographs courtesy of Richard P. Usatine, MD.
The Comparison
A Elbow and forearm with erythematous, well-demarcated, pink plaques with mild micaceous scale in a 42-year-old White woman.
B Elbow and forearm with violaceous, well-demarcated plaques with micaceous scale and hyperpigmented patches around the active plaques in a 58-year-old Black man.
Epidemiology Psoriasis prevalence in the United States has been estimated at 3.7%.1-3 If broken down by race or ethnicity, the prevalence of psoriasis varies: 2.5% to 3.7% in White adults1-4; 1.3% to 2% in Black adults1-4; 1.6% in Hispanics/ other adults1-3; 1% in children overall; 0.29% in White children1,5; and 0.06% in Black children.1,5
Key clinical features in people with darker skin tones include:
plaques that may appear more violaceous in color instead of pink or erythematous
higher body surface area of involvement4 and thicker, more scaly plaques6
increased likelihood of postinflammatory hyperpigmentation (PIH).
Worth noting Although individuals of all skin tones may experience the psychosocial impact of psoriasis, quality-of-life measures have been found to be worse in those with skin of color (SOC) compared to White patients.1,4 This may be due to the lingering PIH and hypopigmentation that occurs even after inflammatory plaques are treated. Of course, lack of access to care contributes to greater disease burden and more devastating psychological impact.
Health disparity highlight Psoriasis may be underreported and underdiagnosed in individuals with SOC, as factors contributing to health care disparities may play a role, such as access to health care in general,1,7 and access to clinicians proficient in diagnosing cutaneous diseases in SOC may be delayed.8
Biologic medications are used less often in Black patients than in White patients, despite biologic medications being very efficacious for treatment of psoriasis.1,9,10
References
Kaufman BP, Alexis AF. Psoriasis in skin of color: insights into the epidemiology, clinical presentation, genetics, quality-of-life impact, and treatment of psoriasis in non-white racial/ethnic groups. Am J Clin Dermatol. 2018;19:405-423.
Rachakonda TD, Schupp CW, Armstrong AW. Psoriasis prevalence among adults in the United States. J Am Acad Dermatol. 2014;70:512-516.
Helmick CG, Lee-Han H, Hirsch SC, et al. Prevalence of psoriasis among adults in the U.S.: 2003-2006 and 2009-2010 National Health and Nutrition Examination Surveys. Am J Prev Med. 2014;47:37-45.
Gelfand JM, Stern RS, Nijsten T, et al. The prevalence of psoriasis in African Americans: results from a population-based study. J Am Acad Dermatol. 2005;52:23-26.
Wu JJ, Black MH, Smith N, et al. Low prevalence of psoriasis among children and adolescents in a large multiethnic cohort in southern California. J Am Acad Dermatol. 2011;65:957-964.
Davis SA, Narahari S, Feldman SR, et al. Top dermatologic conditions in patients of color: an analysis of nationally representative data. J Drugs Dermatol. 2012;11:466-473.
Alexis AF, Blackcloud P. Psoriasis in skin of color: epidemiology, genetics, clinical presentation, and treatment nuances. J Clin Aesthet Dermatol. 2014;7:16-24.
Mundluru SN, Ramalingam ND, Tran HN. Addressing internal medicine residents’ discomfort with basic dermatology in persons of color in the primary care clinic. Am J Med Qual. 2019;34:513-513.
Kerr GS, Qaiyumi S, Richards J, et al. Psoriasis and psoriatic arthritis in African-American patients—the need to measure disease burden. Clin Rheumatol. 2015;34:1753-1759.
Takeshita J, Gelfand JM, Li P, et al. Psoriasis in the US Medicare population: prevalence, treatment, and factors associated with biologic use. J Invest Dermatol. 2015;135:2955-2963.
The historical mistreatment of Black bodies in gynecologic care has bled into present day inequities—from surgeries performed on enslaved Black women and sterilization of low-income Black women under federally funded programs, to higher rates of adverse health-related outcomes among Black women compared with their non-Black counterparts.1-3 Not only is the foundation of gynecology imperfect, so too is its current-day structure.
It is not enough to identify and describe racial inequities in health care; action plans to provide equitable care are called for. In this report, we aim to 1) contextualize the data on disparities in minimally invasive gynecologic surgery, specifically hysterectomy and myomectomy candidates and postsurgical outcomes, and 2) provide recommendations to close racial gaps in gynecologic treatment for more equitable experiences for minority women.
Black women and uterine fibroids
Uterine leiomyomas, or fibroids, are not only the most common benign pelvic tumor but they also cause a significant medical and financial burden in the United States, with estimated direct costs of $4.1 ̶ 9.4 billion.4 Fibroids can affect fertility and cause pain, bulk symptoms, heavy bleeding, anemia requiring blood transfusion, and poor pregnancy outcomes. The burden of disease for uterine fibroids is greatest for Black women. While race is a social construct, women with African ancestry (who we tend to identify as having darker skin) have disproportionately higher rates of uterine fibroids. Black women experience symptoms at a younger age, spanning more of their reproductive years compared with their non-Black counterparts and their disease is often more severe compared with White women.5
The incidence of fibroids is 2 to 3 times higher in Black women compared with White women.5 According to ultrasound-based studies, the prevalence of fibroids among women aged 18 to 30 years was 26% among Black and 7% among White asymptomatic women.6 Earlier onset and more severe symptoms mean that there is a larger potential for impact on fertility for Black women. This coupled with the historical context of mistreatment of Black bodies makes the need for personalized medicine and culturally sensitive care critical. The disproportionately higher rates of uterine fibroids in Black women has been attributed to many factors, including socioeconomic status, health-care access, genetics, and lifestyle and environmental exposures, but the underlying causes of racial/ethnic differences remain unclear.7 Amazingly little data exist not only on patient preferences for management approach but also on the influence of genetic and epigenetic mediators and environmental factors that may play a role in fibroid development to guide optimal management and treatment outcomes for Black women with uterine fibroids.8
Inequitable management of uterine fibroids
Although tumor size, location, and patient risk factors are used to determine the best treatment approach, the American College of Obstetricians and Gynecologists (ACOG) guidelines suggest that the use of alternative treatments to surgery should be first-line management instead of hysterectomy for most benign conditions.9 Conservative management will often help alleviate symptoms, slow the growth of fibroid(s), or bridge women to menopause, and treatment options include hormonal contraception, gonadotropin-releasing hormone agonists, hysteroscopic resection, uterine artery embolization, magnetic resonance-guided focused ultrasound, and myomectomy.
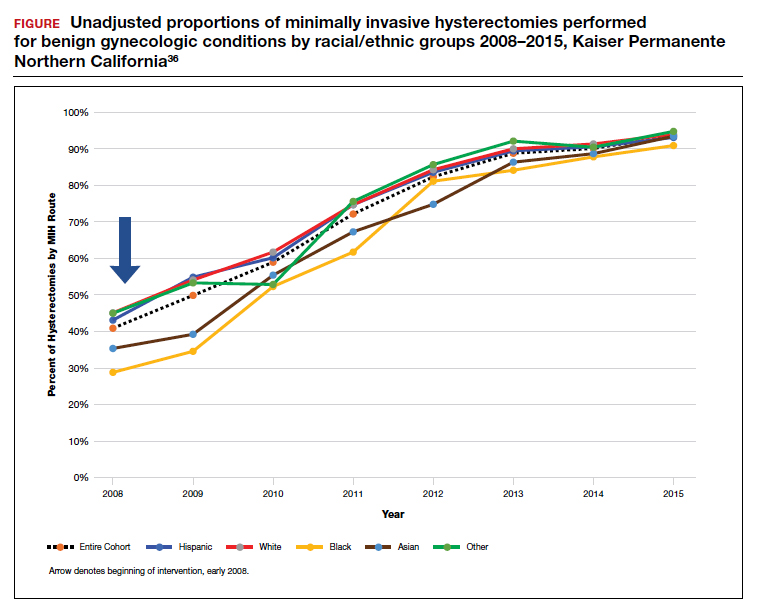
The rate of conservative management prior to hysterectomy varies by setting, reflecting potential bias in treatment decisions. Some medical settings have reported a 29% alternative management rate prior to hysterectomy, while others report much higher rates.10 A study using patient data from Kaiser Permanente Northern California (KPNC) showed that, within a large, diverse, and integrated health care system, more than 80% of patients received alternative treatments before undergoing hysterectomy; for those with symptomatic leiomyomas, 74.1% used alternative treatments prior to hysterectomy, and in logistic regression there was not a difference by race.11 Nationally, Black women are more likely to have hysterectomy or myomectomy compared with a nonsurgical uterine-sparing therapy.12,13
With about 600,000 cases per year within the United States, the hysterectomy is the most frequently performed benign gynecologic surgery.14 The most common indication is for “symptomatic fibroid uterus.” The approach to decision making for route of hysterectomy involves multiple patient and surgeon factors, including history of vaginal delivery, body mass index, history of previous surgery, uterine size, informed patient preference, and surgeon volume.15-17 ACOG recommends a minimally invasive hysterectomy (MIH) whenever feasible given its benefits in postoperative pain, recovery time, and blood loss. Myomectomy, particularly among women in their reproductive years desiring management of leiomyomas, is a uterine-sparing procedure versus hysterectomy. Minimally invasive myomectomy (MIM), compared with an open abdominal route, provides for lower drop in hemoglobin levels, shorter hospital stay, less adhesion formation, and decreased postoperative pain.18
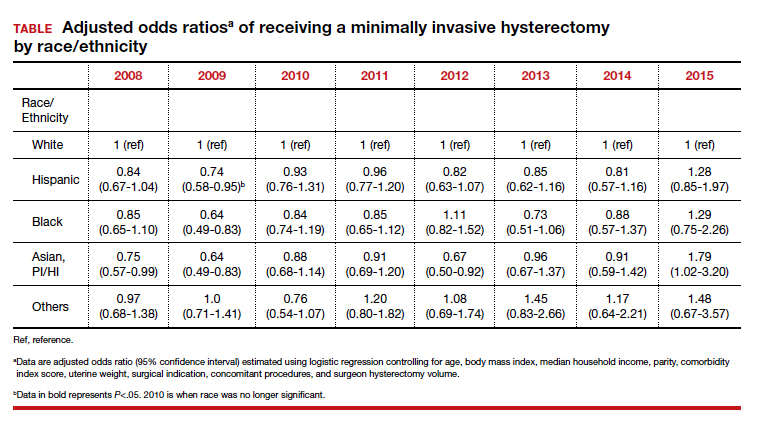
Racial variations in hysterectomy rates persist overall and according to hysterectomy type. Black women are 2 to 3 times more likely to undergo hysterectomy for leiomyomas than other racial groups.19 These differences in rates have been shown to persist even when burden of disease is the same. One study found that Black women had increased odds of hysterectomy compared with their White counterparts even when there was no difference in mean fibroid volume by race,20 calling into question provider bias. Even in a universal insurance setting, Black patients have been found to have higher rates of open hysterectomies.21 Previous studies found that, despite growing frequency of laparoscopic and robotic-assisted hysterectomies, patients of a minority race had decreased odds of undergoing a MIH compared with their White counterparts.22
While little data exist on route of myomectomy by race, a recent study found minority women were more likely to undergo abdominal myomectomy compared with White women; Black women were twice as likely to undergo abdominal myomectomy (adjusted odds ratio [aOR], 1.9; 95% confidence interval [CI], 1.7–2.0), Asian American women were more than twice as likely (aOR, 2.3; 95% CI, 1.8–2.8), and Hispanic American women were 50% more likely to undergo abdominal myomectomy (aOR, 1.5; 95% CI, 1.2–1.9) when compared with White women.23 These differences remained after controlling for potential confounders, and there appeared to be an interaction between race and fibroid weight such that racial bias alone may not explain the differences.
Finally, Black women have higher perioperative complication rates compared with non-Black women. Postoperative complications including blood transfusion after myomectomy have been shown to be twice as high among Black women compared with White women. However, once uterine size, comorbidities, and fibroid number were controlled, race was not associated with higher complications. Black women, compared with White women, have been found to have 50% increased odds of morbidity after an abdominal myomectomy.24
Continue to: How to ensure that BIPOC women get the best management...
How to ensure that BIPOC women get the best management
Eliminating disparities and providing equitable and patient-centered care for Black, Indigenous, and people of color (BIPOC) womenwill require research, education, training, and targeted quality improvement initiatives.
Research into fibroids and comparative treatment outcomes
Uterine fibroids, despite their major public health impact, remain understudied. With Black women carrying the highest fibroid prevalence and severity burden, especially in their childbearing years, it is imperative that research efforts be focused on outcomes by race and ethnicity. Given the significant economic impact of fibroids, more efforts should be directed toward primary prevention of fibroid formation as well as secondary prevention and limitation of fibroid growth by affordable, effective, and safe means. For example, Bratka and colleagues researched the role of vitamin D in inhibiting growth of leiomyoma cells in animal models.25Other innovative forms of management under investigation include aromatase inhibitors, green tea, cabergoline, elagolix, paricalcitol, and epigallocatechin gallate.26 Considerations such as stress, diet, and environmental risk factors have yet to be investigated in large studies.
Research contributing to evidence-based guidelines that address the needs of different patient populations affected by uterine fibroids is critical.8 Additionally, research conducted by Black women about Black women should be prioritized. In March 2021, the Stephanie Tubbs Jones Uterine Fibroid Research and Education Act of 2021 was introduced to fund $150 million in research supported by the National Institutes of Health (NIH). This is an opportunity to develop a research database to inform evidence-based culturally informed care regarding fertility counseling, medical management, and optimal surgical approach, as well as to award funding to minority researchers. There are disparities in distribution of funds from the NIH to minority researchers. Under-represented minorities are awarded fewer NIH grants compared with their counterparts despite initiatives to increase funding. Furthermore, in 2011, Black applicants for NIH funding were two-thirds as likely as White applicants to receive grants from 2000 ̶ 2006, even when accounting for publication record and training.27 Funding BIPOC researchers fuels diversity-driven investigation and can be useful in the charge to increase fibroid research.
Education and training: Changing the work force
Achieving equity requires change in provider work force. In a study of trends across multiple specialties including obstetrics and gynecology, Blacks and Latinx are more under-represented in 2016 than in 1990 across all specialties except for Black women in obstetrics and gynecology.28 It is well documented that under-represented minorities are more likely to engage in practice, research, service, and mentorship activities aligned with their identity.29 As a higher proportion of under-represented minority obstetricians and gynecologists practice in medically underserved areas,30 this presents a unique opportunity for gynecologists to improve care for and increase research involvement among BIPOC women.
Increasing BIPOC representation in medical and health care institutions and practices is not enough, however, to achieve health equity. Data from the Association of American Medical Colleges demonstrate that between 1978 and 2017 the total number of full-time obstetrics and gynecology faculty rose nearly fourfold from 1,688 to 6,347; however, the greatest rise in proportion of faculty who were nontenured was among women who were under-represented minorities.31 Additionally, there are disparities in wage by race even after controlling for hours worked and state of residence.32 Medical and academic centers and health care institutions and practices should proactively and systematically engage in the recruitment and retention of under-represented minority physicians and people in leadership roles. This will involve creating safe and inclusive work environments, with equal pay and promotion structures.
Quality initiatives to address provider bias
Provider bias should be addressed in clinical decision making and counseling of patients. Studies focused on ultrasonography have shown an estimated cumulative incidence of fibroids by age 50 of greater than 80% for Black women and nearly 70% for White women.5 Due to the prevalence and burden of fibroids among Black women there may be a provider bias in approach to management. Addressing this bias requires quality improvement efforts and investigation into patient and provider factors in management of fibroids. Black women have been a vulnerable population in medicine due to instances of mistreatment, and often times mistrust can play a role in how a patient views his or her care decisions. A patient-centered strategy allows patient factors such as age, uterine size, and cultural background to be considered such that a provider can tailor an approach that is best for the patient. Previous minority women focus groups have demonstrated that women have a strong desire for elective treatment;33 therefore, providers should listen openly to patients about their values and their perspectives on how fibroids affect their lives. Provider bias toward surgical volume, incentive for surgery, and implicit bias need to be addressed at every institution to work toward equitable and cost-effective care.
Integrated health care systems like Southern and Northern California Permanente Medical Group, using quality initiatives, have increased their minimally invasive surgery rates. Southern California Permanente Medical Group reached a 78% rate of MIH in a system of more than 350 surgeons performing benign indication hysterectomies as reported in 2011.34 Similarly, a study within KPNC, an institution with an MIH rate greater than 95%,35 found that racial disparities in route of MIH were eliminated through a quality improvement initiative described in detail in 2018 (FIGURE and TABLE).36
Conclusions
There are recognized successes in the gynecology field’s efforts to address racial disparities. Prior studies provide insight into opportunities to improve care in medical management of leiomyomas, minimally invasive route of hysterectomy and myomectomy, postsurgical outcomes, and institutional leadership. Particularly, when systemwide approaches are taken in the delivery of health care it is possible to significantly diminish racial disparities in gynecology.35 Much work remains to be done for our health care systems to provide equitable care.
References
Ojanuga D. The medical ethics of the ‘father of gynaecology,’ Dr J Marion Sims. J Med Ethics. 1993;19:28-31. doi: 10.1136/jme.19.1.28.
Borrero S, Zite N, Creinin MD. Federally funded sterilization: time to rethink policy? Am J Public Health. 2012;102:1822-1825.
Eaglehouse YL, Georg MW, Shriver CD, et al. Racial differences in time to breast cancer surgery and overall survival in the US Military Health System. JAMA Surg. 2019;154:e185113. doi: 10.1001/jamasurg.2018.5113.
Soliman AM, Yang H, Du EX, et al. The direct and indirect costs of uterine fibroid tumors: a systematic review of the literature between 2000 and 2013. Am J Obstet Gynecol. 2015;213:141-160.
Baird DD, Dunson DB, Hill MC, et al. High cumulative incidence of uterine leiomyoma in black and white women: ultrasound evidence. Am J Obstet Gynecol. 2003;188:100-107.
Marshall LM, Spiegelman D, Barbieri RL, et al. Variation in the incidence of uterine leiomyoma among premenopausal women by age and race. Obstet Gynecol. 1997;90:967-973. doi: 10.1016/s0029-7844(97)00534-6.
Styer AK, Rueda BR. The epidemiology and genetics of uterine leiomyoma. Best Pract Res Clin Obstet Gynaecol. 2016;34:3-12. doi: 10.1016/j.bpobgyn.2015.11.018.
Al-Hendy A, Myers ER, Stewart E. Uterine fibroids: burden and unmet medical need. Semin Reprod Med. 2017;35:473-480. doi: 10.1055/s-0037-1607264.
American College of Obstetricians and Gynecologists. ACOG practice bulletin. Alternatives to hysterectomy in the management of leiomyomas. Obstet Gynecol. 2008;112(2 pt 1):387-400.
Corona LE, Swenson CW, Sheetz KH, et al. Use of other treatments before hysterectomy for benign conditions in a statewide hospital collaborative. Am J Obstet Gynecol. 2015;212:304.e1-e7. doi: 10.1016/j.ajog.2014.11.031.
Nguyen NT, Merchant M, Ritterman Weintraub ML, et al. Alternative treatment utilization before hysterectomy for benign gynecologic conditions at a large integrated health system. J Minim Invasive Gynecol. 2019;26:847-855. doi: 10.1016/j.jmig.2018.08.013.
Laughlin-Tommaso SK, Jacoby VL, Myers ER. Disparities in fibroid incidence, prognosis, and management. Obstet Gynecol Clin North Am. 2017;44:81-94. doi: 10.1016/j.ogc.2016.11.007.
Borah BJ, Laughlin-Tommaso SK, Myers ER, et al. Association between patient characteristics and treatment procedure among patients with uterine leiomyomas. Obstet Gynecol. 2016;127:67-77.
Whiteman MK, Hillis SD, Jamieson DJ, et al. Inpatient hysterectomy surveillance in the United States, 2000-2004. Am J Obstet Gynecol. 2008;198:34.e1-e7. doi:10.1016/j.ajog.2007.05.039.
Bardens D, Solomayer E, Baum S, et al. The impact of the body mass index (BMI) on laparoscopic hysterectomy for benign disease. Arch Gynecol Obstet. 2014;289:803-807. doi: 10.1007/s00404-013-3050-2.
Seracchioli R, Venturoli S, Vianello F, et al. Total laparoscopic hysterectomy compared with abdominal hysterectomy in the presence of a large uterus. J Am Assoc Gynecol Laparosc. 2002;9:333-338. doi: 10.1016/s1074-3804(05)60413.
Boyd LR, Novetsky AP, Curtin JP. Effect of surgical volume on route of hysterectomy and short-term morbidity. Obstet Gynecol. 2010;116:909-915. doi: 10.1097/AOG.0b013e3181f395d9.
Jin C, Hu Y, Chen XC, et al. Laparoscopic versus open myomectomy—a meta-analysis of randomized controlled trials. Eur J Obstet Gynecol Reprod Biol. 2009;145:14-21. doi: 10.1016/j.ejogrb.2009.03.009.
Wechter ME, Stewart EA, Myers ER, et al. Leiomyoma-related hospitalization and surgery: prevalence and predicted growth based on population trends. Am J Obstet Gynecol. 2011;205:492.e1-e5. doi: 10.1016/j.ajog.2011.07.008.
Bower JK, Schreiner PJ, Sternfeld B, et al. Black-White differences in hysterectomy prevalence: the CARDIA study. Am J Public Health. 2009;99:300-307. doi: 10.2105/AJPH.2008.133702.
Ranjit A, Sharma M, Romano A, et al. Does universal insurance mitigate racial differences in minimally invasive hysterectomy?J Minim Invasive Gynecol. 2017;24. doi:10.1016/j.jmig.2017.03.016.
Pollack LM, Olsen MA, Gehlert SJ, et al. Racial/ethnic disparities/differences in hysterectomy route in women likely eligible for minimally invasive surgery. J Minim Invasive Gynecol. 2020;27:1167-1177.e2. doi:10.1016/j.jmig.2019.09.003.
Stentz NC, Cooney LG, Sammel MD, et al. Association of patient race with surgical practice and perioperative morbidity after myomectomy. Obstet Gynecol. 2018;132:291-297. doi: 10.1097/AOG.0000000000002738.
Roth TM, Gustilo-Ashby T, Barber MD, et al. Effects of race and clinical factors on short-term outcomes of abdominal myomectomy. Obstet Gynecol. 2003;101(5 pt 1):881-884. doi: 10.1016/s0029-7844(03)00015-2.
Bratka S, Diamond JS, Al-Hendy A, et al. The role of vitamin D in uterine fibroid biology. Fertil Steril. 2015;104:698-706. doi: 10.1016/j.fertnstert.2015.05.031.
Ciebiera M, Łukaszuk K, Męczekalski B, et al. Alternative oral agents in prophylaxis and therapy of uterine fibroids—an up-to-date review. Int J Mol Sci. 2017;18:2586. doi:10.3390/ijms18122586.
Lett LA, Orji WU, Sebro R. Declining racial and ethnic representation in clinical academic medicine: a longitudinal study of 16 US medical specialties. PLoS One. 2018;13:e0207274. doi: 10.1371/journal.pone.0207274.
Sánchez JP, Poll-Hunter N, Stern N, et al. Balancing two cultures: American Indian/Alaska Native medical students’ perceptions of academic medicine careers. J Community Health. 2016;41:871-880.
Rayburn WF, Xierali IM, Castillo-Page L, et al. Racial and ethnic differences between obstetrician-gynecologists and other adult medical specialists. Obstet Gynecol. 2016;127:148-152. doi: 10.1097/AOG.0000000000001184.
Esters D, Xierali IM, Nivet MA, et al. The rise of nontenured faculty in obstetrics and gynecology by sex and underrepresented in medicine status. Obstet Gynecol. 2019;134 suppl 1:34S-39S. doi: 10.1097/AOG.0000000000003484.
Ly DP, Seabury SA, Jena AB. Differences in incomes of physicians in the United States by race and sex: observational study. BMJ. 2016;I2923. doi:10.1136/bmj.i2923.
Groff JY, Mullen PD, Byrd T, et al. Decision making, beliefs, and attitudes toward hysterectomy: a focus group study with medically underserved women in Texas. J Womens Health Gend Based Med. 2000;9 suppl 2:S39-50. doi: 10.1089/152460900318759.
Andryjowicz E, Wray T. Regional expansion of minimally invasive surgery for hysterectomy: implementation and methodology in a large multispecialty group. Perm J. 2011;15:42-46.
Zaritsky E, Ojo A, Tucker LY, et al. Racial disparities in route of hysterectomy for benign indications within an integrated health care system. JAMA Netw Open. 2019;2:e1917004. doi: 10.1001/jamanetworkopen.2019.17004.
Abel MK, Kho KA, Walter A, et al. Measuring quality in minimally invasive gynecologic surgery: what, how, and why? J Minim Invasive Gynecol. 2019;26:321-326. doi: 10.1016/j.jmig.2018.11.013.
Author and Disclosure Information
Dr. Zaritsky is Minimally Invasive Gynecologic Surgeon and Assistant Residency Program Director, Kaiser Permanente Northern California, Oakland Medical Center.
Dr. Ojo is a Chief Resident in Obstetrics & Gynecology, Kaiser Permanente Northern California.
Dr. Ritterman Weintraub is Senior Research Project ManagerGraduate Medical Education, Kaiser Permanente Northern California.
Dr. Raine-Bennett isSenior Staff Physician and Senior Research Scientist in Division of Research, Obstetrics & Gynecology, Kaiser Permanente Northern California.
The authors report no financial relationships relevant to this article.
Author and Disclosure Information
Dr. Zaritsky is Minimally Invasive Gynecologic Surgeon and Assistant Residency Program Director, Kaiser Permanente Northern California, Oakland Medical Center.
Dr. Ojo is a Chief Resident in Obstetrics & Gynecology, Kaiser Permanente Northern California.
Dr. Ritterman Weintraub is Senior Research Project ManagerGraduate Medical Education, Kaiser Permanente Northern California.
Dr. Raine-Bennett isSenior Staff Physician and Senior Research Scientist in Division of Research, Obstetrics & Gynecology, Kaiser Permanente Northern California.
The authors report no financial relationships relevant to this article.
The historical mistreatment of Black bodies in gynecologic care has bled into present day inequities—from surgeries performed on enslaved Black women and sterilization of low-income Black women under federally funded programs, to higher rates of adverse health-related outcomes among Black women compared with their non-Black counterparts.1-3 Not only is the foundation of gynecology imperfect, so too is its current-day structure.
It is not enough to identify and describe racial inequities in health care; action plans to provide equitable care are called for. In this report, we aim to 1) contextualize the data on disparities in minimally invasive gynecologic surgery, specifically hysterectomy and myomectomy candidates and postsurgical outcomes, and 2) provide recommendations to close racial gaps in gynecologic treatment for more equitable experiences for minority women.
Black women and uterine fibroids
Uterine leiomyomas, or fibroids, are not only the most common benign pelvic tumor but they also cause a significant medical and financial burden in the United States, with estimated direct costs of $4.1 ̶ 9.4 billion.4 Fibroids can affect fertility and cause pain, bulk symptoms, heavy bleeding, anemia requiring blood transfusion, and poor pregnancy outcomes. The burden of disease for uterine fibroids is greatest for Black women. While race is a social construct, women with African ancestry (who we tend to identify as having darker skin) have disproportionately higher rates of uterine fibroids. Black women experience symptoms at a younger age, spanning more of their reproductive years compared with their non-Black counterparts and their disease is often more severe compared with White women.5
The incidence of fibroids is 2 to 3 times higher in Black women compared with White women.5 According to ultrasound-based studies, the prevalence of fibroids among women aged 18 to 30 years was 26% among Black and 7% among White asymptomatic women.6 Earlier onset and more severe symptoms mean that there is a larger potential for impact on fertility for Black women. This coupled with the historical context of mistreatment of Black bodies makes the need for personalized medicine and culturally sensitive care critical. The disproportionately higher rates of uterine fibroids in Black women has been attributed to many factors, including socioeconomic status, health-care access, genetics, and lifestyle and environmental exposures, but the underlying causes of racial/ethnic differences remain unclear.7 Amazingly little data exist not only on patient preferences for management approach but also on the influence of genetic and epigenetic mediators and environmental factors that may play a role in fibroid development to guide optimal management and treatment outcomes for Black women with uterine fibroids.8
Inequitable management of uterine fibroids
Although tumor size, location, and patient risk factors are used to determine the best treatment approach, the American College of Obstetricians and Gynecologists (ACOG) guidelines suggest that the use of alternative treatments to surgery should be first-line management instead of hysterectomy for most benign conditions.9 Conservative management will often help alleviate symptoms, slow the growth of fibroid(s), or bridge women to menopause, and treatment options include hormonal contraception, gonadotropin-releasing hormone agonists, hysteroscopic resection, uterine artery embolization, magnetic resonance-guided focused ultrasound, and myomectomy.
The rate of conservative management prior to hysterectomy varies by setting, reflecting potential bias in treatment decisions. Some medical settings have reported a 29% alternative management rate prior to hysterectomy, while others report much higher rates.10 A study using patient data from Kaiser Permanente Northern California (KPNC) showed that, within a large, diverse, and integrated health care system, more than 80% of patients received alternative treatments before undergoing hysterectomy; for those with symptomatic leiomyomas, 74.1% used alternative treatments prior to hysterectomy, and in logistic regression there was not a difference by race.11 Nationally, Black women are more likely to have hysterectomy or myomectomy compared with a nonsurgical uterine-sparing therapy.12,13
With about 600,000 cases per year within the United States, the hysterectomy is the most frequently performed benign gynecologic surgery.14 The most common indication is for “symptomatic fibroid uterus.” The approach to decision making for route of hysterectomy involves multiple patient and surgeon factors, including history of vaginal delivery, body mass index, history of previous surgery, uterine size, informed patient preference, and surgeon volume.15-17 ACOG recommends a minimally invasive hysterectomy (MIH) whenever feasible given its benefits in postoperative pain, recovery time, and blood loss. Myomectomy, particularly among women in their reproductive years desiring management of leiomyomas, is a uterine-sparing procedure versus hysterectomy. Minimally invasive myomectomy (MIM), compared with an open abdominal route, provides for lower drop in hemoglobin levels, shorter hospital stay, less adhesion formation, and decreased postoperative pain.18
Racial variations in hysterectomy rates persist overall and according to hysterectomy type. Black women are 2 to 3 times more likely to undergo hysterectomy for leiomyomas than other racial groups.19 These differences in rates have been shown to persist even when burden of disease is the same. One study found that Black women had increased odds of hysterectomy compared with their White counterparts even when there was no difference in mean fibroid volume by race,20 calling into question provider bias. Even in a universal insurance setting, Black patients have been found to have higher rates of open hysterectomies.21 Previous studies found that, despite growing frequency of laparoscopic and robotic-assisted hysterectomies, patients of a minority race had decreased odds of undergoing a MIH compared with their White counterparts.22
While little data exist on route of myomectomy by race, a recent study found minority women were more likely to undergo abdominal myomectomy compared with White women; Black women were twice as likely to undergo abdominal myomectomy (adjusted odds ratio [aOR], 1.9; 95% confidence interval [CI], 1.7–2.0), Asian American women were more than twice as likely (aOR, 2.3; 95% CI, 1.8–2.8), and Hispanic American women were 50% more likely to undergo abdominal myomectomy (aOR, 1.5; 95% CI, 1.2–1.9) when compared with White women.23 These differences remained after controlling for potential confounders, and there appeared to be an interaction between race and fibroid weight such that racial bias alone may not explain the differences.
Finally, Black women have higher perioperative complication rates compared with non-Black women. Postoperative complications including blood transfusion after myomectomy have been shown to be twice as high among Black women compared with White women. However, once uterine size, comorbidities, and fibroid number were controlled, race was not associated with higher complications. Black women, compared with White women, have been found to have 50% increased odds of morbidity after an abdominal myomectomy.24
Continue to: How to ensure that BIPOC women get the best management...
How to ensure that BIPOC women get the best management
Eliminating disparities and providing equitable and patient-centered care for Black, Indigenous, and people of color (BIPOC) womenwill require research, education, training, and targeted quality improvement initiatives.
Research into fibroids and comparative treatment outcomes
Uterine fibroids, despite their major public health impact, remain understudied. With Black women carrying the highest fibroid prevalence and severity burden, especially in their childbearing years, it is imperative that research efforts be focused on outcomes by race and ethnicity. Given the significant economic impact of fibroids, more efforts should be directed toward primary prevention of fibroid formation as well as secondary prevention and limitation of fibroid growth by affordable, effective, and safe means. For example, Bratka and colleagues researched the role of vitamin D in inhibiting growth of leiomyoma cells in animal models.25Other innovative forms of management under investigation include aromatase inhibitors, green tea, cabergoline, elagolix, paricalcitol, and epigallocatechin gallate.26 Considerations such as stress, diet, and environmental risk factors have yet to be investigated in large studies.
Research contributing to evidence-based guidelines that address the needs of different patient populations affected by uterine fibroids is critical.8 Additionally, research conducted by Black women about Black women should be prioritized. In March 2021, the Stephanie Tubbs Jones Uterine Fibroid Research and Education Act of 2021 was introduced to fund $150 million in research supported by the National Institutes of Health (NIH). This is an opportunity to develop a research database to inform evidence-based culturally informed care regarding fertility counseling, medical management, and optimal surgical approach, as well as to award funding to minority researchers. There are disparities in distribution of funds from the NIH to minority researchers. Under-represented minorities are awarded fewer NIH grants compared with their counterparts despite initiatives to increase funding. Furthermore, in 2011, Black applicants for NIH funding were two-thirds as likely as White applicants to receive grants from 2000 ̶ 2006, even when accounting for publication record and training.27 Funding BIPOC researchers fuels diversity-driven investigation and can be useful in the charge to increase fibroid research.
Education and training: Changing the work force
Achieving equity requires change in provider work force. In a study of trends across multiple specialties including obstetrics and gynecology, Blacks and Latinx are more under-represented in 2016 than in 1990 across all specialties except for Black women in obstetrics and gynecology.28 It is well documented that under-represented minorities are more likely to engage in practice, research, service, and mentorship activities aligned with their identity.29 As a higher proportion of under-represented minority obstetricians and gynecologists practice in medically underserved areas,30 this presents a unique opportunity for gynecologists to improve care for and increase research involvement among BIPOC women.
Increasing BIPOC representation in medical and health care institutions and practices is not enough, however, to achieve health equity. Data from the Association of American Medical Colleges demonstrate that between 1978 and 2017 the total number of full-time obstetrics and gynecology faculty rose nearly fourfold from 1,688 to 6,347; however, the greatest rise in proportion of faculty who were nontenured was among women who were under-represented minorities.31 Additionally, there are disparities in wage by race even after controlling for hours worked and state of residence.32 Medical and academic centers and health care institutions and practices should proactively and systematically engage in the recruitment and retention of under-represented minority physicians and people in leadership roles. This will involve creating safe and inclusive work environments, with equal pay and promotion structures.
Quality initiatives to address provider bias
Provider bias should be addressed in clinical decision making and counseling of patients. Studies focused on ultrasonography have shown an estimated cumulative incidence of fibroids by age 50 of greater than 80% for Black women and nearly 70% for White women.5 Due to the prevalence and burden of fibroids among Black women there may be a provider bias in approach to management. Addressing this bias requires quality improvement efforts and investigation into patient and provider factors in management of fibroids. Black women have been a vulnerable population in medicine due to instances of mistreatment, and often times mistrust can play a role in how a patient views his or her care decisions. A patient-centered strategy allows patient factors such as age, uterine size, and cultural background to be considered such that a provider can tailor an approach that is best for the patient. Previous minority women focus groups have demonstrated that women have a strong desire for elective treatment;33 therefore, providers should listen openly to patients about their values and their perspectives on how fibroids affect their lives. Provider bias toward surgical volume, incentive for surgery, and implicit bias need to be addressed at every institution to work toward equitable and cost-effective care.
Integrated health care systems like Southern and Northern California Permanente Medical Group, using quality initiatives, have increased their minimally invasive surgery rates. Southern California Permanente Medical Group reached a 78% rate of MIH in a system of more than 350 surgeons performing benign indication hysterectomies as reported in 2011.34 Similarly, a study within KPNC, an institution with an MIH rate greater than 95%,35 found that racial disparities in route of MIH were eliminated through a quality improvement initiative described in detail in 2018 (FIGURE and TABLE).36
Conclusions
There are recognized successes in the gynecology field’s efforts to address racial disparities. Prior studies provide insight into opportunities to improve care in medical management of leiomyomas, minimally invasive route of hysterectomy and myomectomy, postsurgical outcomes, and institutional leadership. Particularly, when systemwide approaches are taken in the delivery of health care it is possible to significantly diminish racial disparities in gynecology.35 Much work remains to be done for our health care systems to provide equitable care.
References
Ojanuga D. The medical ethics of the ‘father of gynaecology,’ Dr J Marion Sims. J Med Ethics. 1993;19:28-31. doi: 10.1136/jme.19.1.28.
Borrero S, Zite N, Creinin MD. Federally funded sterilization: time to rethink policy? Am J Public Health. 2012;102:1822-1825.
Eaglehouse YL, Georg MW, Shriver CD, et al. Racial differences in time to breast cancer surgery and overall survival in the US Military Health System. JAMA Surg. 2019;154:e185113. doi: 10.1001/jamasurg.2018.5113.
Soliman AM, Yang H, Du EX, et al. The direct and indirect costs of uterine fibroid tumors: a systematic review of the literature between 2000 and 2013. Am J Obstet Gynecol. 2015;213:141-160.
Baird DD, Dunson DB, Hill MC, et al. High cumulative incidence of uterine leiomyoma in black and white women: ultrasound evidence. Am J Obstet Gynecol. 2003;188:100-107.
Marshall LM, Spiegelman D, Barbieri RL, et al. Variation in the incidence of uterine leiomyoma among premenopausal women by age and race. Obstet Gynecol. 1997;90:967-973. doi: 10.1016/s0029-7844(97)00534-6.
Styer AK, Rueda BR. The epidemiology and genetics of uterine leiomyoma. Best Pract Res Clin Obstet Gynaecol. 2016;34:3-12. doi: 10.1016/j.bpobgyn.2015.11.018.
Al-Hendy A, Myers ER, Stewart E. Uterine fibroids: burden and unmet medical need. Semin Reprod Med. 2017;35:473-480. doi: 10.1055/s-0037-1607264.
American College of Obstetricians and Gynecologists. ACOG practice bulletin. Alternatives to hysterectomy in the management of leiomyomas. Obstet Gynecol. 2008;112(2 pt 1):387-400.
Corona LE, Swenson CW, Sheetz KH, et al. Use of other treatments before hysterectomy for benign conditions in a statewide hospital collaborative. Am J Obstet Gynecol. 2015;212:304.e1-e7. doi: 10.1016/j.ajog.2014.11.031.
Nguyen NT, Merchant M, Ritterman Weintraub ML, et al. Alternative treatment utilization before hysterectomy for benign gynecologic conditions at a large integrated health system. J Minim Invasive Gynecol. 2019;26:847-855. doi: 10.1016/j.jmig.2018.08.013.
Laughlin-Tommaso SK, Jacoby VL, Myers ER. Disparities in fibroid incidence, prognosis, and management. Obstet Gynecol Clin North Am. 2017;44:81-94. doi: 10.1016/j.ogc.2016.11.007.
Borah BJ, Laughlin-Tommaso SK, Myers ER, et al. Association between patient characteristics and treatment procedure among patients with uterine leiomyomas. Obstet Gynecol. 2016;127:67-77.
Whiteman MK, Hillis SD, Jamieson DJ, et al. Inpatient hysterectomy surveillance in the United States, 2000-2004. Am J Obstet Gynecol. 2008;198:34.e1-e7. doi:10.1016/j.ajog.2007.05.039.
Bardens D, Solomayer E, Baum S, et al. The impact of the body mass index (BMI) on laparoscopic hysterectomy for benign disease. Arch Gynecol Obstet. 2014;289:803-807. doi: 10.1007/s00404-013-3050-2.
Seracchioli R, Venturoli S, Vianello F, et al. Total laparoscopic hysterectomy compared with abdominal hysterectomy in the presence of a large uterus. J Am Assoc Gynecol Laparosc. 2002;9:333-338. doi: 10.1016/s1074-3804(05)60413.
Boyd LR, Novetsky AP, Curtin JP. Effect of surgical volume on route of hysterectomy and short-term morbidity. Obstet Gynecol. 2010;116:909-915. doi: 10.1097/AOG.0b013e3181f395d9.
Jin C, Hu Y, Chen XC, et al. Laparoscopic versus open myomectomy—a meta-analysis of randomized controlled trials. Eur J Obstet Gynecol Reprod Biol. 2009;145:14-21. doi: 10.1016/j.ejogrb.2009.03.009.
Wechter ME, Stewart EA, Myers ER, et al. Leiomyoma-related hospitalization and surgery: prevalence and predicted growth based on population trends. Am J Obstet Gynecol. 2011;205:492.e1-e5. doi: 10.1016/j.ajog.2011.07.008.
Bower JK, Schreiner PJ, Sternfeld B, et al. Black-White differences in hysterectomy prevalence: the CARDIA study. Am J Public Health. 2009;99:300-307. doi: 10.2105/AJPH.2008.133702.
Ranjit A, Sharma M, Romano A, et al. Does universal insurance mitigate racial differences in minimally invasive hysterectomy?J Minim Invasive Gynecol. 2017;24. doi:10.1016/j.jmig.2017.03.016.
Pollack LM, Olsen MA, Gehlert SJ, et al. Racial/ethnic disparities/differences in hysterectomy route in women likely eligible for minimally invasive surgery. J Minim Invasive Gynecol. 2020;27:1167-1177.e2. doi:10.1016/j.jmig.2019.09.003.
Stentz NC, Cooney LG, Sammel MD, et al. Association of patient race with surgical practice and perioperative morbidity after myomectomy. Obstet Gynecol. 2018;132:291-297. doi: 10.1097/AOG.0000000000002738.
Roth TM, Gustilo-Ashby T, Barber MD, et al. Effects of race and clinical factors on short-term outcomes of abdominal myomectomy. Obstet Gynecol. 2003;101(5 pt 1):881-884. doi: 10.1016/s0029-7844(03)00015-2.
Bratka S, Diamond JS, Al-Hendy A, et al. The role of vitamin D in uterine fibroid biology. Fertil Steril. 2015;104:698-706. doi: 10.1016/j.fertnstert.2015.05.031.
Ciebiera M, Łukaszuk K, Męczekalski B, et al. Alternative oral agents in prophylaxis and therapy of uterine fibroids—an up-to-date review. Int J Mol Sci. 2017;18:2586. doi:10.3390/ijms18122586.
Lett LA, Orji WU, Sebro R. Declining racial and ethnic representation in clinical academic medicine: a longitudinal study of 16 US medical specialties. PLoS One. 2018;13:e0207274. doi: 10.1371/journal.pone.0207274.
Sánchez JP, Poll-Hunter N, Stern N, et al. Balancing two cultures: American Indian/Alaska Native medical students’ perceptions of academic medicine careers. J Community Health. 2016;41:871-880.
Rayburn WF, Xierali IM, Castillo-Page L, et al. Racial and ethnic differences between obstetrician-gynecologists and other adult medical specialists. Obstet Gynecol. 2016;127:148-152. doi: 10.1097/AOG.0000000000001184.
Esters D, Xierali IM, Nivet MA, et al. The rise of nontenured faculty in obstetrics and gynecology by sex and underrepresented in medicine status. Obstet Gynecol. 2019;134 suppl 1:34S-39S. doi: 10.1097/AOG.0000000000003484.
Ly DP, Seabury SA, Jena AB. Differences in incomes of physicians in the United States by race and sex: observational study. BMJ. 2016;I2923. doi:10.1136/bmj.i2923.
Groff JY, Mullen PD, Byrd T, et al. Decision making, beliefs, and attitudes toward hysterectomy: a focus group study with medically underserved women in Texas. J Womens Health Gend Based Med. 2000;9 suppl 2:S39-50. doi: 10.1089/152460900318759.
Andryjowicz E, Wray T. Regional expansion of minimally invasive surgery for hysterectomy: implementation and methodology in a large multispecialty group. Perm J. 2011;15:42-46.
Zaritsky E, Ojo A, Tucker LY, et al. Racial disparities in route of hysterectomy for benign indications within an integrated health care system. JAMA Netw Open. 2019;2:e1917004. doi: 10.1001/jamanetworkopen.2019.17004.
Abel MK, Kho KA, Walter A, et al. Measuring quality in minimally invasive gynecologic surgery: what, how, and why? J Minim Invasive Gynecol. 2019;26:321-326. doi: 10.1016/j.jmig.2018.11.013.
Bullying in academic medicine, especially among women, is rife, underreported, and remains largely unaddressed, new research suggests.
Investigators reviewed close to 70 studies, encompassing over 82,000 medical consultants or trainees in academic medical settings, and found that men were identified as the most common perpetrators – close to 70% of respondents – whereas women were the most common victims (56%).
Collectively, respondents in all of the studies identified the most common bullies to be consultants (54%), followed by residents (22%), and nurses (15%).
Disturbingly, less than one-third of victims overall reported that they were bullied, and close to 60% who formally reported the abuse said they did not have a positive outcome.
“We found that bullies are commonly men and senior consultants, while more than half of their victims are women,” senior author Harriette G.C. Van Spall, MD, MPH, associate professor of medicine and director of e-health and virtual care, Division of Cardiology, McMaster University, Hamilton, Ont., said in an interview.
“The greatest barriers to addressing academic bullying are the fear of reprisal, lack of impact of reporting, and non-enforcement of anti-bullying policies,” she added.
The study was “inspired by experiences that I endured over a period of time and am grateful to have survived,” said Dr. Van Spall.
“Some behaviors were excruciating to deal with, protesting against them would bring more on, and every day was filled with dread. It took sheer will to show up at work to care for patients, to complete research I was leading, and to have hope, and my academic output, income, and personal well-being dropped during those years,” she added.
Dr. Van Spall thought the subject “merited research because our performance as clinicians, researchers, and educators relies on our work environment.”
To investigate, the researchers reviewed 68 studies (n = 82,349 respondents) conducted between 1999 and 2021 in academic medical settings, in which victims were either consultants or trainees. Many of the studies (31) were conducted in the U.S.
Other countries included the United Kingdom, Canada, Australia, Pakistan, Egypt, Iran, Turkey, New Zealand, Lithuania, Greece, India, Germany, Nigeria, Oman, and Finland.
Studies were required to describe the method and impact of bullying; characteristics of the perpetrators and victims; or interventions that were used to address the bullying.
“Bullying” was defined as “the abuse of authority by a perpetrator who targets the victim in an academic setting through punishing behaviors that include overwork, destabilization, and isolation in order to impede the education or career of the target.”
Systemic sexism
Bullying behaviors, reported in 28 studies (n = 35,779 respondents), were grouped into destabilization, threats to professional status, overwork, and isolation, with overwork found to be the most common form of bullying.
The most common impact of being bullied was psychological distress, reported by 39.1% of respondents in 14 studies, followed by considerations of quitting (35.9%; 7 studies), and worsening of clinical performance (34.6%, 8 studies).
“Among demographic groups, men were identified as the most common perpetrators (67.2% of 4,722 respondents in 5 studies) and women the most common victims (56.2% of 15,246 respondents in 27 studies),” the authors report.
“Academic medicine in many institutions is encumbered by systemic sexism that is evident in processes around remuneration, recognition, opportunities for advancement, and leadership positions,” said Dr. Van Spall.
“There are fewer women at decision-making tables in academic medicine, the climb is uphill at the best of times, and women are likely easier targets for bullies, as their voices are easier to drown out,” she added.
She noted that many men do “exhibit wonderful attributes of professionalism and decency,” but “some in positions of power are given impunity by virtue of other accomplishments.”
Multiple deterrents
Thirty-one studies (n = 15,868) described characteristics of the bullies and showed the most common to be consultants (53.6% [30 studies]), residents (22% [22 studies]), and nurses (14.9% [21 studies]).
Only a minority of victims (28.9% of 9,410 victims [10 studies]) formally reported the bullying. The researchers identified multiple deterrents to reporting.
When a formal complaint was submitted (n = 1,139 respondents), it most frequently had no perceived effect (35.6%); more than one-fifth (21.9%) experienced worsening of the bullying, and only 13.7% reported improvement.
The common institutional facilitators of bullying, described in 25 studies, included lack of enforcement of anti-bullying policies (13 studies), the hierarchical structure of medicine (7 studies), and normalization of bullying (10 studies).
Forty-nine studies looked at strategies to address academic bullying, including anti-bullying policies, mandatory workshops on mistreatment, establishing an anti-bullying oversight committee, and institutional support for victims. However, the studies testing the effectiveness of these interventions “had a high risk of bias.”
Support available
Commenting on the research for this news organization, Roberta Gebhard, DO, past president of the American Medical Women’s Association (AMWA) and a member of the advisory board for Physician Just Equity, called it a “good study, large, international, and well-written.”
Dr. Gebhard, a member of the Governing Council for the American Medical Association Women Physician Section, was not associated with this study but said she is currently researching women who left medical school and residency.
“A common reason for leaving is being bullied. Bullying is often not reported and if reported, often not addressed. Or, if addressed, the person who reports it is often retaliated against, which is a common experience, especially in women.”
She advised female physicians who are bullied to get support from other female physicians – for example, by joining the AMWA, which has an online women’s leadership group.
“Having other women physicians throughout the country you can call for advice and support can be helpful,” said Dr. Gebhard, a family practice physician based in Grand Island, New York.
Dr. Van Spall receives support from the Canadian Institutes of Health Research, the Heart and Stroke Foundation, the Women As One Escalator Award, and McMaster Department of Medicine. The study authors and Dr. Gebhard have disclosed no relevant financial relationships.
A version of this article first appeared on Medscape.com.
We read with great interest the article by Chu et al1 (Cutis. 2021;107:157-159) and commend them for noting the underrepresentation of skin of color (SOC) in the American Academy of Dermatology (AAD) Basic Dermatology Curriculum. The AAD Basic Dermatology Curriculum represents one introductory resource that is ubiquitously utilized by medical students. Herein, we add an analysis of the representation of SOC in the following resources that also comprise the first exposure medical students have to dermatology: Dermatology Clinics Clinical Advisor articles (https://www.clinicaladvisor.com/home/dermatology/dermatology-clinics/), Learn Derm Module (LDM) by VisualDx (https://www.visualdx.com/learnderm/), Lookingbill and Marks’Principles of Dermatology (6th ed)(LB&M),2 and DermNet NZ (https://dermnetnz.org/). We performed a focused search of the DermNet NZ database for images of the following common dermatologic conditions: acne, rosacea, alopecia, urticaria, arthropod bites, blistering diseases (bullous pemphigoid and pemphigus vulgaris), connective tissue diseases (dermatomyositis and lupus), inflammatory conditions (atopic dermatitis, contact dermatitis, and psoriasis), keloids, benign and malignant neoplasms (nevi, seborrheic keratosis, actinic keratosis, basal and squamous cell carcinomas, and melanoma including acral melanoma), bacterial skin infections (impetigo, erysipelas, cellulitis, staphylococcal scalded skin syndrome, and syphilis), fungal infections (dermatophyte infections), and viral skin infections (herpes, molluscum contagiosum, varicella-zoster virus, and warts). We classified images as light (Fitzpatrick phototypes I–IV) or dark (Fitzpatrick phototypes V or VI). We excluded images without visible background skin (eg, images of oral mucosa, genitalia, nails, palms and soles, dermoscopic images, histopathologic images).
We found the representation of SOC in the resources we selected to be as follows: Dermatology Clinics Clinical Advisor articles (70/367 or 19%); LDM (26/150 or 17%); LB&M (52/374 or 14%); DermNet NZ (11/310 or 4%). Representation of SOC in common dermatologic conditions such as actinic keratosis, alopecia, rosacea, urticaria, and warts was entirely absent across all resources. Other common skin diseases were represented in only one of the resources we analyzed: acne (represented only in LB&M, where only 3/11 images of acne were depicted in SOC); contact dermatitis (represented only in LB&M, where only 1/6 images of contact dermatitis were depicted in SOC); psoriasis (represented only on DermNet NZ, where only 2/25 images of psoriasis were depicted in SOC); seborrheic keratosis (represented only in LB&M, where 1/2 images of seborrheic keratosis were depicted in SOC). Furthermore, none of the resources we analyzed depicted malignancy (basal cell carcinoma, squamous cell carcinoma, and melanoma) in SOC. Although the poor representation of SOC in malignancies can be explained by the predilection of skin cancer for light skin, other dermatologic conditions that are more common in SOC also were poorly represented in these resources in SOC: acral melanoma, not represented in any of the resources we analyzed; subacute cutaneous lupus erythematosus and systemic lupus erythematosus, also not represented in any of the resources we analyzed; keloids, represented only in LB&M.
Although no study has investigated the true prevalence of Fitzpatrick phototypes in the United States, He et al3 demonstrated the prevalence of Fitzpatrick phototypes V and VI to be 25.0% and 18.8%, respectively, in an ethnically diverse study of 3386 participants. Indeed, the representation of SOC in the resources we analyzed falls short of this plausible estimate of SOC in an increasingly diverse US population.
Our work adds to the growing body of literature exposing the deficiencies in SOC representation in dermatology. As Lester et al4 noted, such poor representation of SOC is deleterious not just to patients, who may be misdiagnosed, but also more generally to the integrity of the field of dermatology. Moreover, our study, which analyzes introductory resources referenced by the junior medical student, highlights a potential danger of poor SOC representation for trainees—limited exposure to SOC may leave medical students unprepared to recognize lesions in SOC during clerkships and residency. Furthermore, we note an additional concern with minimal SOC representation in online modules such as the AAD and LDM module as well as online databases such as DermNet NZ; images from these resources may be used as training sets for machine learning (ML) software (indeed, DermNet NZ has been used as a training set for ML programs5). However, if data sets with poor representation of SOC are used to train ML algorithms, then ML software may be unable to recognize lesions in SOC.6 Thus, inadequate representation of SOC in online modules and databases may exacerbate existing inequities in dermatology.
To address the paucity of SOC representation, students can be directed to resources devoted to depicting SOC; however, as discussed eloquently by Chu et al,1 an attempt to update existing resources also must be made. The senior author in our study (S.J.K.) embraced such an approach, updating the dermatology lectures given to medical students to include more images of SOC. Such a top-down approach may represent a major step in dismantling the systemic biases that pervade dermatology.
A limitation of our analysis was use of the Fitzpatrick scale, which was conceived as a phenotypic scale to assess cutaneous responses to UV irradiation.7 Although it is the most commonly used scale to describe race/ethnicity and/or constitute skin color, it is not possible to include all non-White skin types and classify strictly under this umbrella term.
References
1. Chu B, Fathy R, Onyekaba G, et al. Distribution of skin-type diversity in photographs in AAD online educational modules. Cutis. 2021;107:157-159. doi:10.12788/cutis.0196
2. Marks JG Jr, Miller JJ. Lookingbill and Marks’ Principles of Dermatology. 6th ed. Saunders Elsevier; 2018.
3. He SY, McCulloch CE, Boscardin WJ, et al. Self-reported pigmentary phenotypes and race are significant but incomplete predictors of Fitzpatrick skin phototype in an ethnically diverse population. J Am Acad Dermatol. 2014;71:731-737. doi:10.1016/j.jaad.2014.05.023
4. Lester JC, Taylor SC, Chren M-M. Under‐representation of skin of colour in dermatology images: not just an educational issue. Br J Dermatol. 2019;180:1521-1522. doi:10.1111/bjd.17608
5. Aggarwal P. Data augmentation in dermatology image recognition using machine learning. Skin Res Technol. 2019;25:815-820. doi:10.1111/srt.12726
6. Adamson AS, Smith A. Machine learning and health care disparities in dermatology. JAMA Dermatol. 2018;154:1247-1248. doi:10.1001/jamadermatol.2018.2348
7. Ware OR, Dawson JE, Shinohara MM, et al. Racial limitations of Fitzpatrick skin type. Cutis. 2020;105:77-80.
Authors’ Response
We thank Mr. Joshi and Dr. Kim for their reply to our article and their added contribution to the literature on inadequate representation of skin of color (SOC) in dermatology educational materials. In recent years, multiple analyses have reviewed textbooks and popular online resources for SOC representation.1 These resources encompass all levels of education—from the laypatient to the medical student, and to residency and beyond—demonstrating the significant challenges to overcome.
In addition, as Mr. Joshi and Dr. Kim state, the potential for these inadequately representative resources to serve as training data for prediction and classification tools adds further urgency to the broader task at hand, as we do not wish to perpetuate disparities. Several tools already exist, including Derm Assist, a recent Google-produced tool that suggests a list of diagnoses from patient-provided images.2 Although Derm Assist has been marked as a CE Class I (low risk) medical device in the European Union, the original research it is built on relied on training data with low representation of darker skin types (2.7% Fitzpatrick V and 0% Fitzpatrick VI),3 drawing concern for its generalizability.
These concerns about SOC representation are not new; dermatology advocates, scholars, and organizations such as the Skin of Color Society have been working to address these deficiencies for many years, contributing to education (including writing of resources and textbooks) and academic research. This work continues today. For instance, Lester et al4 described best practices for clinical photography in SOC; this guidance was not yet published at the time of our original submission. Not only should dermatology strive for increased quantity of representation but also quality. This metric is particularly important if the images are intended not just for education but also for use as training data for prediction and classification tools.
Examples of more recent actions at the organizational level include the American Academy of Dermatology (AAD) announcing a 3-year plan to promote diversity, equity, and inclusion5 and VisualDx establishing #ProjectIMPACT, a collaboration to reduce health care biases in SOC.6 In the AAD 3-year plan, one goal is to “[i]ncrease use of images reflecting full spectrum of skin types and highlight topics on skin of color, health disparities, and cultural competency across all AAD education.”5 Although not specifically mentioned, we hope that the AAD has included updating the Basic Dermatology Curriculum, given its inadequate SOC representation, as part of its short-term goals. The greater recognition of these issues through more prevalent analyses published in leading dermatology journals is encouraging, and we hope both that improvements can be successfully implemented and that future studies will reveal improvements in representation.
Brian Chu, BS; Ramie Fathy, AB; Ginikanwa Onyekaba, BS; Jules B. Lipoff, MD
From the Perelman School of Medicine, University of Pennsylvania, Philadelphia. Dr. Lipoff is from the Department of Dermatology and the Leonard Davis Institute of Health Economics.
The authors report no conflict of interest.
Correspondence: Jules B. Lipoff, MD, Department of Dermatology, University of Pennsylvania, Penn Medicine University City, 3737 Market St, Ste 1100, Philadelphia, PA 19104 ([email protected]).
References
1. Perlman KL, Williams NM, Egbeto IA, et al. Skin of color lacks representation in medical student resources: a cross-sectional study. Int J Womens Dermatol. 2021;7:195-196. doi:10.1016/j.ijwd.2020.12.018
2. Bui P, Liu Y. Using AI to help find answers to common skin conditions. Published May 18, 2021. Accessed June 12, 2021. https://blog.google/technology/health/ai-dermatology-preview-io-2021
3. Liu Y, Jain A, Eng C, et al. A deep learning system for differential diagnosis of skin diseases. Nature Medicine. 2020;26:900-908. doi:10.1038/s41591-020-0842-3
4. Lester JC, Clark L, Linos E, et al. Clinical photography in skin of colour: tips and best practices. Br J Dermatol. 2021;184:1177-1179. doi:10.1111/bjd.19811
5. American Academy of Dermatology Association. Diversity in dermatology: diversity committee approved plan 2021-2023. Published January 26, 2021. Accessed June 24, 2021. https://assets.ctfassets.net/1ny4yoiyrqia/xQgnCE6ji5skUlcZQHS2b/65f0a9072811e11afcc33d043e02cd4d/DEI_Plan.pdf
6. VisualDx. #ProjectIMPACT. Accessed June 24, 2021. https://www.visualdx.com/projectimpact/
To the Editor:
We read with great interest the article by Chu et al1 (Cutis. 2021;107:157-159) and commend them for noting the underrepresentation of skin of color (SOC) in the American Academy of Dermatology (AAD) Basic Dermatology Curriculum. The AAD Basic Dermatology Curriculum represents one introductory resource that is ubiquitously utilized by medical students. Herein, we add an analysis of the representation of SOC in the following resources that also comprise the first exposure medical students have to dermatology: Dermatology Clinics Clinical Advisor articles (https://www.clinicaladvisor.com/home/dermatology/dermatology-clinics/), Learn Derm Module (LDM) by VisualDx (https://www.visualdx.com/learnderm/), Lookingbill and Marks’Principles of Dermatology (6th ed)(LB&M),2 and DermNet NZ (https://dermnetnz.org/). We performed a focused search of the DermNet NZ database for images of the following common dermatologic conditions: acne, rosacea, alopecia, urticaria, arthropod bites, blistering diseases (bullous pemphigoid and pemphigus vulgaris), connective tissue diseases (dermatomyositis and lupus), inflammatory conditions (atopic dermatitis, contact dermatitis, and psoriasis), keloids, benign and malignant neoplasms (nevi, seborrheic keratosis, actinic keratosis, basal and squamous cell carcinomas, and melanoma including acral melanoma), bacterial skin infections (impetigo, erysipelas, cellulitis, staphylococcal scalded skin syndrome, and syphilis), fungal infections (dermatophyte infections), and viral skin infections (herpes, molluscum contagiosum, varicella-zoster virus, and warts). We classified images as light (Fitzpatrick phototypes I–IV) or dark (Fitzpatrick phototypes V or VI). We excluded images without visible background skin (eg, images of oral mucosa, genitalia, nails, palms and soles, dermoscopic images, histopathologic images).
We found the representation of SOC in the resources we selected to be as follows: Dermatology Clinics Clinical Advisor articles (70/367 or 19%); LDM (26/150 or 17%); LB&M (52/374 or 14%); DermNet NZ (11/310 or 4%). Representation of SOC in common dermatologic conditions such as actinic keratosis, alopecia, rosacea, urticaria, and warts was entirely absent across all resources. Other common skin diseases were represented in only one of the resources we analyzed: acne (represented only in LB&M, where only 3/11 images of acne were depicted in SOC); contact dermatitis (represented only in LB&M, where only 1/6 images of contact dermatitis were depicted in SOC); psoriasis (represented only on DermNet NZ, where only 2/25 images of psoriasis were depicted in SOC); seborrheic keratosis (represented only in LB&M, where 1/2 images of seborrheic keratosis were depicted in SOC). Furthermore, none of the resources we analyzed depicted malignancy (basal cell carcinoma, squamous cell carcinoma, and melanoma) in SOC. Although the poor representation of SOC in malignancies can be explained by the predilection of skin cancer for light skin, other dermatologic conditions that are more common in SOC also were poorly represented in these resources in SOC: acral melanoma, not represented in any of the resources we analyzed; subacute cutaneous lupus erythematosus and systemic lupus erythematosus, also not represented in any of the resources we analyzed; keloids, represented only in LB&M.
Although no study has investigated the true prevalence of Fitzpatrick phototypes in the United States, He et al3 demonstrated the prevalence of Fitzpatrick phototypes V and VI to be 25.0% and 18.8%, respectively, in an ethnically diverse study of 3386 participants. Indeed, the representation of SOC in the resources we analyzed falls short of this plausible estimate of SOC in an increasingly diverse US population.
Our work adds to the growing body of literature exposing the deficiencies in SOC representation in dermatology. As Lester et al4 noted, such poor representation of SOC is deleterious not just to patients, who may be misdiagnosed, but also more generally to the integrity of the field of dermatology. Moreover, our study, which analyzes introductory resources referenced by the junior medical student, highlights a potential danger of poor SOC representation for trainees—limited exposure to SOC may leave medical students unprepared to recognize lesions in SOC during clerkships and residency. Furthermore, we note an additional concern with minimal SOC representation in online modules such as the AAD and LDM module as well as online databases such as DermNet NZ; images from these resources may be used as training sets for machine learning (ML) software (indeed, DermNet NZ has been used as a training set for ML programs5). However, if data sets with poor representation of SOC are used to train ML algorithms, then ML software may be unable to recognize lesions in SOC.6 Thus, inadequate representation of SOC in online modules and databases may exacerbate existing inequities in dermatology.
To address the paucity of SOC representation, students can be directed to resources devoted to depicting SOC; however, as discussed eloquently by Chu et al,1 an attempt to update existing resources also must be made. The senior author in our study (S.J.K.) embraced such an approach, updating the dermatology lectures given to medical students to include more images of SOC. Such a top-down approach may represent a major step in dismantling the systemic biases that pervade dermatology.
A limitation of our analysis was use of the Fitzpatrick scale, which was conceived as a phenotypic scale to assess cutaneous responses to UV irradiation.7 Although it is the most commonly used scale to describe race/ethnicity and/or constitute skin color, it is not possible to include all non-White skin types and classify strictly under this umbrella term.
References
1. Chu B, Fathy R, Onyekaba G, et al. Distribution of skin-type diversity in photographs in AAD online educational modules. Cutis. 2021;107:157-159. doi:10.12788/cutis.0196
2. Marks JG Jr, Miller JJ. Lookingbill and Marks’ Principles of Dermatology. 6th ed. Saunders Elsevier; 2018.
3. He SY, McCulloch CE, Boscardin WJ, et al. Self-reported pigmentary phenotypes and race are significant but incomplete predictors of Fitzpatrick skin phototype in an ethnically diverse population. J Am Acad Dermatol. 2014;71:731-737. doi:10.1016/j.jaad.2014.05.023
4. Lester JC, Taylor SC, Chren M-M. Under‐representation of skin of colour in dermatology images: not just an educational issue. Br J Dermatol. 2019;180:1521-1522. doi:10.1111/bjd.17608
5. Aggarwal P. Data augmentation in dermatology image recognition using machine learning. Skin Res Technol. 2019;25:815-820. doi:10.1111/srt.12726
6. Adamson AS, Smith A. Machine learning and health care disparities in dermatology. JAMA Dermatol. 2018;154:1247-1248. doi:10.1001/jamadermatol.2018.2348
7. Ware OR, Dawson JE, Shinohara MM, et al. Racial limitations of Fitzpatrick skin type. Cutis. 2020;105:77-80.
Authors’ Response
We thank Mr. Joshi and Dr. Kim for their reply to our article and their added contribution to the literature on inadequate representation of skin of color (SOC) in dermatology educational materials. In recent years, multiple analyses have reviewed textbooks and popular online resources for SOC representation.1 These resources encompass all levels of education—from the laypatient to the medical student, and to residency and beyond—demonstrating the significant challenges to overcome.
In addition, as Mr. Joshi and Dr. Kim state, the potential for these inadequately representative resources to serve as training data for prediction and classification tools adds further urgency to the broader task at hand, as we do not wish to perpetuate disparities. Several tools already exist, including Derm Assist, a recent Google-produced tool that suggests a list of diagnoses from patient-provided images.2 Although Derm Assist has been marked as a CE Class I (low risk) medical device in the European Union, the original research it is built on relied on training data with low representation of darker skin types (2.7% Fitzpatrick V and 0% Fitzpatrick VI),3 drawing concern for its generalizability.
These concerns about SOC representation are not new; dermatology advocates, scholars, and organizations such as the Skin of Color Society have been working to address these deficiencies for many years, contributing to education (including writing of resources and textbooks) and academic research. This work continues today. For instance, Lester et al4 described best practices for clinical photography in SOC; this guidance was not yet published at the time of our original submission. Not only should dermatology strive for increased quantity of representation but also quality. This metric is particularly important if the images are intended not just for education but also for use as training data for prediction and classification tools.
Examples of more recent actions at the organizational level include the American Academy of Dermatology (AAD) announcing a 3-year plan to promote diversity, equity, and inclusion5 and VisualDx establishing #ProjectIMPACT, a collaboration to reduce health care biases in SOC.6 In the AAD 3-year plan, one goal is to “[i]ncrease use of images reflecting full spectrum of skin types and highlight topics on skin of color, health disparities, and cultural competency across all AAD education.”5 Although not specifically mentioned, we hope that the AAD has included updating the Basic Dermatology Curriculum, given its inadequate SOC representation, as part of its short-term goals. The greater recognition of these issues through more prevalent analyses published in leading dermatology journals is encouraging, and we hope both that improvements can be successfully implemented and that future studies will reveal improvements in representation.
Brian Chu, BS; Ramie Fathy, AB; Ginikanwa Onyekaba, BS; Jules B. Lipoff, MD
From the Perelman School of Medicine, University of Pennsylvania, Philadelphia. Dr. Lipoff is from the Department of Dermatology and the Leonard Davis Institute of Health Economics.
The authors report no conflict of interest.
Correspondence: Jules B. Lipoff, MD, Department of Dermatology, University of Pennsylvania, Penn Medicine University City, 3737 Market St, Ste 1100, Philadelphia, PA 19104 ([email protected]).
References
1. Perlman KL, Williams NM, Egbeto IA, et al. Skin of color lacks representation in medical student resources: a cross-sectional study. Int J Womens Dermatol. 2021;7:195-196. doi:10.1016/j.ijwd.2020.12.018
2. Bui P, Liu Y. Using AI to help find answers to common skin conditions. Published May 18, 2021. Accessed June 12, 2021. https://blog.google/technology/health/ai-dermatology-preview-io-2021
3. Liu Y, Jain A, Eng C, et al. A deep learning system for differential diagnosis of skin diseases. Nature Medicine. 2020;26:900-908. doi:10.1038/s41591-020-0842-3
4. Lester JC, Clark L, Linos E, et al. Clinical photography in skin of colour: tips and best practices. Br J Dermatol. 2021;184:1177-1179. doi:10.1111/bjd.19811
5. American Academy of Dermatology Association. Diversity in dermatology: diversity committee approved plan 2021-2023. Published January 26, 2021. Accessed June 24, 2021. https://assets.ctfassets.net/1ny4yoiyrqia/xQgnCE6ji5skUlcZQHS2b/65f0a9072811e11afcc33d043e02cd4d/DEI_Plan.pdf
6. VisualDx. #ProjectIMPACT. Accessed June 24, 2021. https://www.visualdx.com/projectimpact/
A hectic Friday morning at the hospital seemed less stressful amid morning greetings and humor from colleagues. In a team room full of hospitalists, life and death are often discussed in detail, ranging from medical discussions to joys and frustrations of the day to philosophy, politics, and more. It is almost impossible to miss something interesting.
Dr. Taru Saigal
People breaking into their native languages over the phone call from home always make me smile. The mention of a “complicated Indian patient unable to use interpreter” caught my attention.
My friend and colleague asked if I would be willing to take over the patient since I could speak Hindi. I was doubtful if I would add anything to make a meaningful difference, given the patient wasn’t even participating in a conversation. However, my colleague’s concern for the patient and faith in me was enough to say, “Sure, let me add her to my list.”
At the bedside, it felt like a classic “acute on chronic” hot mess situation. The patient presented with a generalized rash, anasarca, renal failure, multifocal pneumonia, and delirium. All I could gather from the patient were some incomprehensible words that sounded like Hindi. I called the family to obtain some history and to provide updates. Her son was excited to hear from me, and it didn’t take him long to guess that I was from India. But that could still mean that I might speak any of the twenty-two or more Indian languages.
Answering my questions one by one in perfectly understandable English, he was short and sweet. Suspicious of missing out on details, I offered hesitantly, “You could speak in Hindi with me.” Then came a flood of information with the details, concerns, questions, and what was lost in the translation.
We all attend to patients and families with limited English proficiency (LEP), immigrants, and nonimmigrants. LEP is a term used to describe individuals who do not speak English as their primary language and have a limited ability to read, speak, write, or understand English.1 Recent data from the American Community Survey (2005-2009) reports that 8.6% of the population (24 million Americans) have LEP.2 It’s a large and growing population that needs help overcoming language barriers and the appropriate use of professional medical interpreter services – a backbone to safe, quality, and cost-effective patient care.
The following day at bedside rounds, the nurse reported that the patient was looking and responding better. She could cooperate with interpreter services and could speak “some English.” Over the years, one thing that sounds more alarming than “no English” is “some English” or “enough English.” Around noon I received a page that the patient was refusing intravenous Lasix. At the bedside, however, the patient seemed unaware of the perceived refusal. Further discussions with the nurse lead to a familiar culprit, a relatively common gesture in South Asian cultures, a head bobble or shake.
The nurse reported that the patient shook her head side to side, seemed upset, and said “NO” when trying to administer the medication. On the other hand, the patient reported that she was upset to be at the hospital but had “NO” problem with the medicine.
My patient’s “some English” was indeed “enough English” to put her at risk due to medical error, which is highly likely when patients or providers can speak or understand a language to “get by” or to “make do.” Like my patient, the LEP patient population is more likely to experience medical errors, longer hospital stays, hospital-acquired complications, surgical delays, and readmissions. They are also less likely to receive preventive care, have access to regular care, or be satisfied with their care. They are much more likely to have adverse effects from drug complications, poor understanding of diagnoses, a greater risk of being misunderstood by their physicians or ancillary staff, and less likely to follow physician instructions.3-5 One study analyzed over 1,000 adverse-incident reports from six Joint Commission-accredited hospitals for LEP and English-speaking patients and found that 49% of LEP patients experienced physical harm versus 29.5% of English-speaking patients.6
I updated the patient’s LEP status that was missing in the chart, likely due to altered mental status at the time of admission. Reliable language and English proficiency data are usually entered at the patient’s point of entry with documentation of the language services required during the patient-provider encounter. The U.S. Census Bureau’s operational definition for LEP is a patient’s self-assessed ability to speak English less than “very well,” but how well it correlates with a patient’s actual English ability needs more study. Also, one’s self-assessed perception of ability might vary day to day, and language ability, by itself, is not static; it can differ from moment to moment and situation to situation. It may be easier to understand words in English when the situation is simple and less stressful than when things are complicated and stressful.
With a definition of LEP rather vague and the term somewhat derogatory, its meaning is open to interpretation. One study found that though speaking English less than “very well” was the most sensitive measure for identifying all of the patients who reported that they were unable to communicate effectively with their physicians, it was also the least specific.7 This lower specificity could lead to misclassification of some patients as LEP who are, in fact, able to effectively communicate in English with their physicians. This type of misclassification might lead to costly language assistance and carry the potential to cause conflicts between patient and provider. Telling a patient or family that they may have a “limited English proficiency” when they have believed otherwise and feel confident about their skills may come as a challenge. Some patients may also pretend to understand English to avoid being embarrassed about their linguistic abilities or perceive that they might be judged on their abilities in general.
Exiting the room, I gently reminded the RN to use the interpreter services. “Who has never been guilty of using an ad hoc interpreter or rushing through a long interpreter phone call due to time constraints?” I thought. A study from 2011 found that 43% of hospitalized patients with LEP had communicated without an interpreter present during admission, and 40% had communicated without an interpreter present after admission.8 In other words, a system in place does not mean service in use. But, the use of a trained interpreter is not only an obligation for care providers but a right for patients as per legal requirements of Title VI of the Civil Rights Act and the Standards for Culturally and Linguistically Appropriate Services (CLAS) by the Department of Health and Human Services’ (HSS) Office of Minority Health.9 In January 2010, The Joint Commission released a set of new and revised standards for patient-centered communication as part of an initiative to advance effective communication, cultural competence, and patient- and family-centered care.
Despite the requirements and availability of qualified medical interpreter services, there are multiple perceived and experienced barriers to the use of interpreter services. The most common one is that what comes as a free service for patients is a time commitment for providers. A long list of patients, acuity of the situation, and ease of use/availability of translation aids can change the calculus. One may be able to bill a prolonged service code (99354-99357) in addition to the appropriate E/M code, although a patient cannot be billed for the actual service provided by the interpreter. Longstanding CMS policy also permits reimbursement for translation/interpretation activities, so long as they are not included and paid for as part of the rate for direct service.10
The patient, however, insisted that she would rather have her son as the interpreter on the 3-way over the phone (OPI) conference call for interpretation. “He speaks good English and knows my medical history well,” she said. I counseled the patient on the benefits of using interpreter services and explained how to use the call button light and the visual aids.
Placing emphasis on educating patients about the benefits of using, and risks of not using, interpreter services is as essential as emphasizing that care providers use the services. Some patients may voluntarily choose to provide their own interpreter. Use of family members, friends, or unqualified staff as interpreters is one of the most commonly reported causes of errors by frontline staff. Using in-language collateral may help these patients understand how medical interpretation may create a better patient experience and outcome. A short factsheet, in different languages, on qualified interpreters’ expected benefits: meaning-for-meaning communication, impartiality, medical privacy, and improved patient safety and satisfaction, can also come in handy.
However, if the patient still refuses, providers should document the refusal of the offer of free language services, the name of the interpreter designated by the patient, the interpreter’s relationship to the LEP person, and the time or portions of the patient encounter that the interpreter’s services were used. Yet, language interpretation alone can be inadequate without document translation. According to one study, despite the availability of on-site professional interpreter services, hospitalized patients who do not speak English are less likely to have signed consent forms in their medical records.11 Health care professionals, therefore, need well-translated documents to treat LEP patients. Translated documents of consent forms for medical procedures, post-discharge instructions, prescription and medical device labels, and drug usage information may enhance informed decision making, safety and reduce stress and medical errors.
An unpopular and underused service needs it all: availability, convenience, monitoring, reporting, and team effort. Due to the sheer unpopularity and underuse of interpreter services, institutions should enhance ease of availability, monitor the use and quality of interpreter services, and optimize reporting of language-related errors. Ease of availability goes hand in hand with tapping local resources. Over the years, and even more so during the pandemic, in-person interpretation has transitioned to telephonic or video interpretation due to availability, safety, and cost issues. There are challenges in translating a language, and the absence of a visual channel adds another layer of complexity.
The current body of evidence does not indicate a superior interpreting method. Still, in one study providers and interpreters exposed to all three methods were more critical of remote methods and preferred videoconferencing to the telephone as a remote method. The significantly shorter phone interviews raised questions about the prospects of miscommunication in telephonic interpretation, given the absence of a visual channel.12
One way to bypass language barriers is to recognize the value added by hiring and training bilingual health care providers and fostering cultural competence. International medical graduates in many parts of the country aid in closing language barriers. Language-concordant care enhances trust between patients and physicians, optimizes health outcomes, and advances health equity for diverse populations.13-15 The presence of bilingual providers means more effective and timelier communication and improved patient satisfaction. But, according to a Doximity study, there is a significant “language gap” between those languages spoken by physicians and their patients.16 Hospitals, therefore, should assess, qualify, and incentivize staff who can serve as on-site medical interpreters for patients as a means to facilitate language concordant care for LEP patients.
The Agency of Healthcare Research and Quality (AHRQ) also has a guide on how hospitals can better identify, report, monitor, and prevent medical errors in patients with LEP. Included is the TeamSTEPPS LEP module to help develop and deploy a customized plan to train staff in teamwork skills and lead a medical teamwork improvement initiative.17
“Without my family, I was scared that nobody would understand me”
Back to the case. My patient was recovering well, and I was tying up loose ends on the switch day for the hospitalist teams.
“You will likely be discharged in a couple of days,” I said. She and the family were grateful and satisfied with the care. She had used the interpreter services and also received ethnocultural and language concordant and culturally competent care. Reducing language barriers is one of the crucial ways to reduce racial and ethnic disparities in quality of care and health outcomes, and it starts – in many cases – with identifying LEP patients. Proper use and monitoring of interpreter services, reporting language-related errors, hiring and testing bilingual staff’s language proficiency, and educating staff on cultural awareness are essential strategies for caring for LEP patients.
At my weeks’ end, in my handoff note to the incoming providers, I highlighted: “Patient will benefit from a Hindi speaking provider, Limited English Proficiency.”
Dr. Saigal is a hospitalist and clinical assistant professor of medicine in the division of hospital medicine at the Ohio State University Wexner Medical Center, Columbus.
3. Jacobs EA, et al. Overcoming language barriers in health care: Costs and benefits of interpreter services. Am J Public Health. 2004;94(5):866–869. doi: 10.2105/ajph.94.5.866.
4. Gandhi TK, et al. Drug complications in outpatients. J Gen Intern Med. 2000;15(3):149–154. doi: 10.1046/j.1525-1497.2000.04199.x.
5. Karliner LS, et al. Do professional interpreters improve clinical care for patients with limited English proficiency? A systematic review of the literature. Health Serv Res. 2007;42(2):727–754. doi: 10.1111/j.1475-6773.2006.00629.x.
6. Divi C, et al. Language proficiency and adverse events in US hospitals: a pilot study. Int J Qual Health Care. 2007 Apr;19(2):60-7. doi: 10.1093/intqhc/mzl069.
7. Karliner LS, et al. Identification of limited English proficient patients in clinical care. J Gen Intern Med. 2008;23(10):1555-1560. doi:10.1007/s11606-008-0693-y.
8. Schenker Y, et al. Patterns of interpreter use for hospitalized patients with limited English proficiency. J Gen Intern Med. 2011 Jul;26(7):712-7. doi: 10.1007/s11606-010-1619-z.
9. Office of Minority Health, US Department of Health and Human Services. National Standards for Culturally and Linguistically Appropriate Services in Health Care: Final Report. Washington, DC: US Department of Health and Human Services; 2001. https://minorityhealth.hhs.gov/assets/pdf/checked/finalreport.pdf.
11. Schenker Y, et al. The Impact of Language Barriers on Documentation of Informed Consent at a Hospital with On-Site Interpreter Services. J Gen Intern Med. 2007 Nov;22 Suppl 2(Suppl 2):294-9. doi: 10.1007/s11606-007-0359-1.
12. Locatis C, et al. Comparing in-person, video, and telephonic medical interpretation. J Gen Intern Med. 2010;25(4):345-350. doi:10.1007/s11606-009-1236-x.
13. Dunlap JL, et al. The effects of language concordant care on patient satisfaction and clinical understanding for Hispanic pediatric surgery patients. J Pediatr Surg. 2015 Sep;50(9):1586-9. doi: 10.1016/j.jpedsurg.2014.12.020.
14. Diamond L, et al. A Systematic Review of the Impact of Patient–Physician Non-English Language Concordance on Quality of Care and Outcomes. J Gen Intern Med. 2019 Aug;34(8):1591-1606. doi: 10.1007/s11606-019-04847-5.
15. Ngo-Metzger Q, et al. Providing high-quality care for limited English proficient patients: the importance of language concordance and interpreter use. J Gen Intern Med. 2007 Nov;22 Suppl 2(Suppl 2):324-30. doi: 10.1007/s11606-007-0340-z.
Individuals of South Asian ancestry face twice the risk of heart disease, compared with individuals of European descent, yet existing risk calculators fail to account for this disparity, according to the results of a new study.
These findings confirm previous reports and practice guidelines that identify South Asian ancestry as a risk enhancer for atherosclerotic cardiovascular disease (ASCVD), suggesting that earlier heart disease screening and prevention is warranted in this patient population, lead author Aniruddh P. Patel, MD, research fellow at the Center for Genomic Medicine, Massachusetts General Hospital, Boston, and colleagues said.
“Previous studies in multiple countries have estimated a 1.7- to 4-fold higher risk of ASCVD among South Asian individuals, compared with other ancestries, but have important potential limitations,” Dr. Patel and colleagues wrote in the paper on their prospective cohort study, published in Circulation.
The INTERHEART case-control study, for example, which assessed risk factors for acute myocardial infarction among more than 15,000 cases from 52 countries, is now 2 decades old, and “may not reflect recent advances in cardiovascular disease prevention,” the investigators wrote.
Most studies in the area have been small and retrospective, they added, and have not adequately assessed emerging risk factors, such as prediabetes, which appear to play a relatively greater role in the development of heart disease among South Asians.
Methods and results
To address this knowledge gap, Dr. Patel and colleagues analyzed data from the UK Biobank prospective cohort study, including 449,349 middle-aged participants of European ancestry and 8,124 similarly aged participants of South Asian descent who did not have heart disease upon enrollment. Respective rates of incident ASCVD (i.e., MI, ischemic stroke, or coronary revascularization) were analyzed in the context of a variety of lifestyle, anthropometric, and clinical factors.
After a median follow-up of 11.1 years, individuals of South Asian descent had an incident ASCVD rate of 6.8%, compared with 4.4% for individuals of European descent, representing twice the relative risk (adjusted hazard ratio, 2.03; 95% CI, 1.86-2.22; P < .001). Even after accounting for all covariates, risk of ASCVD remained 45% higher for South Asian individuals (aHR, 1.45; 95% CI, 1.28-1.65; P < .001). This elevation in risk was not captured by existing risk calculators, including the American College of Cardiology/American Heart Association Pooled Cohort Equations, or the QRISK3 equations.
The findings were “largely consistent across a range of age, sex, and clinical subgroups,” and “confirm and extend previous reports that hypertension, diabetes, and central adiposity are the leading associations in this observed disparity,” the investigators wrote.
Two diabetes subtypes are more prevalent in South Asians
Hypertension, diabetes, and central adiposity do not fully explain South Asians’ higher risk for ASCVD, wrote Namratha R. Kandula, MD, of Northwestern University Medical Center, Chicago, and Alka M. Kanaya, MD, of the University of California, San Francisco, in an accompanying editorial published in Circulation.
Some of the undetected risk may stem from unique diabetes disease factors, Dr. Kandula and Dr. Kanaya added.
“Newer data have demonstrated distinct subtypes of type 2 diabetes, with South Asians having a higher prevalence of both a severe insulin resistant with obesity subtype and a less recognized severe insulin deficient subtype,” they wrote. “Importantly, both of these more prevalent diabetes subtypes in South Asians were associated with a higher incidence of coronary artery calcium, a marker of subclinical atherosclerosis and strong predictor of future ASCVD, compared to other diabetes subtypes.”
Diabetes rate is higher for South Asians in the U.S.
Although the present study was conducted in the United Kingdom, the findings likely apply to individuals of South Asian ancestry living in the United States, according to principal author Amit V. Khera, MD, associate director of the precision medicine unit at the Center for Genomic Medicine, Massachusetts General Hospital.
“There are already more than 5 million individuals of South Asian ancestry in the U.S. and this represents one of the fastest-growing ethnic subgroups,” Dr. Khera said in an interview. “As in our study of individuals in the U.K., South Asians in the U.S. suffer from diabetes at much higher rates – 23% versus 12% – and this often occurs even in the absence of obesity.”
Zero South Asians included in studies used to develop risk estimator
“I think the first step is to simply acknowledge that the risk estimators we use in clinical practice have important limitations when it comes to diverse patient populations,” Dr. Khera said in an interview. “We saw this in our study, where – despite a more than doubling of risk – the predicted risk based on the equations used in primary care showed no difference. This risk estimator was developed based on legacy cohort studies, in [which] zero South Asians were included. Despite important differences across race/ethnicity, the current state-of-the-art in the U.S. is to use one equation for Black individuals and another for all other ethnicities.”
Experts suggest steps for reducing heart disease risk
While risk modeling remains suboptimal, Dr. Khera suggested that clinicians can take immediate steps to reduce the risk of heart disease among individuals with South Asian ancestry.
“Despite all of the uncertainty – we still don’t have a complete understanding of why the risk is so high – there are still several things primary care doctors can do for their patients,” Dr. Khera said.
Foremost, he recommended lifestyle and dietary counseling.
“Dietary counseling is particularly effective if put in the context of cultural norms,” Dr. Khera said. “Many South Asians consider fruit juices or white rice to be healthy, when they lead to rapid spikes in blood sugar.”
Dr. Khera also advised earlier heart disease screening, such as coronary calcium scanning “sometime between age 40-50 years,” noting that positive test results may motivate patients to start or adhere to medications, such as cholesterol-lowering therapies. If necessary, clinicians can also refer to heart centers for South Asian patients, which are becoming increasingly common.
Dr. Cheryl A.M. Anderson
According to Cheryl A.M. Anderson, PhD, chair of the AHA’s Council on Epidemiology and Prevention, and professor and dean of the Herbert Wertheim School of Public Health and Human Longevity Science at the University of California, San Diego, the current study suggests that heart disease management strategies for South Asian patients may be lacking.
“We have had a tradition of preventing or trying to treat heart disease in a fashion that doesn’t yet account for the increased risk that might be prevalent in those of South Asian ancestry,” Dr. Anderson said in an interview.
She suggested that improving associated risk-analysis tools could be beneficial, although the tools themselves, in the context of race or ethnicity, may present their own risks.
“We want to be mindful of potential adverse implications from having everything linked to one’s ancestry, which I think this tool doesn’t do,” Dr. Anderson said, referring to the AHA/ACC Pooled Cohort Equations. “But in sort of the bigger picture of things, we always want to expand and refine our toolkit.”
Dr. Rajesh Dash
According to Rajesh Dash, MD, PhD, associate professor, cardiologist, and director of the South Asian Translational Heart Initiative (SSATHI) Prevention Clinic and CardioClick Telemedicine Clinic at Stanford (Calif.) HealthCare, the science supports more active risk mitigation strategies for South Asian patients, and the AHA and the ACC “are the two entities that need to lead the way.”
“Certainly the American Heart Association and the American College of Cardiology should be taking a more active leadership role in this,” Dr. Dash said in an interview.
In 2018, the AHA issued a scientific statement about the elevated risk of ASCVD among South Asian individuals, “but it did not rise to the level of specific recommendations, and did not necessarily go as far as to incorporate new screening parameters for that population,” Dr. Dash said. He also noted that the most recent AHA/ACC guideline identifies South Asian ancestry as a risk-enhancing feature, a statement similarly lacking in actionable value.
“That does not definitively lead someone like a primary care physician to a decision to start a statin, or to be more aggressive with a diagnostic workup, like a stress test, for instance, for a patient who they otherwise would not have done one in had they not been South Asian,” Dr. Dash said.
The steps taken by the AHA and the ACC are “a healthy step forward,” he noted, “but not nearly the degree of attention or vigilance that is required, as well as the level of action that is required to change the narrative for the population.”
At the SSATHI Prevention Clinic, Dr. Dash and colleagues aren’t waiting for the narrative to change, and are already taking a more aggressive approach.
The clinic has an average patient age of 41 years, “easily 15 years younger than the average age in most cardiology clinics,” Dr. Dash said, based on the fact that approximately two-thirds of heart attacks in South Asian individuals occur under the age of 55. “We have to look earlier.”
The SSATHI Prevention Clinic screens for both traditional and emerging risk factors, and Dr. Dash suggested that primary care doctors should do the same.
“If you have a South Asian patient as a primary care physician, you should be aggressively looking for risk factors, traditional ones to start, like elevated cholesterol, hypertension, diabetes, or – and I would argue strongly – prediabetes or insulin resistance.”
Dr. Dash also recommended looking into family history, and considering screening for inflammatory biomarkers, the latter of which are commonly elevated at an earlier age among South Asian individuals, and may have a relatively greater prognostic impact.
To encourage broader implementation of this kind of approach, Dr. Dash called for more large-scale studies. Ideally, these would be randomized clinical trials, but, realistically, real-world datasets may be the answer.
The study was supported by the National Heart, Lung, and Blood Institute; the Broad Institute at MIT and Harvard; the National Human Genome Research Institute; and others. The investigators disclosed relationships with IBM Research, Sanofi, Amgen, and others. Dr. Dash disclosed relationships with HealthPals and AstraZeneca. Dr. Anderson reported no relevant conflicts of interest.
Professional appearance of servicemembers has been a long-standing custom in the US Military. Specific standards are determined by each branch. Initially, men dominated the military.1,2 As the number of women as well as racial diversity increased in the military, modifications to grooming standards were slow to change and resulted in female hair standards requiring a uniform tight and sleek style or short haircut. Clinicians can be attuned to these occupational standards and their implications on the diagnosis and management of common diseases of the hair and scalp.
History of Hairstyle Standards for Female Servicemembers
For half a century, female servicemembers had limited hairstyle choices. They were not authorized to have hair shorter than one-quarter inch in length. They could choose either short hair worn down or long hair with neatly secured loose ends in the form of a bun or a tucked braid—both of which could not extend past the bottom edge of the uniform collar.3-5 Female navy sailors and air force airmen with long hair were only allowed to wear ponytails during physical training; however, army soldiers previously were limited to wearing a bun.3,6,7 Cornrows and microbraids were authorized in the mid-1990s for the US Air Force, but policy stated that locs were prohibited due to their “unkempt” and “matted” nature. Furthermore, the size of hair bulk in the air force was restricted to no more than 3 inches and could not obstruct wear of the uniform cap.5 Based on these regulations, female servicemembers with longer hair had to utilize tight hairstyles that caused prolonged traction and pressure along the scalp, which contributed to headaches, a sore scalp, and alopecia over time. Normalization of these symptoms led to underreporting, as women lived with the consequences or turned to shorter hairstyles.
In the last decade alone, female servicemembers have witnessed the greatest number of changes in authorized hairstyles despite being part of the military for more than 50 years (Figure 1).1-11 In 2014, the language used in the air force instructions to describe locs was revised to remove ethnically offensive terms.4,5 This same year, the army allowed female soldiers to wear ponytails during physical training, a privilege that had been authorized by other services years prior.3,6,7 By the end of 2018, locs were authorized by all services, and female sailors could wear a ponytail in all navy uniforms as long as it did not extend 3 inches below the collar.3,4,6-8 In 2018, the air force increased authorized hair bulk up to 3.5 inches from the previous mandate of 3 inches and approved female buzz cuts6,9; in 2020, it allowed hair bulk up to 4 inches. As of 2021, female airmen can wear a ponytail and/or braid(s) as long as it starts below the crown of the head and the length does not extend below a horizontal line running between the top of each sleeve inseam at the underarm (Figures 2–4).6 In an ongoing effort to be more inclusive of hair density differences, female airmen will be authorized to wear a ponytail not exceeding a maximum width bulk of 1 ft starting June 25, 2021, so long as they can comply with the above regulations.11 The army now allows ponytails and braids across all uniforms, as long they do not extend past the bottom of the shoulder blades. This change came just months after authorizing the wearing of ponytails tucked under the uniform blouse with tactical headgear.10 These changes allow for a variety of hairstyles for members to practice while avoiding the physical consequences that develop from repetitive traction and pressure along the same areas of the hair and scalp.
Figure 1. Timeline of female servicemembers’ hair-grooming standards.1-11
Figure 2. Authorized ponytail and braid(s) for female US Air Force airmen.6,9 The horizontal rule signifies the longest ponytail. Photograph by 94th Airlift Wing, the Defense Visual Information Distribution Service.
Figure 3. Authorized hairstyles for female US Air Force airmen.6,9 Photograph by 2nd Lt. Deborah Ou-Yang, courtesy of the Defense Visual Information Distribution Service.
Figure 4. A, A US Air Force pilot wearing a braid. B and C, A US Air Force aircraft maintainer and loadmaster wearing ponytails under the new grooming regulations. Photographs by Senior Airman Jaylen Molden, Airman 1st Class Taylor Slater, and Senior Airman Hannah Bean, respectively, courtesy of the Defense Visual Information Distribution Service.
The changes in grooming policies are not only an initiative to enhance inclusiveness but also address gender and racial injustices and medical conditions related to grooming standards.9-12 In addition, these policies now authorize practical day-to-day hairstyles for many female servicemembers to perform their jobs more efficiently while still looking professional; for example, female pilots often had to wear their hair in ponytails, even though it was not previously allowed, for their helmets to fit. Female servicemembers also had to wear their hair down for gas masks or respirators to fit appropriately (Figure 4). Similarly, female army soldiers wore their hair down so their helmets would fit more comfortably during field operations even though no regulations allowed them to do so. The policy changes address various ethnic hair types, especially Black hair. Black women are at highest risk for alopecia secondary to both intrinsic and extrinsic factors. Intrinsically, they have an elliptically shaped hair shaft with retrocurvature of the hair follicle when compared to the oval-shaped shaft and straight follicles seen in White hair.13 Black individuals also have an overall reduced total hair density, slower rate of hair growth, and reduced sebum secretion when compared to White individuals. These factors as well as common styling practices such as chemical and thermal hair straightening leave Black hair more fragile, dry, and prone to developing knots and breakage.13 New hair regulations allow Black women to meet professional military standards while limiting the need for harsh and damaging styling practices.
Common Hair Disorders in Female Servicemembers
Herein, we discuss 3 of the most common hair and scalp disorders linked to grooming practices utilized by women to meet prior military regulations: trichorrhexis nodosa (TN), extracranial headaches, and traction alopecia (TA). It is essential that health care providers are able to promptly recognize these conditions, understand their risk factors, and be familiar with first-line treatment options. With these new standards, the hope is that the incidence of the following conditions decreases, thus improving servicemembers’ medical readiness and overall quality of life.
Trichorrhexis Nodosa Acquired TN is a defect in the hair shaft that causes the hair to break easily secondary to chemical, thermal, or mechanical trauma. This can include but is not limited to chemical relaxers, blow-dryers, excessive brushing or styling, flat irons, and tightly packed hairstyles. The condition is characterized by a thickened hair diameter and splitting at the tip. Clinically, it may present as brittle, lusterless, broken hair with split ends, as well as a positive tug test.14 Management includes gentle hair care and avoidance of harsh hair care practices and treatments.
Extracranial Headaches Headaches are a common concern among military servicemembers15 and generally are classified as primary or secondary. A less commonly discussed primary headache disorder includes external-pressure headaches, which result from either sustained compression or traction of the soft tissues of the scalp, usually from wearing headbands, helmets, or tight hairstyles.16 Additional at-risk groups include those who chronically wear surgical scrub caps or flight caps, especially if clipped or pinned to the hair. In our 38 years of combined military clinical experience, we can attest that these types of headaches are common among female servicemembers. The diagnostic criteria for an external-pressure headache, commonly referred to by patients as a “ponytail headache,” includes at least 2 headache episodes triggered within 1 hour of sustained traction on the scalp, maximal at the site of traction and resolving within 1 hour after relieving the traction.16 Management includes removal of the pressure-causing source, usually a tight ponytail or bun.
Traction Alopecia Traction alopecia is hair loss caused by repetitive or prolonged tension on the hair secondary to tight hairstyles. It can be clinically classified into 2 types: marginal and nonmarginal patchy alopecia (Figure 5).13,17,18 Traction alopecia most commonly is found in individuals with ethnic hair, predominantly Black women. Hairstyles with the highest risk for causing TA include tight buns, ponytails, cornrows, weaves, and locs—all of which are utilized by female servicemembers to maintain a professional appearance and adhere to grooming regulations.13,18 Other groups at risk include athletes (eg, ballerinas, gymnasts) and those with chronic headwear use (eg, turbans, helmets, nurse caps, wigs).18 Early TA typically presents with perifollicular erythema followed by follicular-based papules or pustules.13,18 Marginal TA classically includes frontotemporal hair loss or thinning with or without a fringe sign.17,18 Nonmarginal TA includes patchy alopecia most commonly involving the parietal or occipital scalp, seen with chignons, buns, ponytails, or the use of clips, extensions, or bobby pins.18 The first line in management is avoidance of traction-causing hairstyles or headgear. Medical therapy may be warranted and consists of a single agent or combination regimen to include oral or topical antibiotics, topical or intralesional steroids, and topical minoxidil.13,18
Figure 5. Traction alopecia (TA) in a female servicemember. Nonmarginal TA (short arrow), marginal TA (long arrow), and fringe sign (arrowhead). Photograph courtesy of Leonard Sperling, MD (Bethesda, Maryland).17
Final Thoughts
Military hair-grooming standards have evolved over time. Recent changes show that the US Department of Defense is seriously evaluating policies that may be inherently exclusive. Prior grooming standards resulted in the widespread use of tight hairstyles and harsh hair treatments among female servicemembers with long hair. These practices resulted in TN, extracranial headaches, and TA, among other hair and scalp disorders. These occupational-related hair conditions impact female servicemembers’ mental and physical well-being and thus impact military readiness. Physicians should recognize that these conditions can be related to occupational grooming standards that may impact hair care practices.
The challenge that remains is a lack of standardized documentation for hair and scalp symptoms in the medical record. Due to a paucity in reporting and documentation, limited objective data exist to guide future recommendations for military grooming standards. Another obstacle is the lack of knowledge of hair diseases among primary care providers and patients, especially due to the underrepresentation of ethnic hair in medical textbooks.19 As a result, women frequently accept their hair symptoms as normal and either suffer through them, cut their hair short, or wear wigs before considering a visit to the doctor. Furthermore, hair-grooming standards can expose racial disparities, which are the driving force behind the current policy changes. Clinicians can strive to ask about hair and scalp symptoms and document the following in relation to hair and scalp disorders: occupational grooming requirements; skin and hair type; location, number, and size of scalp lesion(s); onset; duration; current and prior hair care practices; history of treatment; and clinical course accompanied with photographic documentation. Ultimately, improved awareness in patients, collaboration between physicians, and consistent clinical documentation can help create positive change and continued improvement in hair-grooming standards within the military. Improved reporting and documentation will facilitate further study into the effectiveness of the updated hair-grooming standards in female servicemembers.
References
United States Air Force Statistical Digest FY 1999. United States Air Force; 2000. Accessed June 8, 2021. https://media.defense.gov/2011/Apr/14/2001330240/-1/-1/0/AFD-110414-048.pdf
Air Force demographics. Air Force Personnel Center website. Accessed June 8, 2021. https://www.afpc.af.mil/About/Air-Force-Demographics/
US Department of the Army. Wear and Appearance of Army Uniforms and Insignia: Army Regulation 670-1. Department of the Army; 2021. Accessed June 8, 2021. https://armypubs.army.mil/epubs/DR_pubs/DR_a/ARN30302-AR_670-1-000-WEB-1.pdf
Losey S. Loc hairstyles, off-duty earrings for men ok’d in new dress regs. Air Force Times. Published July 16, 2018. Accessed June 8, 2021. https://www.airforcetimes.com/news/your-air-force/2018/07/16/loc-hairstyles-off-duty-earrings-for-men-okd-in-new-dress-regs/
Department of the Air Force. AFT 36-2903,Dress and Personal Appearance of Air Force Personnel. Department of the Air Force; 2011. Accessed June 8, 2021. https://www.uc.edu/content/dam/uc/afrotc/docs/Documents/AFI36-2903.pdf
Department of the Air Force. AFT 36-2903,Dress and Personal Appearance of Air Force Personnel. Department of the Air Force; 2021. Accessed June 8, 2021. https://static.e-publishing.af.mil/production/1/af_a1/publication/afi36-2903/afi36-2903.pdf
U.S. Navy uniform regulations: summary of changes (26 February 2020). Navy Personnel Command website. Accessed June 8, 2021. https://www.mynavyhr.navy.mil/Portals/55/Navy%20Uniforms/Uniform%20Regulations/Documents/SOC_2020_02_26.pdf?ver=y8Wd0ykVXgISfFpOy8qHkg%3d%3d
US Headquarters Marine Corps. Marine Corps Uniform Regulations: Marine Corps Order 1020.34H. United States Marine Corps, 2018. Accessed June 8, 2021. https://www.marines.mil/portals/1/Publications/MCO%201020.34H%20v2.pdf?ver=2018-06-26-094038-137
Secretary of the Air Force Public Affairs. Air Force to allow longer braids, ponytails, bangs for women. United States Air Force website. Published January 21, 2021. Accessed June 8, 2021. https://www.af.mil/News/Article-Display/Article/2478173/air-force-to-allow-longer-braids-ponytails-bangs-for-women/
Britzky H. The Army will now allow women to wear ponytails in all uniforms. Task & Purpose. Published May 6, 2021. Accessed June 8, 2021. https://taskandpurpose.com/news/army-women-ponytails-all-uniforms/
Secretary of the Air Force Public Affairs. Air Force readdresses women’s hair standard after feedback. US Air Force website. Published June 11, 2021. Accessed June 27, 2021. https://www.af.mil/News/Article-Display/Article/2654774/air-force-readdresses-womens-hair-standard-after-feedback/
Myers M. Esper direct services to review racial bias in grooming standards, training and more. Air Force Times. Published July 15, 2020. Accessed June 8, 2021. https://www.airforcetimes.com/news/your-military/2020/07/15/esper-directs-services-to-review-racial-bias-in-grooming-standards-training-and-more/
Madu P, Kundu RV. Follicular and scarring disorders in skin of color: presentation and management. Am J Clin Dermatol. 2014;15:307-321.
Quaresma M, Martinez Velasco M, Tosti A. Hair breakage in patients of African descent: role of dermoscopy. Skin Appendage Disord. 2015;1:99-104.
Burch RC, Loder S, Loder E, et al. The prevalence and burden of migraine and severe headache in the United States: updated statistics from government health surveillance studies. Headache. 2015;55:21-34.
Kararizou E, Bougea AM, Giotopoulou D, et al. An update on the less-known group of other primary headaches—a review. Eur Neurol Rev. 2014;9:71-77.
Sperling L, Cowper S, Knopp E. An Atlas of Hair Pathology with Clinical Correlations. CRC Press; 2012:67-68.
Billero V, Miteva M. Traction alopecia: the root of the problem. Clin Cosmet Investig Dermatol. 2018;11:149-159.
Adelekun A, Onyekaba G, Lipoff JB. Skin color in dermatology textbooks: an updated evaluation and analysis. J Am Acad Dermatol. 2021;84:194-196.
Drs. May Franklin and Wohltmann are from the San Antonio Military Medical Center, Texas. Dr. May Franklin is from the Transitional Year Program, and Dr. Wohltmann is from the Department of Pathology. Dr. Wong is from the Department of Dermatology, San Antonio Uniformed Services Health Education Consortium.
The authors report no conflict of interest.
The views expressed are those of the authors and do not reflect the official views or policy of the Department of Defense or its Components.
Correspondence: Emily B. Wong, MD, 1100 Wilford Hall Loop, Joint Base San Antonio—Lackland AFB, TX 78236 ([email protected]).
Author and Disclosure Information
Drs. May Franklin and Wohltmann are from the San Antonio Military Medical Center, Texas. Dr. May Franklin is from the Transitional Year Program, and Dr. Wohltmann is from the Department of Pathology. Dr. Wong is from the Department of Dermatology, San Antonio Uniformed Services Health Education Consortium.
The authors report no conflict of interest.
The views expressed are those of the authors and do not reflect the official views or policy of the Department of Defense or its Components.
Correspondence: Emily B. Wong, MD, 1100 Wilford Hall Loop, Joint Base San Antonio—Lackland AFB, TX 78236 ([email protected]).
IN PARTNERSHIP WITH THE ASSOCIATION OF MILITARY DERMATOLOGISTS
IN PARTNERSHIP WITH THE ASSOCIATION OF MILITARY DERMATOLOGISTS
Professional appearance of servicemembers has been a long-standing custom in the US Military. Specific standards are determined by each branch. Initially, men dominated the military.1,2 As the number of women as well as racial diversity increased in the military, modifications to grooming standards were slow to change and resulted in female hair standards requiring a uniform tight and sleek style or short haircut. Clinicians can be attuned to these occupational standards and their implications on the diagnosis and management of common diseases of the hair and scalp.
History of Hairstyle Standards for Female Servicemembers
For half a century, female servicemembers had limited hairstyle choices. They were not authorized to have hair shorter than one-quarter inch in length. They could choose either short hair worn down or long hair with neatly secured loose ends in the form of a bun or a tucked braid—both of which could not extend past the bottom edge of the uniform collar.3-5 Female navy sailors and air force airmen with long hair were only allowed to wear ponytails during physical training; however, army soldiers previously were limited to wearing a bun.3,6,7 Cornrows and microbraids were authorized in the mid-1990s for the US Air Force, but policy stated that locs were prohibited due to their “unkempt” and “matted” nature. Furthermore, the size of hair bulk in the air force was restricted to no more than 3 inches and could not obstruct wear of the uniform cap.5 Based on these regulations, female servicemembers with longer hair had to utilize tight hairstyles that caused prolonged traction and pressure along the scalp, which contributed to headaches, a sore scalp, and alopecia over time. Normalization of these symptoms led to underreporting, as women lived with the consequences or turned to shorter hairstyles.
In the last decade alone, female servicemembers have witnessed the greatest number of changes in authorized hairstyles despite being part of the military for more than 50 years (Figure 1).1-11 In 2014, the language used in the air force instructions to describe locs was revised to remove ethnically offensive terms.4,5 This same year, the army allowed female soldiers to wear ponytails during physical training, a privilege that had been authorized by other services years prior.3,6,7 By the end of 2018, locs were authorized by all services, and female sailors could wear a ponytail in all navy uniforms as long as it did not extend 3 inches below the collar.3,4,6-8 In 2018, the air force increased authorized hair bulk up to 3.5 inches from the previous mandate of 3 inches and approved female buzz cuts6,9; in 2020, it allowed hair bulk up to 4 inches. As of 2021, female airmen can wear a ponytail and/or braid(s) as long as it starts below the crown of the head and the length does not extend below a horizontal line running between the top of each sleeve inseam at the underarm (Figures 2–4).6 In an ongoing effort to be more inclusive of hair density differences, female airmen will be authorized to wear a ponytail not exceeding a maximum width bulk of 1 ft starting June 25, 2021, so long as they can comply with the above regulations.11 The army now allows ponytails and braids across all uniforms, as long they do not extend past the bottom of the shoulder blades. This change came just months after authorizing the wearing of ponytails tucked under the uniform blouse with tactical headgear.10 These changes allow for a variety of hairstyles for members to practice while avoiding the physical consequences that develop from repetitive traction and pressure along the same areas of the hair and scalp.
Figure 1. Timeline of female servicemembers’ hair-grooming standards.1-11
Figure 2. Authorized ponytail and braid(s) for female US Air Force airmen.6,9 The horizontal rule signifies the longest ponytail. Photograph by 94th Airlift Wing, the Defense Visual Information Distribution Service.
Figure 3. Authorized hairstyles for female US Air Force airmen.6,9 Photograph by 2nd Lt. Deborah Ou-Yang, courtesy of the Defense Visual Information Distribution Service.
Figure 4. A, A US Air Force pilot wearing a braid. B and C, A US Air Force aircraft maintainer and loadmaster wearing ponytails under the new grooming regulations. Photographs by Senior Airman Jaylen Molden, Airman 1st Class Taylor Slater, and Senior Airman Hannah Bean, respectively, courtesy of the Defense Visual Information Distribution Service.
The changes in grooming policies are not only an initiative to enhance inclusiveness but also address gender and racial injustices and medical conditions related to grooming standards.9-12 In addition, these policies now authorize practical day-to-day hairstyles for many female servicemembers to perform their jobs more efficiently while still looking professional; for example, female pilots often had to wear their hair in ponytails, even though it was not previously allowed, for their helmets to fit. Female servicemembers also had to wear their hair down for gas masks or respirators to fit appropriately (Figure 4). Similarly, female army soldiers wore their hair down so their helmets would fit more comfortably during field operations even though no regulations allowed them to do so. The policy changes address various ethnic hair types, especially Black hair. Black women are at highest risk for alopecia secondary to both intrinsic and extrinsic factors. Intrinsically, they have an elliptically shaped hair shaft with retrocurvature of the hair follicle when compared to the oval-shaped shaft and straight follicles seen in White hair.13 Black individuals also have an overall reduced total hair density, slower rate of hair growth, and reduced sebum secretion when compared to White individuals. These factors as well as common styling practices such as chemical and thermal hair straightening leave Black hair more fragile, dry, and prone to developing knots and breakage.13 New hair regulations allow Black women to meet professional military standards while limiting the need for harsh and damaging styling practices.
Common Hair Disorders in Female Servicemembers
Herein, we discuss 3 of the most common hair and scalp disorders linked to grooming practices utilized by women to meet prior military regulations: trichorrhexis nodosa (TN), extracranial headaches, and traction alopecia (TA). It is essential that health care providers are able to promptly recognize these conditions, understand their risk factors, and be familiar with first-line treatment options. With these new standards, the hope is that the incidence of the following conditions decreases, thus improving servicemembers’ medical readiness and overall quality of life.
Trichorrhexis Nodosa Acquired TN is a defect in the hair shaft that causes the hair to break easily secondary to chemical, thermal, or mechanical trauma. This can include but is not limited to chemical relaxers, blow-dryers, excessive brushing or styling, flat irons, and tightly packed hairstyles. The condition is characterized by a thickened hair diameter and splitting at the tip. Clinically, it may present as brittle, lusterless, broken hair with split ends, as well as a positive tug test.14 Management includes gentle hair care and avoidance of harsh hair care practices and treatments.
Extracranial Headaches Headaches are a common concern among military servicemembers15 and generally are classified as primary or secondary. A less commonly discussed primary headache disorder includes external-pressure headaches, which result from either sustained compression or traction of the soft tissues of the scalp, usually from wearing headbands, helmets, or tight hairstyles.16 Additional at-risk groups include those who chronically wear surgical scrub caps or flight caps, especially if clipped or pinned to the hair. In our 38 years of combined military clinical experience, we can attest that these types of headaches are common among female servicemembers. The diagnostic criteria for an external-pressure headache, commonly referred to by patients as a “ponytail headache,” includes at least 2 headache episodes triggered within 1 hour of sustained traction on the scalp, maximal at the site of traction and resolving within 1 hour after relieving the traction.16 Management includes removal of the pressure-causing source, usually a tight ponytail or bun.
Traction Alopecia Traction alopecia is hair loss caused by repetitive or prolonged tension on the hair secondary to tight hairstyles. It can be clinically classified into 2 types: marginal and nonmarginal patchy alopecia (Figure 5).13,17,18 Traction alopecia most commonly is found in individuals with ethnic hair, predominantly Black women. Hairstyles with the highest risk for causing TA include tight buns, ponytails, cornrows, weaves, and locs—all of which are utilized by female servicemembers to maintain a professional appearance and adhere to grooming regulations.13,18 Other groups at risk include athletes (eg, ballerinas, gymnasts) and those with chronic headwear use (eg, turbans, helmets, nurse caps, wigs).18 Early TA typically presents with perifollicular erythema followed by follicular-based papules or pustules.13,18 Marginal TA classically includes frontotemporal hair loss or thinning with or without a fringe sign.17,18 Nonmarginal TA includes patchy alopecia most commonly involving the parietal or occipital scalp, seen with chignons, buns, ponytails, or the use of clips, extensions, or bobby pins.18 The first line in management is avoidance of traction-causing hairstyles or headgear. Medical therapy may be warranted and consists of a single agent or combination regimen to include oral or topical antibiotics, topical or intralesional steroids, and topical minoxidil.13,18
Figure 5. Traction alopecia (TA) in a female servicemember. Nonmarginal TA (short arrow), marginal TA (long arrow), and fringe sign (arrowhead). Photograph courtesy of Leonard Sperling, MD (Bethesda, Maryland).17
Final Thoughts
Military hair-grooming standards have evolved over time. Recent changes show that the US Department of Defense is seriously evaluating policies that may be inherently exclusive. Prior grooming standards resulted in the widespread use of tight hairstyles and harsh hair treatments among female servicemembers with long hair. These practices resulted in TN, extracranial headaches, and TA, among other hair and scalp disorders. These occupational-related hair conditions impact female servicemembers’ mental and physical well-being and thus impact military readiness. Physicians should recognize that these conditions can be related to occupational grooming standards that may impact hair care practices.
The challenge that remains is a lack of standardized documentation for hair and scalp symptoms in the medical record. Due to a paucity in reporting and documentation, limited objective data exist to guide future recommendations for military grooming standards. Another obstacle is the lack of knowledge of hair diseases among primary care providers and patients, especially due to the underrepresentation of ethnic hair in medical textbooks.19 As a result, women frequently accept their hair symptoms as normal and either suffer through them, cut their hair short, or wear wigs before considering a visit to the doctor. Furthermore, hair-grooming standards can expose racial disparities, which are the driving force behind the current policy changes. Clinicians can strive to ask about hair and scalp symptoms and document the following in relation to hair and scalp disorders: occupational grooming requirements; skin and hair type; location, number, and size of scalp lesion(s); onset; duration; current and prior hair care practices; history of treatment; and clinical course accompanied with photographic documentation. Ultimately, improved awareness in patients, collaboration between physicians, and consistent clinical documentation can help create positive change and continued improvement in hair-grooming standards within the military. Improved reporting and documentation will facilitate further study into the effectiveness of the updated hair-grooming standards in female servicemembers.
References
United States Air Force Statistical Digest FY 1999. United States Air Force; 2000. Accessed June 8, 2021. https://media.defense.gov/2011/Apr/14/2001330240/-1/-1/0/AFD-110414-048.pdf
Air Force demographics. Air Force Personnel Center website. Accessed June 8, 2021. https://www.afpc.af.mil/About/Air-Force-Demographics/
US Department of the Army. Wear and Appearance of Army Uniforms and Insignia: Army Regulation 670-1. Department of the Army; 2021. Accessed June 8, 2021. https://armypubs.army.mil/epubs/DR_pubs/DR_a/ARN30302-AR_670-1-000-WEB-1.pdf
Losey S. Loc hairstyles, off-duty earrings for men ok’d in new dress regs. Air Force Times. Published July 16, 2018. Accessed June 8, 2021. https://www.airforcetimes.com/news/your-air-force/2018/07/16/loc-hairstyles-off-duty-earrings-for-men-okd-in-new-dress-regs/
Department of the Air Force. AFT 36-2903,Dress and Personal Appearance of Air Force Personnel. Department of the Air Force; 2011. Accessed June 8, 2021. https://www.uc.edu/content/dam/uc/afrotc/docs/Documents/AFI36-2903.pdf
Department of the Air Force. AFT 36-2903,Dress and Personal Appearance of Air Force Personnel. Department of the Air Force; 2021. Accessed June 8, 2021. https://static.e-publishing.af.mil/production/1/af_a1/publication/afi36-2903/afi36-2903.pdf
U.S. Navy uniform regulations: summary of changes (26 February 2020). Navy Personnel Command website. Accessed June 8, 2021. https://www.mynavyhr.navy.mil/Portals/55/Navy%20Uniforms/Uniform%20Regulations/Documents/SOC_2020_02_26.pdf?ver=y8Wd0ykVXgISfFpOy8qHkg%3d%3d
US Headquarters Marine Corps. Marine Corps Uniform Regulations: Marine Corps Order 1020.34H. United States Marine Corps, 2018. Accessed June 8, 2021. https://www.marines.mil/portals/1/Publications/MCO%201020.34H%20v2.pdf?ver=2018-06-26-094038-137
Secretary of the Air Force Public Affairs. Air Force to allow longer braids, ponytails, bangs for women. United States Air Force website. Published January 21, 2021. Accessed June 8, 2021. https://www.af.mil/News/Article-Display/Article/2478173/air-force-to-allow-longer-braids-ponytails-bangs-for-women/
Britzky H. The Army will now allow women to wear ponytails in all uniforms. Task & Purpose. Published May 6, 2021. Accessed June 8, 2021. https://taskandpurpose.com/news/army-women-ponytails-all-uniforms/
Secretary of the Air Force Public Affairs. Air Force readdresses women’s hair standard after feedback. US Air Force website. Published June 11, 2021. Accessed June 27, 2021. https://www.af.mil/News/Article-Display/Article/2654774/air-force-readdresses-womens-hair-standard-after-feedback/
Myers M. Esper direct services to review racial bias in grooming standards, training and more. Air Force Times. Published July 15, 2020. Accessed June 8, 2021. https://www.airforcetimes.com/news/your-military/2020/07/15/esper-directs-services-to-review-racial-bias-in-grooming-standards-training-and-more/
Madu P, Kundu RV. Follicular and scarring disorders in skin of color: presentation and management. Am J Clin Dermatol. 2014;15:307-321.
Quaresma M, Martinez Velasco M, Tosti A. Hair breakage in patients of African descent: role of dermoscopy. Skin Appendage Disord. 2015;1:99-104.
Burch RC, Loder S, Loder E, et al. The prevalence and burden of migraine and severe headache in the United States: updated statistics from government health surveillance studies. Headache. 2015;55:21-34.
Kararizou E, Bougea AM, Giotopoulou D, et al. An update on the less-known group of other primary headaches—a review. Eur Neurol Rev. 2014;9:71-77.
Sperling L, Cowper S, Knopp E. An Atlas of Hair Pathology with Clinical Correlations. CRC Press; 2012:67-68.
Billero V, Miteva M. Traction alopecia: the root of the problem. Clin Cosmet Investig Dermatol. 2018;11:149-159.
Adelekun A, Onyekaba G, Lipoff JB. Skin color in dermatology textbooks: an updated evaluation and analysis. J Am Acad Dermatol. 2021;84:194-196.
The world is an increasingly diverse place, which has particular relevance for the dermatologist. Skin color plays a significant role in diagnostic approach, as there are important differences in how cutaneous disease presents in patients with skin of color (SOC). Therefore, education about these differences is imperative. In this review, we focus on allergic contact dermatitis (ACD) and patch testing in patients with SOC. We discuss allergens common to this demographic and challenges encountered in patch testing patients with SOC. We also identify key health care disparities in the evaluation and management of ACD in this population.
Has contact allergy in SOC populations been studied in North America?
Over the last 2 decades, there have been only a handful of North American studies that address contact allergy in SOC populations. Patch test results from 114 Black patients and 877 White patients at the Cleveland Clinic from 1988 to 1991 showed that overall allergy frequency was relatively similar (43.0% vs 43.6%). There were notable differences in allergen sensitization. Paraphenylenediamine (PPD), which is used in hair dye, had more positive patch test reactions in Black patients (10.6% vs 4.5%), and both PPD (21.2% vs 4.2%) and imidazolidinyl urea, a formaldehyde-releasing preservative (9.1% vs 2.6%), were more frequently allergenic in Black men compared to White men.1 Patch test results from the North American Contact Dermatitis Group from 1992 to 1998 described similar results, with minimal variation in the prevalence of ACD among 1014 Black and 8610 White patients (47%–49% vs 46%–49%).2 Positive patch test reactions to PPD were higher in Black patients for 2 of 3 test cycles (13.5% vs 5.8% [1994-1996] and 10.3% vs 5.3% [1996-1998]). Positive patch test reactions were higher in White patients for dimethylol dimethyl hydantoin, a formaldehyde-releasing preservative, also for 2 of 3 test cycles (1.8% vs 0% [1992-1994] and 2.8% vs 0.3% [1994-1996]). Finally, positive patch test reactions to thioureas (rubber accelerators) had a mixed picture: 2 test cycles were higher in Black patients (1.9% vs 1.0% [1992-1994] and 1.3% vs 0.7% [1994-1996]), but the third cycle (1996-1998) was lower (0.7% vs 1.4%). Positive patch test reactions to the metal cobalt chloride were higher in Black patients in just 1 test cycle (9.2% vs 6.6% [1992-1994]). The authors suggested that the use of darker hair dyes in the Black community may lead to more sensitization to PPD. They also theorized that this population’s more frequent use of ointment-based skin care products may make them less susceptible to sensitization to preservatives such as formaldehyde, which more commonly are found in water-based products such as creams. They concluded that differences in sensitization patterns likely were driven by cultural practices affecting exposures.2
In 2016, the North American Contact Dermatitis Group reported patch test results in 434 Black and 6634 White patients (1998-2006).3 Again, ACD prevalence was about the same in both groups (45.9% vs 43.6%). However, they reported several allergens with different reaction patterns. Black patients had higher risk ratios (RRs) for 3 rubber accelerators: mercaptobenzothiazole (RR, 2.10), mercapto mix (RR, 2.27), and thiuram mix (RR, 1.44). They also reacted to PPD (RR, 1.56) and the antibiotic bacitracin (RR, 1.34) at higher frequencies than White patients, who more frequently reacted to formaldehyde (RR, 0.58); the formaldehyde-releasing preservatives quaternium-15 (RR, 0.63) and diazolidinyl urea (in petrolatum: RR, 0.44; aqueous: RR, 0.47); the clothing finish ethylene urea melamine formalin resin (RR, 0.45); and the fragrances fragrance mix 1 (RR, 0.65) and balsam of Peru (RR, 0.55).3
Patch testing of 139 African American or Black patients at the Cleveland Clinic (2003-2012) revealed that this population most commonly had positive reactions to nickel (27.5%), fragrance mix (18.1%), bacitracin (13.0%), balsam of Peru (12.3%), and PPD (10.9%). The authors highlighted unique features of physical examination in patients with darker skin types, including lichenification and/or hyperpigmentation in those with ACD and the potential for lack of erythema and/or a papular reaction with patch test readings.4 Recently, data was presented at the American Contact Dermatitis Society Annual Meeting (March 2021) on patterns of ACD in Black and White patch tested patients in Philadelphia (2009-2019).5 Using the North American 80 comprehensive series, the researchers documented statistically significant differences in allergen sensitivity between the 2 groups. Black patients reacted to disperse blue dye (P=.019) and textile dye mix (P=.001) at higher frequencies. There was a nonsignificant trend of more frequent positive reactions to PPD in Black patients (11% vs 6%).5
Notably, all of these studies examined only 1 or 2 racial groups with a focus on Black patients. Some authors commented that this was due to low numbers of Hispanic, Asian and Pacific Islander, and Native American patients in tested populations.2,3,5 With approximately 13% of the US population self-identifying as Black,6 these patients and other minority races typically are underrepresented in large patch test studies. More data on patch test results for these groups is necessary for a complete understanding of patch testing in patients with SOC.
What are the challenges in patch testing SOC populations?
Patch testing in patients with SOC requires additional skills and experience. Darker skin does not reveal erythema as strikingly as lighter skin, making it more difficult to appreciate subtle color changes. Moreover, multiple studies have shown that ACD can have different presentations in Black patients.4,7,8 Lichenification and hyperpigmentation may be early signs of ACD in comparison to bright erythema and vesicles that can be seen in lighter skin types. It also has been reported that scalp ACD can be mistaken for seborrheic dermatitis due to lack of erythema.7 Without a high degree of clinical suspicion, a diagnosis of ACD can be missed in this patient population.
Patch test interpretation also can be challenging in patients with SOC. An early papular or follicular eruption with minimal erythema can signal a positive reaction.4,7 Because of these potentially subtle changes, patch testers should exercise care and attention when reading results for SOC populations. We recommend ample side lighting, palpation for adequate identification of positive reactions, and double-checking for positives that may have been overlooked on the initial review of findings.4,7
What health care disparities impact the evaluation and management of ACD?
There are many factors at play in this dialogue. The challenges we identified in diagnosing ACD in darker skin types are important to consider. Lack of familiarity with these unique features can lead to a delay in diagnosis and ultimately a delay in referral for patch testing. This is where dermatology training can help fill in the gap, but are the majority of programs equipped to do so? Inadequate education and exposure to patients with SOC is an issue for many dermatology residency programs. Surveys of residents and program directors in geographically less diverse regions may not receive adequate education or exposure to patients with SOC.9 Further, there is a lack of representation of SOC images for general dermatologic conditions in textbooks,10,11 which has a profound impact on the dermatologist’s ability to recognize common diseases in darker skin types. A 2019 survey of more than 5000 images from 2 dermatology textbooks showed SOC images comprised 22% to 32% of the total images.11 However, SOC images are overrepresented in textbooks for sexually transmitted infections, constituting 47% to 58% of the images; they made up 28% of images for nonvenereal infections.11 Why is that? In this article, we have shown the prevalence of ACD to be nearly equivalent in Black and White patients, yet a perusal of ACD images in dermatology textbooks will tell a different story. This trend deserves our attention; perhaps it is highlighting patterns of systemic racism seen in medicine. If our primary teaching materials are perpetuating stereotypes, we must consider the impact this can have on our personal implicit biases and the health care disparities that can ensue.
Additional factors impact time to diagnosis of ACD and referral for patch testing. A retrospective study examining distance to a North Carolina patch test referral clinic showed that patients living further from the clinic experienced a longer duration of dermatitis prior to patch test consultation and tended to live in areas with a higher county poverty rate.12 Specifically, a 17.9% increase (P<.001) in the median duration of dermatitis was observed for every 50-mile increase in distance to the patch test clinic. County poverty rate was measured by the percentage of residents living below the poverty threshold; for every 5% increase in county poverty rate, a 16.3% increase (P<.032) in duration of dermatitis was found.12
These data highlight a relationship with which many dermatologists are familiar and underscore a need for dermatologists to practice in areas that are more geographically accessible. The recently increased utilization of telehealth modalities can potentially help to bridge this gap by decreasing delays in diagnosis and providing more affordable options for evaluation by a dermatologist for patients with socioeconomic obstacles.
Final Interpretation
The prevalence of ACD among Black and White patients is similar; however, there are important differences in patch test reaction frequencies that may be related to the diverse exposure patterns for each group. Additionally, patients with SOC may have unique clinical presentations of ACD, such as lichenification and hyperpigmentation. Darker skin types also may require specialized techniques for accurate patch test readings. It is imperative that dermatologists are trained to recognize all of these features. Health care disparities come in many forms and, in this setting, can result in delayed referral for patch testing. Additional studies are needed to further examine these health care disparities and identify potential solutions.
References
Dickel H, Taylor JS, Evey P, et al. Comparison of patch test results with a standard series among white and black racial groups. Am J Contact Dermat. 2001;12:77-82.
Deleo VA, Taylor SC, Belsito DV, et al. The effect of race and ethnicity on patch test results. J Am Acad Dermatol. 2002;46(2 suppl understanding):S107-S112.
Deleo VA, Alexis A, Warshaw EM, et al. The association of race/ethnicity and patch test results: North American Contact Dermatitis Group, 1998-2006. Dermatitis. 2016;27:288-292.
Yu SH, Khanna U, Taylor JS, et al. Patch testing in the African American population: a 10-year experience. Dermatitis. 2019;30:277-278.
Garg VS, Zhan, T, Brod B, et al. Patterns of allergic contact dermatitis in African Americans and Caucasians in a major metropolitan area over a ten-year period. Presented at: 32nd American Contact Dermatitis Society Annual Meeting (virtual); March 17-18, 2021.
United States Census Bureau. QuickFacts—United States. Accessed June 11, 2021. https://www.census.gov/quickfacts/fact/table/US/PST045219
Stallings A, Sood A. Hair-care practices in African American women: potential for allergic contact dermatitis. Semin Cutan Med Surg. 2016;35:207-210.
Otrofanowei E, Ayanlowo OO, Akinkugbe A, et al. Clinico-etiologic profile of hand dermatitis and patch response of patients at a tertiary hospital in Lagos, Nigeria: results of a prospective observational study. Int J Dermatol. 2018;57:149-155.
Nijhawan RI, Jacob SE, Woolery-Lloyd H. Skin of color education in dermatology residency programs: does residency training reflect the changing demographics of the United States? J Am Acad Dermatol. 2008;59:615-618.
Ebede T, Papier A. Disparities in dermatology educational resources. J Am Acad Dermatol. 2006;55:687-690.
Lester JC, Taylor SC, Chren MM. Under-representation of skin of colour in dermatology images: not just an educational issue. Br J Dermatol. 2019;180:1521-1522.
Rodriguez-Homs LG, Liu B, Green CL, et al. Duration of dermatitis before patch test appointment is associated with distance to clinic and county poverty rate. Dermatitis. 2020;31:259-264.
Drs. Scott and Atwater are from the Department of Dermatology, Duke University School of Medicine, Durham, North Carolina. Dr. Reeder is from the Department of Dermatology, University of Wisconsin School of Medicine and Public Health, Madison.
Drs. Scott and Reeder report no conflict of interest.Dr. Atwater is Immediate Past President of the American Contact Dermatitis Society (ACDS).
The world is an increasingly diverse place, which has particular relevance for the dermatologist. Skin color plays a significant role in diagnostic approach, as there are important differences in how cutaneous disease presents in patients with skin of color (SOC). Therefore, education about these differences is imperative. In this review, we focus on allergic contact dermatitis (ACD) and patch testing in patients with SOC. We discuss allergens common to this demographic and challenges encountered in patch testing patients with SOC. We also identify key health care disparities in the evaluation and management of ACD in this population.
Has contact allergy in SOC populations been studied in North America?
Over the last 2 decades, there have been only a handful of North American studies that address contact allergy in SOC populations. Patch test results from 114 Black patients and 877 White patients at the Cleveland Clinic from 1988 to 1991 showed that overall allergy frequency was relatively similar (43.0% vs 43.6%). There were notable differences in allergen sensitization. Paraphenylenediamine (PPD), which is used in hair dye, had more positive patch test reactions in Black patients (10.6% vs 4.5%), and both PPD (21.2% vs 4.2%) and imidazolidinyl urea, a formaldehyde-releasing preservative (9.1% vs 2.6%), were more frequently allergenic in Black men compared to White men.1 Patch test results from the North American Contact Dermatitis Group from 1992 to 1998 described similar results, with minimal variation in the prevalence of ACD among 1014 Black and 8610 White patients (47%–49% vs 46%–49%).2 Positive patch test reactions to PPD were higher in Black patients for 2 of 3 test cycles (13.5% vs 5.8% [1994-1996] and 10.3% vs 5.3% [1996-1998]). Positive patch test reactions were higher in White patients for dimethylol dimethyl hydantoin, a formaldehyde-releasing preservative, also for 2 of 3 test cycles (1.8% vs 0% [1992-1994] and 2.8% vs 0.3% [1994-1996]). Finally, positive patch test reactions to thioureas (rubber accelerators) had a mixed picture: 2 test cycles were higher in Black patients (1.9% vs 1.0% [1992-1994] and 1.3% vs 0.7% [1994-1996]), but the third cycle (1996-1998) was lower (0.7% vs 1.4%). Positive patch test reactions to the metal cobalt chloride were higher in Black patients in just 1 test cycle (9.2% vs 6.6% [1992-1994]). The authors suggested that the use of darker hair dyes in the Black community may lead to more sensitization to PPD. They also theorized that this population’s more frequent use of ointment-based skin care products may make them less susceptible to sensitization to preservatives such as formaldehyde, which more commonly are found in water-based products such as creams. They concluded that differences in sensitization patterns likely were driven by cultural practices affecting exposures.2
In 2016, the North American Contact Dermatitis Group reported patch test results in 434 Black and 6634 White patients (1998-2006).3 Again, ACD prevalence was about the same in both groups (45.9% vs 43.6%). However, they reported several allergens with different reaction patterns. Black patients had higher risk ratios (RRs) for 3 rubber accelerators: mercaptobenzothiazole (RR, 2.10), mercapto mix (RR, 2.27), and thiuram mix (RR, 1.44). They also reacted to PPD (RR, 1.56) and the antibiotic bacitracin (RR, 1.34) at higher frequencies than White patients, who more frequently reacted to formaldehyde (RR, 0.58); the formaldehyde-releasing preservatives quaternium-15 (RR, 0.63) and diazolidinyl urea (in petrolatum: RR, 0.44; aqueous: RR, 0.47); the clothing finish ethylene urea melamine formalin resin (RR, 0.45); and the fragrances fragrance mix 1 (RR, 0.65) and balsam of Peru (RR, 0.55).3
Patch testing of 139 African American or Black patients at the Cleveland Clinic (2003-2012) revealed that this population most commonly had positive reactions to nickel (27.5%), fragrance mix (18.1%), bacitracin (13.0%), balsam of Peru (12.3%), and PPD (10.9%). The authors highlighted unique features of physical examination in patients with darker skin types, including lichenification and/or hyperpigmentation in those with ACD and the potential for lack of erythema and/or a papular reaction with patch test readings.4 Recently, data was presented at the American Contact Dermatitis Society Annual Meeting (March 2021) on patterns of ACD in Black and White patch tested patients in Philadelphia (2009-2019).5 Using the North American 80 comprehensive series, the researchers documented statistically significant differences in allergen sensitivity between the 2 groups. Black patients reacted to disperse blue dye (P=.019) and textile dye mix (P=.001) at higher frequencies. There was a nonsignificant trend of more frequent positive reactions to PPD in Black patients (11% vs 6%).5
Notably, all of these studies examined only 1 or 2 racial groups with a focus on Black patients. Some authors commented that this was due to low numbers of Hispanic, Asian and Pacific Islander, and Native American patients in tested populations.2,3,5 With approximately 13% of the US population self-identifying as Black,6 these patients and other minority races typically are underrepresented in large patch test studies. More data on patch test results for these groups is necessary for a complete understanding of patch testing in patients with SOC.
What are the challenges in patch testing SOC populations?
Patch testing in patients with SOC requires additional skills and experience. Darker skin does not reveal erythema as strikingly as lighter skin, making it more difficult to appreciate subtle color changes. Moreover, multiple studies have shown that ACD can have different presentations in Black patients.4,7,8 Lichenification and hyperpigmentation may be early signs of ACD in comparison to bright erythema and vesicles that can be seen in lighter skin types. It also has been reported that scalp ACD can be mistaken for seborrheic dermatitis due to lack of erythema.7 Without a high degree of clinical suspicion, a diagnosis of ACD can be missed in this patient population.
Patch test interpretation also can be challenging in patients with SOC. An early papular or follicular eruption with minimal erythema can signal a positive reaction.4,7 Because of these potentially subtle changes, patch testers should exercise care and attention when reading results for SOC populations. We recommend ample side lighting, palpation for adequate identification of positive reactions, and double-checking for positives that may have been overlooked on the initial review of findings.4,7
What health care disparities impact the evaluation and management of ACD?
There are many factors at play in this dialogue. The challenges we identified in diagnosing ACD in darker skin types are important to consider. Lack of familiarity with these unique features can lead to a delay in diagnosis and ultimately a delay in referral for patch testing. This is where dermatology training can help fill in the gap, but are the majority of programs equipped to do so? Inadequate education and exposure to patients with SOC is an issue for many dermatology residency programs. Surveys of residents and program directors in geographically less diverse regions may not receive adequate education or exposure to patients with SOC.9 Further, there is a lack of representation of SOC images for general dermatologic conditions in textbooks,10,11 which has a profound impact on the dermatologist’s ability to recognize common diseases in darker skin types. A 2019 survey of more than 5000 images from 2 dermatology textbooks showed SOC images comprised 22% to 32% of the total images.11 However, SOC images are overrepresented in textbooks for sexually transmitted infections, constituting 47% to 58% of the images; they made up 28% of images for nonvenereal infections.11 Why is that? In this article, we have shown the prevalence of ACD to be nearly equivalent in Black and White patients, yet a perusal of ACD images in dermatology textbooks will tell a different story. This trend deserves our attention; perhaps it is highlighting patterns of systemic racism seen in medicine. If our primary teaching materials are perpetuating stereotypes, we must consider the impact this can have on our personal implicit biases and the health care disparities that can ensue.
Additional factors impact time to diagnosis of ACD and referral for patch testing. A retrospective study examining distance to a North Carolina patch test referral clinic showed that patients living further from the clinic experienced a longer duration of dermatitis prior to patch test consultation and tended to live in areas with a higher county poverty rate.12 Specifically, a 17.9% increase (P<.001) in the median duration of dermatitis was observed for every 50-mile increase in distance to the patch test clinic. County poverty rate was measured by the percentage of residents living below the poverty threshold; for every 5% increase in county poverty rate, a 16.3% increase (P<.032) in duration of dermatitis was found.12
These data highlight a relationship with which many dermatologists are familiar and underscore a need for dermatologists to practice in areas that are more geographically accessible. The recently increased utilization of telehealth modalities can potentially help to bridge this gap by decreasing delays in diagnosis and providing more affordable options for evaluation by a dermatologist for patients with socioeconomic obstacles.
Final Interpretation
The prevalence of ACD among Black and White patients is similar; however, there are important differences in patch test reaction frequencies that may be related to the diverse exposure patterns for each group. Additionally, patients with SOC may have unique clinical presentations of ACD, such as lichenification and hyperpigmentation. Darker skin types also may require specialized techniques for accurate patch test readings. It is imperative that dermatologists are trained to recognize all of these features. Health care disparities come in many forms and, in this setting, can result in delayed referral for patch testing. Additional studies are needed to further examine these health care disparities and identify potential solutions.
References
Dickel H, Taylor JS, Evey P, et al. Comparison of patch test results with a standard series among white and black racial groups. Am J Contact Dermat. 2001;12:77-82.
Deleo VA, Taylor SC, Belsito DV, et al. The effect of race and ethnicity on patch test results. J Am Acad Dermatol. 2002;46(2 suppl understanding):S107-S112.
Deleo VA, Alexis A, Warshaw EM, et al. The association of race/ethnicity and patch test results: North American Contact Dermatitis Group, 1998-2006. Dermatitis. 2016;27:288-292.
Yu SH, Khanna U, Taylor JS, et al. Patch testing in the African American population: a 10-year experience. Dermatitis. 2019;30:277-278.
Garg VS, Zhan, T, Brod B, et al. Patterns of allergic contact dermatitis in African Americans and Caucasians in a major metropolitan area over a ten-year period. Presented at: 32nd American Contact Dermatitis Society Annual Meeting (virtual); March 17-18, 2021.
United States Census Bureau. QuickFacts—United States. Accessed June 11, 2021. https://www.census.gov/quickfacts/fact/table/US/PST045219
Stallings A, Sood A. Hair-care practices in African American women: potential for allergic contact dermatitis. Semin Cutan Med Surg. 2016;35:207-210.
Otrofanowei E, Ayanlowo OO, Akinkugbe A, et al. Clinico-etiologic profile of hand dermatitis and patch response of patients at a tertiary hospital in Lagos, Nigeria: results of a prospective observational study. Int J Dermatol. 2018;57:149-155.
Nijhawan RI, Jacob SE, Woolery-Lloyd H. Skin of color education in dermatology residency programs: does residency training reflect the changing demographics of the United States? J Am Acad Dermatol. 2008;59:615-618.
Ebede T, Papier A. Disparities in dermatology educational resources. J Am Acad Dermatol. 2006;55:687-690.
Lester JC, Taylor SC, Chren MM. Under-representation of skin of colour in dermatology images: not just an educational issue. Br J Dermatol. 2019;180:1521-1522.
Rodriguez-Homs LG, Liu B, Green CL, et al. Duration of dermatitis before patch test appointment is associated with distance to clinic and county poverty rate. Dermatitis. 2020;31:259-264.