User login
The end of happy hour? No safe level of alcohol for the brain
There is no safe amount of alcohol consumption for the brain; even moderate drinking adversely affects brain structure and function, according a British study of more 25,000 adults.

“This is one of the largest studies of alcohol and brain health to date,” Anya Topiwala, DPhil, University of Oxford (England), told this news organization.
“There have been previous claims the relationship between alcohol and brain health are J-shaped (ie., small amounts are protective), but we formally tested this and did not find it to be the case. In fact, we found that any level of alcohol was associated with poorer brain health, compared to no alcohol,” Dr. Topiwala added.
The study, which has not yet been peer reviewed, was published online May 12 in MedRxiv.
Global impact on the brain
Participants provided detailed information on their alcohol intake. The cohort included 691 never-drinkers, 617 former drinkers, and 24,069 current drinkers.
Median alcohol intake was 13.5 units (102 g) weekly. Almost half of the sample (48.2%) were drinking above current UK low-risk guidelines (14 units, 112 g weekly), but few were heavy drinkers (>50 units, 400 g weekly).
After adjusting for all known potential confounders and multiple comparisons, a higher volume of alcohol consumed per week was associated with lower gray matter in “almost all areas of the brain,” Dr. Topiwala said in an interview.
Alcohol consumption accounted for up to 0.8% of gray matter volume variance. “The size of the effect is small, albeit greater than any other modifiable risk factor. These brain changes have been previously linked to aging, poorer performance on memory changes, and dementia,” Dr. Topiwala said.
Widespread negative associations were also found between drinking alcohol and all the measures of white matter integrity that were assessed. There was a significant positive association between alcohol consumption and resting-state functional connectivity.
Higher blood pressure and body mass index “steepened” the negative associations between alcohol and brain health, and binge drinking had additive negative effects on brain structure beyond the absolute volume consumed.
There was no evidence that the risk for alcohol-related brain harm differs according to the type of alcohol consumed (wine, beer, or spirits).
A key limitation of the study is that the study population from the UK Biobank represents a sample that is healthier, better educated, and less deprived and is characterized by less ethnic diversity than the general population. “As with any observational study, we cannot infer causality from association,” the authors note.
What remains unclear, they say, is the duration of drinking needed to cause an effect on the brain. It may be that vulnerability is increased during periods of life in which dynamic brain changes occur, such as adolescence and older age.
They also note that some studies of alcohol-dependent individuals have suggested that at least some brain damage is reversible upon abstinence. Whether that is true for moderate drinkers is unknown.
On the basis of their findings, there is “no safe dose of alcohol for the brain,” Dr. Topiwala and colleagues conclude. They suggest that current low-risk drinking guidelines be revisited to take account of brain effects.
Experts weigh in
Several experts weighed in on the study in a statement from the nonprofit UK Science Media Center.
Paul Matthews, MD, head of the department of brain sciences, Imperial College London, noted that this “carefully performed preliminary report extends our earlier UK Dementia Research Institute study of a smaller group from same UK Biobank population also showing that even moderate drinking is associated with greater atrophy of the brain, as well as injury to the heart and liver.”
Dr. Matthews said the investigators’ conclusion that there is no safe threshold below which alcohol consumption has no toxic effects “echoes our own. We join with them in suggesting that current public health guidelines concerning alcohol consumption may need to be revisited.”
Rebecca Dewey, PhD, research fellow in neuroimaging, University of Nottingham (England), cautioned that “the degree to which very small changes in brain volume are harmful” is unknown.
“While there was no threshold under which alcohol consumption did not cause changes in the brain, there may a degree of brain volume difference that is irrelevant to brain health. We don’t know what these people’s brains looked like before they drank alcohol, so the brain may have learned to cope/compensate,” Dewey said.
Sadie Boniface, PhD, head of research at the Institute of Alcohol Studies and visiting researcher at King’s College London, said, “While we can’t yet say for sure whether there is ‘no safe level’ of alcohol regarding brain health at the moment, it has been known for decades that heavy drinking is bad for brain health.
“We also shouldn’t forget alcohol affects all parts of the body and there are multiple health risks. For example, it is already known there is ‘no safe level’ of alcohol consumption for the seven types of cancer caused by alcohol, as identified by the UK chief medical officers,” Dr. Boniface said.
The study was supported in part by the Wellcome Trust, Li Ka Shing Center for Health Information and Discovery, the National Institutes of Health, and the UK Medical Research Council. Dr. Topiwala, Dr. Boniface, Dr. Dewey, and Dr. Matthews have disclosed no relevant financial relationships.
A version of this article first appeared on Medscape.com.
There is no safe amount of alcohol consumption for the brain; even moderate drinking adversely affects brain structure and function, according a British study of more 25,000 adults.
“This is one of the largest studies of alcohol and brain health to date,” Anya Topiwala, DPhil, University of Oxford (England), told this news organization.
“There have been previous claims the relationship between alcohol and brain health are J-shaped (ie., small amounts are protective), but we formally tested this and did not find it to be the case. In fact, we found that any level of alcohol was associated with poorer brain health, compared to no alcohol,” Dr. Topiwala added.
The study, which has not yet been peer reviewed, was published online May 12 in MedRxiv.
Global impact on the brain
Participants provided detailed information on their alcohol intake. The cohort included 691 never-drinkers, 617 former drinkers, and 24,069 current drinkers.
Median alcohol intake was 13.5 units (102 g) weekly. Almost half of the sample (48.2%) were drinking above current UK low-risk guidelines (14 units, 112 g weekly), but few were heavy drinkers (>50 units, 400 g weekly).
After adjusting for all known potential confounders and multiple comparisons, a higher volume of alcohol consumed per week was associated with lower gray matter in “almost all areas of the brain,” Dr. Topiwala said in an interview.
Alcohol consumption accounted for up to 0.8% of gray matter volume variance. “The size of the effect is small, albeit greater than any other modifiable risk factor. These brain changes have been previously linked to aging, poorer performance on memory changes, and dementia,” Dr. Topiwala said.
Widespread negative associations were also found between drinking alcohol and all the measures of white matter integrity that were assessed. There was a significant positive association between alcohol consumption and resting-state functional connectivity.
Higher blood pressure and body mass index “steepened” the negative associations between alcohol and brain health, and binge drinking had additive negative effects on brain structure beyond the absolute volume consumed.
There was no evidence that the risk for alcohol-related brain harm differs according to the type of alcohol consumed (wine, beer, or spirits).
A key limitation of the study is that the study population from the UK Biobank represents a sample that is healthier, better educated, and less deprived and is characterized by less ethnic diversity than the general population. “As with any observational study, we cannot infer causality from association,” the authors note.
What remains unclear, they say, is the duration of drinking needed to cause an effect on the brain. It may be that vulnerability is increased during periods of life in which dynamic brain changes occur, such as adolescence and older age.
They also note that some studies of alcohol-dependent individuals have suggested that at least some brain damage is reversible upon abstinence. Whether that is true for moderate drinkers is unknown.
On the basis of their findings, there is “no safe dose of alcohol for the brain,” Dr. Topiwala and colleagues conclude. They suggest that current low-risk drinking guidelines be revisited to take account of brain effects.
Experts weigh in
Several experts weighed in on the study in a statement from the nonprofit UK Science Media Center.
Paul Matthews, MD, head of the department of brain sciences, Imperial College London, noted that this “carefully performed preliminary report extends our earlier UK Dementia Research Institute study of a smaller group from same UK Biobank population also showing that even moderate drinking is associated with greater atrophy of the brain, as well as injury to the heart and liver.”
Dr. Matthews said the investigators’ conclusion that there is no safe threshold below which alcohol consumption has no toxic effects “echoes our own. We join with them in suggesting that current public health guidelines concerning alcohol consumption may need to be revisited.”
Rebecca Dewey, PhD, research fellow in neuroimaging, University of Nottingham (England), cautioned that “the degree to which very small changes in brain volume are harmful” is unknown.
“While there was no threshold under which alcohol consumption did not cause changes in the brain, there may a degree of brain volume difference that is irrelevant to brain health. We don’t know what these people’s brains looked like before they drank alcohol, so the brain may have learned to cope/compensate,” Dewey said.
Sadie Boniface, PhD, head of research at the Institute of Alcohol Studies and visiting researcher at King’s College London, said, “While we can’t yet say for sure whether there is ‘no safe level’ of alcohol regarding brain health at the moment, it has been known for decades that heavy drinking is bad for brain health.
“We also shouldn’t forget alcohol affects all parts of the body and there are multiple health risks. For example, it is already known there is ‘no safe level’ of alcohol consumption for the seven types of cancer caused by alcohol, as identified by the UK chief medical officers,” Dr. Boniface said.
The study was supported in part by the Wellcome Trust, Li Ka Shing Center for Health Information and Discovery, the National Institutes of Health, and the UK Medical Research Council. Dr. Topiwala, Dr. Boniface, Dr. Dewey, and Dr. Matthews have disclosed no relevant financial relationships.
A version of this article first appeared on Medscape.com.
Young adults with epilepsy face higher mental illness risks
Young adults with epilepsy experience higher rates of anxiety, depression, and suicidality, compared with their counterparts in the general population, a new study shows.
The findings, based on a study of 144 young adults with epilepsy (YAWE), was published recently in Epilepsy & Behavior.
“People with epilepsy (PWE) are at a significantly higher risk of experiencing mental health difficulties, compared with healthy controls and individuals with other [long-term conditions] such as asthma and diabetes,” according to Rachel Batchelor, MSc, and Michelle D. Taylor, PhD, of the University of London (England) in Surrey.
Young adulthood, which encompasses people aged 18-25 years, has been identified as “a peak age of onset for anxiety and depression,” but mental health in young adults with epilepsy in particular has not been well studied, they wrote.
The survey measured current mental health symptoms, including anxiety, depression, and suicidality, as well as sociodemographic and epilepsy-related factors, coping strategies, and social support (Epilepsy Behav. 2021 May;118:107911. doi: 10.1016/j.yebeh.2021.107911).
The average age of the respondents was 21.6 years, 61% were female, and 88% were of White British ethnicity. A total of 88 participants were single, 48 were in a relationship, and 8 were married or engaged. About one-third (38%) worked full-time, and 28.5% were full-time university students, 18.8% worked part-time, and 8.3% were unemployed and not students. The average age of seizure onset was 12.4 years.
Overall, 116 (80.6%) of the survey respondents met the criteria for anxiety, 110 (76.4%) for depression, and 51 (35.4%) for suicidality.
Ratings of all three of these conditions were significantly higher in females, compared with males, the researchers noted. Anxiety, depression, and suicidality also were rated higher for individuals who waited more than 1 year vs. less than 1 year for an epilepsy diagnosis from the time of seizure onset, for those suffering from anti-seizure medication side effects vs. no side effects, and for those with comorbid conditions vs. no comorbid conditions.
Avoidant-focused coping strategies were positively correlated with anxiety, depression, and suicidality, while problem-focused coping and meaning-focused coping were negatively correlated, the researchers said. In addition, those who reported greater levels of support from friends had lower rates of anxiety and depression, and those who reported greater levels of support from family had lower rates of suicidality.
The study findings were limited by several factors, including the relatively homogenous population, and the absence of data on current anxiety and depression medications and additional professional support, the researchers noted.
However, the results extend the research on mental health in people with epilepsy, and the study is the first known to focus on the young adult population with epilepsy, they said.
“The high rates of anxiety, depression, and suicidality underscore the need for better integration of mental health provision into epilepsy care,” the researchers wrote. “While it would be premature to base recommendations for treating anxiety, depression, and suicidality in YAWE on the current study, investigating the efficacy of psychological interventions (for example, [acceptance and commitment therapy], [compassion-focused therapy], peer support, and family-based [therapy]) designed to address the psychosocial variables shown to independently predict mental health outcomes in YAWE would be worthy future research avenues,” they concluded.
The study received no outside funding, and the researchers disclosed no financial conflicts.
FROM EPILEPSY & BEHAVIOR
Psychosis, depression tied to neurodegeneration in Parkinson’s
Depression and psychosis are significantly associated with neuronal loss and gliosis – but not with Lewy body scores – in Parkinson’s disease, data from analyses of the brains of 175 patients suggest.

Previous research has suggested a link between neuronal loss and depression in Parkinson’s disease (PD) but the impact of Lewy bodies has not been well studied, Nicole Mercado Fischer, MPH, of Johns Hopkins University, Baltimore, and colleagues wrote.
Evaluating Lewy body scores and neuronal loss/gliosis in the substantia nigra pars compacta (SN) and locus coeruleus (LC) could increase understanding of pathophysiology in PD, they said.
In a study published in the American Journal of Geriatric Psychiatry, the researchers analyzed the brains of 175 individuals with a primary diagnosis of PD.
A total of 98 participants had diagnoses of psychosis, 88 had depression, and 55 had anxiety. The average age of onset for PD was 62.4 years; 67.4% of the subjects were male, and 97.8% were White. The mean duration of illness was 16 years, and the average age at death was 78 years.
Psychosis was significantly associated with severe neuronal loss and gliosis in both the LC and SN (P = .048 and P = .042, respectively). Depression was significantly associated with severe neuronal loss in the SN (P = .042) but not in the LC. Anxiety was not associated with severe neuronal loss in either brain region. These results remained significant after a multivariate analysis, the researchers noted. However, Lewy body scores were not associated with any neuropsychiatric symptom, and severity of neuronal loss and gliosis was not correlated with Lewy body scores.
The study findings were limited by several factors, including the retrospective design and inability to collect pathology data for all patients, the researchers noted. Also, in some cases, the collection of clinical data and observation of brain tissue pathology took place years apart, and the researchers did not assess medication records.
However, the results were strengthened by the large sample size and “further support the notion that in vivo clinical symptoms of PD are either not caused by Lewy body pathology or that the relationship is confounded by the time of autopsy,” they said. and eventually by using new functional imaging techniques in vivo.”
The researchers had no financial conflicts to disclose. Two coauthors were supported in part by the National Institutes of Health.
Depression and psychosis are significantly associated with neuronal loss and gliosis – but not with Lewy body scores – in Parkinson’s disease, data from analyses of the brains of 175 patients suggest.
Previous research has suggested a link between neuronal loss and depression in Parkinson’s disease (PD) but the impact of Lewy bodies has not been well studied, Nicole Mercado Fischer, MPH, of Johns Hopkins University, Baltimore, and colleagues wrote.
Evaluating Lewy body scores and neuronal loss/gliosis in the substantia nigra pars compacta (SN) and locus coeruleus (LC) could increase understanding of pathophysiology in PD, they said.
In a study published in the American Journal of Geriatric Psychiatry, the researchers analyzed the brains of 175 individuals with a primary diagnosis of PD.
A total of 98 participants had diagnoses of psychosis, 88 had depression, and 55 had anxiety. The average age of onset for PD was 62.4 years; 67.4% of the subjects were male, and 97.8% were White. The mean duration of illness was 16 years, and the average age at death was 78 years.
Psychosis was significantly associated with severe neuronal loss and gliosis in both the LC and SN (P = .048 and P = .042, respectively). Depression was significantly associated with severe neuronal loss in the SN (P = .042) but not in the LC. Anxiety was not associated with severe neuronal loss in either brain region. These results remained significant after a multivariate analysis, the researchers noted. However, Lewy body scores were not associated with any neuropsychiatric symptom, and severity of neuronal loss and gliosis was not correlated with Lewy body scores.
The study findings were limited by several factors, including the retrospective design and inability to collect pathology data for all patients, the researchers noted. Also, in some cases, the collection of clinical data and observation of brain tissue pathology took place years apart, and the researchers did not assess medication records.
However, the results were strengthened by the large sample size and “further support the notion that in vivo clinical symptoms of PD are either not caused by Lewy body pathology or that the relationship is confounded by the time of autopsy,” they said. and eventually by using new functional imaging techniques in vivo.”
The researchers had no financial conflicts to disclose. Two coauthors were supported in part by the National Institutes of Health.
FROM THE AMERICAN JOURNAL OF GERIATRIC PSYCHIATRY
Healthy lifestyle can reduce dementia risk despite family history
Individuals at increased risk for dementia because of family history can reduce that risk by adopting healthy lifestyle behaviors, data from more than 300,000 adults aged 50-73 years suggest.

Having a parent or sibling with dementia can increase a person’s risk of developing dementia themselves by nearly 75%, compared with someone with no first-degree family history of dementia, according to Angelique Brellenthin, PhD, of Iowa State University, Ames, and colleagues.
In a study presented at the Epidemiology and Prevention/Lifestyle and Cardiometabolic Health meeting sponsored by the American Heart Association, the researchers reviewed information for 302,239 men and women who were enrolled in the U.K. Biobank, a population-based study of more than 500,000 individuals in the United Kingdom, between 2006 and 2010.
The study participants had no evidence of dementia at baseline, and completed questionnaires about family history and lifestyle. The questions included details about six healthy lifestyle behaviors: eating a healthy diet, engaging in at least 150 minutes of moderate to vigorous physical activity per week, sleeping 6-9 hours each night, drinking alcohol in moderation, not smoking, and maintaining a body mass index below the obese level (less than 30 kg/m2).
The researchers identified 1,698 participants (0.6%) who developed dementia over an average follow-up period of 8 years. Those with a family history (first-degree relative) of dementia had a 70% increased risk of dementia, compared with those who had no such family history.
Overall, individuals who engaged in all six healthy behaviors reduced their risk of dementia by about half, compared with those who engaged in two or fewer healthy behaviors. Engaging in three healthy behaviors reduced the risk of dementia by 30%, compared with engaging in two or fewer healthy behaviors, and this association held after controlling not only for family history of dementia, but also for other dementia risk factors such as age, sex, race, and education level, as well as high blood pressure, high cholesterol, and the presence of type 2 diabetes.
Similarly, among participants with a family history of dementia, those who engaged in three healthy lifestyle behaviors showed a 25%-35% reduction in dementia risk, compared with those who engaged in two or fewer healthy behaviors.
The study findings were limited by several factors including the inability to prove that lifestyle can cause or prevent dementia, only to show an association, the researchers noted. Also, the findings were limited by the reliance on self-reports, rather than genetic data, to confirm familial dementia.
However, the findings were strengthened by the large sample size, and the results suggest that a healthy lifestyle can impact cognitive health, and support the value of encouraging healthy behaviors in general, and especially among individuals with a family history of dementia, they said.
Small changes may promote prevention
The study is important now because, as the population ages, many individuals have a family member who has had dementia, said lead author Dr. Brellenthin, in an interview. “It’s important to understand how lifestyle behaviors affect the risk of dementia when it runs in families,” she said.
Dr. Brellenthin said she was surprised by some of the findings. “It was surprising to see that the risk of dementia was reduced with just three healthy behaviors [but was further reduced as you added more behaviors] compared to two or fewer behaviors. However, it was not surprising to see that these same lifestyle behaviors that tend to be good for the heart and body are also good for the brain.”
The evidence that following just three healthy behaviors can reduce the risk of dementia by 25%-35% for individuals with a familial history of dementia has clinical implications, Dr. Brellenthin said. “Many people are already following some of these behaviors like not smoking, so it might be possible to focus on adding just one more behavior, like getting enough sleep, and going from there.”

Commenting on the study, AHA President Mitchell S. V. Elkind, MD, said that the study “tells us that, yes, family history is important [in determining the risk of dementia], and much of that may be driven by genetic factors, but some of that impact can be mitigated or decreased by engaging in those important behaviors that we know are good to maintain brain health.
“The tricky thing, of course, is getting people to engage in these behaviors. That’s where a lot of work in the future will be: changing people’s behavior to become more healthy, and figuring out exactly which behaviors may be the easiest to engage in and be most likely to have public health impact,” added Dr. Elkind, professor of neurology and epidemiology at Columbia University and attending neurologist at New York–Presbyterian/Columbia University Irving Medical Center, New York.
The study received no outside funding, but the was research was conducted using the U.K. Biobank resources. The researchers had no financial conflicts to disclose.
Individuals at increased risk for dementia because of family history can reduce that risk by adopting healthy lifestyle behaviors, data from more than 300,000 adults aged 50-73 years suggest.
Having a parent or sibling with dementia can increase a person’s risk of developing dementia themselves by nearly 75%, compared with someone with no first-degree family history of dementia, according to Angelique Brellenthin, PhD, of Iowa State University, Ames, and colleagues.
In a study presented at the Epidemiology and Prevention/Lifestyle and Cardiometabolic Health meeting sponsored by the American Heart Association, the researchers reviewed information for 302,239 men and women who were enrolled in the U.K. Biobank, a population-based study of more than 500,000 individuals in the United Kingdom, between 2006 and 2010.
The study participants had no evidence of dementia at baseline, and completed questionnaires about family history and lifestyle. The questions included details about six healthy lifestyle behaviors: eating a healthy diet, engaging in at least 150 minutes of moderate to vigorous physical activity per week, sleeping 6-9 hours each night, drinking alcohol in moderation, not smoking, and maintaining a body mass index below the obese level (less than 30 kg/m2).
The researchers identified 1,698 participants (0.6%) who developed dementia over an average follow-up period of 8 years. Those with a family history (first-degree relative) of dementia had a 70% increased risk of dementia, compared with those who had no such family history.
Overall, individuals who engaged in all six healthy behaviors reduced their risk of dementia by about half, compared with those who engaged in two or fewer healthy behaviors. Engaging in three healthy behaviors reduced the risk of dementia by 30%, compared with engaging in two or fewer healthy behaviors, and this association held after controlling not only for family history of dementia, but also for other dementia risk factors such as age, sex, race, and education level, as well as high blood pressure, high cholesterol, and the presence of type 2 diabetes.
Similarly, among participants with a family history of dementia, those who engaged in three healthy lifestyle behaviors showed a 25%-35% reduction in dementia risk, compared with those who engaged in two or fewer healthy behaviors.
The study findings were limited by several factors including the inability to prove that lifestyle can cause or prevent dementia, only to show an association, the researchers noted. Also, the findings were limited by the reliance on self-reports, rather than genetic data, to confirm familial dementia.
However, the findings were strengthened by the large sample size, and the results suggest that a healthy lifestyle can impact cognitive health, and support the value of encouraging healthy behaviors in general, and especially among individuals with a family history of dementia, they said.
Small changes may promote prevention
The study is important now because, as the population ages, many individuals have a family member who has had dementia, said lead author Dr. Brellenthin, in an interview. “It’s important to understand how lifestyle behaviors affect the risk of dementia when it runs in families,” she said.
Dr. Brellenthin said she was surprised by some of the findings. “It was surprising to see that the risk of dementia was reduced with just three healthy behaviors [but was further reduced as you added more behaviors] compared to two or fewer behaviors. However, it was not surprising to see that these same lifestyle behaviors that tend to be good for the heart and body are also good for the brain.”
The evidence that following just three healthy behaviors can reduce the risk of dementia by 25%-35% for individuals with a familial history of dementia has clinical implications, Dr. Brellenthin said. “Many people are already following some of these behaviors like not smoking, so it might be possible to focus on adding just one more behavior, like getting enough sleep, and going from there.”
Commenting on the study, AHA President Mitchell S. V. Elkind, MD, said that the study “tells us that, yes, family history is important [in determining the risk of dementia], and much of that may be driven by genetic factors, but some of that impact can be mitigated or decreased by engaging in those important behaviors that we know are good to maintain brain health.
“The tricky thing, of course, is getting people to engage in these behaviors. That’s where a lot of work in the future will be: changing people’s behavior to become more healthy, and figuring out exactly which behaviors may be the easiest to engage in and be most likely to have public health impact,” added Dr. Elkind, professor of neurology and epidemiology at Columbia University and attending neurologist at New York–Presbyterian/Columbia University Irving Medical Center, New York.
The study received no outside funding, but the was research was conducted using the U.K. Biobank resources. The researchers had no financial conflicts to disclose.
FROM EPI/LIFESTYLE 2021
Fall prevention advice for patients with Parkinson’s
A 75-year-old man with Parkinson’s disease has had three falls over the past 4 weeks. He has been compliant with his Parkinson’s treatment. Which of the following options would most help decrease his fall risk?
A. Vitamin D supplementation
B. Vitamin B12 supplementation
C. Calcium supplementation
D. Tai chi
There has been recent evidence that vitamin D supplementation is not helpful in preventing falls in most community-dwelling older adults. Bolland and colleagues performed a meta-analysis of 81 randomized, controlled trials and found that vitamin D supplementation does not prevent fractures or falls.1 They found no difference or benefit in high-dose versus low-dose vitamin D supplementation.
The U.S. Preventive Services Task Force recommends against vitamin D supplementation for the purpose of preventing falls in community-dwelling adults over the age of 65.2 The same USPSTF report recommends exercise intervention, as having the strongest evidence for fall prevention in community-dwelling adults age 65 or older who are at risk for falls.
The benefits of tai chi
Tai chi with it’s emphasis on balance, strength training as well as stress reduction is an excellent option for older adults.
Lui and colleagues performed a meta-analyses of five randomized, controlled trials (355 patients) of tai chi in patients with Parkinson disease.3 Tai chi significantly decreased fall rates (odds ratio, 0.47; 95% confidence interval, 0.30-0.74; P = .001) and significantly improved balance and functional mobility (P < .001) in people with Parkinson disease, compared with no training.
Tai chi can also help prevent falls in a more general population of elderly patients. Lomas-Vega and colleagues performed a meta-analysis of 10 high-quality studies that met inclusion criteria evaluating tai chi for fall prevention.4 Fall risk was reduced over short-term follow-up (incident rate ratio, 0.57; 95% CI, 0.46-0.70) and a small protective effect was seen over long-term follow-up (IRR, 0.87; 95% CI, 0.77-0.98).
Pearl: Consider tai chi in your elderly patients with fall risk to increase their balance and reduce risks of falls.
Dr. Paauw is professor of medicine in the division of general internal medicine at the University of Washington, Seattle, and serves as third-year medical student clerkship director at the University of Washington. He is a member of the editorial advisory board of Internal Medicine News. Dr. Paauw has no conflicts to disclose. Contact him at [email protected].
References
1. Bolland MJ et al. Lancet Diabetes Endocrinol. 2018;6(11):847.
2. U.S. Preventive Services Task Force. JAMA. 2018;319(16):1696.
3. Liu HH et al. Parkinsons Dis. 2019 Feb 21;2019:9626934
4. Lomas-Vega R et al. J Am Geriatr Soc. 2017;65(9):2037.
Ptosis after motorcycle accident
A 45-year-old woman visited the clinic 6 weeks after having a stroke while on her motorcycle, which resulted in a crash. She had not been wearing a helmet and was uncertain if she had sustained a head injury. She said that during the hospital stay following the accident, she was diagnosed as hypertensive; she denied any other significant prior medical history.
Following the crash, she said she’d been experiencing weakness in her right arm and leg and had been unable to open her right eye. When her right eye was opened manually, she said she had double vision and sensitivity to light.
On exam, the patient had exotropia with hypotropia of her right eye. Additionally, she had anisocoria with an enlarged, nonreactive right pupil (FIGURE 1A). She was unable to adduct, supraduct, or infraduct her right eye (FIGURE 1B). Her cranial nerves were otherwise intact. On manual strength testing, she had 4/5 strength of both her right upper and lower extremities.

WHAT IS YOUR DIAGNOSIS?
HOW WOULD YOU TREAT THIS PATIENT?
Diagnosis: Third (oculomotor) nerve palsy
This patient had a complete third nerve palsy (TNP). This is defined as palsy involving all of the muscles innervated by the oculomotor nerve, with pupillary involvement.1 The oculomotor nerve supplies motor innervation to the levator palpebrae superioris, superior rectus, medial rectus, inferior rectus, and inferior oblique muscles and parasympathetic innervation to the pupillary constrictor and ciliary muscles.2 As a result, patients present with exotropia and hypotropia on exam with anisocoria. Diplopia, ptosis, and an enlarged pupil are classic symptoms of TNP.2
Computed tomography (CT) of the brain performed immediately after this patient’s accident demonstrated a 15-mm hemorrhage within the left basal ganglia with mild associated edema, and a small focus of hyperattenuation within the right aspect of the suprasellar cistern. There was no evidence of skull fracture. CT angiography (CTA) of the brain showed no evidence of aneurysm.
Several days later, magnetic resonance imaging (MRI) of the brain confirmed prior CT findings and revealed hemorrhagic contusions along the anterior and medial left temporal lobe. Additionally, the MRI showed subtle subdural hemorrhages along the midline falx and right parietal region, as well as diffuse subarachnoid hemorrhage around both hemispheres, the interpeduncular cistern, and the suprasellar cistern (FIGURE 2). The basal ganglia hemorrhage was believed to have been a result of uncontrolled hypertension. The hemorrhage was responsible for her right-sided weakness and was the presumed cause of the accident. The other findings were due to head trauma. Her TNP was most likely caused by both compression and irritation of the right oculomotor nerve.

An uncommon occurrence
A population-based study identified the annual incidence of TNP to be 4 per 100,000.1 The mean age of onset was 42 years. The incidence in patients older than 60 years was greater than the incidence in those younger than 60.2 Isolated TNP occurred in approximately 40% of cases.2
Complete TNP is typically indicative of compression of the ipsilateral third nerve.2 The most common region for third nerve injury is the subarachnoid space, where the oculomotor nerve is vulnerable to compression, often by an aneurysm arising from the junction of the internal carotid and posterior communicating arteries.3
Continue to: Incomplete TNP
Incomplete TNP is often microvascular in origin and requires evaluation for diabetes and hypertension. Microvascular TNP is frequently painful but usually self-resolves after 2 to 4 months.2 Giant cell arteritis may also cause an isolated, painful TNP.2
A varied differential diagnosis and a TNP link to COVID-19
The differential diagnosis for TNP includes the following:
Orbital apex injury is usually seen after high-energy craniofacial trauma.4 Orbital apex fractures present with different signs and symptoms, depending on the degree of injury to neural and vascular structures. Various syndromes come into play, the most common being superior orbital fissure syndrome, which is characterized by dysfunction of cranial nerves III, IV, V, and VI.4 Features include ophthalmoplegia, upper eyelid ptosis, a nonreactive dilated pupil, anesthesia over the ipsilateral forehead, loss of corneal reflex, orbital pain, and proptosis.4
In patients with suspected orbital apex fractures, it’s important to assess for the presence of an optic neuropathy, an evolving orbital compartment syndrome, or a ruptured globe, because these 3 things may demand acute intervention.4
Chronic progressive external ophthalmoplegia (CPEO) is a mitochondrial disorder characterized by a slow, progressive paralysis of the extraocular muscles.5 Patients usually experience bilateral, symmetrical, progressive ptosis, followed by ophthalmoparesis months to years later. Ciliary and iris muscles are not involved. CPEO often occurs with other systemic features of mitochondrial dysfunction that can cause significant morbidity and mortality.5
Continue to: Graves ophthalmopathy
Graves ophthalmopathy arises from soft-tissue enlargement in the orbit, leading to increased pressure within the bony cavity.6 Approximately 40% of patients with Graves ophthalmopathy present with restrictive extraocular myopathy; however > 90% have eyelid retraction, as opposed to ptosis.7
Guillain-Barré syndrome (GBS) is an acute, demyelinating immune-mediated polyneuropathy involving the spinal roots, peripheral nerves, and often the cranial nerves.8 The Miller Fisher variant of GBS is characterized by bilateral ophthalmoparesis, areflexia, and ataxia.8 At the early stage of illness, the presentation may be similar to TNP.8 Brain imaging is normal in patients with GBS; the diagnosis is established via characteristic electromyography and cerebrospinal fluid findings.8
Myasthenia gravis often manifests with variable ptosis associated with diplopia.9 Symptoms may be unilateral or bilateral. The ice-pack test has been identified as a simple, preliminary test for ocular myasthenia. The test involves the application of an ice-pack over the lids for 5 minutes. A 50% reduction in at least 1 component of ocular deviation is considered a positive response.10 Its specificity reportedly reaches 100%, with a sensitivity of 80%.10
COVID-19 infection may also include neurologic manifestations. There are an increasing number of case reports of central nervous system abnormalities including TNP.11,12
Trauma, tumors, or an aneurysm could be at work in TNP
TNP associated with trauma usually develops secondary to compression from an expanding hematoma, although it may also be a result of irritation of the nerve from blood in the subarachnoid space.13 Estimates of the incidence of TNP due to trauma range from 12% to 26% of cases.1,14 Vehicle-related injury is the most frequent cause of trauma-related TNP.14
Continue to: Pituitary tumors
Pituitary tumors most commonly involve the oculomotor nerve; 14% to 30% of pituitary tumors lead to TNP.13 Pituitary apoplexy secondary to infarction or hemorrhage is often associated with visual field defects and TNP.13
An underlying aneurysm manifests in a minority (10% to 15%) of patients presenting with TNP.3
Imaging is key to getting at the cause of TNP
The evaluation of patients presenting with acute TNP should be focused first on detecting an aneurysmal compressive lesion.3 CTA is the imaging modality of choice.
Once an aneurysm has been ruled out, the work-up should include a lumbar puncture and an erythrocyte sedimentation rate. Older patients should be assessed for conditions such as hypertension or diabetes that put them at risk for microvascular disease.3 If microvascular TNP is unlikely, MRI with MR angiography is recommended to exclude other potential etiologies of TNP.3 If the patient is younger than 50 years of age, consider potential infectious and inflammatory etiologies (eg, giant cell arteritis).3
Treatment options are varied
The treatment of patients with TNP is specific to the disease state. For those patients with vascular risk factors and a presumptive diagnosis of microvascular TNP, it is reasonable to observe the patient for 2 to 3 months.3 Antiplatelet therapy is usually initiated. Patching 1 eye is useful in alleviating diplopia, particularly in the short term. In most cases, deficits related to TNP resolve over weeks to months. Deficits that persist beyond 6 months may require surgical intervention.
Continue to: "The tip of the iceberg"
TNP: “The tip of the iceberg”
TNP may signal a neurologic emergency, such as an aneurysm, or other conditions such as pituitary disease or giant cell arteritis. Any patient presenting with acute onset of TNP should undergo a noninvasive neuroimaging study.3
Our patient was treated for hypertension; however, she was lost to follow-up.
1. Fang C, Leavitt JA, Hodge DO, et al. Incidence and etiologies of acquired third nerve palsy using a population-based method. JAMA Ophthalmol. 2017;135:23-28. doi: 10.1001/jamaophthalmol.2016.4456
2. Bruce BB, Biousse V, Newman NJ. Third nerve palsies. Semin Neurol. 2007;27:257-268. doi: 10.1055/s-2007-979681
3. Margolin E, Freund P. A review of third nerve palsies. Int Ophthalmol Clin. 2019;59:99-112. doi: 10.1097/IIO.0000000000000279
4. Linnau KF, Hallam DK, Lomoschitz FM, et al. Orbital apex injury: trauma at the junction between the face and the cranium. Eur J Radiol. 2003;48:5-16. doi: 10.1016/s0720-048x(03)00203-1
5. McClelland C, Manousakis G, Lee MS. Progressive external ophthalmoplegia. Curr Neurol Neurosci Rep. 2016;16:53. doi: 10.1007/s11910-016-0652-7
6. Bahn RS. Graves’ ophthalmopathy. N Engl J Med. 2010;362:726-738. doi: 10.1056/NEJMra0905750
7. Subetki I, Soewond P, Soebardi S, et al. Practical guidelines management of graves ophthalmopathy. Acta Med Indones. 2019;51:364-371.
8. Wijdicks EF, Klein CJ. Guillain-Barré syndrome. Mayo Clin Proc. 2017;92:467-479. doi: 10.1016/j.mayocp.2016.12.002
9. Beloor Suresh A, Asuncion RMD. Myasthenia Gravis. In: StatPearls [Internet]. StatPearls Publishing; 2021. Accessed April 26, 2021. www.ncbi.nlm.nih.gov/books/NBK559331/
10. Chatzistefanou KI, Kouris T, Iliakis E, et al. The ice pack test in the differential diagnosis of myasthenic diplopia. Ophthalmology. 2009;116:2236-2243. doi: 10.1016/j.ophtha.2009.04.039
11. Pascual-Prieto J, Narváez-Palazón C, Porta-Etessam J, et al. COVID-19 epidemic: should ophthalmologists be aware of oculomotor paresis? Arch Soc Esp Oftalmol. 2020;95:361-362. doi: 10.1016/j.oftal.2020.05.002
12. Collantes MEV, Espiritu AI, Sy MCC, et al. Neurological manifestations in COVID-19 infection: a systematic review and meta-analysis. Can J Neurol Sci. 2021;48:66-76. doi: 10.1017/cjn.2020.146
13. Raza HK, Chen H, Chansysouphanthong T, et al. The aetiologies of the unilateral oculomotor nerve palsy: a review of the literature. Somatosens Mot Res. 2018;35:229-239. doi :10.1080/08990220.2018.1547697
14. Keane J. Third nerve palsy: analysis of 1400 personally-examined inpatients. Can J Neurol Sci. 2010;37:662-670. doi: 10.1017/s0317167100010866
A 45-year-old woman visited the clinic 6 weeks after having a stroke while on her motorcycle, which resulted in a crash. She had not been wearing a helmet and was uncertain if she had sustained a head injury. She said that during the hospital stay following the accident, she was diagnosed as hypertensive; she denied any other significant prior medical history.
Following the crash, she said she’d been experiencing weakness in her right arm and leg and had been unable to open her right eye. When her right eye was opened manually, she said she had double vision and sensitivity to light.
On exam, the patient had exotropia with hypotropia of her right eye. Additionally, she had anisocoria with an enlarged, nonreactive right pupil (FIGURE 1A). She was unable to adduct, supraduct, or infraduct her right eye (FIGURE 1B). Her cranial nerves were otherwise intact. On manual strength testing, she had 4/5 strength of both her right upper and lower extremities.
WHAT IS YOUR DIAGNOSIS?
HOW WOULD YOU TREAT THIS PATIENT?
Diagnosis: Third (oculomotor) nerve palsy
This patient had a complete third nerve palsy (TNP). This is defined as palsy involving all of the muscles innervated by the oculomotor nerve, with pupillary involvement.1 The oculomotor nerve supplies motor innervation to the levator palpebrae superioris, superior rectus, medial rectus, inferior rectus, and inferior oblique muscles and parasympathetic innervation to the pupillary constrictor and ciliary muscles.2 As a result, patients present with exotropia and hypotropia on exam with anisocoria. Diplopia, ptosis, and an enlarged pupil are classic symptoms of TNP.2
Computed tomography (CT) of the brain performed immediately after this patient’s accident demonstrated a 15-mm hemorrhage within the left basal ganglia with mild associated edema, and a small focus of hyperattenuation within the right aspect of the suprasellar cistern. There was no evidence of skull fracture. CT angiography (CTA) of the brain showed no evidence of aneurysm.
Several days later, magnetic resonance imaging (MRI) of the brain confirmed prior CT findings and revealed hemorrhagic contusions along the anterior and medial left temporal lobe. Additionally, the MRI showed subtle subdural hemorrhages along the midline falx and right parietal region, as well as diffuse subarachnoid hemorrhage around both hemispheres, the interpeduncular cistern, and the suprasellar cistern (FIGURE 2). The basal ganglia hemorrhage was believed to have been a result of uncontrolled hypertension. The hemorrhage was responsible for her right-sided weakness and was the presumed cause of the accident. The other findings were due to head trauma. Her TNP was most likely caused by both compression and irritation of the right oculomotor nerve.
An uncommon occurrence
A population-based study identified the annual incidence of TNP to be 4 per 100,000.1 The mean age of onset was 42 years. The incidence in patients older than 60 years was greater than the incidence in those younger than 60.2 Isolated TNP occurred in approximately 40% of cases.2
Complete TNP is typically indicative of compression of the ipsilateral third nerve.2 The most common region for third nerve injury is the subarachnoid space, where the oculomotor nerve is vulnerable to compression, often by an aneurysm arising from the junction of the internal carotid and posterior communicating arteries.3
Continue to: Incomplete TNP
Incomplete TNP is often microvascular in origin and requires evaluation for diabetes and hypertension. Microvascular TNP is frequently painful but usually self-resolves after 2 to 4 months.2 Giant cell arteritis may also cause an isolated, painful TNP.2
A varied differential diagnosis and a TNP link to COVID-19
The differential diagnosis for TNP includes the following:
Orbital apex injury is usually seen after high-energy craniofacial trauma.4 Orbital apex fractures present with different signs and symptoms, depending on the degree of injury to neural and vascular structures. Various syndromes come into play, the most common being superior orbital fissure syndrome, which is characterized by dysfunction of cranial nerves III, IV, V, and VI.4 Features include ophthalmoplegia, upper eyelid ptosis, a nonreactive dilated pupil, anesthesia over the ipsilateral forehead, loss of corneal reflex, orbital pain, and proptosis.4
In patients with suspected orbital apex fractures, it’s important to assess for the presence of an optic neuropathy, an evolving orbital compartment syndrome, or a ruptured globe, because these 3 things may demand acute intervention.4
Chronic progressive external ophthalmoplegia (CPEO) is a mitochondrial disorder characterized by a slow, progressive paralysis of the extraocular muscles.5 Patients usually experience bilateral, symmetrical, progressive ptosis, followed by ophthalmoparesis months to years later. Ciliary and iris muscles are not involved. CPEO often occurs with other systemic features of mitochondrial dysfunction that can cause significant morbidity and mortality.5
Continue to: Graves ophthalmopathy
Graves ophthalmopathy arises from soft-tissue enlargement in the orbit, leading to increased pressure within the bony cavity.6 Approximately 40% of patients with Graves ophthalmopathy present with restrictive extraocular myopathy; however > 90% have eyelid retraction, as opposed to ptosis.7
Guillain-Barré syndrome (GBS) is an acute, demyelinating immune-mediated polyneuropathy involving the spinal roots, peripheral nerves, and often the cranial nerves.8 The Miller Fisher variant of GBS is characterized by bilateral ophthalmoparesis, areflexia, and ataxia.8 At the early stage of illness, the presentation may be similar to TNP.8 Brain imaging is normal in patients with GBS; the diagnosis is established via characteristic electromyography and cerebrospinal fluid findings.8
Myasthenia gravis often manifests with variable ptosis associated with diplopia.9 Symptoms may be unilateral or bilateral. The ice-pack test has been identified as a simple, preliminary test for ocular myasthenia. The test involves the application of an ice-pack over the lids for 5 minutes. A 50% reduction in at least 1 component of ocular deviation is considered a positive response.10 Its specificity reportedly reaches 100%, with a sensitivity of 80%.10
COVID-19 infection may also include neurologic manifestations. There are an increasing number of case reports of central nervous system abnormalities including TNP.11,12
Trauma, tumors, or an aneurysm could be at work in TNP
TNP associated with trauma usually develops secondary to compression from an expanding hematoma, although it may also be a result of irritation of the nerve from blood in the subarachnoid space.13 Estimates of the incidence of TNP due to trauma range from 12% to 26% of cases.1,14 Vehicle-related injury is the most frequent cause of trauma-related TNP.14
Continue to: Pituitary tumors
Pituitary tumors most commonly involve the oculomotor nerve; 14% to 30% of pituitary tumors lead to TNP.13 Pituitary apoplexy secondary to infarction or hemorrhage is often associated with visual field defects and TNP.13
An underlying aneurysm manifests in a minority (10% to 15%) of patients presenting with TNP.3
Imaging is key to getting at the cause of TNP
The evaluation of patients presenting with acute TNP should be focused first on detecting an aneurysmal compressive lesion.3 CTA is the imaging modality of choice.
Once an aneurysm has been ruled out, the work-up should include a lumbar puncture and an erythrocyte sedimentation rate. Older patients should be assessed for conditions such as hypertension or diabetes that put them at risk for microvascular disease.3 If microvascular TNP is unlikely, MRI with MR angiography is recommended to exclude other potential etiologies of TNP.3 If the patient is younger than 50 years of age, consider potential infectious and inflammatory etiologies (eg, giant cell arteritis).3
Treatment options are varied
The treatment of patients with TNP is specific to the disease state. For those patients with vascular risk factors and a presumptive diagnosis of microvascular TNP, it is reasonable to observe the patient for 2 to 3 months.3 Antiplatelet therapy is usually initiated. Patching 1 eye is useful in alleviating diplopia, particularly in the short term. In most cases, deficits related to TNP resolve over weeks to months. Deficits that persist beyond 6 months may require surgical intervention.
Continue to: "The tip of the iceberg"
TNP: “The tip of the iceberg”
TNP may signal a neurologic emergency, such as an aneurysm, or other conditions such as pituitary disease or giant cell arteritis. Any patient presenting with acute onset of TNP should undergo a noninvasive neuroimaging study.3
Our patient was treated for hypertension; however, she was lost to follow-up.
1. Fang C, Leavitt JA, Hodge DO, et al. Incidence and etiologies of acquired third nerve palsy using a population-based method. JAMA Ophthalmol. 2017;135:23-28. doi: 10.1001/jamaophthalmol.2016.4456
2. Bruce BB, Biousse V, Newman NJ. Third nerve palsies. Semin Neurol. 2007;27:257-268. doi: 10.1055/s-2007-979681
3. Margolin E, Freund P. A review of third nerve palsies. Int Ophthalmol Clin. 2019;59:99-112. doi: 10.1097/IIO.0000000000000279
4. Linnau KF, Hallam DK, Lomoschitz FM, et al. Orbital apex injury: trauma at the junction between the face and the cranium. Eur J Radiol. 2003;48:5-16. doi: 10.1016/s0720-048x(03)00203-1
5. McClelland C, Manousakis G, Lee MS. Progressive external ophthalmoplegia. Curr Neurol Neurosci Rep. 2016;16:53. doi: 10.1007/s11910-016-0652-7
6. Bahn RS. Graves’ ophthalmopathy. N Engl J Med. 2010;362:726-738. doi: 10.1056/NEJMra0905750
7. Subetki I, Soewond P, Soebardi S, et al. Practical guidelines management of graves ophthalmopathy. Acta Med Indones. 2019;51:364-371.
8. Wijdicks EF, Klein CJ. Guillain-Barré syndrome. Mayo Clin Proc. 2017;92:467-479. doi: 10.1016/j.mayocp.2016.12.002
9. Beloor Suresh A, Asuncion RMD. Myasthenia Gravis. In: StatPearls [Internet]. StatPearls Publishing; 2021. Accessed April 26, 2021. www.ncbi.nlm.nih.gov/books/NBK559331/
10. Chatzistefanou KI, Kouris T, Iliakis E, et al. The ice pack test in the differential diagnosis of myasthenic diplopia. Ophthalmology. 2009;116:2236-2243. doi: 10.1016/j.ophtha.2009.04.039
11. Pascual-Prieto J, Narváez-Palazón C, Porta-Etessam J, et al. COVID-19 epidemic: should ophthalmologists be aware of oculomotor paresis? Arch Soc Esp Oftalmol. 2020;95:361-362. doi: 10.1016/j.oftal.2020.05.002
12. Collantes MEV, Espiritu AI, Sy MCC, et al. Neurological manifestations in COVID-19 infection: a systematic review and meta-analysis. Can J Neurol Sci. 2021;48:66-76. doi: 10.1017/cjn.2020.146
13. Raza HK, Chen H, Chansysouphanthong T, et al. The aetiologies of the unilateral oculomotor nerve palsy: a review of the literature. Somatosens Mot Res. 2018;35:229-239. doi :10.1080/08990220.2018.1547697
14. Keane J. Third nerve palsy: analysis of 1400 personally-examined inpatients. Can J Neurol Sci. 2010;37:662-670. doi: 10.1017/s0317167100010866

Long-term use of prescription sleep meds unsupported by new research
a new study shows.
“While there are good data from [randomized, controlled trials] that these medications improve sleep disturbances in the short term,” few studies have examined whether they provide long-term benefits, stated the authors of the paper, which was published in BMJ Open.
“The current observational study does not support use of sleep medications over the long term, as there were no self-reported differences at 1 or 2 years of follow-up comparing sleep medication users with nonusers,” author Daniel H. Solomon, MD, MPH, from Brigham and Women’s Hospital, Boston, and colleagues wrote.
Women included in the analysis were drawn from the Study of Women’s Health Across the Nation (SWAN), an ongoing multicenter, longitudinal study examining women during the menopausal transition. The average age of the women included in the cohort was 49.5 years and approximately half were White. All women reported a sleep disturbance on at least 3 nights per week during a 2-week interval. At follow up, women were asked to use a Likert scale to rate three aspects of sleep: difficulty initiating sleep, frequent awakening, and waking up early. On the scale, 1 represented having no difficulties on any nights, 3 represented having difficulties 1-2 nights per week, and 5 represented having difficulty 5-7 nights per week.
Women already using prescription sleep medication at their baseline visit were excluded from the study. Medications used included benzodiazepines, selective BZD receptor agonists, and other hypnotics.
Over the 21 years of follow-up in the SWAN study (1995-2016), Dr. Solomon and colleagues identified 238 women using sleep medication and these were compared with a cohort of 447 propensity score–matched non–sleep medication uses. Overall, the 685 women included were similar in characteristics to each other as well as to the other potentially eligible women not included in the analysis.
Sleep disturbance patterns compared
At baseline, sleep disturbance patterns were similar between the two groups. Among medication users, the mean score for difficulty initiating sleep was 2.7 (95% confidence interval, 2.5-2.9), waking frequently 3.8 (95% CI, 3.6-3.9), and waking early 2.9 (95% CI, 2.7-3.1). Among the nonusers, the baseline scores were 2.6 (95% CI, 2.5-2.7), 3.7 (95% CI, 3.6-3.8), and 2.7 (95% CI, 2.5-2.8), respectively. After 1 year, there was no statistically significant difference in scores between the two groups. The average ratings for medication users were 2.6 (95% CI, 2.3-2.8) for difficulty initiating sleep, 3.8 (95% CI, 3.6-4.0) for waking frequently, and 2.8 (95% CI, 2.6-3.0) for waking early.
Average ratings among nonusers were 2.3 (95% CI, 2.2-2.4), 3.5 (95% CI, 3.3-3.6), and 2.5 (95% CI, 2.3-2.6), respectively.
After 2 years, there were still no statistically significant reductions in sleep disturbances among those taking prescription sleep medications, compared with those not taking medication.
The researchers noted that approximately half of the women in this cohort were current or past tobacco users and that 20% were moderate to heavy alcohol users.
More work-up, not more medication, needed
The study authors acknowledged the limitations of an observational study and noted that, since participants only reported medication use and sleep disturbances at annual visits, they did not know whether patients’ medication use was intermittent or of any interim outcomes. Additionally, the authors pointed out that those classified as “nonusers” may have been using over-the-counter medication.
“Investigations should look at detailed-use patterns, on a daily or weekly basis, with frequent outcomes data,” Dr. Solomon said in an interview. “While our data shed new light on chronic use, we only had data collected on an annual basis; daily or weekly data would provide more granular information.”
Regarding clinician prescribing practices, Dr. Solomon said, “short-term, intermittent use can be helpful, but use these agents sparingly” and “educate patients that chronic regular use of medications for sleep is not associated with improvement in sleep disturbances.”
Commenting on the study, Andrea Matsumura, MD, a sleep specialist at the Oregon Clinic in Portland, echoed this sentiment: “When someone says they are having trouble sleeping this is the tip of the iceberg and it warrants an evaluation to determine if someone has a breathing disorder, a circadian disorder, a life situation, or a type of insomnia that is driving the sleeplessness.”
“I think this study supports what we all should know,” Dr. Matsumura concluded. “Sleep aids are not meant to be used long term” and should not be used for longer than 2 weeks without further work-up.
Funding for this study was provided through a grant from the National Institutes of Health. Dr. Solomon has received salary support from research grants to Brigham and Women’s Hospital for unrelated work from AbbVie, Amgen, Corrona, Genentech and Pfizer. The other authors and Dr. Matsumura have reported no relevant financial relationships.
FROM BMJ OPEN
Race, ethnicity, and socioeconomics are often barriers to migraine care
, according to a study published in the April issue of Headache. People of African descent and Latinx ethnicity tend to fare worse than other people of color and their White counterparts.
“It should be shocking to neurologists and other clinicians who care for migraine patients how few are able to successfully traverse the barriers to achieve an accurate diagnosis and proper, evidence-based, acute and preventative treatment,” commented Peter McAllister, MD, medical director at the New England Institute for Neurology and Headache and chief medical officer for clinical research at Ki Clinical Research in Stamford, Conn. Dr. McAllister was not involved in this study.
Assessing barriers to care
Researchers designed the study with the primary objective of estimating the number of patients with migraines with unmet clinical needs and who were impacted by four preidentified barriers to care. To evaluate their objective, researchers conducted a longitudinal, Internet-based survey known as the Chronic Migraine Epidemiology and Outcomes (CaMEO) study. They collected data over 1 year examining a cohort of patients that mimicked the diverse demographics of the U.S. population. Researchers conducted longitudinal assessments every 3 months for 15 months, incorporating cross-sectional analyses that surveyed health care use, family burden, and comorbidities or endophenotypes.
Eligible enrollees were 18 years of age or older.
Researchers identified four barriers that hindered patient outcomes, and they served as the primary outcomes of the studies. They were:
- Health care provider consultations. Investigators used study participants’ responses to the following question during their interactions with their health care providers to help evaluate the quality of their consultation experience: “What type of doctor is currently managing your headaches?” Researchers included data from patients whose practitioners fit the description of those they deemed best suited to address ongoing headache challenges. These medical professionals included general practitioners, family physicians, internal medicine doctors, nurse practitioners, physician assistants, neurologists, pain specialists, headache specialists, and obstetrician-gynecologists.
- Diagnosis. Carefully evaluating patients’ responses to a series of questions helped researchers gauge the accuracy of diagnosis. Questions included: “Have you ever been diagnosed by a doctor or other health professional with any of the following types of headaches?” Respondents were also given a list of options that provided additional context around their headaches and were encouraged to select all appropriate responses. The list included a fictional response option of “citrene headache” to determine incorrect responses. For this study, researchers deemed it necessary to recognize a chronic migraine diagnosis to ensure that patients received appropriate treatment.
- Minimally appropriate pharmacologic treatment. Researchers used the following question to determine whether patients’ chronic migraine and episodic migraine were being managed with the least amount of pharmacological treatment necessary. “Which of these medications (if any) are you currently using (or typically keep on hand) to treat your headaches when you have them?” Researchers defined “minimally appropriate acute pharmacologic treatment” as the use of any prescription nonsteroidal anti-inflammatory drug (NSAID), triptan, ergotamine derivative, or isometheptene.
- Avoidance of medication overuse. The study authors pointed out the sometimes nebulous process of characterizing the appropriate use of preventative medication in patients with episodic migraines as “not straightforward” for some patients because not all patients require preventive treatment. Study participants were required to report having received any form of preventative therapy, defined as pharmacological therapies approved by guidelines and supported by data. Such therapies included various antiseizure medication, antidepressants (for example, doxepin, venlafaxine, duloxetine, amitriptyline, imipramine, nortriptyline, and desvenlafaxine), antihypertensives, and toxin injections. Treatments such as behavioral and neuromodulatory therapies were excluded from the list.
According to lead author Dawn C. Buse, PhD, of the department of neurology at Albert Einstein College of Medicine, New York, acute medication overuse provides an important modifiable target for intervention and recommends that clinicians use the opportunity to optimize migraine care by reducing the patients’ reliance on acute therapies. Taking such initiatives to decrease medication overuse is especially important in communities of color, who are more likely to overuse medications for migraines.
Patients with higher income levels were more likely to overcome each barrier. People of African, African American, or multiracial descent were more prone to overuse of medications to manage their migraines.
Of the 489,537 respondents invited to participate in the CaMEO study, 16,879 qualified for inclusion. Slightly more than half of the respondents (n = 9,184 [54.7%]) had a migraine-related disability (MIDAS) score of 6 or greater – an indicator of disability that is least mild in nature. Most patients who had episodic migraines or chronic migraines (86.2%) had some form of health insurance coverage (n = 9.184; 84.1%; P = .048). Of those patients who were insured, 7,930 patients experienced episodic migraine (86.3%) and the remainder had chronic migraine (n = 1,254; 13.7%). Higher-income patients were more likely to traverse barriers to care. While patients of African descent had higher consultation rates, they also had higher rates of acute medication overuse.
Patients with chronic migraine were more likely to be older than patients with episodic migraine (41.0 vs. 39.6 years; P = .0001) and female (83.0% vs. 79.0%; P = .001), and White (84.5% vs. 79.1%; P < .001). Similarly, patients with chronic migraine were more likely to have a higher mean body mass index (29.8 kg/m2 vs. 28.9 kg/m2; P < .001) and lower rates of full- or part-time employment (56.8% vs. 67.1%; P < .001), and were less likely to have a 4-year degree (64.8 vs. 55.6; P < .001) and annual household incomes below $75,000 (72.6% vs. 64.6%; P < .001). Approximately three-quarters of the patients with episodic migraine (75.7%; 1655/2187) and one-third of patients with chronic migraine (32.8%; 168/512) received accurate diagnoses.
The data uncovered an association with acute medication overuse. Among current consulters who had received an accurate diagnosis and minimally adequate treatment, medication overuse rates were highest among those reporting two or more races (53%) and Blacks and African Americans (45%) and lowest among Whites (33%) and those categorized as “other” race (32%). Ethnic and cultural differences in headache literacy may contribute to differences in medication overuse.
Strategies to improve outcomes
Both Dr. Buse and Dr. McAllister see the value advocacy and education offer in helping to improve outcomes in marginalized communities and other groups negatively impacted by various barriers.
“Patient advocacy and outreach are key here, especially in those traditionally underrepresented in the migraine space, such as men, people of color, blue-collar workers, etc.,” Dr. McAllister noted.
Dr. Buse emphasized the importance of education for patients and health care professionals alike. “A large percentage of people who meet criteria for migraine in the U.S. do not seek care or possibly even know that they have migraines,” Dr. Buse said. “This finding underscores the importance of public health education about migraine as well as well as providing migraine support, education, and resources to health care professionals on the front lines.”
Other strategies recommended by Dr, Buse to ease the impact of barriers include encouraging patient discussion, setting up time for follow-up appointments and education, referring patients for neurological and other specialty consults when warranted, reviewing essential lifestyle habits for migraine management, and creating personalized, mutually agreed-upon treatment plans.
Dr. Buse has received support and honoraria from AbbVie, Amgen, Avanir, Biohaven, Eli Lilly, and Promius.
FROM HEADACHE
High teen BMI linked to stroke risk in young adulthood
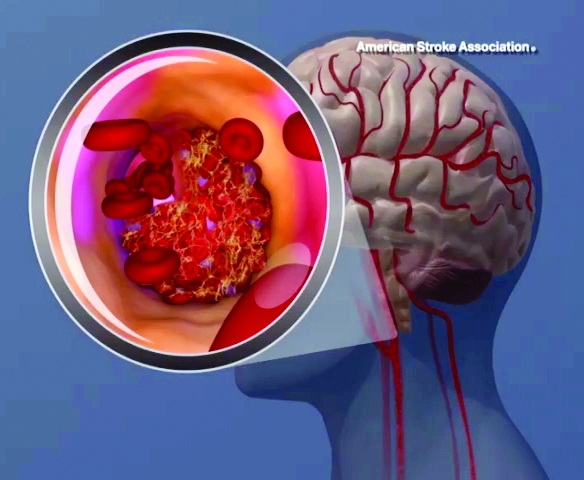
High and even high-normal body mass index (BMI) were linked to increased ischemic stroke risk, regardless of whether or not individuals had diabetes.
Overweight and obese adolescent groups in the study had a roughly two- to threefold increased risk of ischemic stroke, which was apparent even before age 30 years in the study that was based on records of Israeli adolescents evaluated prior to mandatory military service.
These findings highlight the importance of treating and preventing high BMI among adolescence, study coauthor Gilad Twig, MD, MPH, PhD, said in a press release.
“Adults who survive stroke earlier in life face poor functional outcomes, which can lead to unemployment, depression and anxiety,” said Dr. Twig, associate professor in the department of military medicine in The Hebrew University in Jerusalem.
The costs of stroke prevention and care, already high, are expected to become even higher as the adolescent obesity prevalence goes up, fueling further increases in stroke rate, Dr. Twig added.
This is believed to be the first study showing that stroke risk is associated with higher BMI values in both men and women, not just men, Dr. Twig and coauthors said in their article, published May 13, 2021 in the journal Stroke. Previous studies assessing the stroke-BMI relationship in adolescents were based on records of Swedish men evaluated during military conscription at age 18.
In the present study, Dr. Twig and coauthors assessed the linkage between adolescent BMI and first stroke event in 1.9 million male and female adolescents in Israel who were evaluated 1 year prior to mandatory military service, between the years of 1985 and 2013.
They cross-referenced that information with stroke events in a national registry to which all hospitals in Israel are required to report.
The adolescents were about 17 years of age on average at the time of evaluation, 58% were male, and 84% were born in Israel. The mean age at the beginning of follow-up for stroke was about 31 years.
Over the follow-up period, investigators identified 1,088 first stroke events, including 921 ischemic and 167 hemorrhagic strokes.
A gradual increase in stroke rate was seen across BMI categories for ischemic strokes, but not so much for hemorrhagic strokes, investigators found.
Hazard ratios for first ischemic stroke event were 1.4 (95% confidence interval, 1.2-1.6) for the high-normal BMI group, 2.0 (95% CI, 1.6-2.4) for the overweight group, and 3.5 (95% CI, 2.8-4.5) for the obese group after adjusting for age and sex at beginning of follow-up, investigators reported.
When the adjusted results were stratified by presence or absence of diabetes, estimates were similar to what was seen in the overall risk model, they added.
Among those young adults who developed ischemic stroke, 43% smoked, 29% had high blood pressure, 17% had diabetes, and 32% had abnormal lipids at the time of diagnosis, the reported data showed.
The clinical and public health implications of these findings could be substantial, since strokes are associated with worse medical and socioeconomic outcomes in younger as compared with older individuals, according to Dr. Twig and coauthors.
Younger individuals with stroke have a higher risk of recurrent stroke, heart attack, long-term care, or death, they said. Moreover, about half of young-adult stroke survivors have poor functional outcomes, and their risk of unemployment and depression/anxiety is higher than in young individuals without stroke.
One limitation of the study is that follow-up BMI data were not available for all participants. As a result, the contribution of obesity to stroke risk over time could not be assessed, and the independent risk of BMI during adolescence could not be determined. In addition, the authors said the study underrepresents orthodox and ultraorthodox Jewish women, as they are not obligated to serve in the Israeli military.
The study authors had no disclosures related to the study, which was supported by a medical corps Israel Defense Forces research grant.
FROM STROKE
Assessing the cognitive nuances between ADHD and autism
Attention-deficit/hyperactivity disorder and autism spectrum disorder (ASD) often coexist in children and adults, but the range of cognitive abilities can vary widely in these patients. Researchers from around the world are leveraging symptom, cognitive assessment, and neurobiological measures to gain insights on how individuals with ADHD/ASD approach and solve problems.
Several experts discussed the progress of their research during the session, “Overlap and differences of ADHD and autism – new findings of functional imaging and cognition studies” at the World Congress on ADHD – Virtual Event.
“The overlap of these two disorders is a critical issue for our field,” said Sarah Karalunas, PhD, assistant professor of clinical psychology at Purdue University, West Lafayette, Ind., who moderated the session. Clinicians are often asked to make differential diagnoses between these two disorders. Only recently has the DSM-5 allowed their codiagnosis. “There’s increasing recognition that there may be shared cognitive and physiological features that reflect their shared risk and account for the high levels of symptom overlap,” said Dr. Karalunas.
Shared cognitive markers
Under the DSM’s change, “it’s now recognized that an estimated 20%-60% of children with ASD have comorbidities with ADHD, and around 20%-40% of children with ADHD have ASD symptoms,” said Beth Johnson, PhD, a research fellow with the Turner Institute for Brain and Mental Health at Monash University, Melbourne.
The shared overlap on genetic traits and comorbidities such as intellectual disability, anxiety, depression, and oppositional defiant disorder, make it difficult for clinicians to predict clinical outcomes, noted Dr. Johnson.
“We’re now understanding that they’re likely to be multiple autisms and ADHDs, that these symptoms exist on a spectrum of severity or ability,” she said. Dr. Johnson discussed a data-driven subtyping approach based on neurocognitive and symptom profiles in children with ADHD. The aim was to better understand how symptoms are managed across ADHD, ASD and comorbid ASD-ADHD.
As part of this research, her team recruited 295 controls and 117 children with ADHD who underwent clinical phenotyping and also completed working memory tasks, stop signal, and sustained attention tasks.
The researchers divided the children into four stable clusters based on the ADHD rating scale and autism questionnaire data: high ASD/ADHD traits, high ADHD/low ASD, low ADHD/moderate ASD, and low ADHD/ASD. Approximately half of the children with ADHD showed moderate to high ASD symptoms. Looking at neurocognition across the tasks, unsurprisingly, performance was lowest among the high-ASD/ADHD children, with performance on the stop signal being the most pronounced. “Notably, performance on the working memory task worsened with increasing ADHD symptoms,” she reported.
Drift model identifies information processing
Dr. Karalunas has also compared subgroups of ADHD and ASD children. “Our analysis examined whether cognitive impairments in ASD reflect a shared risk mechanism or co-occurring ADHD symptoms and why we see an overlap in these types of impairments,” she said.
Her study included 509 children with ADHD, 97 with ASD, and 301 controls (typical development). All three groups underwent a full cognitive assessment battery that measured attention arousal, basic processing speed, and working memory. Those tasks were collapsed into a series of variables as well as a set of tasks measuring response inhibition, switching, interference control, reward discounting, and measure of reaction time variability.
Four cognitive profiles emerged: a typically developing group, an ADHD group, an ASD group with low levels of ADHD symptoms and an ASD group with high levels of ADHD symptoms.
The ADHD group did worse on many of the tasks than the control group, and the ASD group with low ADHD levels also did poorly relative to the typically developing sample. This shows that autism – even in absence of co-occurring ADHD – demonstrates more cognitive impairment than typically developing kids. The ADHD group with high levels of autism did the most poorly across all of the tasks.
The findings also revealed a symptom severity pattern: the group with fewer symptoms did the best and the group with the most symptoms did the worst. “Overall, this reflects severity of impairment,” said Dr. Karalunas.
To identify measures more specific to either ADHD or autism, Dr. Karalunas and colleagues did a follow-up analysis to characterize cognitive performance. To accomplish this, they applied a drift-diffusion model to the same four cognitive profiles. The model assessed three parameters: drift rate, which relates to the speed or efficiency of information processing, boundary separation or speed accuracy trade-offs (impulsivity), and nondecision time such as motor preparation.
Using the same four cognitive profiles, they found that the ADHD group had slower drift rate relative to the control, although the two groups did not differ on boundary separation, which meant there were no differences on waiting to need to respond. The ADHD group had faster nondecision times. “This is a classic pattern, shown in the literature,” said Dr. Karalunas.
In other results, an interesting pattern began to evolve
Both ASD groups, for example, had much wider boundary separations, which meant they were waiting to be sure before they responded than the ADHD or typically developing groups. In contrast, the two ADHD groups had much faster non-decision times, whereas the two non-ADHD groups had similar nondecisions times.
Unlike the previous analysis, which saw a symptom severity pattern develop, “we’re getting two parameters that seem to track much more specifically to specific symptom domains,” observed Dr. Karalunas.
The results suggest there’s a substantial overlap in cognitive impairments in ADHD/ASD. “But we have pretty strong evidence at this point that these similarities are not accounted for by symptom overlap, especially for things like response and inhibition, working memory and processing speed. These seem to be independently related to ADHD and autism, regardless of the level of comorbid ADHD symptoms in the autism group,” said Dr. Karalunas.
The hope is to expand on these types of analyses to address the interaction of cognition-emotion and social cognition, and empirically define groups based on cognitive performance, she said.
Neurocognitive studies
Researchers have also been studying neural networks to assess ASD and ADHD. Roselyne Chauvin, PhD, a postdoctoral associate at Washington University, St. Louis, discussed the concept of “a task generic connectome,” in which researchers look for a common network between targeted task paradigms to get closer to a common alteration across impairments.
In her research, Dr. Chauvin and colleagues looked at connectivity modulations across three tasks: working memory, reward processing tasks, and stop signal tasks, comparing ADHD patients to siblings and controls. The ADHD group showed reduced sensitivity or a smaller number of connections modulated in the tasks compared with the other groups. Researchers wondered where those missed connections were located.
Dividing the cohorts into task generic and task specific groups, Dr. Chauvin and colleagues found that the ADHD group lacked common processing skills. They were also able to identify reproducible missing circuits in the ADHD participants. Among the cohorts, there was a higher modulation of task-specific edges in the ADHD group.
The ADHD patients seemed to be using more task-tailored alternative strategies that were more challenging and suboptimal.
She also previewed her ongoing work with the EU-AIMS Longitudinal European Autism Project (LEAP) database to study ASD-ADHD comorbidity. In this project, she and her colleagues looked at several tasks: probing emotion processing, inhibitory control, theory of mind, and reward anticipation. Comparing ASD groups with or without ADHD comorbidity or a shared connection, she and her team were able to devise a functional profile predictive of ADHD severity. As an example, “for the connection only used by the ASD with ADHD comorbidity, the more they were using those connections of higher amplitude in the modulation, inside this subset of connection, the higher they would have ADHD severity,” said Dr. Chauvin.

Neural correlates of different behavioral and cognitive profiles haven’t been widely studied, according to Charlotte Tye, PhD, who’s based at the Institute of Psychiatry, Psychology & Neuroscience, King’s College, London. Electroencephalography is a useful technique for understanding the neural correlates of cognitive impairments and teasing apart different models of co-occurrence in ASD and ADHD.
Dr. Tye and colleagues tested this approach in a cohort of boys aged 8-13 years diagnosed with ASD and/or ADHD, measuring EEG while the children did various continuous performance tasks to assess changes in brain activity. Examining P3 amplitude (event-related potential components) they found that children with ADHD or ADHD+ASD showed an attenuated amplitude of the P3, compared with typically developing children and those with ASD.
“This suggests children with an ADHD diagnosis exhibited reduced inhibitory control,” said Dr. Tye. In contrast, children with ASD showed reduced conflict monitoring as indexed by altered N2 amplitude across task conditions.
These, and other studies conducted by Dr. Tye and colleagues indicate that children with ADHD show reduced neural responses during attentional processing, whereas autistic children show typical neural responses, supporting specific profiles.
“Autistic children with a diagnosis of ADHD appear to show the unique patterns of neural responses of autism and ADHD, supporting an additive co-occurrence rather than a distinct condition. This contributes to identification of transdiagnostic subgroups within neurodevelopmental conditions for targeting of personalized intervention, and suggests that children with co-occurring autism and ADHD require support for both conditions,” said Dr. Tye.
An important takeaway from all of these findings is “we can’t look just at how someone does overall on a single test,” said Dr. Karalunas in an interview. “There is a tremendous amount of variability between people who have the same diagnosis, and our research really needs to account for this.”
Attention-deficit/hyperactivity disorder and autism spectrum disorder (ASD) often coexist in children and adults, but the range of cognitive abilities can vary widely in these patients. Researchers from around the world are leveraging symptom, cognitive assessment, and neurobiological measures to gain insights on how individuals with ADHD/ASD approach and solve problems.
Several experts discussed the progress of their research during the session, “Overlap and differences of ADHD and autism – new findings of functional imaging and cognition studies” at the World Congress on ADHD – Virtual Event.
“The overlap of these two disorders is a critical issue for our field,” said Sarah Karalunas, PhD, assistant professor of clinical psychology at Purdue University, West Lafayette, Ind., who moderated the session. Clinicians are often asked to make differential diagnoses between these two disorders. Only recently has the DSM-5 allowed their codiagnosis. “There’s increasing recognition that there may be shared cognitive and physiological features that reflect their shared risk and account for the high levels of symptom overlap,” said Dr. Karalunas.
Shared cognitive markers
Under the DSM’s change, “it’s now recognized that an estimated 20%-60% of children with ASD have comorbidities with ADHD, and around 20%-40% of children with ADHD have ASD symptoms,” said Beth Johnson, PhD, a research fellow with the Turner Institute for Brain and Mental Health at Monash University, Melbourne.
The shared overlap on genetic traits and comorbidities such as intellectual disability, anxiety, depression, and oppositional defiant disorder, make it difficult for clinicians to predict clinical outcomes, noted Dr. Johnson.
“We’re now understanding that they’re likely to be multiple autisms and ADHDs, that these symptoms exist on a spectrum of severity or ability,” she said. Dr. Johnson discussed a data-driven subtyping approach based on neurocognitive and symptom profiles in children with ADHD. The aim was to better understand how symptoms are managed across ADHD, ASD and comorbid ASD-ADHD.
As part of this research, her team recruited 295 controls and 117 children with ADHD who underwent clinical phenotyping and also completed working memory tasks, stop signal, and sustained attention tasks.
The researchers divided the children into four stable clusters based on the ADHD rating scale and autism questionnaire data: high ASD/ADHD traits, high ADHD/low ASD, low ADHD/moderate ASD, and low ADHD/ASD. Approximately half of the children with ADHD showed moderate to high ASD symptoms. Looking at neurocognition across the tasks, unsurprisingly, performance was lowest among the high-ASD/ADHD children, with performance on the stop signal being the most pronounced. “Notably, performance on the working memory task worsened with increasing ADHD symptoms,” she reported.
Drift model identifies information processing
Dr. Karalunas has also compared subgroups of ADHD and ASD children. “Our analysis examined whether cognitive impairments in ASD reflect a shared risk mechanism or co-occurring ADHD symptoms and why we see an overlap in these types of impairments,” she said.
Her study included 509 children with ADHD, 97 with ASD, and 301 controls (typical development). All three groups underwent a full cognitive assessment battery that measured attention arousal, basic processing speed, and working memory. Those tasks were collapsed into a series of variables as well as a set of tasks measuring response inhibition, switching, interference control, reward discounting, and measure of reaction time variability.
Four cognitive profiles emerged: a typically developing group, an ADHD group, an ASD group with low levels of ADHD symptoms and an ASD group with high levels of ADHD symptoms.
The ADHD group did worse on many of the tasks than the control group, and the ASD group with low ADHD levels also did poorly relative to the typically developing sample. This shows that autism – even in absence of co-occurring ADHD – demonstrates more cognitive impairment than typically developing kids. The ADHD group with high levels of autism did the most poorly across all of the tasks.
The findings also revealed a symptom severity pattern: the group with fewer symptoms did the best and the group with the most symptoms did the worst. “Overall, this reflects severity of impairment,” said Dr. Karalunas.
To identify measures more specific to either ADHD or autism, Dr. Karalunas and colleagues did a follow-up analysis to characterize cognitive performance. To accomplish this, they applied a drift-diffusion model to the same four cognitive profiles. The model assessed three parameters: drift rate, which relates to the speed or efficiency of information processing, boundary separation or speed accuracy trade-offs (impulsivity), and nondecision time such as motor preparation.
Using the same four cognitive profiles, they found that the ADHD group had slower drift rate relative to the control, although the two groups did not differ on boundary separation, which meant there were no differences on waiting to need to respond. The ADHD group had faster nondecision times. “This is a classic pattern, shown in the literature,” said Dr. Karalunas.
In other results, an interesting pattern began to evolve
Both ASD groups, for example, had much wider boundary separations, which meant they were waiting to be sure before they responded than the ADHD or typically developing groups. In contrast, the two ADHD groups had much faster non-decision times, whereas the two non-ADHD groups had similar nondecisions times.
Unlike the previous analysis, which saw a symptom severity pattern develop, “we’re getting two parameters that seem to track much more specifically to specific symptom domains,” observed Dr. Karalunas.
The results suggest there’s a substantial overlap in cognitive impairments in ADHD/ASD. “But we have pretty strong evidence at this point that these similarities are not accounted for by symptom overlap, especially for things like response and inhibition, working memory and processing speed. These seem to be independently related to ADHD and autism, regardless of the level of comorbid ADHD symptoms in the autism group,” said Dr. Karalunas.
The hope is to expand on these types of analyses to address the interaction of cognition-emotion and social cognition, and empirically define groups based on cognitive performance, she said.
Neurocognitive studies
Researchers have also been studying neural networks to assess ASD and ADHD. Roselyne Chauvin, PhD, a postdoctoral associate at Washington University, St. Louis, discussed the concept of “a task generic connectome,” in which researchers look for a common network between targeted task paradigms to get closer to a common alteration across impairments.
In her research, Dr. Chauvin and colleagues looked at connectivity modulations across three tasks: working memory, reward processing tasks, and stop signal tasks, comparing ADHD patients to siblings and controls. The ADHD group showed reduced sensitivity or a smaller number of connections modulated in the tasks compared with the other groups. Researchers wondered where those missed connections were located.
Dividing the cohorts into task generic and task specific groups, Dr. Chauvin and colleagues found that the ADHD group lacked common processing skills. They were also able to identify reproducible missing circuits in the ADHD participants. Among the cohorts, there was a higher modulation of task-specific edges in the ADHD group.
The ADHD patients seemed to be using more task-tailored alternative strategies that were more challenging and suboptimal.
She also previewed her ongoing work with the EU-AIMS Longitudinal European Autism Project (LEAP) database to study ASD-ADHD comorbidity. In this project, she and her colleagues looked at several tasks: probing emotion processing, inhibitory control, theory of mind, and reward anticipation. Comparing ASD groups with or without ADHD comorbidity or a shared connection, she and her team were able to devise a functional profile predictive of ADHD severity. As an example, “for the connection only used by the ASD with ADHD comorbidity, the more they were using those connections of higher amplitude in the modulation, inside this subset of connection, the higher they would have ADHD severity,” said Dr. Chauvin.
Neural correlates of different behavioral and cognitive profiles haven’t been widely studied, according to Charlotte Tye, PhD, who’s based at the Institute of Psychiatry, Psychology & Neuroscience, King’s College, London. Electroencephalography is a useful technique for understanding the neural correlates of cognitive impairments and teasing apart different models of co-occurrence in ASD and ADHD.
Dr. Tye and colleagues tested this approach in a cohort of boys aged 8-13 years diagnosed with ASD and/or ADHD, measuring EEG while the children did various continuous performance tasks to assess changes in brain activity. Examining P3 amplitude (event-related potential components) they found that children with ADHD or ADHD+ASD showed an attenuated amplitude of the P3, compared with typically developing children and those with ASD.
“This suggests children with an ADHD diagnosis exhibited reduced inhibitory control,” said Dr. Tye. In contrast, children with ASD showed reduced conflict monitoring as indexed by altered N2 amplitude across task conditions.
These, and other studies conducted by Dr. Tye and colleagues indicate that children with ADHD show reduced neural responses during attentional processing, whereas autistic children show typical neural responses, supporting specific profiles.
“Autistic children with a diagnosis of ADHD appear to show the unique patterns of neural responses of autism and ADHD, supporting an additive co-occurrence rather than a distinct condition. This contributes to identification of transdiagnostic subgroups within neurodevelopmental conditions for targeting of personalized intervention, and suggests that children with co-occurring autism and ADHD require support for both conditions,” said Dr. Tye.
An important takeaway from all of these findings is “we can’t look just at how someone does overall on a single test,” said Dr. Karalunas in an interview. “There is a tremendous amount of variability between people who have the same diagnosis, and our research really needs to account for this.”
FROM ADHD 2021