User login
HBV screening often incomplete or forgone when starting tocilizumab, tofacitinib
People beginning treatment with the immunosuppressive drugs tocilizumab (Actemra) or tofacitinib (Xeljanz) are infrequently screened for hepatitis B virus (HBV) infection, according to a new study of patients with rheumatic diseases who are starting one of the two treatments.
“Perhaps not unexpectedly, these screening patterns conform more with recommendations from the American College of Rheumatology, which do not explicitly stipulate universal HBV screening,” wrote lead author Amir M. Mohareb, MD, of Massachusetts General Hospital in Boston. The study was published in The Journal of Rheumatology.
To determine the frequency of HBV screening among this specific population, the researchers conducted a retrospective, cross-sectional study of patients 18 years or older within the Mass General Brigham health system in the Boston area who initiated either of the two drugs before Dec. 31, 2018. Tocilizumab was approved by the Food and Drug Administration on Jan. 11, 2010, and tofacitinib was approved on Nov. 6, 2012.
The final study population included 678 patients on tocilizumab and 391 patients on tofacitinib. The mean age of the patients in each group was 61 years for tocilizumab and 60 years for tofacitinib. A large majority were female (78% of the tocilizumab group, 88% of the tofacitinib group) and 84% of patients in both groups were white. Their primary diagnosis was rheumatoid arthritis (53% of the tocilizumab group, 77% of the tofacitinib group), and most of them – 57% of patients on tocilizumab and 72% of patients on tofacitinib – had a history of being on both conventional synthetic and biologic disease-modifying antirheumatic drugs (DMARDs).
HBV screening patterns were classified into three categories: complete (all three of the HBV surface antigen [HBsAg], total core antibody [anti-HBcAb], and surface antibody [HBsAb] tests); partial (any one to two tests); and none. Of the 678 patients on tocilizumab, 194 (29%) underwent complete screening, 307 (45%) underwent partial screening, and 177 (26%) had no screening. Of the 391 patients on tofacitinib, 94 (24%) underwent complete screening, 195 (50%) underwent partial screening, and 102 (26%) had none.
Inappropriate testing – defined as either HBV e-antigen (HBeAg), anti-HBcAb IgM, or HBV DNA without a positive HBsAg or total anti-HBcAb – occurred in 22% of patients on tocilizumab and 23% of patients on tofacitinib. After multivariable analysis, the authors found that Whites were less likely to undergo complete screening (odds ratio, 0.74; 95% confidence interval, 0.57-0.95) compared to non-Whites. Previous use of immunosuppressive agents such as conventional synthetic DMARDs (OR, 1.05; 95% CI, 0.72-1.55) and biologic DMARDs with or without prior csDMARDs (OR, 0.73; 95% CI, 0.48-1.12) was not associated with a likelihood of complete appropriate screening.

“These data add to the evidence indicating that clinicians are not completing pretreatment screening for latent infections prior to patients starting high-risk immunosuppressant drugs,” Gabriela Schmajuk, MD, of the University of California, San Francisco, said in an interview. “It can be dangerous, since a fraction of these patients may reactivate latent infections with HBV that can result in liver failure or death.
“On the bright side,” she added, “we have antivirals that can be given as prophylaxis against reactivation of latent HBV if patients do test positive.”
Dr. Schmajuk was previously the senior author of a similar study from the 2019 American College of Rheumatology annual meeting that found only a small percentage of patients who were new users of biologics or new synthetic DMARDs were screened for HBV or hepatitis C virus.
When asked if anything in the study stood out, she acknowledged being “somewhat surprised that patients with prior immunosuppression did not have higher rates of screening. One might expect that since those patients had more opportunities for screening – since they started new medications more times – they would have higher rates, but this did not appear to be the case.”
As a message to rheumatologists who may be starting their patients on any biologic or new synthetic DMARD, she reinforced that “we need universal HBV screening for patients starting these medications. Many clinicians are used to ordering a hepatitis B surface antigen test, but one key message is that we also need to be ordering hepatitis B core antibody tests. Patients with a positive core antibody are still at risk for reactivation.”
The authors noted their study’s limitations, including the data being retrospectively collected and some of the subjects potentially being screened in laboratories outside of the Mass General Brigham health system. In addition, they stated that their findings “may not be generalizable to nonrheumatologic settings or other immunomodulators,” although they added that studies of other patient populations have also uncovered “similarly low HBV screening frequencies.”
Several of the authors reported being supported by institutes within the National Institutes of Health. Beyond that, they declared no potential conflicts of interest.
People beginning treatment with the immunosuppressive drugs tocilizumab (Actemra) or tofacitinib (Xeljanz) are infrequently screened for hepatitis B virus (HBV) infection, according to a new study of patients with rheumatic diseases who are starting one of the two treatments.
“Perhaps not unexpectedly, these screening patterns conform more with recommendations from the American College of Rheumatology, which do not explicitly stipulate universal HBV screening,” wrote lead author Amir M. Mohareb, MD, of Massachusetts General Hospital in Boston. The study was published in The Journal of Rheumatology.
To determine the frequency of HBV screening among this specific population, the researchers conducted a retrospective, cross-sectional study of patients 18 years or older within the Mass General Brigham health system in the Boston area who initiated either of the two drugs before Dec. 31, 2018. Tocilizumab was approved by the Food and Drug Administration on Jan. 11, 2010, and tofacitinib was approved on Nov. 6, 2012.
The final study population included 678 patients on tocilizumab and 391 patients on tofacitinib. The mean age of the patients in each group was 61 years for tocilizumab and 60 years for tofacitinib. A large majority were female (78% of the tocilizumab group, 88% of the tofacitinib group) and 84% of patients in both groups were white. Their primary diagnosis was rheumatoid arthritis (53% of the tocilizumab group, 77% of the tofacitinib group), and most of them – 57% of patients on tocilizumab and 72% of patients on tofacitinib – had a history of being on both conventional synthetic and biologic disease-modifying antirheumatic drugs (DMARDs).
HBV screening patterns were classified into three categories: complete (all three of the HBV surface antigen [HBsAg], total core antibody [anti-HBcAb], and surface antibody [HBsAb] tests); partial (any one to two tests); and none. Of the 678 patients on tocilizumab, 194 (29%) underwent complete screening, 307 (45%) underwent partial screening, and 177 (26%) had no screening. Of the 391 patients on tofacitinib, 94 (24%) underwent complete screening, 195 (50%) underwent partial screening, and 102 (26%) had none.
Inappropriate testing – defined as either HBV e-antigen (HBeAg), anti-HBcAb IgM, or HBV DNA without a positive HBsAg or total anti-HBcAb – occurred in 22% of patients on tocilizumab and 23% of patients on tofacitinib. After multivariable analysis, the authors found that Whites were less likely to undergo complete screening (odds ratio, 0.74; 95% confidence interval, 0.57-0.95) compared to non-Whites. Previous use of immunosuppressive agents such as conventional synthetic DMARDs (OR, 1.05; 95% CI, 0.72-1.55) and biologic DMARDs with or without prior csDMARDs (OR, 0.73; 95% CI, 0.48-1.12) was not associated with a likelihood of complete appropriate screening.
“These data add to the evidence indicating that clinicians are not completing pretreatment screening for latent infections prior to patients starting high-risk immunosuppressant drugs,” Gabriela Schmajuk, MD, of the University of California, San Francisco, said in an interview. “It can be dangerous, since a fraction of these patients may reactivate latent infections with HBV that can result in liver failure or death.
“On the bright side,” she added, “we have antivirals that can be given as prophylaxis against reactivation of latent HBV if patients do test positive.”
Dr. Schmajuk was previously the senior author of a similar study from the 2019 American College of Rheumatology annual meeting that found only a small percentage of patients who were new users of biologics or new synthetic DMARDs were screened for HBV or hepatitis C virus.
When asked if anything in the study stood out, she acknowledged being “somewhat surprised that patients with prior immunosuppression did not have higher rates of screening. One might expect that since those patients had more opportunities for screening – since they started new medications more times – they would have higher rates, but this did not appear to be the case.”
As a message to rheumatologists who may be starting their patients on any biologic or new synthetic DMARD, she reinforced that “we need universal HBV screening for patients starting these medications. Many clinicians are used to ordering a hepatitis B surface antigen test, but one key message is that we also need to be ordering hepatitis B core antibody tests. Patients with a positive core antibody are still at risk for reactivation.”
The authors noted their study’s limitations, including the data being retrospectively collected and some of the subjects potentially being screened in laboratories outside of the Mass General Brigham health system. In addition, they stated that their findings “may not be generalizable to nonrheumatologic settings or other immunomodulators,” although they added that studies of other patient populations have also uncovered “similarly low HBV screening frequencies.”
Several of the authors reported being supported by institutes within the National Institutes of Health. Beyond that, they declared no potential conflicts of interest.
FROM THE JOURNAL OF RHEUMATOLOGY
Rashes in Pregnancy
Rashes that develop during pregnancy often result in considerable anxiety or concern for patients and their families. Recognizing these pregnancy-specific dermatoses is important in identifying fetal risks as well as providing appropriate management and expert guidance for patients regarding future pregnancies. Managing cutaneous manifestations of pregnancy-related disorders is challenging and requires knowledge of potential side effects of therapy for both the mother and fetus. It also is important to appreciate the physiologic cutaneous changes of pregnancy along with their clinical significance and management.
In 2006, Ambrose-Rudolph et al1 proposed reclassification of pregnancy-specific dermatoses, which has since been widely accepted by the academic dermatology community. The 4 most prominent disorders include intrahepatic cholestasis of pregnancy (ICP); pemphigoid gestationis (PG); polymorphic eruption of pregnancy (PEP), also known as pruritic urticarial papules and plaques of pregnancy; and atopic eruption of pregnancy.2 It is important to recognize these pregnancy-specific disorders and to understand their clinical significance. The morphology of the eruption as well as the location and timing of the onset of the rash are important clues in making an accurate diagnosis.3
Clinical Presentation
Intrahepatic cholestasis of pregnancy presents with severe generalized pruritus, usually with involvement of the palms and soles, in the late second or third trimester. Pemphigoid gestationis presents with urticarial papules and/or bullae, often in the second or third trimester or postpartum. An important diagnostic clue for PG is involvement near the umbilicus. Polymorphic eruption of pregnancy presents with urticarial papules and plaques; onset occurs in the third trimester or postpartum and initially involves the striae while sparing the umbilicus, unlike in PG. Atopic eruption of pregnancy has an earlier onset than the other pregnancy-specific dermatoses, often in the first or second trimester, and presents with widespread eczematous lesions.3
Diagnosis
The pregnancy dermatoses with the greatest potential for fetal risks are ICP and PG; therefore, it is critical for health care providers to diagnose these dermatoses in a timely manner and initiate appropriate management. Intrahepatic cholestasis of pregnancy is confirmed by elevated serum bile acids (ie, >10 µmol/L), often during the third trimester. The risk of fetal morbidity is high in ICP with increased bile acids crossing the placenta causing placental anoxia and impaired cardiomyocyte function.4 Fetal risks, including preterm delivery, meconium-stained amniotic fluid, and stillbirth, correlate with the level of bile acids in the serum.5 Maternal prognosis is favorable, but there is an increased association with hepatitis C and hepatobiliary disease.6
Diagnosis of PG is confirmed by classic biopsy results and direct immunofluorescence revealing C3 with or without IgG in a linear band along the basement membrane zone. Additionally, complement indirect immunofluorescence reveals circulating IgG anti–basement membrane zone antibodies. Pemphigoid gestationis is associated with increased fetal risks of preterm labor and intrauterine growth retardation.7 Clinical findings of PG may present in the fetus upon delivery due to transmission of autoantibodies across the placenta. The symptoms usually are mild.8 An increased risk of Graves disease has been reported in mothers with PG.
In most cases, diagnosis of PEP is based on history and morphology, but if the presentation is not classic, skin biopsy must be used to differentiate it from PG as well as more common dermatologic conditions such as contact dermatitis, drug and viral eruptions, and urticaria.
Atopic eruption of pregnancy manifests as widespread eczematous excoriated papules and plaques. Lesions of prurigo nodularis are common.
Comorbidities
It is important to be aware of specific clinical associations related to pregnancy-specific dermatoses. Pemphigoid gestationis has been associated with gestational trophoblastic tumors including hydatiform mole and choriocarcinoma.4 An increased risk for Graves disease has been reported in patients with PG.9 Patients who develop ICP have a higher incidence of hepatitis C, postpartum cholecystitis, gallstones, and nonalcoholic cirrhosis.8 Polymorphic eruption of pregnancy is associated with a notably higher incidence in multiple gestation pregnancies.2
Treatment and Management
Management of ICP requires an accurate and timely diagnosis, and advanced neonatal-obstetric management is critical.3 Ursodeoxycholic acid is the treatment of choice and reduces pruritus, prolongs pregnancy, and reduces fetal risk.4 Most stillbirths cluster at the 38th week of pregnancy, and patients with ICP and highly elevated serum bile acids (>40 µmol/L) should be considered for delivery at 37 weeks or earlier.5
Management of the other cutaneous disorders of pregnancy can be challenging for health care providers based on safety concerns for the fetus. Although it is important to minimize risks to the fetus, it also is important to adequately treat the mother’s cutaneous disease, which requires a solid knowledge of drug safety during pregnancy. The former US Food and Drug Administration classification system using A, B, C, D, and X pregnancy categories was replaced by the Pregnancy Lactation Label Final Rule, which provides counseling on medication safety during pregnancy.10 In 2014, Murase et al11 published a review of dermatologic medication safety during pregnancy, which serves as an excellent guide.
Before instituting treatment, the therapeutic plan should be discussed with the physician managing the patient’s pregnancy. In general, topical steroids are considered safe during pregnancy, and low-potency to moderate-potency topical steroids are preferred. If possible, use of topical steroids should be limited to less than 300 g for the duration of the pregnancy. Fluticasone propionate should be avoided during pregnancy because it is not metabolized by the placenta. When systemic steroids are considered appropriate for management during pregnancy, nonhalogenated corticosteroids such as prednisone and prednisolone are preferred because they are enzymatically inactivated by the placenta, which results in a favorable maternal-fetal gradient.12 There has been concern expressed in the medical literature that systemic steroids during the first trimester may increase the risk of cleft lip and cleft palate.3,12 When managing pregnancy dermatoses, consideration should be given to keep prednisone exposure below 20 mg/d, and try to limit prolonged use to 7.5 mg/d. However, this may not be possible in PG.3 Vitamin D and calcium supplementation may be appropriate when patients are on prolonged systemic steroids to control disease.
Antihistamines can be used to control pruritus complicating pregnancy-associated dermatoses. First-generation antihistamines such as chlorpheniramine and diphenhydramine are preferred due to long-term safety data.3,11,12 Loratadine is the first choice and cetirizine is the second choice if a second-generation antihistamine is preferred.3 Loratadine is preferred during breastfeeding due to less sedation.12 High-dose antihistamines prior to delivery may cause concerns for potential side effects in the newborn, including tremulousness, irritability, and poor feeding.
Recurrence
Women with pregnancy dermatoses often are concerned about recurrence with future pregnancies. Pemphigoid gestationis may flare with subsequent pregnancies, subsequent menses, or with oral contraceptive use.3 Recurrence of PEP in subsequent pregnancies is rare and usually is less severe than the primary eruption.8 Often, the rare recurrent eruption of PEP is associated with multigestational pregnancies.2 Mothers can anticipate a recurrence of ICP in up to 60% to 70% of future pregnancies. Patients with AEP have an underlying atopic diathesis, and recurrence in future pregnancies is not uncommon.8
Final Thoughts
In summary, it is important for health care providers to recognize the specific cutaneous disorders of pregnancy and their potential fetal complications. The anatomical location of onset of the dermatosis and timing of onset during pregnancy can give important clues. Appropriate management, especially with ICP, can minimize fetal complications. A fundamental knowledge of medication safety and management during pregnancy is essential. Rashes during pregnancy can cause anxiety in the mother and family and require support, comfort, and guidance.
- Ambrose-Rudolph CM, Müllegger RR, Vaughn-Jones SA, et al. The specific dermatoses of pregnancy revisited and reclassified: results of a retrospective two-center study on 505 pregnant patients. J Am Acad Dermatol. 2006;54:395-404.
- Bechtel M, Plotner A. Dermatoses of pregnancy. Clin Obstet Gynecol. 2015;58:104-111.
- Bechtel M. Pruritus in pregnancy and its management. Dermatol Clin. 2018;36:259-265.
- Ambrose-Rudolph CM. Dermatoses of pregnancy—clues to diagnosis, fetal risk, and therapy. Ann Dermatol. 2011;23:265-275.
- Geenes V, Chappell LC, Seed PT, et al. Association of severe intrahepatic cholestasis of pregnancy with adverse pregnancy outcomes: a prospective population-based case-controlled study. Hepatology. 2014;59:1482-1491.
- Bergman H, Melamed N, Koven G. Pruritus in pregnancy: treatment of dermatoses unique to pregnancy. Can Fam Physician. 2013;59:1290-1294.
- Beard MP, Millington GW. Recent developments in the specific dermatoses of pregnancy. Clin Exp Dermatol. 2012;37:1-14.
- Shears S, Blaszczak A, Kaffenberger J. Pregnancy dermatosis. In: Tyler KH, ed. Cutaneous Disorders of Pregnancy. 1st ed. Springer Nature; 2020:13-39.
- Lehrhoff S, Pomeranz MK. Specific dermatoses of pregnancy and their treatment. Dermatol Ther. 2015;26:274-284.
- Content and format of labeling for human prescription drug and biological products; requirements for pregnancy and lactation labeling. Fed Registr. 2014;79:72064-72103. To be codified at 21 CFR § 201.
- Murase JE, Heller MM, Butler DC. Safety of dermatologic medications in pregnancy and lactation: part 1. pregnancy. J Am Acad Dermatol. 2014;401:E1-E14.
- Friedman B, Bercovitch L. Atopic dermatitis in pregnancy. In: Tyler KH, ed. Cutaneous Disorders of Pregnancy. Springer Nature; 2020:59-74.
Rashes that develop during pregnancy often result in considerable anxiety or concern for patients and their families. Recognizing these pregnancy-specific dermatoses is important in identifying fetal risks as well as providing appropriate management and expert guidance for patients regarding future pregnancies. Managing cutaneous manifestations of pregnancy-related disorders is challenging and requires knowledge of potential side effects of therapy for both the mother and fetus. It also is important to appreciate the physiologic cutaneous changes of pregnancy along with their clinical significance and management.
In 2006, Ambrose-Rudolph et al1 proposed reclassification of pregnancy-specific dermatoses, which has since been widely accepted by the academic dermatology community. The 4 most prominent disorders include intrahepatic cholestasis of pregnancy (ICP); pemphigoid gestationis (PG); polymorphic eruption of pregnancy (PEP), also known as pruritic urticarial papules and plaques of pregnancy; and atopic eruption of pregnancy.2 It is important to recognize these pregnancy-specific disorders and to understand their clinical significance. The morphology of the eruption as well as the location and timing of the onset of the rash are important clues in making an accurate diagnosis.3
Clinical Presentation
Intrahepatic cholestasis of pregnancy presents with severe generalized pruritus, usually with involvement of the palms and soles, in the late second or third trimester. Pemphigoid gestationis presents with urticarial papules and/or bullae, often in the second or third trimester or postpartum. An important diagnostic clue for PG is involvement near the umbilicus. Polymorphic eruption of pregnancy presents with urticarial papules and plaques; onset occurs in the third trimester or postpartum and initially involves the striae while sparing the umbilicus, unlike in PG. Atopic eruption of pregnancy has an earlier onset than the other pregnancy-specific dermatoses, often in the first or second trimester, and presents with widespread eczematous lesions.3
Diagnosis
The pregnancy dermatoses with the greatest potential for fetal risks are ICP and PG; therefore, it is critical for health care providers to diagnose these dermatoses in a timely manner and initiate appropriate management. Intrahepatic cholestasis of pregnancy is confirmed by elevated serum bile acids (ie, >10 µmol/L), often during the third trimester. The risk of fetal morbidity is high in ICP with increased bile acids crossing the placenta causing placental anoxia and impaired cardiomyocyte function.4 Fetal risks, including preterm delivery, meconium-stained amniotic fluid, and stillbirth, correlate with the level of bile acids in the serum.5 Maternal prognosis is favorable, but there is an increased association with hepatitis C and hepatobiliary disease.6
Diagnosis of PG is confirmed by classic biopsy results and direct immunofluorescence revealing C3 with or without IgG in a linear band along the basement membrane zone. Additionally, complement indirect immunofluorescence reveals circulating IgG anti–basement membrane zone antibodies. Pemphigoid gestationis is associated with increased fetal risks of preterm labor and intrauterine growth retardation.7 Clinical findings of PG may present in the fetus upon delivery due to transmission of autoantibodies across the placenta. The symptoms usually are mild.8 An increased risk of Graves disease has been reported in mothers with PG.
In most cases, diagnosis of PEP is based on history and morphology, but if the presentation is not classic, skin biopsy must be used to differentiate it from PG as well as more common dermatologic conditions such as contact dermatitis, drug and viral eruptions, and urticaria.
Atopic eruption of pregnancy manifests as widespread eczematous excoriated papules and plaques. Lesions of prurigo nodularis are common.
Comorbidities
It is important to be aware of specific clinical associations related to pregnancy-specific dermatoses. Pemphigoid gestationis has been associated with gestational trophoblastic tumors including hydatiform mole and choriocarcinoma.4 An increased risk for Graves disease has been reported in patients with PG.9 Patients who develop ICP have a higher incidence of hepatitis C, postpartum cholecystitis, gallstones, and nonalcoholic cirrhosis.8 Polymorphic eruption of pregnancy is associated with a notably higher incidence in multiple gestation pregnancies.2
Treatment and Management
Management of ICP requires an accurate and timely diagnosis, and advanced neonatal-obstetric management is critical.3 Ursodeoxycholic acid is the treatment of choice and reduces pruritus, prolongs pregnancy, and reduces fetal risk.4 Most stillbirths cluster at the 38th week of pregnancy, and patients with ICP and highly elevated serum bile acids (>40 µmol/L) should be considered for delivery at 37 weeks or earlier.5
Management of the other cutaneous disorders of pregnancy can be challenging for health care providers based on safety concerns for the fetus. Although it is important to minimize risks to the fetus, it also is important to adequately treat the mother’s cutaneous disease, which requires a solid knowledge of drug safety during pregnancy. The former US Food and Drug Administration classification system using A, B, C, D, and X pregnancy categories was replaced by the Pregnancy Lactation Label Final Rule, which provides counseling on medication safety during pregnancy.10 In 2014, Murase et al11 published a review of dermatologic medication safety during pregnancy, which serves as an excellent guide.
Before instituting treatment, the therapeutic plan should be discussed with the physician managing the patient’s pregnancy. In general, topical steroids are considered safe during pregnancy, and low-potency to moderate-potency topical steroids are preferred. If possible, use of topical steroids should be limited to less than 300 g for the duration of the pregnancy. Fluticasone propionate should be avoided during pregnancy because it is not metabolized by the placenta. When systemic steroids are considered appropriate for management during pregnancy, nonhalogenated corticosteroids such as prednisone and prednisolone are preferred because they are enzymatically inactivated by the placenta, which results in a favorable maternal-fetal gradient.12 There has been concern expressed in the medical literature that systemic steroids during the first trimester may increase the risk of cleft lip and cleft palate.3,12 When managing pregnancy dermatoses, consideration should be given to keep prednisone exposure below 20 mg/d, and try to limit prolonged use to 7.5 mg/d. However, this may not be possible in PG.3 Vitamin D and calcium supplementation may be appropriate when patients are on prolonged systemic steroids to control disease.
Antihistamines can be used to control pruritus complicating pregnancy-associated dermatoses. First-generation antihistamines such as chlorpheniramine and diphenhydramine are preferred due to long-term safety data.3,11,12 Loratadine is the first choice and cetirizine is the second choice if a second-generation antihistamine is preferred.3 Loratadine is preferred during breastfeeding due to less sedation.12 High-dose antihistamines prior to delivery may cause concerns for potential side effects in the newborn, including tremulousness, irritability, and poor feeding.
Recurrence
Women with pregnancy dermatoses often are concerned about recurrence with future pregnancies. Pemphigoid gestationis may flare with subsequent pregnancies, subsequent menses, or with oral contraceptive use.3 Recurrence of PEP in subsequent pregnancies is rare and usually is less severe than the primary eruption.8 Often, the rare recurrent eruption of PEP is associated with multigestational pregnancies.2 Mothers can anticipate a recurrence of ICP in up to 60% to 70% of future pregnancies. Patients with AEP have an underlying atopic diathesis, and recurrence in future pregnancies is not uncommon.8
Final Thoughts
In summary, it is important for health care providers to recognize the specific cutaneous disorders of pregnancy and their potential fetal complications. The anatomical location of onset of the dermatosis and timing of onset during pregnancy can give important clues. Appropriate management, especially with ICP, can minimize fetal complications. A fundamental knowledge of medication safety and management during pregnancy is essential. Rashes during pregnancy can cause anxiety in the mother and family and require support, comfort, and guidance.
- Ambrose-Rudolph CM, Müllegger RR, Vaughn-Jones SA, et al. The specific dermatoses of pregnancy revisited and reclassified: results of a retrospective two-center study on 505 pregnant patients. J Am Acad Dermatol. 2006;54:395-404.
- Bechtel M, Plotner A. Dermatoses of pregnancy. Clin Obstet Gynecol. 2015;58:104-111.
- Bechtel M. Pruritus in pregnancy and its management. Dermatol Clin. 2018;36:259-265.
- Ambrose-Rudolph CM. Dermatoses of pregnancy—clues to diagnosis, fetal risk, and therapy. Ann Dermatol. 2011;23:265-275.
- Geenes V, Chappell LC, Seed PT, et al. Association of severe intrahepatic cholestasis of pregnancy with adverse pregnancy outcomes: a prospective population-based case-controlled study. Hepatology. 2014;59:1482-1491.
- Bergman H, Melamed N, Koven G. Pruritus in pregnancy: treatment of dermatoses unique to pregnancy. Can Fam Physician. 2013;59:1290-1294.
- Beard MP, Millington GW. Recent developments in the specific dermatoses of pregnancy. Clin Exp Dermatol. 2012;37:1-14.
- Shears S, Blaszczak A, Kaffenberger J. Pregnancy dermatosis. In: Tyler KH, ed. Cutaneous Disorders of Pregnancy. 1st ed. Springer Nature; 2020:13-39.
- Lehrhoff S, Pomeranz MK. Specific dermatoses of pregnancy and their treatment. Dermatol Ther. 2015;26:274-284.
- Content and format of labeling for human prescription drug and biological products; requirements for pregnancy and lactation labeling. Fed Registr. 2014;79:72064-72103. To be codified at 21 CFR § 201.
- Murase JE, Heller MM, Butler DC. Safety of dermatologic medications in pregnancy and lactation: part 1. pregnancy. J Am Acad Dermatol. 2014;401:E1-E14.
- Friedman B, Bercovitch L. Atopic dermatitis in pregnancy. In: Tyler KH, ed. Cutaneous Disorders of Pregnancy. Springer Nature; 2020:59-74.
Fauci says ‘unprecedented’ conditions could influence COVID vaccine approval for kids
“From a public health standpoint, I think we have an evolving situation,” said Anthony S. Fauci, MD, director of the National Institute of Allergy and Infectious Diseases, in a moderated session with Lee Beers, MD, president of the American Academy of Pediatrics, at the virtual Pediatric Hospital Medicine annual conference.

The reasons for this shift remain unclear, he said.
Dr. Beers emphasized the ability of pediatric hospitalists to be flexible in the face of uncertainty and the evolving virus, and asked Dr. Fauci to elaborate on the unique traits of the delta variant that make it especially challenging.
“There is no doubt that delta transmits much more efficiently than the alpha variant or any other variant,” Dr. Fauci said. The transmissibility is evident in comparisons of the level of virus in the nasopharynx of the delta variant, compared with the original alpha COVID-19 virus – delta is as much as 1,000 times higher, he explained.
In addition, the level of virus in the nasopharynx of vaccinated individuals who develop breakthrough infections with the delta variant is similar to the levels in unvaccinated individuals who are infected with the delta variant.
The delta variant is “the tough guy on the block” at the moment, Dr. Fauci said.
Dr. Fauci also responded to a question on the lack of winter viruses, such as RSV and the flu, last winter, but the surge in these viruses over the summer.
This winter’s activity remains uncertain, Dr. Fauci said. However, he speculated “with a strong dose of humility and modesty” that viruses tend to have niches, some are seasonal, and the winter viruses that were displaced by COVID-19 hit harder in the summer instead. “If I were a [non-COVID] virus looking for a niche, I would be really confused,” he said. “I don’t know what will happen this winter, but if we get good control over COVID-19 by winter, we could have a very vengeful influenza season,” he said. “This is speculation, I don’t have any data for this,” he cautioned.
Dr. Beers raised the issue of back-to-school safety, and the updated AAP guidance for universal masking for K-12 students. “Our guidance about return to school gets updated as the situation changes and we gain a better understanding of how kids can get to school safely,” she said. A combination of factors affect back-to-school guidance, including the ineligibility of children younger than 12 years to be vaccinated, the number of adolescents who are eligible but have not been vaccinated, and the challenge for educators to navigate which children should wear masks, Dr. Beers said.
“We want to get vaccines for our youngest kids as soon as safely possible,” Dr. Beers emphasized. She noted that the same urgency is needed to provide vaccines for children as for adults, although “we have to do it safely, and be sure and feel confident in the data.”
When asked to comment about the status of FDA authorization of COVID-19 vaccines for younger children, Dr. Fauci described the current situation as one that “might require some unprecedented and unique action” on the part of the FDA, which tends to move cautiously because of safety considerations. However, concerns about adverse events might get in the way of protecting children against what “you are really worried about,” in this case COVID-19 and its variants, he said. Despite the breakthrough infections, “vaccination continues to very adequately protect people from getting severe disease,” he emphasized.
Dr. Fauci also said that he believes the current data support boosters for the immune compromised; however “it is a different story about the general vaccinated population and the vaccinated elderly,” he said. Sooner or later most people will likely need boosters; “the question is who, when, and how soon,” he noted.
Dr. Fauci wrapped up the session with kudos and support for the pediatric health care community. “As a nonpediatrician, I have a great deal of respect for the job you are doing,” he said. “Keep up the great work.”
Dr. Beers echoed this sentiment, saying that she was “continually awed, impressed, and inspired” by how the pediatric hospitalists are navigating the ever-changing pandemic environment.
“From a public health standpoint, I think we have an evolving situation,” said Anthony S. Fauci, MD, director of the National Institute of Allergy and Infectious Diseases, in a moderated session with Lee Beers, MD, president of the American Academy of Pediatrics, at the virtual Pediatric Hospital Medicine annual conference.
The reasons for this shift remain unclear, he said.
Dr. Beers emphasized the ability of pediatric hospitalists to be flexible in the face of uncertainty and the evolving virus, and asked Dr. Fauci to elaborate on the unique traits of the delta variant that make it especially challenging.
“There is no doubt that delta transmits much more efficiently than the alpha variant or any other variant,” Dr. Fauci said. The transmissibility is evident in comparisons of the level of virus in the nasopharynx of the delta variant, compared with the original alpha COVID-19 virus – delta is as much as 1,000 times higher, he explained.
In addition, the level of virus in the nasopharynx of vaccinated individuals who develop breakthrough infections with the delta variant is similar to the levels in unvaccinated individuals who are infected with the delta variant.
The delta variant is “the tough guy on the block” at the moment, Dr. Fauci said.
Dr. Fauci also responded to a question on the lack of winter viruses, such as RSV and the flu, last winter, but the surge in these viruses over the summer.
This winter’s activity remains uncertain, Dr. Fauci said. However, he speculated “with a strong dose of humility and modesty” that viruses tend to have niches, some are seasonal, and the winter viruses that were displaced by COVID-19 hit harder in the summer instead. “If I were a [non-COVID] virus looking for a niche, I would be really confused,” he said. “I don’t know what will happen this winter, but if we get good control over COVID-19 by winter, we could have a very vengeful influenza season,” he said. “This is speculation, I don’t have any data for this,” he cautioned.
Dr. Beers raised the issue of back-to-school safety, and the updated AAP guidance for universal masking for K-12 students. “Our guidance about return to school gets updated as the situation changes and we gain a better understanding of how kids can get to school safely,” she said. A combination of factors affect back-to-school guidance, including the ineligibility of children younger than 12 years to be vaccinated, the number of adolescents who are eligible but have not been vaccinated, and the challenge for educators to navigate which children should wear masks, Dr. Beers said.
“We want to get vaccines for our youngest kids as soon as safely possible,” Dr. Beers emphasized. She noted that the same urgency is needed to provide vaccines for children as for adults, although “we have to do it safely, and be sure and feel confident in the data.”
When asked to comment about the status of FDA authorization of COVID-19 vaccines for younger children, Dr. Fauci described the current situation as one that “might require some unprecedented and unique action” on the part of the FDA, which tends to move cautiously because of safety considerations. However, concerns about adverse events might get in the way of protecting children against what “you are really worried about,” in this case COVID-19 and its variants, he said. Despite the breakthrough infections, “vaccination continues to very adequately protect people from getting severe disease,” he emphasized.
Dr. Fauci also said that he believes the current data support boosters for the immune compromised; however “it is a different story about the general vaccinated population and the vaccinated elderly,” he said. Sooner or later most people will likely need boosters; “the question is who, when, and how soon,” he noted.
Dr. Fauci wrapped up the session with kudos and support for the pediatric health care community. “As a nonpediatrician, I have a great deal of respect for the job you are doing,” he said. “Keep up the great work.”
Dr. Beers echoed this sentiment, saying that she was “continually awed, impressed, and inspired” by how the pediatric hospitalists are navigating the ever-changing pandemic environment.
FROM PHM 2021
Long COVID symptoms rare but real in some kids
School-aged children with SARS-CoV-2 infection had only a few mild symptoms and typically recovered in 6 days, with more than 98% recovering in 8 weeks, a large U.K. study of smartphone data reassuringly reports.
In a small proportion (4.4%), however, COVID-19 symptoms such as fatigue, headache, or loss of smell persisted beyond a month, highlighting the need for ongoing pediatric care, according to Erika Molteni, PhD, a research fellow at King’s College, London, and colleagues.
The results, published online in The Lancet Child & Adolescent Health, also indicated that some children who had non-COVID infections were also susceptible to prolonged symptoms. “Our data highlight that other illnesses, such as colds and flu, can also have prolonged symptoms in children and it is important to consider this when planning for pediatric health services during the pandemic and beyond,” Michael Absoud, PhD, a senior coauthor and a King’s College consultant and senior lecturer, said in a news release. “All children who have persistent symptoms – from any illness – need timely multidisciplinary support linked with education, to enable them to find their individual pathway to recovery.”
Using a “citizen science” approach, the study extracted data from a smartphone app for tracking COVID symptoms in the ZOE COVID Study. The researchers looked at 258,790 children aged 5-17 years whose details were reported by adult proxies such as parents and carers from March 24, 2020, to Feb. 22, 2021. Of these, 75,529 had undergone a valid SARS-CoV-2 test.
The study also assessed symptoms in a randomly selected, age- and sex-matched cohort of 1,734 children in the app database who tested negative for COVID-19 but may have had other illnesses such as colds or flu.
In the 1,734 children testing positive for COVID-19 (approximately 50% each boys and girls), the most common symptoms were headache (62.2%) and fatigue (55.0%). More than 10% of the entire cohort had underlying asthma, but other comorbidities were very rare.
To assess the effect of age, the children were assessed in two groups: 5-11 years (n = 588) and 12-17 years (n = 1,146).
While unable to cross-check app reporting against actual medical records, the study suggested that illness lasted longer in COVID-positive than COVID-negative children, with a median of 6 days (interquartile range, 3-11) versus 3 days (IQR, 2-7). Furthermore, illness duration was positively associated with age: older children (median, 7 days; IQR, 3-12) versus younger children (median, 5 days; IQR, 2-9).
In 77 (4.4%) of the 1,734 COVID-positive children, illness persisted for at least 28 days, again more often in older than younger children: 5.1% of older children versus 3.1% of younger children (P = .046).
In addition, those with COVID-19 were more likely than children with non-COVID illness to be sick for more than 4 weeks: 4.4% versus 0.9%. At 4 weeks, however, the few children with other illnesses tended to have more symptoms, exhibiting a median of five symptoms versus two symptoms in the COVID-positive group.

“I tend to agree with the U.K. findings. COVID-19 in most school-age children is asymptomatic or a brief, self-limiting illness,” Sindhu Mohandas, MD, a pediatric infectious disease specialist at the Children’s Hospital Los Angeles, said in an interview. “The few children who need hospitalization have also mostly fully recovered by the time they are seen for their first outpatient clinic follow-up visit.”
Dr. Mohandas, who was not involved in the U.K. study, added that in her experience a small percentage, particularly adolescents, have some lingering symptoms after infection including fatigue, loss of appetite, and changes in smell and taste. “Identifying children with persistent illness and providing support and multidisciplinary care based on their symptomatology can make a positive impact on patients and their families.”
Recent research has suggested that long symptoms can persist for 3 months in 6% of children with COVID-19. And data from China have indicated that the prevalence of coinfection may be higher than in older patients.
In an accompanying comment, Dana Mahr, PhD, and Bruno J. Strasser, PhD, researchers in the faculty of science at the University of Geneva, said the app-based study “illustrates the potential and challenges of what has been called citizenship science,” in which projects rely on data input from nonscientists.
But while potentially democratizing participation in medical research, this subjective approach has the inherent bias of self-reporting (and in the case of the current study, proxy reporting), and can introduce potential conflicts of interest owing to the politicization of certain diseases.
In the case of the current study, Dr. Mahr and Dr. Strasser argued that, since the COVID-19 test result is known to participants, a pediatrician using objective criteria is better positioned to control for reporting biases than a parent asking a child about symptoms. “Entering data on a smartphone app is not equivalent to discussing with a pediatrician or health care worker who can answer further questions and concerns of participants, an especially important factor for underserved communities,” they wrote. “Citizen science will continue to require a close interaction with professional medical researchers to turn unique illness experiences into research data.”
This study was funded by Zoe Limited, the U.K. Government Department of Health and Social Care, Wellcome Trust, the U.K. Engineering and Physical Sciences Research Council, the U.K. Research and Innovation London Medical Imaging and Artificial Intelligence Centre for Value Based Healthcare, the U.K. National Institute for Health Research, the U.K. Medical Research Council, the British Heart Foundation, and the Alzheimer’s Society. Several study authors have disclosed support from various research-funding agencies and Zoe Limited supported all aspects of building and running the symptom-tracking application. Dr. Mahr and Dr. Strasser declared no competing interests. Dr. Mohandas disclosed no competing interests with regard to her comments.
School-aged children with SARS-CoV-2 infection had only a few mild symptoms and typically recovered in 6 days, with more than 98% recovering in 8 weeks, a large U.K. study of smartphone data reassuringly reports.
In a small proportion (4.4%), however, COVID-19 symptoms such as fatigue, headache, or loss of smell persisted beyond a month, highlighting the need for ongoing pediatric care, according to Erika Molteni, PhD, a research fellow at King’s College, London, and colleagues.
The results, published online in The Lancet Child & Adolescent Health, also indicated that some children who had non-COVID infections were also susceptible to prolonged symptoms. “Our data highlight that other illnesses, such as colds and flu, can also have prolonged symptoms in children and it is important to consider this when planning for pediatric health services during the pandemic and beyond,” Michael Absoud, PhD, a senior coauthor and a King’s College consultant and senior lecturer, said in a news release. “All children who have persistent symptoms – from any illness – need timely multidisciplinary support linked with education, to enable them to find their individual pathway to recovery.”
Using a “citizen science” approach, the study extracted data from a smartphone app for tracking COVID symptoms in the ZOE COVID Study. The researchers looked at 258,790 children aged 5-17 years whose details were reported by adult proxies such as parents and carers from March 24, 2020, to Feb. 22, 2021. Of these, 75,529 had undergone a valid SARS-CoV-2 test.
The study also assessed symptoms in a randomly selected, age- and sex-matched cohort of 1,734 children in the app database who tested negative for COVID-19 but may have had other illnesses such as colds or flu.
In the 1,734 children testing positive for COVID-19 (approximately 50% each boys and girls), the most common symptoms were headache (62.2%) and fatigue (55.0%). More than 10% of the entire cohort had underlying asthma, but other comorbidities were very rare.
To assess the effect of age, the children were assessed in two groups: 5-11 years (n = 588) and 12-17 years (n = 1,146).
While unable to cross-check app reporting against actual medical records, the study suggested that illness lasted longer in COVID-positive than COVID-negative children, with a median of 6 days (interquartile range, 3-11) versus 3 days (IQR, 2-7). Furthermore, illness duration was positively associated with age: older children (median, 7 days; IQR, 3-12) versus younger children (median, 5 days; IQR, 2-9).
In 77 (4.4%) of the 1,734 COVID-positive children, illness persisted for at least 28 days, again more often in older than younger children: 5.1% of older children versus 3.1% of younger children (P = .046).
In addition, those with COVID-19 were more likely than children with non-COVID illness to be sick for more than 4 weeks: 4.4% versus 0.9%. At 4 weeks, however, the few children with other illnesses tended to have more symptoms, exhibiting a median of five symptoms versus two symptoms in the COVID-positive group.
“I tend to agree with the U.K. findings. COVID-19 in most school-age children is asymptomatic or a brief, self-limiting illness,” Sindhu Mohandas, MD, a pediatric infectious disease specialist at the Children’s Hospital Los Angeles, said in an interview. “The few children who need hospitalization have also mostly fully recovered by the time they are seen for their first outpatient clinic follow-up visit.”
Dr. Mohandas, who was not involved in the U.K. study, added that in her experience a small percentage, particularly adolescents, have some lingering symptoms after infection including fatigue, loss of appetite, and changes in smell and taste. “Identifying children with persistent illness and providing support and multidisciplinary care based on their symptomatology can make a positive impact on patients and their families.”
Recent research has suggested that long symptoms can persist for 3 months in 6% of children with COVID-19. And data from China have indicated that the prevalence of coinfection may be higher than in older patients.
In an accompanying comment, Dana Mahr, PhD, and Bruno J. Strasser, PhD, researchers in the faculty of science at the University of Geneva, said the app-based study “illustrates the potential and challenges of what has been called citizenship science,” in which projects rely on data input from nonscientists.
But while potentially democratizing participation in medical research, this subjective approach has the inherent bias of self-reporting (and in the case of the current study, proxy reporting), and can introduce potential conflicts of interest owing to the politicization of certain diseases.
In the case of the current study, Dr. Mahr and Dr. Strasser argued that, since the COVID-19 test result is known to participants, a pediatrician using objective criteria is better positioned to control for reporting biases than a parent asking a child about symptoms. “Entering data on a smartphone app is not equivalent to discussing with a pediatrician or health care worker who can answer further questions and concerns of participants, an especially important factor for underserved communities,” they wrote. “Citizen science will continue to require a close interaction with professional medical researchers to turn unique illness experiences into research data.”
This study was funded by Zoe Limited, the U.K. Government Department of Health and Social Care, Wellcome Trust, the U.K. Engineering and Physical Sciences Research Council, the U.K. Research and Innovation London Medical Imaging and Artificial Intelligence Centre for Value Based Healthcare, the U.K. National Institute for Health Research, the U.K. Medical Research Council, the British Heart Foundation, and the Alzheimer’s Society. Several study authors have disclosed support from various research-funding agencies and Zoe Limited supported all aspects of building and running the symptom-tracking application. Dr. Mahr and Dr. Strasser declared no competing interests. Dr. Mohandas disclosed no competing interests with regard to her comments.
FROM THE LANCET CHILD & ADOLESCENT HEALTH
How heat kills: Deadly weather ‘cooking’ people from within
Millions of Americans have been languishing for weeks in the oppressive heat and humidity of a merciless summer. Deadly heat has already taken the lives of hundreds in the Pacific Northwest alone, with numbers likely to grow as the full impact of heat-related deaths eventually comes to light.
In the final week of July, the National Weather Service issued excessive heat warnings for 17 states, stretching from the West Coast, across the Midwest, down south into Louisiana and Georgia. Temperatures 10° to 15° F above average threaten the lives and livelihoods of people all across the country.
After a scorching heat wave in late June, residents of the Pacific Northwest are once again likely to see triple-digit temperatures in the coming days. With the heat, hospitals may face another surge of people with heat-related illnesses.
Erika Moseson, MD, a lung and intensive care specialist, witnessed firsthand the life-threatening impacts of soaring temperatures. She happened to be running her 10-bed intensive care unit in a suburban hospital in Gresham, Ore., about 15 miles east of Portland, the weekend of June 26. Within 12 hours, almost half her ICU beds were filled with people found unconscious on the street, in the bushes, or in their own beds, all because their body’s defenses had become overwhelmed by heat.
“It was unidentified person after unidentified person, coming in, same story, temperatures through the roof, comatose,” Dr. Moseson recalled. Young people in their 20s with muscle breakdown markers through the roof, a sign of rhabdomyolysis; people with no other medical problems that would have put them in a high-risk category.
As a lifelong Oregonian, she’d never seen anything like this before. “We’re all trained for it. I know what happens to you if you have heatstroke, I know how to treat it,” she trailed off, still finding it hard to believe. Still reeling from the number of cases in just a few hours. Still shocked that this happened on what’s supposed to be the cooler, rainforest side of Oregon.
Among those she treated and resuscitated, the memory of a patient that she lost continues to gnaw at her.
“I’ve gone back to it day after day since it happened,” she reflected.
Adults, in their 50s, living at home with their children. Just 1 hour prior, they’d all said goodnight. Then 1 hour later, when a child came to check in, both parents were unconscious.
Dr. Moseson shared how her team tried everything in their power for 18 hours to save the parent that was brought to her ICU. But like hundreds of others who went through the heat wave that weekend, her patient didn’t survive.
It was too late. From Dr. Moseson’s experience, it’s what happens “if you’re cooking a human.”
How heat kills
Regardless of where we live on the planet, humans maintain a consistent internal temperature around 98° F for our systems to function properly.
Our bodies have an entire temperature-regulating system to balance heat gain with heat loss so we don’t stray too far from our ideal range. The hypothalamus functions as the thermostat, communicating with heat sensors in our skin, muscles, and spinal cord. Based on signals about our core body temperature, our nervous system makes many decisions for us – opening up blood vessels in the peripheral parts of our body, pushing more blood toward the skin, and activating sweat glands to produce more sweat.
Sweat is one of the most powerful tools we have to maintain a safe internal temperature. Of course, there are some things under our control, such as removing clothing, drinking more water, and finding shade (or preferably air conditioning). But beyond that, it’s our ability to sweat that keeps us cool. When sweat evaporates into the air, heat from our skin goes with it, cooling us off.
Over time, our sweat response can work better as we get used to warmer environments, a process that’s known as acclimatization. Over the period of a few days to weeks, the sweat glands of acclimated people can start making sweat at lower temperatures, produce more sweat, and absorb more salt back into our system, all to make us more efficient “sweaters.”
While someone who’s not used to the heat may only produce 1 liter of sweat per hour, people who have become acclimated can produce 2-3 liters every hour, allowing evaporation to eliminate more than two times the amount of heat.
Because the process of acclimatization can take some time, typically it’s the first throes of summer, or heat waves in places where people don’t typically see high temperatures, that are the most deadly. And of course, the right infrastructure, like access to air conditioning, also plays a large role in limiting heat-related death and hospitalization.
A 2019 study showed that heat-related hospitalizations peak at different temperatures in different places. For example, hospitalizations typically peak in Texas when the temperature hits 105° F. But they might be highest in the Pacific Northwest at just 81° F.
Even with acclimatization, there are limits to how much our bodies can adapt to heat. When the humidity goes up past 75%, there’s already so much moisture in the air that heat loss through evaporation no longer occurs.
It’s this connection between heat and humidity that can be deadly. This is why the heat index (a measure that takes into account temperature and relative humidity) and wet bulb globe temperature (a measure commonly used by the military and competitive athletes that takes into account temperature, humidity, wind speed, sun angle, and cloud cover) are both better at showing how dangerous the heat may be for our health, compared to temperature alone.
Kristie L. Ebi, PhD, a professor in the Center for Health and the Global Environment at the University of Washington, Seattle, has been studying the effects of heat and other climate-sensitive conditions on health for over 20 years. She stresses that it’s not just the recorded temperatures, but the prolonged exposure that kills.
If you never get a chance to bring down that core body temperature, if your internal temperatures stay above the range where your cells and your organs can work well for a long time, that’s when you can have the most dangerous effects of heat.
“It depends then on your age, your fitness, your individual physiology, underlying medical conditions, to how quickly that could affect the functioning of those organs. There’s lots of variability in there,” Dr. Ebi said.
Our hearts take on the brunt of the early response, working harder to pump blood toward the skin. Water and salt loss through our skin can start to cause electrolyte changes that can cause heat cramps and heat exhaustion. We feel tired, nauseated, dizzy. With enough water loss, we may become dehydrated, limiting the blood flow to our brains, causing us to pass out.
These early signs are like a car’s check engine light – systems are already being damaged, but resting, refueling, and, most importantly, turning off the heat are critical steps to prevent fatal injury.
If hazardous heat exposure continues and our internal temperatures continue to rise, nerves stop talking to each other, the proteins in our body unfold and lose their shape, and the cells of our organs disintegrate. This in turn sets off a fire alarm in our blood vessels, where a variety of chemical messengers, including “heat-shock proteins,” are released. The release of these inflammatory proteins, coupled with the loss of blood flow, eventually leads to the death of cells throughout the body, from the brain, to the heart, the muscles, and the kidneys.
This process is referred to as heatstroke. In essence, we melt from the inside.
At a certain point, this cascade can’t be reversed. Just like when you cool a melting block of ice, the parts that have melted will not go back to their original shape. It’s a similar process in our bodies, so delays in cooling and treatment can lead to death rates as high as 80%.
On the outside, we see people who look confused and disoriented, with hot skin and rapid breathing, and they may eventually become unconscious. Core body temperatures over 105° F clinch the diagnosis, but at the first sign of feeling unwell, cooling should be started.
There is no fancier or more effective treatment than that: Cool right away. In emergency rooms in Washington State, doctors used body bags filled with ice and water to cool victims of the heat wave in late June.
“It was all from heat ... that’s the thing, you feel so idiotic ... you’re like, ‘I’ve given you ice’ ... you bring their temperature down. But it’s already set off this cascade that you can’t stop,” Dr. Moseson said.
By the time Dr. Moseson’s patient made it to her, cooling with ice was just the beginning of the attempts to resuscitate and revive. The patient was already showing evidence of a process causing widespread bleeding and clotting, known as disseminated intravascular coagulation, along with damage to the heart and failing kidneys. Over 18 hours, her team cooled the patient, flooded the blood vessels with fluids and blood products, attempted to start dialysis, and inserted a breathing tube – all of the technology that is used to save people from serious cardiovascular collapse from other conditions. But nothing could reverse the melting that had already occurred.
Deaths from heat are 100% preventable. Until they’re not.
No respite
As Dr. Ebi says, the key to preventing heat-related death is to cool down enough to stabilize our internal cells and proteins before the irreversible cascade begins.
But for close to 80% of Americans who live in urban areas, temperatures can be even higher and more intolerable compared to surrounding areas because of the way we’ve designed our cities. In effect, we have unintentionally created hot zones called “urban heat islands.”
Jeremy Hoffman, PhD, chief scientist for the Science Museum of Virginia, explains that things like bricks, asphalt, and parking lots absorb more of the sun’s energy throughout the day and then emit that back into the air as heat throughout the afternoon and into the evening. This raises the air and surface temperatures in cities, relative to rural areas. When temperatures don’t cool enough at night, there’s no way to recover from the day’s heat. You start the next day still depleted, with less reserve to face the heat of a new day.
When you dig even deeper, it turns out that even within the same city, there are huge “thermal inequities,” as Dr. Hoffman calls them. In a 2019 study, he found that wealthier parts of cities had more natural spaces such as parks and tree-lined streets, compared to areas that had been intentionally “redlined,” or systematically deprived of investment. This pattern repeats itself in over 100 urban areas across the country and translates to huge temperature differences on the order of 10-20 degrees Fahrenheit within the same city, at the exact same time during a heat wave.
“In some ways, the way that we’ve decided to plan and build our cities physically turns up the thermostat by several tens of degrees during heat waves in particular neighborhoods,” Dr. Hoffman said.
Dr. Hoffman’s work showed that the city of Portland (where the death toll from the heat wave in late June was the highest) had some of the most intense differences between formerly redlined vs. tree-lined areas out of the more than 100 cities that he studied.
“Watching it play out, I was really concerned, not only as a climate scientist, but as a human. Understanding the urban heat island effect and the extreme nature of the inequity in our cities, thermally and otherwise, once you start to really recognize it, you can’t forget it.”
The most vulnerable
When it comes to identifying and protecting the people most vulnerable to heat stress and heat-related death, there is an ever-growing list of those most at risk. Unfortunately, very few recognize when they themselves are at risk, often until it’s too late.
According to Linda McCauley, PhD, dean of the Emory University School of Nursing in Atlanta, “the scope of who is vulnerable is quickly increasing.”
For example, we’re used to recognizing that pregnant women and young children are at risk. Public health campaigns have long advised us not to leave young children and pets in hot cars. We know that adolescents who play sports during hot summer months are at high risk for heat-related events and even death.
In Georgia, a 15-year-old boy collapsed and died after his first day back at football practice when the heat index was 105° F on July 26, even as it appears that all protocols for heat safety were being followed.
We recognize that outdoor workers face devastating consequences from prolonged exertion in the heat and must have safer working conditions.
The elderly and those with long-term medical and mental health conditions are also more vulnerable to heat. The elderly may not have the same warning signs and may not recognize that they are dehydrated until it is too late. In addition, their sweating mechanism weakens, and they may be taking medicines that interfere with their ability to regulate their temperature.
Poverty and inadequate housing are risk factors, especially for those in urban heat islands. For many people, their housing does not have enough cooling to protect them, and they can’t safely get themselves to cooling shelters.
These patterns for the most vulnerable fit for the majority of deaths in Oregon during the late June heat wave. Most victims were older, lived alone, and didn’t have air conditioning. But with climate change, the predictions are that temperatures will go higher and heat waves will last longer.
“There’s probably very few people today that are ‘immune’ to the effects of heat-related stress with climate change. All of us can be put in situations where we are susceptible,” Dr. McCauley said.
Dr. Moseson agreed. Many of her patients fit none of these risk categories – she treated people with no health problems in their 20s in her ICU, and the patient she lost would not traditionally have been thought of as high risk. That 50-something patient had no long-standing medical problems, and lived with family in a newly renovated suburban home that had air conditioning. The only problem was that the air conditioner had broken and there had been no rush to fix it based on past experience with Oregon summers.
Preventing heat deaths
Protecting ourselves and our families means monitoring the “simple things.” The first three rules are to make sure we’re drinking plenty of water – this means drinking whether we feel thirsty or not. If we’re not in an air-conditioned place, we’ve got to look for shade. And we need to take regular rest breaks.
Inside a home without air conditioning, placing ice in front of a fan to cool the air can work, but realistically, if you are in a place without air conditioning and the temperatures are approaching 90° F, it’s safest to find another place to stay, if possible.
For those playing sports, there are usually 1-week to 2-week protocols that allow for acclimatization when the season begins – this means starting slowly, without gear, and ramping up activity. Still, parents and coaches should watch advanced weather reports to make sure it’s safe to practice outside.
How we dress can also help us, so light clothing is key. And if we’re able to schedule activities for times when it is cooler, that can also protect us from overheating.
If anyone shows early signs of heat stress, removing clothing, cooling their bodies with cold water, and getting them out of the heat is critical. Any evidence of heatstroke is an emergency, and 911 should be called without delay. The faster the core temperature can be dropped, the better the chances for recovery.
On the level of communities, access to natural air conditioning in the form of healthy tree canopies, and trees at bus stops to provide shade can help a lot. According to Dr. Hoffman, these investments help almost right away. Reimagining our cities to remove the “hot zones” that we have created is another key to protecting ourselves as our climate changes.
Reaching our limits in a changing climate
Already, we are seeing more intense, more frequent, and longer-lasting heat waves throughout the country and across the globe.
Dr. Ebi, a coauthor of a recently released scientific analysis that found that the late June Pacific Northwest heat wave would have been virtually impossible without climate change, herself lived through the scorching temperatures in Seattle. Her work shows that the changing climate is killing us right now.
We are approaching a time where extreme temperatures and humidity will make it almost impossible for people to be outside in many parts of the world. Researchers have found that periods of extreme humid heat have more than doubled since 1979, and some places have already had wet-bulb temperatures at the limits of what scientists think humans can tolerate under ideal conditions, meaning for people in perfect health, completely unclothed, in gale-force winds, performing no activity. Obviously that’s less than ideal for most of us and helps explain why thousands of people die at temperatures much lower than our upper limit.
Dr. Ebi pointed out that the good news is that many local communities with a long history of managing high temperatures have a lot of knowledge to share with regions that are newly dealing with these conditions. This includes how local areas develop early warning and response systems with specific action plans.
But, she cautions, it’s going to take a lot of coordination and a lot of behavior change to stabilize the earth’s climate, understand our weak points, and protect our health.
For Dr. Moseson, this reality has hit home.
“I already spent the year being terrified that I as an ICU doctor was going to be the one who gave my mom COVID. Finally I’m vaccinated, she’s vaccinated. Now I’ve watched someone die because they don’t have AC. And my parents, they’re old-school Oregonians, they don’t have AC.”
A version of this article originally appeared on WebMD.com.
Increases in new COVID cases among children far outpace vaccinations
New COVID-19 cases in children soared by almost 86% over the course of just 1 week, while the number of 12- to 17-year-old children who have received at least one dose of vaccine rose by 5.4%, according to two separate sources.
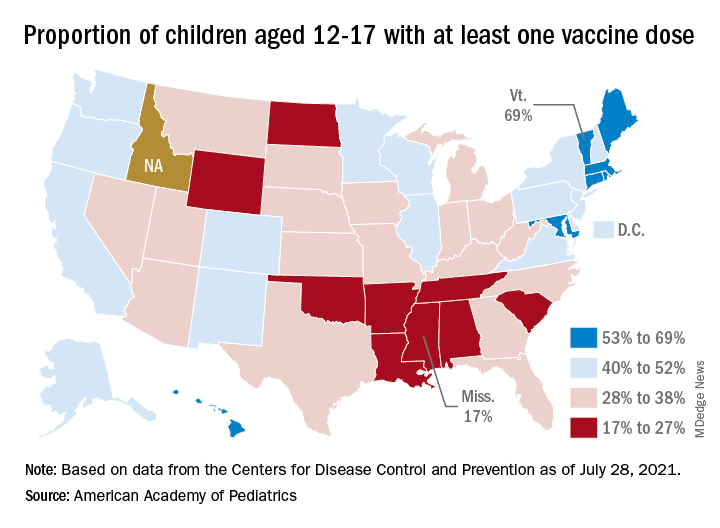
Meanwhile, the increase over the past 2 weeks – from 23,551 new cases for July 16-22 to almost 72,000 – works out to almost 205%, according to a report from the American Academy of Pediatrics and the Children’s Hospital Association.
Children represented 19.0% of the cases reported during the week of July 23-29, and they have made up 14.3% of all cases since the pandemic began, with the total number of cases in children now approaching 4.2 million, the AAP and CHA said in their weekly COVID report. About 22% of the U.S. population is under the age of 18 years.
As of Aug. 2, just over 9.8 million children aged 12-17 years had received at least one dose of the COVID vaccine, which was up by about 500,000, or 5.4%, from a week earlier, based on data from the Centers for Disease Control and Prevention.
Children aged 16-17 have reached a notable milestone on the journey that started with vaccine approval in December: 50.2% have gotten at least one dose and 40.3% are fully vaccinated. Among children aged 12-15 years, the proportion with at least one dose of vaccine is up to 39.5%, compared with 37.1% the previous week, while 29.0% are fully vaccinated (27.8% the week before), the CDC said on its COVID Data Tracker.
The national rates for child vaccination, however, tend to hide the disparities between states. There is a gap between Mississippi (lowest), where just 17% of children aged 12-17 years have gotten at least one dose, and Vermont (highest), which is up to 69%. Vermont also has the highest rate of vaccine completion (60%), while Alabama and Mississippi have the lowest (10%), according to a solo report from the AAP.
New COVID-19 cases in children soared by almost 86% over the course of just 1 week, while the number of 12- to 17-year-old children who have received at least one dose of vaccine rose by 5.4%, according to two separate sources.
Meanwhile, the increase over the past 2 weeks – from 23,551 new cases for July 16-22 to almost 72,000 – works out to almost 205%, according to a report from the American Academy of Pediatrics and the Children’s Hospital Association.
Children represented 19.0% of the cases reported during the week of July 23-29, and they have made up 14.3% of all cases since the pandemic began, with the total number of cases in children now approaching 4.2 million, the AAP and CHA said in their weekly COVID report. About 22% of the U.S. population is under the age of 18 years.
As of Aug. 2, just over 9.8 million children aged 12-17 years had received at least one dose of the COVID vaccine, which was up by about 500,000, or 5.4%, from a week earlier, based on data from the Centers for Disease Control and Prevention.
Children aged 16-17 have reached a notable milestone on the journey that started with vaccine approval in December: 50.2% have gotten at least one dose and 40.3% are fully vaccinated. Among children aged 12-15 years, the proportion with at least one dose of vaccine is up to 39.5%, compared with 37.1% the previous week, while 29.0% are fully vaccinated (27.8% the week before), the CDC said on its COVID Data Tracker.
The national rates for child vaccination, however, tend to hide the disparities between states. There is a gap between Mississippi (lowest), where just 17% of children aged 12-17 years have gotten at least one dose, and Vermont (highest), which is up to 69%. Vermont also has the highest rate of vaccine completion (60%), while Alabama and Mississippi have the lowest (10%), according to a solo report from the AAP.
Bronchitis the leader at putting children in the hospital
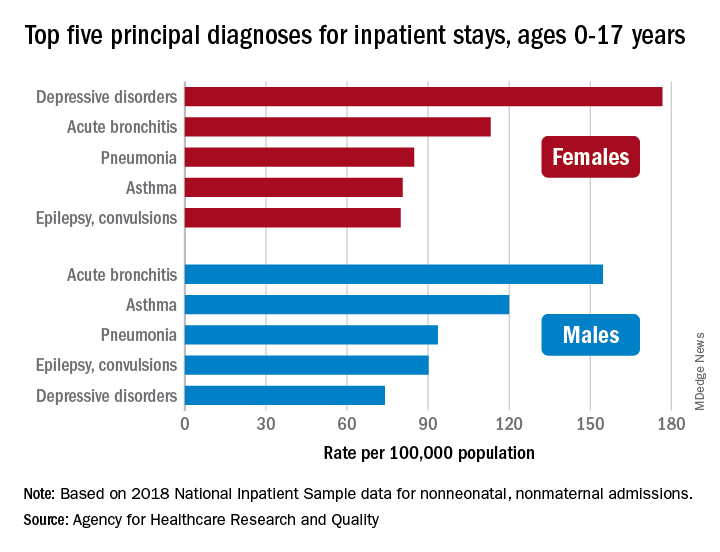
About 7% (99,000) of the 1.47 million nonmaternal, nonneonatal hospital stays in children aged 0-17 years involved a primary diagnosis of acute bronchitis in 2018, representing the leading cause of admissions in boys (154.7 stays per 100,000 population) and the second-leading diagnosis in girls (113.1 stays per 100,000), Kimberly W. McDermott, PhD, and Marc Roemer, MS, said in a statistical brief.
Depressive disorders were the most common primary diagnosis in girls, with a rate of 176.7 stays per 100,000, and the second-leading diagnosis overall, although the rate was less than half that (74.0 per 100,000) in boys. Two other respiratory conditions, asthma and pneumonia, were among the top five for both girls and boys, as was epilepsy, they reported.
The combined rate for all diagnoses was slightly higher for boys, 2,051 per 100,000, compared with 1,922 for girls, they said based on data from the National Inpatient Sample.
“Identifying the most frequent primary conditions for which patients are admitted to the hospital is important to the implementation and improvement of health care delivery, quality initiatives, and health policy,” said Dr. McDermott of IBM Watson Health and Mr. Roemer of the AHRQ.
‘Shocking’ early complications from teen-onset type 2 diabetes
Newly published data show alarmingly high rates and severity of early diabetes-specific complications in individuals who develop type 2 diabetes at a young age. This suggests intervention should be early and aggressive among these youngsters, said the researchers.

The results for the 500 young adult participants in the Treatment Options for Type 2 Diabetes in Adolescents and Youth 2 (TODAY 2) study were published online July 29 in the New England Journal of Medicine by the TODAY study group.
At follow-up – after originally participating in the TODAY trial when they were young teenagers – they had a mean age of 26.4 years.
At this time, more than two thirds had hypertension and half had dyslipidemia.
Overall, 60% had at least one diabetic microvascular complication (retinal disease, neuropathy, or diabetic kidney disease), and more than a quarter had two or more such complications.
“These data illustrate the serious personal and public health consequences of youth-onset type 2 diabetes in the transition to adulthood,” the researchers noted.
Don’t tread lightly just because they are young
“The fact that these youth are accumulating complications at a rapid rate and are broadly affected early in adulthood certainly suggests that aggressive therapy is needed, both for glycemic control and treatment of risk factors like hypertension and dyslipidemia,” study coauthor Philip S. Zeitler, MD, PhD, said in an interview.
“In the absence of studies specifically addressing this, we need to take a more aggressive approach than people might be inclined to, given that the age at diagnosis is young, around 14 years,” he added.
“Contrary to the inclination to be ‘gentle’ in treating them because they are kids, these data suggest that we can’t let these initial years go by without strong intervention, and we need to be prepared for polypharmacy.”
Unfortunately, as Dr. Zeitler and coauthors explained, youth-onset type 2 diabetes is characterized by a suboptimal response to currently approved diabetes medications.
New pediatric indications in the United States for drugs used to treat type 2 diabetes in adults, including the recent Food and Drug Administration approval of extended-release exenatide for children as young as 10 years of age, “helps, but only marginally,” said Dr. Zeitler, of the Clinical & Translational Research Center, Children’s Hospital Colorado, Aurora.
“In some cases, it will help get them covered by carriers, which is always good. But this is still a very limited set of medications. It doesn’t include more recently approved more potent glucagon-like peptide-1 (GLP-1) agonists, like semaglutide, and doesn’t include the sodium-glucose cotransporter 2 (SGLT2) inhibitors. Pediatricians are used to using medications off label and that is necessary here while we await further approvals,” he said.
And he noted that most individuals with youth-onset type 2 diabetes in the United States are covered by public insurance or are uninsured, depending on which state they live in. While the two major Medicaid programs in Colorado allow full access to adult formularies, that’s not the case everywhere. Moreover, patients often face further access barriers in states without expanded Medicaid.
Follow-up shows all metrics worsening over time
In TODAY 2, patients participated in an observational follow-up in their usual care settings in 2011-2020. At the start, they were receiving metformin with or without insulin for diabetes, but whether this continued and whether they were treated for other risk factors was down to individual circumstances.
Participants’ median A1c increased over time, and the percentage with A1c < 6% (< 48 mmol/mol) declined from 75% at the time of TODAY entry to just 19% at the 15-year end of follow-up.
The proportion with an A1c ≤ 10% (≤ 86 mmol/mol) rose from 0% at baseline to 34% at 15 years.
At that time, nearly 50% were taking both metformin and insulin, while more than a quarter were taking no medications.
The prevalence of hypertension increased from 19.2% at baseline to 67.5% at 15 years, while dyslipidemia rose from 20.8% to 51.6%.
Kidney disease prevalence increased from 8.0% at baseline to 54.8% at 15 years. Nerve disease rose from 1.0% to 32.4%. Retinal disease jumped from 13.7% with milder nonproliferative retinopathy in 2010-2011 to 51.0% with any eye disease in 2017-2018, including 8.8% with moderate to severe retinal changes and 3.5% with macular edema.
Overall, at the time of the last visit, 39.9% had no diabetes complications, 31.8% had one, 21.3% had two, and 7.1% had three complications.
Serious cardiovascular events in mid-20s
There were 17 adjudicated serious cardiovascular events, including four myocardial infarctions, six heart failure events, three diagnoses of coronary artery disease, and four strokes.
Six participants died, one each from myocardial infarction, kidney failure, and drug overdose, and three from sepsis.
Dr. Zeitler called the macrovascular events “shocking,” noting that although the numbers are small, for people in their mid-20s “they should be zero ... While we don’t yet know if the rates are the same or faster than in adults, even if they are the same, these kids are only in their late 20s, as opposed to adults experiencing these problems in their 50s, 60s, and 70s.
“The fact that these complications are occurring when these individuals should be in the prime of their life for both family and work has huge implications,” he stressed.
Findings have multiple causes
The reasons for the findings are both biologic and socioeconomic, Dr. Zeitler said.
“We know already that many kids with type 2 have rapid [deterioration of] beta-cell [function], which is probably very biologic. It stands to reason that an individual who can get diabetes as an adolescent probably has more fragile beta cells in some way,” he noted.
“But we also know that many other things contribute: stress, social determinants, access to quality care and medications, access to healthy foods and physical activity, availability of family supervision given the realities of families’ economic status and jobs, etc.”
It’s also known that youth with type 2 diabetes have much more severe insulin resistance than that of adults with the condition, and that “once the kids left ... the [TODAY] study, risk factor treatment in the community was less than ideal, and a lot of kids who met criteria for treatment of their blood pressure or lipids were not being treated. This is likely at least partly sociologic and partly the general pediatric hesitancy to use medications.”
He said the TODAY team will soon have some new data to show that “glycemia during the early years makes a difference, again supporting intensive intervention early on.”
The TODAY study was supported by grants from the National Institute of Diabetes and Digestive and Kidney Diseases. Dr. Zeitler had no further disclosures.
A version of this article first appeared on Medscape.com.
Newly published data show alarmingly high rates and severity of early diabetes-specific complications in individuals who develop type 2 diabetes at a young age. This suggests intervention should be early and aggressive among these youngsters, said the researchers.
The results for the 500 young adult participants in the Treatment Options for Type 2 Diabetes in Adolescents and Youth 2 (TODAY 2) study were published online July 29 in the New England Journal of Medicine by the TODAY study group.
At follow-up – after originally participating in the TODAY trial when they were young teenagers – they had a mean age of 26.4 years.
At this time, more than two thirds had hypertension and half had dyslipidemia.
Overall, 60% had at least one diabetic microvascular complication (retinal disease, neuropathy, or diabetic kidney disease), and more than a quarter had two or more such complications.
“These data illustrate the serious personal and public health consequences of youth-onset type 2 diabetes in the transition to adulthood,” the researchers noted.
Don’t tread lightly just because they are young
“The fact that these youth are accumulating complications at a rapid rate and are broadly affected early in adulthood certainly suggests that aggressive therapy is needed, both for glycemic control and treatment of risk factors like hypertension and dyslipidemia,” study coauthor Philip S. Zeitler, MD, PhD, said in an interview.
“In the absence of studies specifically addressing this, we need to take a more aggressive approach than people might be inclined to, given that the age at diagnosis is young, around 14 years,” he added.
“Contrary to the inclination to be ‘gentle’ in treating them because they are kids, these data suggest that we can’t let these initial years go by without strong intervention, and we need to be prepared for polypharmacy.”
Unfortunately, as Dr. Zeitler and coauthors explained, youth-onset type 2 diabetes is characterized by a suboptimal response to currently approved diabetes medications.
New pediatric indications in the United States for drugs used to treat type 2 diabetes in adults, including the recent Food and Drug Administration approval of extended-release exenatide for children as young as 10 years of age, “helps, but only marginally,” said Dr. Zeitler, of the Clinical & Translational Research Center, Children’s Hospital Colorado, Aurora.
“In some cases, it will help get them covered by carriers, which is always good. But this is still a very limited set of medications. It doesn’t include more recently approved more potent glucagon-like peptide-1 (GLP-1) agonists, like semaglutide, and doesn’t include the sodium-glucose cotransporter 2 (SGLT2) inhibitors. Pediatricians are used to using medications off label and that is necessary here while we await further approvals,” he said.
And he noted that most individuals with youth-onset type 2 diabetes in the United States are covered by public insurance or are uninsured, depending on which state they live in. While the two major Medicaid programs in Colorado allow full access to adult formularies, that’s not the case everywhere. Moreover, patients often face further access barriers in states without expanded Medicaid.
Follow-up shows all metrics worsening over time
In TODAY 2, patients participated in an observational follow-up in their usual care settings in 2011-2020. At the start, they were receiving metformin with or without insulin for diabetes, but whether this continued and whether they were treated for other risk factors was down to individual circumstances.
Participants’ median A1c increased over time, and the percentage with A1c < 6% (< 48 mmol/mol) declined from 75% at the time of TODAY entry to just 19% at the 15-year end of follow-up.
The proportion with an A1c ≤ 10% (≤ 86 mmol/mol) rose from 0% at baseline to 34% at 15 years.
At that time, nearly 50% were taking both metformin and insulin, while more than a quarter were taking no medications.
The prevalence of hypertension increased from 19.2% at baseline to 67.5% at 15 years, while dyslipidemia rose from 20.8% to 51.6%.
Kidney disease prevalence increased from 8.0% at baseline to 54.8% at 15 years. Nerve disease rose from 1.0% to 32.4%. Retinal disease jumped from 13.7% with milder nonproliferative retinopathy in 2010-2011 to 51.0% with any eye disease in 2017-2018, including 8.8% with moderate to severe retinal changes and 3.5% with macular edema.
Overall, at the time of the last visit, 39.9% had no diabetes complications, 31.8% had one, 21.3% had two, and 7.1% had three complications.
Serious cardiovascular events in mid-20s
There were 17 adjudicated serious cardiovascular events, including four myocardial infarctions, six heart failure events, three diagnoses of coronary artery disease, and four strokes.
Six participants died, one each from myocardial infarction, kidney failure, and drug overdose, and three from sepsis.
Dr. Zeitler called the macrovascular events “shocking,” noting that although the numbers are small, for people in their mid-20s “they should be zero ... While we don’t yet know if the rates are the same or faster than in adults, even if they are the same, these kids are only in their late 20s, as opposed to adults experiencing these problems in their 50s, 60s, and 70s.
“The fact that these complications are occurring when these individuals should be in the prime of their life for both family and work has huge implications,” he stressed.
Findings have multiple causes
The reasons for the findings are both biologic and socioeconomic, Dr. Zeitler said.
“We know already that many kids with type 2 have rapid [deterioration of] beta-cell [function], which is probably very biologic. It stands to reason that an individual who can get diabetes as an adolescent probably has more fragile beta cells in some way,” he noted.
“But we also know that many other things contribute: stress, social determinants, access to quality care and medications, access to healthy foods and physical activity, availability of family supervision given the realities of families’ economic status and jobs, etc.”
It’s also known that youth with type 2 diabetes have much more severe insulin resistance than that of adults with the condition, and that “once the kids left ... the [TODAY] study, risk factor treatment in the community was less than ideal, and a lot of kids who met criteria for treatment of their blood pressure or lipids were not being treated. This is likely at least partly sociologic and partly the general pediatric hesitancy to use medications.”
He said the TODAY team will soon have some new data to show that “glycemia during the early years makes a difference, again supporting intensive intervention early on.”
The TODAY study was supported by grants from the National Institute of Diabetes and Digestive and Kidney Diseases. Dr. Zeitler had no further disclosures.
A version of this article first appeared on Medscape.com.

Hyperimmune globulin fails to prevent congenital CMV infection
Administering hyperimmune globulin to pregnant women who tested positive for cytomegalovirus did not reduce CMV infections or deaths among their fetuses or newborns, according to a randomized controlled trial published online July 28 in the New England Journal of Medicine.
Up to 40,000 infants a year have congenital CMV infections, which can lead to stillbirth, neonatal death, deafness, and cognitive and motor delay. An estimated 35%-40% of fetuses of women with a primary CMV infection will develop an infection, write Brenna Hughes, MD, an associate professor of ob/gyn and chief of the division of maternal fetal medicine at Duke University, Durham, N.C., and colleagues.
Previous trials and observational studies have shown mixed results with hyperimmune globulin for the prevention of congenital CMV infection.
“It was surprising to us that none of the outcomes in this trial were in the direction of potential benefit,” Dr. Hughes told this news organization. “However, this is why it is important to do large trials in a diverse population.”
The study cohort comprised 206,082 pregnant women who were screened for CMV infection before 23 weeks’ gestation. Of those women, 712 (0.35%) tested positive for CMV. The researchers enrolled 399 women who had tested positive and randomly assigned them to receive either a monthly infusion of CMV hyperimmune globulin (100 mg/kg) or placebo until delivery. The researchers used a composite of CMV infection or, if no testing occurred, fetal/neonatal death as the primary endpoint.
The trial was stopped early for futility when data from 394 participants revealed that 22.7% of offspring in the hyperimmune globulin group and 19.4% of those in the placebo group had had a CMV infection or had died (relative risk = 1.17; P = .42).
When individual endpoints were examined, trends were detected in favor of the placebo, but they did not reach statistical significance. The incidence of death was higher in the hyperimmune globulin group (4.9%) than in the placebo group (2.6%). The rate of preterm birth was also higher in the intervention group (12.2%) than in the group that received placebo (8.3%). The incidence of birth weight below the fifth percentile was 10.3% in the intervention group and 5.4% in the placebo group.
One woman who received hyperimmune globulin experienced a severe allergic reaction to the first infusion. Additionally, more women in the hyperimmune globulin group experienced headaches and shaking chills during infusions than did those who received placebo. There were no differences in maternal outcomes between the groups. There were no thromboembolic or ischemic events in either group.
“These findings suggest CMV hyperimmune globulin should not be used for the prevention of congenital CMV in pregnant patients with primary CMV during pregnancy,” Dr. Hughes said in an interview.
“A CMV vaccine is likely to be the most effective public health measure that we can offer, and that should be at the forefront of research investments,” she said. “But some of the other medications that work against CMV should be tested on a large scale as well,” she said. For example, a small trial in Israel showed that high-dose valacyclovir in early pregnancy decreased congenital CMV, and thus the drug merits study in a larger trial, she said.
Other experts agree that developing a vaccine should be the priority.
“The ultimate goal for preventing the brain damage and birth defects caused by congenital CMV infection is a vaccine that is as effective as the rubella vaccine has been for eliminating congenital rubella syndrome and that can be given well before pregnancy,” said Sallie Permar, MD, PhD, chair of pediatrics at Weill Cornell Medicine and pediatrician-in-chief at New York–Presbyterian/Weill Cornell Medical Center and the New York–Presbyterian Komansky Children’s Hospital in New York.
“While trials of vaccines are ongoing, there is a need to have a therapeutic option, especially for the high-risk setting of a mother acquiring the virus for the first time during pregnancy,” Dr. Permar said in an interview.
Dr. Permar was not involved in this study but is involved in follow-up studies of this cohort and is conducting research on CMV maternal vaccines. She noted the need for safe, effective antiviral treatments and for research into newer immunoglobulin products, such as monoclonal antibodies.
Both Dr. Permar and Dr. Hughes highlighted the challenge of raising awareness about the danger of CMV infections during pregnancy.
“Pregnant women, and especially those who have or work with young children, who are frequently carriers of the infection, should be informed of this risk,” Dr. Permar said. She hopes universal testing of newborns will be implemented and that it enables people to recognize the frequency and burden of these infections. She remains optimistic about a vaccine.
“After 60 years of research into a CMV vaccine, I believe we are currently in a ‘golden age’ of CMV vaccine development,” she said. She noted that Moderna is about to launch a phase 3 mRNA vaccine trial for CMV. “Moreover, immune correlates of protection against CMV have been identified from previous partially effective vaccines, and animal models have improved for preclinical studies. Therefore, I believe we will have an effective and safe vaccine against this most common congenital infection in the coming years.”
The research was funded by the Eunice Kennedy Shriver National Institute of Child Health and Human Development and the National Center for Advancing Translational Sciences. Dr. Hughes has served on Merck’s scientific advisory board. Various coauthors have received personal fees from Medela and nonfinancial support from Hologic; personal fees from Moderna and VBI vaccines, and grants from Novavax. Dr. Permar consults for Pfizer, Moderna, Merck, Sanofi, and Dynavax on their CMV vaccine programs, and she has a sponsored research program with Merck and Moderna on CMV vaccines.
A version of this article first appeared on Medscape.com.
Impact of Diagnostic Testing on Pediatric Patients With Pharyngitis: Evidence From a Large Health Plan
From the Department of Pharmaceutical and Health Economics, University of Southern California, Los Angeles, CA, (Drs. Sangha and McCombs), Department of Pediatrics, Keck School of Medicine, and Department of Clinical Pharmacy, School of Pharmacy, University of Southern California, Los Angeles, CA, (Dr. Steinberg), and Leonard Schaeffer Center for Health Policy and Economics, University of Southern California, Los Angeles, CA (Dr. McCombs).
Objective: The recommended treatment for children and adolescents under 18 years of age who have a positive test for group A Streptococcus (GAS) are antibiotics using the “test and treat” strategy to detect and treat GAS for pediatric pharyngitis. This study used paid claims data to document the extent to which real-world treatment patterns are consistent with these recommendations. We document the factors correlated with testing and treatment, then examine the effects of receiving a GAS test and being treated with an antibiotic impact the likelihood of a revisit for an acute respiratory tract infection within 28 days.
Methods: This retrospective cohort study used Optum Insight Clinformatics data for medical and pharmacy claims from 2011-2013 to identify episodes of care for children and adolescents with pharyngitis around their index visit (± 6 months). The sample population included children and adolescents under 18 years of age with a diagnosis of pharyngitis. Multivariable logistic regression analyses were used to document factors associated with receipt of GAS test and antibiotic treatment. Next, we used logistic regression models to estimate the impact of test and treat recommendation on revisit risk.
Results: There were 24 685 treatment episodes for children and adolescents diagnosed with pharyngitis. Nearly 47% of these episodes included a GAS test and 48% of tested patients were prescribed an antibiotic prescription. Failing to perform a GAS test increased the risk of a revisit within 28 days by 44%. The use of antibiotics by tested and untested patients had no impact on revisit risk.
Conclusion: While the judicious use of antibiotics is important in managing pharyngitis infections and managing complications, the use of rapid diagnostic tools was found to be the determining factor in reducing revisits for pediatric patients with pharyngitis.
Keywords: pediatrics; pharyngitis; respiratory infections; acute infections; diagnostic tests; group A Streptococcus; antibiotics; revisits.
Acute pharyngitis is a common acute respiratory tract infection (ARTI) in children. Group A β-hemolytic streptococci (GABHS) is the most common bacterial etiology for pediatric pharyngitis, accounting for 15% to 30% of cases.1
Beyond clinical assessment, laboratory diagnostic testing generally plays a limited role in guiding appropriate antibiotic prescribing for patients with an ARTI.2,3 Most diagnostic tests require 2 or 3 days to result, incur additional costs, and may delay treatment.4 While these tests do not provide clear and timely guidance on which specific antibiotic is appropriate for ARTI patients, this is not the case for patients with pharyngitis.5,6,7 A rapid diagnostic test exists to identify pharyngitis patients with GABHS which accounts for 1 in 4 children with acute sore throat.1,4,6 Both the American Academy of Pediatrics and the Infectious Diseases Society of America recommend antibiotic treatment for children and adolescents under 18 years of age who have a positive test for group A Streptococcus (GAS).8,9 This “test and treat” protocol has been consistently included in the Healthcare Effectiveness Data and Information Set (HEDIS) standards over time for pediatric pharyngitis patients aged 3 to 18 years before dispensing an antibiotic.10
Sinusitis, pneumonia, and acute otitis media are considered ARTIs where antibiotic treatment is justified. Therefore, pharyngitis of unclear etiology seen with these comorbid infections may not always undergo GAS testing but move directly to the patient being prescribed antibiotics. This analysis enumerates ARTI-related comorbidities present together with the initial coded pharyngitis diagnosis to evaluate their impact on the provider’s decision to test and treat, and on revisit risk.
Antibiotic treatment for GAS patients is likely to eradicate the acute GABHS infection within 10 days. Penicillin and amoxicillin are commonly recommended because of their narrow spectrum of activity, few adverse effects, established efficacy, and modest cost. Alternative antibiotics for patients with penicillin allergy, or with polymicrobial infection seen on culture results, include a first-generation cephalosporin, clindamycin, clarithromycin (Biaxin), or azithromycin (Zithromax).1,8,11 However, while compliance with these HEDIS guidelines has been evaluated, the outcome effects of following the HEDIS “test and treat” recommendations for children with pharyngitis have not been adequately evaluated.
These outcome evaluations have increasing importance as the latest HEDIS survey has shown testing rates in commercial Preferred Provider Organizations (PPO) falling from 86.4% in 2018 to 75.9% in 2019, the lowest rate of testing since 2009, with similar reductions under 80% for Health Maintenance Organizations (HMO).10 While health plans may execute cost-benefit analyses and algorithms to forge best practices for GAS testing in children and adolescents presenting with symptoms of pharyngitis, it is important to regard the wasteful resource utilization and additional cost of revisits that may offset any gains accrued by more focused GAS testing outside the existing clinical guidelines and HEDIS measures. This may be of particular importance in documenting infection and sparing antibiotic therapy in toddlers and younger.
The objective of this study was to investigate the correlation between testing and antibiotic use on the likelihood of a revisit for an acute respiratory tract infection within 28 days. To achieve this objective, this investigation consists of 3 sequential analyses. First, we document the factors associated with the decision to test the patient for a GABHS infection using the GAS test. Next, we document the factors associated with the decision to use an antibiotic to treat the patient as a function of having tested the patient. Finally, we investigate the impact of the testing and treatment decisions on the likelihood of a revisit within 28 days.
Methods
Study design
This was a retrospective cohort study of episodes of treatment for pediatric patients with pharyngitis. Episodes were identified using data derived from the Optum Insight Clinformatics claims database provided to the University of Southern California to facilitate the training of graduate students. These data cover commercially insured patients with both medical and pharmacy benefits. Data were retrieved from the 3-year period spanning 2011-2013. An episode of care was identified based on date of the first (index) outpatient visit for a pharyngitis diagnosis (International Classification of Diseases, Ninth Revision [ICD-9]: 462, 463, 034.0). Outpatient visits were defined by visit setting: ambulatory clinics, physician offices, emergency rooms, and urgent care facilities. Each pharyngitis treatment episode was then screened for at least a 6-month enrollment in a health insurance plan prior and subsequent to the index visit using Optum enrollment data. Finally, eligible treatment episodes were restricted to children and adolescents under 18 years of age, who had an index outpatient visit for a primary diagnosis of acute pharyngitis.
A diagnostic profile was created for each episode using the diagnoses recorded for the index visit. Up to 3 diagnoses may be recorded for any outpatient visit and the first recorded diagnosis was assumed to be the primary diagnosis for that episode. Any secondary diagnoses recorded on the index visit were used to define comorbidities present at the index visit. ARTI-related comorbidities included: acute otitis media (AOM), bronchitis, sinusitis, pneumonia, and upper respiratory infection (URI). Other comorbid medical diagnoses were documented using diagnostic data from the pre-index period. Dichotomous variables for the following categories were created: mental disorders, nervous system disorders, respiratory symptoms, fever, injury and poisoning, other, or no diseases.
Prior visits for other respiratory infections in the previous 90 days were also identified for patients based on their index visit for pharyngitis. Similarly, any subsequent visits, within 28 days of the index visit, were also recorded to measure the health outcome for analysis. Practice settings include physician offices and federally qualified health centers, state and local health clinics, outpatient hospitals facilities, emergency departments, and other outpatient settings such as walk-in retail health clinic or ambulatory centers. Providers include primary care physicians (family practice, pediatricians, internal medicine), specialty care physicians (emergency medicine, preventive medicine), nonphysician providers (nurse practitioners, physician assistants) and other providers (urgent care, acute outpatient care, ambulatory care centers). Seasons of the year were determined based on the index date of the episode to account for possible seasonality in pharyngitis treatment. Lastly, a previous visits variable was created to identify whether the child had nonpharyngitis ARTI visits in the 3 months prior to the index visit.
Demographic variables were created based on enrollment and the socioeconomic data available in the Optum socioeconomic status file. These variables include patient age, race, sex, household income, geographic location, practice setting type, provider specialty, and type of insurance. An estimate of patient household income was based on algorithms using census block groups. Income categories were informed by the federal guidelines for a family of 4. A low-income family was defined as earning less than $50 000; a middle-income family earned between $50 000 and $75 000, and a high-income family earned $75 000 and above.12 Patient insurance type was categorized as HMO, Exclusive Provider Organization (EPO), Point of Service (POS), and PPO. Race was identified as White, Black, Hispanic, and Asian. Patient location was defined according to national census regions.
Outcomes
GAS test
The HEDIS measures for pharyngitis recommend using the GAS test to identify the bacterial etiology of the pharyngitis infection. Patients who received the test were identified based on Current Procedural Terminology (CPT) codes 87070-71, 87081, 87430, 87650-52, and 87880.10
Antibiotic treatment
The pharmacy administrative claims dataset was used to identify study patients who filled a prescription for an antibiotic during their pharyngitis treatment episode. Optum pharmacy data identify the medications received, specifies the date of prescription filling, National Drug Codes, and American Hospital Formulary Service (AHFS) Classification System codes for each medication. We used the AHFS Pharmacologic-Therapeutic classification of antibiotics to create dichotomous variables documenting the antibacterial used by each patient.13 These are categorized under antibacterial including penicillins, cephalosporins (first, second, third, fourth generation cephalosporins), macrolides (first generation and others), tetracyclines, sulfonamides, fluoroquinolones (ciprofloxacin, levofloxacin, moxifloxacin), cephamycin, carbapenems, and β-lactam antibiotics (amoxicillin, amoxicillin/clavulanate, cephalexin, cefuroxime, cefdinir).
Revisits to physician or other provider
Revisits within 28 days were used as the measure of patient outcomes related to testing and filling of an antibiotic prescription for acute pharyngitis. Revisits may also be due to a patient returning for a follow-up, alternative treatment, worsening pharyngitis, or for another ARTI. An ARTI-related revisit also increases total resources used to treat pediatric pharyngitis patients.
Statistical analysis
Logistic regression was used for all 3 analyses conducted in this study. First, we determined the patient and treating physician characteristics that impact the decision to use GAS testing for pharyngitis. Second, we identified those factors that impact the decision to use antibiotic prescriptions among children who were diagnosed with pharyngitis adding in the dichotomous variable indicating if the patient had received a GAS test. Third, we used a logit regression analysis to document if receiving a GAS test and/or an antibiotic impacted the likelihood of a revisit by comparing revisit risk. To estimate the effect of testing and/or antibiotic use, we divided patients into 4 groups based on whether the patient received a GAS test and/or an antibiotic prescription. This specification of the analysis of revisits as an outcome focuses on adherence to HEDIS “test and treat” guidelines10:
- Patients who were not tested yet filled an antibiotic prescription. This decision was likely based on the clinician’s judgment of the patient’s signs and symptoms, and confirmational testing not performed.
- Patients who were not tested and did not fill an antibiotic prescription. Apparently, in the clinician’s judgment the patient’s signs and symptoms were such that the infection did not warrant treatment and the clinical presentation did not necessitate the GAS test to confirm the recorded diagnosis of pharyngitis.
- Patients who were tested and received antibiotic prescription, likely because the test was positive for GABHS.
- Patients who were tested and did not receive antibiotic prescription.
We tested for statistically significant differences in baseline characteristics across these 4 patient groups using t tests for continuous variables and χ2 tests for categorical variables. Odds ratios (OR) and CI were computed for the influential variables included the regression analyses.
We conducted a sensitivity analysis using a model specification which included the dichotomous variables for testing and for treatment, and the interaction term between these variables to assess if treatment effects varied in tested and untested patients. We also estimated this model of revisit risk using revisits within 7 days as the outcome variable.
All analyses were completed using STATA/IC 13 (StataCorp, College Station, TX).
Results
There were 24 685 treatment episodes for children diagnosed with pharyngitis. Nearly 47% of these episodes included GAS testing and 47% of the tested patients filled an antibiotic prescription. Similarly, 53% of patients were not tested and 49% of untested patients filled an antibiotic prescription. As a result, the 4 groups identified for analysis were evenly distributed: untested and no prescription (26.9%), untested and prescription (26.3%), tested and prescription (21.9%), and tested and no prescription (24.9%) (Figure).
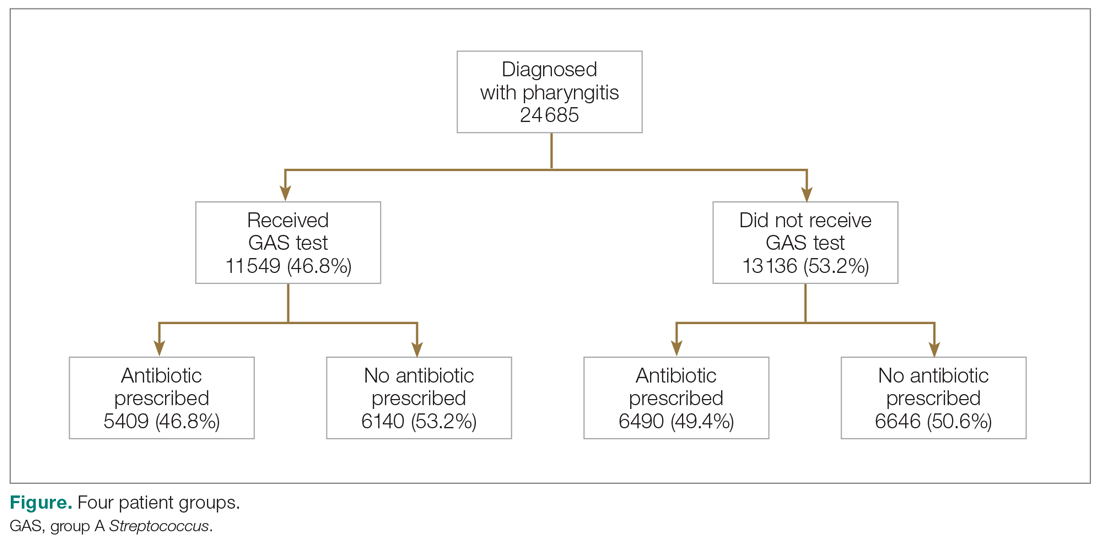
Table 1 presents the descriptive statistics for these 4 patient groups. Note first that the rate of revisits within 28 days is under 5% across all groups. Second, the 2 tested groups have a lower revisit rate than the untested groups: the tested and treated have a revisit rate of 3.3%, and the tested and untreated have a revisit rate of 2.4%, while both the untested groups have a revisit rate of nearly 5%. These small absolute differences in revisit rates across groups were statistically significant.
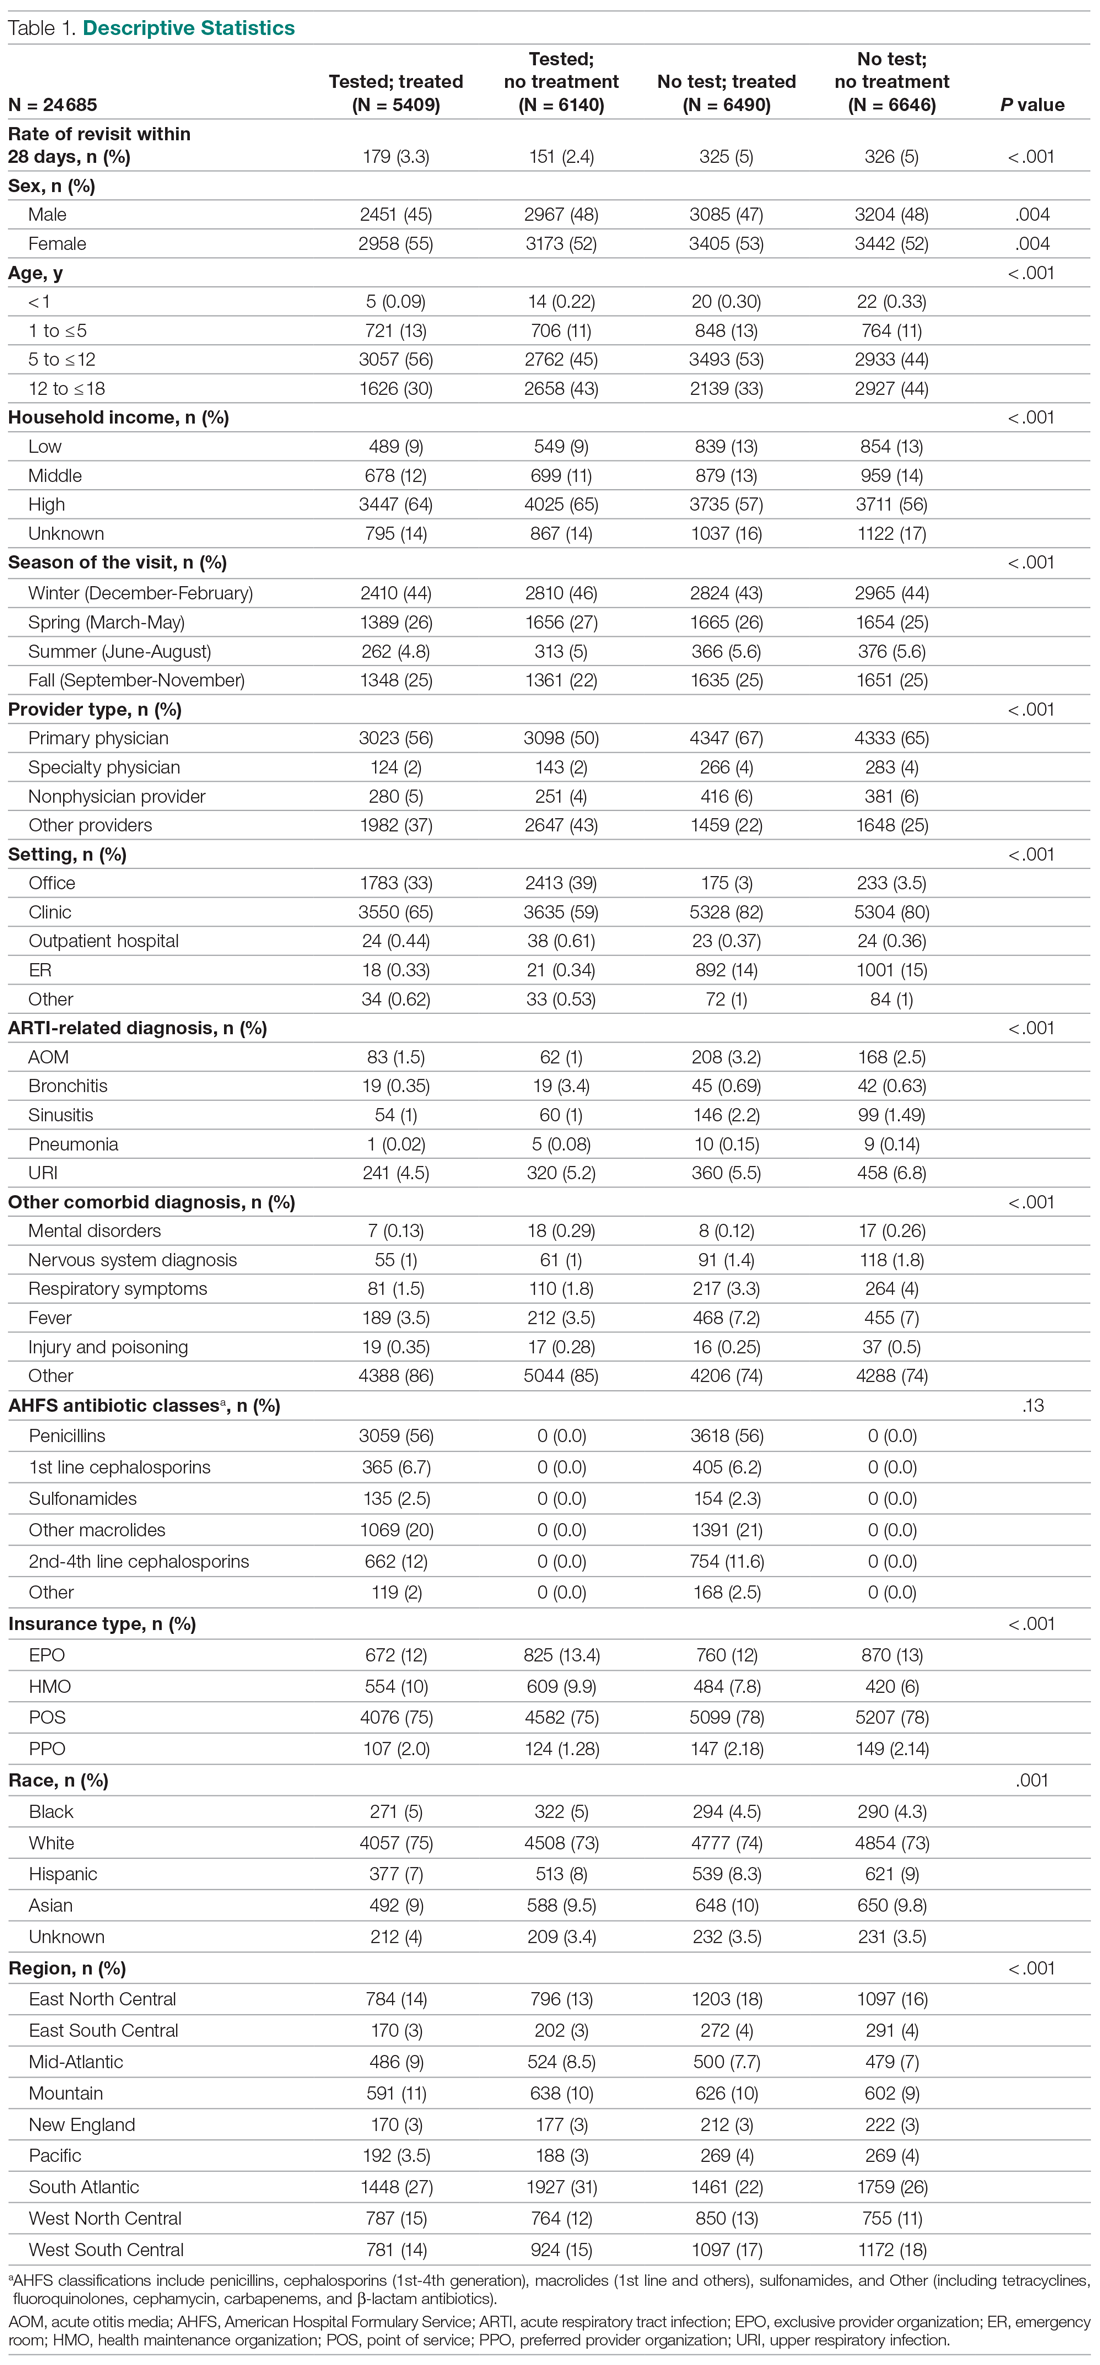
Factors associated with receiving GAS test
Several factors were found to impact the decision to test (Table 2). Only 9.7% of children were reported to have any ARTI coinfection. As expected, these comorbidities resulted in a significantly lower likelihood of receiving the GAS test: AOM, bronchitis, sinusitis, pneumonia, and URI as comorbid infections had a 48%, 41%, 37%, 63%, and 13% lower likelihood of receiving the GAS test, respectively, than those with no comorbidities. Similarly, children with fever and respiratory symptoms were 35% and 45% less likely to receiving the GAS test, respectively. This is consistent with our expectation that comorbid ARTI infections will lead many providers to forgo testing.
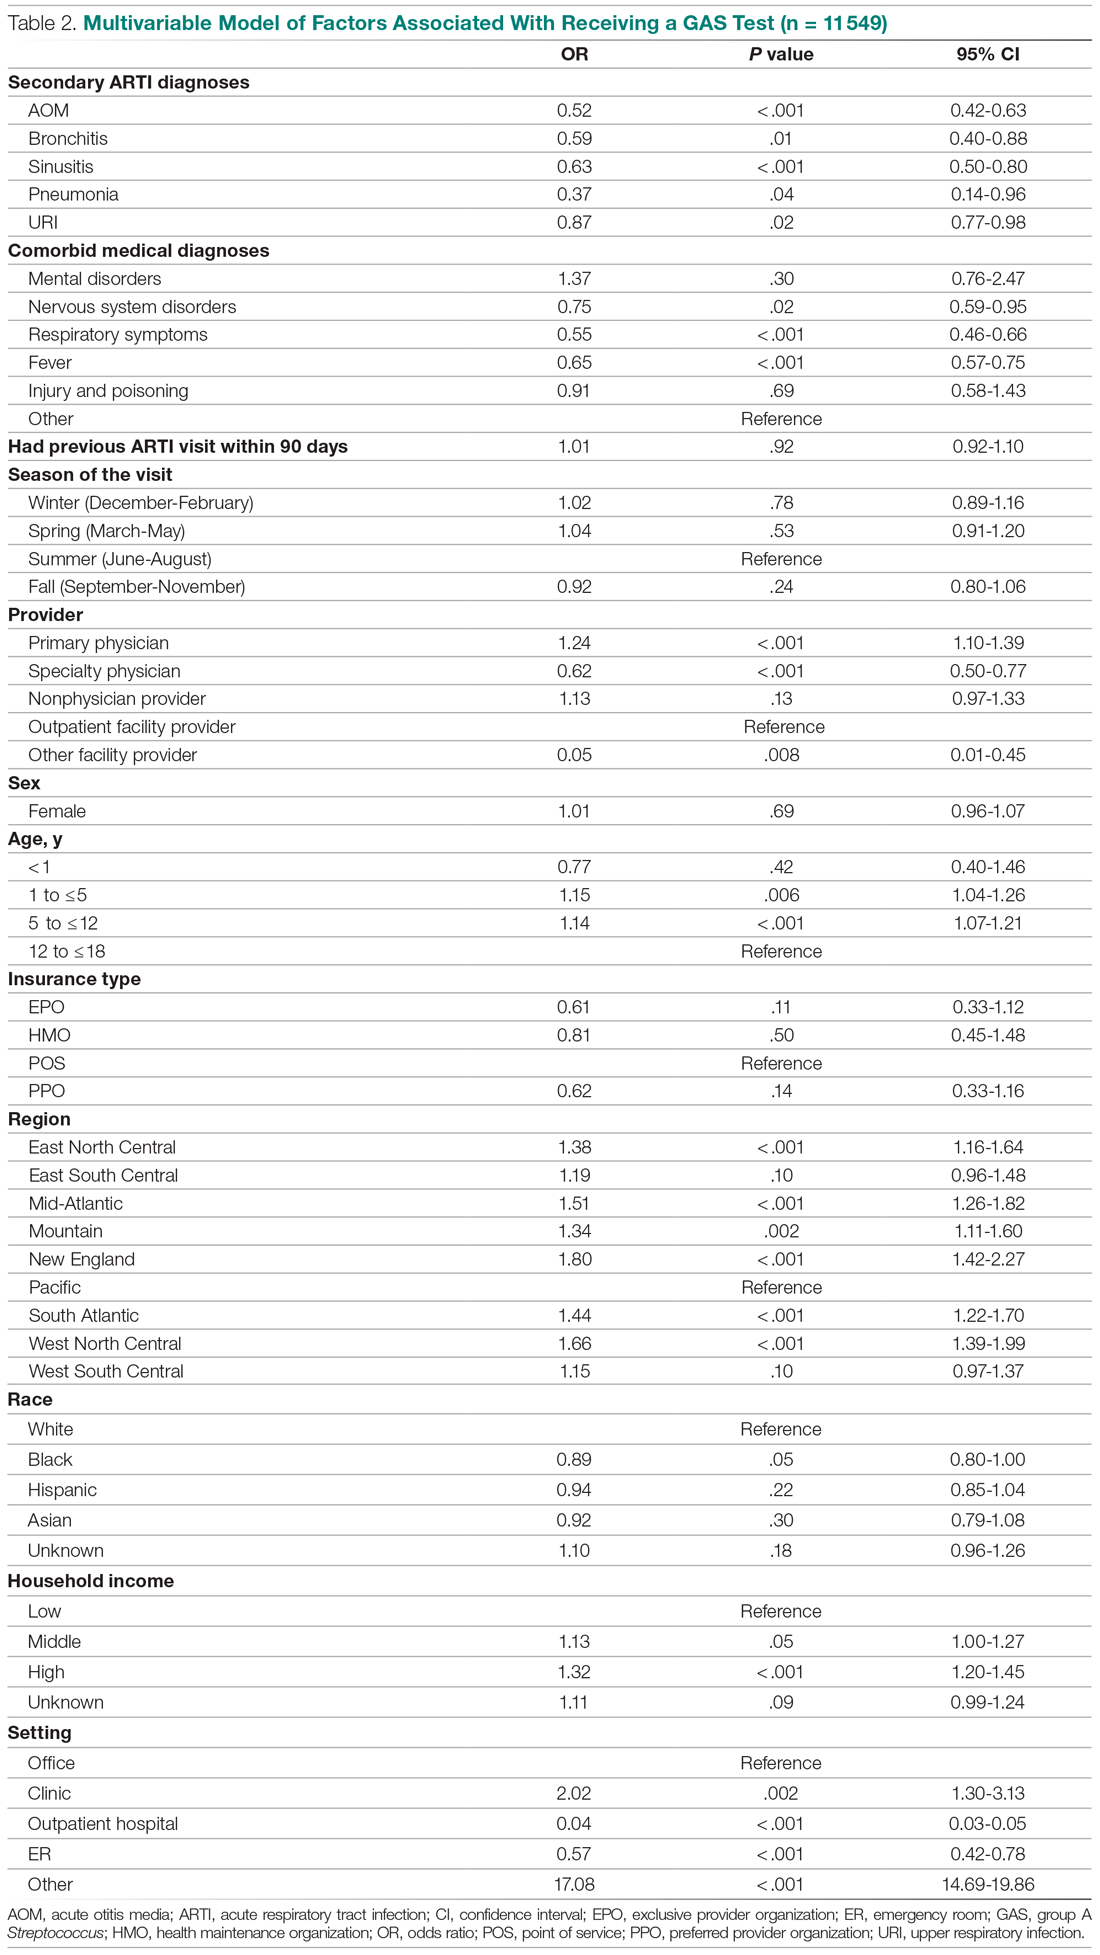
Provider type and patient age also plays a role in receipt of the GAS test. Relative to outpatient facility providers, primary care physicians were 24% more likely and specialty physicians were 38% less likely of employing the GAS test. The child’s age played a significant role in receipt of the GAS test. Children aged 1 to 5 years and 5 to 12 years were 15% and 14% more likely to receive the test compared to children older than 12 years.
Pharyngitis patients have disproportionately higher odds of receiving a GAS test in most regions of the country compared to the Pacific region. For instance, children in the Mid-Atlantic region have 51% higher odds of receiving a GAS test while children in New England have 80% higher odds of receiving the same test.
Black children have 11% lower odds of receiving the GAS test compared to White children. Both middle-income and high-income children have 12% and 32% higher odds of receiving the test compared to low-income children. Compared to office-based visits, children visiting a clinic were twice as likely to receive a GAS test while those seen in the emergency room have 43% lower odds of receiving a GAS test. Hospital outpatient departments, which account for less than 1% of all visits, rarely used a GAS test which could be a statistical artifact due to small sample size. Lastly, insurance and season of the year had no significant impact of receipt of a GAS test.
Factors associated with receiving antibiotic prescription
Surprisingly, receiving the GAS test has a small but insignificant impact on the likelihood that the patient will receive an antibiotic prescription (Table 3) (Adjusted OR = 1.055, P = .07). After controlling for receipt of a GAS test, children with AOM and sinusitis comorbidities have an increased likelihood of being prescribed an antibiotic. Children with URI have a lower likelihood of being prescribed an antibiotic. Additionally, relative to primary care physicians, children visiting nonphysician providers for pharyngitis were more likely to be prescribed an antibiotic.
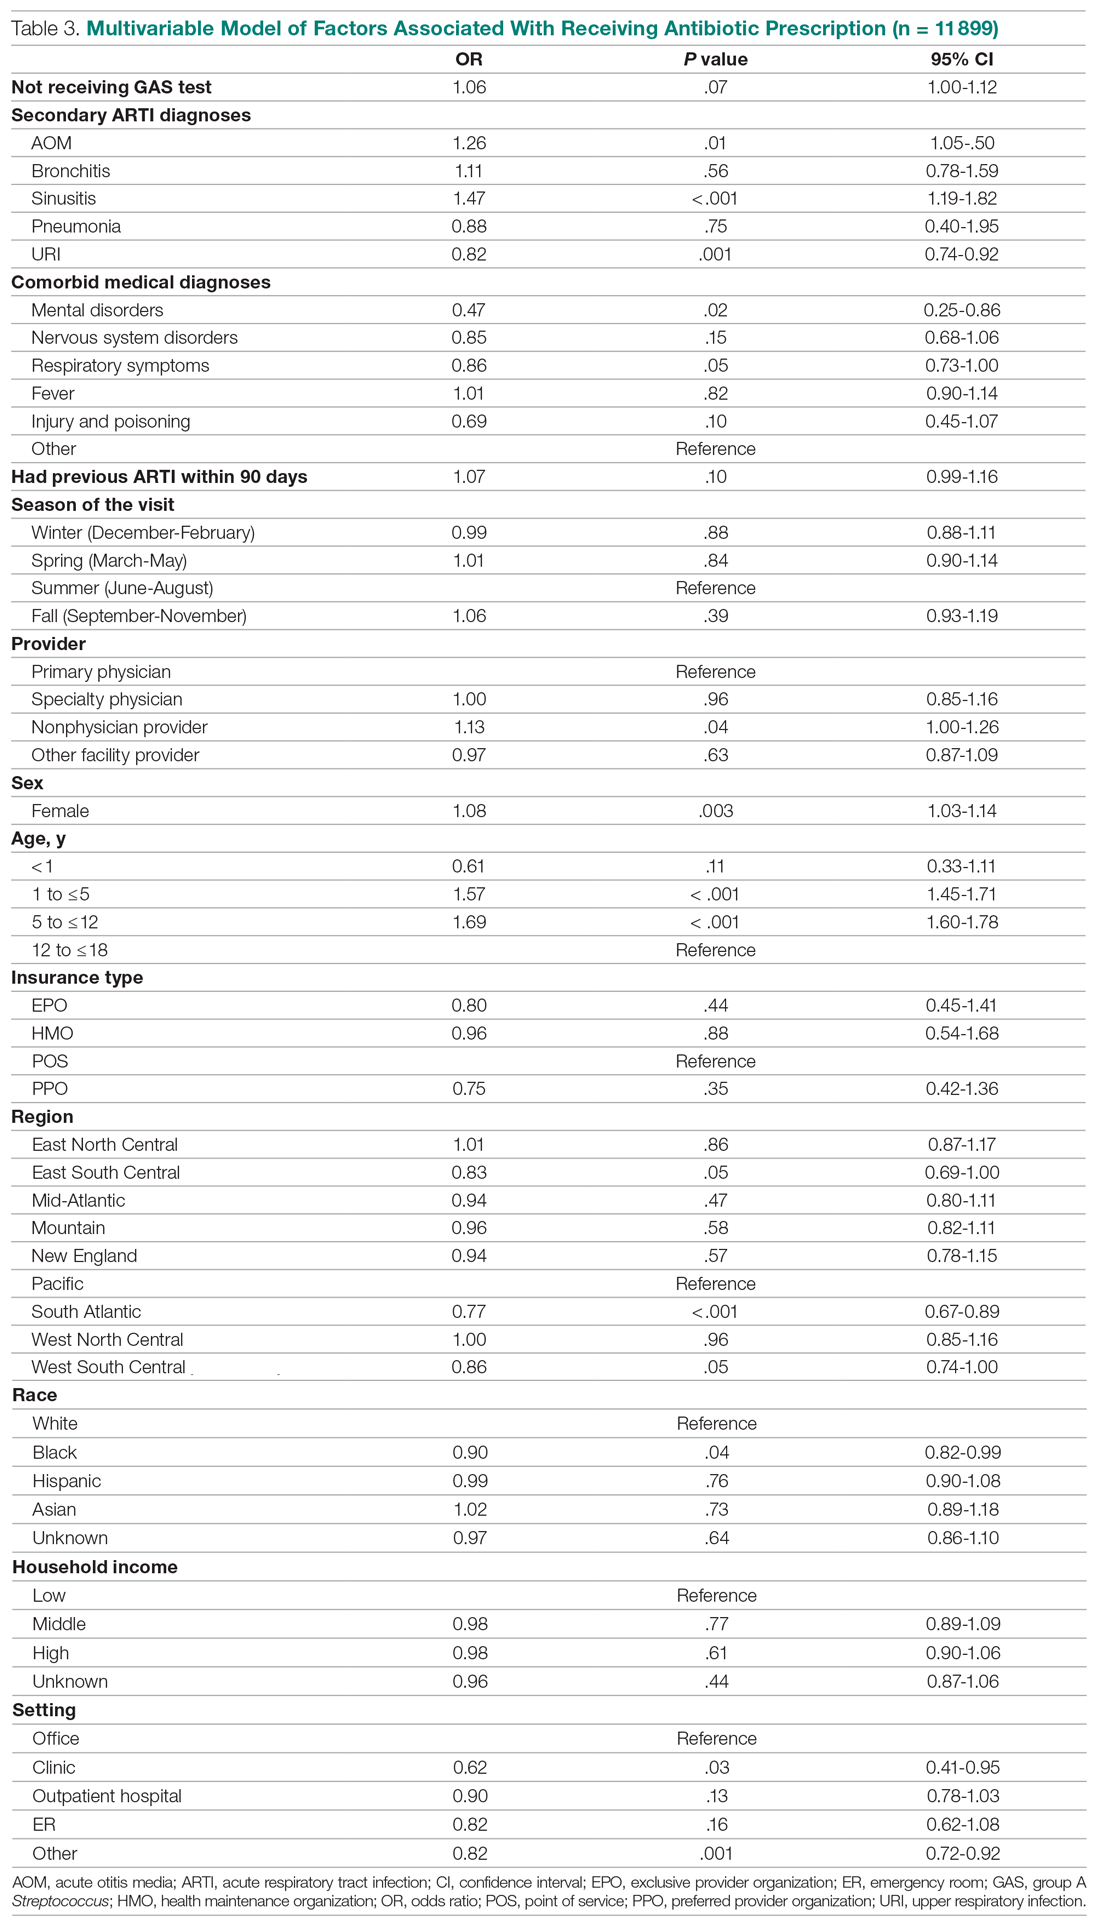
Children under 12 years of age were more likely to use an antibiotic compared to children 12 years and older. Geographically, there is some evidence of regional variation in antibiotic use as well. Children in the south Atlantic, west-south central, and southeast central regions had a significantly lower odds of being prescribed an antibiotic respectively than pharyngitis patients in the Pacific region. Black children had a 10% lower likelihood of being prescribed an antibiotic compared to White children, possibly related to their lower rate of GAS testing. Compared to office-based visits, children visiting a clinic were less likely to use an antibiotic. Household income, insurance type, and season had no significant impact on revisit risk.
Effects of GAS test and antibiotic prescriptions on likelihood of revisits
The multivariate analysis of the risk of a revisit within 28 days is presented in Table 4. Children with pharyngitis who tested and did not receive an antibiotic serve as the reference comparison group for this analysis to illustrate the impact of using the GAS test and treatment with an antibiotic. The results in Table 4 are quite clear: patients who receive the GAS test were significantly less likely to have a revisit within 28 days. Moreover, within the group of patients who were tested, those not receiving an antibiotic, presumedly because their GAS test was negative, experienced the lowest risk of a revisit. This result is consistent with the data in Table 1. Moreover, using an antibiotic had no impact on the likelihood of a revisit in patients not receiving the GAS test. This result is also consistent with Table 1.
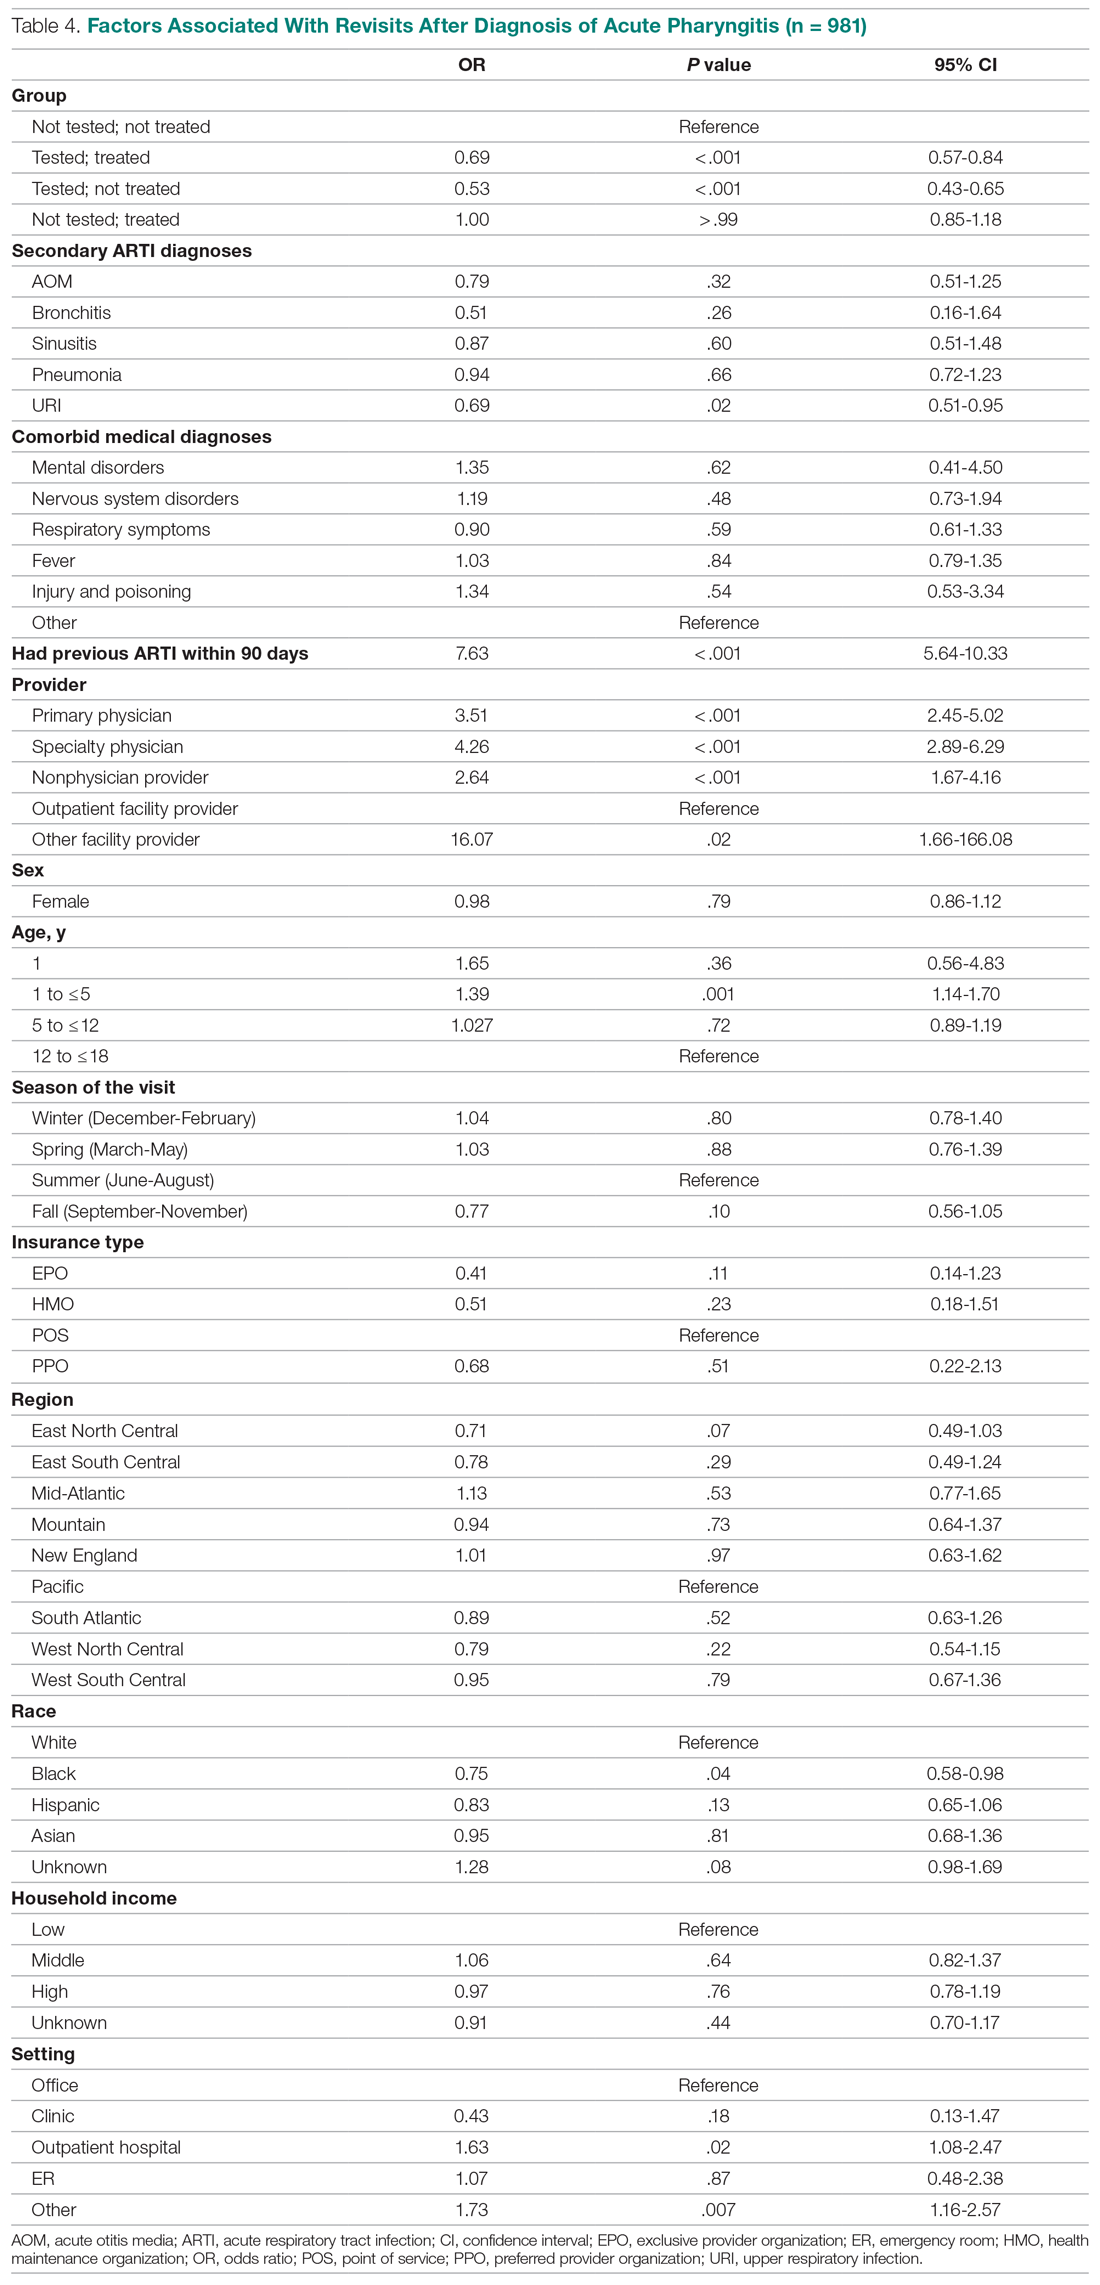
Other results from the analysis of revisit risk may be of interest to clinicians. Pharyngitis patients with a prior episode of treatment within 90 days for an acute respiratory tract infection were more than 7 times more likely to experience a revisit within 28 days of the pharyngitis diagnosis than patients without a history of recent ARTI infections. Age is also a risk factor in likelihood of initiating a revisit. Children under 1 year and children aged 1 to 5 years were more likely to have a revisit than children aged more than 12 years. Compared to White children, Black children were 25% (P = .04) less likely to have a revisit. The care setting also has a significant impact on revisit risk. Children visiting outpatient hospital and other care settings had a significantly higher revisit risk than those visiting a physician’s office. Lastly, household income, geographic region, season, medical comorbidities, gender, and insurance type have no significant impact on revisit risk.
Sensitivity analysis
The results from the analysis of 7-day and 28-day revisit risk are summarized in Table 5. These results indicate that patients who were tested had a more significant decrease in revisit risk at 7 days (72%) than was evident at 28 days (47% reduction). Receiving an antibiotic, with or without the test, had no impact on revisit risk.
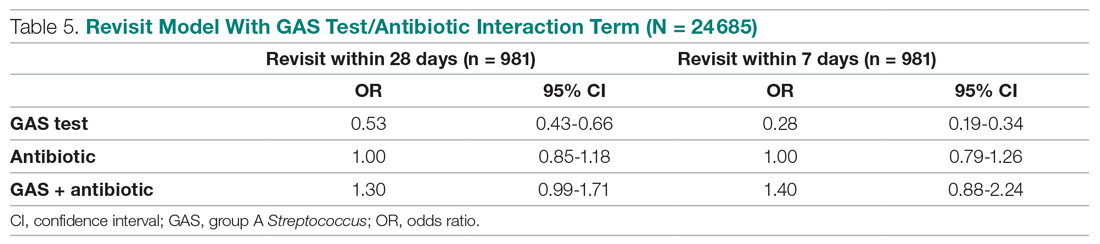
Discussion
Published data on revisits for pharyngitis are lacking with the concentration of prior research focused more on systemic complications of undertreated GABHS disease or on identifying carrier status. Our study results suggest that GAS testing is the most important factor in reducing revisit risk. Being prescribed an antibiotic, on its own, does not have a significant impact on the risk of a revisit. However, once the GAS test is used, the decision not to use an antibiotic was correlated with the lowest revisit rate, likely because the source of the pharyngitis infection was viral and more likely to resolve without a revisit. Prior studies have reported variable rates of testing among children with pharyngitis prescribed an antibiotic, ranging from 23% to 91%,14,15 with testing important toward more appropriate antibiotic use.16 More recently, among more than 67 000 patients aged 3 to 21 years presenting with sore throat and receiving a GAS test, 32.6% were positive.17
Our analysis found that more than 46% of pediatric pharyngitis patients were given the rapid GAS test. While this testing rate is substantially lower than HEDIS recommendations and lower than testing rates achieved by several health maintenance organizations,10 it is similar to the 53% of children receiving such testing in a recent National Ambulatory Medical Care Survey.18 Furthermore, we found that when antibiotics are prescribed following a GAS test, the revisit risk is not significantly reduced, possibly because antibiotics lower revisit risk when informed by diagnostic testing tools that determine the infectious organism. This is supported by a similar population analysis in which we observed reduced revisit rates in children with AOM managed with antibiotics within 3 days of index diagnosis.19
Several other factors also affect the likelihood of a child receiving the GAS test. Children aged 1 to 12 years were significantly more likely to receive the GAS test than children over the age of 12. This included children in the 1 to 5 years old bracket who had a 15% higher likelihood of undergoing a GAS test, despite children less than 3 years of age as not recommended targets for GAS testing.20 As expected, children with reported ARTI-associated comorbidities were also less likely to receive a GAS test. Additionally, specialty care physicians were less inclined to implement the GAS test, possibly because of diagnostic confidence without testing or referral after GAS was ruled out. Black and low-income children had statistically lower odds of receiving the test, even after controlling for other factors, and yet were less likely to consume a revisit. As the overall data suggested more revisits in those not tested, further study is needed to examine if race or income discrepancies are equity based. Finally, children in the Pacific region, compared to the rest of the nation, were the least likely to receive a GAS test and yet there were no significant differences in revisit rates by region. Regional differences in antibiotic use were also observed in our study, as has been seen by others.21
After statistically controlling for having received the diagnostic GAS test and filled a prescription for an antibiotic, there are multitude of factors that independently affect the revisit risk, the most important of which if which was a history of an ARTI infection in the prior 90 days. While prior visit history had no impact on the likelihood of being tested or filling an antibiotic, patients with prior visits were more than 7 times more likely to consume a revisit. This was not reflected in nor related to comorbid ARTIs as these patients did not have statistically higher revisits than those with pharyngitis as the sole-coded diagnosis. Moreover, speculation for bacterial etiology of primary or superinfection based on a recent history of ARTI accounting for revisits seems unlikely as it did not yield greater antibiotic use in that group. Further analysis is required to determine the clinical and behavioral factors that promote for prior ARTI history as a major factor in revisit risk after an index visit for pharyngitis.
Children aged between 1 and 5 years, though 15% more likely to be tested than those aged 12 through 17 years, were also 39% more likely to initiate a revisit compared to older children when statistically controlling for other covariates. This perhaps suggests longer illness, wrong diagnosis, delay in appropriate treatment, or more caution by parents and providers in this age group. Justification for testing children less than 3 years of age who are outside of the HEDIS suggested age group, when clinical judgement does not point to another infection source, can result in positivity rates between 22% and 30% as previously observed.22,23 Patients visiting nonphysician providers and outpatient facility providers were less likely to have a revisit than those visiting primary and specialty care physicians, though slightly higher propensity for antibiotic prescriptions was seen for nonphysician providers. Pediatricians have been noted to be less likely to prescribe antibiotics without GAS testing than nonpediatric providers, and more guidelines-compliant in prescribing.24
Recommendations to not test children under 3 years of age are based on the lack of acute rheumatic fever and other complications in this age group together with more frequent viral syndromes. Selectivity in applying clinical criteria to testing can be attempted to separate bacterial from viral illness. Postnasal drainage/rhinorrhea, hoarse voice, and cough have been used successfully to identify those with viral illness and less need for testing, with greater certainty of low risk for GABHS in those over 11 years of age without tonsillar exudates, cervical adenopathy, or fever.17 However, the marginal benefits of those who have all 3 features of viral illness versus none in identifying GAS positivity was 23.3% vs 37.6% - helpful, but certainly not diminishing the need for testing. These constitutional findings of viral URI also do not exclude the GAS carrier state that features these symptoms.25 Others have reinforced the doubt of pharyngeal exudates as the premier diagnostic finding for test-positive GAS.26
This study had several limitations. The Optum claims dataset only contains ICD-9 codes for diagnoses. It does not include data on infection severity and clinical findings related to symptoms, thus empiric treatment warranted based in clinical severity is not assessed. Antibiotics are commonly available as generics and very inexpensive. Patients may fill and pay for these prescriptions directly, in which case, a claim for payment may not be filed with Optum. This could result in an undercount of treated patients in our study.
There is no corresponding problem of missing medical claims for GAS testing which were obtained from the CPT codes within the Optum claims data set. However, we elected not to verify the test results due to these data being missing for 75% of the study population. Nevertheless, this study’s focus was less about justifying antibiotic treatment, but dealt with the outcomes generated by testing and treatment. Toward that end, we used CPT codes to identify a revisit, and while those can at times be affected by financial reimbursement incentives, differences related to revisits in the 4 patient groups should not be subject to bias.
Conclusion
This study used data from real world practices to document the patterns of GAS testing and antibiotic use in pediatric pharyngitis patients. Revisit rates were under 5% for all patient groups and the use of rapid diagnostic tools were found to be the determining factor in further reducing the risk of revisits. This supports the need for compliance with the HEDIS quality metric for pharyngitis to the recommended levels of rapid testing which have been falling in recent years. Use of more accurate antigen and newer molecular detection testing methods may help further delineate important factors in determining pediatric pharyngitis treatment and need for revisits.27
Corresponding author: Jeffrey McCombs, MD, University of Southern California School of Pharmacy, Department of Pharmaceutical and Health Economics, Leonard D. Schaeffer Center for Health Policy & Economics, 635 Downey Way, Verna & Peter Dauterive Hall 310, Los Angeles, CA 90089-3333; [email protected].
Financial disclosures: None.
1. Choby BA. Diagnosis and treatment of streptococcal pharyngitis. Am Fam Physician. 2009;79(5):383-390.
2. Briel M, Schuetz P, Mueller B, et al. Procalcitonin-guided antibiotic use vs a standard approach for acute respiratory tract infections in primary care. Arch of Intern Med. 2008;168(18):2000-2008. doi: 10.1001/archinte.168.18.2000
3. Maltezou HC, Tsagris V, Antoniadou A, et al. Evaluation of a rapid antigen detection test in the diagnosis of streptococcal pharyngitis in children and its impact on antibiotic prescription. J Antimicrob Chemother. 2008;62(6):1407-1412. doi: 10.1093/jac/dkn376
4. Neuner JM, Hamel MB, Phillips RS, et al. Diagnosis and management of adults with pharyngitis: a cost-effectiveness analysis. Ann Intern Med. 2003;139(2):113-122. doi:10.7326/0003-4819-139-2-200307150-00011
5. Gerber MA, Baltimore RS, Eaton CB, et al. Prevention of rheumatic fever and diagnosis and treatment of acute Streptococcal pharyngitis: a scientific statement from the American Heart Association Rheumatic Fever, Endocarditis, and Kawasaki Disease Committee of the Council on Cardiovascular Disease in the Young, the Interdisciplinary Council on Functional Genomics and Translational Biology, and the Interdisciplinary Council on Quality of Care and Outcomes Research: endorsed by the American Academy of Pediatrics. Circulation. 2009;119(11):1541-1551. doi: 10.1161/CIRCULATIONAHA.109.191959
6. Gieseker KE, Roe MH, MacKenzie T, Todd JK. Evaluating the American Academy of Pediatrics diagnostic standard for Streptococcus pyogenes pharyngitis: backup culture versus repeat rapid antigen testing. Pediatrics. 2003;111(6):e666-e670. doi: 10.1542/peds.111.6.e666
7. Shapiro DJ, Lindgren CE, Neuman MI, Fine AM. Viral features and testing for Streptococcal pharyngitis. Pediatrics. 2017;139(5):e20163403. doi: 10.1542/peds.2016-3403
8. Shulman ST, Bisno AL, Clegg H, et al. Clinical practice guideline for the diagnosis and management of group A Streptococcal pharyngitis: 2012 update by the Infectious Diseases Society of America. Clin Infect Dis. 2012;55(10):e86–e102. doi: 10.1093/cid/cis629
9. Mangione-Smith R, McGlynn EA, Elliott MN, et al. Parent expectations for antibiotics, physician-parent communication, and satisfaction. Arch Pediatr Adolesc Med. 2001;155(7):800–806. doi: 10.1001/archpedi.155.7.800
10. Appropriate Testing for Children with Pharyngitis. HEDIS Measures and Technical Resources. National Committee for Quality Assurance. Accessed February 12, 2021. https://www.ncqa.org/hedis/measures/appropriate-testing-for-children-with-pharyngitis/
11. Linder JA, Bates DW, Lee GM, Finkelstein JA. Antibiotic treatment of children with sore throat. JAMA. 2005;294(18):2315-2322. doi: 10.1001/jama.294.18.2315
12. Crimmel BL. Health Insurance Coverage and Income Levels for the US Noninstitutionalized Population Under Age 65, 2001. Medical Expenditure Panel Survey, Agency for Healthcare Research and Quality. 2004. https://meps.ahrq.gov/data_files/publications/st40/stat40.pd
13. AHFS/ASHP. American Hospital Formulary Service Drug Information. 2012. AHFS drug information. 00--. Accessed January 4, 2021.
14. Mainous AG 3rd, Zoorob, RJ, Kohrs FP, Hagen MD. Streptococcal diagnostic testing and antibiotics prescribed for pediatric tonsillopharyngitis. Pediatr Infect Dis J. 1996;15(9):806-810. doi: 10.1097/00006454-199609000-00014
15. Benin AL, Vitkauskas G, Thornquist E, et al. Improving diagnostic testing and reducing overuse of antibiotics for children with pharyngitis: a useful role for the electronic medical record. Pediatr Infect Dis J. 2003;22(12):1043-1047. doi: 10.1097/01.inf.0000100577.76542.af
16. Luo R, Sickler J, Vahidnia F, et al. Diagnosis and Management of Group a Streptococcal Pharyngitis in the United States, 2011-2015. BMC Infect Dis. 2019;19(1):193-201. doi: 10.1186/s12879-019-3835-4
17. Shapiro DJ, Barak-Corren Y, Neuman MI, et al. Identifying Patients at Lowest Risk for Streptococcal Pharyngitis: A National Validation Study. J Pediatr. 2020;220:132-138.e2. doi: 10.1016/j.jpeds.2020.01.030. Epub 2020 Feb 14
18. Shapiro DJ, King LM, Fleming-Dutra KE, et al. Association between use of diagnostic tests and antibiotic prescribing for pharyngitis in the United States. Infect Control Hosp Epidemiol. 2020;41(4):479-481. doi: 10.1017/ice.2020.29
19. Sangha K, Steinberg I, McCombs JS. The impact of antibiotic treatment time and class of antibiotic for acute otitis media infections on the risk of revisits. Abs PDG4. Value in Health. 2019; 22:S163.
20. Ahluwalia T, Jain S, Norton L, Meade J, et al. Reducing Streptococcal Testing in Patients < 3 Years Old in an Emergency Department. Pediatrics. 2019;144(4):e20190174. doi: 10.1542/peds.2019-0174
21. McKay R, Mah A, Law MR, et al. Systematic Review of Factors Associated with Antibiotic Prescribing for Respiratory Tract Infections. Antimicrob Agents Chemother. 2016;60(7):4106-4118. doi: 10.1128/AAC.00209-16
22. Woods WA, Carter CT, Schlager TA. Detection of group A streptococci in children under 3 years of age with pharyngitis. Pediatr Emerg Care. 1999;15(5):338-340. doi: 10.1097/00006565-199910000-00011
23. Mendes N, Miguéis C, Lindo J, et al. Retrospective study of group A Streptococcus oropharyngeal infection diagnosis using a rapid antigenic detection test in a paediatric population from the central region of Portugal. Eur J Clin Microbiol Infect Dis. 2021;40(6):1235-1243. doi: 10.1007/s10096-021-04157-x
24. Frost HM, McLean HQ, Chow BDW. Variability in Antibiotic Prescribing for Upper Respiratory Illnesses by Provider Specialty. J Pediatr. 2018;203:76-85.e8. doi: 10.1016/j.jpeds.2018.07.044.
25. Rick AM, Zaheer HA, Martin JM. Clinical Features of Group A Streptococcus in Children With Pharyngitis: Carriers versus Acute Infection. Pediatr Infect Dis J. 2020;39(6):483-488. doi: 10.1097/INF.0000000000002602
26. Nadeau NL, Fine AM, Kimia A. Improving the prediction of streptococcal pharyngitis; time to move past exudate alone [published online ahead of print, 2020 Aug 16]. Am J Emerg Med. 2020;S0735-6757(20)30709-9. doi: 10.1016/j.ajem.2020.08.023
27. Mustafa Z, Ghaffari M. Diagnostic Methods, Clinical Guidelines, and Antibiotic Treatment for Group A Streptococcal Pharyngitis: A Narrative Review. Front Cell Infect Microbiol. 2020;10:563627. doi: 10.3389/fcimb.2020.563627
From the Department of Pharmaceutical and Health Economics, University of Southern California, Los Angeles, CA, (Drs. Sangha and McCombs), Department of Pediatrics, Keck School of Medicine, and Department of Clinical Pharmacy, School of Pharmacy, University of Southern California, Los Angeles, CA, (Dr. Steinberg), and Leonard Schaeffer Center for Health Policy and Economics, University of Southern California, Los Angeles, CA (Dr. McCombs).
Objective: The recommended treatment for children and adolescents under 18 years of age who have a positive test for group A Streptococcus (GAS) are antibiotics using the “test and treat” strategy to detect and treat GAS for pediatric pharyngitis. This study used paid claims data to document the extent to which real-world treatment patterns are consistent with these recommendations. We document the factors correlated with testing and treatment, then examine the effects of receiving a GAS test and being treated with an antibiotic impact the likelihood of a revisit for an acute respiratory tract infection within 28 days.
Methods: This retrospective cohort study used Optum Insight Clinformatics data for medical and pharmacy claims from 2011-2013 to identify episodes of care for children and adolescents with pharyngitis around their index visit (± 6 months). The sample population included children and adolescents under 18 years of age with a diagnosis of pharyngitis. Multivariable logistic regression analyses were used to document factors associated with receipt of GAS test and antibiotic treatment. Next, we used logistic regression models to estimate the impact of test and treat recommendation on revisit risk.
Results: There were 24 685 treatment episodes for children and adolescents diagnosed with pharyngitis. Nearly 47% of these episodes included a GAS test and 48% of tested patients were prescribed an antibiotic prescription. Failing to perform a GAS test increased the risk of a revisit within 28 days by 44%. The use of antibiotics by tested and untested patients had no impact on revisit risk.
Conclusion: While the judicious use of antibiotics is important in managing pharyngitis infections and managing complications, the use of rapid diagnostic tools was found to be the determining factor in reducing revisits for pediatric patients with pharyngitis.
Keywords: pediatrics; pharyngitis; respiratory infections; acute infections; diagnostic tests; group A Streptococcus; antibiotics; revisits.
Acute pharyngitis is a common acute respiratory tract infection (ARTI) in children. Group A β-hemolytic streptococci (GABHS) is the most common bacterial etiology for pediatric pharyngitis, accounting for 15% to 30% of cases.1
Beyond clinical assessment, laboratory diagnostic testing generally plays a limited role in guiding appropriate antibiotic prescribing for patients with an ARTI.2,3 Most diagnostic tests require 2 or 3 days to result, incur additional costs, and may delay treatment.4 While these tests do not provide clear and timely guidance on which specific antibiotic is appropriate for ARTI patients, this is not the case for patients with pharyngitis.5,6,7 A rapid diagnostic test exists to identify pharyngitis patients with GABHS which accounts for 1 in 4 children with acute sore throat.1,4,6 Both the American Academy of Pediatrics and the Infectious Diseases Society of America recommend antibiotic treatment for children and adolescents under 18 years of age who have a positive test for group A Streptococcus (GAS).8,9 This “test and treat” protocol has been consistently included in the Healthcare Effectiveness Data and Information Set (HEDIS) standards over time for pediatric pharyngitis patients aged 3 to 18 years before dispensing an antibiotic.10
Sinusitis, pneumonia, and acute otitis media are considered ARTIs where antibiotic treatment is justified. Therefore, pharyngitis of unclear etiology seen with these comorbid infections may not always undergo GAS testing but move directly to the patient being prescribed antibiotics. This analysis enumerates ARTI-related comorbidities present together with the initial coded pharyngitis diagnosis to evaluate their impact on the provider’s decision to test and treat, and on revisit risk.
Antibiotic treatment for GAS patients is likely to eradicate the acute GABHS infection within 10 days. Penicillin and amoxicillin are commonly recommended because of their narrow spectrum of activity, few adverse effects, established efficacy, and modest cost. Alternative antibiotics for patients with penicillin allergy, or with polymicrobial infection seen on culture results, include a first-generation cephalosporin, clindamycin, clarithromycin (Biaxin), or azithromycin (Zithromax).1,8,11 However, while compliance with these HEDIS guidelines has been evaluated, the outcome effects of following the HEDIS “test and treat” recommendations for children with pharyngitis have not been adequately evaluated.
These outcome evaluations have increasing importance as the latest HEDIS survey has shown testing rates in commercial Preferred Provider Organizations (PPO) falling from 86.4% in 2018 to 75.9% in 2019, the lowest rate of testing since 2009, with similar reductions under 80% for Health Maintenance Organizations (HMO).10 While health plans may execute cost-benefit analyses and algorithms to forge best practices for GAS testing in children and adolescents presenting with symptoms of pharyngitis, it is important to regard the wasteful resource utilization and additional cost of revisits that may offset any gains accrued by more focused GAS testing outside the existing clinical guidelines and HEDIS measures. This may be of particular importance in documenting infection and sparing antibiotic therapy in toddlers and younger.
The objective of this study was to investigate the correlation between testing and antibiotic use on the likelihood of a revisit for an acute respiratory tract infection within 28 days. To achieve this objective, this investigation consists of 3 sequential analyses. First, we document the factors associated with the decision to test the patient for a GABHS infection using the GAS test. Next, we document the factors associated with the decision to use an antibiotic to treat the patient as a function of having tested the patient. Finally, we investigate the impact of the testing and treatment decisions on the likelihood of a revisit within 28 days.
Methods
Study design
This was a retrospective cohort study of episodes of treatment for pediatric patients with pharyngitis. Episodes were identified using data derived from the Optum Insight Clinformatics claims database provided to the University of Southern California to facilitate the training of graduate students. These data cover commercially insured patients with both medical and pharmacy benefits. Data were retrieved from the 3-year period spanning 2011-2013. An episode of care was identified based on date of the first (index) outpatient visit for a pharyngitis diagnosis (International Classification of Diseases, Ninth Revision [ICD-9]: 462, 463, 034.0). Outpatient visits were defined by visit setting: ambulatory clinics, physician offices, emergency rooms, and urgent care facilities. Each pharyngitis treatment episode was then screened for at least a 6-month enrollment in a health insurance plan prior and subsequent to the index visit using Optum enrollment data. Finally, eligible treatment episodes were restricted to children and adolescents under 18 years of age, who had an index outpatient visit for a primary diagnosis of acute pharyngitis.
A diagnostic profile was created for each episode using the diagnoses recorded for the index visit. Up to 3 diagnoses may be recorded for any outpatient visit and the first recorded diagnosis was assumed to be the primary diagnosis for that episode. Any secondary diagnoses recorded on the index visit were used to define comorbidities present at the index visit. ARTI-related comorbidities included: acute otitis media (AOM), bronchitis, sinusitis, pneumonia, and upper respiratory infection (URI). Other comorbid medical diagnoses were documented using diagnostic data from the pre-index period. Dichotomous variables for the following categories were created: mental disorders, nervous system disorders, respiratory symptoms, fever, injury and poisoning, other, or no diseases.
Prior visits for other respiratory infections in the previous 90 days were also identified for patients based on their index visit for pharyngitis. Similarly, any subsequent visits, within 28 days of the index visit, were also recorded to measure the health outcome for analysis. Practice settings include physician offices and federally qualified health centers, state and local health clinics, outpatient hospitals facilities, emergency departments, and other outpatient settings such as walk-in retail health clinic or ambulatory centers. Providers include primary care physicians (family practice, pediatricians, internal medicine), specialty care physicians (emergency medicine, preventive medicine), nonphysician providers (nurse practitioners, physician assistants) and other providers (urgent care, acute outpatient care, ambulatory care centers). Seasons of the year were determined based on the index date of the episode to account for possible seasonality in pharyngitis treatment. Lastly, a previous visits variable was created to identify whether the child had nonpharyngitis ARTI visits in the 3 months prior to the index visit.
Demographic variables were created based on enrollment and the socioeconomic data available in the Optum socioeconomic status file. These variables include patient age, race, sex, household income, geographic location, practice setting type, provider specialty, and type of insurance. An estimate of patient household income was based on algorithms using census block groups. Income categories were informed by the federal guidelines for a family of 4. A low-income family was defined as earning less than $50 000; a middle-income family earned between $50 000 and $75 000, and a high-income family earned $75 000 and above.12 Patient insurance type was categorized as HMO, Exclusive Provider Organization (EPO), Point of Service (POS), and PPO. Race was identified as White, Black, Hispanic, and Asian. Patient location was defined according to national census regions.
Outcomes
GAS test
The HEDIS measures for pharyngitis recommend using the GAS test to identify the bacterial etiology of the pharyngitis infection. Patients who received the test were identified based on Current Procedural Terminology (CPT) codes 87070-71, 87081, 87430, 87650-52, and 87880.10
Antibiotic treatment
The pharmacy administrative claims dataset was used to identify study patients who filled a prescription for an antibiotic during their pharyngitis treatment episode. Optum pharmacy data identify the medications received, specifies the date of prescription filling, National Drug Codes, and American Hospital Formulary Service (AHFS) Classification System codes for each medication. We used the AHFS Pharmacologic-Therapeutic classification of antibiotics to create dichotomous variables documenting the antibacterial used by each patient.13 These are categorized under antibacterial including penicillins, cephalosporins (first, second, third, fourth generation cephalosporins), macrolides (first generation and others), tetracyclines, sulfonamides, fluoroquinolones (ciprofloxacin, levofloxacin, moxifloxacin), cephamycin, carbapenems, and β-lactam antibiotics (amoxicillin, amoxicillin/clavulanate, cephalexin, cefuroxime, cefdinir).
Revisits to physician or other provider
Revisits within 28 days were used as the measure of patient outcomes related to testing and filling of an antibiotic prescription for acute pharyngitis. Revisits may also be due to a patient returning for a follow-up, alternative treatment, worsening pharyngitis, or for another ARTI. An ARTI-related revisit also increases total resources used to treat pediatric pharyngitis patients.
Statistical analysis
Logistic regression was used for all 3 analyses conducted in this study. First, we determined the patient and treating physician characteristics that impact the decision to use GAS testing for pharyngitis. Second, we identified those factors that impact the decision to use antibiotic prescriptions among children who were diagnosed with pharyngitis adding in the dichotomous variable indicating if the patient had received a GAS test. Third, we used a logit regression analysis to document if receiving a GAS test and/or an antibiotic impacted the likelihood of a revisit by comparing revisit risk. To estimate the effect of testing and/or antibiotic use, we divided patients into 4 groups based on whether the patient received a GAS test and/or an antibiotic prescription. This specification of the analysis of revisits as an outcome focuses on adherence to HEDIS “test and treat” guidelines10:
- Patients who were not tested yet filled an antibiotic prescription. This decision was likely based on the clinician’s judgment of the patient’s signs and symptoms, and confirmational testing not performed.
- Patients who were not tested and did not fill an antibiotic prescription. Apparently, in the clinician’s judgment the patient’s signs and symptoms were such that the infection did not warrant treatment and the clinical presentation did not necessitate the GAS test to confirm the recorded diagnosis of pharyngitis.
- Patients who were tested and received antibiotic prescription, likely because the test was positive for GABHS.
- Patients who were tested and did not receive antibiotic prescription.
We tested for statistically significant differences in baseline characteristics across these 4 patient groups using t tests for continuous variables and χ2 tests for categorical variables. Odds ratios (OR) and CI were computed for the influential variables included the regression analyses.
We conducted a sensitivity analysis using a model specification which included the dichotomous variables for testing and for treatment, and the interaction term between these variables to assess if treatment effects varied in tested and untested patients. We also estimated this model of revisit risk using revisits within 7 days as the outcome variable.
All analyses were completed using STATA/IC 13 (StataCorp, College Station, TX).
Results
There were 24 685 treatment episodes for children diagnosed with pharyngitis. Nearly 47% of these episodes included GAS testing and 47% of the tested patients filled an antibiotic prescription. Similarly, 53% of patients were not tested and 49% of untested patients filled an antibiotic prescription. As a result, the 4 groups identified for analysis were evenly distributed: untested and no prescription (26.9%), untested and prescription (26.3%), tested and prescription (21.9%), and tested and no prescription (24.9%) (Figure).
Table 1 presents the descriptive statistics for these 4 patient groups. Note first that the rate of revisits within 28 days is under 5% across all groups. Second, the 2 tested groups have a lower revisit rate than the untested groups: the tested and treated have a revisit rate of 3.3%, and the tested and untreated have a revisit rate of 2.4%, while both the untested groups have a revisit rate of nearly 5%. These small absolute differences in revisit rates across groups were statistically significant.
Factors associated with receiving GAS test
Several factors were found to impact the decision to test (Table 2). Only 9.7% of children were reported to have any ARTI coinfection. As expected, these comorbidities resulted in a significantly lower likelihood of receiving the GAS test: AOM, bronchitis, sinusitis, pneumonia, and URI as comorbid infections had a 48%, 41%, 37%, 63%, and 13% lower likelihood of receiving the GAS test, respectively, than those with no comorbidities. Similarly, children with fever and respiratory symptoms were 35% and 45% less likely to receiving the GAS test, respectively. This is consistent with our expectation that comorbid ARTI infections will lead many providers to forgo testing.
Provider type and patient age also plays a role in receipt of the GAS test. Relative to outpatient facility providers, primary care physicians were 24% more likely and specialty physicians were 38% less likely of employing the GAS test. The child’s age played a significant role in receipt of the GAS test. Children aged 1 to 5 years and 5 to 12 years were 15% and 14% more likely to receive the test compared to children older than 12 years.
Pharyngitis patients have disproportionately higher odds of receiving a GAS test in most regions of the country compared to the Pacific region. For instance, children in the Mid-Atlantic region have 51% higher odds of receiving a GAS test while children in New England have 80% higher odds of receiving the same test.
Black children have 11% lower odds of receiving the GAS test compared to White children. Both middle-income and high-income children have 12% and 32% higher odds of receiving the test compared to low-income children. Compared to office-based visits, children visiting a clinic were twice as likely to receive a GAS test while those seen in the emergency room have 43% lower odds of receiving a GAS test. Hospital outpatient departments, which account for less than 1% of all visits, rarely used a GAS test which could be a statistical artifact due to small sample size. Lastly, insurance and season of the year had no significant impact of receipt of a GAS test.
Factors associated with receiving antibiotic prescription
Surprisingly, receiving the GAS test has a small but insignificant impact on the likelihood that the patient will receive an antibiotic prescription (Table 3) (Adjusted OR = 1.055, P = .07). After controlling for receipt of a GAS test, children with AOM and sinusitis comorbidities have an increased likelihood of being prescribed an antibiotic. Children with URI have a lower likelihood of being prescribed an antibiotic. Additionally, relative to primary care physicians, children visiting nonphysician providers for pharyngitis were more likely to be prescribed an antibiotic.
Children under 12 years of age were more likely to use an antibiotic compared to children 12 years and older. Geographically, there is some evidence of regional variation in antibiotic use as well. Children in the south Atlantic, west-south central, and southeast central regions had a significantly lower odds of being prescribed an antibiotic respectively than pharyngitis patients in the Pacific region. Black children had a 10% lower likelihood of being prescribed an antibiotic compared to White children, possibly related to their lower rate of GAS testing. Compared to office-based visits, children visiting a clinic were less likely to use an antibiotic. Household income, insurance type, and season had no significant impact on revisit risk.
Effects of GAS test and antibiotic prescriptions on likelihood of revisits
The multivariate analysis of the risk of a revisit within 28 days is presented in Table 4. Children with pharyngitis who tested and did not receive an antibiotic serve as the reference comparison group for this analysis to illustrate the impact of using the GAS test and treatment with an antibiotic. The results in Table 4 are quite clear: patients who receive the GAS test were significantly less likely to have a revisit within 28 days. Moreover, within the group of patients who were tested, those not receiving an antibiotic, presumedly because their GAS test was negative, experienced the lowest risk of a revisit. This result is consistent with the data in Table 1. Moreover, using an antibiotic had no impact on the likelihood of a revisit in patients not receiving the GAS test. This result is also consistent with Table 1.
Other results from the analysis of revisit risk may be of interest to clinicians. Pharyngitis patients with a prior episode of treatment within 90 days for an acute respiratory tract infection were more than 7 times more likely to experience a revisit within 28 days of the pharyngitis diagnosis than patients without a history of recent ARTI infections. Age is also a risk factor in likelihood of initiating a revisit. Children under 1 year and children aged 1 to 5 years were more likely to have a revisit than children aged more than 12 years. Compared to White children, Black children were 25% (P = .04) less likely to have a revisit. The care setting also has a significant impact on revisit risk. Children visiting outpatient hospital and other care settings had a significantly higher revisit risk than those visiting a physician’s office. Lastly, household income, geographic region, season, medical comorbidities, gender, and insurance type have no significant impact on revisit risk.
Sensitivity analysis
The results from the analysis of 7-day and 28-day revisit risk are summarized in Table 5. These results indicate that patients who were tested had a more significant decrease in revisit risk at 7 days (72%) than was evident at 28 days (47% reduction). Receiving an antibiotic, with or without the test, had no impact on revisit risk.
Discussion
Published data on revisits for pharyngitis are lacking with the concentration of prior research focused more on systemic complications of undertreated GABHS disease or on identifying carrier status. Our study results suggest that GAS testing is the most important factor in reducing revisit risk. Being prescribed an antibiotic, on its own, does not have a significant impact on the risk of a revisit. However, once the GAS test is used, the decision not to use an antibiotic was correlated with the lowest revisit rate, likely because the source of the pharyngitis infection was viral and more likely to resolve without a revisit. Prior studies have reported variable rates of testing among children with pharyngitis prescribed an antibiotic, ranging from 23% to 91%,14,15 with testing important toward more appropriate antibiotic use.16 More recently, among more than 67 000 patients aged 3 to 21 years presenting with sore throat and receiving a GAS test, 32.6% were positive.17
Our analysis found that more than 46% of pediatric pharyngitis patients were given the rapid GAS test. While this testing rate is substantially lower than HEDIS recommendations and lower than testing rates achieved by several health maintenance organizations,10 it is similar to the 53% of children receiving such testing in a recent National Ambulatory Medical Care Survey.18 Furthermore, we found that when antibiotics are prescribed following a GAS test, the revisit risk is not significantly reduced, possibly because antibiotics lower revisit risk when informed by diagnostic testing tools that determine the infectious organism. This is supported by a similar population analysis in which we observed reduced revisit rates in children with AOM managed with antibiotics within 3 days of index diagnosis.19
Several other factors also affect the likelihood of a child receiving the GAS test. Children aged 1 to 12 years were significantly more likely to receive the GAS test than children over the age of 12. This included children in the 1 to 5 years old bracket who had a 15% higher likelihood of undergoing a GAS test, despite children less than 3 years of age as not recommended targets for GAS testing.20 As expected, children with reported ARTI-associated comorbidities were also less likely to receive a GAS test. Additionally, specialty care physicians were less inclined to implement the GAS test, possibly because of diagnostic confidence without testing or referral after GAS was ruled out. Black and low-income children had statistically lower odds of receiving the test, even after controlling for other factors, and yet were less likely to consume a revisit. As the overall data suggested more revisits in those not tested, further study is needed to examine if race or income discrepancies are equity based. Finally, children in the Pacific region, compared to the rest of the nation, were the least likely to receive a GAS test and yet there were no significant differences in revisit rates by region. Regional differences in antibiotic use were also observed in our study, as has been seen by others.21
After statistically controlling for having received the diagnostic GAS test and filled a prescription for an antibiotic, there are multitude of factors that independently affect the revisit risk, the most important of which if which was a history of an ARTI infection in the prior 90 days. While prior visit history had no impact on the likelihood of being tested or filling an antibiotic, patients with prior visits were more than 7 times more likely to consume a revisit. This was not reflected in nor related to comorbid ARTIs as these patients did not have statistically higher revisits than those with pharyngitis as the sole-coded diagnosis. Moreover, speculation for bacterial etiology of primary or superinfection based on a recent history of ARTI accounting for revisits seems unlikely as it did not yield greater antibiotic use in that group. Further analysis is required to determine the clinical and behavioral factors that promote for prior ARTI history as a major factor in revisit risk after an index visit for pharyngitis.
Children aged between 1 and 5 years, though 15% more likely to be tested than those aged 12 through 17 years, were also 39% more likely to initiate a revisit compared to older children when statistically controlling for other covariates. This perhaps suggests longer illness, wrong diagnosis, delay in appropriate treatment, or more caution by parents and providers in this age group. Justification for testing children less than 3 years of age who are outside of the HEDIS suggested age group, when clinical judgement does not point to another infection source, can result in positivity rates between 22% and 30% as previously observed.22,23 Patients visiting nonphysician providers and outpatient facility providers were less likely to have a revisit than those visiting primary and specialty care physicians, though slightly higher propensity for antibiotic prescriptions was seen for nonphysician providers. Pediatricians have been noted to be less likely to prescribe antibiotics without GAS testing than nonpediatric providers, and more guidelines-compliant in prescribing.24
Recommendations to not test children under 3 years of age are based on the lack of acute rheumatic fever and other complications in this age group together with more frequent viral syndromes. Selectivity in applying clinical criteria to testing can be attempted to separate bacterial from viral illness. Postnasal drainage/rhinorrhea, hoarse voice, and cough have been used successfully to identify those with viral illness and less need for testing, with greater certainty of low risk for GABHS in those over 11 years of age without tonsillar exudates, cervical adenopathy, or fever.17 However, the marginal benefits of those who have all 3 features of viral illness versus none in identifying GAS positivity was 23.3% vs 37.6% - helpful, but certainly not diminishing the need for testing. These constitutional findings of viral URI also do not exclude the GAS carrier state that features these symptoms.25 Others have reinforced the doubt of pharyngeal exudates as the premier diagnostic finding for test-positive GAS.26
This study had several limitations. The Optum claims dataset only contains ICD-9 codes for diagnoses. It does not include data on infection severity and clinical findings related to symptoms, thus empiric treatment warranted based in clinical severity is not assessed. Antibiotics are commonly available as generics and very inexpensive. Patients may fill and pay for these prescriptions directly, in which case, a claim for payment may not be filed with Optum. This could result in an undercount of treated patients in our study.
There is no corresponding problem of missing medical claims for GAS testing which were obtained from the CPT codes within the Optum claims data set. However, we elected not to verify the test results due to these data being missing for 75% of the study population. Nevertheless, this study’s focus was less about justifying antibiotic treatment, but dealt with the outcomes generated by testing and treatment. Toward that end, we used CPT codes to identify a revisit, and while those can at times be affected by financial reimbursement incentives, differences related to revisits in the 4 patient groups should not be subject to bias.
Conclusion
This study used data from real world practices to document the patterns of GAS testing and antibiotic use in pediatric pharyngitis patients. Revisit rates were under 5% for all patient groups and the use of rapid diagnostic tools were found to be the determining factor in further reducing the risk of revisits. This supports the need for compliance with the HEDIS quality metric for pharyngitis to the recommended levels of rapid testing which have been falling in recent years. Use of more accurate antigen and newer molecular detection testing methods may help further delineate important factors in determining pediatric pharyngitis treatment and need for revisits.27
Corresponding author: Jeffrey McCombs, MD, University of Southern California School of Pharmacy, Department of Pharmaceutical and Health Economics, Leonard D. Schaeffer Center for Health Policy & Economics, 635 Downey Way, Verna & Peter Dauterive Hall 310, Los Angeles, CA 90089-3333; [email protected].
Financial disclosures: None.
1. Choby BA. Diagnosis and treatment of streptococcal pharyngitis. Am Fam Physician. 2009;79(5):383-390.
2. Briel M, Schuetz P, Mueller B, et al. Procalcitonin-guided antibiotic use vs a standard approach for acute respiratory tract infections in primary care. Arch of Intern Med. 2008;168(18):2000-2008. doi: 10.1001/archinte.168.18.2000
3. Maltezou HC, Tsagris V, Antoniadou A, et al. Evaluation of a rapid antigen detection test in the diagnosis of streptococcal pharyngitis in children and its impact on antibiotic prescription. J Antimicrob Chemother. 2008;62(6):1407-1412. doi: 10.1093/jac/dkn376
4. Neuner JM, Hamel MB, Phillips RS, et al. Diagnosis and management of adults with pharyngitis: a cost-effectiveness analysis. Ann Intern Med. 2003;139(2):113-122. doi:10.7326/0003-4819-139-2-200307150-00011
5. Gerber MA, Baltimore RS, Eaton CB, et al. Prevention of rheumatic fever and diagnosis and treatment of acute Streptococcal pharyngitis: a scientific statement from the American Heart Association Rheumatic Fever, Endocarditis, and Kawasaki Disease Committee of the Council on Cardiovascular Disease in the Young, the Interdisciplinary Council on Functional Genomics and Translational Biology, and the Interdisciplinary Council on Quality of Care and Outcomes Research: endorsed by the American Academy of Pediatrics. Circulation. 2009;119(11):1541-1551. doi: 10.1161/CIRCULATIONAHA.109.191959
6. Gieseker KE, Roe MH, MacKenzie T, Todd JK. Evaluating the American Academy of Pediatrics diagnostic standard for Streptococcus pyogenes pharyngitis: backup culture versus repeat rapid antigen testing. Pediatrics. 2003;111(6):e666-e670. doi: 10.1542/peds.111.6.e666
7. Shapiro DJ, Lindgren CE, Neuman MI, Fine AM. Viral features and testing for Streptococcal pharyngitis. Pediatrics. 2017;139(5):e20163403. doi: 10.1542/peds.2016-3403
8. Shulman ST, Bisno AL, Clegg H, et al. Clinical practice guideline for the diagnosis and management of group A Streptococcal pharyngitis: 2012 update by the Infectious Diseases Society of America. Clin Infect Dis. 2012;55(10):e86–e102. doi: 10.1093/cid/cis629
9. Mangione-Smith R, McGlynn EA, Elliott MN, et al. Parent expectations for antibiotics, physician-parent communication, and satisfaction. Arch Pediatr Adolesc Med. 2001;155(7):800–806. doi: 10.1001/archpedi.155.7.800
10. Appropriate Testing for Children with Pharyngitis. HEDIS Measures and Technical Resources. National Committee for Quality Assurance. Accessed February 12, 2021. https://www.ncqa.org/hedis/measures/appropriate-testing-for-children-with-pharyngitis/
11. Linder JA, Bates DW, Lee GM, Finkelstein JA. Antibiotic treatment of children with sore throat. JAMA. 2005;294(18):2315-2322. doi: 10.1001/jama.294.18.2315
12. Crimmel BL. Health Insurance Coverage and Income Levels for the US Noninstitutionalized Population Under Age 65, 2001. Medical Expenditure Panel Survey, Agency for Healthcare Research and Quality. 2004. https://meps.ahrq.gov/data_files/publications/st40/stat40.pd
13. AHFS/ASHP. American Hospital Formulary Service Drug Information. 2012. AHFS drug information. 00--. Accessed January 4, 2021.
14. Mainous AG 3rd, Zoorob, RJ, Kohrs FP, Hagen MD. Streptococcal diagnostic testing and antibiotics prescribed for pediatric tonsillopharyngitis. Pediatr Infect Dis J. 1996;15(9):806-810. doi: 10.1097/00006454-199609000-00014
15. Benin AL, Vitkauskas G, Thornquist E, et al. Improving diagnostic testing and reducing overuse of antibiotics for children with pharyngitis: a useful role for the electronic medical record. Pediatr Infect Dis J. 2003;22(12):1043-1047. doi: 10.1097/01.inf.0000100577.76542.af
16. Luo R, Sickler J, Vahidnia F, et al. Diagnosis and Management of Group a Streptococcal Pharyngitis in the United States, 2011-2015. BMC Infect Dis. 2019;19(1):193-201. doi: 10.1186/s12879-019-3835-4
17. Shapiro DJ, Barak-Corren Y, Neuman MI, et al. Identifying Patients at Lowest Risk for Streptococcal Pharyngitis: A National Validation Study. J Pediatr. 2020;220:132-138.e2. doi: 10.1016/j.jpeds.2020.01.030. Epub 2020 Feb 14
18. Shapiro DJ, King LM, Fleming-Dutra KE, et al. Association between use of diagnostic tests and antibiotic prescribing for pharyngitis in the United States. Infect Control Hosp Epidemiol. 2020;41(4):479-481. doi: 10.1017/ice.2020.29
19. Sangha K, Steinberg I, McCombs JS. The impact of antibiotic treatment time and class of antibiotic for acute otitis media infections on the risk of revisits. Abs PDG4. Value in Health. 2019; 22:S163.
20. Ahluwalia T, Jain S, Norton L, Meade J, et al. Reducing Streptococcal Testing in Patients < 3 Years Old in an Emergency Department. Pediatrics. 2019;144(4):e20190174. doi: 10.1542/peds.2019-0174
21. McKay R, Mah A, Law MR, et al. Systematic Review of Factors Associated with Antibiotic Prescribing for Respiratory Tract Infections. Antimicrob Agents Chemother. 2016;60(7):4106-4118. doi: 10.1128/AAC.00209-16
22. Woods WA, Carter CT, Schlager TA. Detection of group A streptococci in children under 3 years of age with pharyngitis. Pediatr Emerg Care. 1999;15(5):338-340. doi: 10.1097/00006565-199910000-00011
23. Mendes N, Miguéis C, Lindo J, et al. Retrospective study of group A Streptococcus oropharyngeal infection diagnosis using a rapid antigenic detection test in a paediatric population from the central region of Portugal. Eur J Clin Microbiol Infect Dis. 2021;40(6):1235-1243. doi: 10.1007/s10096-021-04157-x
24. Frost HM, McLean HQ, Chow BDW. Variability in Antibiotic Prescribing for Upper Respiratory Illnesses by Provider Specialty. J Pediatr. 2018;203:76-85.e8. doi: 10.1016/j.jpeds.2018.07.044.
25. Rick AM, Zaheer HA, Martin JM. Clinical Features of Group A Streptococcus in Children With Pharyngitis: Carriers versus Acute Infection. Pediatr Infect Dis J. 2020;39(6):483-488. doi: 10.1097/INF.0000000000002602
26. Nadeau NL, Fine AM, Kimia A. Improving the prediction of streptococcal pharyngitis; time to move past exudate alone [published online ahead of print, 2020 Aug 16]. Am J Emerg Med. 2020;S0735-6757(20)30709-9. doi: 10.1016/j.ajem.2020.08.023
27. Mustafa Z, Ghaffari M. Diagnostic Methods, Clinical Guidelines, and Antibiotic Treatment for Group A Streptococcal Pharyngitis: A Narrative Review. Front Cell Infect Microbiol. 2020;10:563627. doi: 10.3389/fcimb.2020.563627