User login
School antibullying programs may have substantial population impact
School antibullying programs may have small effect sizes but a valuable population impact, according to research published in JAMA Pediatrics.
.
The investigators estimated population effect numbers for the interventions, such as the number of students needed to participate in an antibullying program to prevent one case of bullying.
Assuming a bullying prevalence of 15%, “an average antibullying intervention needs to include 207 people to prevent 1 case of bullying perpetration or 140 people to prevent 1 case of bullying exposure,” reported David Fraguas, MD, PhD, of the Institute of Psychiatry and Mental Health at Hospital Clínico San Carlos in Madrid, and colleagues. To improve mental health, the average antibullying program needs to include 107 people, the results indicate.
Few trials assessed the same antibullying program, so the researchers examined antibullying programs as a whole. Still, “not all antibullying programs are efficacious,” and “effectiveness may vary in different settings,” they noted.
Public health implications
Schools frequently implement programs to address bullying, which research suggests is a prevalent, modifiable risk factor for mental health disorders and therefore a “major public health concern,” the authors said. Studies have suggested that antibullying programs may be effective, though the evidence has been unclear.
“I see teens with mental health issues frequently in my practice, and often during their assessment, these patients and parents disclose a history of bullying at school or online,” said Kelly A. Curran, MD, associate professor of pediatrics at the University of Oklahoma, Oklahoma City. “The impact of bullying on these teens is obvious – from the mental health issues to school absenteeism and dropouts to long-term health consequences. Often, parents ask for guidance on how to ‘make it stop’ or for help working with the teen’s school. It’s hard in these cases as a clinician to know what to recommend – while it’s clear that the bullying is contributing to the teen’s health issues, giving evidenced-based guidance on bullying has been difficult.”

Dr. Curran had been “somewhat skeptical” of the effectiveness of antibullying curricula.
“I was pleasantly surprised to see that there is a significant population impact for interventions to prevent traditional bullying (207 people educated to prevent 1 case) and cyberbullying (167 people educated to prevent 1 case),” Dr. Curran said. “Additionally, these interventions do not have to be lengthy in duration – and may have long-term effectiveness. While there are limitations to this study, I feel more comfortable recommending and advocating for antibullying campaigns in schools.”
Relative to control groups
To assess the population impact of antibullying interventions, Dr. Fraguas and collaborators conducted random-effects meta-analyses. They identified 69 trials that included 56,511 participants in intervention groups and 55,148 in control groups. Five of the trials tested interventions targeting cyberbullying.
Participants ranged in age from 4 to 17 years, and the weighted average age was 11 years. The durations of the interventions ranged from 1 week to more than 2 years, with an average duration of 29.4 weeks.
“Antibullying interventions showed statistically significant effectiveness compared with control groups on all assessed bullying-related outcomes after the intervention,” the researchers reported. “The effect sizes were mostly statistically significant and small ... with high statistical heterogeneity and risk of publication bias. Antibullying interventions also showed statistically significant effectiveness in improving mental health problems (e.g., anxiety and depression) at study endpoint, with small effect size.”
Consistent with prior research, results varied by region. For example, interventions in Europe, where 31 of the trials were conducted, significantly decreased bullying exposure and attitudes that encourage bullying, whereas interventions in North America, where 19 of the trials were conducted, did not. In addition, European trials found greater effect sizes for the outcome measure of increasing attitudes that discourage bullying, compared with North American trials. The regional differences could reflect different programs or study designs, or differences in “social, educational, or cultural context,” the authors said.
‘Substantial’ impact
Together, the findings suggest that “universal antibullying interventions have a substantial population impact,” Dr. Fraguas and coauthors wrote. “To put these results into context, the [population impact number] is 35,450 for taking aspirin to avoid 1 death during the 6 months after a first nonhemorrhagic stroke, and the [population impact number] is 324 for human papillomavirus vaccination in girls to prevent cervical cancer.”
Furthermore, the interventions appear to be safe, they said. None of the trials in the meta-analysis reported an increase in bullying perpetration or bullying exposure at the end of the study or during follow-up, and mental health improved in all trials that assessed that outcome.
Pediatricians may be seen as resource
“From our survey work among parents all across Chicago, we know that almost one-half of all parents with children in school are concerned that their children get bullied,” said Matthew M. Davis, MD chair of the department of pediatrics at Ann & Robert H. Lurie Children’s Hospital of Chicago and professor of pediatrics, medicine, medical social sciences, and preventive medicine at Northwestern University in Chicago. “Among those parents, about one-half sought help from a teacher and about one-third asked a school administrator or school social worker for help. That means that schools are, by far, the go-to source for help when parents are worried about bullying.”

The survey of 1,642 parents in Chicago also found that 20% of parents with concerns sought help from mental health care providers, and 16% sought help from their pediatricians.
“Pediatricians can provide psychosocial support for their patients who are being bullied,” Dr. Davis said. “They can also talk with patients and their parents/guardians about how to team up with school personnel to address the bullying in the school environment.”
The meta-analysis was supported by grants from Instituto de Salud Carlos III (Spanish Ministry of Science and Innovation), cofinanced by the European Regional Development Fund from the European Commission. It also was supported by Madrid Regional Government, European Union programs, Fundación Familia Alonso, Fundación Alicia Koplowitz, and Fundación Mutua Madrileña.
Dr. Fraguas disclosed consulting for or receiving fees from Angelini, Eisai, IE4Lab, Janssen, Lundbeck, and Otsuka and grant support from Fundación Alicia Koplowitz and Instituto de Salud Carlos III. Coauthors disclosed financial ties to pharmaceutical companies, as well as government and foundation grants. Dr. Curran is a member of the Pediatric News editorial advisory board. Dr. Davis had no relevant disclosures.
School antibullying programs may have small effect sizes but a valuable population impact, according to research published in JAMA Pediatrics.
.
The investigators estimated population effect numbers for the interventions, such as the number of students needed to participate in an antibullying program to prevent one case of bullying.
Assuming a bullying prevalence of 15%, “an average antibullying intervention needs to include 207 people to prevent 1 case of bullying perpetration or 140 people to prevent 1 case of bullying exposure,” reported David Fraguas, MD, PhD, of the Institute of Psychiatry and Mental Health at Hospital Clínico San Carlos in Madrid, and colleagues. To improve mental health, the average antibullying program needs to include 107 people, the results indicate.
Few trials assessed the same antibullying program, so the researchers examined antibullying programs as a whole. Still, “not all antibullying programs are efficacious,” and “effectiveness may vary in different settings,” they noted.
Public health implications
Schools frequently implement programs to address bullying, which research suggests is a prevalent, modifiable risk factor for mental health disorders and therefore a “major public health concern,” the authors said. Studies have suggested that antibullying programs may be effective, though the evidence has been unclear.
“I see teens with mental health issues frequently in my practice, and often during their assessment, these patients and parents disclose a history of bullying at school or online,” said Kelly A. Curran, MD, associate professor of pediatrics at the University of Oklahoma, Oklahoma City. “The impact of bullying on these teens is obvious – from the mental health issues to school absenteeism and dropouts to long-term health consequences. Often, parents ask for guidance on how to ‘make it stop’ or for help working with the teen’s school. It’s hard in these cases as a clinician to know what to recommend – while it’s clear that the bullying is contributing to the teen’s health issues, giving evidenced-based guidance on bullying has been difficult.”
Dr. Curran had been “somewhat skeptical” of the effectiveness of antibullying curricula.
“I was pleasantly surprised to see that there is a significant population impact for interventions to prevent traditional bullying (207 people educated to prevent 1 case) and cyberbullying (167 people educated to prevent 1 case),” Dr. Curran said. “Additionally, these interventions do not have to be lengthy in duration – and may have long-term effectiveness. While there are limitations to this study, I feel more comfortable recommending and advocating for antibullying campaigns in schools.”
Relative to control groups
To assess the population impact of antibullying interventions, Dr. Fraguas and collaborators conducted random-effects meta-analyses. They identified 69 trials that included 56,511 participants in intervention groups and 55,148 in control groups. Five of the trials tested interventions targeting cyberbullying.
Participants ranged in age from 4 to 17 years, and the weighted average age was 11 years. The durations of the interventions ranged from 1 week to more than 2 years, with an average duration of 29.4 weeks.
“Antibullying interventions showed statistically significant effectiveness compared with control groups on all assessed bullying-related outcomes after the intervention,” the researchers reported. “The effect sizes were mostly statistically significant and small ... with high statistical heterogeneity and risk of publication bias. Antibullying interventions also showed statistically significant effectiveness in improving mental health problems (e.g., anxiety and depression) at study endpoint, with small effect size.”
Consistent with prior research, results varied by region. For example, interventions in Europe, where 31 of the trials were conducted, significantly decreased bullying exposure and attitudes that encourage bullying, whereas interventions in North America, where 19 of the trials were conducted, did not. In addition, European trials found greater effect sizes for the outcome measure of increasing attitudes that discourage bullying, compared with North American trials. The regional differences could reflect different programs or study designs, or differences in “social, educational, or cultural context,” the authors said.
‘Substantial’ impact
Together, the findings suggest that “universal antibullying interventions have a substantial population impact,” Dr. Fraguas and coauthors wrote. “To put these results into context, the [population impact number] is 35,450 for taking aspirin to avoid 1 death during the 6 months after a first nonhemorrhagic stroke, and the [population impact number] is 324 for human papillomavirus vaccination in girls to prevent cervical cancer.”
Furthermore, the interventions appear to be safe, they said. None of the trials in the meta-analysis reported an increase in bullying perpetration or bullying exposure at the end of the study or during follow-up, and mental health improved in all trials that assessed that outcome.
Pediatricians may be seen as resource
“From our survey work among parents all across Chicago, we know that almost one-half of all parents with children in school are concerned that their children get bullied,” said Matthew M. Davis, MD chair of the department of pediatrics at Ann & Robert H. Lurie Children’s Hospital of Chicago and professor of pediatrics, medicine, medical social sciences, and preventive medicine at Northwestern University in Chicago. “Among those parents, about one-half sought help from a teacher and about one-third asked a school administrator or school social worker for help. That means that schools are, by far, the go-to source for help when parents are worried about bullying.”
The survey of 1,642 parents in Chicago also found that 20% of parents with concerns sought help from mental health care providers, and 16% sought help from their pediatricians.
“Pediatricians can provide psychosocial support for their patients who are being bullied,” Dr. Davis said. “They can also talk with patients and their parents/guardians about how to team up with school personnel to address the bullying in the school environment.”
The meta-analysis was supported by grants from Instituto de Salud Carlos III (Spanish Ministry of Science and Innovation), cofinanced by the European Regional Development Fund from the European Commission. It also was supported by Madrid Regional Government, European Union programs, Fundación Familia Alonso, Fundación Alicia Koplowitz, and Fundación Mutua Madrileña.
Dr. Fraguas disclosed consulting for or receiving fees from Angelini, Eisai, IE4Lab, Janssen, Lundbeck, and Otsuka and grant support from Fundación Alicia Koplowitz and Instituto de Salud Carlos III. Coauthors disclosed financial ties to pharmaceutical companies, as well as government and foundation grants. Dr. Curran is a member of the Pediatric News editorial advisory board. Dr. Davis had no relevant disclosures.
FROM JAMA PEDIATRICS
No pain, if you’ve got game
ILLUSTRATIVE CASE
An 8-year-old girl with congenital heart disease (status: post repair) arrives at your clinic for a routine appointment. Since the age of 12 months, she has experienced significant anxiety during medical visits, especially with blood draws and injections. She enjoys playing video games on her new tablet computer. Her parents want to know what you can do to reduce her anxiety and pain during today’s scheduled blood draw. Should you recommend that she continue playing video games during the venipuncture?
Adequately managing pain while performing venipuncture in children can improve the quality of the experience, reduce children’s fear of going to the doctor, and increase efficiency in medical practice.2 Since pharmacologic pain-control methods may have adverse effects, distraction techniques—engaging the child in another activity during a procedure—are commonly used instead to help reduce a child’s pain. These techniques can be active or passive.
Studies have demonstrated that both active and passive distraction techniques reduce children’s pain during medical procedures, including venipuncture. Passive techniques, such as nurse coaching3 and watching cartoons,4 have been found to reduce distress and pain. Active distraction techniques, such as playing video games while undergoing a painful procedure (eg, dressing a wound), have been shown to be more effective than passive techniques.5,6
A Cochrane review and meta-analysis of distraction and hypnosis for needle-related pain and distress in children demonstrated reduced pain, but the quality of evidence was low and the review recommended improved methodological rigor and trial reporting.7 Another systematic review and analysis showed strong support for distraction for reducing pain; however, the quality of evidence was low and the researchers cited problems with characteristics of the distraction interventions, child age, and risk of bias in the studies.8
There has been a lack of RCTs comparing the effectiveness and superiority of active vs passive distraction techniques. The first high-quality RCT to directly compare 3 of the most common distraction techniques to a control group was recently conducted in a large training and research hospital in Turkey.1
STUDY SUMMARY
Pain and anxiety levels were lowest in actively distracted children
The RCT included 180 children ages 6 to 10 years randomly assigned to 1 of 3 intervention groups or a control group.1 Phlebotomy was performed while children watched a cartoon, played a video game, were distracted by parental interaction, or had no distraction (control group).
Investigators independently measured pain and anxiety in the patient and perceived pain and anxiety according to both a family member and a health care worker (medical observer). Researchers used the previously validated Children’s Fear Scale and the Wong-Baker Pain Scale.9,10 The Children’s Fear Scale was used to assess anxiety in children on a scale of 0 (picture of a calm face) to 4 (picture of the most fearful face). The Wong-Baker Pain Scale was used to assess pain on a scale of 0 (no hurt: happy face) to 10 (hurts worst: saddest face).
Continue to: Results
Results. The pain and anxiety scores were significantly lower in all of the intervention groups compared with the control group (P < .05). The video game (active distraction) group had the lowest levels of both pain and anxiety. The self-reported Children’s Fear Scale scores of children in the video game group were 0.27, compared with 0.76 in the cartoon group, 1.24 in the parental distraction group, and 2.22 in the control group. The anxiety scores recorded by the family member and the medical observer showed similar significant differences.
The Wong-Baker Pain Scale scores showed similar differences in self-reported pain for the video game group (1.42) compared with the cartoon group (3.02), the parental distraction group (2.89), and the control group (5.11). Pain scores reported by the family member and the medical observer (respectively) also reflected benefit from any type of distraction, with active game-playing as the most effective type of distraction (video game: 1.69 and 1.96; cartoon: 3.07 and 3.20; parental distraction: 3.56 and 4.22; and control: 5.29 and 6.13).
In addition, the intraclass correlation coefficient was 0.67 to 0.924 (P < .01), suggesting that the reports from the child, parent, and medical observer about the child’s pain and anxiety were highly correlated.
WHAT'S NEW
All distraction techniques provide benefit, but there’s a clear winner
In this RCT of children undergoing phlebotomy, both active and passive distraction techniques were superior to no distraction in terms of perceived pain and anxiety by the child, a health care provider, or a parent. The active-distraction group played a video game, while the passive-distraction groups watched a cartoon or interacted with a parent. Active distraction was superior to passive distraction.
CAVEATS
Procedure time was short; intervention not blinded
One potential weakness of this study is that it was not a double-blinded trial. Blinding was not possible for much of the study as the patient, parent, and medical observer were fully aware of the intervention or lack thereof. However, the parent and medical observer were blinded to each other’s assessments of the child’s pain and anxiety.
Continue to: Furthermore, the study...
Furthermore, the study was conducted at a single institution in Turkey. There could be cultural differences in reporting of pain and anxiety compared to Western cultures.
Finally, the average duration of the procedure in this study was 3 minutes, with a range of 1 to 5 minutes. It is unclear if the findings can be extrapolated to more time-consuming procedures.
CHALLENGES TO IMPLEMENTATION
Technology is not available to all
The use of tablet computers may seem increasingly ubiquitous, but not all families have access to these devices. Another challenge is that phlebotomy/clinic personnel must learn to work around the device.
ACKNOWLEDGEMENT
The PURLs Surveillance System was supported in part by Grant Number UL1RR024999 from the National Center for Research Resources, a Clinical Translational Science Award to the University of Chicago. The content is solely the responsibility of the authors and does not necessarily represent the official views of the National Center for Research Resources or the National Institutes of Health.
1. Inan G, Inal S. The impact of 3 different distraction techniques on the pain and anxiety levels of children during venipuncture: a clinical trial. Clin J Pain. 2019;35:140-147.
2. Fein JA, Zempsky WT, Cravero JP, Committee on Pediatric Emergency Medicine and Section on Anesthesiology and Pain Medicine; American Academy of Pediatrics. Relief of pain and anxiety in pediatric patients in emergency medical systems. Pediatrics. 2012;130:e1391-e1405.
3. Cohen LL, Blount RL, Panopoulos G. Nurse coaching and cartoon distraction: an effective and practical intervention to reduce child, parent, and nurse distress during immunizations. J Pediatr Psychol. 1997;22:355-370.
4. Downey VA, Zun LS. The impact of watching cartoons for distraction during painful procedures in the emergency department. Pediatr Emerg. 2012;28:1033-1035.
5. Hussein H. Effect of active and passive distraction on decreasing pain associated with painful medical procedures among school aged children. World J Nurs Sci. 2015;1:13-23.
6. Nilsson S, Enskär K, Hallqvist C, et al. Active and passive distraction in children undergoing wound dressing. J Pediatr Nurs. 2013;28:158-166.
7. Birnie KA, Noel M, Chambers CT, et al. Psychological interventions for needle-related procedural pain and distress in children and adolescents. Cochrane Database Syst Rev. 2018;10:CD005179.
8. Birnie KA, Noel M, Parker JA, et al. Systematic review and meta-analysis of distraction and hypnosis for needle-related pain and distress in children and adolescents. J Pediatr Psychol. 2014;39:783-808.
9. McMurtry CM, Noel M, Chambers CT, et al. Children’s fear during procedural pain: preliminary investigation of the Children’s Fear Scale. Health Psychol. 2011;30:780-788.
10. Wong DL, Baker CM. Pain in children: comparison of assessment scales. Pediatric Nurs. 1988;14:9-17.
ILLUSTRATIVE CASE
An 8-year-old girl with congenital heart disease (status: post repair) arrives at your clinic for a routine appointment. Since the age of 12 months, she has experienced significant anxiety during medical visits, especially with blood draws and injections. She enjoys playing video games on her new tablet computer. Her parents want to know what you can do to reduce her anxiety and pain during today’s scheduled blood draw. Should you recommend that she continue playing video games during the venipuncture?
Adequately managing pain while performing venipuncture in children can improve the quality of the experience, reduce children’s fear of going to the doctor, and increase efficiency in medical practice.2 Since pharmacologic pain-control methods may have adverse effects, distraction techniques—engaging the child in another activity during a procedure—are commonly used instead to help reduce a child’s pain. These techniques can be active or passive.
Studies have demonstrated that both active and passive distraction techniques reduce children’s pain during medical procedures, including venipuncture. Passive techniques, such as nurse coaching3 and watching cartoons,4 have been found to reduce distress and pain. Active distraction techniques, such as playing video games while undergoing a painful procedure (eg, dressing a wound), have been shown to be more effective than passive techniques.5,6
A Cochrane review and meta-analysis of distraction and hypnosis for needle-related pain and distress in children demonstrated reduced pain, but the quality of evidence was low and the review recommended improved methodological rigor and trial reporting.7 Another systematic review and analysis showed strong support for distraction for reducing pain; however, the quality of evidence was low and the researchers cited problems with characteristics of the distraction interventions, child age, and risk of bias in the studies.8
There has been a lack of RCTs comparing the effectiveness and superiority of active vs passive distraction techniques. The first high-quality RCT to directly compare 3 of the most common distraction techniques to a control group was recently conducted in a large training and research hospital in Turkey.1
STUDY SUMMARY
Pain and anxiety levels were lowest in actively distracted children
The RCT included 180 children ages 6 to 10 years randomly assigned to 1 of 3 intervention groups or a control group.1 Phlebotomy was performed while children watched a cartoon, played a video game, were distracted by parental interaction, or had no distraction (control group).
Investigators independently measured pain and anxiety in the patient and perceived pain and anxiety according to both a family member and a health care worker (medical observer). Researchers used the previously validated Children’s Fear Scale and the Wong-Baker Pain Scale.9,10 The Children’s Fear Scale was used to assess anxiety in children on a scale of 0 (picture of a calm face) to 4 (picture of the most fearful face). The Wong-Baker Pain Scale was used to assess pain on a scale of 0 (no hurt: happy face) to 10 (hurts worst: saddest face).
Continue to: Results
Results. The pain and anxiety scores were significantly lower in all of the intervention groups compared with the control group (P < .05). The video game (active distraction) group had the lowest levels of both pain and anxiety. The self-reported Children’s Fear Scale scores of children in the video game group were 0.27, compared with 0.76 in the cartoon group, 1.24 in the parental distraction group, and 2.22 in the control group. The anxiety scores recorded by the family member and the medical observer showed similar significant differences.
The Wong-Baker Pain Scale scores showed similar differences in self-reported pain for the video game group (1.42) compared with the cartoon group (3.02), the parental distraction group (2.89), and the control group (5.11). Pain scores reported by the family member and the medical observer (respectively) also reflected benefit from any type of distraction, with active game-playing as the most effective type of distraction (video game: 1.69 and 1.96; cartoon: 3.07 and 3.20; parental distraction: 3.56 and 4.22; and control: 5.29 and 6.13).
In addition, the intraclass correlation coefficient was 0.67 to 0.924 (P < .01), suggesting that the reports from the child, parent, and medical observer about the child’s pain and anxiety were highly correlated.
WHAT'S NEW
All distraction techniques provide benefit, but there’s a clear winner
In this RCT of children undergoing phlebotomy, both active and passive distraction techniques were superior to no distraction in terms of perceived pain and anxiety by the child, a health care provider, or a parent. The active-distraction group played a video game, while the passive-distraction groups watched a cartoon or interacted with a parent. Active distraction was superior to passive distraction.
CAVEATS
Procedure time was short; intervention not blinded
One potential weakness of this study is that it was not a double-blinded trial. Blinding was not possible for much of the study as the patient, parent, and medical observer were fully aware of the intervention or lack thereof. However, the parent and medical observer were blinded to each other’s assessments of the child’s pain and anxiety.
Continue to: Furthermore, the study...
Furthermore, the study was conducted at a single institution in Turkey. There could be cultural differences in reporting of pain and anxiety compared to Western cultures.
Finally, the average duration of the procedure in this study was 3 minutes, with a range of 1 to 5 minutes. It is unclear if the findings can be extrapolated to more time-consuming procedures.
CHALLENGES TO IMPLEMENTATION
Technology is not available to all
The use of tablet computers may seem increasingly ubiquitous, but not all families have access to these devices. Another challenge is that phlebotomy/clinic personnel must learn to work around the device.
ACKNOWLEDGEMENT
The PURLs Surveillance System was supported in part by Grant Number UL1RR024999 from the National Center for Research Resources, a Clinical Translational Science Award to the University of Chicago. The content is solely the responsibility of the authors and does not necessarily represent the official views of the National Center for Research Resources or the National Institutes of Health.
1. Inan G, Inal S. The impact of 3 different distraction techniques on the pain and anxiety levels of children during venipuncture: a clinical trial. Clin J Pain. 2019;35:140-147.
2. Fein JA, Zempsky WT, Cravero JP, Committee on Pediatric Emergency Medicine and Section on Anesthesiology and Pain Medicine; American Academy of Pediatrics. Relief of pain and anxiety in pediatric patients in emergency medical systems. Pediatrics. 2012;130:e1391-e1405.
3. Cohen LL, Blount RL, Panopoulos G. Nurse coaching and cartoon distraction: an effective and practical intervention to reduce child, parent, and nurse distress during immunizations. J Pediatr Psychol. 1997;22:355-370.
4. Downey VA, Zun LS. The impact of watching cartoons for distraction during painful procedures in the emergency department. Pediatr Emerg. 2012;28:1033-1035.
5. Hussein H. Effect of active and passive distraction on decreasing pain associated with painful medical procedures among school aged children. World J Nurs Sci. 2015;1:13-23.
6. Nilsson S, Enskär K, Hallqvist C, et al. Active and passive distraction in children undergoing wound dressing. J Pediatr Nurs. 2013;28:158-166.
7. Birnie KA, Noel M, Chambers CT, et al. Psychological interventions for needle-related procedural pain and distress in children and adolescents. Cochrane Database Syst Rev. 2018;10:CD005179.
8. Birnie KA, Noel M, Parker JA, et al. Systematic review and meta-analysis of distraction and hypnosis for needle-related pain and distress in children and adolescents. J Pediatr Psychol. 2014;39:783-808.
9. McMurtry CM, Noel M, Chambers CT, et al. Children’s fear during procedural pain: preliminary investigation of the Children’s Fear Scale. Health Psychol. 2011;30:780-788.
10. Wong DL, Baker CM. Pain in children: comparison of assessment scales. Pediatric Nurs. 1988;14:9-17.
PRACTICE CHANGER
Employ active distraction, such as playing a video game, rather than passive distraction (eg, watching a video) to reduce pain and anxiety during pediatric venipuncture.
STRENGTH OF RECOMMENDATION
B: Based on a single, high-quality, randomized controlled trial (RCT). 1
Inan G, Inal S. The impact of 3 different distraction techniques on the pain and anxiety levels of children during venipuncture: a clinical trial. Clin J Pain. 2019;35:140-147.

Is the incidence of depressive disorders increased following cerebral concussion?
EVIDENCE SUMMARY
Higher odds of depression in youth and adolescents with concussion
A 2019 prospective cohort study used data from the 2017 Nevada Youth Risk Behavior Surveillance Survey (YRBSS) to evaluate the relationship between concussion and depression in high school students.1 Included students were physically active for at least 60 minutes on 5 or more days per week or played on at least 1 sports team (N = 3427; 9th-12th grade students from 98 schools). When compared to the total population of included students and controlled for covariates, those who self-reported a concussion within the past 12 months (N = 664) had a higher adjusted odds ratio (aOR) of depressive symptoms (aOR = 1.5; 95% confidence interval [CI], 1.1-1.9). Depressive symptoms were reported in 38.1% of patients with a history of concussion, compared to 29.2% of patients who did not report a concussion in the past 12 months.
A 2014 retrospective cohort study examined data from the 2007-2008 National Survey of Children’s Health and evaluated the association between previous concussion and current depression diagnosis in youth ages 12 to 17 years without a current concussion (N = 36,060).2 Parents were contacted by random-digit dialing, prompted with a description of depression, and asked if their child currently had a clinical diagnosis of depression and whether a concussion had ever been diagnosed. A prior diagnosis of concussion was associated with greater risk for current depression compared to youth with no concussion history (aOR = 3.3; 95% CI, 2-5.5). Current depression was reported in 10.1% of patients with a history of concussion compared to 3.4% of patients with no history of concussion.
Findings vary among college athletes
A 2015 case-control study examined the prevalence of depressive symptoms in college athletes diagnosed with concussion compared to an athletic control group.3 The intervention group (N = 84; 77% male; average age, 18.4 years) received a concussion diagnosis from the team physician or certified athletic trainer. The athletic control group (N = 42; 55% male; average age, 18.9 years) reported no concussions in the past year.
The Beck Depression Inventory–Fast Screen (BDI-FS) was administered to the concussion group at baseline and postconcussion, and to the control group at 2 time points, with an average interval of 6.8 weeks. A score of ≥ 4 on the BDI-FS (scoring range, 0-21; higher score suggestive of more severe depression) indicated athletes at risk for depression. Concussed athletes exhibited a statistically significant increase in depression symptoms compared to control participants (20% vs 5%; x21 = 5.2; P = .02).
A 2018 cross-sectional study examined the association between concussion and adverse health outcomes in former college football players who played at least 1 year in college (1999-2001) but had no professional football experience.4 The cohort (N = 204; average age, 35) self-reported (15 years after their college career ended) the number of concussions sustained during high school and college sports performance. Reports were then stratified into 3 categories: no concussions, 1 or 2 concussions, and ≥ 3 concussions. The Patient Health Questionnaire (PHQ-9) was used to screen for depression, with scores categorized to no or mild depression (< 10) and moderate-to-severe depression (≥ 10).
Controlling for body mass index, athletes reporting ≥ 3 concussions had a higher prevalence of depression compared to those reporting no concussions (prevalence ratio [PR] = 4.2; 95% CI, 1.0-16.3) or 1 to 2 concussions (PR = 2.8; 95% CI, 1.3-6.0). No statistically significant association between concussion and depression was observed with athletes reporting 1 to 2 concussions compared to 0 concussions.
A 2015 prospective longitudinal cohort study examined postinjury depressive symptoms in 3 groups of Division 1 male and female college student athletes (N = 21; ages 18-22).5 Physician-diagnosed concussed (N = 7) and injured but nonconcussed (N = 7) athletes completed the Center for Epidemiological Studies Depression Scale (CES-D) at baseline and at 1 week, 1 month, and 3 months postinjury. Sport-matched healthy athletes (N = 7) completed it only at baseline. A CES-D score of ≥ 16 (range, 0-60) indicated a risk for clinical depression. Participants with a history of depression or other injury resulting in ≥ 1 day of time lost within the past 3 months were excluded.
Continue to: While both groups...
While both groups showed a significant increase from baseline CES-D scores, there were no significant differences in depressive symptoms between concussed (mean CES-D score ± standard deviation [SD]: baseline, 6.7 ± 3.9; 1 week, 11 ± 5.3; 1 month, 8.3 ± 5; 3 months, 6.4 ± 5.4) and injured but nonconcussed participants (mean CES-D score ± SD: baseline, 5.7 ± 2.8; 1 week, 9.1 ± 4; 1 month, 8.9 ± 4.6; 3 months, 6.9 ± 2.8) at any of the postinjury time points.
Findings among semipro and pro athletes appear to vary by sport
A 2016 prospective cohort study assessed the impact of concussive events on incidence of depression in active semiprofessional and professional football players who had previously sustained ≥ 1 concussions.6 Participants (N = 27) answered an anonymous online survey that included the revised version of the CES-D (CESD-R) to determine level of depression (a score of ≥ 16 defined clinical depression). Players with a CESD-R score ≥ 16 (N = 16) sustained a significantly greater average number of concussions compared to those who scored < 16 (N = 11; 3.8 vs. 1.6, P = .0004). Players who sustained ≥ 3 concussions scored significantly higher on the CESD-R than players with ≤ 2 concussions (average score, 24 vs 15.6; P = .03).
A 2017 case-control study examined the long-term health outcomes of retired Scottish male rugby players (N = 52; mean age, 54 years) with a history of mild concussion compared to males of similar age with no previous history of concussion (N = 29; mean age, 55).7 The Hospital Anxiety and Depression Scale (HADS) was used to assess depression on a 21-point scale (normal = 0-7; borderline, 8-10; abnormal, 11-21). There was no significant difference observed in mean HADS scores between the rugby players and controls, respectively (2.8 ± 2.1 vs 2.6 ± 2 .8; P = .941).
A 2013 case-control study of 30 retired NFL players with 29 controls matched for age, estimated IQ, and education examined the relationship between a remote history of concussion and current symptoms of depression.8 Concussion history was self-reported by the retired players. Controls with a history of concussion were excluded from the study. The Beck Depression Inventory-II (BDI-II) was used to measure depression symptoms, with a score of 1 to 9 designating minimal depression and ≥ 10 mild-to-moderate depression. Retired players scored significantly higher on the BDI-II compared to the controls (8.8 vs 2.8; P = .001).
Editor’s takeaway
Concussions include cognitive compromise. An astute clinician’s concern for depression as a sequela makes sense. This evidence contributes to that conjecture. However, the authors of this Clinical Inquiry correctly outline the limitations, inconsistencies, and biases of the evidence. The exact relationship—degree and context—between concussion and depression remains vague.
1. Yang MN, Clements-Nolle K, Parrish B, et al. Adolescent concussion and mental health outcomes: a population-based study. Am J Health Behav. 2019;43:258-265.
2. Chrisman SPD, Richardson LP. Prevalence of diagnosed depression in adolescents with history of concussion. J Adolesc Health. 2014;54:582-586.
3. Vargas G, Rabinowitz A, Meyer J, et al. Predictors and prevalence of postconcussion depression symptoms in collegiate athletes. J Athl Train. 2015;50:250-255.
4. Kerr ZY, Thomas LC, Simon JE, et al. Association between history of multiple concussions and health outcomes among former college football players. Am J Sports Med. 2018;46:1733-1741.
5. Roiger T, Weidauer L, Kern B. A longitudinal pilot study of depressive symptoms in concussed and injured/nonconcussed National Collegiate Athletic Association Division I student-athletes. J Athl Train. 2015;50:256-261.
6. Pryor J, Larson A, DeBeliso M. The prevalence of depression and concussions in a sample of active North American semi-professional and professional football players. J Lifestyle Med. 2016;6:7-15.
7. McMillan TM, McSkimming P, Wainman-Lefley J, et al. Long-term health outcomes after exposure to repeated concussion in elite level: rugby union players. J Neurol Neurosurg Psychiatry. 2017;88:505-511.
8. Didehbani N, Munro Cullum C, Mansinghani S, et al. Depressive symptoms and concussions in aging retired NFL players. Arch Clin Neuropsychol. 2013;28:418-424.
EVIDENCE SUMMARY
Higher odds of depression in youth and adolescents with concussion
A 2019 prospective cohort study used data from the 2017 Nevada Youth Risk Behavior Surveillance Survey (YRBSS) to evaluate the relationship between concussion and depression in high school students.1 Included students were physically active for at least 60 minutes on 5 or more days per week or played on at least 1 sports team (N = 3427; 9th-12th grade students from 98 schools). When compared to the total population of included students and controlled for covariates, those who self-reported a concussion within the past 12 months (N = 664) had a higher adjusted odds ratio (aOR) of depressive symptoms (aOR = 1.5; 95% confidence interval [CI], 1.1-1.9). Depressive symptoms were reported in 38.1% of patients with a history of concussion, compared to 29.2% of patients who did not report a concussion in the past 12 months.
A 2014 retrospective cohort study examined data from the 2007-2008 National Survey of Children’s Health and evaluated the association between previous concussion and current depression diagnosis in youth ages 12 to 17 years without a current concussion (N = 36,060).2 Parents were contacted by random-digit dialing, prompted with a description of depression, and asked if their child currently had a clinical diagnosis of depression and whether a concussion had ever been diagnosed. A prior diagnosis of concussion was associated with greater risk for current depression compared to youth with no concussion history (aOR = 3.3; 95% CI, 2-5.5). Current depression was reported in 10.1% of patients with a history of concussion compared to 3.4% of patients with no history of concussion.
Findings vary among college athletes
A 2015 case-control study examined the prevalence of depressive symptoms in college athletes diagnosed with concussion compared to an athletic control group.3 The intervention group (N = 84; 77% male; average age, 18.4 years) received a concussion diagnosis from the team physician or certified athletic trainer. The athletic control group (N = 42; 55% male; average age, 18.9 years) reported no concussions in the past year.
The Beck Depression Inventory–Fast Screen (BDI-FS) was administered to the concussion group at baseline and postconcussion, and to the control group at 2 time points, with an average interval of 6.8 weeks. A score of ≥ 4 on the BDI-FS (scoring range, 0-21; higher score suggestive of more severe depression) indicated athletes at risk for depression. Concussed athletes exhibited a statistically significant increase in depression symptoms compared to control participants (20% vs 5%; x21 = 5.2; P = .02).
A 2018 cross-sectional study examined the association between concussion and adverse health outcomes in former college football players who played at least 1 year in college (1999-2001) but had no professional football experience.4 The cohort (N = 204; average age, 35) self-reported (15 years after their college career ended) the number of concussions sustained during high school and college sports performance. Reports were then stratified into 3 categories: no concussions, 1 or 2 concussions, and ≥ 3 concussions. The Patient Health Questionnaire (PHQ-9) was used to screen for depression, with scores categorized to no or mild depression (< 10) and moderate-to-severe depression (≥ 10).
Controlling for body mass index, athletes reporting ≥ 3 concussions had a higher prevalence of depression compared to those reporting no concussions (prevalence ratio [PR] = 4.2; 95% CI, 1.0-16.3) or 1 to 2 concussions (PR = 2.8; 95% CI, 1.3-6.0). No statistically significant association between concussion and depression was observed with athletes reporting 1 to 2 concussions compared to 0 concussions.
A 2015 prospective longitudinal cohort study examined postinjury depressive symptoms in 3 groups of Division 1 male and female college student athletes (N = 21; ages 18-22).5 Physician-diagnosed concussed (N = 7) and injured but nonconcussed (N = 7) athletes completed the Center for Epidemiological Studies Depression Scale (CES-D) at baseline and at 1 week, 1 month, and 3 months postinjury. Sport-matched healthy athletes (N = 7) completed it only at baseline. A CES-D score of ≥ 16 (range, 0-60) indicated a risk for clinical depression. Participants with a history of depression or other injury resulting in ≥ 1 day of time lost within the past 3 months were excluded.
Continue to: While both groups...
While both groups showed a significant increase from baseline CES-D scores, there were no significant differences in depressive symptoms between concussed (mean CES-D score ± standard deviation [SD]: baseline, 6.7 ± 3.9; 1 week, 11 ± 5.3; 1 month, 8.3 ± 5; 3 months, 6.4 ± 5.4) and injured but nonconcussed participants (mean CES-D score ± SD: baseline, 5.7 ± 2.8; 1 week, 9.1 ± 4; 1 month, 8.9 ± 4.6; 3 months, 6.9 ± 2.8) at any of the postinjury time points.
Findings among semipro and pro athletes appear to vary by sport
A 2016 prospective cohort study assessed the impact of concussive events on incidence of depression in active semiprofessional and professional football players who had previously sustained ≥ 1 concussions.6 Participants (N = 27) answered an anonymous online survey that included the revised version of the CES-D (CESD-R) to determine level of depression (a score of ≥ 16 defined clinical depression). Players with a CESD-R score ≥ 16 (N = 16) sustained a significantly greater average number of concussions compared to those who scored < 16 (N = 11; 3.8 vs. 1.6, P = .0004). Players who sustained ≥ 3 concussions scored significantly higher on the CESD-R than players with ≤ 2 concussions (average score, 24 vs 15.6; P = .03).
A 2017 case-control study examined the long-term health outcomes of retired Scottish male rugby players (N = 52; mean age, 54 years) with a history of mild concussion compared to males of similar age with no previous history of concussion (N = 29; mean age, 55).7 The Hospital Anxiety and Depression Scale (HADS) was used to assess depression on a 21-point scale (normal = 0-7; borderline, 8-10; abnormal, 11-21). There was no significant difference observed in mean HADS scores between the rugby players and controls, respectively (2.8 ± 2.1 vs 2.6 ± 2 .8; P = .941).
A 2013 case-control study of 30 retired NFL players with 29 controls matched for age, estimated IQ, and education examined the relationship between a remote history of concussion and current symptoms of depression.8 Concussion history was self-reported by the retired players. Controls with a history of concussion were excluded from the study. The Beck Depression Inventory-II (BDI-II) was used to measure depression symptoms, with a score of 1 to 9 designating minimal depression and ≥ 10 mild-to-moderate depression. Retired players scored significantly higher on the BDI-II compared to the controls (8.8 vs 2.8; P = .001).
Editor’s takeaway
Concussions include cognitive compromise. An astute clinician’s concern for depression as a sequela makes sense. This evidence contributes to that conjecture. However, the authors of this Clinical Inquiry correctly outline the limitations, inconsistencies, and biases of the evidence. The exact relationship—degree and context—between concussion and depression remains vague.
1. Yang MN, Clements-Nolle K, Parrish B, et al. Adolescent concussion and mental health outcomes: a population-based study. Am J Health Behav. 2019;43:258-265.
2. Chrisman SPD, Richardson LP. Prevalence of diagnosed depression in adolescents with history of concussion. J Adolesc Health. 2014;54:582-586.
3. Vargas G, Rabinowitz A, Meyer J, et al. Predictors and prevalence of postconcussion depression symptoms in collegiate athletes. J Athl Train. 2015;50:250-255.
4. Kerr ZY, Thomas LC, Simon JE, et al. Association between history of multiple concussions and health outcomes among former college football players. Am J Sports Med. 2018;46:1733-1741.
5. Roiger T, Weidauer L, Kern B. A longitudinal pilot study of depressive symptoms in concussed and injured/nonconcussed National Collegiate Athletic Association Division I student-athletes. J Athl Train. 2015;50:256-261.
6. Pryor J, Larson A, DeBeliso M. The prevalence of depression and concussions in a sample of active North American semi-professional and professional football players. J Lifestyle Med. 2016;6:7-15.
7. McMillan TM, McSkimming P, Wainman-Lefley J, et al. Long-term health outcomes after exposure to repeated concussion in elite level: rugby union players. J Neurol Neurosurg Psychiatry. 2017;88:505-511.
8. Didehbani N, Munro Cullum C, Mansinghani S, et al. Depressive symptoms and concussions in aging retired NFL players. Arch Clin Neuropsychol. 2013;28:418-424.
EVIDENCE-BASED ANSWER
Yes, in some populations. Youth and adolescents with self-reported history of concussion had increased risk of depressive disorders (strength of recommendation [SOR]: B, based on a prospective cohort study and a retrospective cohort study). Evidence was inconsistent for college athletes. Athletes with ≥ 3 concussions exhibited more depressive disorders, but no association was observed for those with 1 or 2 concussions compared to nonconcussion injuries (SOR: B, based on a cross-sectional study, a small prospective cohort study, and a case-control study).
In semiprofessional and professional athletes, evidence was variable and may be sport related. Retired rugby players with a history of concussion showed no increase in depression compared to controls with no concussion history (SOR: B, based on a case-control study). Retired football players with previous concussions displayed increased incidence of depression, especially after ≥ 3 concussions (SOR: B, based on a prospective cohort study and a small case-control study).
There is a significant risk of bias in these studies because of their reliance on self-reported concussions, differing definitions of depression, and possible unmeasured confounders in the study designs, making a causative relationship between concussion and depression unclear.

Maternal COVID antibodies cross placenta, detected in newborns
Antibodies against SARS-CoV-2 cross the placenta during pregnancy and are detectable in most newborns born to mothers who had COVID-19 during pregnancy, according to findings from a study presented Jan. 28 at the meeting sponsored by the Society for Maternal-Fetal Medicine.
“I think the most striking finding is that we noticed a high degree of neutralizing response to natural infection even among asymptomatic infection, but of course a higher degree was seen in those with symptomatic infection,” Naima Joseph, MD, MPH, of Emory University, Atlanta, said in an interview.
“Our data demonstrate maternal capacity to mount an appropriate and robust immune response,” and maternal protective immunity lasted at least 28 days after infection, Dr. Joseph said. “Also, we noted higher neonatal cord blood titers in moms with higher titers, which suggests a relationship, but we need to better understand how transplacental transfer occurs as well as establish neonatal correlates of protection in order to see if and how maternal immunity may also benefit neonates.”
The researchers analyzed the amount of IgG and IgM antibodies in maternal and cord blood samples prospectively collected at delivery from women who tested positive for COVID-19 at any time while pregnant. They used enzyme-linked immunosorbent assay to assess for antibodies for the receptor binding domain of the SARS-CoV-2 spike protein.
The 32 pairs of mothers and infants in the study were predominantly non-Hispanic Black (72%) and Hispanic (25%), and 84% used Medicaid as their payer. Most of the mothers (72%) had at least one comorbidity, most commonly obesity, hypertension, and asthma or pulmonary disease. Just over half the women (53%) were symptomatic while they were infected, and 88% were ill with COVID-19 during the third trimester. The average time from infection to delivery was 28 days.
All the mothers had IgG antibodies, 94% had IgM antibodies, and 94% had neutralizing antibodies against SARS-CoV-2. Among the cord blood samples, 91% had IgG antibodies, 9% had IgM antibodies, and 25% had neutralizing antibodies.
“It’s reassuring that, so far, the physiological response is exactly what we expected it to be,” Judette Louis, MD, MPH, an associate professor of ob.gyn. and the ob.gyn. department chair at the University of South Florida, Tampa, said in an interview. “It’s what we would expect, but it’s always helpful to have more data to support that. Otherwise, you’re extrapolating from what you know from other conditions,” said Dr. Louis, who moderated the oral abstracts session.
Symptomatic infection was associated with significantly higher IgG titers than asymptomatic infection (P = .03), but no correlation was seen for IgM or neutralizing antibodies. In addition, although mothers who delivered more than 28 days after their infection had higher IgG titers (P = .05), no differences existed in IgM or neutralizing response.
Infants’ cord blood titers were significantly lower than their corresponding maternal samples, independently of symptoms or latency from infection to delivery (P < .001), Dr. Joseph reported.
“Transplacental efficiency in other pathogens has been shown to be correlated with neonatal immunity when the ratio of cord to maternal blood is greater than 1,” Dr. Joseph said in her presentation. Their data showed “suboptimal efficiency” at a ratio of 0.81.
The study’s small sample size and lack of a control group were weaknesses, but a major strength was having a population at disproportionately higher risk for infection and severe morbidity than the general population.
Implications for maternal COVID-19 vaccination
Although the data are not yet available, Dr. Joseph said they have expanded their protocol to include vaccinated pregnant women.
“The key to developing an effective vaccine [for pregnant people] is in really characterizing adaptive immunity in pregnancy,” Dr. Joseph told SMFM attendees. “I think that these findings inform further vaccine development in demonstrating that maternal immunity is robust.”
The World Health Organization recently recommended withholding COVID-19 vaccines from pregnant people, but the SMFM and American College of Obstetricians and Gynecologists subsequently issued a joint statement reaffirming that the COVID-19 vaccines authorized by the FDA “should not be withheld from pregnant individuals who choose to receive the vaccine.”
“One of the questions people ask is whether in pregnancy you’re going to mount a good response to the vaccine the way you would outside of pregnancy,” Dr. Louis said. “If we can demonstrate that you do, that may provide the information that some mothers need to make their decisions.” Data such as those from Dr. Joseph’s study can also inform recommendations on timing of maternal vaccination.
“For instance, Dr. Joseph demonstrated that, 28 days out from the infection, you had more antibodies, so there may be a scenario where we say this vaccine may be more beneficial in the middle of the pregnancy for the purpose of forming those antibodies,” Dr. Louis said.
Consensus emerging from maternal antibodies data
The findings from Dr. Joseph’s study mirror those reported in a study published online Jan. 29 in JAMA Pediatrics. That study, led by Dustin D. Flannery, DO, MSCE, of Children’s Hospital of Philadelphia, also examined maternal and neonatal levels of IgG and IgM antibodies against the receptor binding domain of the SARS-CoV-2 spike protein. They also found a positive correlation between cord blood and maternal IgG concentrations (P < .001), but notably, the ratio of cord to maternal blood titers was greater than 1, unlike in Dr. Joseph’s study.
For their study, Dr. Flannery and colleagues obtained maternal and cord blood sera at the time of delivery from 1471 pairs of mothers and infants, independently of COVID status during pregnancy. The average maternal age was 32 years, and just over a quarter of the population (26%) were Black, non-Hispanic women. About half (51%) were White, 12% were Hispanic, and 7% were Asian.
About 6% of the women had either IgG or IgM antibodies at delivery, and 87% of infants born to those mothers had measurable IgG in their cord blood. No infants had IgM antibodies. As with the study presented at SMFM, the mothers’ infections included asymptomatic, mild, moderate, and severe cases, and the degree of severity of cases had no apparent effect on infant antibody concentrations. Most of the women who tested positive for COVID-19 (60%) were asymptomatic.
Among the 11 mothers who had antibodies but whose infants’ cord blood did not, 5 had only IgM antibodies, and 6 had significantly lower IgG concentrations than those seen in the other mothers.
In a commentary about the JAMA Pediatrics study, Flor Munoz, MD, of the Baylor College of Medicine, Houston, suggested that the findings are grounds for optimism about a maternal vaccination strategy to protect infants from COVID-19.
“However, the timing of maternal vaccination to protect the infant, as opposed to the mother alone, would necessitate an adequate interval from vaccination to delivery (of at least 4 weeks), while vaccination early in gestation and even late in the third trimester could still be protective for the mother,” Dr. Munoz wrote.
Given the interval between two-dose vaccination regimens and the fact that transplacental transfer begins at about the 17th week of gestation, “maternal vaccination starting in the early second trimester of gestation might be optimal to achieve the highest levels of antibodies in the newborn,” Dr. Munoz wrote. But questions remain, such as how effective the neonatal antibodies would be in protecting against COVID-19 and how long they last after birth.
No external funding was used in Dr. Joseph’s study. Dr. Joseph and Dr. Louis have disclosed no relevant financial relationships. The JAMA Pediatrics study was funded by the Children’s Hospital of Philadelphia. One coauthor received consultancy fees from Sanofi Pasteur, Lumen, Novavax, and Merck unrelated to the study. Dr. Munoz served on the data and safety monitoring boards of Moderna, Pfizer, Virometix, and Meissa Vaccines and has received grants from Novavax Research and Gilead Research.
A version of this article first appeared on Medscape.com.
Tofacitinib for RA misses the mark in safety study
Daily treatment with tofacitinib (Xeljanz) led to more malignancies and adverse cardiovascular events in older rheumatoid arthritis patients compared with treatment with a tumor necrosis factor (TNF) inhibitor, according to the partial results of a safety study announced last week by Pfizer.
The postmarketing study known as ORAL Surveillance began in 2014 to evaluate the safety of the Janus kinase (JAK) inhibitor tofacitinib compared to a TNF inhibitor in RA patients 50 years of age or older with at least one additional cardiovascular risk factor. Its 4,362 participants were randomized to either daily doses of 5 mg (n = 1,455) or 10 mg (n = 1,456) of tofacitinib or the TNFi (n = 1,451), which was adalimumab for patients in the United States, Canada, and Puerto Rico, and etanercept elsewhere. During analysis, adverse events were pooled for all patients on tofacitinib.
Overall, 135 patients developed major adverse cardiovascular events (MACE) and 164 developed malignancies – excluding nonmelanoma skin cancer. The incidence of adjudicated malignancies was significantly higher in the tofacitinib group, compared with the TNFi group (1.13 vs. 0.77 per 100 person-years; hazard ratio, 1.48; 95% confidence interval, 1.04-2.09). The rate of MACE was also higher in the combined tofacitinib group (0.98 vs. 0.73 per 100 person-years; HR, 1.33; 95% CI, 0.91-1.94). Both rates for tofacitinib did not meet the trial’s noninferiority criteria.
Among the patients on tofacitinib, the most reported MACE was myocardial infarction and the most reported malignancy was lung cancer. Study participants with noted risk factors – including older age and smoking – were more likely to experience adverse events.
In February 2019, patients in the 10-mg tofacitinib group were switched to the 5-mg because of a safety signal indicating increased risk of pulmonary embolism and death.
Tofacitinib was approved for RA in November 2012, though concerns about serious side effects had been noted during clinical trials and a boxed warning was ultimately added to the drug’s label. Tofacitinib is also approved for adults with active psoriatic arthritis, adults with moderately to severely active ulcerative colitis, and patients aged 2 years or older with active polyarticular course juvenile idiopathic arthritis. Other JAK inhibitors such as baricitinib and upadacitinib have been approved for RA in the interim as well, though the higher dose of baricitinib was rejected in committee because of safety concerns and both their boxes also warn against infections, thrombosis, and cancer.
A postmarketing safety study on baricitinib is expected to be completed in 2025.
The full results of the ORAL Surveillance study – which should address safety regarding pulmonary embolism and mortality, as well as efficacy data – have not yet been released. “Pfizer is working with the [FDA] and other regulatory agencies to review the full results and analyses as they become available,” the press release said.
Helping survivors of human trafficking
Human trafficking (HT) is a secretive, multibillion dollar criminal industry involving the use of coercion, threats, and fraud to force individuals to engage in labor or commercial sex acts. In 2017, the International Labour Organization estimated that 24.9 million people worldwide were victims of forced labor (ie, working under threat or coercion).1 Risk factors for individuals who are vulnerable to HT include recent migration, substance use, housing insecurity, runaway youth, and mental illness. Traffickers continue the cycle of HT through isolation and emotional, physical, financial, and verbal abuse.
Survivors of HT may avoid seeking health care due to cultural reasons or feelings of guilt, isolation, distrust, or fear of criminal sanctions. There can be missed opportunities for victims to obtain help through health care services, law enforcement, child welfare services, or even family or friends. In a study of 173 survivors of HT in the United States, 68% of those who were currently trafficked visited with a health care professional at least once and were not identified as being trafficked.2 Psychiatrists rarely receive education on HT, which can lead to missed opportunities for identifying victims. Table 1 lists screening questions psychiatrists can ask patients they suspect may be trafficked.

The psychiatric sequelae of trafficking
Survivors of HT commonly experience psychiatric illness, substance use, pain, sexually transmitted diseases, and unplanned pregnancies.3 Here we discuss some of the psychiatric conditions that are common among HT survivors, and outline a multidisciplinary approach to their care.
PTSD, mood disorders, and anxiety disorders. Studies suggest survivors of HT who seek care have a high prevalence of depression, anxiety, and posttraumatic stress disorder (PTSD).3 Survivors may have experienced multiple repetitive trauma, such as physical and sexual abuse.3 Compared with survivors of forced labor trafficking, survivors of sex trafficking have higher rates of childhood abuse, violence during trafficking, severe symptoms of PTSD, and comorbid depression and PTSD.4 For survivors with PTSD, consider psychosocial interventions that address social support, coping strategies, and community reintegration.5 Survivors can also benefit from trauma-informed care that focuses on the cognitive aspect of the trauma, such as cognitive processing therapy, which involves cognitive restructuring without a written account of the trauma.6
Substance use disorders. Some individuals who are trafficked may be forced to use drugs of abuse or alcohol, while others may use substances to help cope while they are being trafficked or afterwards.3 For these patients, motivational interviewing may be beneficial. Also, consider referring them to detoxification or rehabilitation programs.
Suicide and self-harm. In a study of 98 HT survivors in England, 33% reported a history of self-harm before receiving care and 25% engaged in self-harm during care.7 After engaging in self-harm, survivors of HT were more likely to be admitted to psychiatric inpatient units than were patients who had not been trafficked.7 It is crucial to conduct a suicide risk assessment as part of the trauma-informed care of these patients.
Other conditions. In addition to psychiatric illness, survivors of HT may experience physical symptoms such as headache, back pain, stomach pain, fatigue, dizziness, memory problems, and weight loss.3 Referral to other specialties may be necessary for addressing any of the patient’s other conditions.
Continue to: Use a multidisciplinary approach
Use a multidisciplinary approach
Treatment for survivors of HT should be tailored to their specific mental health needs by including psychopharmacology; individual, group, or family psychotherapy; and peer advocate support. Rehabilitation, social services, and case management should also be considered. The care of survivors of HT benefits from a multidisciplinary, culturally-sensitive, and trauma-informed approach. Table 28 describes the PEARR Tool (Provide privacy, Educate, Ask, Respect, and Respond), which offers physicians 4 steps for addressing abuse, neglect, or violence with their patients. Also, the National Human Trafficking Hotline (1-888-373-7888) is available 24/7 for trafficked persons, survivors, and health care professionals to provide guidance on reporting laws and finding additional resources such as housing and legal services.

1. International Labour Organization, the Walk Free Foundation. Global Estimates of Modern Slavery: forced labour and forced marriage. Published 2017. Accessed January 14, 2021. www.ilo.org/global/publications/books/WCMS_575479/lang--en/index.htm
2. Chisolm-Straker M, Baldwin S, Gaïgbé-Togbé B, et al. Health care and human trafficking: we are seeing the unseen. J Health Care Poor Underserved. 2016;27(3):1220-1233.
3. Ottisova L, Hemmings S, Howard LM, et al. Prevalence and risk of violence and the mental, physical and sexual health problems associated with human trafficking: an updated systematic review. Epidemiol Psychiatr Sci. 2016;25(4):317-341.
4. Hopper EK, Gonzalez LD. A comparison of psychological symptoms in survivors of sex and labor trafficking. Behav Med. 2018;44(3):177-188.
5. Okech D, Hanseen N, Howard W, et al. Social support, dysfunctional coping, and community reintegration as predictors of PTSD among human trafficking survivors. Behav Med. 2018;44(3):209-218.
6. Salami T, Gordon M, Coverdale J, et al. What therapies are favored in the treatment of the psychological sequelae of trauma in human trafficking victims? J Psychiatr Pract. 2018;24(2):87-96.
7. Borschmann R, Oram S, Kinner SA, et al. Self-harm among adult victims of human trafficking who accessed secondary mental health services in England. Psychiatr Serv. 2017;68(2):207-210.
8. Using the PEARR Tool. Dignity Health. Published 2019. Accessed January 14, 2021. https://www.dignityhealth.org/hello-humankindness/human-trafficking/victimcentered-and-trauma-informed/using-the-pearr-tool
Human trafficking (HT) is a secretive, multibillion dollar criminal industry involving the use of coercion, threats, and fraud to force individuals to engage in labor or commercial sex acts. In 2017, the International Labour Organization estimated that 24.9 million people worldwide were victims of forced labor (ie, working under threat or coercion).1 Risk factors for individuals who are vulnerable to HT include recent migration, substance use, housing insecurity, runaway youth, and mental illness. Traffickers continue the cycle of HT through isolation and emotional, physical, financial, and verbal abuse.
Survivors of HT may avoid seeking health care due to cultural reasons or feelings of guilt, isolation, distrust, or fear of criminal sanctions. There can be missed opportunities for victims to obtain help through health care services, law enforcement, child welfare services, or even family or friends. In a study of 173 survivors of HT in the United States, 68% of those who were currently trafficked visited with a health care professional at least once and were not identified as being trafficked.2 Psychiatrists rarely receive education on HT, which can lead to missed opportunities for identifying victims. Table 1 lists screening questions psychiatrists can ask patients they suspect may be trafficked.
The psychiatric sequelae of trafficking
Survivors of HT commonly experience psychiatric illness, substance use, pain, sexually transmitted diseases, and unplanned pregnancies.3 Here we discuss some of the psychiatric conditions that are common among HT survivors, and outline a multidisciplinary approach to their care.
PTSD, mood disorders, and anxiety disorders. Studies suggest survivors of HT who seek care have a high prevalence of depression, anxiety, and posttraumatic stress disorder (PTSD).3 Survivors may have experienced multiple repetitive trauma, such as physical and sexual abuse.3 Compared with survivors of forced labor trafficking, survivors of sex trafficking have higher rates of childhood abuse, violence during trafficking, severe symptoms of PTSD, and comorbid depression and PTSD.4 For survivors with PTSD, consider psychosocial interventions that address social support, coping strategies, and community reintegration.5 Survivors can also benefit from trauma-informed care that focuses on the cognitive aspect of the trauma, such as cognitive processing therapy, which involves cognitive restructuring without a written account of the trauma.6
Substance use disorders. Some individuals who are trafficked may be forced to use drugs of abuse or alcohol, while others may use substances to help cope while they are being trafficked or afterwards.3 For these patients, motivational interviewing may be beneficial. Also, consider referring them to detoxification or rehabilitation programs.
Suicide and self-harm. In a study of 98 HT survivors in England, 33% reported a history of self-harm before receiving care and 25% engaged in self-harm during care.7 After engaging in self-harm, survivors of HT were more likely to be admitted to psychiatric inpatient units than were patients who had not been trafficked.7 It is crucial to conduct a suicide risk assessment as part of the trauma-informed care of these patients.
Other conditions. In addition to psychiatric illness, survivors of HT may experience physical symptoms such as headache, back pain, stomach pain, fatigue, dizziness, memory problems, and weight loss.3 Referral to other specialties may be necessary for addressing any of the patient’s other conditions.
Continue to: Use a multidisciplinary approach
Use a multidisciplinary approach
Treatment for survivors of HT should be tailored to their specific mental health needs by including psychopharmacology; individual, group, or family psychotherapy; and peer advocate support. Rehabilitation, social services, and case management should also be considered. The care of survivors of HT benefits from a multidisciplinary, culturally-sensitive, and trauma-informed approach. Table 28 describes the PEARR Tool (Provide privacy, Educate, Ask, Respect, and Respond), which offers physicians 4 steps for addressing abuse, neglect, or violence with their patients. Also, the National Human Trafficking Hotline (1-888-373-7888) is available 24/7 for trafficked persons, survivors, and health care professionals to provide guidance on reporting laws and finding additional resources such as housing and legal services.
1. International Labour Organization, the Walk Free Foundation. Global Estimates of Modern Slavery: forced labour and forced marriage. Published 2017. Accessed January 14, 2021. www.ilo.org/global/publications/books/WCMS_575479/lang--en/index.htm
2. Chisolm-Straker M, Baldwin S, Gaïgbé-Togbé B, et al. Health care and human trafficking: we are seeing the unseen. J Health Care Poor Underserved. 2016;27(3):1220-1233.
3. Ottisova L, Hemmings S, Howard LM, et al. Prevalence and risk of violence and the mental, physical and sexual health problems associated with human trafficking: an updated systematic review. Epidemiol Psychiatr Sci. 2016;25(4):317-341.
4. Hopper EK, Gonzalez LD. A comparison of psychological symptoms in survivors of sex and labor trafficking. Behav Med. 2018;44(3):177-188.
5. Okech D, Hanseen N, Howard W, et al. Social support, dysfunctional coping, and community reintegration as predictors of PTSD among human trafficking survivors. Behav Med. 2018;44(3):209-218.
6. Salami T, Gordon M, Coverdale J, et al. What therapies are favored in the treatment of the psychological sequelae of trauma in human trafficking victims? J Psychiatr Pract. 2018;24(2):87-96.
7. Borschmann R, Oram S, Kinner SA, et al. Self-harm among adult victims of human trafficking who accessed secondary mental health services in England. Psychiatr Serv. 2017;68(2):207-210.
8. Using the PEARR Tool. Dignity Health. Published 2019. Accessed January 14, 2021. https://www.dignityhealth.org/hello-humankindness/human-trafficking/victimcentered-and-trauma-informed/using-the-pearr-tool

Maternal autoimmune disease raises children’s risk of ADHD
Maternal autoimmune diseases significantly increased the risk of ADHD in children, based on data from a large cohort study of more than 800,000 mothers and children and a subsequent meta-analysis.
“There is growing evidence that immune-related cells and proteins play a role in brain development and function and that maternal immune activation, including infection, autoimmune disease, and chronic inflammation during pregnancy, increases the risk of neurodevelopmental disorders among children,” wrote Timothy C. Nielsen, MPH, of the University of Sydney, and colleagues.
Previous research has examined a link between maternal autoimmune disorders and autism spectrum disorders in children, but associations with ADHD have not been well studied, they said.
In a population-based cohort study published in JAMA Pediatrics, the researchers identified 831,718 mothers and their 831,718 singleton infants in Australia. A total of 12,787 infants were born to mothers with an autoimmune diagnosis; 12,610 of them were matched to 50,440 control infants. ADHD was determined based on prescription for a stimulant treatment or a hospital diagnosis; children with a first ADHD event younger than 3 years were excluded.
In the total cohort of 63,050 infants, the presence of any maternal autoimmune disease was associated with a significantly increased risk of ADHD (hazard ratio, 1.30) as was the presence of several specific conditions: type 1 diabetes (HR, 2.23), psoriasis (HR, 1.66), and rheumatic fever or rheumatic carditis (HR, 1.75).
In addition, the researchers conducted a meta-analysis of the current study and four additional studies that yielded similar results. In the meta-analysis, the risk of ADHD was significantly associated with any maternal autoimmune disease in two studies (HR, 1.20); with maternal type 1 diabetes in four studies (HR, 1.53); with maternal hyperthyroidism in three studies (HR 1.15); and with maternal psoriasis in two studies (HR, 1.31).
Type 1 diabetes (T1D) had the highest HR and was the most often studied condition. However, “the observed association may also be related to nonimmune aspects of T1D, such as glycemic control, as nonautoimmune diabetes has been associated with ADHD among children,” the researchers wrote.
The study findings were limited by several factors, including the lack of outpatient and primary care records to identify maternal autoimmune disease, and lack of data on any medication used to managed diseases during pregnancy, as well as a lack of data on children with ADHD who might not have been treated with medication, the researchers noted. In addition, “given differences in study design and definitions, the pooled HRs presented in the meta-analysis need to be treated cautiously.”
However, the results were strengthened by the hybrid study design and large study population, and were generally consistent with previous research supporting an effect of maternal immune function on fetal neurodevelopment, they noted.
“Our study provides justification for future studies that examine the effect of maternal autoimmune diseases, including biomarkers, condition severity, and management in pregnancy and in the periconception period, on neurodevelopmental disorders in children,” they concluded.
Studies need to explore mechanism of action
The current study, with its hybrid design, adds support to the evidence of an association between any maternal autoimmune disease and ADHD in children, as well as an association between the specific conditions of type 1 diabetes, hyperthyroidism, and psoriasis in mothers and ADHD in children, Søren Dalsgaard, MD, of Aarhus (Denmark) University, wrote in an accompanying editorial.
“Importantly, Nielsen et al. emphasized in their article that, for the many different autoimmune diseases, different underlying mechanisms for the associations with disorders of the central nervous system were likely. They mentioned that, for T1D, low glycemic control may play a role, as type 2 diabetes has been associated with ADHD,” said Dr. Dalsgaard.
“Overall, these mechanisms are thought to include shared genetic and environmental risk factors or direct effects of maternal autoantibodies or cytokines crossing the placenta and altering the fetal immune response, which in turns leads to changes in the central nervous system,” Dr. Dalsgaard explained. However, the current study and previous studies have not identified the mechanisms to explain the association between ADHD in children and maternal autoimmune disease.
“To understand more about these associations, future studies should include researchers and data from different scientific disciplines, such as epidemiology, animal modeling, genetics, and neuroimmunology,” he concluded.
Association is not causality
Overall, the study findings add to the evidence of a correlation between autoimmune diseases and neurologic disease, said Herschel Lessin, MD, of Children’s Medical Group, Poughkeepsie, N.Y., in an interview. “Anything that might contribute to behavioral problems is worth investigating.” However, it is important to remember that association is not causation.

“There is some literature and evidence that autoimmune disease is associated with mental health issues, but the mechanisms of action are unknown,” said Dr. Lessin. ADHD is highly heritable, so the association may be caused by a similar genetic predisposition, or it may be something related to autoimmunity that is impacting the fetus by passing through the placenta.
The current study’s strengths include the large size and hybrid design, but limitations such as the identification of ADHD based on medication prescriptions may have led to underreporting, and identifying maternal autoimmune disease via inpatient hospital diagnosis could have selected for more severe disease, he said.
From a clinical standpoint, the study suggests a correlation that should be noted in a family history and potentially used to inform a diagnosis, especially in cases of type 1 diabetes where the association was strongest, Dr. Lessin said. The findings also support the value of further research to look for mechanisms that might explain whether the association between autoimmune disease and ADHD is autoimmune system causality or shared genetic susceptibility.
The study received no outside funding. One coauthor disclosed receiving grants from the National Blood Authority Australia and the Australian National Health and Medical Research Council during the conduct of the study. Dr. Dalsgaard had no financial conflicts to disclose. Dr. Lessin disclosed serving as editor of the ADHD toolkit for the American Academy of Pediatrics and coauthor of the current ADHD clinical guidelines. He also serves in advisory capacity to Cognoa, a company involved in diagnosis of autism, and Corium/KemPharm, companies involved in the development of ADHD treatments.
Maternal autoimmune diseases significantly increased the risk of ADHD in children, based on data from a large cohort study of more than 800,000 mothers and children and a subsequent meta-analysis.
“There is growing evidence that immune-related cells and proteins play a role in brain development and function and that maternal immune activation, including infection, autoimmune disease, and chronic inflammation during pregnancy, increases the risk of neurodevelopmental disorders among children,” wrote Timothy C. Nielsen, MPH, of the University of Sydney, and colleagues.
Previous research has examined a link between maternal autoimmune disorders and autism spectrum disorders in children, but associations with ADHD have not been well studied, they said.
In a population-based cohort study published in JAMA Pediatrics, the researchers identified 831,718 mothers and their 831,718 singleton infants in Australia. A total of 12,787 infants were born to mothers with an autoimmune diagnosis; 12,610 of them were matched to 50,440 control infants. ADHD was determined based on prescription for a stimulant treatment or a hospital diagnosis; children with a first ADHD event younger than 3 years were excluded.
In the total cohort of 63,050 infants, the presence of any maternal autoimmune disease was associated with a significantly increased risk of ADHD (hazard ratio, 1.30) as was the presence of several specific conditions: type 1 diabetes (HR, 2.23), psoriasis (HR, 1.66), and rheumatic fever or rheumatic carditis (HR, 1.75).
In addition, the researchers conducted a meta-analysis of the current study and four additional studies that yielded similar results. In the meta-analysis, the risk of ADHD was significantly associated with any maternal autoimmune disease in two studies (HR, 1.20); with maternal type 1 diabetes in four studies (HR, 1.53); with maternal hyperthyroidism in three studies (HR 1.15); and with maternal psoriasis in two studies (HR, 1.31).
Type 1 diabetes (T1D) had the highest HR and was the most often studied condition. However, “the observed association may also be related to nonimmune aspects of T1D, such as glycemic control, as nonautoimmune diabetes has been associated with ADHD among children,” the researchers wrote.
The study findings were limited by several factors, including the lack of outpatient and primary care records to identify maternal autoimmune disease, and lack of data on any medication used to managed diseases during pregnancy, as well as a lack of data on children with ADHD who might not have been treated with medication, the researchers noted. In addition, “given differences in study design and definitions, the pooled HRs presented in the meta-analysis need to be treated cautiously.”
However, the results were strengthened by the hybrid study design and large study population, and were generally consistent with previous research supporting an effect of maternal immune function on fetal neurodevelopment, they noted.
“Our study provides justification for future studies that examine the effect of maternal autoimmune diseases, including biomarkers, condition severity, and management in pregnancy and in the periconception period, on neurodevelopmental disorders in children,” they concluded.
Studies need to explore mechanism of action
The current study, with its hybrid design, adds support to the evidence of an association between any maternal autoimmune disease and ADHD in children, as well as an association between the specific conditions of type 1 diabetes, hyperthyroidism, and psoriasis in mothers and ADHD in children, Søren Dalsgaard, MD, of Aarhus (Denmark) University, wrote in an accompanying editorial.
“Importantly, Nielsen et al. emphasized in their article that, for the many different autoimmune diseases, different underlying mechanisms for the associations with disorders of the central nervous system were likely. They mentioned that, for T1D, low glycemic control may play a role, as type 2 diabetes has been associated with ADHD,” said Dr. Dalsgaard.
“Overall, these mechanisms are thought to include shared genetic and environmental risk factors or direct effects of maternal autoantibodies or cytokines crossing the placenta and altering the fetal immune response, which in turns leads to changes in the central nervous system,” Dr. Dalsgaard explained. However, the current study and previous studies have not identified the mechanisms to explain the association between ADHD in children and maternal autoimmune disease.
“To understand more about these associations, future studies should include researchers and data from different scientific disciplines, such as epidemiology, animal modeling, genetics, and neuroimmunology,” he concluded.
Association is not causality
Overall, the study findings add to the evidence of a correlation between autoimmune diseases and neurologic disease, said Herschel Lessin, MD, of Children’s Medical Group, Poughkeepsie, N.Y., in an interview. “Anything that might contribute to behavioral problems is worth investigating.” However, it is important to remember that association is not causation.
“There is some literature and evidence that autoimmune disease is associated with mental health issues, but the mechanisms of action are unknown,” said Dr. Lessin. ADHD is highly heritable, so the association may be caused by a similar genetic predisposition, or it may be something related to autoimmunity that is impacting the fetus by passing through the placenta.
The current study’s strengths include the large size and hybrid design, but limitations such as the identification of ADHD based on medication prescriptions may have led to underreporting, and identifying maternal autoimmune disease via inpatient hospital diagnosis could have selected for more severe disease, he said.
From a clinical standpoint, the study suggests a correlation that should be noted in a family history and potentially used to inform a diagnosis, especially in cases of type 1 diabetes where the association was strongest, Dr. Lessin said. The findings also support the value of further research to look for mechanisms that might explain whether the association between autoimmune disease and ADHD is autoimmune system causality or shared genetic susceptibility.
The study received no outside funding. One coauthor disclosed receiving grants from the National Blood Authority Australia and the Australian National Health and Medical Research Council during the conduct of the study. Dr. Dalsgaard had no financial conflicts to disclose. Dr. Lessin disclosed serving as editor of the ADHD toolkit for the American Academy of Pediatrics and coauthor of the current ADHD clinical guidelines. He also serves in advisory capacity to Cognoa, a company involved in diagnosis of autism, and Corium/KemPharm, companies involved in the development of ADHD treatments.
FROM JAMA PEDIATRICS
Topical brepocitinib for atopic dermatitis meets endpoints in phase 2b study
, and with a safety profile essentially indistinguishable from vehicle cream in a phase 2b randomized trial, Megan N. Landis, MD, reported at the virtual annual congress of the European Academy of Dermatology and Venereology.
The study included 240 adolescents and adults with mild to moderate AD at 70 sites in the United States and nine other countries. Patients’ mean baseline Eczema Area and Severity Index (EASI) score was 7.3, with 9.2% of their body surface area being involved. Participants were equally split between mild and moderate disease. They were randomized to 6 weeks of double-blind treatment in one of eight study arms: once-daily topical brepocitinib at a concentration of 0.1%, 0.3%, 1%, or 3%; twice-daily brepocitinib at 1% or 3%; or once- or twice-daily vehicle cream.
The primary endpoint was change in EASI score from baseline to week 6. Brepocitinib 1% and 3% once daily and 1% twice daily outperformed vehicle, with EASI score reductions of 70.1%, 67.9%, and 75%, respectively, compared with a 44.4% decrease among those in the once-daily vehicle control group and a 47.6% reduction among those in the twice-daily vehicle control group, according to Dr. Landis, a dermatologist at the University of Louisville (Ky).
The key secondary efficacy endpoint was the proportion of patients achieving an Investigator’s Global Assessment (IGA) score of 0 or 1 – clear or almost clear skin – plus at least a 2-point reduction at week 6. This occurred in a dose-dependent fashion in 27.8%-44.4% of patients on once-daily brepocitinib, all significantly better results than the 10.8% rate in once-daily controls. Patients on the TYK2/JAK1 inhibitor at 0.3% twice daily had a 33.3% IGA response rate, versus 13.9% with twice-daily vehicle, also a significant difference.
A 90% reduction in EASI score at week 6, or EASI 90 response, occurred in a dose-dependent fashion in 27.8%-41.7% of patients on 0.3%, 1%, and 3% of patients on once-daily brepocitinib, all significantly better than the 10.8% rate with once-daily vehicle, and in 27% of patients on brepocitinib 1% twice daily, versus 8.3% with twice-daily vehicle.
Improvement in itch was another secondary endpoint. A clinically meaningful week-6 improvement of at least 4 points on the Peak Pruritus Numerical Rating Scale was documented in 45.2% of patients on 1% brepocitinib once daily, 50% on 3% once daily, and 40.7% on 1% brepocitinib twice daily, all significantly better than the roughly 17% itch response rate in controls.
Treatment-emergent adverse events were about one-third more frequent in controls than in brepocitinib-treated patients. These events were overwhelmingly mild and were similar in nature in the two groups. There was no dose-dependent increase in treatment-emergent adverse events in the brepocitinib patients. Moreover, no serious treatment-emergent adverse events occurred during the study, nor were there any cases of herpes zoster or malignancies, and no changes in laboratory parameters or ECG findings.
Pfizer sponsored the phase 2b AD trial of the topical TYK2/JAK1 inhibitor, which is also in phase 2 studies for psoriatic arthritis, psoriasis, lupus, and alopecia areata.
Dr. Landis reported serving as a paid investigator for Pfizer and numerous other pharmaceutical companies.
FROM THE EADV CONGRESS
Are pediatric and adult dermatitis the same disease?

“Maybe not,” Jonathan I. Silverberg, MD, PhD, MPH, said during the Revolutionizing Atopic Dermatitis symposium.
Dr. Silverberg, director of clinical research in the division of dermatology at George Washington University, Washington, based his comments largely on a review that he and his colleagues carried out to understand how features of atopic dermatitis (AD) vary by region globally as well as by age. They identified 101 studies with sufficient data for meta-analysis and stratified the results by pediatric and adult age groups.
Several signs and symptoms occurred with similar frequency among pediatric and adult patients, including pruritus, xerosis, flexural involvement, extensor involvement, early onset of disease, comorbid atopy, head and neck involvement, and ophthalmic comorbidities. However, adults were found to have more signs of chronic disease, more hand eczema, different patterns of hand eczema, and a stronger relationship of disease activity with emotional factors. Meanwhile, children were found to have more exudative or weeping lesions, more perifollicular eczema, and more pityriasis alba.
Dr. Silverberg showed photos of three adults with varied presentations of extensor involvement, including one “who had a lot of lichenification and thickening of the skin, but over knees where you might think about psoriasis,” he said. “All three of these patients were of Southeast Asian descent. That happens to be a region where this feature was reported much more commonly. It may even tie to some underlying immunopathophysiologic differences of the disease across different patient populations.”
AD signs that occur more commonly in adults than children include lichenification (100% vs. 48%), urticaria (32% vs. 20%), popular lichenoid lesions (46% vs. 8%), Hertoghe’s sign (25% vs. 2%), erythroderma (29% vs. 1%), and nodular prurigo (18% vs. 4%).
Hand eczema features also differ between adults and children, including hand or foot dermatitis (44% vs. 25%), dyshidrosis/pompholyx (21% vs. 3%), knuckle dermatitis (25% vs. 8%), nail involvement (15% vs. 8%), and fissured heels. However, ventral wrist dermatitis was found to be more than twice as common in children, compared with adults (34% vs. 15%).
Other signs of AD were more common in children, compared with adults, including exudative eczema (61% vs. 42%), pityriasis alba (28% vs. 18%), Dennie-Morgan infraorbital folds (47% vs. 36%), seborrheic dermatitis–like lesions (40% vs. 18%), and perifollicular accentuation (37% vs. 21%). “This is such an important sign to wrap your head around and get comfortable assessing,” he said. “I have seen patients who are erythrodermic with follicular eczema who were told that they were crazy and had psychogenic itch, and they should go to a shrink.”
AD triggers can differ between adults and children as well, including course influenced by emotions/environmental factors (72% vs. 32%), worsening itch worse (65% vs. 49%), course influenced by environment (62% vs. 37%), and course influenced by emotions (70% vs. 15%).
According to Dr. Silverberg, emerging research suggests that there may be differences in the immune pathways activated in pediatric versus adult AD. Specifically, more Th17 and interferon-gamma in AD lesions have been observed in children, compared with adults, and more Th22 and Th17 in nonlesional AD have been seen in children, compared with adults. “This leads to a question: Will children respond differently than adults to treatment?” Dr. Silverberg said. “We see that omalizumab doesn’t seem to help much in adults, yet a recent study suggested that it might work reasonably well for children. Dupilumab has different dosing requirements and potentially different responses between the pediatric and adult populations.”
Age differences in AD may also be related to differences in the skin microbiome. In 2016, researchers led by Richard L. Gallo, MD, PhD, professor of dermatology, University of California, San Diego, compared the skin microbiome between adults and children with AD by swabbing the volar forearm and performing 16S rRNA gene sequencing. The study included 59 young children, 13 teenagers, and 56 adults with AD as well as 68 age-matched non-atopic healthy controls. The researchers found a greater abundance of Streptococcus, Granulicatella, Gemella, Rothia, and Haemophilus in young children, compared with adults, while Propionibacterium, Corynebacterium, Staphylococcus, Lactobacillus, Finegoldia, and Anaerococcus were more abundant in adults, compared with children.
Dr. Silverberg reported that he is a consultant to and/or an advisory board member for several pharmaceutical companies. He is also a speaker for Regeneron and Sanofi and has received a grant from Galderma.
FROM REVOLUTIONIZING AD 2020
Weekly COVID-19 cases in children dropped 22%
according to new data from the American Academy of Pediatrics and the Children’s Hospital Association.
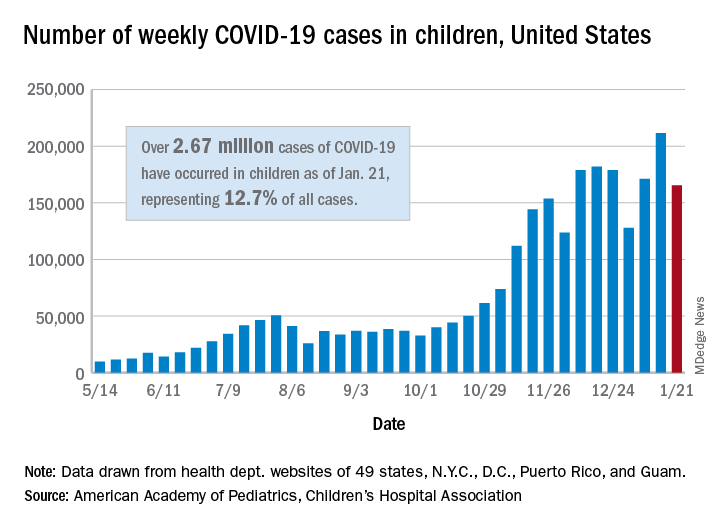
The 165,000 new cases reported during the week of Jan. 15-21 were down by almost 22% from the previous week’s 211,000, when the new-case count reached its highest point in the pandemic, the AAP and CHA said in their weekly COVID-19 report.
Cumulative cases in children now stand at just over 2.67 million, and children represent 12.7% of all COVID-19 cases reported by 49 states (excluding New York), the District of Columbia, New York City, Puerto Rico, and Guam. For the week of Jan. 15-21, children made up 14.8% of all new cases, the highest proportion since late September, the AAP/CHA data show.
The cumulative rate of infection among children is up to 3,556 per 100,000 nationally, with states ranging from 943 per 100,000 in Hawaii to 8,195 in North Dakota. California has the most reported cases at 383,000, while Vermont has the fewest at 1,820, the two organizations reported.
There were 14 more deaths among children in the last week, bringing the total to 205 in the 43 states (plus New York City and Guam) reporting such data. Children represent just 0.06% of all coronavirus-related deaths, and only 0.01% of all cases in children have resulted in death, the AAP and CHA said. There are still 10 states where no children have died from COVID-19.
Although severe illness appears to be rare in children, the AAP and CHA noted, “there is an urgent need to collect more data on longer-term impacts of the pandemic on children, including ways the virus may harm the long-term physical health of infected children, as well as its emotional and mental health effects.”
according to new data from the American Academy of Pediatrics and the Children’s Hospital Association.
The 165,000 new cases reported during the week of Jan. 15-21 were down by almost 22% from the previous week’s 211,000, when the new-case count reached its highest point in the pandemic, the AAP and CHA said in their weekly COVID-19 report.
Cumulative cases in children now stand at just over 2.67 million, and children represent 12.7% of all COVID-19 cases reported by 49 states (excluding New York), the District of Columbia, New York City, Puerto Rico, and Guam. For the week of Jan. 15-21, children made up 14.8% of all new cases, the highest proportion since late September, the AAP/CHA data show.
The cumulative rate of infection among children is up to 3,556 per 100,000 nationally, with states ranging from 943 per 100,000 in Hawaii to 8,195 in North Dakota. California has the most reported cases at 383,000, while Vermont has the fewest at 1,820, the two organizations reported.
There were 14 more deaths among children in the last week, bringing the total to 205 in the 43 states (plus New York City and Guam) reporting such data. Children represent just 0.06% of all coronavirus-related deaths, and only 0.01% of all cases in children have resulted in death, the AAP and CHA said. There are still 10 states where no children have died from COVID-19.
Although severe illness appears to be rare in children, the AAP and CHA noted, “there is an urgent need to collect more data on longer-term impacts of the pandemic on children, including ways the virus may harm the long-term physical health of infected children, as well as its emotional and mental health effects.”