User login
3-year-history of difficulty walking
The patient has probably transitioned to the secondary progressive form of multiple sclerosis (MS). Four phenotypes have been identified in MS, with relapsing-remitting MS (RRMS) representing the most common and secondary progressive MS (SPMS) the second most common. RRMS is thought to begin as an inflammatory disease that over time becomes primarily neurodegenerative. The course of RRMS is marked by episodes of neurologic deficit followed by periods of remission which may be asymptomatic. When symptoms do not resolve — becoming fixed without remission — this is a sign of progression to SPMS. One in two RRMS patients will develop SPMS within 15 years of their diagnosis, leading to a progressive decrease of neurologic function and limitation of daily activities. Risk factors for developing SPMS include older age at onset of RRMS, longer duration of RRMS, and more cortical inflammatory lesions at baseline.
RRMS is diagnosed through clinical findings and laboratory results, the main approaches being MRI of the brain and spinal cord, and examination of cerebrospinal fluid. Neurologic symptoms must be consistent with those typically seen in MS, with deficit lasting for days to weeks. MRI is useful in monitoring disease progression (ie, new lesions that develop during relapses in RRMS). There are no universally accepted diagnostic criteria for SPMS, however. A patient usually can be diagnosed upon meeting these criteria: The patient was previously diagnosed with RRMS; the patient's symptoms are gradually worsening; this worsening is not tied to a relapse; and this worsening has been observed for 6 months or longer. Of note, SPMS' symptom-worsening characteristics can be subtle and difficult for patients to detect, and delays in diagnosis of up to several years are common.
Recognizing the onset of transition to SPMS is critical, as early initiation of therapy is thought to slow disease progression, the primary goal of treatment. In patients with SPMS, adhering to a holistic health program and managing comorbidities, especially vascular risk factors, can help preserve the health and functions of both the central nervous system and brain. Patients with SPMS who experience relapses or demonstrate new lesion formation as captured on MRI are thought to have active SPMS (aSPMS) and generally benefit from disease-modifying therapy (DMT). There is generally a transition period of about 5 years during which SPMS patients will still have a relapsing form of the disease, meaning that DMTs have proven to be effective in managing progressive MS should theoretically be beneficial for SPMS during this period. There are FDA-approved treatments for aSPMS, but off-label use is acceptable of those medications indicated for relapsing MS in those patients with evidence of relapses or new MRI activity.
Krupa Pandey, MD, Director, Multiple Sclerosis Center, Department of Neurology & Neuroscience Institute, Hackensack University Medical Center; Neurologist, Department of Neurology, Hackensack Meridian Health, Hackensack, NJ
Krupa Pandey, MD, has serve(d) as a speaker or a member of a speakers bureau for: Bristol-Myers Squibb; Biogen; Alexion; Genentech; Sanofi-Genzyme
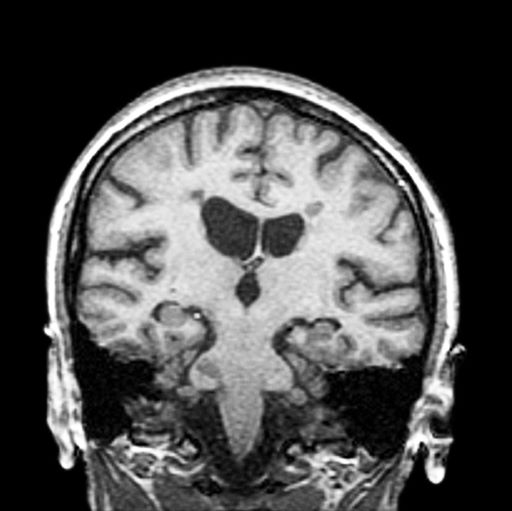
A 51-year-old woman presents with a 3-year history of difficulty walking. She says that it is difficult to pinpoint when her walking problems began but reports that it has been gradual. She recalls about 10 years back a history of numbness and tingling in her hands that improved over the course of a few weeks without any further workup. She also recalls blurry vision and loss of color perception in her left eye 5 years ago while traveling for work. Because the symptoms resolved on their own over 6-8 weeks, she never sought care. MRI shows plaques of demyelination.

Is it bipolar disorder, or a complex form of PTSD?
CASE A long history of suicidality
Mr. X, age 26, who has a history of bipolar II disorder and multiple inpatient admissions, presents to a state hospital after a suicide attempt by gunshot. He reports that throughout his lifetime, he has had >20 suicide attempts, often by overdose.
Mr. X is admitted to the hospital under a temporary detention order. He is initially adherent and cooperative with his psychiatric evaluations.
HISTORY Chronic physical and emotional pain
Mr. X is single, unemployed, and lives with his mother and nephew. He was diagnosed with bipolar II disorder during adolescence and receives sertraline, 50 mg twice a day, and lamotrigine, 100 mg twice a day, to which he reports adherence. He also was taking clonazepam and zolpidem, dosages unknown.
His medical history is significant for severe childhood liver disease and inflammatory bowel disease. He dropped out of school during high school due to his multiple medical conditions, which resulted in a significantly diminished overall childhood experience, interrupted developmental trajectory, and chronic physical and emotional pain. He has never been employed and receives financial support through disability benefits. He spends his days on the internet or watching television. He reports daily cigarette and marijuana use and occasional alcohol use, but no other substance use. His mother helps manage his medical conditions and is his main support. His biological father was abusive towards his mother and absent for most of Mr. X’s life. Beyond his mother and therapist, Mr. X has minimal other interpersonal interactions, and reports feeling isolated, lonely, and frustrated.
EVALUATION Agitated and aggressive while hospitalized
Upon learning that he is being involuntarily committed, Mr. X becomes physically aggressive, makes verbal threats, and throws objects across his room. He is given diphenhydramine, 50 mg, haloperidol, 5 mg, and lorazepam, 2 mg, all of which are ordered on an as-needed basis. Mr. X is placed in an emergency restraint chair and put in seclusion. The episode resolves within an hour with reassurance and attention from the treatment team; the rapid escalation from and return to a calmer state is indicative of situational, stress-induced mood lability and impulsivity. Mr. X is counseled on maintaining safety and appropriate behavior, and is advised to ask for medication if he feels agitated or unable to control his behaviors. To maintain safe and appropriate behavior, he requires daily counseling and expectation management regarding his treatment timeline. No further aggressive incidents are noted throughout his hospitalization, and he requires only minimal use of the as-needed medications.
[polldaddy:10983392]
The authors’ observations
The least appropriate therapy for Mr. X would be exposure and response prevention, which allows patients to face their fears without the need to soothe or relieve related feelings with a compulsive act. It is designed to improve specific behavioral deficits most often associated with obsessive-compulsive disorder, a diagnosis inconsistent with Mr. X’s history and presentation. Trauma-focused CBT could facilitate healing from Mr. X’s childhood trauma/adverse childhood experiences, and DBT might help with his anger, maladaptive coping strategies, and chronic suicidality. Motivational interviewing might help with his substance use and his apparent lack of motivation for other forms of social engagement, including seeking employment.
Based on Mr. X’s history of trauma and chronic physical and emotional pain, the treatment team reevaluated him and reconsidered his original diagnosis.
Continue to: EVALUATION A closer look at the diagnosis...
EVALUATION A closer look at the diagnosis
After meeting with Mr. X, the treatment team begins to piece together a more robust picture of him. They review his childhood trauma involving his biological father, his chronic and limiting medical illnesses, and his restricted and somewhat regressive level of functioning. Further, they consider his >20 suicide attempts, numerous psychiatric hospitalizations, and mood and behavioral lability and reactivity. Based on its review, the treatment team concludes that a diagnosis of bipolar disorder II or major depressive disorder is not fully adequate to describe Mr. X’s clinical picture.
At no point during his hospitalization does Mr. X meet full criteria for a major depressive episode or display mania or hypomania. The treatment team considers posttraumatic stress disorder (PTSD) in the setting of chronic, repetitive trauma given Mr. X’s nightmares, dissociative behavior, anger, negative cognitions, and intrusive symptoms. However, not all his symptoms fall within the diagnostic criteria of PTSD. There are also elements of borderline personality disorder in Mr. X’s history, most notably his multiple suicide attempts, emotional lability, and disrupted interpersonal attachments. In this context, a diagnosis of complex PTSD (CPTSD) seems most appropriate in capturing the array of trauma-related symptoms with which he presents.
Complex PTSD
Since at least the early to mid-1990s, there has been recognition of a qualitatively distinct clinical picture that can emerge when an individual’s exposure to trauma or adversity is chronic or repetitive, causing not only familiar PTSD symptomatology but also alterations in self-perception, interpersonal functioning, and affective instability. Complex PTSD was first described by Judith Herman, MD, in 1992 as a distinct entity from PTSD.1 She theorized that PTSD derives primarily from singular traumatic events, while a distinct clinical syndrome might arise after prolonged, repeated trauma.1 A diagnosis of CPTSD might arise in situations with more chronicity than a classic single circumscribed traumatic event, such as being held in captivity, under the control of perpetrators for extended periods of time, imprisoned, or subject to prolonged sexual abuse. Herman’s description of CPTSD identifies 3 areas of psychopathology that extend beyond PTSD1:
- symptomatic refers to the complex, diffuse, and tenacious symptom presentation
- characterological focuses on the personality changes in terms of dissociation, ego-fragmentation, and identity complications
- vulnerability describes characteristic repeated harm with respect to self-mutilation or other self-injurious behaviors, and suicidality.
Taxometrics, official recognition, and controversy
Complex PTSD was proposed for inclusion in DSM-IV as “Disorders of Extreme Stress Not Otherwise Specified,” or DESNOS. Reportedly, it was interpreted as a severe presentation of PTSD, and therefore not included in the manual as a separate diagnosis.2 In contrast, ICD-10 included a CPTSD-like entity of “Enduring Personality Change After Catastrophic Event” (EPCACE). Although the existence of CPTSD as a categorically distinct diagnosis in the psychiatric mainstream has been debated and discussed for years, with many arguably unaware of its existence, clinicians and researchers specializing in trauma are well-versed in its clinical utility. As such, CPTSD was again discussed during the development of DSM-5. In an apparent attempt to balance this clinical utility with ongoing concerns about its validity as a diagnostically distinct syndrome, DSM-5 did not officially recognize CPTSD, but added several criteria to PTSD referencing changes in self-perception, affective instability, and dysphoria, as well as a dissociative subtype, effectively expanding the scope of a PTSD diagnosis to also include CPTSD symptoms when applicable. ICD-11 has taken a different direction, and officially recognizes CPTSD as a distinct diagnosis.
ICD-11 presents CPTSD as a “sibling” disorder, which it distinguishes from PTSD with high levels of dissociation, depression, and borderline personality disorder traits.3 Within this framework, the diagnosis of CPTSD requires that the PTSD criteria be met in addition to symptoms that fall into a “disturbances of self-organization” category. When parsing the symptoms of the “disturbances of self-organization” category, the overlap with borderline personality disorder symptoms is apparent.4 This overlap has given rise to yet another controversy regarding CPTSD’s categorical validity; in addition to its distinctness from PTSD, its distinctness from borderline personality disorder has also been debated. In a study examining the similarity between CPTSD and borderline personality disorder, Jowett et al5 concluded that CPTSD was associated with greater exposure to multiple traumas earlier in life and resulted in higher functional impairment than borderline personality disorder, ultimately supporting CPTSD as a separate entity with features that overlap borderline personality disorder.5 According to Ford and Courtois6 “the evidence ... suggests that a sub-group of BPD patients—who often but not always have comorbid PTSD—may be best understood and treated if CPTSD is explicitly addressed as well—and in some cases, in lieu of—BPD.”
PTSD and CPTSD may therefore both be understood to fall within a spectrum of trauma diagnoses; this paradigm postulates that there exists a wide variety of posttraumatic patient presentations, perhaps on a continuum. On the less severe side of the trauma spectrum, the symptoms traditionally seen and characterized as PTSD (such as hypervigilance, nightmares, and flashbacks) may be found, while, with increasingly severe or prolonged trauma, there may be a tendency to see more complex elements (such as dissociation, personality changes mimicking borderline personality disorder, depression, anxiety, self-injurious behavior, and suicidality).7 Nevertheless, controversy about discriminant validity still exists. A review article by Resnick et al8 argued that the existing evidence is not strong enough to support CPTSD as a standalone entity. However, Resnick et al8 agreed that a singular PTSD diagnosis has limitations, and that there is a need for more research in the field of trauma psychiatry.
Continue to: Utility of the diagnostic conceptualization...
Utility of the diagnostic conceptualization
Although the controversy surrounding the distinction of CPTSD demands categorical clarity with respect to PTSD and borderline personality disorder as a means of resolution, the diagnosis has practical applications that should not limit its use in clinical formulation or treatment planning. Comorbid diagnoses do not prevent clinicians from diagnosing and treating patients who present with complicated manifestations of trauma.9 In fact, having overlapping diagnoses would highlight the array of patient presentations that can be seen in the posttraumatic condition. Furthermore, in the pursuit of individualized care approaches, the addition of CPTSD as a diagnostic conception would allow for more integrated treatment options using a multi-modular approach.10
The addition of CPTSD as a diagnosis is helpful in determining the etiology of a patient’s presentation and therefore formulating the most appropriate treatment plan. While the 2-pronged approach of psychopharmacology and therapy is the central dogma of psychiatric care, there are many specific options to consider for each. By viewing such patients through the lens of trauma as opposed to depression and anxiety, there is a clear shift in treatment that has the potential to make more lasting impacts and progress.11
CPTSD may coexist with PTSD, but it extends beyond it to include a pleomorphic symptom picture encompassing personality changes and a high risk for repeated harm. Failure to correctly classify a patient’s presentation as a response to repetitive, prolonged trauma may result in discrimination and inappropriate or ineffective treatment recommendations.
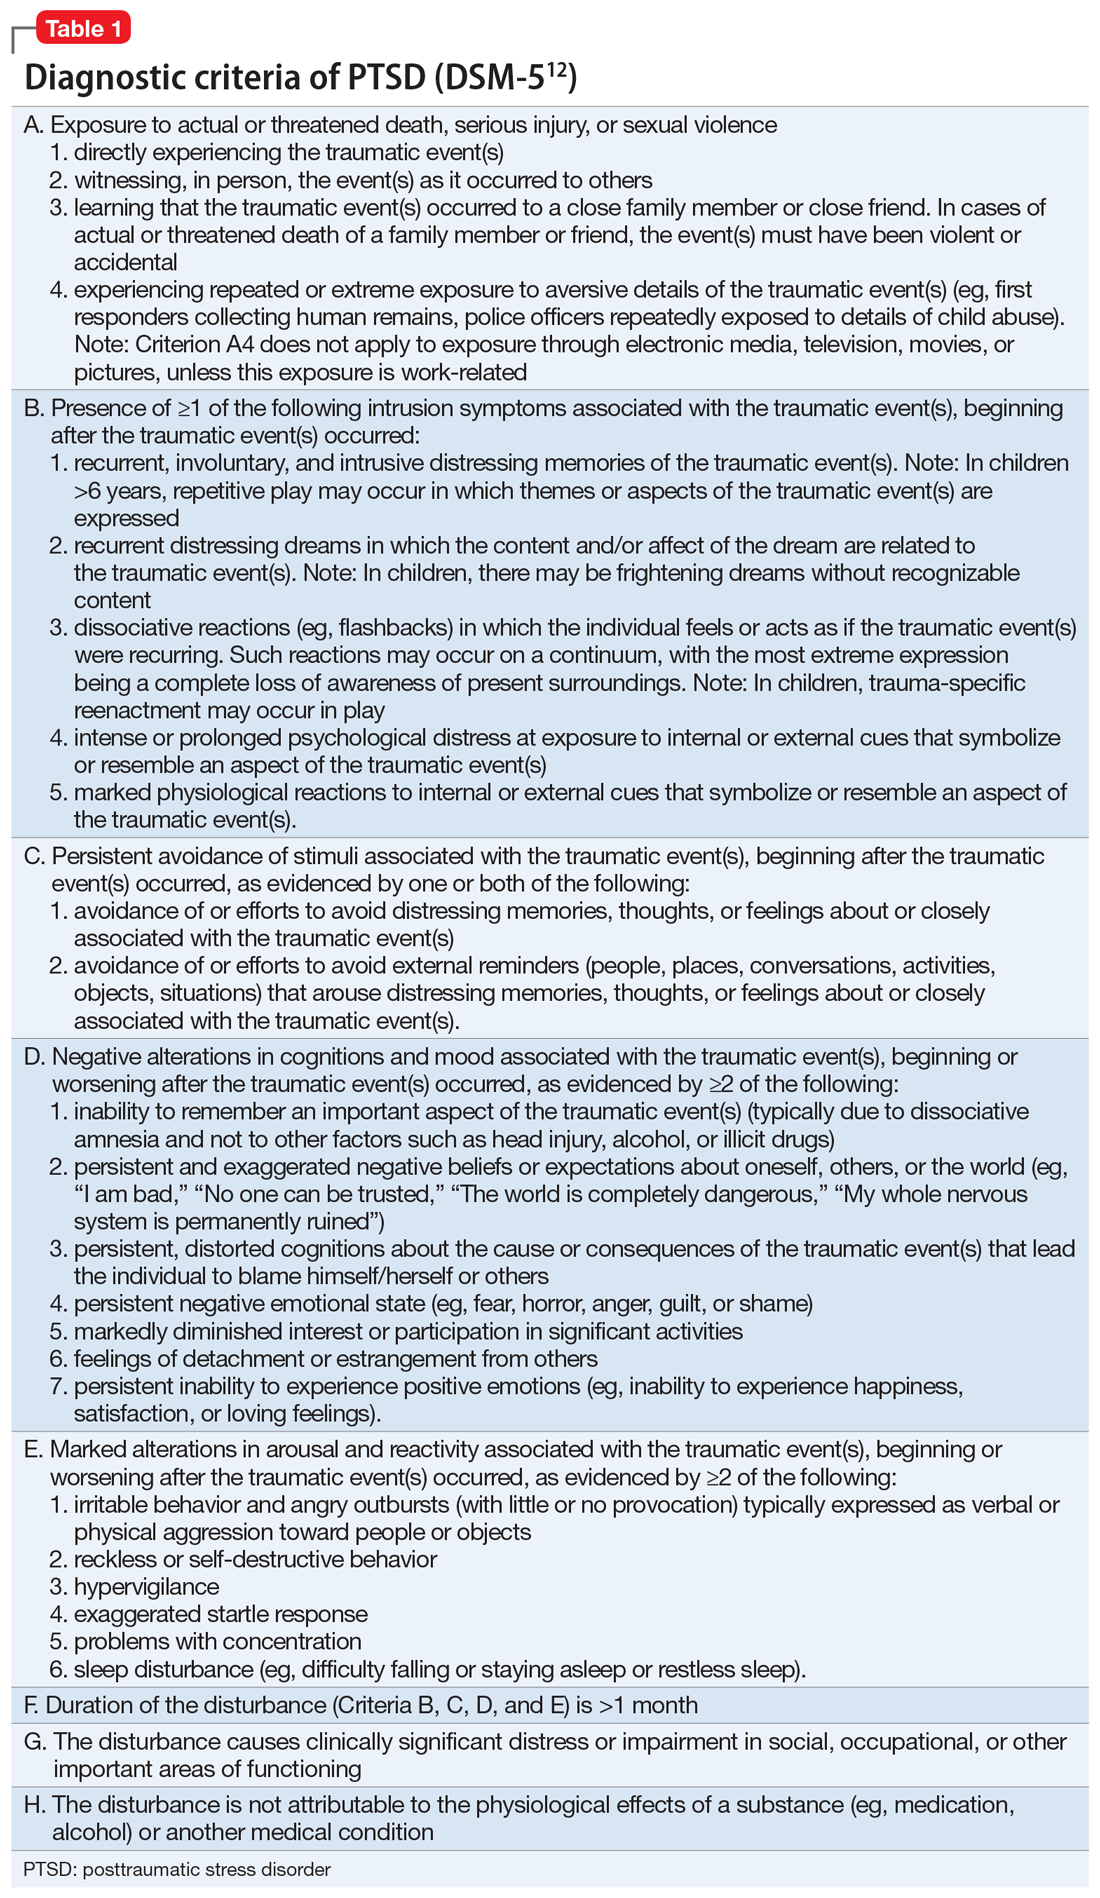
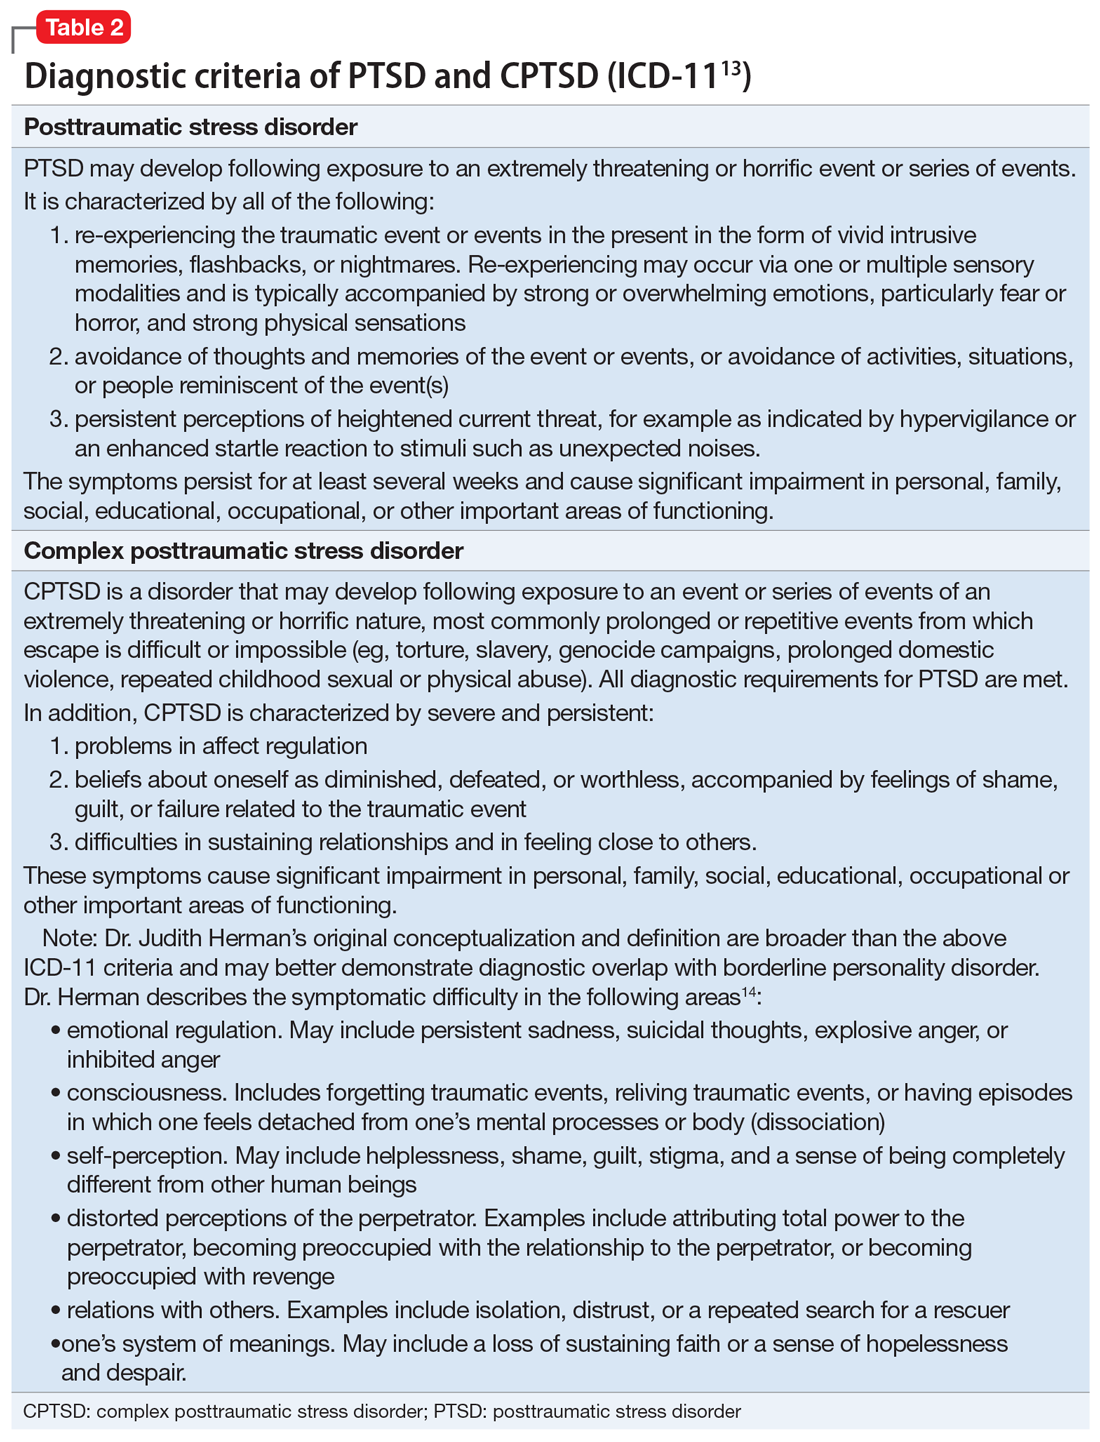
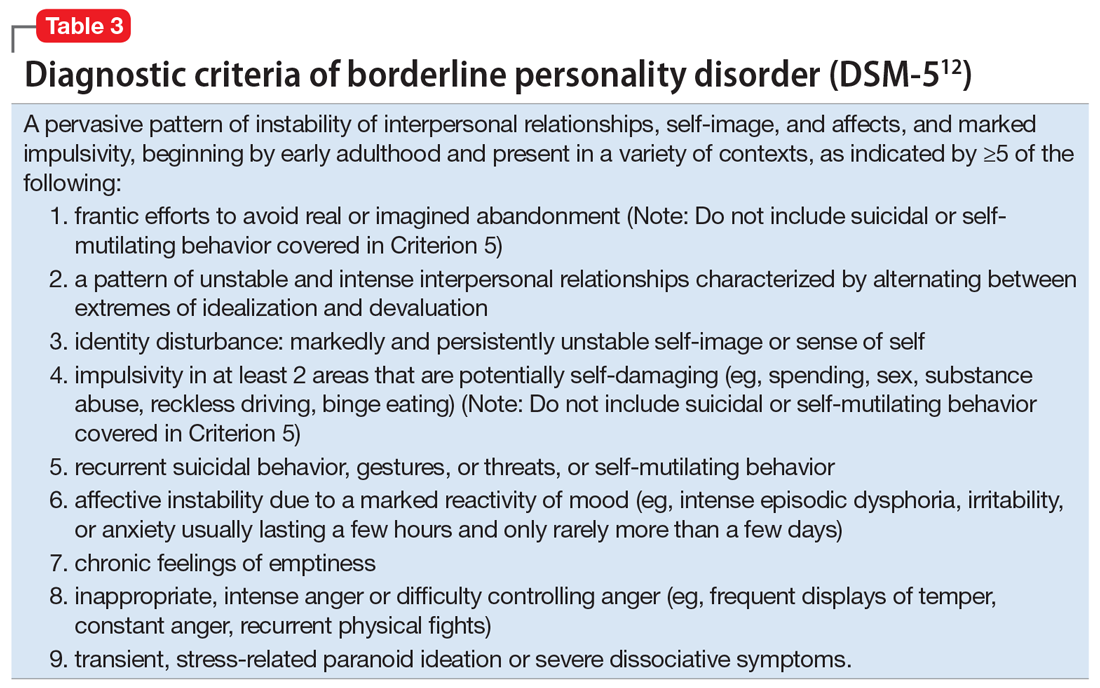
For a comparison of the diagnostic criteria of PTSD, CPTSD, and borderline personality disorder, see Table 112, Table 2,13,14, and Table 312.
Patients with CPTSD
One of the authors (NR) has cared for several similar individuals presenting for treatment with vague diagnoses of “chronic depression and anxiety” for years, sometimes with a speculative bipolar disorder diagnosis due to situational mood swings or reactivity, and a generally poor response to both medications and psychotherapy. These patients were frustrated because none of the diagnoses seemed to fully “fit” with their pattern of symptoms or subjective experience, and treatment seemed minimally helpful. Very often, their social history revealed a variety of adversities or traumatic events, such as childhood sexual or physical abuse, a home environment plagued by domestic violence, or being raised by one or both parents with their own history of trauma, or perhaps a personality or substance use disorder. Although many of these patients’ symptom profiles aligned only partially with “typical” PTSD, they were often better captured by CPTSD, with a focus on negative self-perception and impact on close relationships. Helping the patient “connect the dots” to create a more continuous narrative, and consequently reconceptualizing the diagnosis as a complex trauma disorder, has proven effective in a number of these cases, allowing the patient to make sense of their symptoms in the context of their personal history, reducing stigma, and allowing for different avenues with medication, therapy, and self-understanding. It can also help to validate the impact of a patient’s adverse experiences and encourage a patient to view their symptoms as an understandable or even once-adaptive response to traumatic stress, rather than a sign of personal weakness or defectiveness.
TREATMENT A trauma-focused approach
Once the treatment team considersMr. X’s significant childhood trauma and reconceptualizes his behaviors through this lens, treatment is adjusted accordingly. His significant reactivity, dissociative symptoms, social impairment, and repeated suicide attempts are better understood and have more significance through a trauma lens, which provides a better explanation than a primary mood disorder.
Therapeutic interventions in the hospital are tailored according to the treatment team’s new insight. Specific DBT skills are practiced, insight-oriented therapy and motivational interviewing are used, and Mr. X and his therapist begin to explore his trauma, both from his biological father and from his intense stressors experienced because of his medical issues.
Mr. X’s mother, who is very involved in his care, is provided with education on this conceptualization and given instruction on trauma-focused therapies in the outpatient setting. While Mr. X’s medication regimen is not changed significantly, for some patients, the reformulation from a primary mood or anxiety disorder to a trauma disorder might require a change in the pharmacotherapy regimen to address behavioral symptoms such as mood reactivity or issues with sleep.
OUTCOME Decreased intensity of suicidal thoughts
By the time of discharge, Mr. X has maintained safety, with no further outbursts, and subjectively reports feeling more understood and validated. Although chronic suicidal ideation can take months or years of treatment to resolve, at the time of discharge Mr. X reports a decreased intensity of these thoughts, and no acute suicidal ideation, plan, or intent. His discharge planning emphasizes ongoing work specifically related to coping with symptoms of traumatic stress, and the involvement of his main social support in facilitating this work.
The authors’ observations
As a caveat, it may be in some cases that chronic negative affect, dysphoria, and self-perception are better understood as a comorbid depressive disorder rather than subsumed into a PTSD/ CPTSD diagnosis. Also, because situational mood instability and impulsivity are often interpreted as bipolar disorder, a history of hypomania and mania should be ruled out. In Mr. X’s case, the diagnostic reformulation did not significantly impact pharmacotherapy because the target symptoms of mood instability, irritability, anxiety, and depression remained, despite the change in diagnosis.
Although the DSM-5 PTSD criteria effectively incorporate many CPTSD elements, we argue that this inclusivity comes at the expense of appreciating CPTSD as a qualitatively distinct condition, and we prefer ICD-11’s recognition of CPTSD as a separate diagnosis that incorporates PTSD criteria but extends the definition to include negative self-concept, affect dysregulation, and interpersonal difficulties.
Related Resources
- US Department of Veterans Affairs. PTSD: National Center for PTSD. Published January 1, 2007. https://www.ptsd.va.gov/ professional/treat/essentials/complex_ptsd.asp
- Jowett S, Karatzias T, Shevlin M, et al. Differentiating symptom profiles of ICD-11 PTSD, complex PTSD, and borderline personality disorder: a latent class analysis in a multiply traumatized sample. Personality disorders: theory, research, and treatment. 2020;11(1):36.
Drug Brand Names
Clonazepam • Klonopin
Haloperidol • Haldol
Lamotrigine • Lamictal
Lorazepam • Ativan
Sertraline • Zoloft
Zolpidem • Ambien
Bottom Line
Consider a diagnosis of complex posttraumatic stress disorder (CPTSD) when providing care for patients with chronic depression and suicidality with a history of trauma or childhood adversity. This reformulation can allow clinicians to understand the contributing factors more holistically; align with the patient more effectively; appreciate past and present interpersonal, psychological, and psychosocial factors that may precipitate and perpetuate symptoms; and allow for treatment recommendations beyond those of mood and anxiety disorders.
1. Herman JL. Complex PTSD: a syndrome in survivors of prolonged and repeated trauma. J Trauma Stress. 1992;5(3):377-391.
2. Friedman MJ. Finalizing PTSD in DSM-5: getting here from there and where to go next. J Trauma Stress. 2013;26(5):548-556. doi: 10.1002/jts.21840 3. Hyland P, Shevlin M, Fyvie C, et al. Posttraumatic stress disorder and complex posttraumatic stress disorder in DSM-5 and ICD-11: clinical and behavioral correlates. J Trauma Stress. 2018; 31(12):174-180.
4. Brand B, Loewenstein R. Dissociative disorders: an overview of assessment, phenomenology and treatment. Psychiatric Times. Published 2010. Accessed October 4, 2021. https://www.researchgate.net/profile/Bethany-Brand/publication/231337464_Dissociative_Disorders_An_Overview_of_Assessment_Phenomonology_and_Treatment/links/09e415068c721ef9b5000000/Dissociative-Disorders-An-Overview-of-Assessment-Phenomonology-and-Treatment.pdf
5. Jowett S, Karatzias T, Shevlin M, et al. Differentiating symptom profiles of ICD-11 PTSD, complex PTSD, and borderline personality disorder: a latent class analysis in a multiply traumatized sample. Personality Disorders: theory, research, and treatment. 2020;11(1):36.
6. Ford JD, Courtois CA. Complex PTSD, affect dysregulation, and borderline personality disorder. Bord Personal Disord Emot Dysregul. 2014;1:9. doi.org/10.1186/2051-6673-1-9
7. van der Kolk BA. The trauma spectrum: the interaction of biological and social events in the genesis of the trauma response. J Trauma Stress. 1998;1(3):273-290.
8. Resnick PA, Bovin MJ, Calloway AL, et al. A critical evaluation of the complex PTSD literature: implications for DSM-5. J Trauma Stress. 2012;25(3);241-251.
9. Herman J. CPTSD is a distinct entity: comment on Resick et al. J Trauma Stress. 2012;25(3): 256-257.
10. Karatzias T, Cloitre M. Treating adults with complex posttraumatic stress disorder using a modular approach to treatment: rationale, evidence, and directions for future research. J Trauma Stress. 2019;32(6):870-876.
11. Perry S, Cooper AM, Michels R. The psychodynamic formulation: its purpose, structure, and clinical application. Am J Psych. 1987;144(5):543-550.
12. Diagnostic and statistical manual of mental disorders, 5th ed. American Psychiatric Association; 2013.
13. International Classification of Diseases, 11th revision. 2019; World Health Organization.
14. US Department of Veterans Affairs. PTSD: National Center for PTSD. Complex PTSD. Published January 1, 2007. Accessed October 4, 2021. https://www.ptsd.va.gov/professional/treat/essentials/complex_ptsd.asp
CASE A long history of suicidality
Mr. X, age 26, who has a history of bipolar II disorder and multiple inpatient admissions, presents to a state hospital after a suicide attempt by gunshot. He reports that throughout his lifetime, he has had >20 suicide attempts, often by overdose.
Mr. X is admitted to the hospital under a temporary detention order. He is initially adherent and cooperative with his psychiatric evaluations.
HISTORY Chronic physical and emotional pain
Mr. X is single, unemployed, and lives with his mother and nephew. He was diagnosed with bipolar II disorder during adolescence and receives sertraline, 50 mg twice a day, and lamotrigine, 100 mg twice a day, to which he reports adherence. He also was taking clonazepam and zolpidem, dosages unknown.
His medical history is significant for severe childhood liver disease and inflammatory bowel disease. He dropped out of school during high school due to his multiple medical conditions, which resulted in a significantly diminished overall childhood experience, interrupted developmental trajectory, and chronic physical and emotional pain. He has never been employed and receives financial support through disability benefits. He spends his days on the internet or watching television. He reports daily cigarette and marijuana use and occasional alcohol use, but no other substance use. His mother helps manage his medical conditions and is his main support. His biological father was abusive towards his mother and absent for most of Mr. X’s life. Beyond his mother and therapist, Mr. X has minimal other interpersonal interactions, and reports feeling isolated, lonely, and frustrated.
EVALUATION Agitated and aggressive while hospitalized
Upon learning that he is being involuntarily committed, Mr. X becomes physically aggressive, makes verbal threats, and throws objects across his room. He is given diphenhydramine, 50 mg, haloperidol, 5 mg, and lorazepam, 2 mg, all of which are ordered on an as-needed basis. Mr. X is placed in an emergency restraint chair and put in seclusion. The episode resolves within an hour with reassurance and attention from the treatment team; the rapid escalation from and return to a calmer state is indicative of situational, stress-induced mood lability and impulsivity. Mr. X is counseled on maintaining safety and appropriate behavior, and is advised to ask for medication if he feels agitated or unable to control his behaviors. To maintain safe and appropriate behavior, he requires daily counseling and expectation management regarding his treatment timeline. No further aggressive incidents are noted throughout his hospitalization, and he requires only minimal use of the as-needed medications.
[polldaddy:10983392]
The authors’ observations
The least appropriate therapy for Mr. X would be exposure and response prevention, which allows patients to face their fears without the need to soothe or relieve related feelings with a compulsive act. It is designed to improve specific behavioral deficits most often associated with obsessive-compulsive disorder, a diagnosis inconsistent with Mr. X’s history and presentation. Trauma-focused CBT could facilitate healing from Mr. X’s childhood trauma/adverse childhood experiences, and DBT might help with his anger, maladaptive coping strategies, and chronic suicidality. Motivational interviewing might help with his substance use and his apparent lack of motivation for other forms of social engagement, including seeking employment.
Based on Mr. X’s history of trauma and chronic physical and emotional pain, the treatment team reevaluated him and reconsidered his original diagnosis.
Continue to: EVALUATION A closer look at the diagnosis...
EVALUATION A closer look at the diagnosis
After meeting with Mr. X, the treatment team begins to piece together a more robust picture of him. They review his childhood trauma involving his biological father, his chronic and limiting medical illnesses, and his restricted and somewhat regressive level of functioning. Further, they consider his >20 suicide attempts, numerous psychiatric hospitalizations, and mood and behavioral lability and reactivity. Based on its review, the treatment team concludes that a diagnosis of bipolar disorder II or major depressive disorder is not fully adequate to describe Mr. X’s clinical picture.
At no point during his hospitalization does Mr. X meet full criteria for a major depressive episode or display mania or hypomania. The treatment team considers posttraumatic stress disorder (PTSD) in the setting of chronic, repetitive trauma given Mr. X’s nightmares, dissociative behavior, anger, negative cognitions, and intrusive symptoms. However, not all his symptoms fall within the diagnostic criteria of PTSD. There are also elements of borderline personality disorder in Mr. X’s history, most notably his multiple suicide attempts, emotional lability, and disrupted interpersonal attachments. In this context, a diagnosis of complex PTSD (CPTSD) seems most appropriate in capturing the array of trauma-related symptoms with which he presents.
Complex PTSD
Since at least the early to mid-1990s, there has been recognition of a qualitatively distinct clinical picture that can emerge when an individual’s exposure to trauma or adversity is chronic or repetitive, causing not only familiar PTSD symptomatology but also alterations in self-perception, interpersonal functioning, and affective instability. Complex PTSD was first described by Judith Herman, MD, in 1992 as a distinct entity from PTSD.1 She theorized that PTSD derives primarily from singular traumatic events, while a distinct clinical syndrome might arise after prolonged, repeated trauma.1 A diagnosis of CPTSD might arise in situations with more chronicity than a classic single circumscribed traumatic event, such as being held in captivity, under the control of perpetrators for extended periods of time, imprisoned, or subject to prolonged sexual abuse. Herman’s description of CPTSD identifies 3 areas of psychopathology that extend beyond PTSD1:
- symptomatic refers to the complex, diffuse, and tenacious symptom presentation
- characterological focuses on the personality changes in terms of dissociation, ego-fragmentation, and identity complications
- vulnerability describes characteristic repeated harm with respect to self-mutilation or other self-injurious behaviors, and suicidality.
Taxometrics, official recognition, and controversy
Complex PTSD was proposed for inclusion in DSM-IV as “Disorders of Extreme Stress Not Otherwise Specified,” or DESNOS. Reportedly, it was interpreted as a severe presentation of PTSD, and therefore not included in the manual as a separate diagnosis.2 In contrast, ICD-10 included a CPTSD-like entity of “Enduring Personality Change After Catastrophic Event” (EPCACE). Although the existence of CPTSD as a categorically distinct diagnosis in the psychiatric mainstream has been debated and discussed for years, with many arguably unaware of its existence, clinicians and researchers specializing in trauma are well-versed in its clinical utility. As such, CPTSD was again discussed during the development of DSM-5. In an apparent attempt to balance this clinical utility with ongoing concerns about its validity as a diagnostically distinct syndrome, DSM-5 did not officially recognize CPTSD, but added several criteria to PTSD referencing changes in self-perception, affective instability, and dysphoria, as well as a dissociative subtype, effectively expanding the scope of a PTSD diagnosis to also include CPTSD symptoms when applicable. ICD-11 has taken a different direction, and officially recognizes CPTSD as a distinct diagnosis.
ICD-11 presents CPTSD as a “sibling” disorder, which it distinguishes from PTSD with high levels of dissociation, depression, and borderline personality disorder traits.3 Within this framework, the diagnosis of CPTSD requires that the PTSD criteria be met in addition to symptoms that fall into a “disturbances of self-organization” category. When parsing the symptoms of the “disturbances of self-organization” category, the overlap with borderline personality disorder symptoms is apparent.4 This overlap has given rise to yet another controversy regarding CPTSD’s categorical validity; in addition to its distinctness from PTSD, its distinctness from borderline personality disorder has also been debated. In a study examining the similarity between CPTSD and borderline personality disorder, Jowett et al5 concluded that CPTSD was associated with greater exposure to multiple traumas earlier in life and resulted in higher functional impairment than borderline personality disorder, ultimately supporting CPTSD as a separate entity with features that overlap borderline personality disorder.5 According to Ford and Courtois6 “the evidence ... suggests that a sub-group of BPD patients—who often but not always have comorbid PTSD—may be best understood and treated if CPTSD is explicitly addressed as well—and in some cases, in lieu of—BPD.”
PTSD and CPTSD may therefore both be understood to fall within a spectrum of trauma diagnoses; this paradigm postulates that there exists a wide variety of posttraumatic patient presentations, perhaps on a continuum. On the less severe side of the trauma spectrum, the symptoms traditionally seen and characterized as PTSD (such as hypervigilance, nightmares, and flashbacks) may be found, while, with increasingly severe or prolonged trauma, there may be a tendency to see more complex elements (such as dissociation, personality changes mimicking borderline personality disorder, depression, anxiety, self-injurious behavior, and suicidality).7 Nevertheless, controversy about discriminant validity still exists. A review article by Resnick et al8 argued that the existing evidence is not strong enough to support CPTSD as a standalone entity. However, Resnick et al8 agreed that a singular PTSD diagnosis has limitations, and that there is a need for more research in the field of trauma psychiatry.
Continue to: Utility of the diagnostic conceptualization...
Utility of the diagnostic conceptualization
Although the controversy surrounding the distinction of CPTSD demands categorical clarity with respect to PTSD and borderline personality disorder as a means of resolution, the diagnosis has practical applications that should not limit its use in clinical formulation or treatment planning. Comorbid diagnoses do not prevent clinicians from diagnosing and treating patients who present with complicated manifestations of trauma.9 In fact, having overlapping diagnoses would highlight the array of patient presentations that can be seen in the posttraumatic condition. Furthermore, in the pursuit of individualized care approaches, the addition of CPTSD as a diagnostic conception would allow for more integrated treatment options using a multi-modular approach.10
The addition of CPTSD as a diagnosis is helpful in determining the etiology of a patient’s presentation and therefore formulating the most appropriate treatment plan. While the 2-pronged approach of psychopharmacology and therapy is the central dogma of psychiatric care, there are many specific options to consider for each. By viewing such patients through the lens of trauma as opposed to depression and anxiety, there is a clear shift in treatment that has the potential to make more lasting impacts and progress.11
CPTSD may coexist with PTSD, but it extends beyond it to include a pleomorphic symptom picture encompassing personality changes and a high risk for repeated harm. Failure to correctly classify a patient’s presentation as a response to repetitive, prolonged trauma may result in discrimination and inappropriate or ineffective treatment recommendations.
For a comparison of the diagnostic criteria of PTSD, CPTSD, and borderline personality disorder, see Table 112, Table 2,13,14, and Table 312.
Patients with CPTSD
One of the authors (NR) has cared for several similar individuals presenting for treatment with vague diagnoses of “chronic depression and anxiety” for years, sometimes with a speculative bipolar disorder diagnosis due to situational mood swings or reactivity, and a generally poor response to both medications and psychotherapy. These patients were frustrated because none of the diagnoses seemed to fully “fit” with their pattern of symptoms or subjective experience, and treatment seemed minimally helpful. Very often, their social history revealed a variety of adversities or traumatic events, such as childhood sexual or physical abuse, a home environment plagued by domestic violence, or being raised by one or both parents with their own history of trauma, or perhaps a personality or substance use disorder. Although many of these patients’ symptom profiles aligned only partially with “typical” PTSD, they were often better captured by CPTSD, with a focus on negative self-perception and impact on close relationships. Helping the patient “connect the dots” to create a more continuous narrative, and consequently reconceptualizing the diagnosis as a complex trauma disorder, has proven effective in a number of these cases, allowing the patient to make sense of their symptoms in the context of their personal history, reducing stigma, and allowing for different avenues with medication, therapy, and self-understanding. It can also help to validate the impact of a patient’s adverse experiences and encourage a patient to view their symptoms as an understandable or even once-adaptive response to traumatic stress, rather than a sign of personal weakness or defectiveness.
TREATMENT A trauma-focused approach
Once the treatment team considersMr. X’s significant childhood trauma and reconceptualizes his behaviors through this lens, treatment is adjusted accordingly. His significant reactivity, dissociative symptoms, social impairment, and repeated suicide attempts are better understood and have more significance through a trauma lens, which provides a better explanation than a primary mood disorder.
Therapeutic interventions in the hospital are tailored according to the treatment team’s new insight. Specific DBT skills are practiced, insight-oriented therapy and motivational interviewing are used, and Mr. X and his therapist begin to explore his trauma, both from his biological father and from his intense stressors experienced because of his medical issues.
Mr. X’s mother, who is very involved in his care, is provided with education on this conceptualization and given instruction on trauma-focused therapies in the outpatient setting. While Mr. X’s medication regimen is not changed significantly, for some patients, the reformulation from a primary mood or anxiety disorder to a trauma disorder might require a change in the pharmacotherapy regimen to address behavioral symptoms such as mood reactivity or issues with sleep.
OUTCOME Decreased intensity of suicidal thoughts
By the time of discharge, Mr. X has maintained safety, with no further outbursts, and subjectively reports feeling more understood and validated. Although chronic suicidal ideation can take months or years of treatment to resolve, at the time of discharge Mr. X reports a decreased intensity of these thoughts, and no acute suicidal ideation, plan, or intent. His discharge planning emphasizes ongoing work specifically related to coping with symptoms of traumatic stress, and the involvement of his main social support in facilitating this work.
The authors’ observations
As a caveat, it may be in some cases that chronic negative affect, dysphoria, and self-perception are better understood as a comorbid depressive disorder rather than subsumed into a PTSD/ CPTSD diagnosis. Also, because situational mood instability and impulsivity are often interpreted as bipolar disorder, a history of hypomania and mania should be ruled out. In Mr. X’s case, the diagnostic reformulation did not significantly impact pharmacotherapy because the target symptoms of mood instability, irritability, anxiety, and depression remained, despite the change in diagnosis.
Although the DSM-5 PTSD criteria effectively incorporate many CPTSD elements, we argue that this inclusivity comes at the expense of appreciating CPTSD as a qualitatively distinct condition, and we prefer ICD-11’s recognition of CPTSD as a separate diagnosis that incorporates PTSD criteria but extends the definition to include negative self-concept, affect dysregulation, and interpersonal difficulties.
Related Resources
- US Department of Veterans Affairs. PTSD: National Center for PTSD. Published January 1, 2007. https://www.ptsd.va.gov/ professional/treat/essentials/complex_ptsd.asp
- Jowett S, Karatzias T, Shevlin M, et al. Differentiating symptom profiles of ICD-11 PTSD, complex PTSD, and borderline personality disorder: a latent class analysis in a multiply traumatized sample. Personality disorders: theory, research, and treatment. 2020;11(1):36.
Drug Brand Names
Clonazepam • Klonopin
Haloperidol • Haldol
Lamotrigine • Lamictal
Lorazepam • Ativan
Sertraline • Zoloft
Zolpidem • Ambien
Bottom Line
Consider a diagnosis of complex posttraumatic stress disorder (CPTSD) when providing care for patients with chronic depression and suicidality with a history of trauma or childhood adversity. This reformulation can allow clinicians to understand the contributing factors more holistically; align with the patient more effectively; appreciate past and present interpersonal, psychological, and psychosocial factors that may precipitate and perpetuate symptoms; and allow for treatment recommendations beyond those of mood and anxiety disorders.
1. Herman JL. Complex PTSD: a syndrome in survivors of prolonged and repeated trauma. J Trauma Stress. 1992;5(3):377-391.
2. Friedman MJ. Finalizing PTSD in DSM-5: getting here from there and where to go next. J Trauma Stress. 2013;26(5):548-556. doi: 10.1002/jts.21840 3. Hyland P, Shevlin M, Fyvie C, et al. Posttraumatic stress disorder and complex posttraumatic stress disorder in DSM-5 and ICD-11: clinical and behavioral correlates. J Trauma Stress. 2018; 31(12):174-180.
4. Brand B, Loewenstein R. Dissociative disorders: an overview of assessment, phenomenology and treatment. Psychiatric Times. Published 2010. Accessed October 4, 2021. https://www.researchgate.net/profile/Bethany-Brand/publication/231337464_Dissociative_Disorders_An_Overview_of_Assessment_Phenomonology_and_Treatment/links/09e415068c721ef9b5000000/Dissociative-Disorders-An-Overview-of-Assessment-Phenomonology-and-Treatment.pdf
5. Jowett S, Karatzias T, Shevlin M, et al. Differentiating symptom profiles of ICD-11 PTSD, complex PTSD, and borderline personality disorder: a latent class analysis in a multiply traumatized sample. Personality Disorders: theory, research, and treatment. 2020;11(1):36.
6. Ford JD, Courtois CA. Complex PTSD, affect dysregulation, and borderline personality disorder. Bord Personal Disord Emot Dysregul. 2014;1:9. doi.org/10.1186/2051-6673-1-9
7. van der Kolk BA. The trauma spectrum: the interaction of biological and social events in the genesis of the trauma response. J Trauma Stress. 1998;1(3):273-290.
8. Resnick PA, Bovin MJ, Calloway AL, et al. A critical evaluation of the complex PTSD literature: implications for DSM-5. J Trauma Stress. 2012;25(3);241-251.
9. Herman J. CPTSD is a distinct entity: comment on Resick et al. J Trauma Stress. 2012;25(3): 256-257.
10. Karatzias T, Cloitre M. Treating adults with complex posttraumatic stress disorder using a modular approach to treatment: rationale, evidence, and directions for future research. J Trauma Stress. 2019;32(6):870-876.
11. Perry S, Cooper AM, Michels R. The psychodynamic formulation: its purpose, structure, and clinical application. Am J Psych. 1987;144(5):543-550.
12. Diagnostic and statistical manual of mental disorders, 5th ed. American Psychiatric Association; 2013.
13. International Classification of Diseases, 11th revision. 2019; World Health Organization.
14. US Department of Veterans Affairs. PTSD: National Center for PTSD. Complex PTSD. Published January 1, 2007. Accessed October 4, 2021. https://www.ptsd.va.gov/professional/treat/essentials/complex_ptsd.asp
Study finds nadolol noninferior to propranolol for infantile hemangiomas
according to a study published in JAMA Pediatrics.

“In our experience, nadolol is preferable to propranolol given its observed efficacy and similar safety profile [and] its more predictable metabolism that does not involve the liver,” lead author Elena Pope, MD, told this news organization. “In addition, the fact that nadolol is less lipophilic than propranolol makes it less likely to cross the blood-brain barrier and potentially affect the central nervous system,” added Dr. Pope, who is head of the division of pediatric dermatology at the Hospital for Sick Children, Toronto, and professor of pediatric medicine at the University of Toronto.
The prospective double-blind, randomized noninferiority study was conducted between 2016 and 2020 at two tertiary academic pediatric dermatology clinics in Ontario, Canada. It included 71 infants with a corrected gestational age of 1-6 months whose hemangiomas were greater than 1.5 cm on the face or 3 cm or greater on another body part and had the potential to cause functional impairment or cosmetic disfigurement.
Patients were randomized to either nadolol (oral suspension, 10 mg/mL) or propranolol (oral suspension, 5 mg/mL) beginning at a dose of 0.5 mg/kg per day twice a day and titrated weekly by 0.5 mg/kg per day until the maximum dose of 2 mg/kg per day. The dose was then adjusted until week 24, based on patient weight and clinical response, after which parents could choose to continue the infant on the assigned medication or switch to the other one. Follow-up visits occurred every 2 months after that until week 52.
For the main study outcome, measured by visual analog scale (VAS) scores at week 24, the between-group differences of IH size and color from baseline were 8.8 and 17.1, respectively, in favor of the nadolol group, the researchers report, with similar results seen at week 52. Safety data were similar for both treatments, “demonstrating that nadolol was noninferior to propranolol,” they write.
Additionally, the mean size involution, compared with baseline was 97.9% in the nadolol group and 89.1% in the propranolol group, and the mean color fading was 94.5% in the nadolol group, compared with 80.5% in the propranolol group. During the study, nadolol was also “59% faster in achieving 75% shrinkage of IH, compared with propranolol (P = .02) and 105% faster in achieving 100% shrinkage (P = .07),” they add.
“A considerable portion of patients experienced at least one mild adverse event (77.1% vs. 94.4% at 0-24 weeks and 84.2% vs. 74.2% at 24-52 weeks in the nadolol group vs. the propranolol group, respectively), with a median of two in each intervention group,” they noted, adding that while these numbers are high, they are similar to those in previous clinical trials.
“The efficacy data coupled with a more predictable pharmacokinetic profile and lower chance of crossing the blood-brain barrier may make nadolol a favorable alternative intervention in patients with IHs,” the authors conclude. However, they add that “further studies are needed to prove superiority over propranolol.”
Asked to comment on the results, Ilona J. Frieden, MD, director of the Birthmarks & Vascular Anomalies Center at the University of California, San Francisco, said that while this is a “very interesting study and deserves further consideration,” the findings do not reach the level at which they would change guidelines. “The vast majority of patients being treated with a systemic medication for IH are in fact getting propranolol,” said Dr. Frieden, coauthor of the American Academy of Pediatrics Clinical Practice Guideline for the Management of Infantile Hemangiomas.

“Though this study – designed as a noninferiority study – does seem to show slightly better outcomes from nadolol versus propranolol … it is a relatively small study,” she told this news organization. “Infantile hemangiomas are a very heterogeneous group, and larger studies and longer-term outcome data would be needed to truly compare the two modalities of treatment.”
Concern over the safety of nadolol was raised in a case report published in Pediatrics, which described the death of a 10-week-old girl 7 weeks after starting nadolol for IH. The infant was found to have an elevated postmortem cardiac blood nadolol level of 0.94 mg/L. “Although we debated the conclusion of that report in terms of death attribution to nadolol, one practical pearl is to instruct the parents to discontinue nadolol if the baby has no bowel movements for more than 3 days,” Dr. Pope advised.
The author of that case report, Eric McGillis, MD, program director of clinical pharmacology and toxicology and an emergency physician at Alberta Health Services, in Calgary, Alt., said the conclusion of his report has been taken out of context. “We acknowledge that our case report, like any case report, cannot prove causation,” he told this news organization. “We hypothesized that nadolol may have contributed to the death of the infant based on the limited pharmacokinetic data currently available for nadolol in infants. Nadolol is largely eliminated in the feces and infants may have infrequent stooling based on diet and other factors; therefore, nadolol may accumulate,” he noted.
The infant in the case report did not have a bowel movement for 10 days “and had an elevated postmortem cardiac nadolol concentration in the absence of another obvious cause of death. More pharmacokinetic studies on nadolol in this population are needed to substantiate our hypothesis. However, in the meantime, we agree that having parents monitor stool output for dose adjustments makes practical sense and can potentially reduce harm.”
Dr. Pope presented the results of the study earlier this year at the annual meeting of the Society for Pediatric Dermatology.
The study was supported by Physician Services, Ont. Dr. Pope has reported serving as an advisory board member for Boehringer Ingelheim, Novartis, Sanofi Genzyme, and Timber. Other authors have reported receiving personal fees from Pierre Fabre during the conduct of the study, as well as personal fees from Amgen, Ipsen, Novartis, Pfizer, and Sanofi Genzyme; grants from AbbVie, Clementia, Mayne Pharma, and Sanofi Genzyme; and grants and personal fees from Venthera. One author has a patent for a new topical treatment of IH. Dr. Frieden has reported being a consultant for Pfizer (data safety board), Novartis, and Venthera. Dr. McGillis has reported no relevant financial relationships.
Commentary by Lawrence W. Eichenfield, MD
The treatment of functionally significant and deforming hemangiomas has been revolutionized by propranolol, developed after the observation by Christine Léauté-Labrèze, MD, that a child who developed hypertension as a side effect of systemic steroids for a nasal hemangioma and was prescribed propranolol for the hypertension had rapid shrinkage of the hemangioma. The study by Pope and colleagues assesses nadolol as an alternative to propranolol, showing noninferiority and in some parameters improved outcomes and speed of response. The drug appeared to be fairly well tolerated in the study, though there is a prior published case report of a death from nadolol use for hemangioma treatment from a different Canadian center. Nadolol may be an important alternative to propranolol; however, propranolol remains the only FDA-approved medication for infantile hemangiomas and the generally recommended medication in the American Academy of Pediatrics guidelines for management of infantile hemangiomas.
Dr. Eichenfield is chief of pediatric and adolescent dermatology at Rady Children's Hospital-San Diego. He is vice chair of the department of dermatology and professor of dermatology and pediatrics at the University of California, San Diego. He disclosed that he has served as an investigator and/or consultant to AbbVie, Lilly, Pfizer, Regeneron, Sanofi-Genzyme, and Verrica.
A version of this article first appeared on Medscape.com.
This article was updated 6/18/22.
according to a study published in JAMA Pediatrics.
“In our experience, nadolol is preferable to propranolol given its observed efficacy and similar safety profile [and] its more predictable metabolism that does not involve the liver,” lead author Elena Pope, MD, told this news organization. “In addition, the fact that nadolol is less lipophilic than propranolol makes it less likely to cross the blood-brain barrier and potentially affect the central nervous system,” added Dr. Pope, who is head of the division of pediatric dermatology at the Hospital for Sick Children, Toronto, and professor of pediatric medicine at the University of Toronto.
The prospective double-blind, randomized noninferiority study was conducted between 2016 and 2020 at two tertiary academic pediatric dermatology clinics in Ontario, Canada. It included 71 infants with a corrected gestational age of 1-6 months whose hemangiomas were greater than 1.5 cm on the face or 3 cm or greater on another body part and had the potential to cause functional impairment or cosmetic disfigurement.
Patients were randomized to either nadolol (oral suspension, 10 mg/mL) or propranolol (oral suspension, 5 mg/mL) beginning at a dose of 0.5 mg/kg per day twice a day and titrated weekly by 0.5 mg/kg per day until the maximum dose of 2 mg/kg per day. The dose was then adjusted until week 24, based on patient weight and clinical response, after which parents could choose to continue the infant on the assigned medication or switch to the other one. Follow-up visits occurred every 2 months after that until week 52.
For the main study outcome, measured by visual analog scale (VAS) scores at week 24, the between-group differences of IH size and color from baseline were 8.8 and 17.1, respectively, in favor of the nadolol group, the researchers report, with similar results seen at week 52. Safety data were similar for both treatments, “demonstrating that nadolol was noninferior to propranolol,” they write.
Additionally, the mean size involution, compared with baseline was 97.9% in the nadolol group and 89.1% in the propranolol group, and the mean color fading was 94.5% in the nadolol group, compared with 80.5% in the propranolol group. During the study, nadolol was also “59% faster in achieving 75% shrinkage of IH, compared with propranolol (P = .02) and 105% faster in achieving 100% shrinkage (P = .07),” they add.
“A considerable portion of patients experienced at least one mild adverse event (77.1% vs. 94.4% at 0-24 weeks and 84.2% vs. 74.2% at 24-52 weeks in the nadolol group vs. the propranolol group, respectively), with a median of two in each intervention group,” they noted, adding that while these numbers are high, they are similar to those in previous clinical trials.
“The efficacy data coupled with a more predictable pharmacokinetic profile and lower chance of crossing the blood-brain barrier may make nadolol a favorable alternative intervention in patients with IHs,” the authors conclude. However, they add that “further studies are needed to prove superiority over propranolol.”
Asked to comment on the results, Ilona J. Frieden, MD, director of the Birthmarks & Vascular Anomalies Center at the University of California, San Francisco, said that while this is a “very interesting study and deserves further consideration,” the findings do not reach the level at which they would change guidelines. “The vast majority of patients being treated with a systemic medication for IH are in fact getting propranolol,” said Dr. Frieden, coauthor of the American Academy of Pediatrics Clinical Practice Guideline for the Management of Infantile Hemangiomas.
“Though this study – designed as a noninferiority study – does seem to show slightly better outcomes from nadolol versus propranolol … it is a relatively small study,” she told this news organization. “Infantile hemangiomas are a very heterogeneous group, and larger studies and longer-term outcome data would be needed to truly compare the two modalities of treatment.”
Concern over the safety of nadolol was raised in a case report published in Pediatrics, which described the death of a 10-week-old girl 7 weeks after starting nadolol for IH. The infant was found to have an elevated postmortem cardiac blood nadolol level of 0.94 mg/L. “Although we debated the conclusion of that report in terms of death attribution to nadolol, one practical pearl is to instruct the parents to discontinue nadolol if the baby has no bowel movements for more than 3 days,” Dr. Pope advised.
The author of that case report, Eric McGillis, MD, program director of clinical pharmacology and toxicology and an emergency physician at Alberta Health Services, in Calgary, Alt., said the conclusion of his report has been taken out of context. “We acknowledge that our case report, like any case report, cannot prove causation,” he told this news organization. “We hypothesized that nadolol may have contributed to the death of the infant based on the limited pharmacokinetic data currently available for nadolol in infants. Nadolol is largely eliminated in the feces and infants may have infrequent stooling based on diet and other factors; therefore, nadolol may accumulate,” he noted.
The infant in the case report did not have a bowel movement for 10 days “and had an elevated postmortem cardiac nadolol concentration in the absence of another obvious cause of death. More pharmacokinetic studies on nadolol in this population are needed to substantiate our hypothesis. However, in the meantime, we agree that having parents monitor stool output for dose adjustments makes practical sense and can potentially reduce harm.”
Dr. Pope presented the results of the study earlier this year at the annual meeting of the Society for Pediatric Dermatology.
The study was supported by Physician Services, Ont. Dr. Pope has reported serving as an advisory board member for Boehringer Ingelheim, Novartis, Sanofi Genzyme, and Timber. Other authors have reported receiving personal fees from Pierre Fabre during the conduct of the study, as well as personal fees from Amgen, Ipsen, Novartis, Pfizer, and Sanofi Genzyme; grants from AbbVie, Clementia, Mayne Pharma, and Sanofi Genzyme; and grants and personal fees from Venthera. One author has a patent for a new topical treatment of IH. Dr. Frieden has reported being a consultant for Pfizer (data safety board), Novartis, and Venthera. Dr. McGillis has reported no relevant financial relationships.
Commentary by Lawrence W. Eichenfield, MD
The treatment of functionally significant and deforming hemangiomas has been revolutionized by propranolol, developed after the observation by Christine Léauté-Labrèze, MD, that a child who developed hypertension as a side effect of systemic steroids for a nasal hemangioma and was prescribed propranolol for the hypertension had rapid shrinkage of the hemangioma. The study by Pope and colleagues assesses nadolol as an alternative to propranolol, showing noninferiority and in some parameters improved outcomes and speed of response. The drug appeared to be fairly well tolerated in the study, though there is a prior published case report of a death from nadolol use for hemangioma treatment from a different Canadian center. Nadolol may be an important alternative to propranolol; however, propranolol remains the only FDA-approved medication for infantile hemangiomas and the generally recommended medication in the American Academy of Pediatrics guidelines for management of infantile hemangiomas.
Dr. Eichenfield is chief of pediatric and adolescent dermatology at Rady Children's Hospital-San Diego. He is vice chair of the department of dermatology and professor of dermatology and pediatrics at the University of California, San Diego. He disclosed that he has served as an investigator and/or consultant to AbbVie, Lilly, Pfizer, Regeneron, Sanofi-Genzyme, and Verrica.
A version of this article first appeared on Medscape.com.
This article was updated 6/18/22.
FROM JAMA PEDIATRICS
‘I Can Go Anywhere’: How Service Dogs Help Veterans With PTSD
It was supper time in the Whittier, California, home of Air Force veteran Danyelle Clark-Gutierrez, and eagerly awaiting a bowl of kibble and canned dog food was Lisa, a 3-year-old yellow Labrador retriever.
Her nails clicking on the kitchen floor as she danced about, Lisa looked more like an exuberant puppy than the highly trained service animal that helps Clark-Gutierrez manage the symptoms of post-traumatic stress disorder.
“Having her now, it’s like I can go anywhere,” Clark-Gutierrez said. “And, yes, if somebody did come at me, I’d have warning — I could run.”
A growing body of research into PTSD and service animals paved the way for President Joe Biden to sign into law the Puppies Assisting Wounded Servicemembers (PAWS) for Veterans Therapy Act. The legislation, enacted in August, requires the Department of Veterans Affairs to open its service dog referral program to veterans with PTSD and to launch a five-year pilot program in which veterans with PTSD train service dogs for other veterans.
Clark-Gutierrez, 33, is among the 25 percent of female veterans who have reported experiencing military sexual trauma while serving in the U.S. armed services.
Military sexual trauma, combat violence and brain injuries are some of the experiences that increase the risk that service members will develop PTSD. Symptoms include flashbacks to the traumatic event, severe anxiety, nightmares and hypervigilance — all normal reactions to experiencing or witnessing violence, according to psychologists. Someone receives a PTSD diagnosis when symptoms worsen or remain for months or years.
That’s what Clark-Gutierrez said happened to her after ongoing sexual harassment by a fellow airman escalated to a physical attack about a decade ago. A lawyer with three children, she said that to feel safe leaving her home she needed her husband by her side. After diagnosing Clark-Gutierrez with PTSD, doctors at VA hospitals prescribed a cascade of medications for her. At one point, Clark-Gutierrez said, her prescriptions added up to more than a dozen pills a day.
“I had medication, and then I had medication for the two or three side effects for each medication,” she said. “And every time they gave me a new med, they had to give me three more. I just couldn’t do it anymore. I was just getting so tired. So we started looking at other therapies.”
And that’s how she got her service dog, Lisa. Clark-Gutierrez’s husband, also an Air Force veteran, discovered the nonprofit group K9s for Warriors, which rescues dogs — many from kill shelters — and trains them to be service animals for veterans with PTSD. Lisa is one of about 700 dogs the group has paired with veterans dealing with symptoms caused by traumatic experiences.
“Now with Lisa we take bike rides, we go down to the park, we go to Home Depot,” said Clark-Gutierrez. “I go grocery shopping — normal-people things that I get to do that I didn’t get to do before Lisa.”
That comes as no surprise to Maggie O’Haire, an associate professor of human-animal interaction at Purdue University. Her research suggests that while service dogs aren’t necessarily a cure for PTSD, they do ease its symptoms. Among her published studies is one showing that veterans partnered with these dogs experience less anger and anxiety and get better sleep than those without a service dog. Another of her studies suggests that service dogs lower cortisol levels in veterans who have been traumatized.
“We actually saw patterns of that stress hormone that were more similar to healthy adults who don’t have post-traumatic stress disorder,” O’Haire said.
A congressionally mandated VA study that focuses on service dogs’ impact on veterans with PTSD and was published this year suggests that those partnered with the animals experience less suicidal ideation and more improvement to their symptoms than those without them.
Until now, the federal dog referral program — which relies on nonprofit service dog organizations to pay for the dogs and to provide them to veterans for free — required that participating veterans have a physical mobility issue, such as a lost limb, paralysis or blindness. Veterans like Clark-Gutierrez who have PTSD but no physical disability were on their own in arranging for a service dog.
The pilot program created by the new federal law will give veterans with PTSD the chance to train mental health service dogs for other veterans. It’s modeled on a program at the VA hospital in Palo Alto, California, and will be offered at five VA medical centers nationwide in partnership with accredited service dog training organizations.
“This bill is really about therapeutic, on-the-job training, or ‘training the trainer,’” said Adam Webb, a spokesperson for Sen. Thom Tillis (R-N.C.), who introduced the legislation in the Senate. “We don’t anticipate VA will start prescribing PTSD service dogs, but the data we generate from this pilot program will likely be useful in making that case in the future.”
The Congressional Budget Office estimates the pilot program will cost the VA about $19 million. The law stops short of requiring the VA to pay for the dogs. Instead, the agency will partner with accredited service dog organizations that use private money to cover the cost of adopting, training and pairing the dogs with veterans.
Still, the law represents a welcome about-face in VA policy, said Rory Diamond, CEO of K9s for Warriors.
“For the last 10 years, the VA has essentially told us that they don’t recognize service dogs as helping a veteran with post-traumatic stress,” Diamond said.
PTSD service dogs are often confused with emotional support dogs, Diamond said. The latter provide companionship and are not trained to support someone with a disability. PTSD service dogs cost about $25,000 to adopt and train, he said.
Diamond explained that the command “cover” means “the dog will sit next to the warrior, look behind them and alert them if someone comes up from behind.” The command “block” means the dog will “stand perpendicular and give them some space from whatever’s in front of them.”
Retired Army Master Sgt. David Crenshaw of Kearny, New Jersey, said his service dog, Doc, has changed his life.
“We teach in the military to have a battle buddy,” Crenshaw said. “And these service animals act as a battle buddy.”
A few months ago, Crenshaw experienced this firsthand. He had generally avoided large gatherings because persistent hypervigilance is one symptom of his combat-caused PTSD. But this summer, Doc, a pointer and Labrador mix, helped Crenshaw navigate the crowds at Disney World — a significant first for Crenshaw and his family of five.
“I was not agitated. I was not anxious. I was not upset,” said Crenshaw, 39. “It was truly, truly amazing and so much so that I didn’t even have to even stop to think about it in the moment. It just happened naturally.”
Thanks to Doc, Crenshaw said, he no longer takes PTSD drugs or self-medicates with alcohol. Clark-Gutierrez said Lisa, too, has helped her quit using alcohol and stop taking VA-prescribed medications for panic attacks, nightmares and periods of disassociation.
The dogs actually save the VA money over time, Diamond said. “Our warriors are far less likely to be on expensive prescription drugs, are far less likely to use other VA services and far more likely to go to school or go to work. So it’s a win-win-win across the board.”
History of dysphagia and abdominal pain
The diagnosis is squamous cell carcinoma. A central or hilar mass is most likely to be a squamous cell carcinoma or a small cell tumor and less commonly an adenocarcinoma. Histologically, when there is lack of cohesion among the epithelial cells due to malignant changes, the cells get arranged in a concentric manner. The fate of a squamous cell is to form keratin, so these cells lay down keratin in a concentric manner and then appear as keratin pearls.
This patient's tumor is found to have programmed cell death–ligand 1 ≥ 1% and has no actionable molecular markers. The patient has a performance status score of 1. In a patient with advanced or metastatic squamous cell carcinoma with a performance status score of 1, the National Comprehensive Cancer Network recommends pembrolizumab/carboplatin/paclitaxel or pembrolizumab/carboplatin/albumin-bound paclitaxel as preferred regimens. The pembrolizumab component is based on the results of the KEYNOTE-407 trial. In patients with previously untreated metastatic, squamous non-small cell lung cancer, the addition of pembrolizumab to chemotherapy with carboplatin plus paclitaxel or nab-paclitaxel resulted in significantly longer overall survival and progression-free survival than chemotherapy alone.
Maurie Markman, MD, President, Department of Medical Oncology, Cancer Treatment Centers of America.
Maurie Markman, MD, has disclosed the following relevant financial relationships:
Serve(d) as a director, officer, partner, employee, advisor, consultant, or trustee for: Merck
Serve(d) as a speaker or a member of a speakers bureau for: AstraZeneca; Novis; Glaxo Smith Kline
Received research grant from: AstraZeneca; Novis; GSK; Merck

A 59-year-old woman presents with a 4-month history of dysphagia when eating solids in addition to nausea and abdominal pain. She also reports recent hemoptysis and the onset of hoarseness. She has had an unintentional 22-lb weight loss over the past 6 months. She has a history of emphysema. She takes no medication. She has a 26 pack-year history of cigarette smoking. She is 5 feet 4 in tall and weighs 105 lb, with a BMI of 18. Her vital signs are within normal limits. Chest auscultation reveals diminished breath sounds over the right lung fields. Chest radiography reveals a right-sided 6-cm hilar mass. Laboratory studies show a serum calcium level of 12 mg/dL (normal range, 8.5-10.5 mg/dL). A CT scan revealed a spiculated lesion and hepatic metastases. A biopsy was performed. Keratinization was found in the form of keratin pearls.
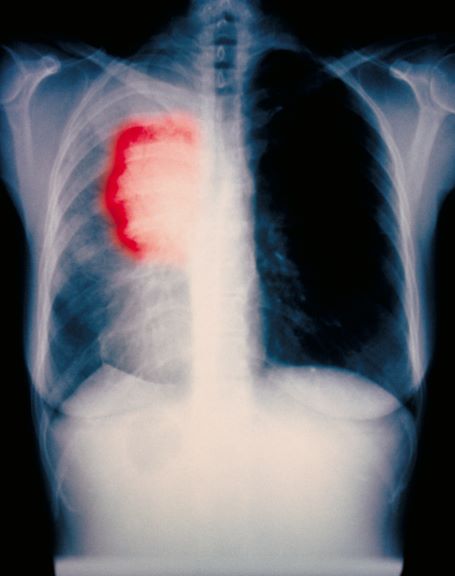
Editor’s note on 50th Anniversary series
While this is the last piece in a series, my intention is for it to read more like the opening of a new book on family medicine, rather than an ending to a story about the specialty.
April Lockley, DO, represents a new generation of family physicians who began their careers in the 21st century, and she is hopeful that the experiences of practicing family medicine and being the patient of a family physician will change in several ways.
Among her desires for the future, is to be able to write a prescription for a medication or physical therapy to a patient who is able “to fill the prescription without having to worry about the financial implications of paying for it,” she writes. She also hopes “patients can seek out care without the fear of discrimination or racism through an increasingly diverse work force.”
In her article, Dr. Lockley both expresses how she wants family medicine to change and what she already finds satisfying about being a family physician.
I hope you enjoyed reading about the professional journeys of Dr. Lockley and other family physicians who have written commentaries or interviewed for articles in Family Practice News’ 50th Anniversary series this year.
To revisit any of these articles, go to the 50th Anniversary bucket on mdedge.com/familymedicine.
Thank you for continuing to read Family Practice News, and I hope to celebrate more milestones with you in the future.
[email protected]
Optimizing perioperative cardiac risk assessment and management for noncardiac surgery
Background: There are extensive publications regarding preoperative risk assessment and optimization of risk management. This article is a review of current aggregate data from various meta-analyses and observational studies. It explores a systematic approach to preoperative risk assessment.
Study design: Literature review of meta-analyses and observational studies.
Setting: A review of the current literature available in the MEDLINE database and Cochrane Library from 1949 to January 2020, favoring meta-analyses and clinical practice guidelines.
Synopsis: A total of 92 publications were included in this review, which found history, physical exam, and functional capacity to be the best assessments of cardiac risk and should guide further preoperative management. Cardiovascular testing is rarely indicated except in those with clinical signs and symptoms of active cardiac conditions or with poor functional status undergoing high-risk surgery. Cardiac consultation should be considered for those with prior stents; high-risk conditions, including acute coronary syndrome, severe valvular disease, or active heart failure, among other conditions; or high-risk findings on cardiovascular testing. Preoperative medications should be individualized to patient-specific conditions. This study is limited by current available evidence and expert opinion, and the systematic approach suggested here has not been prospectively tested.
Bottom line: Preoperative risk assessment and management should be largely based on individualized history, physical exam, and functional status. Cardiovascular work-up should be pursued only if it would influence surgical decision-making and perioperative care.
Citation: Smilowitz NR, Berger JS. Perioperative cardiovascular risk assessment and management for noncardiac surgery: A review. JAMA. 2020 Jul 21;324:279-90. doi:
Dr. Young is a hospitalist at Northwestern Memorial Hospital and instructor of medicine, Feinberg School of Medicine, both in Chicago.
Could stem cells have a role in treating mental illnesses?
While laboratory studies move forward at full speed, the clinical use of stem cells—undifferentiated cells that can develop into many different types of specialized cells—remains controversial. Presently, only unadulterated stem cells are allowed to be used in patients, and only on an experimental and investigational basis. Stem cells that have been expanded, modified, or enhanced outside of the body are not allowed to be used for clinical application in the United States at this time. In June 2021, the FDA strengthened the language of stem cell regulation, further limiting their clinical application (see https://www.fda.gov/vaccines-blood-biologics/consumers-biologics/important-patient-and-consumer-information-about-regenerative-medicine-therapies). Yet some applications, such as treatment of lymphoma or restorative knee injections, are covered by some health insurance plans, and the acceptance of stem cell treatment is growing.
In this article, I describe the basics of stem cells, and explore the potential therapeutic use of stem cells for treating various mental illnesses.
Stem cells: A primer
Human embryonic stem cells were initially investigated for their healing properties. However, the need to harvest these cells from embryos drew much criticism, and many found the process to be ethically and religiously unacceptable. This was resolved by the Nobel prize–winning discovery that adult somatic cells can be reprogrammed into cells with embryonic stem cell properties by introducing specific transcription factors. These cells have been termed “induced pluripotent stem cells” (iPSCs).1 The use of adult stem cells and stem cells from the umbilical cords of healthy newborns has allowed for wider acceptance of stem cell research and treatment.
Stem cells may be collected from the patient himself or herself; these are autologous stem cells. They may also be harvested from healthy newborn waste, such as the umbilical cord blood and wall; these are allogenic stem cells. Autologous stem cells are present in almost any tissue but are usually collected from the patient’s adipose tissue or from bone marrow. Understandably, younger stem cells possess higher healing properties. Stem cells may be mesenchymal, producing primarily connective and nervous tissue, or hematopoietic, influencing the immune system and blood cell production, though there is a considerable overlap in the function of these types of cells.
Adult somatic stem cells may be turned into stem cells (iPSCs) and then become any tissue, including neurons. This ability of stem cells to physically regenerate the CNS is directly relevant to psychiatry.
In addition to neurogenesis, stem cell transplants can assist in immune and vascular restoration as well as in suppressing inflammation. The ability of stem cells to replace mutated genes may be useful for addressing inheritable neuropsychiatric conditions.
Both autoimmune and inflammatory mechanisms play an important role in most psychiatric illnesses. The more we learn, the more it is clear that brain function is profoundly dependent on more than just its structure, and that structure depends on more than blood supply. Stem cells influence the vascular, nutritional, functional, inflammatory, and immune environment of the brain, potentially assisting in cognitive and emotional rehabilitation.
Stem cells operate in 2 fundamental ways: via direct cell-to-cell interaction, and via the production and release of growth, immune-regulating, and anti-inflammatory factors. Such factors are produced within the cells and then released in the extracellular environment as a content of exosomes. The route of administration is important in the delivery of the stem cells to the target tissue. Unlike their direct introduction into a joint, muscle, or intervertebral disk, injection of stem cells into the brain is more complicated and not routinely feasible. Intrathecal injections may bring stem cells into the CNS, but cerebrospinal fluid does not easily carry stem cells into the brain, and certainly cannot deliver them to an identified target within the brain. Existing technology can allow stem cells to be packaged in such a way that they can penetrate the blood-brain barrier, but this requires stem cell modification, which presently is not permitted in clinical practice in the United States. Alternatively, there is a way to weaken the blood-brain barrier to allow stem cells to travel through the “opened doors,” so to speak, but this allows everything to have access to the CNS, which may be unsafe. IV administration is technologically easy, and it grants stem cells the environment to multiply and produce extracellular factors that can cross the blood-brain barrier, while large cells cannot.
Continue to: Stem cells as a treatment for mental illness...
Stem cells as a treatment for mental illness
Based on our understanding of the function of stem cells, many neurodegenerative-, vascular-, immune-, and inflammation-based psychiatric conditions can be influenced by stem cell treatment. Here I review the potential therapeutic role of stem cells in the treatment of several psychiatric disorders.
Alzheimer’s dementia
Alzheimer’s dementia (AD) is a progressive neurodegenerative pathology based on neuronal and synaptic loss. Repopulation and regeneration of depleted neuronal circuitry by exogenous stem cells may be a rational therapeutic strategy.2 The regeneration of lost neurons has the potential to restore cognitive function. Multiple growth factors that regulate neurogenesis are abundant during child development but dramatically decline with age. The introduction of stem cells—especially those derived from newborn waste—seem to promote recovery from neurodegenerative disease or injury.3
There currently is no cure for AD. Cellular therapy promises new advances in treatment.4 Neurogenesis occurs not only during fetal development but in the adult brain. Neural stem cells reside in the adult CNS of all mammals.5 They are intimately involved in continuous restoration, but age just like the rest of the animal tissue, providing ever-decreasing restorative potential.
The number of studies of stem cells in AD has increased since the early 2000 s,6,7 and research continues to demonstrate robust CNS neurogenesis. In a 2020 study, Zappa Villar et al8 evaluated stem cells as a treatment for rats in which an AD model was induced by the intracerebroventricular injection of streptozotocin (STZ). The STZ-treated rats displayed poor performance in all behavioral tests. Stem cell therapy increased exploratory behavior, decreased anxiety, and improved spatial memory and marble-burying behavior; the latter was representative of daily life activities. Importantly, stem cell therapy ameliorated and restored hippocampal atrophy and some presynaptic protein levels in the rats with AD.8 Animal models cannot be automatically applied to humans, but they shine a light on the areas that need further exploration.
In humans, elevated cortisol levels during aging predict hippocampal atrophy and memory deficits,9 and this deficiency may be positively influenced by stem cell treatment.
Schizophrenia
Recent research indicates that schizophrenia may begin with abnormal neurogenesis from neural stem cells inside the embryo, and that this process may be particularly vulnerable to numerous genetic and/or environmental disturbances of early brain development.10 Because neurogenesis is not confined to the womb but is a protracted process that continues into postnatal life, adolescence and beyond, influencing this process may be a way to add to the schizophrenia treatment armamentarium.10 Sacco et al11 described links between the alteration of intrauterine and adult neurogenesis and the causes of neuropsychiatric disorders, including schizophrenia. Immune and inflammatory mechanisms are important in the etiology of schizophrenia. By their core function, stem cells address both mechanisms, and may directly modulate this devastating disease.
In addition to clinical hopes, advances in research tools hold the promise of new discoveries. With the advent of iPSC technology, it is possible to generate live neurons in vitro from somatic tissue of patients with schizophrenia. Despite its many limitations, this revolutionary technology has already helped to advance our understanding of schizophrenia.11
Bipolar disorder
Many of the fundamental neurobiological mechanisms of schizophrenia are mirrored in bipolar disorder.12 Though we are not ready to bring stem cells into the day-to-day treatment of this condition, several groups are starting to apply iPSC technology to the study of bipolar disorder.13
Neurodevelopmental factors—particularly pathways related to nervous system development, cell migration, extracellular matrix, methylation, and calcium signaling—have been identified in large gene expression studies as altered in bipolar disorder.14 Stem cell technology opens doorways to reverse engineering of human neurodegenerative disease.15
Continue to: Autism spectrum disorders...
Autism spectrum disorders
Autism spectrum disorders (ASDs) are multiple heterogeneous neurodevelopmental disorders.16 Neuroinflammation and immune dysregulation influence the origin of ASDs. Due to the neurobiologic changes underlying ASD development, cell-based therapies, including the use of mesenchymal stem cells (MSCs), have been applied to ASDs.16 Stem cells show specific immunologic properties that make them promising candidates for treating ASDs.17
The exact mechanisms of action of MSCs to restore function in patients with ASDs are largely unknown, but proposed mechanisms include:
- synthesizing and releasing anti-inflammatory cytokines and survival-promoting growth factors
- integrating into the existing neural and synaptic network
- restoring plasticity.18
In a study of transplantation of human cord blood cells and umbilical cord–derived MSCs for patients with ASDs, Bradstreet et al19 found a statistically significant difference on scores for domains of speech, sociability, sensory, and overall health, as well as reductions in the total scores, in those who received transplants compared to their pretreatment values.
In another study of stem cell therapy for ASDs, Lv et al20 demonstrated the safety and efficacy of combined transplantation of human cord blood cells and umbilical cord–derived MSCs in treating children with ASDs. The transplantations included 4 stem cell IV infusions and intrathecal injections once a week. Statistically significant differences were shown at 24 weeks post-treatment. Although this nonrandomized, open-label, single-center Phase I/II trial cannot be relied on for any definitive conclusions, it suggests an important area of investigation.20
The vascular aspects of ASDs’ pathogenesis should not be overlooked. For example, specific temporal lobe areas associated with facial recognition, social interaction, and language comprehension have been demonstrated to be hypoperfused in children with ASDs, but not in controls. The degree of hypoperfusion and resulting hypoxia correlates with the severity of ASD symptoms. The damage causing hypoperfusion of temporal areas was associated with the onset of autism-like disorders. Damage of the amygdala, hippocampus, or other temporal structures induces permanent or transient autistic-like characteristics, such as unexpressive faces, little eye contact, and motor stereotypes. Clinically, temporal lobe damage by viral and other means has been implicated in the development of ASD in children and adults. Hypoperfusion may contribute to defects, not only by inducing hypoxia, but also by allowing for abnormal metabolite or neurotransmitter accumulation. This is one of the reasons glutamate toxicity has been implicated in ASD. The augmentation of perfusion through stimulation of angiogenesis by stem cells should allow for metabolite clearance and restoration of functionality. Vargas et al21 compared brain autopsy samples from 11 children with ASDs to those of 7 age-matched controls. They demonstrated an active neuroinflammatory process in the cerebral cortex, white matter, and cerebellum of patients with ASDs, both by immunohistochemistry and morphology.21
Multiple studies have confirmed that the systemic administration of cord blood cells is sufficient to induce neuroregeneration.22,23 Angiogenesis has been experimentally demonstrated in peripheral artery disease, myocardial ischemia, and stroke, and has direct implications on brain repair.24 Immune dysregulation25,26 and immune modulation27 also are addressed by stem cell treatment, which provides a promising avenue for battling ASDs.
Like attention-deficit/hyperactivity disorder and obsessive-compulsive disorder, ASDs are neurodevelopmental conditions. Advances based on the use of stem cells hold great promise for understanding, diagnosing and, possibly, treating these psychiatric disorders.28,29
Depression
Neuropsychiatric disorders arise from deviations from the regular differentiation process of the CNS, leading to altered neuronal connectivity. Relatively subtle abnormalities in the size and number of cells in the prefrontal cortex and basal ganglia have been observed in patients with depressive disorder and Tourette syndrome.30 Fibroblast-derived iPSCs generate serotonergic neurons through the exposure of the cells to growth factors and modulators of signaling pathways. If these serotonergic neurons are made from the patients’ own cells, they can be used to screen for new therapeutics and elucidate the unknown mechanisms through which current medications may function.31 This development could lead to the discovery of new medication targets and new insights into the molecular biology of depression.32
Deficiencies of brain-derived neurotrophic factor (BDNF) have a role in depression, anxiety, and other neuropsychiatric illnesses. The acute behavioral effects of selective serotonin reuptake inhibitors and tricyclic antidepressants seem to require BDNF signaling, which suggests that BDNF holds great potential as a therapeutic agent. Cell therapies focused on correcting BDNF deficiencies in mice have had some success.33
Dysregulation of GABAergic neurons has also been implicated in depression and anxiety. Patients with major depressive disorder have reduced gamma aminobutyric acid (GABA) receptors in the parahippocampal and lateral temporal lobes.34
Ultimately, the development of differentiation protocols for serotonergic and GABAergic neuronal populations will pave the way for examining the role of these populations in the pathogenesis of depression and anxiety, and may eventually open the door for cell-based therapies in humans.35
Studies have demonstrated a reduction in the density of pyramidal and nonpyramidal neurons in the anterior cingulate cortex of patients with schizophrenia and bipolar disorder,36 glial reduction in the subgenual prefrontal cortex in mood disorders,37 and morphometric evidence for neuronal and glial prefrontal cell pathology in major depressive disorder.38 The potential for stem cells to repair such pathology may be of clinical benefit to many patients.
Aside from their other suggested clinical uses, iPSCs may be utilized in new pathways for research on the biology and pharmacology of major depressive disorder.39
Continue to: Obsessive-compulsive disorder...
Obsessive-compulsive disorder
Obsessive-compulsive disorder (OCD) is often characterized by excessive behaviors related to cleanliness, including grooming, which is represented across most animal species. In mice, behaviors such as compulsive grooming and hair removal—similar to behaviors in humans with OCD or trichotillomania—are associated with a specific mutation. Chen et al40 reported that the transplantation of bone marrow stem cells into mice with this mutation (bone marrow–derived microglia specifically home to the brain) rescues their pathological phenotype by repairing native neurons.
The autoimmune, inflammatory, and neurodegenerative changes that are prevalent in OCD may be remedied by stem cell treatment in a fashion described throughout this article.
Other conditions
The Box41-50 describes a possible role for stem cells in the treatment or prevention of several types of substance use disorders.
Box
Researchers have begun to explore stem cells as a potential treatment for several substance use disorders, including those involving alcohol, cocaine, and opioids, as well as their interactions with cannabinoids.
Alcohol use disorder. In a 2017 study, Israel et al41 gave intra-cerebral injections of mesenchymal stem cells (MSCs) to rats that were bred to have a high alcohol intake. The MSC injections resulted in drastic reductions in the rats’ alcohol consumption. A single intracerebroventricular MSC administration inhibited relapse-like drinking by up to 85% for 40 days.
It is beyond unlikely that direct brain injections would be used to treat alcohol use disorder in humans. To address this problem, researchers aggregated MSCs into smaller spheroid shapes, which reduced their size up to 75% and allowed them to be injected intravenously to reach the brain in a study conducted in rats.42 Within 48 hours of a single treatment, the rats had reduced their intake of alcohol by 90%. The IV administration of antiinflammatory MSCs in human trials will be the next step to verify these results.
Alcohol research using human stem cells is also being conducted as a model system to understand the neural mechanisms of alcohol use disorder.43
Cocaine use disorder. In a grant proposal, Yadid and Popovtzer44 suggested that cocaine addiction affects neurogenesis, especially in the dentate gyrus, ventral tegmental area, nucleus accumbens, and prefrontal cortex; it damages mitochondrial RNA, brain-derived neurotrophic factor (BDNF), glutamate transporter (excitatory amino acid transporter; EAAT), and interleukin-10. MSCs have a predilection to these areas and influence neurogenesis. Currently, there are no FDAapproved medications for the safe and effective treatment of cocaine addiction. MSCs can home to pathological areas in the brain, release growth factors, and serve as cellular delivery tools in various brain disorders. Moreover, restoration of basal glutamate levels via the EAAT has been proposed as a promising target for treating cocaine dependence. Therefore, MSCs differentiated to express EAATs may have a combined long-term effect that can attenuate cocaine craving and relapse.44
Neural stem cells undergo a series of developmental processes before giving rise to newborn neurons, astrocytes, and oligodendrocytes in adult neurogenesis. During the past decade, studies of adult neurogenesis modulated by addictive drugs have highlighted the role of stem cells. These drugs have been shown to regulate the proliferation, differentiation, and survival of adult cells in different manners, which results in the varying consequences of adult neurogenesis.45 Reversal of these influences by healthy stem cells can be a worthy goal to pursue.
Opioid use disorder. Opiate medications cause a loss of newly born neural progenitors in the subgranular zone of the dentate gyrus by either modulating proliferation or interfering with differentiation and maturation.46 Opiates were the first medications shown to negatively impact neurogenesis in the adult mammalian hippocampus.47,48 The restoration of hippocampal function may positively affect the prognosis of a patient who is addicted.
Cannabinoids. Cannabinoids’ influence on the brain and on stem cells is controversial. On one hand, deteriorated neurogenesis results in reduced long-term potentiation in hippocampal formation. These cellular and physiological alterations lead to decreased short-term spatial memory and increased depressionlike behaviors.49 On the other hand, there is emerging evidence that cannabinoids improve neurogenesis and CNS plasticity, at least in the adult mouse.50 Through normalization of immune function, and restoration of the brain and the body, stem cells may assist in better health and in treatment of cannabis use disorder.
Chronic pain is a neuropsychiatric condition that involves the immune system, inflammation, vascularization, trophic changes, and other aspects of the CNS function in addition to peripheral factors and somatic pain generators. Treatment of painful conditions with the aid of stem cells represents a large and ever-developing field that lies outside of the scope of this article.51
Experimental, but promising
It is not easy to accept revolutionary new approaches in medicine. Endless research and due diligence are needed to prove a concept and then to work out specific applications, safeguards, and limitations for any novel treatments. The stem cell terrain is poorly explored, and one needs to be careful when venturing there. Presently, the FDA appropriately sees treatment with stem cells as experimental and investigational, particularly in the mental health arena. Stem cells are not approved for treatment of any specific condition. At the same time, research and clinical practice suggest stem cell treatment may someday play a more prominent role in health care. Undoubtedly, psychiatry will eventually benefit from the knowledge and application of stem cell research and practice.
Related Resources
- De Los Angeles A, Fernando MB, Hall NAL, et al. Induced pluripotent stem cells in psychiatry: an overview and critical perspective. Biol Psychiatry. 2021;90(6):362-372.
- Heider J, Vogel S, Volkmer H, et al. Human iPSC-derived glia as a tool for neuropsychiatric research and drug development. Int J Mol Sci. 2021;22(19):10254.
Drug Brand Name
Streptozotocin • Zanosar
Bottom Line
Treatment with stem cell transplantation is experimental and not approved for any medical or psychiatric illness. However, based on our growing understanding of the function of stem cells, and preliminary research conducted mainly in animals, many neurodegenerative-, vascular-, immune-, and inflammation-based psychiatric conditions might be beneficially influenced by stem cell treatment.
- Takahashi K, Tanabe K, Ohnuki M, et al. Induction of pluripotent stem cells from adult human fibroblasts by defined factors. Cell. 2007;131(5):861-872.
- Duncan T, Valenzuela M. Alzheimer’s disease, dementia, and stem cell therapy. Stem Cell Res Ther. 2017;8(1):111.
- Brinton RD, Wang JM. Therapeutic potential of neurogenesis for prevention and recovery from Alzheimer’s disease: allopregnanolone as a proof of concept neurogenic agent. Curr Alzheimer Res. 2006;3(3):185-190.
- Taupin P. Adult neurogenesis, neural stem cells, and Alzheimer’s disease: developments, limitations, problems, and promises. Curr Alzheimer Res. 2009;6(6):461-470.
- Taupin P. Neurogenesis, NSCs, pathogenesis, and therapies for Alzheimer’s disease. Front Biosci (Schol Ed). 2011;3:178-90.
- Kang JM, Yeon BK, Cho SJ, et al. Stem cell therapy for Alzheimer’s disease: a review of recent clinical trials. J Alzheimers Dis. 2016;54(3):879-889.
- Li M, Guo K, Ikehara S. Stem cell treatment for Alzheimer’s disease. Int J Mol Sci. 2014;15(10):19226-19238.
- Zappa Villar MF, López Hanotte J, Pardo J, et al. Mesenchymal stem cells therapy improved the streptozotocin-induced behavioral and hippocampal impairment in rats. Mol Neurobiol. 2020;57(2):600-615.
- Lupien SJ, de Leon M, de Santi S, et al. Cortisol levels during human aging predict hippocampal atrophy and memory deficits. Nat Neurosci. 1998;1(1):69-73.
- Iannitelli A, Quartini A, Tirassa P, et al. Schizophrenia and neurogenesis: a stem cell approach. Neurosci Biobehav Rev. 2017;80:414-442.
- Sacco R, Cacci E, Novarino G. Neural stem cells in neuropsychiatric disorders. Curr Opin Neurobiol. 2018; 48:131-138.
- Miller ND, Kelsoe JR. Unraveling the biology of bipolar disorder using induced pluripotent stem-derived neurons. Bipolar Disord. 2017;19(7):544-551.
- O’Shea KS, McInnis MG. Neurodevelopmental origins of bipolar disorder: iPSC models. Mol Cell Neurosci. 2016;73:63-83.
- Jacobs BM. A dangerous method? The use of induced pluripotent stem cells as a model for schizophrenia. Schizophr Res. 2015;168(1-2):563-568.
- Liu Y, Deng W. Reverse engineering human neurodegenerative disease using pluripotent stem cell technology. Brain Res. 2016;1638(Pt A):30-41.
- Siniscalco D, Kannan S, Semprún-Hernández N, et al. Stem cell therapy in autism: recent insights. Stem Cells Cloning. 2018;11:55-67.
- Siniscalco D, Bradstreet JJ, Sych N, et al. Mesenchymal stem cells in treating autism: novel insights. World J Stem Cells. 2014;6(2):173-178.
- Siniscalco D, Sapone A, Cirillo A, et al. Autism spectrum disorders: is mesenchymal stem cell personalized therapy the future? J Biomed Biotechnol. 2012; 2012:480289.
- Bradstreet JJ, Sych N, Antonucci N, et al. Efficacy of fetal stem cell transplantation in autism spectrum disorders: an open-labeled pilot study. Cell Transplant. 2014;23(Suppl 1):S105-S112.
- Lv YT, Zhang Y, Liu M, et al. Transplantation of human cord blood mononuclear cells and umbilical cordderived mesenchymal stem cells in autism. J Transl Med. 2013;11:196.
- Vargas DL, Nascimbene C, Krishnan C, et al. Neuroglial activation and neuroinflammation in the brain of patients with autism. Ann Neurol. 2005;57(1):67-81.
- Wei L, Keogh CL, Whitaker VR, et al. Angiogenesis and stem cell transplantation as potential treatments of cerebral ischemic stroke. Pathophysiology. 2005;12(1): 47-62.
- Newman MB, Willing AE, Manresa JJ, et al. Cytokines produced by cultured human umbilical cord blood (HUCB) cells: implications for brain repair. Exp Neurol. 2006;199(1):201-218.
- Peterson DA. Umbilical cord blood cells and brain stroke injury: bringing in fresh blood to address an old problem. J Clin Invest. 2004;114(3):312-314.
- Cohly HH, Panja A. Immunological findings in autism. Int Rev Neurobiol. 2005;71:317-341.
- Ashwood P, Van de Water J. Is autism an autoimmune disease? Autoimmun Rev. 2004;3(7-8):557-562.
- Yagi H, Soto-Gutierrez A, Parekkadan B, et al. Mesenchymal stem cells: mechanisms of immunomodulation and homing. Cell Transplant. 2010;19(6):667-679.
- Vaccarino FM, Urban AE, Stevens HE, et al. Annual Research Review: The promise of stem cell research for neuropsychiatric disorders. J Child Psychol Psychiatry. 2011;52(4):504-516.
- Liu EY, Scott CT. Great expectations: autism spectrum disorder and induced pluripotent stem cell technologies. Stem Cell Rev Rep. 2014;10(2):145-150.
- Richardson-Jones JW, Craige CP, Guiard BP, et al. 5-HT1A autoreceptor levels determine vulnerability to stress and response to antidepressants. Neuron. 2010;65(1):40-52.
- Saarelainen T, Hendolin P, Lucas G, et al. Activation of the TrkB neurotrophin receptor is induced by antidepressant drugs and is required for antidepressant-induced behavioral effects. J Neurosci. 2003;23(1):349-357.
- Klumpers UM, Veltman DJ, Drent ML, et al. Reduced parahippocampal and lateral temporal GABAA-[11C] flumazenil binding in major depression: preliminary results. Eur J Nucl Med Mol Imaging. 2010;37(3): 565-574.
- Bremner JD, Narayan M, Anderson ER, et al. Hippocampal volume reduction in major depression. Am J Psychiatry. 2000;157(1):115-118.
- Bremner JD, Randall P, Scott TM, et al. MRI-based measurement of hippocampal volume in patients with combat-related posttraumatic stress disorder. Am J Psychiatry. 1995;152(7):973-981.
- Vincent SL, Todtenkopf MS, Benes FM. A comparison of the density of pyramidal and non-pyramidal neurons in the anterior cingulate cortex of schizophrenics and manic depressives. Soc Neurosci Abstr. 1997;23:2199.
- Benes FM, Kwok EW, Vincent SL, et al. A reduction of nonpyramidal cells in sector CA2 of schizophrenics and manic depressives. Biol Psychiatry. 1998;44(2): 88-97.
- Ongür D, Drevets WC, Price JL. Glial reduction in the subgenual prefrontal cortex in mood disorders. Proc Natl Acad Sci U S A. 1998;95(22):13290-13295.
- Rajkowska G, Miguel-Hidalgo JJ, Wei J, et al. Morphometric evidence for neuronal and glial prefrontal cell pathology in major depression. Biol Psychiatry. 1999;45(9): 1085-1098.
- Licinio J, Wong ML. Serotonergic neurons derived from induced pluripotent stem cells (iPSCs): a new pathway for research on the biology and pharmacology of major depression. Mol Psychiatry. 2016;21(1):1-2.
- Chen SK, Tvrdik P, Peden E, et al. Hematopoietic origin of pathological grooming in Hoxb8 mutant mice. Cell. 2010;141(5):775-785.
- Israel Y, Ezquer F, Quintanilla ME, et al. Intracerebral stem cell administration inhibits relapse-like alcohol drinking in rats. Alcohol Alcohol. 2017;52(1):1-4.
- Ezquer F, Morales P, Quintanilla ME, et al. Intravenous administration of anti-inflammatory mesenchymal stem cell spheroids reduces chronic alcohol intake and abolishes binge-drinking. Sci Rep. 2018;8(1):4325.
- Scarnati MS, Halikere A, Pang ZP. Using human stem cells as a model system to understand the neural mechanisms of alcohol use disorders: current status and outlook. Alcohol. 2019;74:83-93.
- Yadid GM, Popovtzer R. Nanoparticle-mesenchymal stem cell conjugates for cell therapy in drug addiction. NIH grant application. 2017.
- Xu C, Loh HH, Law PY. Effects of addictive drugs on adult neural stem/progenitor cells. Cell Mol Life Sci. 2016;73(2):327-348.
- Dholakiya SL, Aliberti A, Barile FA. Morphine sulfate concomitantly decreases neuronal differentiation and opioid receptor expression in mouse embryonic stem cells. Toxicol Lett. 2016;247:45-55.
- Zhang Y, Loh HH, Law PY. Effect of opioid on adult hippocampal neurogenesis. Scientific World Journal. 2016;2016:2601264.
- Bortolotto V, Grilli M. Opiate analgesics as negative modulators of adult hippocampal neurogenesis: potential implications in clinical practice. Front Pharmacol. 2017; 8:254.
- Galve-Roperh I, Chiurchiù V, Díaz-Alonso J, et al. Cannabinoid receptor signaling in progenitor/stem cell proliferation and differentiation. Prog Lipid Res. 2013; 52(4):633-650.
- Zimmermann T, Maroso M, Beer A, et al. Neural stem cell lineage-specific cannabinoid type-1 receptor regulates neurogenesis and plasticity in the adult mouse hippocampus. Cereb Cortex. 2018;28(12):4454-4471.
- Ren J, Liu N, Sun N, et al. Mesenchymal stem cells and their exosomes: promising therapies for chronic pain. Curr Stem Cell Res Ther. 2019;14(8):644-653.
While laboratory studies move forward at full speed, the clinical use of stem cells—undifferentiated cells that can develop into many different types of specialized cells—remains controversial. Presently, only unadulterated stem cells are allowed to be used in patients, and only on an experimental and investigational basis. Stem cells that have been expanded, modified, or enhanced outside of the body are not allowed to be used for clinical application in the United States at this time. In June 2021, the FDA strengthened the language of stem cell regulation, further limiting their clinical application (see https://www.fda.gov/vaccines-blood-biologics/consumers-biologics/important-patient-and-consumer-information-about-regenerative-medicine-therapies). Yet some applications, such as treatment of lymphoma or restorative knee injections, are covered by some health insurance plans, and the acceptance of stem cell treatment is growing.
In this article, I describe the basics of stem cells, and explore the potential therapeutic use of stem cells for treating various mental illnesses.
Stem cells: A primer
Human embryonic stem cells were initially investigated for their healing properties. However, the need to harvest these cells from embryos drew much criticism, and many found the process to be ethically and religiously unacceptable. This was resolved by the Nobel prize–winning discovery that adult somatic cells can be reprogrammed into cells with embryonic stem cell properties by introducing specific transcription factors. These cells have been termed “induced pluripotent stem cells” (iPSCs).1 The use of adult stem cells and stem cells from the umbilical cords of healthy newborns has allowed for wider acceptance of stem cell research and treatment.
Stem cells may be collected from the patient himself or herself; these are autologous stem cells. They may also be harvested from healthy newborn waste, such as the umbilical cord blood and wall; these are allogenic stem cells. Autologous stem cells are present in almost any tissue but are usually collected from the patient’s adipose tissue or from bone marrow. Understandably, younger stem cells possess higher healing properties. Stem cells may be mesenchymal, producing primarily connective and nervous tissue, or hematopoietic, influencing the immune system and blood cell production, though there is a considerable overlap in the function of these types of cells.
Adult somatic stem cells may be turned into stem cells (iPSCs) and then become any tissue, including neurons. This ability of stem cells to physically regenerate the CNS is directly relevant to psychiatry.
In addition to neurogenesis, stem cell transplants can assist in immune and vascular restoration as well as in suppressing inflammation. The ability of stem cells to replace mutated genes may be useful for addressing inheritable neuropsychiatric conditions.
Both autoimmune and inflammatory mechanisms play an important role in most psychiatric illnesses. The more we learn, the more it is clear that brain function is profoundly dependent on more than just its structure, and that structure depends on more than blood supply. Stem cells influence the vascular, nutritional, functional, inflammatory, and immune environment of the brain, potentially assisting in cognitive and emotional rehabilitation.
Stem cells operate in 2 fundamental ways: via direct cell-to-cell interaction, and via the production and release of growth, immune-regulating, and anti-inflammatory factors. Such factors are produced within the cells and then released in the extracellular environment as a content of exosomes. The route of administration is important in the delivery of the stem cells to the target tissue. Unlike their direct introduction into a joint, muscle, or intervertebral disk, injection of stem cells into the brain is more complicated and not routinely feasible. Intrathecal injections may bring stem cells into the CNS, but cerebrospinal fluid does not easily carry stem cells into the brain, and certainly cannot deliver them to an identified target within the brain. Existing technology can allow stem cells to be packaged in such a way that they can penetrate the blood-brain barrier, but this requires stem cell modification, which presently is not permitted in clinical practice in the United States. Alternatively, there is a way to weaken the blood-brain barrier to allow stem cells to travel through the “opened doors,” so to speak, but this allows everything to have access to the CNS, which may be unsafe. IV administration is technologically easy, and it grants stem cells the environment to multiply and produce extracellular factors that can cross the blood-brain barrier, while large cells cannot.
Continue to: Stem cells as a treatment for mental illness...
Stem cells as a treatment for mental illness
Based on our understanding of the function of stem cells, many neurodegenerative-, vascular-, immune-, and inflammation-based psychiatric conditions can be influenced by stem cell treatment. Here I review the potential therapeutic role of stem cells in the treatment of several psychiatric disorders.
Alzheimer’s dementia
Alzheimer’s dementia (AD) is a progressive neurodegenerative pathology based on neuronal and synaptic loss. Repopulation and regeneration of depleted neuronal circuitry by exogenous stem cells may be a rational therapeutic strategy.2 The regeneration of lost neurons has the potential to restore cognitive function. Multiple growth factors that regulate neurogenesis are abundant during child development but dramatically decline with age. The introduction of stem cells—especially those derived from newborn waste—seem to promote recovery from neurodegenerative disease or injury.3
There currently is no cure for AD. Cellular therapy promises new advances in treatment.4 Neurogenesis occurs not only during fetal development but in the adult brain. Neural stem cells reside in the adult CNS of all mammals.5 They are intimately involved in continuous restoration, but age just like the rest of the animal tissue, providing ever-decreasing restorative potential.
The number of studies of stem cells in AD has increased since the early 2000 s,6,7 and research continues to demonstrate robust CNS neurogenesis. In a 2020 study, Zappa Villar et al8 evaluated stem cells as a treatment for rats in which an AD model was induced by the intracerebroventricular injection of streptozotocin (STZ). The STZ-treated rats displayed poor performance in all behavioral tests. Stem cell therapy increased exploratory behavior, decreased anxiety, and improved spatial memory and marble-burying behavior; the latter was representative of daily life activities. Importantly, stem cell therapy ameliorated and restored hippocampal atrophy and some presynaptic protein levels in the rats with AD.8 Animal models cannot be automatically applied to humans, but they shine a light on the areas that need further exploration.
In humans, elevated cortisol levels during aging predict hippocampal atrophy and memory deficits,9 and this deficiency may be positively influenced by stem cell treatment.
Schizophrenia
Recent research indicates that schizophrenia may begin with abnormal neurogenesis from neural stem cells inside the embryo, and that this process may be particularly vulnerable to numerous genetic and/or environmental disturbances of early brain development.10 Because neurogenesis is not confined to the womb but is a protracted process that continues into postnatal life, adolescence and beyond, influencing this process may be a way to add to the schizophrenia treatment armamentarium.10 Sacco et al11 described links between the alteration of intrauterine and adult neurogenesis and the causes of neuropsychiatric disorders, including schizophrenia. Immune and inflammatory mechanisms are important in the etiology of schizophrenia. By their core function, stem cells address both mechanisms, and may directly modulate this devastating disease.
In addition to clinical hopes, advances in research tools hold the promise of new discoveries. With the advent of iPSC technology, it is possible to generate live neurons in vitro from somatic tissue of patients with schizophrenia. Despite its many limitations, this revolutionary technology has already helped to advance our understanding of schizophrenia.11
Bipolar disorder
Many of the fundamental neurobiological mechanisms of schizophrenia are mirrored in bipolar disorder.12 Though we are not ready to bring stem cells into the day-to-day treatment of this condition, several groups are starting to apply iPSC technology to the study of bipolar disorder.13
Neurodevelopmental factors—particularly pathways related to nervous system development, cell migration, extracellular matrix, methylation, and calcium signaling—have been identified in large gene expression studies as altered in bipolar disorder.14 Stem cell technology opens doorways to reverse engineering of human neurodegenerative disease.15
Continue to: Autism spectrum disorders...
Autism spectrum disorders
Autism spectrum disorders (ASDs) are multiple heterogeneous neurodevelopmental disorders.16 Neuroinflammation and immune dysregulation influence the origin of ASDs. Due to the neurobiologic changes underlying ASD development, cell-based therapies, including the use of mesenchymal stem cells (MSCs), have been applied to ASDs.16 Stem cells show specific immunologic properties that make them promising candidates for treating ASDs.17
The exact mechanisms of action of MSCs to restore function in patients with ASDs are largely unknown, but proposed mechanisms include:
- synthesizing and releasing anti-inflammatory cytokines and survival-promoting growth factors
- integrating into the existing neural and synaptic network
- restoring plasticity.18
In a study of transplantation of human cord blood cells and umbilical cord–derived MSCs for patients with ASDs, Bradstreet et al19 found a statistically significant difference on scores for domains of speech, sociability, sensory, and overall health, as well as reductions in the total scores, in those who received transplants compared to their pretreatment values.
In another study of stem cell therapy for ASDs, Lv et al20 demonstrated the safety and efficacy of combined transplantation of human cord blood cells and umbilical cord–derived MSCs in treating children with ASDs. The transplantations included 4 stem cell IV infusions and intrathecal injections once a week. Statistically significant differences were shown at 24 weeks post-treatment. Although this nonrandomized, open-label, single-center Phase I/II trial cannot be relied on for any definitive conclusions, it suggests an important area of investigation.20
The vascular aspects of ASDs’ pathogenesis should not be overlooked. For example, specific temporal lobe areas associated with facial recognition, social interaction, and language comprehension have been demonstrated to be hypoperfused in children with ASDs, but not in controls. The degree of hypoperfusion and resulting hypoxia correlates with the severity of ASD symptoms. The damage causing hypoperfusion of temporal areas was associated with the onset of autism-like disorders. Damage of the amygdala, hippocampus, or other temporal structures induces permanent or transient autistic-like characteristics, such as unexpressive faces, little eye contact, and motor stereotypes. Clinically, temporal lobe damage by viral and other means has been implicated in the development of ASD in children and adults. Hypoperfusion may contribute to defects, not only by inducing hypoxia, but also by allowing for abnormal metabolite or neurotransmitter accumulation. This is one of the reasons glutamate toxicity has been implicated in ASD. The augmentation of perfusion through stimulation of angiogenesis by stem cells should allow for metabolite clearance and restoration of functionality. Vargas et al21 compared brain autopsy samples from 11 children with ASDs to those of 7 age-matched controls. They demonstrated an active neuroinflammatory process in the cerebral cortex, white matter, and cerebellum of patients with ASDs, both by immunohistochemistry and morphology.21
Multiple studies have confirmed that the systemic administration of cord blood cells is sufficient to induce neuroregeneration.22,23 Angiogenesis has been experimentally demonstrated in peripheral artery disease, myocardial ischemia, and stroke, and has direct implications on brain repair.24 Immune dysregulation25,26 and immune modulation27 also are addressed by stem cell treatment, which provides a promising avenue for battling ASDs.
Like attention-deficit/hyperactivity disorder and obsessive-compulsive disorder, ASDs are neurodevelopmental conditions. Advances based on the use of stem cells hold great promise for understanding, diagnosing and, possibly, treating these psychiatric disorders.28,29
Depression
Neuropsychiatric disorders arise from deviations from the regular differentiation process of the CNS, leading to altered neuronal connectivity. Relatively subtle abnormalities in the size and number of cells in the prefrontal cortex and basal ganglia have been observed in patients with depressive disorder and Tourette syndrome.30 Fibroblast-derived iPSCs generate serotonergic neurons through the exposure of the cells to growth factors and modulators of signaling pathways. If these serotonergic neurons are made from the patients’ own cells, they can be used to screen for new therapeutics and elucidate the unknown mechanisms through which current medications may function.31 This development could lead to the discovery of new medication targets and new insights into the molecular biology of depression.32
Deficiencies of brain-derived neurotrophic factor (BDNF) have a role in depression, anxiety, and other neuropsychiatric illnesses. The acute behavioral effects of selective serotonin reuptake inhibitors and tricyclic antidepressants seem to require BDNF signaling, which suggests that BDNF holds great potential as a therapeutic agent. Cell therapies focused on correcting BDNF deficiencies in mice have had some success.33
Dysregulation of GABAergic neurons has also been implicated in depression and anxiety. Patients with major depressive disorder have reduced gamma aminobutyric acid (GABA) receptors in the parahippocampal and lateral temporal lobes.34
Ultimately, the development of differentiation protocols for serotonergic and GABAergic neuronal populations will pave the way for examining the role of these populations in the pathogenesis of depression and anxiety, and may eventually open the door for cell-based therapies in humans.35
Studies have demonstrated a reduction in the density of pyramidal and nonpyramidal neurons in the anterior cingulate cortex of patients with schizophrenia and bipolar disorder,36 glial reduction in the subgenual prefrontal cortex in mood disorders,37 and morphometric evidence for neuronal and glial prefrontal cell pathology in major depressive disorder.38 The potential for stem cells to repair such pathology may be of clinical benefit to many patients.
Aside from their other suggested clinical uses, iPSCs may be utilized in new pathways for research on the biology and pharmacology of major depressive disorder.39
Continue to: Obsessive-compulsive disorder...
Obsessive-compulsive disorder
Obsessive-compulsive disorder (OCD) is often characterized by excessive behaviors related to cleanliness, including grooming, which is represented across most animal species. In mice, behaviors such as compulsive grooming and hair removal—similar to behaviors in humans with OCD or trichotillomania—are associated with a specific mutation. Chen et al40 reported that the transplantation of bone marrow stem cells into mice with this mutation (bone marrow–derived microglia specifically home to the brain) rescues their pathological phenotype by repairing native neurons.
The autoimmune, inflammatory, and neurodegenerative changes that are prevalent in OCD may be remedied by stem cell treatment in a fashion described throughout this article.
Other conditions
The Box41-50 describes a possible role for stem cells in the treatment or prevention of several types of substance use disorders.
Box
Researchers have begun to explore stem cells as a potential treatment for several substance use disorders, including those involving alcohol, cocaine, and opioids, as well as their interactions with cannabinoids.
Alcohol use disorder. In a 2017 study, Israel et al41 gave intra-cerebral injections of mesenchymal stem cells (MSCs) to rats that were bred to have a high alcohol intake. The MSC injections resulted in drastic reductions in the rats’ alcohol consumption. A single intracerebroventricular MSC administration inhibited relapse-like drinking by up to 85% for 40 days.
It is beyond unlikely that direct brain injections would be used to treat alcohol use disorder in humans. To address this problem, researchers aggregated MSCs into smaller spheroid shapes, which reduced their size up to 75% and allowed them to be injected intravenously to reach the brain in a study conducted in rats.42 Within 48 hours of a single treatment, the rats had reduced their intake of alcohol by 90%. The IV administration of antiinflammatory MSCs in human trials will be the next step to verify these results.
Alcohol research using human stem cells is also being conducted as a model system to understand the neural mechanisms of alcohol use disorder.43
Cocaine use disorder. In a grant proposal, Yadid and Popovtzer44 suggested that cocaine addiction affects neurogenesis, especially in the dentate gyrus, ventral tegmental area, nucleus accumbens, and prefrontal cortex; it damages mitochondrial RNA, brain-derived neurotrophic factor (BDNF), glutamate transporter (excitatory amino acid transporter; EAAT), and interleukin-10. MSCs have a predilection to these areas and influence neurogenesis. Currently, there are no FDAapproved medications for the safe and effective treatment of cocaine addiction. MSCs can home to pathological areas in the brain, release growth factors, and serve as cellular delivery tools in various brain disorders. Moreover, restoration of basal glutamate levels via the EAAT has been proposed as a promising target for treating cocaine dependence. Therefore, MSCs differentiated to express EAATs may have a combined long-term effect that can attenuate cocaine craving and relapse.44
Neural stem cells undergo a series of developmental processes before giving rise to newborn neurons, astrocytes, and oligodendrocytes in adult neurogenesis. During the past decade, studies of adult neurogenesis modulated by addictive drugs have highlighted the role of stem cells. These drugs have been shown to regulate the proliferation, differentiation, and survival of adult cells in different manners, which results in the varying consequences of adult neurogenesis.45 Reversal of these influences by healthy stem cells can be a worthy goal to pursue.
Opioid use disorder. Opiate medications cause a loss of newly born neural progenitors in the subgranular zone of the dentate gyrus by either modulating proliferation or interfering with differentiation and maturation.46 Opiates were the first medications shown to negatively impact neurogenesis in the adult mammalian hippocampus.47,48 The restoration of hippocampal function may positively affect the prognosis of a patient who is addicted.
Cannabinoids. Cannabinoids’ influence on the brain and on stem cells is controversial. On one hand, deteriorated neurogenesis results in reduced long-term potentiation in hippocampal formation. These cellular and physiological alterations lead to decreased short-term spatial memory and increased depressionlike behaviors.49 On the other hand, there is emerging evidence that cannabinoids improve neurogenesis and CNS plasticity, at least in the adult mouse.50 Through normalization of immune function, and restoration of the brain and the body, stem cells may assist in better health and in treatment of cannabis use disorder.
Chronic pain is a neuropsychiatric condition that involves the immune system, inflammation, vascularization, trophic changes, and other aspects of the CNS function in addition to peripheral factors and somatic pain generators. Treatment of painful conditions with the aid of stem cells represents a large and ever-developing field that lies outside of the scope of this article.51
Experimental, but promising
It is not easy to accept revolutionary new approaches in medicine. Endless research and due diligence are needed to prove a concept and then to work out specific applications, safeguards, and limitations for any novel treatments. The stem cell terrain is poorly explored, and one needs to be careful when venturing there. Presently, the FDA appropriately sees treatment with stem cells as experimental and investigational, particularly in the mental health arena. Stem cells are not approved for treatment of any specific condition. At the same time, research and clinical practice suggest stem cell treatment may someday play a more prominent role in health care. Undoubtedly, psychiatry will eventually benefit from the knowledge and application of stem cell research and practice.
Related Resources
- De Los Angeles A, Fernando MB, Hall NAL, et al. Induced pluripotent stem cells in psychiatry: an overview and critical perspective. Biol Psychiatry. 2021;90(6):362-372.
- Heider J, Vogel S, Volkmer H, et al. Human iPSC-derived glia as a tool for neuropsychiatric research and drug development. Int J Mol Sci. 2021;22(19):10254.
Drug Brand Name
Streptozotocin • Zanosar
Bottom Line
Treatment with stem cell transplantation is experimental and not approved for any medical or psychiatric illness. However, based on our growing understanding of the function of stem cells, and preliminary research conducted mainly in animals, many neurodegenerative-, vascular-, immune-, and inflammation-based psychiatric conditions might be beneficially influenced by stem cell treatment.
- Takahashi K, Tanabe K, Ohnuki M, et al. Induction of pluripotent stem cells from adult human fibroblasts by defined factors. Cell. 2007;131(5):861-872.
- Duncan T, Valenzuela M. Alzheimer’s disease, dementia, and stem cell therapy. Stem Cell Res Ther. 2017;8(1):111.
- Brinton RD, Wang JM. Therapeutic potential of neurogenesis for prevention and recovery from Alzheimer’s disease: allopregnanolone as a proof of concept neurogenic agent. Curr Alzheimer Res. 2006;3(3):185-190.
- Taupin P. Adult neurogenesis, neural stem cells, and Alzheimer’s disease: developments, limitations, problems, and promises. Curr Alzheimer Res. 2009;6(6):461-470.
- Taupin P. Neurogenesis, NSCs, pathogenesis, and therapies for Alzheimer’s disease. Front Biosci (Schol Ed). 2011;3:178-90.
- Kang JM, Yeon BK, Cho SJ, et al. Stem cell therapy for Alzheimer’s disease: a review of recent clinical trials. J Alzheimers Dis. 2016;54(3):879-889.
- Li M, Guo K, Ikehara S. Stem cell treatment for Alzheimer’s disease. Int J Mol Sci. 2014;15(10):19226-19238.
- Zappa Villar MF, López Hanotte J, Pardo J, et al. Mesenchymal stem cells therapy improved the streptozotocin-induced behavioral and hippocampal impairment in rats. Mol Neurobiol. 2020;57(2):600-615.
- Lupien SJ, de Leon M, de Santi S, et al. Cortisol levels during human aging predict hippocampal atrophy and memory deficits. Nat Neurosci. 1998;1(1):69-73.
- Iannitelli A, Quartini A, Tirassa P, et al. Schizophrenia and neurogenesis: a stem cell approach. Neurosci Biobehav Rev. 2017;80:414-442.
- Sacco R, Cacci E, Novarino G. Neural stem cells in neuropsychiatric disorders. Curr Opin Neurobiol. 2018; 48:131-138.
- Miller ND, Kelsoe JR. Unraveling the biology of bipolar disorder using induced pluripotent stem-derived neurons. Bipolar Disord. 2017;19(7):544-551.
- O’Shea KS, McInnis MG. Neurodevelopmental origins of bipolar disorder: iPSC models. Mol Cell Neurosci. 2016;73:63-83.
- Jacobs BM. A dangerous method? The use of induced pluripotent stem cells as a model for schizophrenia. Schizophr Res. 2015;168(1-2):563-568.
- Liu Y, Deng W. Reverse engineering human neurodegenerative disease using pluripotent stem cell technology. Brain Res. 2016;1638(Pt A):30-41.
- Siniscalco D, Kannan S, Semprún-Hernández N, et al. Stem cell therapy in autism: recent insights. Stem Cells Cloning. 2018;11:55-67.
- Siniscalco D, Bradstreet JJ, Sych N, et al. Mesenchymal stem cells in treating autism: novel insights. World J Stem Cells. 2014;6(2):173-178.
- Siniscalco D, Sapone A, Cirillo A, et al. Autism spectrum disorders: is mesenchymal stem cell personalized therapy the future? J Biomed Biotechnol. 2012; 2012:480289.
- Bradstreet JJ, Sych N, Antonucci N, et al. Efficacy of fetal stem cell transplantation in autism spectrum disorders: an open-labeled pilot study. Cell Transplant. 2014;23(Suppl 1):S105-S112.
- Lv YT, Zhang Y, Liu M, et al. Transplantation of human cord blood mononuclear cells and umbilical cordderived mesenchymal stem cells in autism. J Transl Med. 2013;11:196.
- Vargas DL, Nascimbene C, Krishnan C, et al. Neuroglial activation and neuroinflammation in the brain of patients with autism. Ann Neurol. 2005;57(1):67-81.
- Wei L, Keogh CL, Whitaker VR, et al. Angiogenesis and stem cell transplantation as potential treatments of cerebral ischemic stroke. Pathophysiology. 2005;12(1): 47-62.
- Newman MB, Willing AE, Manresa JJ, et al. Cytokines produced by cultured human umbilical cord blood (HUCB) cells: implications for brain repair. Exp Neurol. 2006;199(1):201-218.
- Peterson DA. Umbilical cord blood cells and brain stroke injury: bringing in fresh blood to address an old problem. J Clin Invest. 2004;114(3):312-314.
- Cohly HH, Panja A. Immunological findings in autism. Int Rev Neurobiol. 2005;71:317-341.
- Ashwood P, Van de Water J. Is autism an autoimmune disease? Autoimmun Rev. 2004;3(7-8):557-562.
- Yagi H, Soto-Gutierrez A, Parekkadan B, et al. Mesenchymal stem cells: mechanisms of immunomodulation and homing. Cell Transplant. 2010;19(6):667-679.
- Vaccarino FM, Urban AE, Stevens HE, et al. Annual Research Review: The promise of stem cell research for neuropsychiatric disorders. J Child Psychol Psychiatry. 2011;52(4):504-516.
- Liu EY, Scott CT. Great expectations: autism spectrum disorder and induced pluripotent stem cell technologies. Stem Cell Rev Rep. 2014;10(2):145-150.
- Richardson-Jones JW, Craige CP, Guiard BP, et al. 5-HT1A autoreceptor levels determine vulnerability to stress and response to antidepressants. Neuron. 2010;65(1):40-52.
- Saarelainen T, Hendolin P, Lucas G, et al. Activation of the TrkB neurotrophin receptor is induced by antidepressant drugs and is required for antidepressant-induced behavioral effects. J Neurosci. 2003;23(1):349-357.
- Klumpers UM, Veltman DJ, Drent ML, et al. Reduced parahippocampal and lateral temporal GABAA-[11C] flumazenil binding in major depression: preliminary results. Eur J Nucl Med Mol Imaging. 2010;37(3): 565-574.
- Bremner JD, Narayan M, Anderson ER, et al. Hippocampal volume reduction in major depression. Am J Psychiatry. 2000;157(1):115-118.
- Bremner JD, Randall P, Scott TM, et al. MRI-based measurement of hippocampal volume in patients with combat-related posttraumatic stress disorder. Am J Psychiatry. 1995;152(7):973-981.
- Vincent SL, Todtenkopf MS, Benes FM. A comparison of the density of pyramidal and non-pyramidal neurons in the anterior cingulate cortex of schizophrenics and manic depressives. Soc Neurosci Abstr. 1997;23:2199.
- Benes FM, Kwok EW, Vincent SL, et al. A reduction of nonpyramidal cells in sector CA2 of schizophrenics and manic depressives. Biol Psychiatry. 1998;44(2): 88-97.
- Ongür D, Drevets WC, Price JL. Glial reduction in the subgenual prefrontal cortex in mood disorders. Proc Natl Acad Sci U S A. 1998;95(22):13290-13295.
- Rajkowska G, Miguel-Hidalgo JJ, Wei J, et al. Morphometric evidence for neuronal and glial prefrontal cell pathology in major depression. Biol Psychiatry. 1999;45(9): 1085-1098.
- Licinio J, Wong ML. Serotonergic neurons derived from induced pluripotent stem cells (iPSCs): a new pathway for research on the biology and pharmacology of major depression. Mol Psychiatry. 2016;21(1):1-2.
- Chen SK, Tvrdik P, Peden E, et al. Hematopoietic origin of pathological grooming in Hoxb8 mutant mice. Cell. 2010;141(5):775-785.
- Israel Y, Ezquer F, Quintanilla ME, et al. Intracerebral stem cell administration inhibits relapse-like alcohol drinking in rats. Alcohol Alcohol. 2017;52(1):1-4.
- Ezquer F, Morales P, Quintanilla ME, et al. Intravenous administration of anti-inflammatory mesenchymal stem cell spheroids reduces chronic alcohol intake and abolishes binge-drinking. Sci Rep. 2018;8(1):4325.
- Scarnati MS, Halikere A, Pang ZP. Using human stem cells as a model system to understand the neural mechanisms of alcohol use disorders: current status and outlook. Alcohol. 2019;74:83-93.
- Yadid GM, Popovtzer R. Nanoparticle-mesenchymal stem cell conjugates for cell therapy in drug addiction. NIH grant application. 2017.
- Xu C, Loh HH, Law PY. Effects of addictive drugs on adult neural stem/progenitor cells. Cell Mol Life Sci. 2016;73(2):327-348.
- Dholakiya SL, Aliberti A, Barile FA. Morphine sulfate concomitantly decreases neuronal differentiation and opioid receptor expression in mouse embryonic stem cells. Toxicol Lett. 2016;247:45-55.
- Zhang Y, Loh HH, Law PY. Effect of opioid on adult hippocampal neurogenesis. Scientific World Journal. 2016;2016:2601264.
- Bortolotto V, Grilli M. Opiate analgesics as negative modulators of adult hippocampal neurogenesis: potential implications in clinical practice. Front Pharmacol. 2017; 8:254.
- Galve-Roperh I, Chiurchiù V, Díaz-Alonso J, et al. Cannabinoid receptor signaling in progenitor/stem cell proliferation and differentiation. Prog Lipid Res. 2013; 52(4):633-650.
- Zimmermann T, Maroso M, Beer A, et al. Neural stem cell lineage-specific cannabinoid type-1 receptor regulates neurogenesis and plasticity in the adult mouse hippocampus. Cereb Cortex. 2018;28(12):4454-4471.
- Ren J, Liu N, Sun N, et al. Mesenchymal stem cells and their exosomes: promising therapies for chronic pain. Curr Stem Cell Res Ther. 2019;14(8):644-653.

Could an oral PCSK9 inhibitor be on the horizon?
The investigational PCSK9 inhibitor that Merck showcased recently would be more than a “me-too” drug if it ultimately wins approval, despite competition from several approved agents that slash elevated cholesterol levels by targeting the same protein.
In fact, it would be something of a breakthrough. The new agent under study – now called MK-0616 – comes in pill form, in contrast to the three currently available PCSK9-lowering drugs that must be given in injections separated by weeks to months.
The drug faces an uncertain road to regulatory review and any approval, but MK-0616 at least seems to be starting out in the right direction.
In two phase 1 studies with a total of 100 participants, plasma PCSK9 levels plunged more than 90% after a single dose of the drug; and low-density-lipoprotein cholesterol (LDL-C) levels dropped about 65% when MK-0616 was given daily for 2 weeks on a background of statin therapy.
Moreover, “MK-0616 was generally well tolerated at up to and including single doses of 300 milligrams,” the maximum tested in the studies, Douglas G. Johns, PhD, reported at the virtual American Heart Association scientific sessions.
The collective results from the oral agent’s earliest human experience are “definitely encouraging” and support MK-0616 as a potential LDL-lowering agent that would be more convenient and arguably more accessible to patients compared to current injectable PCSK9 inhibitors, proposed Dr. Johns, clinical director of translational medicine for Merck in Kenilworth, N.J.
Available PCSK9-targeting agents include alirocumab (Praluent, Sanofi/Regeneron), Food and Drug Administration–approved in July 2015, and evolocumab (Repatha, Amgen), approved by the agency the following month. Both are monoclonal antibodies with neutralizing specificity for the PCSK9 protein; whereas the third such agent, inclisiran (Leqvio, Novartis) is a small-molecule interfering-RNA that suppresses PCSK9 synthesis. Inclisiran is approved in the European Union but its case to the FDA was turned down in 2020.
Dr. Johns said MK-0616 is a cyclic peptide that is “about one-hundredth the size of a monoclonal antibody, but we’re able to achieve monoclonal antibody-like potency and selectivity with this much smaller footprint.”
Added to statin therapy, the current PCSK9-targeting agents reduce LDL-C by an additional one-half or more, and the two antibody-based agents “also decrease atherosclerotic cardiovascular events. They are, however, expensive and not always available, requiring insurance or other approval,” observed Anne C. Goldberg, MD, as invited discussant after Dr. Johns’ presentation.
“They require every 2- to 4-week injections. They’re generally reserved for secondary prevention, and sometimes primary prevention as in familial hypercholesterolemia,” said Dr. Goldberg, of Washington University, St. Louis. Inclisiran, she noted, requires injections every 6 months and has yet to show its mettle in cardiovascular outcomes trials.
“Certainly, an oral form would be easier to use,” she said. “This would be particularly helpful in patients averse to injections,” especially, perhaps, in children. “Children with familial hypercholesterolemia could benefit with greater cholesterol lowering and might be better off with a pill than an injection.” That would be good reason to emphasize the enrollment of children in the drug’s upcoming clinical trials, Dr. Goldberg said.
But cost could potentially become restrictive for MK-0616 as well, should it ever be approved. “If it’s priced too high, then are you really going to see the increased use?” she posed. “Certainly, there’s a high bar for therapies that are add-on to statins in terms of cost effectiveness.”
In the first of the two trials, 60 predominantly White male participants aged 50 or younger were randomly assigned to receive a single dose of MK-0616, at different levels ranging from 10 mg to 300 mg, or placebo. They subsequently crossed over to a different group for a second round of dosing. Both times, three participants took the drug for every one who received placebo.
Participants who took the active drug, regardless of dosage, showed greater than 90% reductions in circulating PCSK9 levels compared to baseline. Six participants discontinued the study before its completion.
In the second trial, 40 White adults aged 65 or younger (mean, 58), including 13 women, with LDL-C of 60 mg/dL to 160 mg/dL (mean, 87 mg/dL) on statin therapy for at least 3 months were randomly assigned 3-to-1 to add-on MK-0616, either 10 mg or 20 mg daily, or placebo for 14 days.
LDL-C levels fell an average of about 65% over the 2 weeks among those taking the active drug; they declined less than 5% for those who took placebo.
There were no deaths or serious adverse events in either trial, Dr. Johns reported. On the other hand, pharmacokinetics studies showed that exposure to the drug fell by “about 50%-60%” when dosing was preceded by food intake within the previous 30 minutes. “However, if a meal is consumed 30 minutes after the dose, this food effect is much, much less prominent, almost negligible.”
These preliminary results show the drug is “orally bioavailable and exerts a clinically meaningful effect,” Dr. Johns said. “However, there’s definitely more to be done. And we are planning the next phase of clinical development, a phase 2 trial, sometime next year.”
The research was funded by Merck. Dr. Johns disclosed employment with and equity ownership in Merck, as did all the study’s coauthors. Dr. Goldberg disclosed holding research contracts through her institution with Regeneron/Sanofi-Aventis, Amarin, Amgen, Pfizer, IONIS/Akcea, Regeneron, Novartis, Arrowroot Pharmaceuticals, and the FH Foundation; and consulting for Novartis, Akcea, Regeneron, and Esperion.
A version of this article first appeared on Medscape.com.
FROM AHA 2021
Virtual center boosts liver transplant listings in rural area
A “virtual” liver transplant center servicing Vermont and New Hampshire has improved access to liver transplant listing among patients in rural areas of the region, according to a new analysis.
The virtual center was established in 2016 at Dartmouth Hitchcock Medical Center, and it allows patients to receive pre–liver transplant evaluations, testing, and care and posttransplant follow-up there rather than at the liver transplant center that conducts the surgery. The center includes two hepatologists, two associate care providers, and a nurse liver transplant coordinator at DHMC, and led to increased transplant listing in the vicinity, according to Margaret Liu, MD, who presented the study at the virtual annual meeting of the American Association for the Study of Liver Diseases.
“The initiation of this Virtual Liver Transplant Center has been able to provide patients with the ability to get a full liver transplant workup and evaluation at a center near their home rather than the often time-consuming and costly process of potentially multiple trips to a liver transplant center up to 250 miles away for a full transplant evaluation,” said Dr. Liu in an interview. Dr. Liu is an internal medicine resident at Dartmouth Hitchcock Medical Center.
“Our results did show that the initiation of a virtual liver transplant center correlated with an increased and sustained liver transplant listing rate within 60 miles of Dartmouth over that particular study period. Conversely there was no significant change in the listing rate of New Hampshire zip codes that were within 60 miles of the nearest transplant center during the same study period,” said Dr. Liu.
The center receives referrals of patients who are potential candidates for liver transplant listing from practices throughout New Hampshire and Vermont, or from their own center. Their specialists conduct full testing, including a full liver transplant workup that includes evaluation of the patient’s general health and social factors, prior to sending the patient to the actual liver transplant center for their evaluation and transplant surgery. “We essentially do all of the pre–liver transplant workup, a formal liver transplant evaluation, and then the whole packet gets sent to an actual liver transplant center to expedite the process of getting listed for liver transplant. We’re able to streamline the process, so they get everything done here at a hospital near their home. If that requires multiple trips, it’s a lot more doable for the patients,” said Dr. Liu.
The researchers defined urban areas as having more than 50,000 people per square mile and within 30 miles of the nearest hospital, and rural as fewer than 10,000 and more than 60 miles from the nearest hospital. They used the Scientific Registry of Transplant Recipients to determine the number of liver transplant listings per zip code.
Between 2015 and 2019, the frequency of liver transplant listings per 10,000 people remained nearly unchanged in the metropolitan area of southern New Hampshire, ranging from around 0.36 to 0.75. In the rural area within 60 miles of DHMC, the frequency increased from about 0.7 per 10,000 in 2015 to about 1.4 in 2016 and 0.9 in 2017. There was an increase to nearly 3 in 10,000 in 2018, and the frequency was just over 2 in 2019.
The model has the potential to be used in other areas, according to Dr. Liu. “This could potentially be implemented in other rural areas that do not have a transplant center or don’t have a formal liver transplant evaluation process,” said Dr. Liu.
While other centers may have taken on some aspects of liver transplant evaluation and posttransplant care, the Virtual Liver Transplant Center is unique in that a great deal of effort has gone into covering all of a patient’s needs for the liver transplant evaluation. “It’s really the formalization that, from what I have researched, has not been done before,” said Dr. Liu.
The model addresses transplant-listing disparity, as well as improves patient quality of life through reduction in travel, according to Mayur Brahmania, MD, of Western University, London, Ont., who moderated the session. “They’ve proven that they can get more of their patients listed over the study period, which I think is amazing. The next step, I think, would be about whether getting them onto the transplant list actually made a difference in terms of outcome – looking at their wait list mortality, looking at how many of these patients actually got a liver transplantation. That’s the ultimate outcome,” said Dr. Brahmania.
He also noted the challenge of setting up a virtual center. “You have to have allied health staff – addiction counselors, physical therapists, dietitians, social workers. You need to have the appropriate ancillary services like cardiac testing, pulmonary function testing. It’s quite an endeavor, and if the program isn’t too enthusiastic or doesn’t have a local champion, it’s really hard to get something like this started off. So kudos to them for taking on this challenge and getting this up and running over the last 5 years,” said Dr. Brahmania.
Dr. Liu and Dr. Brahmania have no relevant financial disclosures.
AGA applauds researchers who are working to raise our awareness of health disparities in digestive diseases. AGA is committed to addressing this important societal issue head on. Learn more about AGA’s commitment through the AGA Equity Project.
FROM THE LIVER MEETING