User login
Comic books help explain type 1 diabetes to all ages
Overcoming the challenges in managing type 1 diabetes can sometimes feel like an unappreciated “superpower.” That was part of the thinking behind the creation of a comic book trilogy that aims to educate people of all ages – including health care providers – about the realities of living with this condition.
The series was initially launched by a team from Portsmouth (England) Hospitals University National Health Service Trust and University Hospital Southampton NHS Foundation Trust. It is now officially backed by the NHS. The first book in the trilogy, published in 2016, visually illustrates the challenges faced by a teenage boy who had recently been diagnosed with type 1 diabetes. The second volume, released in 2018, follows a young girl who is hospitalized with diabetic ketoacidosis. The third, published in December 2020, explores the stigma associated with diabetes and delves into hypoglycemia.
Available for free online, the three comic books are meant for adults, children, health care professionals, and laypeople. This news organization spoke with series cocreator Partha Kar, MBBS, MD, national specialty adviser, Diabetes for NHS England, about the series. This interview has been edited for length and clarity.
How did the idea for a comic book series about type 1 diabetes come about?Dr. Kar: My Southampton colleague Mayank Patel, BM, DM, FRCP, and I were discussing ways of reaching different audiences to raise awareness about type 1 diabetes, and we had the idea of comic books. After all, comic book movies are among the biggest blockbusters if one looks at popular culture, because it’s not just kids watching them.
One of our patients made an interesting observation that really resonated. He said having type 1 diabetes was like the Marvel Comics superhero Hulk.
Several scenes in the first publication, Type 1: Origins, were based on the Hulk, a scientist who gets a radioactive dose by accident. He doesn’t like turning green when he’s angry, even though he also becomes very strong. He basically spends the rest of his life trying to find the cure for himself, but he eventually makes the best of his two worlds – Professor and Hulk – rather than constantly fighting his situation.
The story line was primarily written by a group of patients with type 1 diabetes based on their own experiences. Mayank and I were mostly just supervising and financing the project. The graphics and layout were done by Revolve Comics, a publisher specializing in health education via the comic book medium.
Our aim was to bring awareness of type 1 diabetes to people who don’t have diabetes, including teachers, family members, and friends. At the end of Origins, we provide a list of online resources for more information and for social connection.
Since it launched in October 2016, Origins has been downloaded nearly 10,000 times. Lots of local charities and schools have picked it up. Parents and kids have come to us asking for more and giving us ideas. That’s what prompted the next one.
The second volume, Type 1: Attack of the Ketones, is more technical and somewhat surprising in that it portrays some hospital staff members as not well-informed about type 1 diabetes. Are they part of the intended audience?
Yes, this one was directed a little bit more towards professionals, hospitals, and staff. It’s also informed by patient feedback, and dovetails with my efforts to improve hospital care for people with type 1 diabetes. But of course, patients and interested laypeople can also learn from it.
A theme in volume 2 comes from another Marvel Comics superhero, Iron Man. In the movie, when Tony Stark’s heart is severely damaged with shrapnel, he acquires an arc reactor that keeps him alive and also powers the suit that gives him superpowers. After the reactor is taken away, he devises a way to replace the missing part and reassemble the suit.
Similarly, in type 1 diabetes, the ability to produce insulin has been taken away without permission. But what is missing can thankfully be replaced, albeit imperfectly. As we illustrate, things don’t always go to plan despite best efforts to administer insulin in the right dose at the right time.
At the end of Attack of the Ketones, we provide two pages of text about recognizing and managing hyperglycemia and preventing diabetic ketoacidosis. This volume was funded by NHS England and then backed by JDRF and Diabetes UK, and many hospitals picked it up. It has had about 8,000 downloads.
In Volume 3, you explore stigma and the issue of language regarding type 1 diabetes. How did those topics come about?
Kar: Type 1 Mission 3: S.T.I.G.M.A. was also based on patient feedback, with input from some Indian diabetes groups I’ve worked with. Here, the protagonist is a young man with type 1 diabetes who goes on holiday to India, where diabetes stigma is widespread. The characters address language problems such as use of the word “diabetic” to label a person, and they counter misconceptions such as that diabetes is contagious. There’s an Indian comic book version of this volume out now.
The main character of this volume experiences severe hypoglycemia and is saved by a glucagon injection from a colleague, one of several presented as superheroes who help in the fight to end diabetes stigma. They are referred to as Guardians of the Glucose, a take on yet another Marvel franchise, Guardians of the Galaxy.
At the end of this volume, we provide two pages of text about recognizing, managing, and preventing hypoglycemia. Again, we hope to educate as wide an audience as possible.
At the end of volume 3, you also briefly mention the COVID-19 pandemic. Will there be a fourth volume dealing with that, or other topics, such as diabetes technology?
We’ve left it open. We want to see how volume 3 lands. Depending on that, we might take it forward. There are certainly plenty of topics to tackle. We’ve also discussed moving into gaming or virtual reality. Overall, we hope to educate people by engaging them in different ways.
Dr. Kar has been a consultant diabetologist/endocrinologist within the NHS since 2008. He disclosed no relevant financial relationships.
A version of this article first appeared on Medscape.com.
Melatonin not recommended for early-stage NSCLC
There was a hint of benefit with melatonin among patients with stage III/IV NSCLC. These patients had a hazard reduction of 25% in 5-year DFS. However, the median DFS for patients with advanced disease was the same whether they received melatonin or placebo – 18 months.
In the overall study population, melatonin had no beneficial effects on quality of life, sleep, anxiety, depression, pain, or fatigue, and it did not reduce adverse events from chemotherapy or radiation.
These results were reported in EClinicalMedicine.
“In light of the results, we do not recommend the inclusion of adjuvant melatonin for patients with early-stage NSCLC. Evidence suggests there may be a benefit for those with late-stage disease,” the authors wrote. “However, because of the mixed findings observed, we recommend a follow-up randomized, controlled trial involving a larger population focusing on later-stage resected lung cancer to clarify these results.”
“I would very much like to pursue another controlled study of melatonin specifically in a group of late-stage lung cancer and possibly in other more advanced cancer types,” said lead author Dugald Seely, ND, of the Canadian College of Naturopathic Medicine in Toronto.
Study rationale and design
Melatonin has shown promise for treating patients with lung cancer, Dr. Seely and colleagues noted. Melatonin is often recommended by naturopathic doctors following lung cancer surgery, but until now there was no high-level evidence regarding the practice.
For their study, Dr. Seely and colleagues evaluated 709 patients who had undergone NSCLC resection. The patients were randomized to receive placebo (n = 353) or melatonin (n = 356) 1 hour before bedtime for 1 year. A 20-mg melatonin dose was used, which is common in clinical practice and research.
The study arms were well matched, with no “clinically meaningful” differences in demographics, surgery type, cancer type, stage of cancer, or preoperative comorbidities, according to the researchers.
The mean age in both treatment arms was 67 years. Overall, 134 participants received adjuvant chemotherapy (66 melatonin, 68 placebo), and 43 had adjuvant radiation (22 melatonin, 21 placebo).
Results
For 2-year DFS, melatonin showed an adjusted relative risk of 1.01 (95% confidence interval, 0.83-1.22; P = .94) versus placebo. The adjusted relative risk in the per-protocol analysis was 1.12 (95% CI, 0.96-1.32; P = .14.)
At 5 years, the median DFS was not reached in either treatment arm. Melatonin showed a hazard ratio of 0.97 (95% CI, 0.86-1.09; P = .84) for 5-year DFS.
Among patients with stage I-II NSCLC, the median DFS was not reached at 5 years in either treatment arm. Among patients with stage III-IV NSCLC, the median DFS was 18 months in both arms.
Melatonin showed a hazard ratio of 0.97 (95% CI, 0.85-1.11; P = .66) in patients with early-stage NSCLC and a hazard reduction of 25% (HR, 0.75; 95% CI, 0.61-0.92; P = .005) in patients with late-stage NSCLC.
For the entire cohort, there were no significant differences between treatment arms in the number, severity, or seriousness of adverse events. Likewise, there were no significant differences between the treatment arms with regard to fatigue, quality of life, or sleep at 1 or 2 years.
Dr. Seely said the most surprising thing about this study was that melatonin didn’t help with sleep.
“Since initiation of the trial, my thinking on the right dose of melatonin to support sleep has changed. Clinically, I see extended-release and, indeed, lower doses to be more effective than 20 mg nightly,” he noted.
Dr. Seely and colleagues also assessed proposed mechanisms for melatonin’s possible benefit in NSCLC but found no effect on natural killer cell cytotoxicity or phenotype and no effect on blood levels of inflammatory cytokines in a substudy of 92 patients.
This research was funded by the Lotte and John Hecht Memorial Foundation and the Gateway for Cancer Research Foundation. The researchers had no relevant disclosures.
FROM ECLINICALMEDICINE
Clinical Advances in Rhinosinusitis From AAAAI 2021
Dr Anju Peters, an expert in allergy and immunology from Northwestern University, discusses data on new and emerging biologics in rhinosinusitis presented at the 2021 American Academy of Allergy, Asthma & Immunology (AAAAI) Virtual Annual Meeting.
Dr Peters reviews a study examining the effect of dupilumab (Dupixent) on blood eosinophil levels in patients with a range of atopic/allergic diseases; the trial found that hypereosinophilia was rare.
She then addresses two post-hoc analyses of phase 3 dupilumab trials in chronic rhinosinusitis with nasal polyps (CRSwNP). The first examined the impact of the disease on physical and mental health–related quality of life. The second assessed the effect of the drug on both objective and patient-reported subjective endpoints.
Dr Peters closes by discussing two studies that relied on data from the SYNAPSE phase 3 trial of the anti–IL-5 antibody mepolizumab (Nucala) vs placebo in adult patients with CRSwNP. The first looked at the effect of the drug on health-related quality of life, while the second focused on meaningful within-patient changes in disease outcomes.
--
Professor, Department of Medicine, Division of Allergy-Immunology, Northwestern University Feinberg School of Medicine; Director of Clinical Research, Associate Chief of Research, Education, and Clinical Affairs, Division of Allergy-Immunology, Northwestern Medicine, Chicago, Illinois.
Anju T. Peters, MD, MSci, has disclosed the following relevant financial relationships:
Serve(d) on the advisory board for: Sanofi Regeneron; Optinose; AstraZeneca. Received research grant from: AstraZeneca; Optinose.

Severe Asthma Highlights From AAAAI 2021
Key studies on severe asthma from the 2021 American Academy of Allergy, Asthma & Immunology (AAAAI) meeting include data on newer biologic treatments.
Dr Mario Castro, of the University of Kansas School of Medicine in Kansas City, discusses results from the pivotal NAVIGATOR trial. This 1-year study demonstrated that tezepelumab, a monoclonal antibody inhibitor of the activity of thymic stromal lymphopoietin (TSLP), can provide clinically meaningful exacerbation reductions inpatients with severe asthma.
Dr Castro also discusses the phase 3 PONENTE study of benralizumab, a biologic therapy that targets the IL-5 pathway to reduce eosinophilic inflammation. He reviews data showing that benralizumab can significantly reduce the use of oral corticosteroids in patients with asthma, and considers the PONENTE trial results in light of data from the prior ZONDA phase 3 clinical trial.
--
Mario Castro, MD, MPH, Professor; Chief, Department of Medicine, Division of Pulmonary, Critical Care, and Sleep Medicine, University of Kansas School of Medicine, Kansas City, Kansas.
Mario Castro, MD, MPH, has disclosed the following relevant financial relationships:
Serve(d) as a director, officer, partner, employee, advisor, consultant, or trustee for: Genentech; Teva; Sanofi-Aventis; Novartis.
Serve(d) as a speaker or a member of a speakers bureau for: AstraZeneca; Genentech; GlaxoSmithKline; Regeneron; Sanofi; Teva.
Received research grant from: AstraZeneca; GlaxoSmithKline; Pulmatrix; Sanofi-Aventis; Shirogi.

A young girl presents with ‘itchy, rashy’ hands
Given the presence of erythema, lichenification, fissuring, and scale of the hands over the course of more than 3 months with the absence of nail findings is most consistent with a diagnosis of chronic hand eczema.

Chronic hand eczema (CHE) is an inflammatory dermatitis of the hands or wrists that persists for longer than 3 months or recurs twice or more in a 12-month timespan.1,2 Hand eczema can be a manifestation of atopic dermatitis, allergic contact dermatitis, or irritant contact dermatitis. Its multifactorial pathogenesis includes epidermal injury and disturbed epidermal barrier function from exogenous factors such as irritants or contact allergens, as well as endogenous factors including atopic dermatitis.3 In pediatrics, it often presents after an acute phase of hand dermatitis with chronic pruritus, erythema, and dry skin with scale.4 Examination findings vary widely with erythema, vesicles, scale, fissures, crusting, hyperkeratosis, and/or lichenification.3,5 Diagnosis is often achieved with careful history, asking about potential exposures that may induce lesions, and physical exam of the entire skin, including the feet. Based upon clinical history or persistent dermatitis, allergic contact dermatitis patch testing should be considered.2
What’s the treatment plan?
Given that CHE is an inflammatory disease process, the goal of treatment is to reduce inflammation and allow for skin barrier repair. Unfortunately, only one study has investigated therapeutics for pediatric CHE,6 with the remainder of the literature based on adult CHE. Current CHE guidelines recommend avoidance of allergens, irritants, or other triggers of the disease as well as liberal and regular use of emollients. Because of the relative thickness of hand skin, higher-potency topical corticosteroids are often used as first-line therapy, with lower-strength topical steroids, calcineurin inhibitors, or crisaborole used as maintenance therapy. Other treatment options include phototherapy, and rarely, systemic therapies are utilized for atopic dermatitis.
What’s the differential diagnosis?
The differential diagnosis of CHE includes other scaling or hyperkeratotic skin conditions including psoriasis and tinea manuum. Other skin conditions that localize to extremities including scabies and hand-foot-and-mouth disease are discussed below.

Psoriasis can present on the hands with erythematous, well-demarcated, silver scaling plaques. However, additional plaques may be found on the elbows, knees, scalp, umbilicus, and sacrum. Nails can demonstrate pitting, oil drops, splinter hemorrhages, or onycholysis. First-line treatment includes a combination of topical steroids, topical vitamin D analogues, and keratolytics.
Tinea mannum is a dermatophyte infection of the skin of the hands. Typically, only one hand is affected with concomitant bilateral tinea pedis. It results in a white scaly plaque with dorsal hand involvement demonstrating an annular appearance, elevated edge, and central clearing. KOH prep will demonstrate septate hyphae, and cultures will grow dermatophyte colonies. Treatment includes topical antifungals or systemic antifungals for recalcitrant disease.
Scabies presents with short linear hypopigmented lesions with a black dot on one end as well as erythematous pruritic papules. These appear on the interdigital web spaces, wrists, axilla, buttocks, and genital region. Skin scraping prep with mineral oil can show mites and eggs. All individuals in an affected household should be treated with either topical permethrin or oral ivermectin to avoid reinfection or parasitic spread. All contacted linens must be cleaned with hot water and dried on high heat.
Hand-foot-and-mouth disease, classically caused by coxsackievirus, is an acute viral illness that results in an eruption of erythematous macules, papules, and vesicles on the ventral hands, soles of the feet, and oral mucosa. Diagnosis is achieved clinically and treatment is symptomatic as the lesions are self-limited.
Our patient underwent patch testing but did not return positive to any allergens. She was started on potent topical corticosteroids, educated on trigger avoidance, and gradually achieved good disease control.
Neither Mr. Haft nor Dr. Eichenfield have any relevant financial disclosures.
Michael Haft is a pediatric dermatology research associate in the division of pediatric and adolescent dermatology at the University of California, San Diego, and Rady Children’s Hospital, San Diego. He is a 4th year medical student at the University of Rochester (N.Y.). Dr. Eichenfield is vice chair of the department of dermatology and professor of dermatology and pediatrics at the University of California, San Diego, and Rady Children’s Hospital.
References
1. Diepgen TL et al. Br J Dermatol. 2009;160(2):353-8.
2. Diepgen TL et al. J Dtsch Dermatol Ges. 2015;13(1):e1-22.
3. Agner T and Elsner P. J Eur Acad Dermatol Venereol. 2020;34 Suppl 1:4-12.
4. Mortz CG et al. Br J Dermatol. 2001;144(3):523-32.
5. Silvestre Salvador JF et al. Actas Dermosifiliogr. 2020;111(1):26-40.
6. Luchsinger I et al. J Eur Acad Dermatol Venereol. 2020;34(5):1037-42.
7. English J et al. Clin Exp Dermatol. 2009;34(7):761-9.
8. Elsner P and Agner T. J Eur Acad Dermatol Venereol. 2020;34 Suppl 1:13-21.
Given the presence of erythema, lichenification, fissuring, and scale of the hands over the course of more than 3 months with the absence of nail findings is most consistent with a diagnosis of chronic hand eczema.
Chronic hand eczema (CHE) is an inflammatory dermatitis of the hands or wrists that persists for longer than 3 months or recurs twice or more in a 12-month timespan.1,2 Hand eczema can be a manifestation of atopic dermatitis, allergic contact dermatitis, or irritant contact dermatitis. Its multifactorial pathogenesis includes epidermal injury and disturbed epidermal barrier function from exogenous factors such as irritants or contact allergens, as well as endogenous factors including atopic dermatitis.3 In pediatrics, it often presents after an acute phase of hand dermatitis with chronic pruritus, erythema, and dry skin with scale.4 Examination findings vary widely with erythema, vesicles, scale, fissures, crusting, hyperkeratosis, and/or lichenification.3,5 Diagnosis is often achieved with careful history, asking about potential exposures that may induce lesions, and physical exam of the entire skin, including the feet. Based upon clinical history or persistent dermatitis, allergic contact dermatitis patch testing should be considered.2
What’s the treatment plan?
Given that CHE is an inflammatory disease process, the goal of treatment is to reduce inflammation and allow for skin barrier repair. Unfortunately, only one study has investigated therapeutics for pediatric CHE,6 with the remainder of the literature based on adult CHE. Current CHE guidelines recommend avoidance of allergens, irritants, or other triggers of the disease as well as liberal and regular use of emollients. Because of the relative thickness of hand skin, higher-potency topical corticosteroids are often used as first-line therapy, with lower-strength topical steroids, calcineurin inhibitors, or crisaborole used as maintenance therapy. Other treatment options include phototherapy, and rarely, systemic therapies are utilized for atopic dermatitis.
What’s the differential diagnosis?
The differential diagnosis of CHE includes other scaling or hyperkeratotic skin conditions including psoriasis and tinea manuum. Other skin conditions that localize to extremities including scabies and hand-foot-and-mouth disease are discussed below.
Psoriasis can present on the hands with erythematous, well-demarcated, silver scaling plaques. However, additional plaques may be found on the elbows, knees, scalp, umbilicus, and sacrum. Nails can demonstrate pitting, oil drops, splinter hemorrhages, or onycholysis. First-line treatment includes a combination of topical steroids, topical vitamin D analogues, and keratolytics.
Tinea mannum is a dermatophyte infection of the skin of the hands. Typically, only one hand is affected with concomitant bilateral tinea pedis. It results in a white scaly plaque with dorsal hand involvement demonstrating an annular appearance, elevated edge, and central clearing. KOH prep will demonstrate septate hyphae, and cultures will grow dermatophyte colonies. Treatment includes topical antifungals or systemic antifungals for recalcitrant disease.
Scabies presents with short linear hypopigmented lesions with a black dot on one end as well as erythematous pruritic papules. These appear on the interdigital web spaces, wrists, axilla, buttocks, and genital region. Skin scraping prep with mineral oil can show mites and eggs. All individuals in an affected household should be treated with either topical permethrin or oral ivermectin to avoid reinfection or parasitic spread. All contacted linens must be cleaned with hot water and dried on high heat.
Hand-foot-and-mouth disease, classically caused by coxsackievirus, is an acute viral illness that results in an eruption of erythematous macules, papules, and vesicles on the ventral hands, soles of the feet, and oral mucosa. Diagnosis is achieved clinically and treatment is symptomatic as the lesions are self-limited.
Our patient underwent patch testing but did not return positive to any allergens. She was started on potent topical corticosteroids, educated on trigger avoidance, and gradually achieved good disease control.
Neither Mr. Haft nor Dr. Eichenfield have any relevant financial disclosures.
Michael Haft is a pediatric dermatology research associate in the division of pediatric and adolescent dermatology at the University of California, San Diego, and Rady Children’s Hospital, San Diego. He is a 4th year medical student at the University of Rochester (N.Y.). Dr. Eichenfield is vice chair of the department of dermatology and professor of dermatology and pediatrics at the University of California, San Diego, and Rady Children’s Hospital.
References
1. Diepgen TL et al. Br J Dermatol. 2009;160(2):353-8.
2. Diepgen TL et al. J Dtsch Dermatol Ges. 2015;13(1):e1-22.
3. Agner T and Elsner P. J Eur Acad Dermatol Venereol. 2020;34 Suppl 1:4-12.
4. Mortz CG et al. Br J Dermatol. 2001;144(3):523-32.
5. Silvestre Salvador JF et al. Actas Dermosifiliogr. 2020;111(1):26-40.
6. Luchsinger I et al. J Eur Acad Dermatol Venereol. 2020;34(5):1037-42.
7. English J et al. Clin Exp Dermatol. 2009;34(7):761-9.
8. Elsner P and Agner T. J Eur Acad Dermatol Venereol. 2020;34 Suppl 1:13-21.
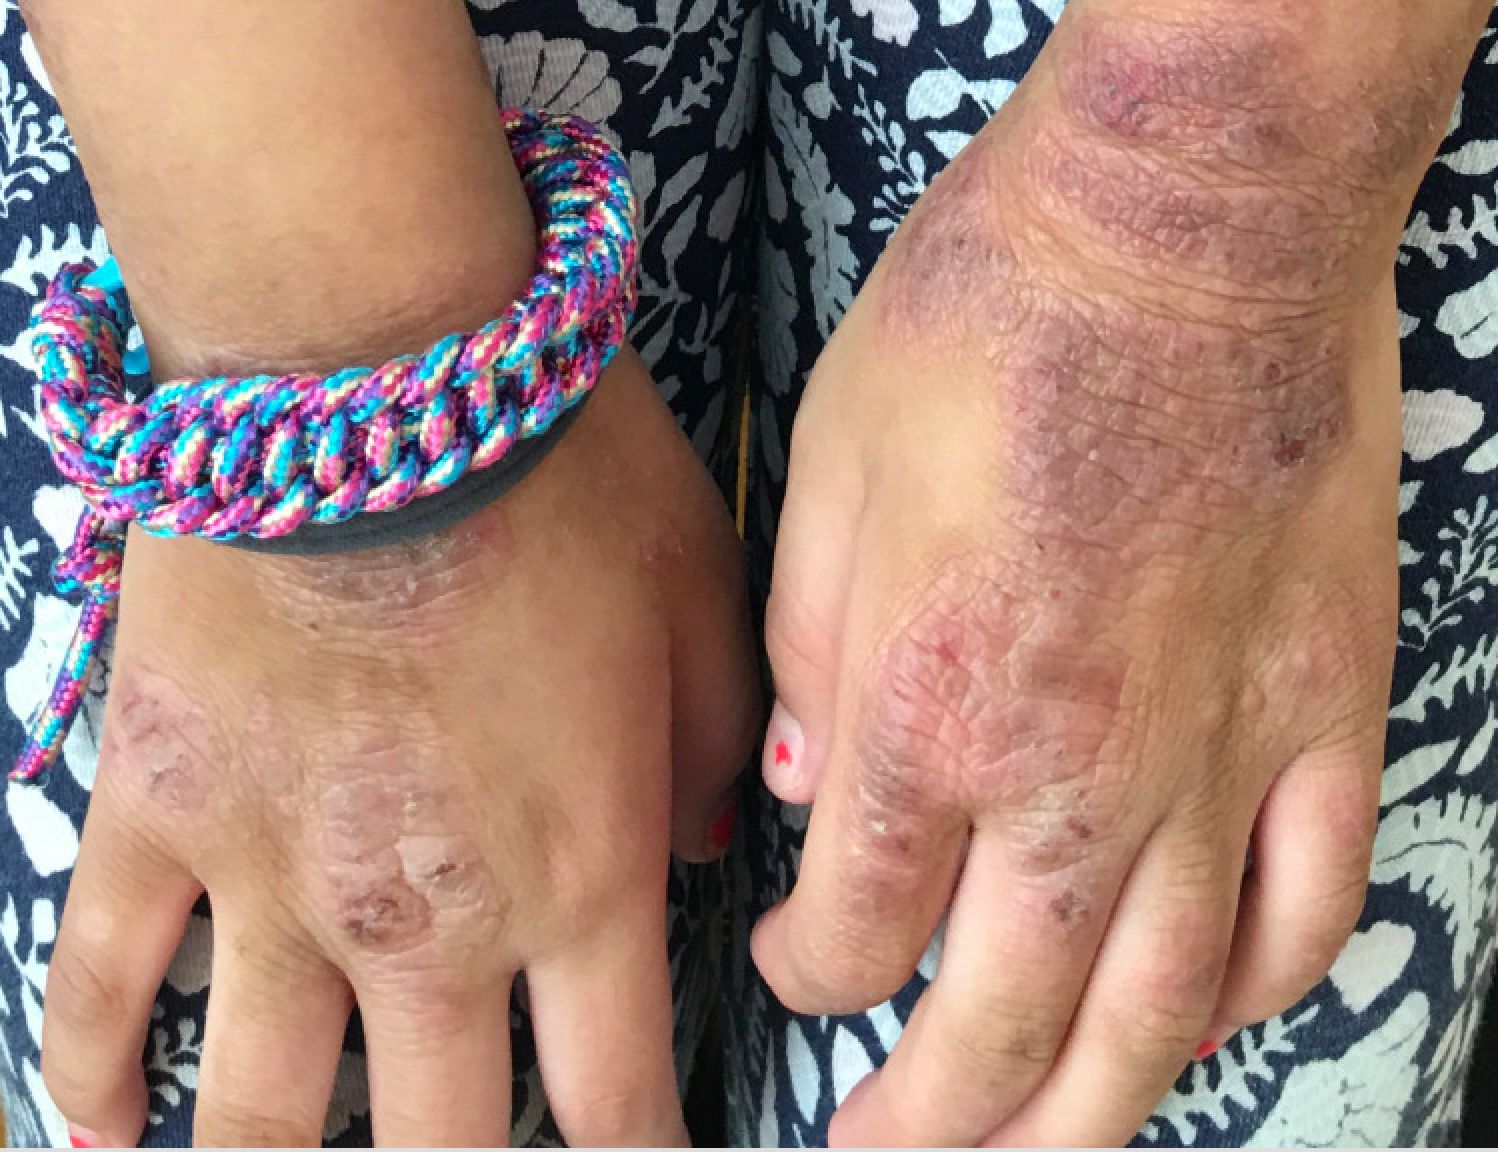
Examination findings of the bilateral hands and wrists demonstrate plaques of erythema, lichenification, and scale of the dorsal surfaces of the hands and digits. Closer inspection reveals fissuring and erythematous crust of the affected skin but normal nails. The rest of the skin exam is unremarkable.
Blood pressure meds tied to increased schizophrenia risk
ACE inhibitors may be associated with an increased risk for schizophrenia and may affect psychiatric symptoms, new research suggests.

Investigators found individuals who carry a genetic variant associated with lower levels of the ACE gene and protein have increased liability to schizophrenia, suggesting that drugs that lower ACE levels or activity may do the same.
“Our findings warrant further investigation into the role of ACE in schizophrenia and closer monitoring by clinicians of individuals, especially those with schizophrenia, who may be on medication that lower ACE activity, such as ACE inhibitors,” Sonia Shah, PhD, Institute for Biomedical Sciences, University of Queensland, Brisbane, Australia, said in an interview.
The study was published online March 10, 2021, in JAMA Psychiatry.
Antihypertensives and mental illness
Hypertension is common in patients with psychiatric disorders and observational studies have reported associations between antihypertensive medication and these disorders, although the findings have been mixed.
Dr. Shah and colleagues estimated the potential of different antihypertensive drug classes on schizophrenia, bipolar disorder, and major depressive disorder.
In a two-sample Mendelian randomization study, they evaluated ties between a single-nucleotide variant and drug-target gene expression derived from expression quantitative trait loci data in blood (sample 1) and the SNV disease association from published case-control, genomewide association studies (sample 2).
The analyses included 40,675 patients with schizophrenia and 64,643 controls; 20,352 with bipolar disorder and 31,358 controls; and 135,458 with major depressive disorder and 344,901 controls.
The major finding was that a one standard deviation–lower expression of the ACE gene in blood was associated with lower systolic blood pressure of 4.0 mm Hg (95% confidence interval, 2.7-5.3), but also an increased risk of schizophrenia (odds ratio, 1.75; 95% CI, 1.28-2.38).
Could ACE inhibitors worsen symptoms or trigger episodes?
In their article, the researchers noted that, in most patients, onset of schizophrenia occurs in late adolescence or early adult life, ruling out ACE inhibitor treatment as a potential causal factor for most cases.
“However, if lower ACE levels play a causal role for schizophrenia risk, it would be reasonable to hypothesize that further lowering of ACE activity in existing patients could worsen symptoms or trigger a new episode,” they wrote.
Dr. Shah emphasized that evidence from genetic analyses alone is “not sufficient to justify changes in prescription guidelines.”
“Patients should not stop taking these medications if they are effective at controlling their blood pressure and they don’t suffer any adverse effects. But it would be reasonable to encourage greater pharmacovigilance,” she said in an interview.
“One way in which we are hoping to follow up these findings,” said Dr. Shah, “is to access electronic health record data for millions of individuals to investigate if there is evidence of increased rates of psychotic episodes in individuals who use ACE inhibitors, compared to other classes of blood pressure–lowering medication.”
Caution warranted
Reached for comment, Timothy Sullivan, MD, chair of psychiatry and behavioral sciences at Staten Island University Hospital in New York, noted that this is an “extremely complicated” study and urged caution in interpreting the results.
“Since most people develop schizophrenia earlier in life, before they usually develop problems with blood pressure, it’s not so much that these drugs might cause schizophrenia,” Dr. Sullivan said.
“But because of their effects on this particular gene, there’s a possibility that they might worsen symptoms or in somebody with borderline risk might cause them to develop symptoms later in life. This may apply to a relatively small number of people who develop symptoms of schizophrenia in their 40s and beyond,” he added.
That’s where “pharmacovigilance” comes into play, Dr. Sullivan said. “In other words, that they otherwise wouldn’t experience?”
Support for the study was provided by the National Health and Medical Research Council (Australia) and U.S. National Institute for Mental Health. Dr. Shah and Dr. Sullivan disclosed no relevant financial relationships.
A version of this article first appeared on Medscape.com.
ACE inhibitors may be associated with an increased risk for schizophrenia and may affect psychiatric symptoms, new research suggests.
Investigators found individuals who carry a genetic variant associated with lower levels of the ACE gene and protein have increased liability to schizophrenia, suggesting that drugs that lower ACE levels or activity may do the same.
“Our findings warrant further investigation into the role of ACE in schizophrenia and closer monitoring by clinicians of individuals, especially those with schizophrenia, who may be on medication that lower ACE activity, such as ACE inhibitors,” Sonia Shah, PhD, Institute for Biomedical Sciences, University of Queensland, Brisbane, Australia, said in an interview.
The study was published online March 10, 2021, in JAMA Psychiatry.
Antihypertensives and mental illness
Hypertension is common in patients with psychiatric disorders and observational studies have reported associations between antihypertensive medication and these disorders, although the findings have been mixed.
Dr. Shah and colleagues estimated the potential of different antihypertensive drug classes on schizophrenia, bipolar disorder, and major depressive disorder.
In a two-sample Mendelian randomization study, they evaluated ties between a single-nucleotide variant and drug-target gene expression derived from expression quantitative trait loci data in blood (sample 1) and the SNV disease association from published case-control, genomewide association studies (sample 2).
The analyses included 40,675 patients with schizophrenia and 64,643 controls; 20,352 with bipolar disorder and 31,358 controls; and 135,458 with major depressive disorder and 344,901 controls.
The major finding was that a one standard deviation–lower expression of the ACE gene in blood was associated with lower systolic blood pressure of 4.0 mm Hg (95% confidence interval, 2.7-5.3), but also an increased risk of schizophrenia (odds ratio, 1.75; 95% CI, 1.28-2.38).
Could ACE inhibitors worsen symptoms or trigger episodes?
In their article, the researchers noted that, in most patients, onset of schizophrenia occurs in late adolescence or early adult life, ruling out ACE inhibitor treatment as a potential causal factor for most cases.
“However, if lower ACE levels play a causal role for schizophrenia risk, it would be reasonable to hypothesize that further lowering of ACE activity in existing patients could worsen symptoms or trigger a new episode,” they wrote.
Dr. Shah emphasized that evidence from genetic analyses alone is “not sufficient to justify changes in prescription guidelines.”
“Patients should not stop taking these medications if they are effective at controlling their blood pressure and they don’t suffer any adverse effects. But it would be reasonable to encourage greater pharmacovigilance,” she said in an interview.
“One way in which we are hoping to follow up these findings,” said Dr. Shah, “is to access electronic health record data for millions of individuals to investigate if there is evidence of increased rates of psychotic episodes in individuals who use ACE inhibitors, compared to other classes of blood pressure–lowering medication.”
Caution warranted
Reached for comment, Timothy Sullivan, MD, chair of psychiatry and behavioral sciences at Staten Island University Hospital in New York, noted that this is an “extremely complicated” study and urged caution in interpreting the results.
“Since most people develop schizophrenia earlier in life, before they usually develop problems with blood pressure, it’s not so much that these drugs might cause schizophrenia,” Dr. Sullivan said.
“But because of their effects on this particular gene, there’s a possibility that they might worsen symptoms or in somebody with borderline risk might cause them to develop symptoms later in life. This may apply to a relatively small number of people who develop symptoms of schizophrenia in their 40s and beyond,” he added.
That’s where “pharmacovigilance” comes into play, Dr. Sullivan said. “In other words, that they otherwise wouldn’t experience?”
Support for the study was provided by the National Health and Medical Research Council (Australia) and U.S. National Institute for Mental Health. Dr. Shah and Dr. Sullivan disclosed no relevant financial relationships.
A version of this article first appeared on Medscape.com.
Women with PCOS at increased risk for COVID-19
Women with polycystic ovary syndrome (PCOS) face an almost 30% increased risk for COVID-19 compared with unaffected women, even after adjusting for cardiometabolic and other related factors, suggests an analysis of United Kingdom primary care data.
“Our research has highlighted that women with PCOS are an often overlooked and potentially high-risk population for contracting COVID-19,” said joint senior author Wiebke Arlt, MD, PhD, director of the Institute of Metabolism and Systems Research at the University of Birmingham (England), in a press release.
“Before the onset of the COVID-19 pandemic, women with PCOS consistently report fragmented care, delayed diagnosis and a perception of poor clinician understanding of their condition,” added co-author Michael W. O’Reilly, MD, PhD, University of Medicine and Health Sciences, Dublin.
“Women suffering from this condition may fear, with some degree of justification, that an enhanced risk of COVID-19 infection will further compromise timely access to health care and serve to increase the sense of disenfranchisement currently experienced by many patients,” he added.
Consequently, “these findings need to be considered when designing public health policy and advice as our understanding of COVID-19 evolves,” noted first author Anuradhaa Subramanian, PhD Student, Institute of Applied Health Research, University of Birmingham.
The research was published by the European Journal of Endocrinology on March 9.
Women with PCOS: A distinct subgroup?
PCOS, which is thought to affect up to 16% of women, is associated with a significantly increased risk for type 2 diabetes, non-alcoholic fatty liver disease, and cardiovascular disease, all which have been linked to more severe COVID-19.
The condition is more prevalent in Black and South Asian women, who also appear to have an increased risk for severe COVID-19 vs. their White counterparts.
However, women and younger people in general have a lower overall risk for severe COVID-19 and mortality compared with older people and men.
Women with PCOS may therefore “represent a distinct subgroup of women at higher than average [on the basis of their sex and age] risk of adverse COVID-19–related outcomes,” the researchers note.
To investigate further, they collated data from The Health Improvement Network primary care database, which includes information from 365 active general practices in the U.K. for the period Jan. 31, 2020, to July 22, 2020.
They identified women with PCOS or a coded diagnosis of polycystic ovaries (PCO), and then for each woman randomly selected four unaffected controls matched for age and general practice location.
They included 21,292 women with PCOS/PCO and 78,310 controls, who had a mean age at study entry of 39.3 years and 39.5 years, respectively. The mean age at diagnosis of PCOS was 27 years, and the mean duration of the condition was 12.4 years.
The crude incidence of COVID-19 was 18.1 per 1000 person-years among women with PCOS vs. 11.9 per 1000 person-years in those without.
Cox regression analysis adjusted for age indicated that women with PCOS faced a significantly increased risk for COVID-19 than those without, at a hazard ratio of 1.51 (P < .001).
Further adjustment for body mass index (BMI) and age reduced the hazard ratio to 1.36 (P = .001).
In the fully adjusted model, which also took into account impaired glucose regulation, androgen excess, anovulation, hypertension, and other PCOS-related factors, the hazard ratio remained significant, at 1.28 (P = .015).
For shielding, balance benefits with impact on mental health
Joint senior author Krishnarajah Nirantharakumar, MD, PhD, also of the University of Birmingham, commented that, despite the increased risks, shielding strategies for COVID-19 need to take into account the impact of PCOS on women’s mental health.
“The risk of mental health problems, including low self-esteem, anxiety, and depression, is significantly higher in women with PCOS,” he said, “and advice on strict adherence to social distancing needs to be tempered by the associated risk of exacerbating these underlying problems.”
Arlt also pointed out that the study only looked at the incidence of COVID-19 infection, rather than outcomes.
“Our study does not provide information on the risk of a severe course of the COVID-19 infection or on the risk of COVID-19–related long-term complications [in women with PCOS], and further research is required,” she concluded.
The study was funded by Health Data Research UK and supported by the Wellcome Trust, the Health Research Board, and the National Institute for Health Research Birmingham Biomedical Research Centre based at the University of Birmingham and University Hospitals Birmingham NHS Foundation Trust. The study authors have disclosed no relevant financial relationships.
A version of this article first appeared on Medscape.com.
Cumulative inflammatory burden predicts cancer risk in ulcerative colitis
The cumulative burden of histologic inflammation is a strong predictor of colorectal neoplasia risk in ulcerative colitis, according to a recent case-control study.

David T. Rubin, MD, was the senior author of the study, which provided independent validation of a metric for cumulative burden of inflammation as a risk stratification tool in ulcerative colitis and presented these findings at the Gastroenterology Updates, IBD, Liver Disease Conference. The metric was developed at St. Mark’s Hospital, London, which he called “a leader in the field.”
“The implication of demonstrating this is that, if you control inflammation and keep it controlled over time, it would imply that you can reduce the overall risk for cancer and dysplasia,” explained Dr. Rubin, professor of medicine and chief of the section of gastroenterology, hepatology, and nutrition at the University of Chicago.
The original retrospective St. Mark’s study included 987 patients with extensive ulcerative colitis followed with colonoscopic surveillance for a median of 13 years. Each colonoscopy was scored for severity of microscopic inflammation on a 0-3 scale. The investigators calculated a patient’s cumulative inflammatory burden by adding each histologic inflammatory activity score and multiplying that figure by the surveillance interval in years.
In a multivariate analysis, the London investigators demonstrated that the risk of colorectal neoplasia jumped by 2.1-fold for each 10-unit increase in cumulative inflammatory burden, defined as the equivalent of either 10 years of continuous mild active histologic inflammation, 5 years of continuous moderate inflammation, or 3.3 years of continuous severe inflammation.
The University of Chicago retrospective external validation study included 26 ulcerative colitis patients with colorectal neoplasia and 36 others without cancer. The mean cumulative histologic inflammatory activity score in the group with colorectal neoplasia was 12.63, compared with 7.98 in controls. For each 1-unit increase in cumulative inflammatory burden the risk of developing colorectal neoplasia increased by 8%, consistent with the magnitude of the hazard previously reported at St. Mark’s.
“The way you could take this back to your practice is by thinking carefully about what is the degree of inflammation each time you’ve done a colonoscopy and considering whether the patient who is in deep remission and doing well might deserve a longer interval between their next exam and the one you just completed,” according to the gastroenterologist.
“The most interval I give a patient is 3 years – for somebody in deep remission with no inflammation on the last exam. And when they’ve had prior inflammation but are now doing well, I keep in mind what that prior inflammation was. We’re now working on using that cumulative histologic inflammation score to guide intervals, but we don’t have prospective data to validate this approach. So when you’re not sure, the conservative approach is surveillance colonoscopy every 1-2 years after you’ve had 10 years of disease. That’s probably overutilization of our resources, but we don’t have a better way to do it yet,” Dr. Rubin said.
The novel metric for calculating cumulative histologic inflammation burden as a means of predicting colorectal cancer in ulcerative colitis dovetails with the current emphasis upon individualized risk assessment as recommended in the latest American College of Gastroenterology practice guidelines, for which Dr. Rubin was first author.
“Like we individualize our treatments, we should individualize our colorectal cancer screening and prevention strategies,” he emphasized.
Risk factors for colorectal cancer and dysplasia in patients with ulcerative colitis can be grouped as either potentially modifiable or immutable. Potentially modifiable risk factors include backwash ileitis, pseudopolyps, prior dysplasia, and mass or stricture, as well as the degree of histologic inflammation. Immutable risk factors include younger age at diagnosis, male gender, duration and extent of disease, family history of colorectal cancer, and primary sclerosing cholangitis, Dr. Rubin noted.
He reported receiving grant support from and/or serving as a consultant to more than two dozen medical companies.
The cumulative burden of histologic inflammation is a strong predictor of colorectal neoplasia risk in ulcerative colitis, according to a recent case-control study.
David T. Rubin, MD, was the senior author of the study, which provided independent validation of a metric for cumulative burden of inflammation as a risk stratification tool in ulcerative colitis and presented these findings at the Gastroenterology Updates, IBD, Liver Disease Conference. The metric was developed at St. Mark’s Hospital, London, which he called “a leader in the field.”
“The implication of demonstrating this is that, if you control inflammation and keep it controlled over time, it would imply that you can reduce the overall risk for cancer and dysplasia,” explained Dr. Rubin, professor of medicine and chief of the section of gastroenterology, hepatology, and nutrition at the University of Chicago.
The original retrospective St. Mark’s study included 987 patients with extensive ulcerative colitis followed with colonoscopic surveillance for a median of 13 years. Each colonoscopy was scored for severity of microscopic inflammation on a 0-3 scale. The investigators calculated a patient’s cumulative inflammatory burden by adding each histologic inflammatory activity score and multiplying that figure by the surveillance interval in years.
In a multivariate analysis, the London investigators demonstrated that the risk of colorectal neoplasia jumped by 2.1-fold for each 10-unit increase in cumulative inflammatory burden, defined as the equivalent of either 10 years of continuous mild active histologic inflammation, 5 years of continuous moderate inflammation, or 3.3 years of continuous severe inflammation.
The University of Chicago retrospective external validation study included 26 ulcerative colitis patients with colorectal neoplasia and 36 others without cancer. The mean cumulative histologic inflammatory activity score in the group with colorectal neoplasia was 12.63, compared with 7.98 in controls. For each 1-unit increase in cumulative inflammatory burden the risk of developing colorectal neoplasia increased by 8%, consistent with the magnitude of the hazard previously reported at St. Mark’s.
“The way you could take this back to your practice is by thinking carefully about what is the degree of inflammation each time you’ve done a colonoscopy and considering whether the patient who is in deep remission and doing well might deserve a longer interval between their next exam and the one you just completed,” according to the gastroenterologist.
“The most interval I give a patient is 3 years – for somebody in deep remission with no inflammation on the last exam. And when they’ve had prior inflammation but are now doing well, I keep in mind what that prior inflammation was. We’re now working on using that cumulative histologic inflammation score to guide intervals, but we don’t have prospective data to validate this approach. So when you’re not sure, the conservative approach is surveillance colonoscopy every 1-2 years after you’ve had 10 years of disease. That’s probably overutilization of our resources, but we don’t have a better way to do it yet,” Dr. Rubin said.
The novel metric for calculating cumulative histologic inflammation burden as a means of predicting colorectal cancer in ulcerative colitis dovetails with the current emphasis upon individualized risk assessment as recommended in the latest American College of Gastroenterology practice guidelines, for which Dr. Rubin was first author.
“Like we individualize our treatments, we should individualize our colorectal cancer screening and prevention strategies,” he emphasized.
Risk factors for colorectal cancer and dysplasia in patients with ulcerative colitis can be grouped as either potentially modifiable or immutable. Potentially modifiable risk factors include backwash ileitis, pseudopolyps, prior dysplasia, and mass or stricture, as well as the degree of histologic inflammation. Immutable risk factors include younger age at diagnosis, male gender, duration and extent of disease, family history of colorectal cancer, and primary sclerosing cholangitis, Dr. Rubin noted.
He reported receiving grant support from and/or serving as a consultant to more than two dozen medical companies.
FROM GUILD 2021
Study: Gynecologic cancer therapy does not increase COVID-19 risks
Women with gynecologic cancers can safely continue anticancer therapy, despite the threat of COVID-19, according to researchers.
The team found no significant association between recent anticancer therapy and COVID-19 hospitalization or mortality among patients with gynecologic cancers and COVID-19.
Some gynecologic cancer patients have expressed concerns that chemotherapy would weaken their immune system and increase their risk of more severe illness if they developed COVID-19, according to Olivia Lara, MD, a gynecologic oncology fellow at New York University.
Furthermore, some prior studies had shown an increased risk of health complications from COVID-19 among cancer patients. However, patients with gynecologic cancer were underrepresented in those studies.
With all this in mind, Dr. Lara and colleagues conducted a study of 193 patients with gynecologic cancers and COVID-19 who were treated at eight hospital systems in the New York City area from March 2020 through May 2020.
Dr. Lara presented the results at the Society of Gynecologic Oncology’s Virtual Annual Meeting on Women’s Cancer (Abstract 10663).
Study results
Of the 193 patients analyzed, 106 (54.9%) required hospitalization for COVID-19, including 13 (12.3%) who required mechanical ventilation and 39 (36.8%) who required ICU admission. There were 34 patients (17.6%) who died of COVID-19-related complications, including all who required mechanical ventilation.
Multivariable analyses showed that recent cytotoxic chemotherapy, which was used in 13 of the 34 patients who died (38.2%), and recent immunotherapy, which was used in 4 of the 34 patients (11.8%), were not predictive of COVID-19 hospitalization or mortality.
Only current or former smoking was associated with COVID-19-related death (odds ratio, 2.75).
An earlier analysis of data from 121 patients in this cohort showed an association between immunotherapy and COVID-19-related death, but this was no longer statistically significant in the updated analysis.
Factors significantly associated with hospitalization in the updated cohort were age 65 years or older (OR, 2.12), Black race (OR, 2.53), performance status of 2 or greater (OR, 3.67), and the presence of three or more comorbidities (OR, 2.00), the most common of which were hypertension, diabetes, and chronic kidney disease.
More research needed
The current findings show that recent chemotherapy or immunotherapy for gynecologic cancer do not raise the risk of death due to COVID-19, Dr. Lara said, adding that “[w]e can reassure women with gynecologic cancer that they can continue anticancer therapy.”
The finding of a nearly threefold increased risk of hospitalization among Black patients in this study underscores the need for “better understanding of the risks of COVID-19 in vulnerable populations,” Dr. Lara noted.
“Going forward, the impact of the COVID-19 pandemic on cancer care delivery and cancer screening must be evaluated,” she said. “Data collection is ongoing, with additional analyses and studies planned to investigate the impact COVID-19 has had on gynecologic cancer care through the SGO registry.”
The current findings are strengthened by the collaborative multicenter study design and use of multivariable analyses, said invited discussant and study coauthor Bhavana Pothuri, MD, of New York University.
However, it is unclear whether the results are generalizable to other parts of the country or world, and whether the outcomes have changed since the initial surge of COVID-19 cases.
Dr. Lara said the fatality rate in this cohort is similar to that of age-matched women with COVID-19 who did not have cancer, and she acknowledged that fatality rates may be lower now than they were early in the pandemic when the study was conducted.
This study was supported, in part, by a Cancer Center Support Grant from the National Institutes of Health/National Cancer Institute. Dr. Lara reported having no disclosures. Dr. Pothuri disclosed relationships with Tesaro/GlaxoSmithKline, AstraZeneca, Merck, Genentech/Roche, Celsion, Clovis Oncology, Toray, Mersana, Elevar, and Eisai. She is also a member of GOG Partners leadership.
FROM SGO 2021
Update: U.S. regulators question AstraZeneca vaccine trial data
Federal regulators on March 23 said they were “concerned” that drug maker AstraZeneca included “outdated information” in its announcement the previous day that the company’s COVID-19 vaccine was effective.
The federal Data and Safety Monitoring Board shared those concerns with the company as well as with the National Institute of Allergy and Infectious Diseases, and the U.S. Biomedical Advanced Research and Development Authority, according to a statement from NIAID issued early March 23.
“We urge the company to work with the DSMB to review the efficacy data and ensure the most accurate, up-to-date efficacy data be made public as quickly as possible,” the agency said.
The NIAID statement does not say what data may have been outdated or how it may have changed the results. The company said March 22 it plans to see U.S. authorization for the vaccine in April.
The statement from NIAID comes a day after AstraZeneca said the interim results of their phase III U.S. study found it was 79% effective against symptomatic COVID-19, 80% effective in people 65 years and older, and 100% effective against severe or critical disease and hospitalization.
Company officials and clinical trial investigators on March 22 also addressed the recent concerns about blood clots, how well the vaccine will perform against variants, and provided a timeline for seeking regulatory approval.
“There are many countries in Europe and throughout the world that have already authorized this. The fact that a United States-run study has confirmed the efficacy and safety of this vaccine, I think is an important contribution to global health in general,” Anthony Fauci, MD, chief medical advisor to President Joe Biden, said during a White House press briefing March 22.
Andy Slavitt, White House senior advisor for the COVID-19 Response Team, had a more tempered reaction.
“It’s important to remind everyone we cannot and will not get ahead of the FDA,” he said. “While we would certainly call today’s news encouraging, it’s the kind of thing we like to see, we have a rigorous process that will come once an EUA is submitted and that will give us more information.”
With 30 million doses at the ready, the company plans to file for FDA emergency use authorization “within weeks,” Menelas Pangalos, executive vice president of biopharmaceuticals research and development at AstraZeneca, said during a media briefing March 22.
Risk of thrombosis addressed
Regarding highly publicized reports of problems with blood clots from the AstraZeneca vaccine, the World Health Organization found the vaccine creates no greater risks, as did the European Medicines Agency
“We’ve had absolute confidence in the efficacy of the vaccine. Seeing this data now I hope gives others increased confidence that this is a very safe and effective vaccine,” Mr. Pangalos said.
“We’re glad this is being investigated really thoroughly,” Magda Sobieszczyk, MD, an infectious disease specialist at Columbia University In New York City, said. “It’s incredibly reassuring that the regulatory agencies have looked at the data thoroughly and there is no enhanced signal above what is seen in the population.”
“There were no concerning signals noted in the U.S. data,” she added.
Regarding the risk of blood clots, “These data are therefore timely in further addressing any safety concerns that could undermine vaccine uptake.” Andrew Garrett, PhD, executive vice president of scientific operations at ICON Clinical Research, agreed.
The vaccine was well-tolerated, the company reported, with no serious adverse events. Temporary pain and tenderness at the injection site, mild-to-moderate headaches, fatigue, chills, fever, muscle aches. and malaise were among the reported reactions.
The phase III interim results show 141 cases of symptomatic COVID-19 in the study of 32,449 adults. “We don’t have the whole breakdown yet . . . these are the high-level results we just got this week,” Mr. Pangalos said. Further information on rates of mild to moderate COVID-19 illness between groups is not yet available, for example.
The company explained that participants were randomly assigned to vaccine or placebo, with twice as many receiving the actual vaccine.
The trial is ongoing, so the FDA will receive information on more than the 141 COVID-19 symptomatic cases when the company submits a full primary analysis to the agency, Mr. Pangalos said.
In the phase III study, patients received two doses 4 weeks apart.
Beyond the U.S. study, the company has additional information, including real-world data from the United Kingdom, that it intends to submit to the FDA. Part of this evidence suggests increased efficacy when a second dose is administered at 3 months
‘Robust’ findings
“This is a large study, so these results can be expected to be robust. They could be expected to be even more so if there were more cases to compare between the groups, but 141 is still a substantial number of cases,” said Peter English, MD, of Horsham, United Kingdom, who is immediate past chair of the British Medical Association Public Health Medicine Committee.
Experts welcomed the 80% efficacy in people 65 and older in particular. “Importantly, the trial provides further support for efficacy in the elderly where previous clinical trial data, other than immunologic data, had been lacking,” Dr. Garrett said.
“It is clear this vaccine has very good efficacy. Remember that 60% was, prior to any trials being started, regarded as a good target,” said Stephen Evans, professor of pharmacoepidemiology at the London School of Hygiene & Tropical Medicine. “This efficacy does not show a notable decline at older ages. This was expected and the speculation that it was ineffective or quasi-ineffective at older ages was totally unjustified.
“This is good news for the global community and one hopes that any political statements around this good news are avoided,” he added.
Efficacy against variants?
Regarding virus variants, Mr. Pangalos noted the study was conducted when several variants of concern were in circulation.
“What I can say is given this study was conducted much later in terms of timing, it’s very encouraging that we’ve got such high efficacy numbers when undoubtedly there are variants of concern in circulation in this study,” Mr. Pangalos said.
“It also highlights why we believe that against severe disease, our vaccine will be effective against all variants of concern,” he added.
Once the company submits its EUA to the FDA, the company is ready to immediately distribute 30 million doses of the vaccine and expects to ship 50 million total within the first month, Ruud Dobber, PhD, AstraZeneca executive vice president and president of the AZ Biopharmaceuticals Business Unit, said during the briefing.
The vaccine can be stored at 2 to 8 degrees Celsius for at least 6 months. Like other COVID-19 vaccines already authorized for emergency use, the duration of protection with the AstraZeneca product remains unknown.
This article was updated March 23, 2021.
A version of this article first appeared on WebMD.com.