User login
Finding fulfillment in a psychiatry clinical teaching role
On my third day as a PGY-4 junior attending on the inpatient psychiatric ward, 2 new PGY-1 residents, 2 medical students, and I stood in the wee hours of the morning, preparing to meet with our attending to begin rounds. I took the opportunity to discuss potential antipsychotic selection for one of our patients. I questioned the students to gauge their level of knowledge on antipsychotics in general, and did some “thinking out loud” about what our possible options could be. We discussed which antipsychotics are considered “weight-neutral” and which ones require caloric intake for adequate absorption. We discussed what other laboratory tests we should consider upon initiating the hypothetical medication. While discussing these things, I was suddenly taken aback to see that every member of my team was diligently taking notes and hanging on my every word!
Lessons from my teaching experiences
Taking on the role of junior attending has made me reflect on a few things about the transition that I will undergo at the end of this year, from resident to attending. First, teaching makes me keen to really sharpen my own knowledge, so that I can provide accurate information with confidence and ease. Making valid clinical decisions is a basic attending skill, but eloquently explaining clinical decisions to trainees with varying levels of background knowledge is a unique teaching attending necessity.
Second, I had this amazing feeling of helping patients beyond those currently in my care, since disseminating useful clinical information will allow trainees to better prepare to treat their own patients later. Random hypothetical situations presented by my attendings through the years may have seemed tangentially related to rounds at the time, but were meant to prepare me for actual future decisions (for example, “What would you change if this patient’s renal impairment were more severe?”). These teaching moments strengthen problem-solving skills and help us get as much benefit as possible from each case. The service to future patients extends to students who aren’t pursuing careers in psychiatry, because the skills they learn during a psychiatry rotation will help them connect with patients in any setting.
Third, I realized that teaching has the power to actively shape the future of medicine. What my attendings have taught me through the years is echoed and amplified in my teaching, and supplemented with my own readings and practice patterns.
Fourth, I noted what a privilege it is to be in a field with such attentive and eager trainees; as teachers in medicine, we truly get to work with the cream of the crop, which is a joy and a great responsibility. Working with such highly motivated and attentive students can be intimidating, but as I realized later in the morning, when asked about the complete indications for gabapentin, I realized I’m comfortable saying, “I don’t know, let’s look it up together!”
My fifth and final realization from this exciting teaching experience was that as an attending, I will need to help manage the wellness and growth of my trainees. Attendings must strike a balance between pushing learners to gain mastery while protecting them from excessive stress. I am so grateful for the perceptiveness of my attendings and their ability to adapt to the demands of a clinical environment while maintaining a strong focus on teaching. I have often told PGY-1 residents, when they face feelings of inadequacy for early mistakes, “You have 4 whole years to learn how to do this job!”
These are the moments that make me appreciate the fulfillment that can come from teaching residents and medical students, and really put into perspective how far I’ve come as a trainee. Not long ago, I was one of those medical students scribbling notes while my attending effortlessly spouted medical knowledge, and I was worried I’d never learn the difference between clonidine and clozapine.

Asenapine transdermal system for schizophrenia

The asenapine transdermal system is available in 3 patch sizes: 20, 30, and 40 cm2, which deliver 3.8, 5.7, and 7.6 mg/24 hours of asenapine, respectively.3 Based on the average exposure (area under the plasma concentration curve [AUC]) of asenapine, 3.8 mg/24 hours corresponds to 5 mg twice daily of sublingual asenapine, and 7.6 mg/24 hours corresponds to 10 mg twice daily of sublingual asenapine.3 The “in-between” dose strength of 5.7 mg/24 hours would correspond to exposure to a total of 15 mg/d of sublingual asenapine. The recommended starting dose for asenapine transdermal system is 3.8 mg/24 hours. The dosage may be increased to 5.7 mg/24 hours or 7.6 mg/24 hours, as needed, after 1 week. The safety of doses above 7.6 mg/24 hours has not been evaluated in clinical studies. Asenapine transdermal system is applied once daily and should be worn for 24 hours only, with only 1 patch at any time. Application sites include the upper arm, upper back, abdomen, and hip. A different application site of clean, dry, intact skin should be selected each time a new patch is applied. Although showering is permitted, the use of asenapine transdermal system during swimming or taking a bath has not been evaluated. Of note, prolonged application of heat over an asenapine transdermal system increases plasma concentrations of asenapine, and thus application of external heat sources (eg, heating pads) over the patch should be avoided.
How it works
Product labeling notes that asenapine is an atypical antipsychotic, and that its efficacy in schizophrenia could be mediated through a combination of antagonist activity at dopamine D2 and serotonin 5-HT2A receptors.3 The pharmacodynamic profile of asenapine is complex5 and receptor-binding assays performed using cloned human serotonin, norepinephrine, dopamine, histamine, and muscarinic receptors demonstrated picomolar affinity (extremely high) for 5-HT2C and 5-HT2A receptors, subnanomolar affinity (very high) for 5-HT7, 5-HT2B, 5-HT6, and D3 receptors, and nanomolar affinity (high) for D2 receptors, as well as histamine H1, D4, a1-adrenergic, a2-adrenergic, D1, 5-HT5, 5-HT1A, 5-HT1B, and histamine H2 receptors. Activity of asenapine is that of antagonism at these receptors. Asenapine has no appreciable affinity for muscarinic cholinergic receptors.
The asenapine receptor-binding “fingerprint” differs from that of other antipsychotics. Some of these receptor affinities are of special interest in terms of potential efficacy for pro-cognitive effects and amelioration of abnormal mood.5,9 In terms of tolerability, a relative absence of affinity to muscarinic receptors would predict a low risk for anticholinergic adverse effects, but antagonism at histamine H1 and at a1-adrenergic receptors, either alone or in combination, may cause sedation, and blockade of H1 receptors would also predict weight gain.9 Antagonism of a1-adrenergic receptors can be associated with orthostatic hypotension and neurally mediated reflex bradycardia.9
Clinical pharmacokinetics
Three open-label, randomized, phase 1 studies were conducted to assess the relative bioavailability of asenapine transdermal system vs sublingual asenapine.10 These included single- and multiple-dose studies and clinical trials that examined the effects of different application sites and ethnic groups, and the effect of external heat on medication absorption. Studies were conducted in healthy individuals, except for the multiple-dose study, which was performed in adults with schizophrenia. The AUC for asenapine transdermal system was within the range of that of equivalent doses of sublingual asenapine, but peak exposure (maximum concentration) was significantly lower. As already noted, the AUC of the asenapine patch for 3.8 mg/24 hours and 7.6 mg/24 hours corresponds to sublingual asenapine 5 mg and 10 mg twice daily, respectively. Maximum asenapine concentrations are typically reached between 12 and 24 hours, with sustained concentrations during the 24-hour wear time.3 On average, approximately 60% of the available asenapine is released from the transdermal system over 24 hours. Steady-state plasma concentrations for asenapine transdermal system were achieved approximately 72 hours after the first application and, in contrast to sublingual asenapine, the peak-trough fluctuations were small (peak-to-trough ratio is 1.5 for asenapine transdermal system compared with >3 for sublingual asenapine). Dose-proportionality at steady state was evident for asenapine transdermal system. This is in contrast to sublingual asenapine, where exposure increases 1.7-fold with a 2-fold increase in dose.4,5 Following patch removal, the apparent elimination half-life is approximately 30 hours.3 The pharmacokinetics of the patch did not vary with regards to the application site (upper arm, upper back, abdomen, or hip area), and the pharmacokinetic profile was similar across the ethnic groups that participated in the study. Direct exposure to external heat did increase both the rate and extent of absorption, so external heat sources should be avoided.3
Efficacy
The efficacy profile for asenapine transdermal system would be expected to mirror that for sublingual asenapine.6,7 In addition to data supporting the use of asenapine as administered sublingually, a phase 3 study specifically assessed efficacy and safety of asenapine transdermal system in adults with schizophrenia.11,12 This study was conducted in the United States and 4 other countries at a total of 59 study sites, and 616 patients with acutely exacerbated schizophrenia were enrolled. After a 3- to 14-day screening/single-blind run-in washout period, participants entered a 6-week inpatient double-blind period. Randomization was 1:1:1 to asenapine transdermal system 3.8 mg/24 hours, 7.6 mg/24 hours, or a placebo patch. Each of the patch doses demonstrated significant improvement vs placebo at Week 6 for the primary (change in Positive and Negative Syndrome Scale [PANSS] total score) and key secondary (change in Clinical Global Impression-Severity of Illness) endpoints. Response at endpoint, as defined by a ≥30% improvement from baseline PANSS total score, or by a Clinical Global Impression–Improvement score of 1 (very much improved) or 2 (much improved), was also assessed. For either definition of response, both doses of asenapine transdermal system were superior to placebo, with number needed to treat (NNT) (Box) values <10 for the 3.8 mg/24 hours dose (Table 2). These effect sizes are similar to what is known about sublingual asenapine as determined in a meta-analysis performed by the manufacturer and using individual patient data.13
Box
Clinical trials produce a mountain of data that can be difficult to interpret and apply to clinical practice. When reading about studies, you may wonder:
- How large is the effect being measured?
- Is it clinically important?
- Are we reviewing a result that may be statistically significant but irrelevant for day-today patient care?
Number needed to treat (NNT) and number needed to harm (NNH)—two tools of evidence-based medicine—can help answer these questions. NNT helps us gauge effect size or clinical significance. It is different from knowing if a clinical trial result is statistically significant. NNT allows us to place a number on how often we can expect to encounter a difference between two interventions. If we see a therapeutic difference once every 100 patients (NNT of 100), the difference between the treatments is not of great concern under most circumstances. But if a difference in outcome is seen once in every 7 patients being treated with an intervention vs another (NNT of 7), the result will likely influence dayto-day practice.
How to calculate NNT (or NNH):
What is the NNT for an outcome for drug A vs drug B?
fA = frequency of outcome for drug A
fB = frequency of outcome for drug B
NNT = 1/[ fA - fB]
By convention, we round up the NNT to the next higher whole number.
For example, let’s say drugs A and B are used to treat depression, and they result in 6-week response rates of 55% and 75%, respectively. The NNT to encounter a difference between drug B and drug A in terms of responders at 6 weeks can be calculated as follows:
- Difference in response rates: .75 -.55 = .20
- NNT: 1/.20 = 5
A rule of thumb: NNT values for a medication vs placebo <10 usually denote a medication we use on a regular basis to treat patients.
a Adapted from Citrome L. Dissecting clinical trials with ‘number needed to treat.’ Current Psychiatry. 2007;6(3):66-71. Citrome L. Can you interpret confidence intervals? It’s not that difficult. Current Psychiatry. 2007;6(8):77-82. Additional information can be found in Citrome L, Ketter TA. When does a difference make a difference? Interpretation of number needed to treat, number needed to harm, and likelihood to be helped or harmed. Int J Clin Pract. 2013;67(5):407-411 (free to access at onlinelibrary.wiley.com/doi/full/10.1111/ijcp.12142)
Overall tolerability and safety
The systemic safety and tolerability profile for asenapine transdermal system would be expected to be similar to that for sublingual asenapine, unless there are adverse events that are related to high peak plasma concentrations or large differences between peak and trough plasma concentrations.6 Nonsystemic local application site adverse events would, of course, differ between sublingual vs transdermal administration.

Continue to: Use of asenapine transdermal system...
Use of asenapine transdermal system avoids the dysgeusia and oral hypoesthesia that can be observed with sublingual asenapine4,6; however, dermal effects need to be considered (see Dermal safety). The most commonly observed adverse reactions (incidence ≥5% and at least twice that for placebo) for asenapine transdermal system are extrapyramidal disorder, application site reaction, and weight gain.3 For sublingual asenapine for adults with schizophrenia, the list includes akathisia, oral hypoesthesia, and somnolence.4 These adverse events can be further described using the metric of number needed to harm (NNH) as shown in Table 3.3,4,11,12,14 Of note, extrapyramidal disorder and weight gain appear to be dose-related for asenapine transdermal system. Akathisia appears to be dose-related for sublingual asenapine but not for asenapine transdermal system. Somnolence appears to be associated with sublingual asenapine but not necessarily with asenapine transdermal system.

For sublingual asenapine, the additional indications (bipolar I disorder as acute monotherapy treatment of manic or mixed episodes in adults and pediatric patients age 10 to 17, adjunctive treatment to lithium or valproate in adults, and maintenance monotherapy treatment in adults) have varying commonly encountered adverse reactions.4 Both transdermal asenapine system and sublingual asenapine are contraindicated in patients with severe hepatic impairment (Child-Pugh C) and those with known hypersensitivity to asenapine or to any components in the formulation. Both formulations carry similar warnings in their prescribing information regarding increased mortality in older patients with dementia-related psychosis, cerebrovascular adverse reactions in older patients with dementia-related psychosis, neuroleptic malignant syndrome, tardive dyskinesia, metabolic changes, orthostatic hypotension, leukopenia (and neutropenia and agranulocytosis), QT prolongation, seizures, and potential for cognitive and motor impairment.
Adverse events leading to discontinuation of study treatment in the asenapine transdermal system pivotal trial occurred in 4.9%, 7.8%, and 6.8% of participants in the 3.8 mg/24 hour, 7.6 mg/24 hour, and placebo groups, respectively.11
Dermal safety
In the pivotal efficacy study,11 the incidence of adverse events at patch application sites was higher in the active groups vs placebo (Table 33,4,11,12,14). The most frequently reported patch application site reactions were erythema and pruritus, occurring in approximately 10% and 4% in the active treatment arms vs 1.5% and 1.9% for placebo, respectively. With the exception of 1 adverse event of severe application site erythema during Week 2 (participant received 7.6 mg/24 hour, erythema resolved without intervention, and the patient continued the study), all other patch application site events were mild or moderate in severity. Rates of discontinuation due to application site reactions or skin disorders were ≤0.5% across all groups. In the pharmacokinetic studies,10 no patches were removed because of unacceptable irritation.
Why Rx?
Asenapine transdermal system is the first antipsychotic “patch” FDA-approved for the treatment of adults with schizophrenia. Asenapine has been available since 2009 as a sublingual formulation administered twice daily. The pharmacokinetic profile of the once-daily transdermal system demonstrates dose-proportional kinetics and sustained delivery of asenapine with a low peak-to-trough plasma level ratio. Three dosage strengths (3.8, 5.7, and 7.6 mg/24 hours) are available, corresponding to blood levels attained with sublingual asenapine exposures of 10, 15, and 20 mg/d, respectively. Application sites are rotated daily and include the upper arms, upper back, abdomen, or hip. Dysgeusia and hypoesthesia of the tongue are avoided with the use of the patch, and there are no food or drink restrictions. Attention will be needed in case of dermal reactions, similar to that observed with other medication patches.
Bottom Line
The asenapine transdermal drug delivery system appears to be efficacious and reasonably well tolerated. The treatment of schizophrenia is complex and requires individualized choices in order to optimize outcomes. A patch may be the preferred formulation for selected patients, and caregivers will have the ability to visually check if the medication is being used.
Related Resource
- Hisamitsu Pharmaceutical Co., Inc. SECUADO® (asenapine) transdermal system prescribing information. October 2019. https://www.accessdata.fda.gov/drugsatfda_docs/label/2019/212268s000lbl.pdf
Drug Brand Names
Asenapine sublingual • Saphris
Asenapine transdermal system • Secuado
Lithium • Eskalith, Lithobid
Valproate • Depakote
1. Noven. US FDA approves SECUADO® (asenapine) transdermal system, the first-and-only transdermal patch for the treatment of adults with schizophrenia. October 15, 2019. Accessed January 15, 2021. https://www.noven.com/wp-content/uploads/2020/04/PR101519.pdf
2. US Food and Drug Administration. Center for Drug Evaluation and Research. Approval Package for: APPLICATION NUMBER: 212268Orig1s000. October 11, 2019. Accessed January 15, 2021. https://www.accessdata.fda.gov/drugsatfda_docs/nda/2019/212268Orig1s000Approv.pdf
3. Hisam itsu Pharmaceutical Co., Inc. SECUADO® (asenapine) transdermal system prescribing information. October 2019. https://www.accessdata.fda.gov/drugsatfda_docs/label/2019/212268s000lbl.pdf
4. Allergan USA, Inc. SAPHRIS® (asenapine) sublingual tablets prescribing information. February 2017. Accessed January 15, 2021. https://media.allergan.com/actavis/actavis/media/allergan-pdf-documents/product-prescribing/Final_labeling_text_SAPHRIS-clean-02-2017.pdf
5. Citrome L. Asenapine review, part I: chemistry, receptor affinity profile, pharmacokinetics and metabolism. Expert Opin Drug Metab Toxicol. 2014;10(6):893-903.
6. Citrome L. Asenapine review, part II: clinical efficacy, safety and tolerability. Expert Opin Drug Saf. 2014;13(6):803-830.
7. Citrome L. Chapter 31: Asenapine. In: Schatzberg AF, Nemeroff CB, eds. The American Psychiatric Association Publishing Textbook of Psychopharmacology, 5th ed. American Psychiatric Association Publishing; 2017:797-808.
8. Citrome L, Zeni CM, Correll CU. Patches: established and emerging transdermal treatments in psychiatry. J Clin Psychiatry. 2019;80(4):18nr12554. doi: 10.4088/JCP.18nr12554
9. Shayegan DK, Stahl SM. Atypical antipsychotics: matching receptor profile to individual patient’s clinical profile. CNS Spectr. 2004;9(10 suppl 11):6-14.
10. Castelli M, Suzuki K, Komaroff M, et al. Pharmacokinetic profile of asenapine transdermal system HP-3070: The first antipsychotic patch in the US. Poster presented virtually at the American Society for Clinical Psychopharmacology (ASCP) 2020 Annual Meeting, May 29-30, 2020. https://www.psychiatrist.com/ascpcorner/Documents/ascp2020/3_ASCP%20Poster%20Abstracts%202020-JCP.pdf
11. Citrome L, Walling DP, Zeni CM, et al. Efficacy and safety of HP-3070, an asenapine transdermal system, in patients with schizophrenia: a phase 3, randomized, placebo-controlled study. J Clin Psychiatry. 2020;82(1):20m13602. doi: 10.4088/JCP.20m13602
12. US Food and Drug Administration. Drug Approval Package: SECAUDO. October 11, 2019. Accessed January 15, 2021. https://www.accessdata.fda.gov/drugsatfda_docs/nda/2019/212268Orig1s000TOC.cfm
13. Szegedi A, Verweij P, van Duijnhoven W, et al. Meta-analyses of the efficacy of asenapine for acute schizophrenia: comparisons with placebo and other antipsychotics. J Clin Psychiatry. 2012;73(12):1533-1540.
14. Citrome L. Asenapine for schizophrenia and bipolar disorder: a review of the efficacy and safety profile for this newly approved sublingually absorbed second-generation antipsychotic. Int J Clin Pract. 2009;63(12):1762-1784.
The asenapine transdermal system is available in 3 patch sizes: 20, 30, and 40 cm2, which deliver 3.8, 5.7, and 7.6 mg/24 hours of asenapine, respectively.3 Based on the average exposure (area under the plasma concentration curve [AUC]) of asenapine, 3.8 mg/24 hours corresponds to 5 mg twice daily of sublingual asenapine, and 7.6 mg/24 hours corresponds to 10 mg twice daily of sublingual asenapine.3 The “in-between” dose strength of 5.7 mg/24 hours would correspond to exposure to a total of 15 mg/d of sublingual asenapine. The recommended starting dose for asenapine transdermal system is 3.8 mg/24 hours. The dosage may be increased to 5.7 mg/24 hours or 7.6 mg/24 hours, as needed, after 1 week. The safety of doses above 7.6 mg/24 hours has not been evaluated in clinical studies. Asenapine transdermal system is applied once daily and should be worn for 24 hours only, with only 1 patch at any time. Application sites include the upper arm, upper back, abdomen, and hip. A different application site of clean, dry, intact skin should be selected each time a new patch is applied. Although showering is permitted, the use of asenapine transdermal system during swimming or taking a bath has not been evaluated. Of note, prolonged application of heat over an asenapine transdermal system increases plasma concentrations of asenapine, and thus application of external heat sources (eg, heating pads) over the patch should be avoided.
How it works
Product labeling notes that asenapine is an atypical antipsychotic, and that its efficacy in schizophrenia could be mediated through a combination of antagonist activity at dopamine D2 and serotonin 5-HT2A receptors.3 The pharmacodynamic profile of asenapine is complex5 and receptor-binding assays performed using cloned human serotonin, norepinephrine, dopamine, histamine, and muscarinic receptors demonstrated picomolar affinity (extremely high) for 5-HT2C and 5-HT2A receptors, subnanomolar affinity (very high) for 5-HT7, 5-HT2B, 5-HT6, and D3 receptors, and nanomolar affinity (high) for D2 receptors, as well as histamine H1, D4, a1-adrenergic, a2-adrenergic, D1, 5-HT5, 5-HT1A, 5-HT1B, and histamine H2 receptors. Activity of asenapine is that of antagonism at these receptors. Asenapine has no appreciable affinity for muscarinic cholinergic receptors.
The asenapine receptor-binding “fingerprint” differs from that of other antipsychotics. Some of these receptor affinities are of special interest in terms of potential efficacy for pro-cognitive effects and amelioration of abnormal mood.5,9 In terms of tolerability, a relative absence of affinity to muscarinic receptors would predict a low risk for anticholinergic adverse effects, but antagonism at histamine H1 and at a1-adrenergic receptors, either alone or in combination, may cause sedation, and blockade of H1 receptors would also predict weight gain.9 Antagonism of a1-adrenergic receptors can be associated with orthostatic hypotension and neurally mediated reflex bradycardia.9
Clinical pharmacokinetics
Three open-label, randomized, phase 1 studies were conducted to assess the relative bioavailability of asenapine transdermal system vs sublingual asenapine.10 These included single- and multiple-dose studies and clinical trials that examined the effects of different application sites and ethnic groups, and the effect of external heat on medication absorption. Studies were conducted in healthy individuals, except for the multiple-dose study, which was performed in adults with schizophrenia. The AUC for asenapine transdermal system was within the range of that of equivalent doses of sublingual asenapine, but peak exposure (maximum concentration) was significantly lower. As already noted, the AUC of the asenapine patch for 3.8 mg/24 hours and 7.6 mg/24 hours corresponds to sublingual asenapine 5 mg and 10 mg twice daily, respectively. Maximum asenapine concentrations are typically reached between 12 and 24 hours, with sustained concentrations during the 24-hour wear time.3 On average, approximately 60% of the available asenapine is released from the transdermal system over 24 hours. Steady-state plasma concentrations for asenapine transdermal system were achieved approximately 72 hours after the first application and, in contrast to sublingual asenapine, the peak-trough fluctuations were small (peak-to-trough ratio is 1.5 for asenapine transdermal system compared with >3 for sublingual asenapine). Dose-proportionality at steady state was evident for asenapine transdermal system. This is in contrast to sublingual asenapine, where exposure increases 1.7-fold with a 2-fold increase in dose.4,5 Following patch removal, the apparent elimination half-life is approximately 30 hours.3 The pharmacokinetics of the patch did not vary with regards to the application site (upper arm, upper back, abdomen, or hip area), and the pharmacokinetic profile was similar across the ethnic groups that participated in the study. Direct exposure to external heat did increase both the rate and extent of absorption, so external heat sources should be avoided.3
Efficacy
The efficacy profile for asenapine transdermal system would be expected to mirror that for sublingual asenapine.6,7 In addition to data supporting the use of asenapine as administered sublingually, a phase 3 study specifically assessed efficacy and safety of asenapine transdermal system in adults with schizophrenia.11,12 This study was conducted in the United States and 4 other countries at a total of 59 study sites, and 616 patients with acutely exacerbated schizophrenia were enrolled. After a 3- to 14-day screening/single-blind run-in washout period, participants entered a 6-week inpatient double-blind period. Randomization was 1:1:1 to asenapine transdermal system 3.8 mg/24 hours, 7.6 mg/24 hours, or a placebo patch. Each of the patch doses demonstrated significant improvement vs placebo at Week 6 for the primary (change in Positive and Negative Syndrome Scale [PANSS] total score) and key secondary (change in Clinical Global Impression-Severity of Illness) endpoints. Response at endpoint, as defined by a ≥30% improvement from baseline PANSS total score, or by a Clinical Global Impression–Improvement score of 1 (very much improved) or 2 (much improved), was also assessed. For either definition of response, both doses of asenapine transdermal system were superior to placebo, with number needed to treat (NNT) (Box) values <10 for the 3.8 mg/24 hours dose (Table 2). These effect sizes are similar to what is known about sublingual asenapine as determined in a meta-analysis performed by the manufacturer and using individual patient data.13
Box
Clinical trials produce a mountain of data that can be difficult to interpret and apply to clinical practice. When reading about studies, you may wonder:
- How large is the effect being measured?
- Is it clinically important?
- Are we reviewing a result that may be statistically significant but irrelevant for day-today patient care?
Number needed to treat (NNT) and number needed to harm (NNH)—two tools of evidence-based medicine—can help answer these questions. NNT helps us gauge effect size or clinical significance. It is different from knowing if a clinical trial result is statistically significant. NNT allows us to place a number on how often we can expect to encounter a difference between two interventions. If we see a therapeutic difference once every 100 patients (NNT of 100), the difference between the treatments is not of great concern under most circumstances. But if a difference in outcome is seen once in every 7 patients being treated with an intervention vs another (NNT of 7), the result will likely influence dayto-day practice.
How to calculate NNT (or NNH):
What is the NNT for an outcome for drug A vs drug B?
fA = frequency of outcome for drug A
fB = frequency of outcome for drug B
NNT = 1/[ fA - fB]
By convention, we round up the NNT to the next higher whole number.
For example, let’s say drugs A and B are used to treat depression, and they result in 6-week response rates of 55% and 75%, respectively. The NNT to encounter a difference between drug B and drug A in terms of responders at 6 weeks can be calculated as follows:
- Difference in response rates: .75 -.55 = .20
- NNT: 1/.20 = 5
A rule of thumb: NNT values for a medication vs placebo <10 usually denote a medication we use on a regular basis to treat patients.
a Adapted from Citrome L. Dissecting clinical trials with ‘number needed to treat.’ Current Psychiatry. 2007;6(3):66-71. Citrome L. Can you interpret confidence intervals? It’s not that difficult. Current Psychiatry. 2007;6(8):77-82. Additional information can be found in Citrome L, Ketter TA. When does a difference make a difference? Interpretation of number needed to treat, number needed to harm, and likelihood to be helped or harmed. Int J Clin Pract. 2013;67(5):407-411 (free to access at onlinelibrary.wiley.com/doi/full/10.1111/ijcp.12142)
Overall tolerability and safety
The systemic safety and tolerability profile for asenapine transdermal system would be expected to be similar to that for sublingual asenapine, unless there are adverse events that are related to high peak plasma concentrations or large differences between peak and trough plasma concentrations.6 Nonsystemic local application site adverse events would, of course, differ between sublingual vs transdermal administration.
Continue to: Use of asenapine transdermal system...
Use of asenapine transdermal system avoids the dysgeusia and oral hypoesthesia that can be observed with sublingual asenapine4,6; however, dermal effects need to be considered (see Dermal safety). The most commonly observed adverse reactions (incidence ≥5% and at least twice that for placebo) for asenapine transdermal system are extrapyramidal disorder, application site reaction, and weight gain.3 For sublingual asenapine for adults with schizophrenia, the list includes akathisia, oral hypoesthesia, and somnolence.4 These adverse events can be further described using the metric of number needed to harm (NNH) as shown in Table 3.3,4,11,12,14 Of note, extrapyramidal disorder and weight gain appear to be dose-related for asenapine transdermal system. Akathisia appears to be dose-related for sublingual asenapine but not for asenapine transdermal system. Somnolence appears to be associated with sublingual asenapine but not necessarily with asenapine transdermal system.
For sublingual asenapine, the additional indications (bipolar I disorder as acute monotherapy treatment of manic or mixed episodes in adults and pediatric patients age 10 to 17, adjunctive treatment to lithium or valproate in adults, and maintenance monotherapy treatment in adults) have varying commonly encountered adverse reactions.4 Both transdermal asenapine system and sublingual asenapine are contraindicated in patients with severe hepatic impairment (Child-Pugh C) and those with known hypersensitivity to asenapine or to any components in the formulation. Both formulations carry similar warnings in their prescribing information regarding increased mortality in older patients with dementia-related psychosis, cerebrovascular adverse reactions in older patients with dementia-related psychosis, neuroleptic malignant syndrome, tardive dyskinesia, metabolic changes, orthostatic hypotension, leukopenia (and neutropenia and agranulocytosis), QT prolongation, seizures, and potential for cognitive and motor impairment.
Adverse events leading to discontinuation of study treatment in the asenapine transdermal system pivotal trial occurred in 4.9%, 7.8%, and 6.8% of participants in the 3.8 mg/24 hour, 7.6 mg/24 hour, and placebo groups, respectively.11
Dermal safety
In the pivotal efficacy study,11 the incidence of adverse events at patch application sites was higher in the active groups vs placebo (Table 33,4,11,12,14). The most frequently reported patch application site reactions were erythema and pruritus, occurring in approximately 10% and 4% in the active treatment arms vs 1.5% and 1.9% for placebo, respectively. With the exception of 1 adverse event of severe application site erythema during Week 2 (participant received 7.6 mg/24 hour, erythema resolved without intervention, and the patient continued the study), all other patch application site events were mild or moderate in severity. Rates of discontinuation due to application site reactions or skin disorders were ≤0.5% across all groups. In the pharmacokinetic studies,10 no patches were removed because of unacceptable irritation.
Why Rx?
Asenapine transdermal system is the first antipsychotic “patch” FDA-approved for the treatment of adults with schizophrenia. Asenapine has been available since 2009 as a sublingual formulation administered twice daily. The pharmacokinetic profile of the once-daily transdermal system demonstrates dose-proportional kinetics and sustained delivery of asenapine with a low peak-to-trough plasma level ratio. Three dosage strengths (3.8, 5.7, and 7.6 mg/24 hours) are available, corresponding to blood levels attained with sublingual asenapine exposures of 10, 15, and 20 mg/d, respectively. Application sites are rotated daily and include the upper arms, upper back, abdomen, or hip. Dysgeusia and hypoesthesia of the tongue are avoided with the use of the patch, and there are no food or drink restrictions. Attention will be needed in case of dermal reactions, similar to that observed with other medication patches.
Bottom Line
The asenapine transdermal drug delivery system appears to be efficacious and reasonably well tolerated. The treatment of schizophrenia is complex and requires individualized choices in order to optimize outcomes. A patch may be the preferred formulation for selected patients, and caregivers will have the ability to visually check if the medication is being used.
Related Resource
- Hisamitsu Pharmaceutical Co., Inc. SECUADO® (asenapine) transdermal system prescribing information. October 2019. https://www.accessdata.fda.gov/drugsatfda_docs/label/2019/212268s000lbl.pdf
Drug Brand Names
Asenapine sublingual • Saphris
Asenapine transdermal system • Secuado
Lithium • Eskalith, Lithobid
Valproate • Depakote
1. Noven. US FDA approves SECUADO® (asenapine) transdermal system, the first-and-only transdermal patch for the treatment of adults with schizophrenia. October 15, 2019. Accessed January 15, 2021. https://www.noven.com/wp-content/uploads/2020/04/PR101519.pdf
2. US Food and Drug Administration. Center for Drug Evaluation and Research. Approval Package for: APPLICATION NUMBER: 212268Orig1s000. October 11, 2019. Accessed January 15, 2021. https://www.accessdata.fda.gov/drugsatfda_docs/nda/2019/212268Orig1s000Approv.pdf
3. Hisam itsu Pharmaceutical Co., Inc. SECUADO® (asenapine) transdermal system prescribing information. October 2019. https://www.accessdata.fda.gov/drugsatfda_docs/label/2019/212268s000lbl.pdf
4. Allergan USA, Inc. SAPHRIS® (asenapine) sublingual tablets prescribing information. February 2017. Accessed January 15, 2021. https://media.allergan.com/actavis/actavis/media/allergan-pdf-documents/product-prescribing/Final_labeling_text_SAPHRIS-clean-02-2017.pdf
5. Citrome L. Asenapine review, part I: chemistry, receptor affinity profile, pharmacokinetics and metabolism. Expert Opin Drug Metab Toxicol. 2014;10(6):893-903.
6. Citrome L. Asenapine review, part II: clinical efficacy, safety and tolerability. Expert Opin Drug Saf. 2014;13(6):803-830.
7. Citrome L. Chapter 31: Asenapine. In: Schatzberg AF, Nemeroff CB, eds. The American Psychiatric Association Publishing Textbook of Psychopharmacology, 5th ed. American Psychiatric Association Publishing; 2017:797-808.
8. Citrome L, Zeni CM, Correll CU. Patches: established and emerging transdermal treatments in psychiatry. J Clin Psychiatry. 2019;80(4):18nr12554. doi: 10.4088/JCP.18nr12554
9. Shayegan DK, Stahl SM. Atypical antipsychotics: matching receptor profile to individual patient’s clinical profile. CNS Spectr. 2004;9(10 suppl 11):6-14.
10. Castelli M, Suzuki K, Komaroff M, et al. Pharmacokinetic profile of asenapine transdermal system HP-3070: The first antipsychotic patch in the US. Poster presented virtually at the American Society for Clinical Psychopharmacology (ASCP) 2020 Annual Meeting, May 29-30, 2020. https://www.psychiatrist.com/ascpcorner/Documents/ascp2020/3_ASCP%20Poster%20Abstracts%202020-JCP.pdf
11. Citrome L, Walling DP, Zeni CM, et al. Efficacy and safety of HP-3070, an asenapine transdermal system, in patients with schizophrenia: a phase 3, randomized, placebo-controlled study. J Clin Psychiatry. 2020;82(1):20m13602. doi: 10.4088/JCP.20m13602
12. US Food and Drug Administration. Drug Approval Package: SECAUDO. October 11, 2019. Accessed January 15, 2021. https://www.accessdata.fda.gov/drugsatfda_docs/nda/2019/212268Orig1s000TOC.cfm
13. Szegedi A, Verweij P, van Duijnhoven W, et al. Meta-analyses of the efficacy of asenapine for acute schizophrenia: comparisons with placebo and other antipsychotics. J Clin Psychiatry. 2012;73(12):1533-1540.
14. Citrome L. Asenapine for schizophrenia and bipolar disorder: a review of the efficacy and safety profile for this newly approved sublingually absorbed second-generation antipsychotic. Int J Clin Pract. 2009;63(12):1762-1784.

Elaborate hallucinations, but is it a psychotic disorder?
CASE Visual, auditory, and tactile hallucinations
Mr. B, age 93, is brought to the emergency department by his son after experiencing hallucinations where he reportedly saw and heard individuals in his home. In frustration, Mr. B wielded a knife because he “wanted them to go away.”
Mr. B and his son report that the hallucinations had begun 2 years ago, without prior trauma, medication changes, changes in social situation, or other apparent precipitating events. The hallucinations “come and go,” without preceding symptoms, but have recurring content involving a friendly man named “Harry,” people coming out of the television, 2 children playing, and water covering the floor. Mr. B acknowledges these are hallucinations and had not felt threatened by them until recently, when he wielded the knife. He often tries to talk to them, but they do not reply.
Mr. B also reports intermittent auditory hallucinations including voices at home (non-command) and papers rustling. He also describes tactile hallucinations, where he says he can feel Harry and others prodding him, knocking things out of his hands, or splashing him with water.
Mr. B is admitted to the hospital because he is a danger to himself and others. While on the inpatient unit, Mr. B is pleasant with staff, and eats and sleeps normally; however, he continues to have hallucinations of Harry. Mr. B reports seeing Harry in the hall, and says that Harry pulls out Mr. B’s earpiece and steals his fork. Mr. B also reports hearing a sound “like a bee buzzing.” Mr. B is started on risperidone, 1 mg nightly, for a presumed psychotic disorder.
HISTORY Independent and in good health
Mr. B lives alone and is independent in his activities of daily living. He spends his days at home, often visited by his children, who bring him groceries and other necessities.
Mr. B takes no medications, and has no history of psychiatric treatment; psychotic, manic, or depressive episodes; posttraumatic stress disorder; obsessive-compulsive disorder; or recent emotional stress. His medical history includes chronic progressive hearing loss, which is managed with hearing aids; macular degeneration; and prior bilateral cataract surgeries.
EVALUATION Mental status exam and objective findings
During his evaluation, Mr. B appears well-nourished, and wears glasses and hearing aids. During the interview, he is euthymic with appropriately reactive affect. He is talkative but redirectable, with a goal-directed thought process. Mr. B does not appear to be internally preoccupied. His hearing is impaired, and he often requires questions to be repeated loudly. He is oriented to person, place, and time. There are no signs of delusions, paranoia, thought blocking, thought broadcasting/insertion, or referential thinking. He denies depressed mood, anhedonia, fatigue, sleep changes, or manic symptoms. He denies the occurrence of auditory or visual hallucinations during the evaluation.
Continue to: A neurologic exam shows...
A neurologic exam shows impaired hearing bilaterally and impaired visual acuity. Even with glasses, both eyes have acuity only to finger counting. All other cranial nerves are normal, and Mr. B’s strength, sensation, and cerebellar function are all intact, without rigidity, numbness, or tingling. His gait is steady without a walker, with symmetric arm swing and slight dragging of his feet. His vitals are stable, with normal orthostatic pressures.
Other objective data include a score of 24/30 on the Mini-Mental State Examination, notable for deficits in visuospatial orientation, attention, and calculation, with language and copying limited by poor vision. Mr. B scores 16/22 on the Montreal Cognitive Assessment (MoCA)-Blind (adapted version of MoCA), which is equivalent to a 22/30 on the MoCA, indicating some mild cognitive impairment; however, this modified test is still limited by his poor hearing. His serum and urine laboratory workup show no liver, kidney, metabolic, or electrolyte abnormalities, no sign of infection, negative urine drug screen, and normal B12 and thyroid-stimulating hormone levels. He undergoes a brain MRI, which shows chronic microvascular ischemic change, without mass lesions, infarction, or other pathology.
[polldaddy:10729178]
The authors’ observations
Given Mr. B’s presentation, we ruled out a primary psychotic disorder. He had no psychiatric history, with organized thought, a reactive affect, and no delusions, paranoia, or other psychotic symptoms, all pointing against psychosis. His brain MRI showed no malignancy or other lesions. He had no substance use history to suggest intoxication/withdrawal. His intact attention and orientation did not suggest delirium, and his serum and urine studies were all negative. Although his blaming Harry for knocking things out of his hands could suggest confabulation, Mr. B had no other signs of Korsakoff syndrome, such as ataxia, general confusion, or malnourishment.
We also considered early dementia. There was suspicion for Lewy body dementia given Mr. B’s prominent fluctuating visual hallucinations; however, he displayed no other signs of the disorder, such as parkinsonism, dysautonomia, or sensitivity to the antipsychotic (risperidone 1 mg nightly) started on admission. The presence of 1 core feature of Lewy body dementia—visual hallucinations—indicated a possible, but not probable, diagnosis. Additionally, Mr. B did not have the characteristic features of other types of dementia, such as the stepwise progression of vascular dementia, the behavioral disinhibition of frontotemporal dementia, or the insidious forgetfulness, confusion, language problems, or paranoia that may appear in Alzheimer’s disease. Remarkably, he had a relatively normal brain MRI for his age, given chronic microvascular ischemic changes, and cognitive testing that indicated only mild impairment further pointed against a dementia process.
Charles Bonnet syndrome
Based on Mr. B’s severe vision loss and history of ocular surgeries, we diagnosed him with CBS, described as visual hallucinations in the presence of impaired vision. Charles Bonnet syndrome has been observed in several disorders that affect vision, most commonly macular degeneration, diabetic retinopathy, and glaucoma, with an estimated prevalence of 11% to 39% in older patients with ocular disease.1,2 Visual hallucinations in CBS occur due to ocular disease, likely resulting from changes in afferent sensory input to visual cortical regions of the brain. Table 13 outlines the features of visual hallucinations in patients with CBS. The subsequent disinhibition and spontaneous firing of the visual association cortices leads to the “release hallucinations” of the syndrome.4 The disorder is thought to be significantly underdiagnosed—in a survey of patients with CBS, only 15% had reported their visual hallucinations to a physician.5

Continue to: Mr. B's symptoms...
Mr. B’s symptoms are atypical for CBS, but they fit the diagnosis when considering the entire clinical picture. While hallucinations in CBS are more often simple shapes, complex hallucinations including people and scenes have been noted in several instances.6
Similar to Mr. B’s case, patients with CBS can have recurring figures in their hallucinations, and the images may even move across the visual field.1 Patients with CBS also frequently recognize that their hallucinations are not real, and may or may not be distressed by them.4 Patients with CBS often have hallucinations multiple times daily, lasting from a few seconds to many minutes,7 consistent with Mr. B’s temporary symptoms.
Although auditory and tactile hallucinations are typically not included in CBS, they can also be explained by Mr. B’s significant sensory impairment. Severe hearing impairment in geriatric adults has been associated with auditory hallucinations8; in 1 survey, half of these hallucinations consisted of voices.9 In contrast, tactile hallucinations are not described in sensory deprivation literature. However, in the context of Mr. B’s severe comorbid hearing and vision loss, we propose that these hallucinations reflect his interpretation of sensory events around him, and their integration into his extensive hallucination framework. In other words, Harry poking him and causing him to drop things may be Mr. B’s way of rationalizing events that he has trouble perceiving entirely, or his mild forgetfulness. Mr. B’s social isolation is another factor that may worsen his sensory deprivation and contribute to his extensive hallucinations.10 Additionally, his mild cognitive deficits on testing with chronic microvascular changes on the MRI may suggest a mild vascular-related dementia process, which could also exacerbate his hallucinations. While classic CBS occurs without cognitive impairment, dementia can often co-occur with CBS.11
TREATMENT No significant improvement with medications
During his inpatient stay, Mr. B is treated with risperidone, 1 mg nightly, and is also started on donepezil, 5 mg/d, to treat a possible comorbid dementia. However, he continues to hallucinate without significant improvement.
[polldaddy:10729181]
The authors’ observations
There is no definitive treatment for CBS, and while the hallucinations may spontaneously resolve, per case reports, this typically occurs only as visual loss progresses to total blindness.12 However, many patients can have the hallucinations remit after the underlying ocular etiology is corrected, such as through ocular surgery.13 Other optical interventions, such as special glasses or contact lenses, may help maximize remaining vision.8 In patients without this option, such as Mr. B, there are limited data on beneficial medications for CBS.
Continue to: Evidence for treatment of CBS...
Evidence for treatment of CBS with antipsychotic medications is mixed. Some case studies have found them to be ineffective, while others have found agents such as olanzapine or risperidone to be partially helpful in reducing symptoms.14 There are also data from case reports that may support the use of cholinesterase inhibitors such as donepezil, antiepileptics (carbamazepine, valproate, gabapentin, and clonazepam), and certain antidepressants (escitalopram, venlafaxine) (Table 28,11).3

Addressing loneliness and social isolation
With minimal definitive evidence for pharmacologic management, the most important intervention for treating CBS may be changing the patient’s sensory environment. Specifically, loneliness and social isolation are major exacerbating factors of CBS, and many clinicians advocate for the consistent presence of a sympathetic professional. Reassurance that hallucinations are from ocular disease rather than a primary mental disorder may be extremely relieving for patients.11 A psychoeducation or support group may also be beneficial, not only for giving patients more social contact, but also for teaching them coping skills or strategies to reduce hallucinations, such as distraction, turning on more lights, or even certain eye/blinking movements.11 Table 28,11 (page 49) outlines behavioral interventions for CBS.
Regardless of etiology, Mr. B’s hallucinations significantly affected his quality of life. During his inpatient stay, he was treated with
OUTCOME Home care and family involvement
After discussion with Mr. B and his family about the risks and benefits of medication, the risperidone and donepezil are discontinued. Ultimately, it is determined that Mr. B requires a higher level of home care, both for his safety and to improve his social contact. Mr. B returns home with a combination of a professional home health aide and increased family involvement.
Bottom Line
When evaluating visual hallucinations in older adults, Charles Bonnet syndrome (CBS) should be considered. Sensory deprivation and social isolation are significant risk factors for CBS. While evidence is inconclusive for medical treatment, reassurance and behavioral interventions can often improve symptoms.
Continue to: Related Resources
Related Resources
- Charles Bonnet Syndrome Foundation. http://www.charlesbonnetsyndrome.org
- Schultz G, Melzack R. The Charles Bonnet syndrome: ‘phantom visual images’. Perception. 1991;20:809-825.
- Menon GJ, Rahman I, Menon SJ, et al. Complex visual hallucinations in the visually impaired: the Charles Bonnet syndrome. Surv Ophthalmol. 2003;48(1):58-72.
Drug Brand Names
Carbamazepine • Tegretol
Clonazepam • Klonopin
Donepezil • Aricept
Escitalopram • Lexapro
Gabapentin • Neurontin
Olanzapine • Zyprexa
Risperidone • Risperdal
Valproate • Depakote
Venlafaxine • Effexor
1. Menon GJ, Rahman I, Menon SJ, et al. Complex visual hallucinations in the visually impaired: the Charles Bonnet syndrome. Surv Ophthalmol. 2003;48(1):58-72.
2. Cox TM, Ffytche DH. Negative outcome Charles Bonnet syndrome. Br J Ophthalmol. 2014;98(9):1236-1239.
3. Pelak VS. Visual release hallucinations (Charles Bonnet syndrome). UpToDate. Updated February 5, 2019. Accessed September 17, 2020. https://www.uptodate.com/contents/visual-release-hallucinations-charles-bonnet-syndrome
4. Burke W. The neural basis of Charles Bonnet hallucinations: a hypothesis. J Neurol Neurosurg Psychiatry. 2002;73(5):535-541.
5. Scott IU, Schein OD, Feuer WJ, et al. Visual hallucinations in patients with retinal disease. Am J Ophthalmol. 2001;131(5):590-598.
6. Lepore FE. Spontaneous visual phenomena with visual loss: 104 patients with lesions of retinal and neural afferent pathways. Neurology. 1990;40(3 Pt 1):444-447.
7. Nesher R, Nesher G, Epstein E, et al. Charles Bonnet syndrome in glaucoma patients with low vision. J Glaucoma. 2001;10(5):396-400.
8. Pang L. Hallucinations experienced by visually impaired: Charles Bonnet syndrome. Optom Vis Sci. 2016;93(12):1466-1478.
9. Linszen M, Van Zanten G, Teunisse R, et al. Auditory hallucinations in adults with hearing impairment: a large prevalence study. Psychological Medicine. 2019;49(1):132-139.
10. Teunisse RJ, Cruysberg JR, Hoefnagels WH, et al. Social and psychological characteristics of elderly visually handicapped patients with the Charles Bonnet syndrome. Compr Psychiatry. 1999;40(4):315-319.
11. Eperjesi F, Akbarali A. Rehabilitation in Charles Bonnet syndrome: a review of treatment options. Clin Exp Optom. 2004;87(3):149-152.
12. Fernandez A, Lichtshein G, Vieweg WVR. The Charles Bonnet syndrome: a review. J Nen Ment Dis. 1997;185(3):195-200.
13. Rosenbaum F, Harati Y, Rolak L, et al. Visual hallucinations in sane people: Charles Bonnet syndrome. J Am Geriatr Soc. 1987;35(1):66-68.
14. Coletti Moja M, Milano E, Gasverde S, et al. Olanzapine therapy in hallucinatory visions related to Bonnet syndrome. Neurol Sci. 2005;26(3):168-170.
CASE Visual, auditory, and tactile hallucinations
Mr. B, age 93, is brought to the emergency department by his son after experiencing hallucinations where he reportedly saw and heard individuals in his home. In frustration, Mr. B wielded a knife because he “wanted them to go away.”
Mr. B and his son report that the hallucinations had begun 2 years ago, without prior trauma, medication changes, changes in social situation, or other apparent precipitating events. The hallucinations “come and go,” without preceding symptoms, but have recurring content involving a friendly man named “Harry,” people coming out of the television, 2 children playing, and water covering the floor. Mr. B acknowledges these are hallucinations and had not felt threatened by them until recently, when he wielded the knife. He often tries to talk to them, but they do not reply.
Mr. B also reports intermittent auditory hallucinations including voices at home (non-command) and papers rustling. He also describes tactile hallucinations, where he says he can feel Harry and others prodding him, knocking things out of his hands, or splashing him with water.
Mr. B is admitted to the hospital because he is a danger to himself and others. While on the inpatient unit, Mr. B is pleasant with staff, and eats and sleeps normally; however, he continues to have hallucinations of Harry. Mr. B reports seeing Harry in the hall, and says that Harry pulls out Mr. B’s earpiece and steals his fork. Mr. B also reports hearing a sound “like a bee buzzing.” Mr. B is started on risperidone, 1 mg nightly, for a presumed psychotic disorder.
HISTORY Independent and in good health
Mr. B lives alone and is independent in his activities of daily living. He spends his days at home, often visited by his children, who bring him groceries and other necessities.
Mr. B takes no medications, and has no history of psychiatric treatment; psychotic, manic, or depressive episodes; posttraumatic stress disorder; obsessive-compulsive disorder; or recent emotional stress. His medical history includes chronic progressive hearing loss, which is managed with hearing aids; macular degeneration; and prior bilateral cataract surgeries.
EVALUATION Mental status exam and objective findings
During his evaluation, Mr. B appears well-nourished, and wears glasses and hearing aids. During the interview, he is euthymic with appropriately reactive affect. He is talkative but redirectable, with a goal-directed thought process. Mr. B does not appear to be internally preoccupied. His hearing is impaired, and he often requires questions to be repeated loudly. He is oriented to person, place, and time. There are no signs of delusions, paranoia, thought blocking, thought broadcasting/insertion, or referential thinking. He denies depressed mood, anhedonia, fatigue, sleep changes, or manic symptoms. He denies the occurrence of auditory or visual hallucinations during the evaluation.
Continue to: A neurologic exam shows...
A neurologic exam shows impaired hearing bilaterally and impaired visual acuity. Even with glasses, both eyes have acuity only to finger counting. All other cranial nerves are normal, and Mr. B’s strength, sensation, and cerebellar function are all intact, without rigidity, numbness, or tingling. His gait is steady without a walker, with symmetric arm swing and slight dragging of his feet. His vitals are stable, with normal orthostatic pressures.
Other objective data include a score of 24/30 on the Mini-Mental State Examination, notable for deficits in visuospatial orientation, attention, and calculation, with language and copying limited by poor vision. Mr. B scores 16/22 on the Montreal Cognitive Assessment (MoCA)-Blind (adapted version of MoCA), which is equivalent to a 22/30 on the MoCA, indicating some mild cognitive impairment; however, this modified test is still limited by his poor hearing. His serum and urine laboratory workup show no liver, kidney, metabolic, or electrolyte abnormalities, no sign of infection, negative urine drug screen, and normal B12 and thyroid-stimulating hormone levels. He undergoes a brain MRI, which shows chronic microvascular ischemic change, without mass lesions, infarction, or other pathology.
[polldaddy:10729178]
The authors’ observations
Given Mr. B’s presentation, we ruled out a primary psychotic disorder. He had no psychiatric history, with organized thought, a reactive affect, and no delusions, paranoia, or other psychotic symptoms, all pointing against psychosis. His brain MRI showed no malignancy or other lesions. He had no substance use history to suggest intoxication/withdrawal. His intact attention and orientation did not suggest delirium, and his serum and urine studies were all negative. Although his blaming Harry for knocking things out of his hands could suggest confabulation, Mr. B had no other signs of Korsakoff syndrome, such as ataxia, general confusion, or malnourishment.
We also considered early dementia. There was suspicion for Lewy body dementia given Mr. B’s prominent fluctuating visual hallucinations; however, he displayed no other signs of the disorder, such as parkinsonism, dysautonomia, or sensitivity to the antipsychotic (risperidone 1 mg nightly) started on admission. The presence of 1 core feature of Lewy body dementia—visual hallucinations—indicated a possible, but not probable, diagnosis. Additionally, Mr. B did not have the characteristic features of other types of dementia, such as the stepwise progression of vascular dementia, the behavioral disinhibition of frontotemporal dementia, or the insidious forgetfulness, confusion, language problems, or paranoia that may appear in Alzheimer’s disease. Remarkably, he had a relatively normal brain MRI for his age, given chronic microvascular ischemic changes, and cognitive testing that indicated only mild impairment further pointed against a dementia process.
Charles Bonnet syndrome
Based on Mr. B’s severe vision loss and history of ocular surgeries, we diagnosed him with CBS, described as visual hallucinations in the presence of impaired vision. Charles Bonnet syndrome has been observed in several disorders that affect vision, most commonly macular degeneration, diabetic retinopathy, and glaucoma, with an estimated prevalence of 11% to 39% in older patients with ocular disease.1,2 Visual hallucinations in CBS occur due to ocular disease, likely resulting from changes in afferent sensory input to visual cortical regions of the brain. Table 13 outlines the features of visual hallucinations in patients with CBS. The subsequent disinhibition and spontaneous firing of the visual association cortices leads to the “release hallucinations” of the syndrome.4 The disorder is thought to be significantly underdiagnosed—in a survey of patients with CBS, only 15% had reported their visual hallucinations to a physician.5
Continue to: Mr. B's symptoms...
Mr. B’s symptoms are atypical for CBS, but they fit the diagnosis when considering the entire clinical picture. While hallucinations in CBS are more often simple shapes, complex hallucinations including people and scenes have been noted in several instances.6
Similar to Mr. B’s case, patients with CBS can have recurring figures in their hallucinations, and the images may even move across the visual field.1 Patients with CBS also frequently recognize that their hallucinations are not real, and may or may not be distressed by them.4 Patients with CBS often have hallucinations multiple times daily, lasting from a few seconds to many minutes,7 consistent with Mr. B’s temporary symptoms.
Although auditory and tactile hallucinations are typically not included in CBS, they can also be explained by Mr. B’s significant sensory impairment. Severe hearing impairment in geriatric adults has been associated with auditory hallucinations8; in 1 survey, half of these hallucinations consisted of voices.9 In contrast, tactile hallucinations are not described in sensory deprivation literature. However, in the context of Mr. B’s severe comorbid hearing and vision loss, we propose that these hallucinations reflect his interpretation of sensory events around him, and their integration into his extensive hallucination framework. In other words, Harry poking him and causing him to drop things may be Mr. B’s way of rationalizing events that he has trouble perceiving entirely, or his mild forgetfulness. Mr. B’s social isolation is another factor that may worsen his sensory deprivation and contribute to his extensive hallucinations.10 Additionally, his mild cognitive deficits on testing with chronic microvascular changes on the MRI may suggest a mild vascular-related dementia process, which could also exacerbate his hallucinations. While classic CBS occurs without cognitive impairment, dementia can often co-occur with CBS.11
TREATMENT No significant improvement with medications
During his inpatient stay, Mr. B is treated with risperidone, 1 mg nightly, and is also started on donepezil, 5 mg/d, to treat a possible comorbid dementia. However, he continues to hallucinate without significant improvement.
[polldaddy:10729181]
The authors’ observations
There is no definitive treatment for CBS, and while the hallucinations may spontaneously resolve, per case reports, this typically occurs only as visual loss progresses to total blindness.12 However, many patients can have the hallucinations remit after the underlying ocular etiology is corrected, such as through ocular surgery.13 Other optical interventions, such as special glasses or contact lenses, may help maximize remaining vision.8 In patients without this option, such as Mr. B, there are limited data on beneficial medications for CBS.
Continue to: Evidence for treatment of CBS...
Evidence for treatment of CBS with antipsychotic medications is mixed. Some case studies have found them to be ineffective, while others have found agents such as olanzapine or risperidone to be partially helpful in reducing symptoms.14 There are also data from case reports that may support the use of cholinesterase inhibitors such as donepezil, antiepileptics (carbamazepine, valproate, gabapentin, and clonazepam), and certain antidepressants (escitalopram, venlafaxine) (Table 28,11).3
Addressing loneliness and social isolation
With minimal definitive evidence for pharmacologic management, the most important intervention for treating CBS may be changing the patient’s sensory environment. Specifically, loneliness and social isolation are major exacerbating factors of CBS, and many clinicians advocate for the consistent presence of a sympathetic professional. Reassurance that hallucinations are from ocular disease rather than a primary mental disorder may be extremely relieving for patients.11 A psychoeducation or support group may also be beneficial, not only for giving patients more social contact, but also for teaching them coping skills or strategies to reduce hallucinations, such as distraction, turning on more lights, or even certain eye/blinking movements.11 Table 28,11 (page 49) outlines behavioral interventions for CBS.
Regardless of etiology, Mr. B’s hallucinations significantly affected his quality of life. During his inpatient stay, he was treated with
OUTCOME Home care and family involvement
After discussion with Mr. B and his family about the risks and benefits of medication, the risperidone and donepezil are discontinued. Ultimately, it is determined that Mr. B requires a higher level of home care, both for his safety and to improve his social contact. Mr. B returns home with a combination of a professional home health aide and increased family involvement.
Bottom Line
When evaluating visual hallucinations in older adults, Charles Bonnet syndrome (CBS) should be considered. Sensory deprivation and social isolation are significant risk factors for CBS. While evidence is inconclusive for medical treatment, reassurance and behavioral interventions can often improve symptoms.
Continue to: Related Resources
Related Resources
- Charles Bonnet Syndrome Foundation. http://www.charlesbonnetsyndrome.org
- Schultz G, Melzack R. The Charles Bonnet syndrome: ‘phantom visual images’. Perception. 1991;20:809-825.
- Menon GJ, Rahman I, Menon SJ, et al. Complex visual hallucinations in the visually impaired: the Charles Bonnet syndrome. Surv Ophthalmol. 2003;48(1):58-72.
Drug Brand Names
Carbamazepine • Tegretol
Clonazepam • Klonopin
Donepezil • Aricept
Escitalopram • Lexapro
Gabapentin • Neurontin
Olanzapine • Zyprexa
Risperidone • Risperdal
Valproate • Depakote
Venlafaxine • Effexor
1. Menon GJ, Rahman I, Menon SJ, et al. Complex visual hallucinations in the visually impaired: the Charles Bonnet syndrome. Surv Ophthalmol. 2003;48(1):58-72.
2. Cox TM, Ffytche DH. Negative outcome Charles Bonnet syndrome. Br J Ophthalmol. 2014;98(9):1236-1239.
3. Pelak VS. Visual release hallucinations (Charles Bonnet syndrome). UpToDate. Updated February 5, 2019. Accessed September 17, 2020. https://www.uptodate.com/contents/visual-release-hallucinations-charles-bonnet-syndrome
4. Burke W. The neural basis of Charles Bonnet hallucinations: a hypothesis. J Neurol Neurosurg Psychiatry. 2002;73(5):535-541.
5. Scott IU, Schein OD, Feuer WJ, et al. Visual hallucinations in patients with retinal disease. Am J Ophthalmol. 2001;131(5):590-598.
6. Lepore FE. Spontaneous visual phenomena with visual loss: 104 patients with lesions of retinal and neural afferent pathways. Neurology. 1990;40(3 Pt 1):444-447.
7. Nesher R, Nesher G, Epstein E, et al. Charles Bonnet syndrome in glaucoma patients with low vision. J Glaucoma. 2001;10(5):396-400.
8. Pang L. Hallucinations experienced by visually impaired: Charles Bonnet syndrome. Optom Vis Sci. 2016;93(12):1466-1478.
9. Linszen M, Van Zanten G, Teunisse R, et al. Auditory hallucinations in adults with hearing impairment: a large prevalence study. Psychological Medicine. 2019;49(1):132-139.
10. Teunisse RJ, Cruysberg JR, Hoefnagels WH, et al. Social and psychological characteristics of elderly visually handicapped patients with the Charles Bonnet syndrome. Compr Psychiatry. 1999;40(4):315-319.
11. Eperjesi F, Akbarali A. Rehabilitation in Charles Bonnet syndrome: a review of treatment options. Clin Exp Optom. 2004;87(3):149-152.
12. Fernandez A, Lichtshein G, Vieweg WVR. The Charles Bonnet syndrome: a review. J Nen Ment Dis. 1997;185(3):195-200.
13. Rosenbaum F, Harati Y, Rolak L, et al. Visual hallucinations in sane people: Charles Bonnet syndrome. J Am Geriatr Soc. 1987;35(1):66-68.
14. Coletti Moja M, Milano E, Gasverde S, et al. Olanzapine therapy in hallucinatory visions related to Bonnet syndrome. Neurol Sci. 2005;26(3):168-170.

Suvorexant: An option for preventing delirium?
Delirium is characterized by a disturbance of consciousness or cognition that typically has a rapid onset and fluctuating course.1 Up to 42% of hospitalized geriatric patients experience delirium.1 Approximately 10% to 31% of these patients have the condition upon admission, and the remainder develop it during their hospitalization.1 Unfortunately, options for preventing or treating delirium are limited. Benzodiazepines and antipsychotic medications have been used to treat problematic behaviors associated with delirium, but they do not effectively reduce the occurrence, duration, or severity of this condition.2,3
Recent evidence suggests that suvorexant, which is FDA-approved for insomnia, may be useful for preventing delirium. Suvorexant—a dual orexin receptor (OX1R, OX2R) antagonist—promotes sleep onset and maintenance, and is associated with normal measures of sleep activity such as rapid eye movement (REM) sleep, non-REM sleep, and sleep stage–specific electroencephalographic profiles.4 Here we review 3 studies that evaluated suvorexant for preventing delirium.
Hatta et al.5 In this randomized, placebo-controlled, blinded, multicenter study, 72 patients (age 65 to 89) newly admitted to an ICU were randomized to suvorexant, 15 mg/d, (n = 36) or placebo (n = 36) for 3 days.5 None of the patients taking suvorexant developed delirium, whereas 17% (6 patients) in the placebo group did (P = .025).5
Azuma et al.6 In this 7-day, blinded, randomized study of 70 adult patients (age ≥20) admitted to an ICU, 34 participants received suvorexant (15 mg nightly for age <65, 20 mg nightly for age ≥65) and the rest received treatment as usual (TAU). Suvorexant was associated with a lower incidence of delirium symptoms (n = 6, 17.6%) compared with TAU (n = 17, 47.2%) (P = .011).6 The onset of delirium was earlier in the TAU group (P < .05).6
Hatta et al.7 In this large prospective, observational study of adults (age >65), 526 patients with significant risk factors for delirium were prescribed suvorexant and/or ramelteon. Approximately 16% of the patients who received either or both of these medications met DSM-5 criteria for delirium, compared with 24% who did not receive these medications (P = .005).7
Acknowledgment
The authors thank Jakob Evans, BS, for compiling much of the research for this article.
1. Siddiqi N, House AO, Holmes JD. Occurrence and outcome of delirium in medical in-patients: a systematic literature review. Age Ageing. 2006;35(4):350-364.
2. Lonergan E, Luxenberg J, Areosa Sastre A. Benzodiazepines for delirium. Cochrane Database Syst Rev. 2009;2009(4):CD006379.
3. Burry L, Mehta S, Perreault MM, et al. Antipsychotics for treatment of delirium in hospitalised non-ICU patients. Cochrane Database Syst Rev. 2018;6(6):CD005594.
4. Coleman PJ, Gotter AL, Herring WJ, et al. The discovery of suvorexant, the first orexin receptor drug for insomnia. Annu Rev Pharmacol Toxicol. 2017;57:509-533.
5. Hatta K, Kishi Y, Wada K, et al. Preventive effects of suvorexant on delirium: a randomized placebo-controlled trial. J Clin Psychiatry. 2017;78(8):e970-e979.
6. Azuma K, Takaesu Y, Soeda H, et al. Ability of suvorexant to prevent delirium in patients in the intensive care unit: a randomized controlled trial. Acute Med Surg. 2018;5(4):362-368.
7. Hatta K, Kishi Y, Wada K, et al. Real-world effectiveness of ramelteon and suvorexant for delirium prevention in 948 patients with delirium risk factors. J Clin Psychiatry. 2019;81(1):19m12865. doi: 10.4088/JCP.19m12865
Delirium is characterized by a disturbance of consciousness or cognition that typically has a rapid onset and fluctuating course.1 Up to 42% of hospitalized geriatric patients experience delirium.1 Approximately 10% to 31% of these patients have the condition upon admission, and the remainder develop it during their hospitalization.1 Unfortunately, options for preventing or treating delirium are limited. Benzodiazepines and antipsychotic medications have been used to treat problematic behaviors associated with delirium, but they do not effectively reduce the occurrence, duration, or severity of this condition.2,3
Recent evidence suggests that suvorexant, which is FDA-approved for insomnia, may be useful for preventing delirium. Suvorexant—a dual orexin receptor (OX1R, OX2R) antagonist—promotes sleep onset and maintenance, and is associated with normal measures of sleep activity such as rapid eye movement (REM) sleep, non-REM sleep, and sleep stage–specific electroencephalographic profiles.4 Here we review 3 studies that evaluated suvorexant for preventing delirium.
Hatta et al.5 In this randomized, placebo-controlled, blinded, multicenter study, 72 patients (age 65 to 89) newly admitted to an ICU were randomized to suvorexant, 15 mg/d, (n = 36) or placebo (n = 36) for 3 days.5 None of the patients taking suvorexant developed delirium, whereas 17% (6 patients) in the placebo group did (P = .025).5
Azuma et al.6 In this 7-day, blinded, randomized study of 70 adult patients (age ≥20) admitted to an ICU, 34 participants received suvorexant (15 mg nightly for age <65, 20 mg nightly for age ≥65) and the rest received treatment as usual (TAU). Suvorexant was associated with a lower incidence of delirium symptoms (n = 6, 17.6%) compared with TAU (n = 17, 47.2%) (P = .011).6 The onset of delirium was earlier in the TAU group (P < .05).6
Hatta et al.7 In this large prospective, observational study of adults (age >65), 526 patients with significant risk factors for delirium were prescribed suvorexant and/or ramelteon. Approximately 16% of the patients who received either or both of these medications met DSM-5 criteria for delirium, compared with 24% who did not receive these medications (P = .005).7
Acknowledgment
The authors thank Jakob Evans, BS, for compiling much of the research for this article.
1. Siddiqi N, House AO, Holmes JD. Occurrence and outcome of delirium in medical in-patients: a systematic literature review. Age Ageing. 2006;35(4):350-364.
2. Lonergan E, Luxenberg J, Areosa Sastre A. Benzodiazepines for delirium. Cochrane Database Syst Rev. 2009;2009(4):CD006379.
3. Burry L, Mehta S, Perreault MM, et al. Antipsychotics for treatment of delirium in hospitalised non-ICU patients. Cochrane Database Syst Rev. 2018;6(6):CD005594.
4. Coleman PJ, Gotter AL, Herring WJ, et al. The discovery of suvorexant, the first orexin receptor drug for insomnia. Annu Rev Pharmacol Toxicol. 2017;57:509-533.
5. Hatta K, Kishi Y, Wada K, et al. Preventive effects of suvorexant on delirium: a randomized placebo-controlled trial. J Clin Psychiatry. 2017;78(8):e970-e979.
6. Azuma K, Takaesu Y, Soeda H, et al. Ability of suvorexant to prevent delirium in patients in the intensive care unit: a randomized controlled trial. Acute Med Surg. 2018;5(4):362-368.
7. Hatta K, Kishi Y, Wada K, et al. Real-world effectiveness of ramelteon and suvorexant for delirium prevention in 948 patients with delirium risk factors. J Clin Psychiatry. 2019;81(1):19m12865. doi: 10.4088/JCP.19m12865

Key questions to ask patients who are veterans
The Mission Act—signed into law in 2018—recognizes that the health care needs of patients who are veterans can no longer be fully served by the Veterans Health Administration.1 This act allows some veterans who are enrolled in the Veterans Affairs (VA) health care system or otherwise entitled to VA care to access treatment outside of VA facilities.1 As a result, psychiatrists may treat veterans more frequently.
During such patients’ initial visit, obtaining a detailed history of their military service can reveal vital clinical information and establish a therapeutic alliance that can help foster positive treatment outcomes. Here we offer an A-to-L list of important questions to ask veterans about their military service, and explanations of why these questions are valuable.
Attained rank. What rank did you attain during your military service? Did you retire from the military? How many years did you serve?
Asking about your patient’s rank, retirement status, and time in service is vital to understanding their military experience. By military law, only individuals who retired from the military can use their rank as an identifier after they leave the military, although some veterans may not wish to be called by their rank in a clinical setting.
Branch. Which branch of the military did you serve? Were you in Active Duty, the Reserves, or the National Guard?
Military members often take great pride in service of their specific branch. Each branch has its own language, culture, values, and exposures. If your patient has served in a combination of Active Duty, Reserves, and/or National Guard, ask how much time they spent in each.
Culture. What part of the military culture was positive or negative for you?
Continue to: There is a clear culture...
There is a clear culture within the military. Some veterans may feel lost without the military structure, and even devalued without the respect of rank. Others may feel jaded and spiteful about the strict military culture, procedures, and expectations.
Discharge. When, why, and under what circumstances were you discharged? What type of discharge did you receive?
There are 6 types of discharge: Honorable, General, Other than Honorable (OTH), Entry Level Separation, Bad Conduct, and Dishonorable. The type of discharge a veteran received may impact what resources are available to them. It also can influence a veteran’s perception of their military career.
Exposures. Were you exposed to combat, death, explosive blasts, or hazardous chemicals?
Do not ask a veteran if they have killed anyone. This question is both disrespectful and highly presumptuous because most veterans have not killed anyone. Be respectful of their experiences. Depending on the veteran’s mission, they may have unique exposures (Agent Orange, burn pits, detainee camps, etc.). Consider asking follow-up questions to learn the details of these exposures.
Continue to: Family impact
Family impact. How has your military service impacted your family?
A veteran’s military service often affects family members. Deployments can cause strain on marital relationships, children’s birthdays and special events may be missed, and extended family may have negative reactions to military service. Understanding the impact on the veteran’s family members can help uncover potential stressful relationships as well as help enhance any positive support systems that are available at home.
Go. Where were you stationed? Were you deployed?
Training location, geography of combat theater, peace-keeping locations, and area of station can all profoundly impact a veteran’s military experience. Ask follow-up questions about their duty stations, deployment locations, and experiences with these locations.
Hot water. Did you ever get into “trouble” while serving the military (eg, lose rank, get arrested, etc.)? How did you respond to the military’s method of discipline?
Continue to: Although it may be difficult...
Although it may be difficult or uncomfortable to ask your patient if they experienced any disciplinary action, this information may prove useful. It can help provide context when you discuss the veteran’s ease of assimilation into civilian life and other important information regarding the type of discharge.
Injuries. Have you experienced any moral, physical, sexual, emotional, or concussive injuries?
Moral injury, guilt, and regret are common for veterans. Not all injuries are from combat. Your patient may have experienced sexual assault, hazing rituals, pranks, etc.
Job. What was your job in the military? What kind of security clearance did you have?
Note that not all veterans’ “jobs” in the military accurately reflect the duties and tasks that they actually performed. Security clearance will often influence the duties and tasks they were required to perform.
Continue to: Keeping it inside
Keeping it inside. Do you have anyone to talk with about your military experiences?
Many veterans feel uncomfortable discussing their experiences with others. Some veterans may be concerned that others will not understand what they went through. Some might perceive that disclosing their experiences could burden other people, or they may be concerned that explaining their experiences may be too shocking. Asking this question may present an opportunity for you to suggest psychotherapy for your patient.
Life as a civilian. How is your life different as a civilian? How have you adjusted to civilian life?
During the process of assimilation into civilian life, veterans may experience symptoms of depression, posttraumatic stress disorder, anxiety, or other disorders. These symptoms may emerge and/or become exacerbated during their transition to civilian life.
1. VA MISSION Act of 2018 (VA Maintaining Internal Systems and Strengthening Integrated Outside Networks Act), S 2372, 115th Cong, 2nd Sess, HR Doc No. 115-671 (2018).
The Mission Act—signed into law in 2018—recognizes that the health care needs of patients who are veterans can no longer be fully served by the Veterans Health Administration.1 This act allows some veterans who are enrolled in the Veterans Affairs (VA) health care system or otherwise entitled to VA care to access treatment outside of VA facilities.1 As a result, psychiatrists may treat veterans more frequently.
During such patients’ initial visit, obtaining a detailed history of their military service can reveal vital clinical information and establish a therapeutic alliance that can help foster positive treatment outcomes. Here we offer an A-to-L list of important questions to ask veterans about their military service, and explanations of why these questions are valuable.
Attained rank. What rank did you attain during your military service? Did you retire from the military? How many years did you serve?
Asking about your patient’s rank, retirement status, and time in service is vital to understanding their military experience. By military law, only individuals who retired from the military can use their rank as an identifier after they leave the military, although some veterans may not wish to be called by their rank in a clinical setting.
Branch. Which branch of the military did you serve? Were you in Active Duty, the Reserves, or the National Guard?
Military members often take great pride in service of their specific branch. Each branch has its own language, culture, values, and exposures. If your patient has served in a combination of Active Duty, Reserves, and/or National Guard, ask how much time they spent in each.
Culture. What part of the military culture was positive or negative for you?
Continue to: There is a clear culture...
There is a clear culture within the military. Some veterans may feel lost without the military structure, and even devalued without the respect of rank. Others may feel jaded and spiteful about the strict military culture, procedures, and expectations.
Discharge. When, why, and under what circumstances were you discharged? What type of discharge did you receive?
There are 6 types of discharge: Honorable, General, Other than Honorable (OTH), Entry Level Separation, Bad Conduct, and Dishonorable. The type of discharge a veteran received may impact what resources are available to them. It also can influence a veteran’s perception of their military career.
Exposures. Were you exposed to combat, death, explosive blasts, or hazardous chemicals?
Do not ask a veteran if they have killed anyone. This question is both disrespectful and highly presumptuous because most veterans have not killed anyone. Be respectful of their experiences. Depending on the veteran’s mission, they may have unique exposures (Agent Orange, burn pits, detainee camps, etc.). Consider asking follow-up questions to learn the details of these exposures.
Continue to: Family impact
Family impact. How has your military service impacted your family?
A veteran’s military service often affects family members. Deployments can cause strain on marital relationships, children’s birthdays and special events may be missed, and extended family may have negative reactions to military service. Understanding the impact on the veteran’s family members can help uncover potential stressful relationships as well as help enhance any positive support systems that are available at home.
Go. Where were you stationed? Were you deployed?
Training location, geography of combat theater, peace-keeping locations, and area of station can all profoundly impact a veteran’s military experience. Ask follow-up questions about their duty stations, deployment locations, and experiences with these locations.
Hot water. Did you ever get into “trouble” while serving the military (eg, lose rank, get arrested, etc.)? How did you respond to the military’s method of discipline?
Continue to: Although it may be difficult...
Although it may be difficult or uncomfortable to ask your patient if they experienced any disciplinary action, this information may prove useful. It can help provide context when you discuss the veteran’s ease of assimilation into civilian life and other important information regarding the type of discharge.
Injuries. Have you experienced any moral, physical, sexual, emotional, or concussive injuries?
Moral injury, guilt, and regret are common for veterans. Not all injuries are from combat. Your patient may have experienced sexual assault, hazing rituals, pranks, etc.
Job. What was your job in the military? What kind of security clearance did you have?
Note that not all veterans’ “jobs” in the military accurately reflect the duties and tasks that they actually performed. Security clearance will often influence the duties and tasks they were required to perform.
Continue to: Keeping it inside
Keeping it inside. Do you have anyone to talk with about your military experiences?
Many veterans feel uncomfortable discussing their experiences with others. Some veterans may be concerned that others will not understand what they went through. Some might perceive that disclosing their experiences could burden other people, or they may be concerned that explaining their experiences may be too shocking. Asking this question may present an opportunity for you to suggest psychotherapy for your patient.
Life as a civilian. How is your life different as a civilian? How have you adjusted to civilian life?
During the process of assimilation into civilian life, veterans may experience symptoms of depression, posttraumatic stress disorder, anxiety, or other disorders. These symptoms may emerge and/or become exacerbated during their transition to civilian life.
1. VA MISSION Act of 2018 (VA Maintaining Internal Systems and Strengthening Integrated Outside Networks Act), S 2372, 115th Cong, 2nd Sess, HR Doc No. 115-671 (2018).
1. VA MISSION Act of 2018 (VA Maintaining Internal Systems and Strengthening Integrated Outside Networks Act), S 2372, 115th Cong, 2nd Sess, HR Doc No. 115-671 (2018).

Helping survivors of human trafficking
Human trafficking (HT) is a secretive, multibillion dollar criminal industry involving the use of coercion, threats, and fraud to force individuals to engage in labor or commercial sex acts. In 2017, the International Labour Organization estimated that 24.9 million people worldwide were victims of forced labor (ie, working under threat or coercion).1 Risk factors for individuals who are vulnerable to HT include recent migration, substance use, housing insecurity, runaway youth, and mental illness. Traffickers continue the cycle of HT through isolation and emotional, physical, financial, and verbal abuse.
Survivors of HT may avoid seeking health care due to cultural reasons or feelings of guilt, isolation, distrust, or fear of criminal sanctions. There can be missed opportunities for victims to obtain help through health care services, law enforcement, child welfare services, or even family or friends. In a study of 173 survivors of HT in the United States, 68% of those who were currently trafficked visited with a health care professional at least once and were not identified as being trafficked.2 Psychiatrists rarely receive education on HT, which can lead to missed opportunities for identifying victims. Table 1 lists screening questions psychiatrists can ask patients they suspect may be trafficked.

The psychiatric sequelae of trafficking
Survivors of HT commonly experience psychiatric illness, substance use, pain, sexually transmitted diseases, and unplanned pregnancies.3 Here we discuss some of the psychiatric conditions that are common among HT survivors, and outline a multidisciplinary approach to their care.
PTSD, mood disorders, and anxiety disorders. Studies suggest survivors of HT who seek care have a high prevalence of depression, anxiety, and posttraumatic stress disorder (PTSD).3 Survivors may have experienced multiple repetitive trauma, such as physical and sexual abuse.3 Compared with survivors of forced labor trafficking, survivors of sex trafficking have higher rates of childhood abuse, violence during trafficking, severe symptoms of PTSD, and comorbid depression and PTSD.4 For survivors with PTSD, consider psychosocial interventions that address social support, coping strategies, and community reintegration.5 Survivors can also benefit from trauma-informed care that focuses on the cognitive aspect of the trauma, such as cognitive processing therapy, which involves cognitive restructuring without a written account of the trauma.6
Substance use disorders. Some individuals who are trafficked may be forced to use drugs of abuse or alcohol, while others may use substances to help cope while they are being trafficked or afterwards.3 For these patients, motivational interviewing may be beneficial. Also, consider referring them to detoxification or rehabilitation programs.
Suicide and self-harm. In a study of 98 HT survivors in England, 33% reported a history of self-harm before receiving care and 25% engaged in self-harm during care.7 After engaging in self-harm, survivors of HT were more likely to be admitted to psychiatric inpatient units than were patients who had not been trafficked.7 It is crucial to conduct a suicide risk assessment as part of the trauma-informed care of these patients.
Other conditions. In addition to psychiatric illness, survivors of HT may experience physical symptoms such as headache, back pain, stomach pain, fatigue, dizziness, memory problems, and weight loss.3 Referral to other specialties may be necessary for addressing any of the patient’s other conditions.
Continue to: Use a multidisciplinary approach
Use a multidisciplinary approach
Treatment for survivors of HT should be tailored to their specific mental health needs by including psychopharmacology; individual, group, or family psychotherapy; and peer advocate support. Rehabilitation, social services, and case management should also be considered. The care of survivors of HT benefits from a multidisciplinary, culturally-sensitive, and trauma-informed approach. Table 28 describes the PEARR Tool (Provide privacy, Educate, Ask, Respect, and Respond), which offers physicians 4 steps for addressing abuse, neglect, or violence with their patients. Also, the National Human Trafficking Hotline (1-888-373-7888) is available 24/7 for trafficked persons, survivors, and health care professionals to provide guidance on reporting laws and finding additional resources such as housing and legal services.

1. International Labour Organization, the Walk Free Foundation. Global Estimates of Modern Slavery: forced labour and forced marriage. Published 2017. Accessed January 14, 2021. www.ilo.org/global/publications/books/WCMS_575479/lang--en/index.htm
2. Chisolm-Straker M, Baldwin S, Gaïgbé-Togbé B, et al. Health care and human trafficking: we are seeing the unseen. J Health Care Poor Underserved. 2016;27(3):1220-1233.
3. Ottisova L, Hemmings S, Howard LM, et al. Prevalence and risk of violence and the mental, physical and sexual health problems associated with human trafficking: an updated systematic review. Epidemiol Psychiatr Sci. 2016;25(4):317-341.
4. Hopper EK, Gonzalez LD. A comparison of psychological symptoms in survivors of sex and labor trafficking. Behav Med. 2018;44(3):177-188.
5. Okech D, Hanseen N, Howard W, et al. Social support, dysfunctional coping, and community reintegration as predictors of PTSD among human trafficking survivors. Behav Med. 2018;44(3):209-218.
6. Salami T, Gordon M, Coverdale J, et al. What therapies are favored in the treatment of the psychological sequelae of trauma in human trafficking victims? J Psychiatr Pract. 2018;24(2):87-96.
7. Borschmann R, Oram S, Kinner SA, et al. Self-harm among adult victims of human trafficking who accessed secondary mental health services in England. Psychiatr Serv. 2017;68(2):207-210.
8. Using the PEARR Tool. Dignity Health. Published 2019. Accessed January 14, 2021. https://www.dignityhealth.org/hello-humankindness/human-trafficking/victimcentered-and-trauma-informed/using-the-pearr-tool
Human trafficking (HT) is a secretive, multibillion dollar criminal industry involving the use of coercion, threats, and fraud to force individuals to engage in labor or commercial sex acts. In 2017, the International Labour Organization estimated that 24.9 million people worldwide were victims of forced labor (ie, working under threat or coercion).1 Risk factors for individuals who are vulnerable to HT include recent migration, substance use, housing insecurity, runaway youth, and mental illness. Traffickers continue the cycle of HT through isolation and emotional, physical, financial, and verbal abuse.
Survivors of HT may avoid seeking health care due to cultural reasons or feelings of guilt, isolation, distrust, or fear of criminal sanctions. There can be missed opportunities for victims to obtain help through health care services, law enforcement, child welfare services, or even family or friends. In a study of 173 survivors of HT in the United States, 68% of those who were currently trafficked visited with a health care professional at least once and were not identified as being trafficked.2 Psychiatrists rarely receive education on HT, which can lead to missed opportunities for identifying victims. Table 1 lists screening questions psychiatrists can ask patients they suspect may be trafficked.
The psychiatric sequelae of trafficking
Survivors of HT commonly experience psychiatric illness, substance use, pain, sexually transmitted diseases, and unplanned pregnancies.3 Here we discuss some of the psychiatric conditions that are common among HT survivors, and outline a multidisciplinary approach to their care.
PTSD, mood disorders, and anxiety disorders. Studies suggest survivors of HT who seek care have a high prevalence of depression, anxiety, and posttraumatic stress disorder (PTSD).3 Survivors may have experienced multiple repetitive trauma, such as physical and sexual abuse.3 Compared with survivors of forced labor trafficking, survivors of sex trafficking have higher rates of childhood abuse, violence during trafficking, severe symptoms of PTSD, and comorbid depression and PTSD.4 For survivors with PTSD, consider psychosocial interventions that address social support, coping strategies, and community reintegration.5 Survivors can also benefit from trauma-informed care that focuses on the cognitive aspect of the trauma, such as cognitive processing therapy, which involves cognitive restructuring without a written account of the trauma.6
Substance use disorders. Some individuals who are trafficked may be forced to use drugs of abuse or alcohol, while others may use substances to help cope while they are being trafficked or afterwards.3 For these patients, motivational interviewing may be beneficial. Also, consider referring them to detoxification or rehabilitation programs.
Suicide and self-harm. In a study of 98 HT survivors in England, 33% reported a history of self-harm before receiving care and 25% engaged in self-harm during care.7 After engaging in self-harm, survivors of HT were more likely to be admitted to psychiatric inpatient units than were patients who had not been trafficked.7 It is crucial to conduct a suicide risk assessment as part of the trauma-informed care of these patients.
Other conditions. In addition to psychiatric illness, survivors of HT may experience physical symptoms such as headache, back pain, stomach pain, fatigue, dizziness, memory problems, and weight loss.3 Referral to other specialties may be necessary for addressing any of the patient’s other conditions.
Continue to: Use a multidisciplinary approach
Use a multidisciplinary approach
Treatment for survivors of HT should be tailored to their specific mental health needs by including psychopharmacology; individual, group, or family psychotherapy; and peer advocate support. Rehabilitation, social services, and case management should also be considered. The care of survivors of HT benefits from a multidisciplinary, culturally-sensitive, and trauma-informed approach. Table 28 describes the PEARR Tool (Provide privacy, Educate, Ask, Respect, and Respond), which offers physicians 4 steps for addressing abuse, neglect, or violence with their patients. Also, the National Human Trafficking Hotline (1-888-373-7888) is available 24/7 for trafficked persons, survivors, and health care professionals to provide guidance on reporting laws and finding additional resources such as housing and legal services.
1. International Labour Organization, the Walk Free Foundation. Global Estimates of Modern Slavery: forced labour and forced marriage. Published 2017. Accessed January 14, 2021. www.ilo.org/global/publications/books/WCMS_575479/lang--en/index.htm
2. Chisolm-Straker M, Baldwin S, Gaïgbé-Togbé B, et al. Health care and human trafficking: we are seeing the unseen. J Health Care Poor Underserved. 2016;27(3):1220-1233.
3. Ottisova L, Hemmings S, Howard LM, et al. Prevalence and risk of violence and the mental, physical and sexual health problems associated with human trafficking: an updated systematic review. Epidemiol Psychiatr Sci. 2016;25(4):317-341.
4. Hopper EK, Gonzalez LD. A comparison of psychological symptoms in survivors of sex and labor trafficking. Behav Med. 2018;44(3):177-188.
5. Okech D, Hanseen N, Howard W, et al. Social support, dysfunctional coping, and community reintegration as predictors of PTSD among human trafficking survivors. Behav Med. 2018;44(3):209-218.
6. Salami T, Gordon M, Coverdale J, et al. What therapies are favored in the treatment of the psychological sequelae of trauma in human trafficking victims? J Psychiatr Pract. 2018;24(2):87-96.
7. Borschmann R, Oram S, Kinner SA, et al. Self-harm among adult victims of human trafficking who accessed secondary mental health services in England. Psychiatr Serv. 2017;68(2):207-210.
8. Using the PEARR Tool. Dignity Health. Published 2019. Accessed January 14, 2021. https://www.dignityhealth.org/hello-humankindness/human-trafficking/victimcentered-and-trauma-informed/using-the-pearr-tool

New Author Guidelines for Addressing Race and Racism in the Journal of Hospital Medicine
We are committed to using our platform at the Journal of Hospital Medicine (JHM) to address inequities in healthcare delivery, policy, and research. Race was conceived as a mechanism of social division, leading to the false belief, propagated over time, of race as a biological variable.1 As a result, racism has contributed to the medical abuse and exploitation of Black and Brown communities and inequities in health status among racialized groups. We must abandon practices that perpetuate inequities and champion practices that resolve them. Racial health equity—the absence of unjust and avoidable health disparities among racialized groups—is unattainable if we continue to simply identify inequities without naming racism as a determinant of health. As a journal, our responsibility is to disseminate evidence-based manuscripts that reflect an understanding of race, racism, and health.
We have modified our author guidelines. First, we now require authors to clearly define race and provide justification for its inclusion in clinical case descriptions and study analyses. We aim to contribute to the necessary course correction as well as promote self-reflection on study design choices that propagate false notions of race as a biological concept and conclusions that reinforce race-based rather than race-conscious practices in medicine.2 Second, we expect authors to explicitly name racism and make a concerted effort to explore its role, identify its specific forms, and examine mutually reinforcing mechanisms of inequity that potentially contributed to study findings. Finally, we instruct authors to avoid the use of phrases like “patient mistrust,” which places blame for inequities on patients and their families and decouples mistrust from the fraught history of racism in medicine.
We must also acknowledge and reflect on our previous contributions to such inequity as authors, reviewers, and editors in order to learn and grow. Among the more than 2,000 articles published in JHM since its inception, only four included the term “racism.” Three of these articles are perspectives published in June 2020 and beyond. The only original research manuscript that directly addressed racism was a qualitative study of adults with sickle cell disease.3 The authors described study participants’ perspectives: “In contrast, the hospital experience during adulthood was often punctuated by bitter relationships with staff, and distrust over possible excessive use of opioids. Moreover, participants raised the possibility of racism in their interactions with hospital staff.” In this example, patients called out racism and its impact on their experience. We know JHM is not alone in falling woefully short in advancing our understanding of racism and racial health inequities. Each of us should identify missed opportunities to call out racism as a driver of racial health disparities in our own publications. We must act on these lessons regarding the ways in which racism infiltrates scientific publishing. We must use this awareness, along with our influence, voice, and collective power, to enact change for the betterment of our patients, their families, and the medical community.
We at JHM will contribute to uncovering and disseminating solutions to health inequities that result from racism. We are grateful to Boyd et al for their call to action and for providing a blueprint for improvement to those of us who write, review, and publish scholarly work.4
1. Roberts D. Fatal Invention: How Science, Politics, and Big Business Re-Create Race in the Twenty-First Century. 2nd ed. The New Press; 2012.
2. Cerdeña JP, Plaisime MV, Tsai J. From race-based to race-conscious medicine: how anti-racist uprisings call us to act. Lancet. 2020;396:1125-1128. https://doi:10.1016/S0140-6736(20)32076-6
3. Weisberg D, Balf-Soran G, Becker W, et al. “I’m talking about pain”: sickle cell disease patients with extremely high hospital use. J Hosp Med. 2013;8:42-46. https://doi:10.1002/jhm.1987
4. Boyd RW, Lindo EG, Weeks LD, McLemore MR. On racism: a new standard for publishing on racial health inequities. Health Affairs Blog. July 2, 2020. Accessed January 22, 2021. https://doi:10.1377/hblog20200630.939347 https://www.healthaffairs.org/do/10.1377/hblog20200630.939347/full/
We are committed to using our platform at the Journal of Hospital Medicine (JHM) to address inequities in healthcare delivery, policy, and research. Race was conceived as a mechanism of social division, leading to the false belief, propagated over time, of race as a biological variable.1 As a result, racism has contributed to the medical abuse and exploitation of Black and Brown communities and inequities in health status among racialized groups. We must abandon practices that perpetuate inequities and champion practices that resolve them. Racial health equity—the absence of unjust and avoidable health disparities among racialized groups—is unattainable if we continue to simply identify inequities without naming racism as a determinant of health. As a journal, our responsibility is to disseminate evidence-based manuscripts that reflect an understanding of race, racism, and health.
We have modified our author guidelines. First, we now require authors to clearly define race and provide justification for its inclusion in clinical case descriptions and study analyses. We aim to contribute to the necessary course correction as well as promote self-reflection on study design choices that propagate false notions of race as a biological concept and conclusions that reinforce race-based rather than race-conscious practices in medicine.2 Second, we expect authors to explicitly name racism and make a concerted effort to explore its role, identify its specific forms, and examine mutually reinforcing mechanisms of inequity that potentially contributed to study findings. Finally, we instruct authors to avoid the use of phrases like “patient mistrust,” which places blame for inequities on patients and their families and decouples mistrust from the fraught history of racism in medicine.
We must also acknowledge and reflect on our previous contributions to such inequity as authors, reviewers, and editors in order to learn and grow. Among the more than 2,000 articles published in JHM since its inception, only four included the term “racism.” Three of these articles are perspectives published in June 2020 and beyond. The only original research manuscript that directly addressed racism was a qualitative study of adults with sickle cell disease.3 The authors described study participants’ perspectives: “In contrast, the hospital experience during adulthood was often punctuated by bitter relationships with staff, and distrust over possible excessive use of opioids. Moreover, participants raised the possibility of racism in their interactions with hospital staff.” In this example, patients called out racism and its impact on their experience. We know JHM is not alone in falling woefully short in advancing our understanding of racism and racial health inequities. Each of us should identify missed opportunities to call out racism as a driver of racial health disparities in our own publications. We must act on these lessons regarding the ways in which racism infiltrates scientific publishing. We must use this awareness, along with our influence, voice, and collective power, to enact change for the betterment of our patients, their families, and the medical community.
We at JHM will contribute to uncovering and disseminating solutions to health inequities that result from racism. We are grateful to Boyd et al for their call to action and for providing a blueprint for improvement to those of us who write, review, and publish scholarly work.4
1. Roberts D. Fatal Invention: How Science, Politics, and Big Business Re-Create Race in the Twenty-First Century. 2nd ed. The New Press; 2012.
2. Cerdeña JP, Plaisime MV, Tsai J. From race-based to race-conscious medicine: how anti-racist uprisings call us to act. Lancet. 2020;396:1125-1128. https://doi:10.1016/S0140-6736(20)32076-6
3. Weisberg D, Balf-Soran G, Becker W, et al. “I’m talking about pain”: sickle cell disease patients with extremely high hospital use. J Hosp Med. 2013;8:42-46. https://doi:10.1002/jhm.1987
4. Boyd RW, Lindo EG, Weeks LD, McLemore MR. On racism: a new standard for publishing on racial health inequities. Health Affairs Blog. July 2, 2020. Accessed January 22, 2021. https://doi:10.1377/hblog20200630.939347 https://www.healthaffairs.org/do/10.1377/hblog20200630.939347/full/
© 2021 Society of Hospital Medicine
Finding common purpose, or else
I am composing this editorial 4 days after the U.S. Capitol was invaded and 10 days before the presidential inauguration. It is impossible to ignore what is happening in our country, but I hesitate to add my thoughts to the overwhelming sea of opinions circulating in standard media, social media, and the dark web. I hope, as do many, that we return to a civil discourse, recognize the voices of all people, respect each other, and return to a belief in science and facts.

SARS-CoV-2 has devastated the world and will continue to cause preventable deaths until we adopt stricter mitigation measures, vaccinate most people, and develop widespread immunity. We are gaining immense knowledge about this virus, and as gastroenterologists, we are on the front lines in many aspects. A recent article in American Journal of Gastroenterology, among others, emphasized that mild GI symptoms may be the only presenting complaint for people with COVID-19. Responses to COVID-19, such as limits on elective procedures and social distancing, have upended our endoscopic processes and even altered the business models of GI practice. We will never go back to pre-COVID models.
The front page of this month’s GI & Hepatology News features important articles for our practice. One article delves into an extensive guideline from the American Gastroenterological Association on medical management of colonic diverticulitis. In another article, they also describe how efforts to encourage our patients with nonalcoholic fatty liver disease to exercise and manage their diet can make a real difference in their health. Finally, another explores how and why your immunocompromised patients (including those with inflammatory bowel disease) should and can be safely vaccinated for COVID-19.
Meanwhile, we need civility, science, and community. Without common purpose, we will experience the William Forster Lloyd’s Tragedy of the Commons. Incivility has economic and emotional costs, according to the Harvard Business Review. “Weathering,” the deterioration of Black women’s health over time that’s related to continued socioeconomic disadvantage, has multigenerational impacts; for example the Department of Health & Human Services reports that infant mortality among African American women is 2.3 times that of non-Hispanic Whites. Late effects of redlining continue to cause economic, health, and emotional harms (Badger E. “How Redlining’s Racist Effects Lasted for Decades” The New York Times. 2017 Aug 24).
“If Men were angels, no government would be necessary,” James Madison wrote. “In framing a government which is to be administered by men over men, the great difficulty lies in this: you must first enable the government to control the governed; and the next place, oblige it to control itself.”
John I. Allen, MD, MBA, AGAF
Editor in Chief
I am composing this editorial 4 days after the U.S. Capitol was invaded and 10 days before the presidential inauguration. It is impossible to ignore what is happening in our country, but I hesitate to add my thoughts to the overwhelming sea of opinions circulating in standard media, social media, and the dark web. I hope, as do many, that we return to a civil discourse, recognize the voices of all people, respect each other, and return to a belief in science and facts.
SARS-CoV-2 has devastated the world and will continue to cause preventable deaths until we adopt stricter mitigation measures, vaccinate most people, and develop widespread immunity. We are gaining immense knowledge about this virus, and as gastroenterologists, we are on the front lines in many aspects. A recent article in American Journal of Gastroenterology, among others, emphasized that mild GI symptoms may be the only presenting complaint for people with COVID-19. Responses to COVID-19, such as limits on elective procedures and social distancing, have upended our endoscopic processes and even altered the business models of GI practice. We will never go back to pre-COVID models.
The front page of this month’s GI & Hepatology News features important articles for our practice. One article delves into an extensive guideline from the American Gastroenterological Association on medical management of colonic diverticulitis. In another article, they also describe how efforts to encourage our patients with nonalcoholic fatty liver disease to exercise and manage their diet can make a real difference in their health. Finally, another explores how and why your immunocompromised patients (including those with inflammatory bowel disease) should and can be safely vaccinated for COVID-19.
Meanwhile, we need civility, science, and community. Without common purpose, we will experience the William Forster Lloyd’s Tragedy of the Commons. Incivility has economic and emotional costs, according to the Harvard Business Review. “Weathering,” the deterioration of Black women’s health over time that’s related to continued socioeconomic disadvantage, has multigenerational impacts; for example the Department of Health & Human Services reports that infant mortality among African American women is 2.3 times that of non-Hispanic Whites. Late effects of redlining continue to cause economic, health, and emotional harms (Badger E. “How Redlining’s Racist Effects Lasted for Decades” The New York Times. 2017 Aug 24).
“If Men were angels, no government would be necessary,” James Madison wrote. “In framing a government which is to be administered by men over men, the great difficulty lies in this: you must first enable the government to control the governed; and the next place, oblige it to control itself.”
John I. Allen, MD, MBA, AGAF
Editor in Chief
Update on feeding tubes: Indications and troubleshooting complications
Introduction
Gastroenterologists are in a unique position to manage individuals with feeding tubes as their training underscores principles in digestion, absorption, nutrition support, and enteral tube placement. Adequate management of individuals with feeding tubes and, importantly, the complications that arise from feeding tube use and placement require a basic understanding of intestinal anatomy and physiology. Therefore, gastroenterologists are well suited to both place and manage individuals with feeding tubes in the long term.

Indications for tube feeding
When deciding on the appropriate route for artificial nutrition support, the first decision to be made is enteral access versus parenteral nutrition support. Enteral nutrition confers multiple benefits, including preservation of the mucosal lining, reductions in complicated infections, decreased costs, and improved patient compliance. All attempts at adequate enteral access should be made before deciding on the use of parenteral nutrition. Following the clinical decision to pursue artificial means of nutrition support and enteral access, the next common decision is the anticipated duration of nutrition support. Generally, the oral or nasal tubes are used for short durations (i.e., less than 4 weeks) with percutaneous placement into the stomach or small intestine for longer-term feeding (i.e., percutaneous endoscopic gastrostomy [PEG] or percutaneous endoscopic jejunostomy [PEJ]).
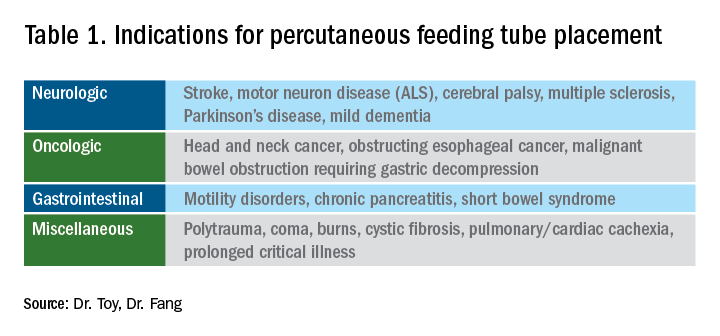
The most general indication for nutrition support is an inability to maintain adequate nutritional needs with oral intake alone. General categories of inadequate oral intake include neurologic disorders, malignancy, and gastrointestinal conditions affecting digestion and absorption (Table 1). Absolute and relative contraindications to PEG placement are listed in Table 2. If an endoscopic placement is not possible, alternative means of placement (i.e., surgery or interventional radiology) can be considered to avoid the consequences of prolonged malnutrition. In-hospital mortality following PEG placement has decreased 40% over the last 10 years, which can be attributed to improved patient selection, enhanced discharge practices, and exclusion of patients with the highest comorbidity and mortality rates, like those with advanced dementia or terminal cancer.1
PEG placement in patients with dementia is controversial, with previous studies not demonstrating improved outcomes and association with high mortality rates,2 so the practice is currently not recommended by the American Geriatrics Society in individuals with advanced dementia.3 However, a large Japanese study showed that careful selection of patients with mild dementia to undergo gastrostomy increased independence fourfold; therefore, multidisciplinary involvement is often necessary in the decision to pursue artificial means of nutrition support in this population.4
The recent coronavirus disease 2019 (COVID-19) pandemic has placed additional strains on endoscopic placement and has highlighted the effect of the severe acute respiratory syndrome coronavirus 2 (SARS-COV-2) on GI symptoms. A recent meta-analysis showed an overall incidence of GI symptoms of 17.6% in the following conditions in decreasing order of prevalence: anorexia, diarrhea, nausea, vomiting, and abdominal discomfort.5 In addition, the prolonged ventilatory requirements among a subset of individuals with the most severe COVID-19 results in extended periods of nutrition support via enteral tube placements. In individuals with ICU-acquired weakness and discharge to long-term care facilities, the placement of percutaneous endoscopic tubes may be required, although with the additional consideration of the need for an aerosolizing procedure. Delay of placement has been advocated, in addition to appropriate personal protective equipment, in order to ensure safe placement for the endoscopy staff.6
Types of feeding tubes
After deciding to feed a patient enterally and determining the anticipated duration of enteral support, the next decision is to determine the most appropriate location of feeding delivery: into the stomach or the small bowel. Gastric feeding is advantageous most commonly because of its increased capacity, allowing for larger volumes to be delivered over shorter durations. However, in the setting of postsurgical anatomy, gastroparesis, or obstructing tumors/pancreatic inflammation, distal delivery of tube feeds may be required into the jejunum. Additionally, percutaneous tubes placed into the stomach can have extenders into the small bowel (GJ tubes) to allow for feeding into the small bowel and decompression or delivery of medications into the stomach.

In general, gastric feeding is preferred over small bowel feeding as PEG tubes are more stable and have fewer complications than either PEG-J or direct PEJ tubes. Gastrostomy tubes are generally shorter and larger in diameter making them less likely to clog. PEG-J tubes have separate lumens for gastric and small intestinal access, but the smaller-bore jejunal extension tubes are more likely to clog or become dislodged. While direct PEJ is shown to have higher rates of tube patency and decreased rates of endoscopic re-intervention, compared with PEG-J,7 one limitation of a direct PEJ is difficulty in placement and site selection, which can be performed with a pediatric colonoscope or balloon enteroscopy system. Most commonly, this procedure is performed under general anesthesia.
In the case of a critically ill patient in the ICU, it is recommended to start enteral nutrition within 24-48 hours of arrival to avoid complications of prolonged calorie deficits. Nasally inserted feeding tubes (e.g., Cortrak, Avanos Medical Devices, Alpharetta, Ga.) are most commonly used at the bedside and can be placed blindly using electromagnetic image guidance, radiographically, or endoscopy. However, the small caliber of nasoenteric tubes comes with the common complication of clogging, which can be overcome with slightly larger bore gastric feeding tubes. If gastric feeding is not tolerated (e.g., in the case of vomiting, witnessed aspiration), small bowel feeding should be initiated and can be a more durable form of enteral feeding with fewer interruptions as feedings do not need to be held for procedures or symptomatic gastric intolerance. In clinical areas of question, or if there is a concern for intolerance of enteral feeding, a short trial with nasogastric or nasojejunal tube placement should be performed before a more definitive percutaneous placement.
With respect to percutaneous tubes, important characteristics to choose are the size (diameter in French units), type of internal retention device, and external appearance of the tube (standard or low profile). All percutaneous tubes contain an external retention device (i.e., bumper) that fits against the skin and an internal retention device that is either a balloon or plastic dome or funnel that prevents the tube from becoming dislodged. Balloon retention tubes require replacement every 3-6 months, while nonballoon tubes generally require replacement annually in order to prevent the plastic from cracking, which can make removal complicated. Low-profile tubes have an external cap, which, when opened, allows for extension tubing to be securely attached while in use and detached while not in use. Low-profile tubes are often preferred among younger, active patients and those with adequate dexterity to allow for attachment of the external extension tubing. These tubes are most often inserted as a replacement for an initially endoscopically placed tube, although one-step systems for initial placement are available. The size of the low-profile tube is chosen based on the size of the existing PEG tube and by measuring the length of the stoma tract using specialized measuring devices.8 Patients and caregivers can also be trained to replace balloon-type tubes on their own to limit complications of displaced or cracked tubes. Low-profile tubes are commercially available for both gastric placement and gastric placement with extension into the small bowel, which often requires fluoroscopy for secure placement.
All percutaneous enteral tubes are being transitioned to the ENfit connector system, which prevents connections from the enteral system to nonenteral systems (namely intravenous lines, chest tubes) and vice versa. Tubing misconnections have been rarely reported, and the EnFIT system is designed to prevent such misadventures that have resulted in serious complications and even mortality.9 Adapter devices are available that may be required for patients with feeding tubes who have not been transitioned yet. Most commonly with new tube placements and replacements, patients and providers will have to become familiar with the new syringes and feeding bags required with EnFIT connectors.
Gastrostomy placement can be considered a higher-risk endoscopic procedure. One complicating factor is the increased use of antiplatelet and anticoagulant therapies in individuals with a history of neurologic insults. The American Society for Gastrointestinal Endoscopy (ASGE) guidelines recommend that coumadin be held 5 days before the procedure and bridged with heparin if the patient is at high risk of thromboembolic complications. For patients on dual anti-platelet therapy, thienopyridines like clopidogrel are often stopped 5-7 days prior to procedure with continuation of aspirin,10 but there are more recent data that PEG insertion is safe with continued use of DAPT.11 Direct-acting anticoagulants (DOACs) are often stopped 24-48 hours prior to procedure and then restarted 48 hours after tube placement, but this is dependent on the half-life of the specific DOAC and the patient’s renal function. Patients with decreased creatinine clearance may need to hold the DOAC up to 3-4 days prior to the procedure. In this situation, referring to ASGE guidelines and consultation with a hematologist or managing anti-coagulation clinic is advised.10
Troubleshooting complications
Nasoenteric tubes: One of the most common and irritating complications with nasoenteric feeding tubes is clogging. To prevent clogging, the tube should be flushed frequently.12 At least 30 mL of free water should be used to flush the tube every 4-8 hours for continuous feedings or before and after bolus feeding. Additionally, 15-30 mL of water should be given with each separate medication administration, and if possible, medication administration via small-bore small bowel feeding tubes should be avoided.12 Water flushing is especially important with small-caliber tubes and pumps that deliver both feeding and water flushes. It is available for small bowel feeding in order to allow for programmed water delivery.
Warm water flushes can also help unclog the tube,12 and additional pharmacologic and mechanical devices have been promoted for clogged tubes. One common technique is mixing pancreatic enzymes (Viokase) with a crushed 325-mg tablet of nonenteric coated sodium bicarbonate and 5 mL of water to create a solution that has the alkaline properties allowing for both pancreatic enzyme activation and clog dissolution. Additionally, an endoscopic retrograde cholangiopancreatography (ERCP) catheter can be placed into longer feeding tubes to directly infuse the activated agent to the site of the clog.13 If water and enzymes are not successful in unclogging the tube, commercially available brushes can help remove clogs. The TubeClear® system (Actuated Medical, Bellefonte, Penna) has a single-use stem that is connected to AC power to create a jackhammerlike movement to remove clogs in longer nasoenteral and gastrojejunal tubes.
PEG tubes (short-term complications): Procedural and immediate postprocedural complications include bleeding, aspiration, pneumoperitoneum, and perforation. Pneumoperitoneum occurs in approximately 50% of cases and is generally clinically insignificant. The risk of pneumoperitoneum can be reduced by using CO2 insufflation.14 If the patient develops systemic signs of infection or peritoneal signs, CT scan with oral contrast is warranted for further evaluation and to assess for inadvertent perforation of overlying bowel or dislodged tube. Aspiration during or following endoscopy is another common complication of PEG placement and risk factors include over-sedation, supine positioning, advanced age, and neurologic dysfunction. This risk can be mitigated by avoiding over-sedation, immediately aspirating gastric contents when the stomach is reached, and avoiding excessive insufflation.15 In addition, elevating the head of the bed during the procedure and dedicating an assistant to perform oral suctioning during the entire procedure is recommended.
PEG tubes (long-term complications): More delayed complications of PEG insertion include wound infection, buried bumper syndrome, tumor seeding, peristomal leakage, and tube dislodgement. The prevalence of wound infection is 5%- 25%,16 and randomized controlled trials have demonstrated the efficacy of a single dose of an IV antibiotic (i.e., cephalosporin) in those not already receiving a broad spectrum antibiotic and administered prophylactically before tube placement.17 The significance of this reduction is such that antibiotic administration before tube placement should be considered a quality measure for the procedure. A small amount of redness around the tube site (less than 5 mm) is typical, but extension of erythema, warmth, tenderness, purulent drainage, or systemic symptoms is consistent with infection and warrants additional antibiotic administration. Minor infections can be treated with local antiseptics and oral antibiotics, and early intervention is important to prevent need for hospital admission, systemic antibiotics, and even surgical debridement.
Peristomal leakage is reported in approximately 1%-2% of patients.18 Photographs of the site can be very useful in evaluating and managing peristomal leakage and infections. Interventions include reducing gastric secretions with proton pump inhibitors and management of the skin with barrier creams, such as zinc oxide (Calmoseptine®) ointment. Placement of a larger-diameter tube only enlarges the stoma track and worsens the leakage. In such cases, thorough evaluations for delayed gastric emptying (gastroparesis), distal obstruction, or constipation should be performed and managed accordingly. Opiates are common contributors to constipation and delayed gastric emptying and often require reduction in use or directed antagonist therapy to reduce leaking. Continuous feeding over bolus feedings and delivering nutrition distally into the small bowel (PEG-J placement) can improve leaking from gastrostomy tubes. Additional means of management include stabilizing the tube by replacing a traditional tube with a low-profile tube or using right-angle external bumpers. If all measures fail, removing the tube and allowing for stomal closure can be attempted,16 although this option often requires parenteral nutrition support to prevent prolonged periods of inadequate nutrition.
Buried bumper syndrome (BBS) occurs in 1.5%-8.8% of PEG placements and is a common late complication of PEG placement, although early reports have been described.18 The development of BBS occurs when the internal bumper migrates from the gastric lumen through and into the stomach or abdominal wall. It occurs more frequently with solid nonballoon retention tubes and is caused by excessive compression of the external bumper against the skin and abdominal wall. Patients with BBS usually present with an immobile catheter, resistance with feeds (because of a closure of the stomach wall around the internal portion of the gastrostomy tube), abdominal pain, or peristomal leakage. Physicians should be aware of and assess tubes for BBS, in particular when replacing an immobile tube (cannot be pushed into the free stomach lumen) or when there is difficulty in flushing water into the tube. This complication can be easily prevented by allowing a minimum of 0.5-1.0 cm (1 finger breadth) between the external bumper and the abdominal wall. In particular, patients and caregivers should be warned that if the patient gains significant amounts of weight, the outer bumper will need to be loosened. Once BBS is diagnosed, the PEG tube requires removal and replacement as it can cause bleeding, infection, or fasciitis. The general steps to replacement include endoscopic removal of the existing tube and replacement of new PEG in the existing tract as long as the BBS is not severe. In most cases a replacement tube can be pulled into place using the pull-PEG technique at the same gastrostomy site as long as the stoma tract can be cannulated with a wire after the existing tube is removed.
Similar to nasoenteric tubes, PEG tubes can become clogged, although this complication is infrequent. The primary steps for prevention include adequately flushing with water before and after feeds and ensuring that all medications are liquid or well crushed and dissolved before instilling. Timely tube replacement also ensures that the internal portions of the gastrostomy tube remain free of debris. Management is similar to that of unclogging nasoenteral tubes, as discussed above, and specific commercial declogging devices for PEG tubes include the Bionix Declogger® (Bionix Development Corp., Toledo, Ohio) and the Bard® PEG cleaning brush (Bard Peripheral Vascular Inc., Tempe, Ariz.). The Bionix system has a plastic stem with a screw and thread design that will remove clogs in 14-24 French PEG tubes, while the Bard brush has a flexible nylon stem with soft bristles at the end to prevent mucosal injury and can be used for prophylaxis against clogs, as well as removing clogs themselves.12
Lastly, a rare but important complication of PEG placement is tumor seeding of the PEG site in patients with active head and neck or upper gastrointestinal cancer.19 The presumed mechanism is shearing of tumor cells as the PEG is pulled through the upper aerodigestive tract and through the wall of the stomach, as prior studies have demonstrated frequent seeding of tubes and incision sites as shown by brushing the tube for malignant cells after tube placement.20 It is important to recognize this complication and not misdiagnose it as granulation tissue, infection, or bleeding as the spread of the cancer generally portends a poor prognosis. Therefore, it is best to use a PEG insertion technique that does not involve pulling or pushing the PEG through the upper aerodigestive tract in patients with active cancer and instead place tubes via an external approach by colleagues in interventional radiology or via direct surgical placement.
Conclusion
Gastroenterologists occupy a unique role in evaluation, diagnosis, and management of patients requiring enteral feeding. In addition, they are best equipped to place, prevent, and manage complications of tube feeding. For this reason, it is imperative that gastroenterologists familiarize themselves with indications for enteral tubes and types of enteral tubes available, as well as the identification and management of common complications. Comprehensive understanding of these concepts will augment the practicing gastroenterologist’s ability to manage patients requiring enteral nutrition support with confidence.
References
1. Stein DJ et al. Dig Dis Sci. 2020 Jun 19. doi: 10.1007/s10620-020-06396-y.
2. American Geriatrics Society Ethics Committee and Clinical Practice and Models of Care Committee. J Am Geriatr Soc. 2014;62(8):1590-3.
3. Dietrich CG, Schoppmeyer K. World J Gastroenterol. 2020;26(20):2464-71.
4. Suzuki Y et al. T Gastroenterology Res.2012 Feb;5(1):10-20.
5. Cheung KS et al. Gastroenterology. 2020 Jul;159(1):81-95.
6. Micic D et al. Am J Gastroenterol. 2020 Sep;115(9):1367-70.
7. Fan AC et al. Gastrointest Endosc. 2002;56(6):890-4.
8. Tang SJ. Video J Encycl GI Endosc. 2014;2(2):70-3.
9. Guenter P, Lyman B. Nutr Clin Pract. 2016;31(6):769-72.
10. Acosta RD et al. Gastrointest Endosc. 2016;83(1):3-16.
11. Richter JA et al. Gastrointest Endosc. 2011;74(1):22-34.
12. Boullata JI et al. JPEN. 2017;41(1):15-103.
13. McClave SA. Tech Gastrointest Endosc. 2021;3(1):62-8.
14. Murphy CJ et al. Endosc Int Open. 2016;4(3):E292. doi: 10.1053/tgie.2001.19915.
15. Lynch CR et al. Pract Gastroenterology. 2004;28:66-77.
16. Hucl T et al. Best Pract Res Clin Gastroenterol. 2016;30(5):769-81. doi: 10.1016/j.bpg.2016.10.002.
17. Jafri NS et al. Aliment Pharmacol & Therapeut. 2007;25(6):647-56. doi: 10.1111/j.1365-2036.2007.03247.x.
18. Blumenstein I et al. World J Gastroenterol. 2014;20(26):8505-24. doi: 10.3748/wjg.v20.i26.8505.
19. Fung E et al. Surgical Endosc. 2017;31(9):3623-7. doi: 10.1007/s00464-016-5394-8.
20. Ellrichmann M et al. Endoscopy. 2013;45(07):526-31. doi: 10.1055/s-0033-1344023.
Dr. Toy is with the department of internal medicine at the University of Utah, Salt Lake City. Dr. Fang is with the division of gastroenterology and hepatology at the University of Utah.
Introduction
Gastroenterologists are in a unique position to manage individuals with feeding tubes as their training underscores principles in digestion, absorption, nutrition support, and enteral tube placement. Adequate management of individuals with feeding tubes and, importantly, the complications that arise from feeding tube use and placement require a basic understanding of intestinal anatomy and physiology. Therefore, gastroenterologists are well suited to both place and manage individuals with feeding tubes in the long term.
Indications for tube feeding
When deciding on the appropriate route for artificial nutrition support, the first decision to be made is enteral access versus parenteral nutrition support. Enteral nutrition confers multiple benefits, including preservation of the mucosal lining, reductions in complicated infections, decreased costs, and improved patient compliance. All attempts at adequate enteral access should be made before deciding on the use of parenteral nutrition. Following the clinical decision to pursue artificial means of nutrition support and enteral access, the next common decision is the anticipated duration of nutrition support. Generally, the oral or nasal tubes are used for short durations (i.e., less than 4 weeks) with percutaneous placement into the stomach or small intestine for longer-term feeding (i.e., percutaneous endoscopic gastrostomy [PEG] or percutaneous endoscopic jejunostomy [PEJ]).
The most general indication for nutrition support is an inability to maintain adequate nutritional needs with oral intake alone. General categories of inadequate oral intake include neurologic disorders, malignancy, and gastrointestinal conditions affecting digestion and absorption (Table 1). Absolute and relative contraindications to PEG placement are listed in Table 2. If an endoscopic placement is not possible, alternative means of placement (i.e., surgery or interventional radiology) can be considered to avoid the consequences of prolonged malnutrition. In-hospital mortality following PEG placement has decreased 40% over the last 10 years, which can be attributed to improved patient selection, enhanced discharge practices, and exclusion of patients with the highest comorbidity and mortality rates, like those with advanced dementia or terminal cancer.1
PEG placement in patients with dementia is controversial, with previous studies not demonstrating improved outcomes and association with high mortality rates,2 so the practice is currently not recommended by the American Geriatrics Society in individuals with advanced dementia.3 However, a large Japanese study showed that careful selection of patients with mild dementia to undergo gastrostomy increased independence fourfold; therefore, multidisciplinary involvement is often necessary in the decision to pursue artificial means of nutrition support in this population.4
The recent coronavirus disease 2019 (COVID-19) pandemic has placed additional strains on endoscopic placement and has highlighted the effect of the severe acute respiratory syndrome coronavirus 2 (SARS-COV-2) on GI symptoms. A recent meta-analysis showed an overall incidence of GI symptoms of 17.6% in the following conditions in decreasing order of prevalence: anorexia, diarrhea, nausea, vomiting, and abdominal discomfort.5 In addition, the prolonged ventilatory requirements among a subset of individuals with the most severe COVID-19 results in extended periods of nutrition support via enteral tube placements. In individuals with ICU-acquired weakness and discharge to long-term care facilities, the placement of percutaneous endoscopic tubes may be required, although with the additional consideration of the need for an aerosolizing procedure. Delay of placement has been advocated, in addition to appropriate personal protective equipment, in order to ensure safe placement for the endoscopy staff.6
Types of feeding tubes
After deciding to feed a patient enterally and determining the anticipated duration of enteral support, the next decision is to determine the most appropriate location of feeding delivery: into the stomach or the small bowel. Gastric feeding is advantageous most commonly because of its increased capacity, allowing for larger volumes to be delivered over shorter durations. However, in the setting of postsurgical anatomy, gastroparesis, or obstructing tumors/pancreatic inflammation, distal delivery of tube feeds may be required into the jejunum. Additionally, percutaneous tubes placed into the stomach can have extenders into the small bowel (GJ tubes) to allow for feeding into the small bowel and decompression or delivery of medications into the stomach.
In general, gastric feeding is preferred over small bowel feeding as PEG tubes are more stable and have fewer complications than either PEG-J or direct PEJ tubes. Gastrostomy tubes are generally shorter and larger in diameter making them less likely to clog. PEG-J tubes have separate lumens for gastric and small intestinal access, but the smaller-bore jejunal extension tubes are more likely to clog or become dislodged. While direct PEJ is shown to have higher rates of tube patency and decreased rates of endoscopic re-intervention, compared with PEG-J,7 one limitation of a direct PEJ is difficulty in placement and site selection, which can be performed with a pediatric colonoscope or balloon enteroscopy system. Most commonly, this procedure is performed under general anesthesia.
In the case of a critically ill patient in the ICU, it is recommended to start enteral nutrition within 24-48 hours of arrival to avoid complications of prolonged calorie deficits. Nasally inserted feeding tubes (e.g., Cortrak, Avanos Medical Devices, Alpharetta, Ga.) are most commonly used at the bedside and can be placed blindly using electromagnetic image guidance, radiographically, or endoscopy. However, the small caliber of nasoenteric tubes comes with the common complication of clogging, which can be overcome with slightly larger bore gastric feeding tubes. If gastric feeding is not tolerated (e.g., in the case of vomiting, witnessed aspiration), small bowel feeding should be initiated and can be a more durable form of enteral feeding with fewer interruptions as feedings do not need to be held for procedures or symptomatic gastric intolerance. In clinical areas of question, or if there is a concern for intolerance of enteral feeding, a short trial with nasogastric or nasojejunal tube placement should be performed before a more definitive percutaneous placement.
With respect to percutaneous tubes, important characteristics to choose are the size (diameter in French units), type of internal retention device, and external appearance of the tube (standard or low profile). All percutaneous tubes contain an external retention device (i.e., bumper) that fits against the skin and an internal retention device that is either a balloon or plastic dome or funnel that prevents the tube from becoming dislodged. Balloon retention tubes require replacement every 3-6 months, while nonballoon tubes generally require replacement annually in order to prevent the plastic from cracking, which can make removal complicated. Low-profile tubes have an external cap, which, when opened, allows for extension tubing to be securely attached while in use and detached while not in use. Low-profile tubes are often preferred among younger, active patients and those with adequate dexterity to allow for attachment of the external extension tubing. These tubes are most often inserted as a replacement for an initially endoscopically placed tube, although one-step systems for initial placement are available. The size of the low-profile tube is chosen based on the size of the existing PEG tube and by measuring the length of the stoma tract using specialized measuring devices.8 Patients and caregivers can also be trained to replace balloon-type tubes on their own to limit complications of displaced or cracked tubes. Low-profile tubes are commercially available for both gastric placement and gastric placement with extension into the small bowel, which often requires fluoroscopy for secure placement.
All percutaneous enteral tubes are being transitioned to the ENfit connector system, which prevents connections from the enteral system to nonenteral systems (namely intravenous lines, chest tubes) and vice versa. Tubing misconnections have been rarely reported, and the EnFIT system is designed to prevent such misadventures that have resulted in serious complications and even mortality.9 Adapter devices are available that may be required for patients with feeding tubes who have not been transitioned yet. Most commonly with new tube placements and replacements, patients and providers will have to become familiar with the new syringes and feeding bags required with EnFIT connectors.
Gastrostomy placement can be considered a higher-risk endoscopic procedure. One complicating factor is the increased use of antiplatelet and anticoagulant therapies in individuals with a history of neurologic insults. The American Society for Gastrointestinal Endoscopy (ASGE) guidelines recommend that coumadin be held 5 days before the procedure and bridged with heparin if the patient is at high risk of thromboembolic complications. For patients on dual anti-platelet therapy, thienopyridines like clopidogrel are often stopped 5-7 days prior to procedure with continuation of aspirin,10 but there are more recent data that PEG insertion is safe with continued use of DAPT.11 Direct-acting anticoagulants (DOACs) are often stopped 24-48 hours prior to procedure and then restarted 48 hours after tube placement, but this is dependent on the half-life of the specific DOAC and the patient’s renal function. Patients with decreased creatinine clearance may need to hold the DOAC up to 3-4 days prior to the procedure. In this situation, referring to ASGE guidelines and consultation with a hematologist or managing anti-coagulation clinic is advised.10
Troubleshooting complications
Nasoenteric tubes: One of the most common and irritating complications with nasoenteric feeding tubes is clogging. To prevent clogging, the tube should be flushed frequently.12 At least 30 mL of free water should be used to flush the tube every 4-8 hours for continuous feedings or before and after bolus feeding. Additionally, 15-30 mL of water should be given with each separate medication administration, and if possible, medication administration via small-bore small bowel feeding tubes should be avoided.12 Water flushing is especially important with small-caliber tubes and pumps that deliver both feeding and water flushes. It is available for small bowel feeding in order to allow for programmed water delivery.
Warm water flushes can also help unclog the tube,12 and additional pharmacologic and mechanical devices have been promoted for clogged tubes. One common technique is mixing pancreatic enzymes (Viokase) with a crushed 325-mg tablet of nonenteric coated sodium bicarbonate and 5 mL of water to create a solution that has the alkaline properties allowing for both pancreatic enzyme activation and clog dissolution. Additionally, an endoscopic retrograde cholangiopancreatography (ERCP) catheter can be placed into longer feeding tubes to directly infuse the activated agent to the site of the clog.13 If water and enzymes are not successful in unclogging the tube, commercially available brushes can help remove clogs. The TubeClear® system (Actuated Medical, Bellefonte, Penna) has a single-use stem that is connected to AC power to create a jackhammerlike movement to remove clogs in longer nasoenteral and gastrojejunal tubes.
PEG tubes (short-term complications): Procedural and immediate postprocedural complications include bleeding, aspiration, pneumoperitoneum, and perforation. Pneumoperitoneum occurs in approximately 50% of cases and is generally clinically insignificant. The risk of pneumoperitoneum can be reduced by using CO2 insufflation.14 If the patient develops systemic signs of infection or peritoneal signs, CT scan with oral contrast is warranted for further evaluation and to assess for inadvertent perforation of overlying bowel or dislodged tube. Aspiration during or following endoscopy is another common complication of PEG placement and risk factors include over-sedation, supine positioning, advanced age, and neurologic dysfunction. This risk can be mitigated by avoiding over-sedation, immediately aspirating gastric contents when the stomach is reached, and avoiding excessive insufflation.15 In addition, elevating the head of the bed during the procedure and dedicating an assistant to perform oral suctioning during the entire procedure is recommended.
PEG tubes (long-term complications): More delayed complications of PEG insertion include wound infection, buried bumper syndrome, tumor seeding, peristomal leakage, and tube dislodgement. The prevalence of wound infection is 5%- 25%,16 and randomized controlled trials have demonstrated the efficacy of a single dose of an IV antibiotic (i.e., cephalosporin) in those not already receiving a broad spectrum antibiotic and administered prophylactically before tube placement.17 The significance of this reduction is such that antibiotic administration before tube placement should be considered a quality measure for the procedure. A small amount of redness around the tube site (less than 5 mm) is typical, but extension of erythema, warmth, tenderness, purulent drainage, or systemic symptoms is consistent with infection and warrants additional antibiotic administration. Minor infections can be treated with local antiseptics and oral antibiotics, and early intervention is important to prevent need for hospital admission, systemic antibiotics, and even surgical debridement.
Peristomal leakage is reported in approximately 1%-2% of patients.18 Photographs of the site can be very useful in evaluating and managing peristomal leakage and infections. Interventions include reducing gastric secretions with proton pump inhibitors and management of the skin with barrier creams, such as zinc oxide (Calmoseptine®) ointment. Placement of a larger-diameter tube only enlarges the stoma track and worsens the leakage. In such cases, thorough evaluations for delayed gastric emptying (gastroparesis), distal obstruction, or constipation should be performed and managed accordingly. Opiates are common contributors to constipation and delayed gastric emptying and often require reduction in use or directed antagonist therapy to reduce leaking. Continuous feeding over bolus feedings and delivering nutrition distally into the small bowel (PEG-J placement) can improve leaking from gastrostomy tubes. Additional means of management include stabilizing the tube by replacing a traditional tube with a low-profile tube or using right-angle external bumpers. If all measures fail, removing the tube and allowing for stomal closure can be attempted,16 although this option often requires parenteral nutrition support to prevent prolonged periods of inadequate nutrition.
Buried bumper syndrome (BBS) occurs in 1.5%-8.8% of PEG placements and is a common late complication of PEG placement, although early reports have been described.18 The development of BBS occurs when the internal bumper migrates from the gastric lumen through and into the stomach or abdominal wall. It occurs more frequently with solid nonballoon retention tubes and is caused by excessive compression of the external bumper against the skin and abdominal wall. Patients with BBS usually present with an immobile catheter, resistance with feeds (because of a closure of the stomach wall around the internal portion of the gastrostomy tube), abdominal pain, or peristomal leakage. Physicians should be aware of and assess tubes for BBS, in particular when replacing an immobile tube (cannot be pushed into the free stomach lumen) or when there is difficulty in flushing water into the tube. This complication can be easily prevented by allowing a minimum of 0.5-1.0 cm (1 finger breadth) between the external bumper and the abdominal wall. In particular, patients and caregivers should be warned that if the patient gains significant amounts of weight, the outer bumper will need to be loosened. Once BBS is diagnosed, the PEG tube requires removal and replacement as it can cause bleeding, infection, or fasciitis. The general steps to replacement include endoscopic removal of the existing tube and replacement of new PEG in the existing tract as long as the BBS is not severe. In most cases a replacement tube can be pulled into place using the pull-PEG technique at the same gastrostomy site as long as the stoma tract can be cannulated with a wire after the existing tube is removed.
Similar to nasoenteric tubes, PEG tubes can become clogged, although this complication is infrequent. The primary steps for prevention include adequately flushing with water before and after feeds and ensuring that all medications are liquid or well crushed and dissolved before instilling. Timely tube replacement also ensures that the internal portions of the gastrostomy tube remain free of debris. Management is similar to that of unclogging nasoenteral tubes, as discussed above, and specific commercial declogging devices for PEG tubes include the Bionix Declogger® (Bionix Development Corp., Toledo, Ohio) and the Bard® PEG cleaning brush (Bard Peripheral Vascular Inc., Tempe, Ariz.). The Bionix system has a plastic stem with a screw and thread design that will remove clogs in 14-24 French PEG tubes, while the Bard brush has a flexible nylon stem with soft bristles at the end to prevent mucosal injury and can be used for prophylaxis against clogs, as well as removing clogs themselves.12
Lastly, a rare but important complication of PEG placement is tumor seeding of the PEG site in patients with active head and neck or upper gastrointestinal cancer.19 The presumed mechanism is shearing of tumor cells as the PEG is pulled through the upper aerodigestive tract and through the wall of the stomach, as prior studies have demonstrated frequent seeding of tubes and incision sites as shown by brushing the tube for malignant cells after tube placement.20 It is important to recognize this complication and not misdiagnose it as granulation tissue, infection, or bleeding as the spread of the cancer generally portends a poor prognosis. Therefore, it is best to use a PEG insertion technique that does not involve pulling or pushing the PEG through the upper aerodigestive tract in patients with active cancer and instead place tubes via an external approach by colleagues in interventional radiology or via direct surgical placement.
Conclusion
Gastroenterologists occupy a unique role in evaluation, diagnosis, and management of patients requiring enteral feeding. In addition, they are best equipped to place, prevent, and manage complications of tube feeding. For this reason, it is imperative that gastroenterologists familiarize themselves with indications for enteral tubes and types of enteral tubes available, as well as the identification and management of common complications. Comprehensive understanding of these concepts will augment the practicing gastroenterologist’s ability to manage patients requiring enteral nutrition support with confidence.
References
1. Stein DJ et al. Dig Dis Sci. 2020 Jun 19. doi: 10.1007/s10620-020-06396-y.
2. American Geriatrics Society Ethics Committee and Clinical Practice and Models of Care Committee. J Am Geriatr Soc. 2014;62(8):1590-3.
3. Dietrich CG, Schoppmeyer K. World J Gastroenterol. 2020;26(20):2464-71.
4. Suzuki Y et al. T Gastroenterology Res.2012 Feb;5(1):10-20.
5. Cheung KS et al. Gastroenterology. 2020 Jul;159(1):81-95.
6. Micic D et al. Am J Gastroenterol. 2020 Sep;115(9):1367-70.
7. Fan AC et al. Gastrointest Endosc. 2002;56(6):890-4.
8. Tang SJ. Video J Encycl GI Endosc. 2014;2(2):70-3.
9. Guenter P, Lyman B. Nutr Clin Pract. 2016;31(6):769-72.
10. Acosta RD et al. Gastrointest Endosc. 2016;83(1):3-16.
11. Richter JA et al. Gastrointest Endosc. 2011;74(1):22-34.
12. Boullata JI et al. JPEN. 2017;41(1):15-103.
13. McClave SA. Tech Gastrointest Endosc. 2021;3(1):62-8.
14. Murphy CJ et al. Endosc Int Open. 2016;4(3):E292. doi: 10.1053/tgie.2001.19915.
15. Lynch CR et al. Pract Gastroenterology. 2004;28:66-77.
16. Hucl T et al. Best Pract Res Clin Gastroenterol. 2016;30(5):769-81. doi: 10.1016/j.bpg.2016.10.002.
17. Jafri NS et al. Aliment Pharmacol & Therapeut. 2007;25(6):647-56. doi: 10.1111/j.1365-2036.2007.03247.x.
18. Blumenstein I et al. World J Gastroenterol. 2014;20(26):8505-24. doi: 10.3748/wjg.v20.i26.8505.
19. Fung E et al. Surgical Endosc. 2017;31(9):3623-7. doi: 10.1007/s00464-016-5394-8.
20. Ellrichmann M et al. Endoscopy. 2013;45(07):526-31. doi: 10.1055/s-0033-1344023.
Dr. Toy is with the department of internal medicine at the University of Utah, Salt Lake City. Dr. Fang is with the division of gastroenterology and hepatology at the University of Utah.

How productivity influences compensation in private practice
When starting a career in gastroenterology, physicians tend to work in the hospital, where there is usually high demand for services and productivity goals are easy to meet. This is a little different in private GI groups, where it takes some time to build up your patient base. This might be a significant concern for young physicians considering private practice. But understanding the role that productivity plays in compensation packages can help in choosing the right group to join.

While compensation models may differ from practice to practice, there is usually a base salary provided with a productivity bonus. Some practices may use productivity along with other measures to determine when a physician is eligible to become a partner in the practice. Partnership is often accompanied with the benefits of ancillary services ownership such as ambulatory surgery centers (ASCs) and anesthesia, pathology, and infusion services.

How is productivity measured?
Most practices utilize relative value units (RVUs), a standard used by Medicare to determine the amount to pay physicians according to their productivity. Most public and private payers are utilizing the RVU system first developed for Medicare as a useful, time-saving way to handle physician payments. The RVU defines the volume of work doctors perform for all procedures and services covered under the Medicare Physician Fee Schedule.
The Medicare Physician Payment System has three components:
• The geographic practice cost indices (GPCIs)
• Relative value units (RVUs)
• A conversion factor
It is important to understand the types of RVUs that exist to understand how to calculate them properly – these include the following categories:
• Physician work, which accounts for the time and effort to perform a procedure.
• Practice expense, which is for the costs of nonphysician labor such as rent and supplies.
• Global fees, which includes fees for initial visits, follow-ups, and practice expense, and applies during a predetermined length of time known as the “global periods,” primarily for major surgeries.
• Malpractice expense, such as costs for professional liability insurance.
There is no specific dollar amount attached to an RVU because RVUs are part of a resource-based relative value scale (RBRVS) which uses RVUs to relate medical procedures to each other. Payment for physician work is based on whether the procedure is performed in an ASC or hospital outpatient department or in an office. A separate facility fee payment is made to the ASC or hospital outpatient department for procedures performed there. Other elements include skills and the amount of time needed to perform a procedure. Calculating the reimbursement from an RVU involves several components and a significant amount of complex math.
Meeting goals while building a practice
For many young physicians working in the hospital where patients are plentiful, it might seem daunting to build your practice with productivity goals. Practices should, and many do, design their initial productivity plans to minimum or mean RVUs for young physicians rather than someone 10 years into practice. Younger physicians have fellowship and training, but it takes years to become highly efficient with time and productivity. It’s important for everyone involved to set attainable benchmarks.
The practice should also do its best to support your efforts to grow your patient base. While you should be expected to develop relationships with referring physicians, you’ll benefit from the practice’s marketing efforts. When new patients come in, they usually go to newly hired physicians because more senior physicians are booked weeks or months in advance.
Practice administrators also work hard to time new hires to overlap with expected retirements. Senior partners will always have follow-up colonoscopies and associates will need to take on these cases as their colleagues retire. In some practices, younger physicians are expected to take the hospital on call schedules or respond to emergency department calls, so it shouldn’t be difficult to meet productivity goals.
And once you become a partner and are further along on in your career, your productivity plan will change. Some groups have productivity-based compensation, which allows more senior partners to work when they want to – as long as they are meeting the productivity rates that will cover their portion of the practice expenses.
If a physician is consistently not meeting productivity measures, a practice may exercise the right to terminate the relationship, but this is rare. More often, physicians meet their productivity levels and receive certain bonuses for exceeding their goals. In most practices, the partners you work with will know if you aren’t meeting your goals. In most cases, they will take on a mentorship role to help you succeed.
Ask questions, be engaged
Another thing to be aware of is that all practices worth joining make sure productivity plans do not violate the Stark Law, anti-kickback statutes, or other regulations. A huge red flag to look out for is a productivity plan that is based on the number of procedures – it should never be tied to volume.
It’s also best to consider how often the productivity plan is measured. It might be a red flag if it is measured weekly or monthly or if there are heavy consequences for not meeting RVU goals. Most groups look at productivity on a quarterly basis and integrate those discussions into a standard review process.
The successful early-career GIs we interview in our practices are those who are interested in understanding the ins and outs of our practices and what they can achieve through practicing independently. The practices worth joining will likewise be interested in discussing your level of entrepreneurship, the opportunities for you to grow in your career, and what it takes to be on the track to partner.
Dr. Baig is a practicing gastroenterologist at Allied Digestive Care in New Jersey and is the chair of communications for the Digestive Health Physicians Association (DHPA); Mr. Harlen is the president of PE Practice Solutions and immediate past chief operating officer of Capital Digestive Care in Maryland. He is the executive director of DHPA.
When starting a career in gastroenterology, physicians tend to work in the hospital, where there is usually high demand for services and productivity goals are easy to meet. This is a little different in private GI groups, where it takes some time to build up your patient base. This might be a significant concern for young physicians considering private practice. But understanding the role that productivity plays in compensation packages can help in choosing the right group to join.
While compensation models may differ from practice to practice, there is usually a base salary provided with a productivity bonus. Some practices may use productivity along with other measures to determine when a physician is eligible to become a partner in the practice. Partnership is often accompanied with the benefits of ancillary services ownership such as ambulatory surgery centers (ASCs) and anesthesia, pathology, and infusion services.
How is productivity measured?
Most practices utilize relative value units (RVUs), a standard used by Medicare to determine the amount to pay physicians according to their productivity. Most public and private payers are utilizing the RVU system first developed for Medicare as a useful, time-saving way to handle physician payments. The RVU defines the volume of work doctors perform for all procedures and services covered under the Medicare Physician Fee Schedule.
The Medicare Physician Payment System has three components:
• The geographic practice cost indices (GPCIs)
• Relative value units (RVUs)
• A conversion factor
It is important to understand the types of RVUs that exist to understand how to calculate them properly – these include the following categories:
• Physician work, which accounts for the time and effort to perform a procedure.
• Practice expense, which is for the costs of nonphysician labor such as rent and supplies.
• Global fees, which includes fees for initial visits, follow-ups, and practice expense, and applies during a predetermined length of time known as the “global periods,” primarily for major surgeries.
• Malpractice expense, such as costs for professional liability insurance.
There is no specific dollar amount attached to an RVU because RVUs are part of a resource-based relative value scale (RBRVS) which uses RVUs to relate medical procedures to each other. Payment for physician work is based on whether the procedure is performed in an ASC or hospital outpatient department or in an office. A separate facility fee payment is made to the ASC or hospital outpatient department for procedures performed there. Other elements include skills and the amount of time needed to perform a procedure. Calculating the reimbursement from an RVU involves several components and a significant amount of complex math.
Meeting goals while building a practice
For many young physicians working in the hospital where patients are plentiful, it might seem daunting to build your practice with productivity goals. Practices should, and many do, design their initial productivity plans to minimum or mean RVUs for young physicians rather than someone 10 years into practice. Younger physicians have fellowship and training, but it takes years to become highly efficient with time and productivity. It’s important for everyone involved to set attainable benchmarks.
The practice should also do its best to support your efforts to grow your patient base. While you should be expected to develop relationships with referring physicians, you’ll benefit from the practice’s marketing efforts. When new patients come in, they usually go to newly hired physicians because more senior physicians are booked weeks or months in advance.
Practice administrators also work hard to time new hires to overlap with expected retirements. Senior partners will always have follow-up colonoscopies and associates will need to take on these cases as their colleagues retire. In some practices, younger physicians are expected to take the hospital on call schedules or respond to emergency department calls, so it shouldn’t be difficult to meet productivity goals.
And once you become a partner and are further along on in your career, your productivity plan will change. Some groups have productivity-based compensation, which allows more senior partners to work when they want to – as long as they are meeting the productivity rates that will cover their portion of the practice expenses.
If a physician is consistently not meeting productivity measures, a practice may exercise the right to terminate the relationship, but this is rare. More often, physicians meet their productivity levels and receive certain bonuses for exceeding their goals. In most practices, the partners you work with will know if you aren’t meeting your goals. In most cases, they will take on a mentorship role to help you succeed.
Ask questions, be engaged
Another thing to be aware of is that all practices worth joining make sure productivity plans do not violate the Stark Law, anti-kickback statutes, or other regulations. A huge red flag to look out for is a productivity plan that is based on the number of procedures – it should never be tied to volume.
It’s also best to consider how often the productivity plan is measured. It might be a red flag if it is measured weekly or monthly or if there are heavy consequences for not meeting RVU goals. Most groups look at productivity on a quarterly basis and integrate those discussions into a standard review process.
The successful early-career GIs we interview in our practices are those who are interested in understanding the ins and outs of our practices and what they can achieve through practicing independently. The practices worth joining will likewise be interested in discussing your level of entrepreneurship, the opportunities for you to grow in your career, and what it takes to be on the track to partner.
Dr. Baig is a practicing gastroenterologist at Allied Digestive Care in New Jersey and is the chair of communications for the Digestive Health Physicians Association (DHPA); Mr. Harlen is the president of PE Practice Solutions and immediate past chief operating officer of Capital Digestive Care in Maryland. He is the executive director of DHPA.