User login
Education: The Mediating Factor in Gun Violence?
I read “Up In Arms About Gun Violence” in the May/June issue of Clinician Reviews with great interest. My response is drawn from research, professional experience, and three particularly formative experiences:
- The birth of a child with learning and behavioral differences requiring an individualized education program and temporary placement in an alternative school.
- Co-leading a parent workshop for my clinical Capstone project.
- A nonclinical position at a public alternative school for children with emotional and behavioral disorders.
In nursing, as in all human services, we strive to be holistic, drawing from science, research, ethics, human development, sociology, anthropology, etc, to function in our roles. Many in nursing have come to value and function well in multidisciplinary teams for the management of individuals with complex needs.
What I have learned in my life—a fact supported by my professional preparation—is that the cycle of poverty, poor health, and quality of life are greatly influenced by education. During my pediatrics rotation and clinical, I learned you must consider family to be the vehicle by which the child may benefit from your clinical services. Therefore, you must reach beyond your setting in an effective and consistent way to engage, connect the home, and then follow up for response. My colleagues are aware of the need to document and the processes currently available for health, social service, and school professionals to report concerns. Too often, obstacles and other influences stand in the way of our ethical duty as professionals; we must find a way to overcome them, both individually and as a group.
We have processes for adolescents aging out of foster care and the developmentally delayed transitioning to sheltered work; can these be expanded?
My experience in a public school district’s alternative school for children in grades 6-12 opened my eyes to the need for the public to understand how these schools function. I likened these schools to the intensive care unit in the acute care setting. Smaller population, high needs, high cost, and dedicated staff but high burnout and turnover. Children in my school came from foster care or struggling homes and often had experienced trauma. Underfunded school districts cut nurses and social workers, cannot attract professional support staff, and choose to distribute money and efforts on the general population in neighborhood schools.
My “professional health care” mindset was embedded in an environment of wounded children, amazing educators, and support staff; powerless to do our best, we held on. But it is not enough to just hold on, sequestering at-risk children out of sight. We can do better.
Continue to: Some ideas to turn this belief into reality
Some ideas to turn this belief into reality:
- Create position statements and recommendations for our licensing and professional certifying bodies to share with their membership.
- Include mandates for communicating those recommendations during certification and relicensing.
- Employ district staff or contracted consulting medical and psychologic evaluators for review of public school students with health and behavioral diagnoses.
- Partner better with schools from the community health, pediatrician, behavioral health, and primary care settings. Kennedy Krieger Institute has partnered with schools in Baltimore—can this be replicated elsewhere?
- Every child enters school with a need for health clearance and a “Guardian Permission Contact Card.” Perhaps we can expand this to develop a process for results of routine assessments to be shared, for the safety and welfare of the child.
- Teach individuals to cope effectively with the anxiety and distress fed by constant exposure to the Internet and social media. This can—and should—be done through multiple venues: religious and social groups and the workplace.
- Inform the public with PowerPoint presentations and seminars, advertising what to look for and where to get help for concerning behaviors; again, this can be done through multiple portals. This, I believe, may also help defuse tensions between parents and schools surrounding children with health and educational differences.
- Have professional health associations deliver a cohesive message to our legislators for gun control, funding for research, and mental and public health.
Dr. Onieal, you are correct in saying that this epidemic of mass shootings is a public health issue. It is a threat as serious as HIV, cancer, lead poisoning, hypertension, and diabetes. We must find a way to stop this epidemic.
Diane Page, RN, MSN, ARNP-C
Sanford, FL
Opioid use has not declined meaningfully
Opioid use has not significantly declined over the past 10 years despite efforts to educate prescribers about the risks of opioid abuse, with over half of disabled Medicare beneficiaries using opioids each year, according to a recent retrospective cohort study published in the BMJ.
“We found very high prevalence of opioid use and opioid doses in disabled Medicare beneficiaries, most likely reflecting the high burden of illness in this population,” Molly M. Jeffery, PhD, from the Mayo Clinic, Rochester, Minn., and her associates wrote in their study.
The investigators evaluated pharmaceutical and medical claims data from 48 million individuals who were commercially insured or were Medicare Advantage recipients (both those eligible because they were older than 65 years and those under 65 years old who still were eligible because of disability). The researchers found that 52% of disabled Medicare patients, 26% of aged Medicare patients, and 14% of commercially insured patients used opioids annually within the study period.
In the commercially insured group, there was little fluctuation in patient opioid prevalence by quarter, with an average daily dose of 17 mg morphine equivalents (MME) during 2011-2016; 6% of patients used opioids quarterly at the beginning and end of the study. There was an increase of quarterly opioid prevalence in the aged Medicare group from 11% to 14% at the beginning and end of the study period. Average daily dose also increased during this period for the aged Medicare group from 18 MME in 2011 to 20 MME in 2016.
Researchers said commercial beneficiaries between 45 years and 54 years old had the highest prevalence of opioid use. The disabled Medicare group saw the greatest increase among groups in opioid prevalence and average daily dose, with a 26% prevalence in 2007 and 53 MME average daily dose, which increased to a prevalence of 39% and an average daily dose of 56 MME in 2016.
“Doctors and patients should consider whether long-term opioid use is improving the patient’s ability to function and, if not, should consider other treatments either as an addition or replacement to opioid use,” Dr. Jeffery and her colleagues wrote. “Evidence-based approaches are needed to improve both the safety of opioid use and patient outcomes including pain management and ability to function.”
The researchers noted limitations in the study, such as not including people with Medicaid, fee-for-service Medicare, or the uninsured. In addition, the data reviewed did not indicate the prevalence of chronic pain or pain duration in the patient population studied, they said.
The authors reported no relevant financial disclosures.
SOURCE: Jeffery MM et al. BMJ. 2018 Aug 1. doi: 10.1136/bmj.k2833.
FROM THE BMJ
Key clinical point: The highest prevalence was seen among disabled patients with Medicare Advantage.
Major finding: Of those studied, annual prevalence of opioid use was 14% for commercial beneficiaries, 26% for aged Medicare beneficiaries, and 52% for disabled Medicare beneficiaries.
Study details: An observational cohort study of claims data from 48 million people who had commercial insurance or Medicare Advantage between January 2007 and December 2016.
Disclosures: The authors reported no relevant financial disclosures.
Source: Jeffery MM et al. BMJ. 2018 Aug 1. doi: 10.1136/bmj.k2833.
August 2018 Question 2
Rationale
For patients who have small varices with either red wale signs or the presence of severe liver disease (Child Pugh class C), the risk of first hemorrhage is as high as for patients with large varices. Because these small varices are difficult to ligate, therapy with a nonselective beta-blocker such as nadolol is recommended. Nonselective beta-adrenergic blockers (propranolol, nadolol) reduce portal pressure by reducing portal venous inflow through both a beta-1 (reduction in cardiac output) and a beta-2 (splanchnic vasoconstriction). A decrease in HVPG greater than 20% in patients treated with nonselective beta-blockers has been associated with a lower rate of first variceal hemorrhage, ascites, and death. Clinical targets include a heart rate below 60 bpm or a 25% reduction from baseline heart rate. Metoprolol is a selective beta-blocker and is not effective in reducing portal pressure. Nitrates alone are not effective in preventing first variceal hemorrhage and are associated with increased long-term mortality in patients over the age of 50. Diltiazem is a calcium channel blocker, which has not been shown to be effective in the treatment of esophageal varices. Observation is not an appropriate option given the high risk of bleeding for these varices, which should be addressed.
References
1. Garcia-Tsao G., Sanyal A.J., Grace N.D., et al. Prevention and management of gastroesophageal varices and variceal hemorrhage in cirrhosis. Hepatology. 2007;46(3):922-38.
2. de Franchis R. Evolving consensus in portal hypertension. Report of the Baveno IV Consensus Workshop on methodology of diagnosis and therapy in portal hypertension. J Hepatol. 2005;43:167-76.
[email protected]
A 56-year-old man with hepatitis C cirrhosis presents for variceal screening. He has mild ascites and grade 1-2 encephalopathy, both controlled with pharmacologic treatment. Recent blood work reveals a total bilirubin of 2.1 mg/dL, albumin of 3.1 g/dL, and an INR of 1.8. Endoscopy reveals small varices.
Which is the next best step in management?
August 2018 Question 1
References
1. Garcia-Tsao G., Sanyal A.J., Grace N.D., et al. Prevention and management of gastroesophageal varices and variceal hemorrhage in cirrhosis. Hepatology. 2007;46(3):922-38.
2. de Franchis R. Evolving consensus in portal hypertension. Report of the Baveno IV Consensus Workshop on methodology of diagnosis and therapy in portal hypertension. J Hepatol. 2005;43:167-76.
[email protected]
A 44-year-old man with history of renal transplant, on immunosupression with prednisone and tacrolimus, presents to the emergency department with high-grade fever of 105 °C and confusion. He initially developed nausea, vomiting, and diarrhea for a few days after attending a dinner party. Later, he developed fever and headache. His symptoms progressed, with worsening neurological features, manifested as ataxia and tremors. Soon after admission to the emergency department, he developed seizures and lost consciousness, and was intubated to protect his airway. Routine labs were sent for investigation, and both CT head scan and lumbar puncture were performed. CBC revealed leukocytosis. CT scan was negative for any acute findings, and CSF fluid analysis revealed increased white blood cells, mainly lymphocytes, and low glucose.
Which of the following organisms is the most likely cause of this illness?
Quality metrics in colonoscopy
Editor's Note:
As quality metrics are becoming increasingly significant throughout all of medicine, our field is no exception. Recent evidence has demonstrated the importance of quality measures in colonoscopy; understanding, reporting, and improving these metrics has become a hot topic of discussion.
In this month’s In Focus article, brought to you by The New Gastroenterologist, Nabiha Shamsi, Ashish Malhotra, and Aasma Shaukat (University of Minnesota/Minneapolis VAMC) provide an outstanding overview of the evidence as well as recommended goals for important quality metrics in colonoscopy. Ultimately, improving colonoscopy quality amongst all gastroenterologists will increase colonoscopy value and lead to further decreases in the incidence and mortality of colorectal cancer.
Bryson W. Katona, MD, PhD
Editor in Chief, The New Gastroenterologist
Introduction
Colonoscopy is a widely used modality to evaluate colorectal cancer because it allows for both identification of early malignancies and removal of precancerous lesions. The increased use of colonoscopy in the last 20 years has been associated with a decline in the incidence and mortality from colorectal cancer.1,2 However, colonoscopy has its limitations. It is an invasive test with inherent risks. Additionally, studies have reported rates of post-colonoscopy cancers, also referred to as interval cancers, of 2%-7%, and miss-rates for adenomas by tandem colonoscopy of 2%-26%.3-5
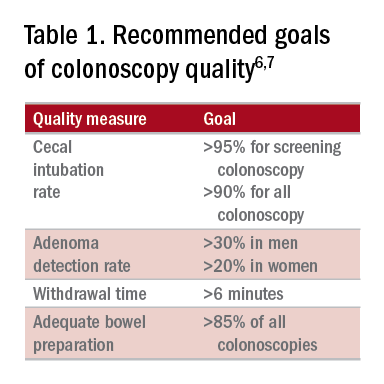
High-quality exams can maximize the value of colonoscopy, and it is important to consider the factors that contribute to high-quality colonoscopies. While there are many metrics proposed,6,7 here we discuss the most evidence-based ones, outlined in Table 1, along with their goal values.
Cecal intubation rate

A high-quality colonoscopy should include a complete examination of the colon. To achieve this, it is necessary to fully intubate the cecum, passing the colonoscope past the ileocecal valve to examine the medial wall of the cecum.8
There are several factors that may contribute to an incomplete colonoscopy, including bowel preparation, anatomy, body habitus, and endoscopist’s skill. To calculate cecal intubation rate as a quality measure, colonoscopies that are incomplete because of poor bowel preparation, severe colitis, or known obstructing lesion are usually excluded.
The U.S. Multi-Society Task Force on Colorectal Cancer recommends a cecal intubation rate of at least 95% for screening colonoscopy and 90% for all colonoscopies.6 There is an expectation of photodocumentation of the ileocecal valve and appendiceal orifice to establish completion of the colonoscopy.6
Some methods used to assist with cecal intubation include changing patient position, applying abdominal pressure, stiffening the colonoscope, and alternating between adult or pediatric colonoscopes.
Adenoma detection rate
Adenoma detection rate (ADR), is defined as the proportion of patients over the age of 50 years undergoing first-time screening colonoscopies in which at least one adenomatous polyp is detected for a given endoscopist in a given time period.

Adenomas are tracked because clearing the colon of neoplasm is the goal of screening colonoscopies; adenomas are tracked instead of more advanced lesions because the higher frequency of adenomas allows for better tracking of variation between endoscopists. Tracking ADR also utilizes the assumption that, if small lesions are identified, larger ones will be as well.
ADR is the only current quality indicator reported to be significantly associated with the risk of interval cancers. In 2010, a study of 45,000 screening colonoscopies by 186 endoscopists validated the use of ADR, finding that patients who underwent colonoscopy by physicians with ADRs below 20% had hazard ratios for development of postcolonoscopy cancer greater than 10 times higher than patients of physicians with ADRs above 20%.9 However, this study had limited power to establish that cancer protection continues to improve when ADRs rise above 20%. Another study, which evaluated the association of ADR in 224,000 patients undergoing colonoscopies by 136 gastroenterologists, showed each 1% increase in ADR is associated with 3% decrease in the risk of interval CRC and 5% decrease in the risk of fatal interval cancers.10
Most recent guidelines propose an adequate ADR for asymptomatic individuals aged 50 years or older undergoing screening colonoscopy should be greater than 30% in men and greater than 20% in women.6 It remains unknown whether there is a threshold for maximum benefit of ADR, in which a very high ADR is not associated with further protective benefit. The answer to this question may depend on why a low ADR is associated with a higher rate of interval cancers and whether every missed polyp, independent of size, is a potential interval cancer or whether hasty, inadequate, or incomplete examinations of the colon are the underlying concern.
Withdrawal time
Optimizing identification of colonic lesions requires a careful and thorough exam of the colon on withdrawal. While this may seem obvious, there is often little focus on the approach to withdrawal. In four chapters on colonoscopy technique from textbooks, the number of pages describing insertion ranged from 20 to 38, while the number of pages focused on withdrawal ranged from 0.5 to 1.5.11-14
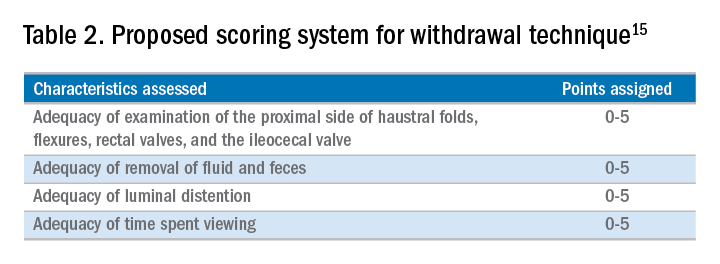
A study examining the difference in withdrawal technique between two endoscopists who were known to differ in adenoma miss rates by tandem colonoscopy proposed the scoring system listed in Table 2 that can assess quality of examination on withdrawal. There was a statistically significant difference in quality scores for the two endoscopists, as assessed by expert review of video recordings of their colonoscopies.15

The endoscopist with the lower adenoma miss rate was also found to have an average withdrawal time of 8 minutes and 55 seconds versus 6 minutes and 41 seconds for the endoscopist with the higher adenoma miss rate. A large, community-based study with over 76,000 colonoscopies found a statistically significant correlation between interval colorectal cancer and withdrawal times shorter than 6 minutes.16 However, there was no association between ADR and colorectal cancer, suggesting that, for practices with optimal ADRs (that is, rates greater than 25%), withdrawal time may be a more sensitive marker of quality of colonoscopy than ADR is.16Intuitively, adequate examination of the colon that includes examining the proximal side of folds, washing and suctioning stool, and even repositioning the patient would likely increase withdrawal time. In a 2008 study examining 2,000 screening colonoscopies of 12 endoscopists, those with withdrawal times greater than 6 minutes had significantly higher rates of detecting adenomas and advanced neoplasia, compared with those with faster withdrawal times.17 The average ADR in this group was 28.3%, compared with 11.8% for physicians who had a withdrawal time less than 6 minutes.17 An evaluation of nearly 11,000 colonoscopies done by 43 endoscopists also identified an increase polyp yield with increased withdrawal time.18 These data drive the recommendation for a minimum withdrawal time of 6 minutes, with 2 minutes spent examining each colonic segment.
Bowel preparation
Diagnosis of colonic lesions is dependent on adequate visualization of the colon. Poor bowel preparation can limit the yield of colonoscopy and lead to missed lesions. It also leads to canceled and rescheduled procedures that reduce efficiency, increase cost, and pose an undue burden on the patient.
The quality of bowel preparation should be assessed after washing and suctioning of colonic mucosa has been completed. Adequate preparation is that which allows identification of lesions greater than 5 mm in size.19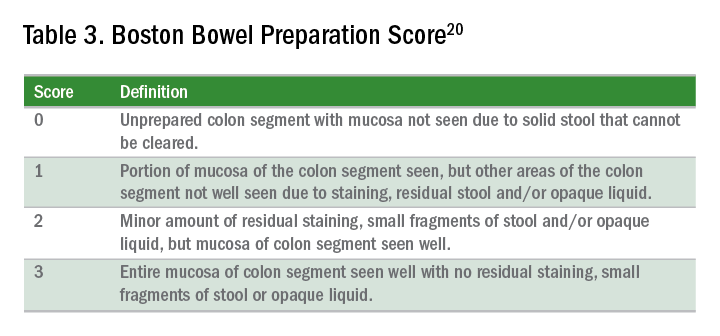
Quality of preparation is assessed subjectively by the endoscopists and often listed as excellent, good, fair, or poor. An alternative method of reporting bowel preparation quality is the Boston Bowel Preparation Score (BBPS) (Table 3).20 This scoring system allows for a more descriptive assessment of each colonic segment by assigning a score from 0 to 3 for the right, transverse, and left colon, leading to a total score between 0 and 9. The BBPS also helps standardize reporting of bowel preparation. The polyp detection rate associated with a BBPS of 5 or greater was 40%, compared with 24% associated with BBPS less than 5.19 A split-dose bowel preparation regimen with at least half of the preparation ingested on the day of the procedure is recommended to optimize quality of bowel preparation.6
The American Society for Gastrointestinal Endoscopy and American College of Gastroenterology task force on quality assurance in endoscopy recommends that bowel preparation should be adequate in 85% of all colonoscopy exams on a per-provider basis.7 One study of completed colonoscopy with inadequate preparation showed an adenoma miss rate of 48%.21 In the setting of inadequate bowel preparation, another study reported 42% of all adenomas detected were only found on repeat colonoscopy. When considering advanced adenomas, there was a 27% miss rate, a relatively high percentage.22
When poor bowel preparation precludes the exam, colonoscopy is appropriately aborted, and the patient asked to return. However, there are situations in which the exam can be completed but the bowel preparation is still inadequate to identify polyps larger than 5 mm. In this setting, the colonoscopy should be repeated with a more aggressive bowel preparation regimen within 1 year.19 Shorter intervals are recommended if advanced neoplasm is detected within an inadequate bowel preparation.19
The appropriate surveillance interval can be unclear when bowel preparation is considered adequate to identify polyps greater than or equal to 5 mm, yet still suboptimal. “Adequate” or “fair” bowel preparation often leads to shorter-than-recommended surveillance intervals because of the concern for small missed lesions. For example, patients with normal colonoscopy results and a fair prep were recommended to undergo a screening colonoscopy in 5 years at 57.4%, while only 23.1% received a 10-year recommendation.23 This increased frequency of colonoscopy leads to increased costs and procedural risks for the patient. Furthermore, a meta-analysis evaluating the effects of bowel preparation reported no significant difference in ADR between adequate and excellent prep.24 These findings suggest that patients with adequate bowel preparation may be followed at guideline-recommended surveillance intervals without significantly affecting colonoscopy quality as measured by ADR.
Endoscopist feedback and report cards
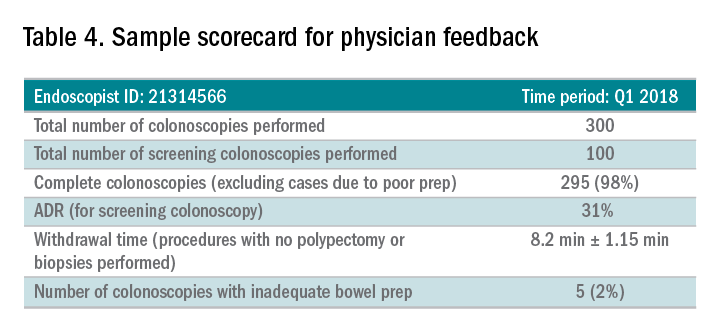
Awareness of quality metrics among individuals and endoscopy practices is crucial to ensuring adequate performance. Several studies have shown improvement with feedback and monitoring of endoscopists.25,26 Some strategies to improve colonoscopy technique and efficiency include having recorded or observed procedures, computer software that measures image resolution/velocity, and scorecards with quality measures. A representation of the scorecards used in our practice is shown in Table 4. Feedback measures both make endoscopists aware of how their performance compares with recommended goals for colonoscopy and help track their improvement. We recommend such feedback should be provided quarterly for most providers and more frequently for providers not meeting benchmarks.
Conclusion
Given we rely on colonoscopy to identify and clear the colon of potential malignancy, it is imperative that we provide high-value exams for our patients. The basis for a quality colonoscopy is complete intubation and careful inspection of the mucosa on withdrawal. Several quality measures are used as surrogates of a good exam such that endoscopists can assess themselves in relation to their peers. These metrics can help us in our goal of remaining mindful during each procedure we are completing and providing the best exam possible.
Dr. Shamsi is a third-year GI fellow. Dr. Malhotra is an assistant professor in the division of gastroenterology at the University of Minnesota, Minneapolis. Dr. Shaukat is a professor of medicine in the division of gastroenterology at the University of Minnesota, Minneapolis, and the GI Section Chief at the Minneapolis VA Medical Center.
References
1. Siegel R et al. CA Cancer J Clin. 2012 Jan-Feb;62(1):10-29.
2. Edwards BK et al. Cancer. 2010 Feb 1;116(3):544-73.
3. Hosokawa O et al. Endoscopy. 2003 Jun;35(6):506-10.
4. Morris EJ et al. Gut. 2015(Aug);64(2):1248-56.
5. Bressler B et al. Gastroenterology. 2004 Aug;127(2):452-6.
6. Rex DK et al. Am J Gastroenterol. 2017 July;12(7):1016-30.
7. Rex DK et al. Gastrointest Endosc. 2015 Jan;81(1):31-53.
8. Anderson J et al. Clin Transl Gastroenterol. 2015 Feb 26;6:e77.
9. Kaminski M et al. N Engl J Med. 2010 May 13;362(19):1795-803.
10. Corley DA et al. N Engl J Med. 2014 Apr 3;370(4):1298-306.
11. Hunt RH. Colonoscopy intubation techniques without fluoroscopy. In: Colonoscopy techniques clinical practice and color atlas. Edited by Hunt RH, Waye JD. London: Chapman and Hall; 1981. p. 109-46.
12. Waye JD. Colonoscopy intubation techniques without fluoroscopy. In: Colonoscopy techniques clinical practice and color atlas. Edited by Hunt RH, Waye JD. London: Chapman and Hall; 1981. p. 147-78.
13. Williams CB et al. In: Colonoscopy principles & techniques. Edited by Raskin J, Juergen NH. New York: Igaku-Shoin Medical Publishers; 1995. p. 121-42.
14. Baillie J. Colonoscopy. In: Gastrointestinal endoscopy basic principles and practice. Oxford (UK): Butterworth-Heinemann; 1992. p. 63-92.
15. Rex DK. Gastrointest Endosc. 2000 Jan;51(1):33-6.
16. Shaukat A et al. Gastroenterol. 2015;149(4):952-7.
17. Barclay R et al. N Engl J Med. 2006 Dec 14;355(24):2533-41.
18. Simmons DT et al. Gastrointest Endosc. 2007;65(5):AB94.
19. Johnson DA et al. Gastrointest Endosc. 2014;80(4):543-62.
20. Calderwood A et al. Gastrointest Endosc. 2010 Oct;72(4):686-92.
21. Chokshi R et al. Gastrointest Endosc. 2012 Jun;75(6):1197-203.
22. Lebwohl B et al. Gastrointest Endosc. 2011 Jun;73(6):1207-14.
23. Menees SB et al. Gastrointest Endosc. 2013 Sep;78(3): 510-6.
24. Clark B et al. Am J Gastroenterol. 2014 Nov;109(11):1714-23.
25. Nielson A et al. BMJ Open Gastro. 2017 Jun. doi: 10.1136/bmjgast-2017-000142.
26. Gurudu S et al. J Gastroenterol Hepatol. 2018 Mar;33(3):645-9.
Editor's Note:
As quality metrics are becoming increasingly significant throughout all of medicine, our field is no exception. Recent evidence has demonstrated the importance of quality measures in colonoscopy; understanding, reporting, and improving these metrics has become a hot topic of discussion.
In this month’s In Focus article, brought to you by The New Gastroenterologist, Nabiha Shamsi, Ashish Malhotra, and Aasma Shaukat (University of Minnesota/Minneapolis VAMC) provide an outstanding overview of the evidence as well as recommended goals for important quality metrics in colonoscopy. Ultimately, improving colonoscopy quality amongst all gastroenterologists will increase colonoscopy value and lead to further decreases in the incidence and mortality of colorectal cancer.
Bryson W. Katona, MD, PhD
Editor in Chief, The New Gastroenterologist
Introduction
Colonoscopy is a widely used modality to evaluate colorectal cancer because it allows for both identification of early malignancies and removal of precancerous lesions. The increased use of colonoscopy in the last 20 years has been associated with a decline in the incidence and mortality from colorectal cancer.1,2 However, colonoscopy has its limitations. It is an invasive test with inherent risks. Additionally, studies have reported rates of post-colonoscopy cancers, also referred to as interval cancers, of 2%-7%, and miss-rates for adenomas by tandem colonoscopy of 2%-26%.3-5
High-quality exams can maximize the value of colonoscopy, and it is important to consider the factors that contribute to high-quality colonoscopies. While there are many metrics proposed,6,7 here we discuss the most evidence-based ones, outlined in Table 1, along with their goal values.
Cecal intubation rate
A high-quality colonoscopy should include a complete examination of the colon. To achieve this, it is necessary to fully intubate the cecum, passing the colonoscope past the ileocecal valve to examine the medial wall of the cecum.8
There are several factors that may contribute to an incomplete colonoscopy, including bowel preparation, anatomy, body habitus, and endoscopist’s skill. To calculate cecal intubation rate as a quality measure, colonoscopies that are incomplete because of poor bowel preparation, severe colitis, or known obstructing lesion are usually excluded.
The U.S. Multi-Society Task Force on Colorectal Cancer recommends a cecal intubation rate of at least 95% for screening colonoscopy and 90% for all colonoscopies.6 There is an expectation of photodocumentation of the ileocecal valve and appendiceal orifice to establish completion of the colonoscopy.6
Some methods used to assist with cecal intubation include changing patient position, applying abdominal pressure, stiffening the colonoscope, and alternating between adult or pediatric colonoscopes.
Adenoma detection rate
Adenoma detection rate (ADR), is defined as the proportion of patients over the age of 50 years undergoing first-time screening colonoscopies in which at least one adenomatous polyp is detected for a given endoscopist in a given time period.
Adenomas are tracked because clearing the colon of neoplasm is the goal of screening colonoscopies; adenomas are tracked instead of more advanced lesions because the higher frequency of adenomas allows for better tracking of variation between endoscopists. Tracking ADR also utilizes the assumption that, if small lesions are identified, larger ones will be as well.
ADR is the only current quality indicator reported to be significantly associated with the risk of interval cancers. In 2010, a study of 45,000 screening colonoscopies by 186 endoscopists validated the use of ADR, finding that patients who underwent colonoscopy by physicians with ADRs below 20% had hazard ratios for development of postcolonoscopy cancer greater than 10 times higher than patients of physicians with ADRs above 20%.9 However, this study had limited power to establish that cancer protection continues to improve when ADRs rise above 20%. Another study, which evaluated the association of ADR in 224,000 patients undergoing colonoscopies by 136 gastroenterologists, showed each 1% increase in ADR is associated with 3% decrease in the risk of interval CRC and 5% decrease in the risk of fatal interval cancers.10
Most recent guidelines propose an adequate ADR for asymptomatic individuals aged 50 years or older undergoing screening colonoscopy should be greater than 30% in men and greater than 20% in women.6 It remains unknown whether there is a threshold for maximum benefit of ADR, in which a very high ADR is not associated with further protective benefit. The answer to this question may depend on why a low ADR is associated with a higher rate of interval cancers and whether every missed polyp, independent of size, is a potential interval cancer or whether hasty, inadequate, or incomplete examinations of the colon are the underlying concern.
Withdrawal time
Optimizing identification of colonic lesions requires a careful and thorough exam of the colon on withdrawal. While this may seem obvious, there is often little focus on the approach to withdrawal. In four chapters on colonoscopy technique from textbooks, the number of pages describing insertion ranged from 20 to 38, while the number of pages focused on withdrawal ranged from 0.5 to 1.5.11-14
A study examining the difference in withdrawal technique between two endoscopists who were known to differ in adenoma miss rates by tandem colonoscopy proposed the scoring system listed in Table 2 that can assess quality of examination on withdrawal. There was a statistically significant difference in quality scores for the two endoscopists, as assessed by expert review of video recordings of their colonoscopies.15
The endoscopist with the lower adenoma miss rate was also found to have an average withdrawal time of 8 minutes and 55 seconds versus 6 minutes and 41 seconds for the endoscopist with the higher adenoma miss rate. A large, community-based study with over 76,000 colonoscopies found a statistically significant correlation between interval colorectal cancer and withdrawal times shorter than 6 minutes.16 However, there was no association between ADR and colorectal cancer, suggesting that, for practices with optimal ADRs (that is, rates greater than 25%), withdrawal time may be a more sensitive marker of quality of colonoscopy than ADR is.16Intuitively, adequate examination of the colon that includes examining the proximal side of folds, washing and suctioning stool, and even repositioning the patient would likely increase withdrawal time. In a 2008 study examining 2,000 screening colonoscopies of 12 endoscopists, those with withdrawal times greater than 6 minutes had significantly higher rates of detecting adenomas and advanced neoplasia, compared with those with faster withdrawal times.17 The average ADR in this group was 28.3%, compared with 11.8% for physicians who had a withdrawal time less than 6 minutes.17 An evaluation of nearly 11,000 colonoscopies done by 43 endoscopists also identified an increase polyp yield with increased withdrawal time.18 These data drive the recommendation for a minimum withdrawal time of 6 minutes, with 2 minutes spent examining each colonic segment.
Bowel preparation
Diagnosis of colonic lesions is dependent on adequate visualization of the colon. Poor bowel preparation can limit the yield of colonoscopy and lead to missed lesions. It also leads to canceled and rescheduled procedures that reduce efficiency, increase cost, and pose an undue burden on the patient.
The quality of bowel preparation should be assessed after washing and suctioning of colonic mucosa has been completed. Adequate preparation is that which allows identification of lesions greater than 5 mm in size.19
Quality of preparation is assessed subjectively by the endoscopists and often listed as excellent, good, fair, or poor. An alternative method of reporting bowel preparation quality is the Boston Bowel Preparation Score (BBPS) (Table 3).20 This scoring system allows for a more descriptive assessment of each colonic segment by assigning a score from 0 to 3 for the right, transverse, and left colon, leading to a total score between 0 and 9. The BBPS also helps standardize reporting of bowel preparation. The polyp detection rate associated with a BBPS of 5 or greater was 40%, compared with 24% associated with BBPS less than 5.19 A split-dose bowel preparation regimen with at least half of the preparation ingested on the day of the procedure is recommended to optimize quality of bowel preparation.6
The American Society for Gastrointestinal Endoscopy and American College of Gastroenterology task force on quality assurance in endoscopy recommends that bowel preparation should be adequate in 85% of all colonoscopy exams on a per-provider basis.7 One study of completed colonoscopy with inadequate preparation showed an adenoma miss rate of 48%.21 In the setting of inadequate bowel preparation, another study reported 42% of all adenomas detected were only found on repeat colonoscopy. When considering advanced adenomas, there was a 27% miss rate, a relatively high percentage.22
When poor bowel preparation precludes the exam, colonoscopy is appropriately aborted, and the patient asked to return. However, there are situations in which the exam can be completed but the bowel preparation is still inadequate to identify polyps larger than 5 mm. In this setting, the colonoscopy should be repeated with a more aggressive bowel preparation regimen within 1 year.19 Shorter intervals are recommended if advanced neoplasm is detected within an inadequate bowel preparation.19
The appropriate surveillance interval can be unclear when bowel preparation is considered adequate to identify polyps greater than or equal to 5 mm, yet still suboptimal. “Adequate” or “fair” bowel preparation often leads to shorter-than-recommended surveillance intervals because of the concern for small missed lesions. For example, patients with normal colonoscopy results and a fair prep were recommended to undergo a screening colonoscopy in 5 years at 57.4%, while only 23.1% received a 10-year recommendation.23 This increased frequency of colonoscopy leads to increased costs and procedural risks for the patient. Furthermore, a meta-analysis evaluating the effects of bowel preparation reported no significant difference in ADR between adequate and excellent prep.24 These findings suggest that patients with adequate bowel preparation may be followed at guideline-recommended surveillance intervals without significantly affecting colonoscopy quality as measured by ADR.
Endoscopist feedback and report cards
Awareness of quality metrics among individuals and endoscopy practices is crucial to ensuring adequate performance. Several studies have shown improvement with feedback and monitoring of endoscopists.25,26 Some strategies to improve colonoscopy technique and efficiency include having recorded or observed procedures, computer software that measures image resolution/velocity, and scorecards with quality measures. A representation of the scorecards used in our practice is shown in Table 4. Feedback measures both make endoscopists aware of how their performance compares with recommended goals for colonoscopy and help track their improvement. We recommend such feedback should be provided quarterly for most providers and more frequently for providers not meeting benchmarks.
Conclusion
Given we rely on colonoscopy to identify and clear the colon of potential malignancy, it is imperative that we provide high-value exams for our patients. The basis for a quality colonoscopy is complete intubation and careful inspection of the mucosa on withdrawal. Several quality measures are used as surrogates of a good exam such that endoscopists can assess themselves in relation to their peers. These metrics can help us in our goal of remaining mindful during each procedure we are completing and providing the best exam possible.
Dr. Shamsi is a third-year GI fellow. Dr. Malhotra is an assistant professor in the division of gastroenterology at the University of Minnesota, Minneapolis. Dr. Shaukat is a professor of medicine in the division of gastroenterology at the University of Minnesota, Minneapolis, and the GI Section Chief at the Minneapolis VA Medical Center.
References
1. Siegel R et al. CA Cancer J Clin. 2012 Jan-Feb;62(1):10-29.
2. Edwards BK et al. Cancer. 2010 Feb 1;116(3):544-73.
3. Hosokawa O et al. Endoscopy. 2003 Jun;35(6):506-10.
4. Morris EJ et al. Gut. 2015(Aug);64(2):1248-56.
5. Bressler B et al. Gastroenterology. 2004 Aug;127(2):452-6.
6. Rex DK et al. Am J Gastroenterol. 2017 July;12(7):1016-30.
7. Rex DK et al. Gastrointest Endosc. 2015 Jan;81(1):31-53.
8. Anderson J et al. Clin Transl Gastroenterol. 2015 Feb 26;6:e77.
9. Kaminski M et al. N Engl J Med. 2010 May 13;362(19):1795-803.
10. Corley DA et al. N Engl J Med. 2014 Apr 3;370(4):1298-306.
11. Hunt RH. Colonoscopy intubation techniques without fluoroscopy. In: Colonoscopy techniques clinical practice and color atlas. Edited by Hunt RH, Waye JD. London: Chapman and Hall; 1981. p. 109-46.
12. Waye JD. Colonoscopy intubation techniques without fluoroscopy. In: Colonoscopy techniques clinical practice and color atlas. Edited by Hunt RH, Waye JD. London: Chapman and Hall; 1981. p. 147-78.
13. Williams CB et al. In: Colonoscopy principles & techniques. Edited by Raskin J, Juergen NH. New York: Igaku-Shoin Medical Publishers; 1995. p. 121-42.
14. Baillie J. Colonoscopy. In: Gastrointestinal endoscopy basic principles and practice. Oxford (UK): Butterworth-Heinemann; 1992. p. 63-92.
15. Rex DK. Gastrointest Endosc. 2000 Jan;51(1):33-6.
16. Shaukat A et al. Gastroenterol. 2015;149(4):952-7.
17. Barclay R et al. N Engl J Med. 2006 Dec 14;355(24):2533-41.
18. Simmons DT et al. Gastrointest Endosc. 2007;65(5):AB94.
19. Johnson DA et al. Gastrointest Endosc. 2014;80(4):543-62.
20. Calderwood A et al. Gastrointest Endosc. 2010 Oct;72(4):686-92.
21. Chokshi R et al. Gastrointest Endosc. 2012 Jun;75(6):1197-203.
22. Lebwohl B et al. Gastrointest Endosc. 2011 Jun;73(6):1207-14.
23. Menees SB et al. Gastrointest Endosc. 2013 Sep;78(3): 510-6.
24. Clark B et al. Am J Gastroenterol. 2014 Nov;109(11):1714-23.
25. Nielson A et al. BMJ Open Gastro. 2017 Jun. doi: 10.1136/bmjgast-2017-000142.
26. Gurudu S et al. J Gastroenterol Hepatol. 2018 Mar;33(3):645-9.
To tame prescription prices, HHS dips a toe into drug importation stream
It came as something of a surprise when Health & Human Services Secretary Alex Azar announced that the administration was exploring the importation of prescription drugs to fight high domestic prices. Sec. Azar and Scott Gottlieb, MD, commissioner of the Food and Drug Administration, who also endorsed the new proposal, had previously opposed the idea.

But drug prices in the United States have continued to rise and more than 80% of Americans say the government should take action. President Donald Trump has said drugmakers are “getting away with murder” and has angrily tweeted at companies about individual price hikes.
Although candidate Trump supported the idea of allowing patients to import medicines, since he was elected, he has not mentioned that option – which is strongly opposed by drug companies.
Now, determined to explore more avenues to curb price hikes, the administration is signaling that it is willing to consider what the industry regards as something of a nuclear option to address a recalcitrant problem. Carefully tailored to focus solely on specific situations in which a high-priced drug is made by only one company, it is finding support where broader proposals have failed.
“They’re approaching it incrementally and wisely, they’re focusing on prices where there’s a need,” said Dan Mendelson, the founder of health care consultant company Avalere and an official in the Clinton White House. “It is certainly more narrow than the way others have conceptualized it.”
Far from a blanket legalization of imported medicines, the working group Sec. Azar convened will study importation to combat sudden price increases in specific drugs. The focus is on temporarily bringing in cheaper similar or identical drugs to introduce competition into the U.S. market. The medicines must be off patent and have only one manufacturer here.
The secretary’s memo said the effort is designed to avoid the kind of overnight increases seen with Daraprim in 2015. That price hike was engineered by “pharma bro” Martin Shkreli, then CEO of Turing Pharmaceuticals. He purchased the rights to the single-sourced medication that treats parasitic infections and began charging $750 for a pill that formerly cost $13.50 and costs a little more than a dollar in much of the world. Turing was the only U.S. producer.
“This is a workable solution to a discrete problem,” said Ameet Sarpatwari, PhD, JD, an instructor in medicine at Harvard Medical School in Boston.
But those who support more sweeping importation policies decried the plan’s limited scope and suspected the announcement was part theatrics and part a threatening signal to drugmakers.
“This could just be a dog-and-pony show, where they’re calling in an expert group to explore avenues of importation – but when all is said and done, they find that they don’t want to do this,” said Gabriel Levitt, the cofounder of PharmacyChecker.com, a private company that verifies international online pharmacies and compares prescription drug prices for consumers.
“At that point, we’ll learn that the exercise was lip service,” he added. “Frankly, there’s a good chance that that is the case.”
This isn’t the first time officials have suggested importing drugs from other countries to find better prices. Bills have been offered in Congress to allow it, and George W. Bush administration officials investigated the issue and produced two reports questioning the safety of such efforts in 2004.
Overall, the measure is by no means a silver bullet to the larger problem of rising drug prices, said Rachel Sachs, JD, an associate professor of law at Washington University School of Law in St. Louis.
“It’s a really smart move to solve one of the many drug pricing problems we observe, but, of course, it won’t address every problem,” Sachs said.
Mr. Mendelson suggested this working group might be an effort to placate patients who have seen little movement to bring down drug costs, despite the president’s repeated promises to provide help.
“If the goal is to make policy changes that are visible and help with the 2018 and 2020 election, I think it’s right up there with a lot of the things they’re doing,” Mendelson said. “If the goal is truly to help consumers with drug prices, not so much.”
In addition, since the group’s work applies primarily to the generic drug market, a new policy would stop short of taming the price spirals and high launch prices of blockbuster brand-name drugs, which Harvard’s Sarpatwari said were the “elephants in the room” of the drug pricing debate.
Mr. Levitt pointed out that, while a big overnight increase on a drug might trigger action to allow importation, the move would do nothing to stop the yearly increases that drug companies tack on to medicines. Depending on how possible regulations are written, such increases might even be encouraged. The administration has been pressuring pharmaceutical makers to hold down those rising prices but finding tepid support among the companies.
Even if the policy targets just a slice of the overall problem, it could still make a difference for Americans struggling to pay for off-patent drugs and provide more competition.
“If Azar is serious about this proposal, even though it’s very limited in scope, it could help deter the most egregious forms of drug price gouging where there are single-source meds,” Mr. Levitt said.
KHN’s coverage of prescription drug development, costs and pricing is supported in part by the Laura and John Arnold Foundation. Kaiser Health News is a nonprofit national health policy news service. It is an editorially independent program of the Henry J. Kaiser Family Foundation that is not affiliated with Kaiser Permanente.
It came as something of a surprise when Health & Human Services Secretary Alex Azar announced that the administration was exploring the importation of prescription drugs to fight high domestic prices. Sec. Azar and Scott Gottlieb, MD, commissioner of the Food and Drug Administration, who also endorsed the new proposal, had previously opposed the idea.
But drug prices in the United States have continued to rise and more than 80% of Americans say the government should take action. President Donald Trump has said drugmakers are “getting away with murder” and has angrily tweeted at companies about individual price hikes.
Although candidate Trump supported the idea of allowing patients to import medicines, since he was elected, he has not mentioned that option – which is strongly opposed by drug companies.
Now, determined to explore more avenues to curb price hikes, the administration is signaling that it is willing to consider what the industry regards as something of a nuclear option to address a recalcitrant problem. Carefully tailored to focus solely on specific situations in which a high-priced drug is made by only one company, it is finding support where broader proposals have failed.
“They’re approaching it incrementally and wisely, they’re focusing on prices where there’s a need,” said Dan Mendelson, the founder of health care consultant company Avalere and an official in the Clinton White House. “It is certainly more narrow than the way others have conceptualized it.”
Far from a blanket legalization of imported medicines, the working group Sec. Azar convened will study importation to combat sudden price increases in specific drugs. The focus is on temporarily bringing in cheaper similar or identical drugs to introduce competition into the U.S. market. The medicines must be off patent and have only one manufacturer here.
The secretary’s memo said the effort is designed to avoid the kind of overnight increases seen with Daraprim in 2015. That price hike was engineered by “pharma bro” Martin Shkreli, then CEO of Turing Pharmaceuticals. He purchased the rights to the single-sourced medication that treats parasitic infections and began charging $750 for a pill that formerly cost $13.50 and costs a little more than a dollar in much of the world. Turing was the only U.S. producer.
“This is a workable solution to a discrete problem,” said Ameet Sarpatwari, PhD, JD, an instructor in medicine at Harvard Medical School in Boston.
But those who support more sweeping importation policies decried the plan’s limited scope and suspected the announcement was part theatrics and part a threatening signal to drugmakers.
“This could just be a dog-and-pony show, where they’re calling in an expert group to explore avenues of importation – but when all is said and done, they find that they don’t want to do this,” said Gabriel Levitt, the cofounder of PharmacyChecker.com, a private company that verifies international online pharmacies and compares prescription drug prices for consumers.
“At that point, we’ll learn that the exercise was lip service,” he added. “Frankly, there’s a good chance that that is the case.”
This isn’t the first time officials have suggested importing drugs from other countries to find better prices. Bills have been offered in Congress to allow it, and George W. Bush administration officials investigated the issue and produced two reports questioning the safety of such efforts in 2004.
Overall, the measure is by no means a silver bullet to the larger problem of rising drug prices, said Rachel Sachs, JD, an associate professor of law at Washington University School of Law in St. Louis.
“It’s a really smart move to solve one of the many drug pricing problems we observe, but, of course, it won’t address every problem,” Sachs said.
Mr. Mendelson suggested this working group might be an effort to placate patients who have seen little movement to bring down drug costs, despite the president’s repeated promises to provide help.
“If the goal is to make policy changes that are visible and help with the 2018 and 2020 election, I think it’s right up there with a lot of the things they’re doing,” Mendelson said. “If the goal is truly to help consumers with drug prices, not so much.”
In addition, since the group’s work applies primarily to the generic drug market, a new policy would stop short of taming the price spirals and high launch prices of blockbuster brand-name drugs, which Harvard’s Sarpatwari said were the “elephants in the room” of the drug pricing debate.
Mr. Levitt pointed out that, while a big overnight increase on a drug might trigger action to allow importation, the move would do nothing to stop the yearly increases that drug companies tack on to medicines. Depending on how possible regulations are written, such increases might even be encouraged. The administration has been pressuring pharmaceutical makers to hold down those rising prices but finding tepid support among the companies.
Even if the policy targets just a slice of the overall problem, it could still make a difference for Americans struggling to pay for off-patent drugs and provide more competition.
“If Azar is serious about this proposal, even though it’s very limited in scope, it could help deter the most egregious forms of drug price gouging where there are single-source meds,” Mr. Levitt said.
KHN’s coverage of prescription drug development, costs and pricing is supported in part by the Laura and John Arnold Foundation. Kaiser Health News is a nonprofit national health policy news service. It is an editorially independent program of the Henry J. Kaiser Family Foundation that is not affiliated with Kaiser Permanente.
Screening for osteoporosis to prevent fractures: USPSTF recommendation statement
The U.S. Preventive Services Task Force commissioned a systematic evidence review of 168 fair-good quality articles to examine newer evidence on screening for and treatment of osteoporotic fracture in women and men and update its 2011 guideline. For postmenopausal women older than 65 years and those younger than 65 years with increased risk of osteoporosis, USPSTF found convincing evidence that screening can detect osteoporosis and that treatment can provide at least a moderate benefit in preventing fractures (grade B). For men, they report inadequate evidence on the benefits and harms of screening for osteoporosis to reduce the risk of fractures (I statement).

Importance
Osteoporosis leads to increased bone fragility and risk of fractures, specifically hip fractures, that are associated with limitations in ambulation, chronic pain, disability and loss of independence, and decreased quality of life: 21%-30% of those who suffer hip fractures die within 1 year. Osteoporosis is usually asymptomatic until a fracture occurs, thus preventing fractures is the main goal of an osteoporosis screening strategy. With the increasing life expectancy of the U.S. population, the potential preventable burden is likely to increase in future years.
Screening tests
The most commonly used test is central dual energy x-ray absorptiometry (DXA), which provides measurement of bone mineral density (BMD) of the hip and lumbar spine. Most treatment guidelines already use central DXA BMD to define osteoporosis and the threshold at which to start drug therapies for prevention. Other lower-cost and more accessible alternatives include peripheral DXA, which measures BMD at lower forearm and heel, and quantitative ultrasound (QUS), which also evaluates peripheral sites like the calcaneus. QUS does not measure BMD. USPSTF found that the harms associated with screening were small (mainly radiation exposure from DXA and opportunity costs).
Population and risk assessment
The review included adults older than 40 years of age, mostly postmenopausal women, without a history of previous low-trauma fractures, without conditions or medications that may cause secondary osteoporosis, and without increased risk of falls.
Patients at increased risk of osteoporotic fractures include those with parental history of hip fractures, low body weight, excessive alcohol consumption, and smokers. For postmenopausal women younger than 65 years of age with at least one risk factor, a reasonable approach to determine who should be screened with BMD is to use one of the various clinical risk assessment tools available. The most frequently studied tools in women are the Osteoporosis Risk Assessment Instrument (ORAI), Osteoporosis Index of Risk (OSIRIS), Osteoporosis Self-Assessment Tool (OST), and Simple Calculated Osteoporosis Risk Estimation (SCORE). The Fracture Risk Assessment (FRAX) tool calculates the 10-year risk of a major osteoporotic fracture (MOF) using clinical risk factors. For example, one approach is to perform BMD in women younger than 65 years with a FRAX risk greater than 8.4% (the FRAX risk of a 65-year-old woman of mean height and weight without major risk factors).
In men, the prevalence of osteoporosis (4.3%) is generally lower than in women (15.4%). In the absence of other risk factors, it is not till age 80 that the prevalence of osteoporosis in white men starts to reach that of a 65-year-old white woman. While men have similar risk factors as women described above, men with hypogonadism, history of cerebrovascular accident, and history of diabetes are also at increased risk of fracture.
Preventative measures to reduce osteoporotic fractures
Approved drug therapies. The majority of studies were conducted in postmenopausal women. Bisphosphonates, most commonly used and studied, significantly reduced vertebral and nonvertebral fractures but not hip fractures (possibly because of underpowered studies). Raloxifene and parathyroid hormone reduced vertebral fractures but not nonvertebral fractures. Denosumab significantly reduced all three types of fractures. A 2011 review identified that estrogen reduced vertebral fractures, but no new studies were identified for the current review. Data from the Women’s Health Initiative show that women receiving estrogen with or without progesterone had an elevated risk of stroke, venous thromboembolism, and gallbladder disease; their risk for urinary incontinence was increased during the first year of follow-up. In addition, women receiving estrogen plus progestin had a higher risk of invasive breast cancer, coronary heart disease, and probable dementia. The risk of serious adverse events, upper-gastrointestinal events, or cardiovascular events associated with the most common class of medications used, bisphosphonates, is small. Evidence on the effectiveness of medications to treat osteoporosis in men is lacking (only two studies conducted).
Exercise. Engagement in 120-300 minutes of weekly moderate-intensity aerobic activity can reduce the risk of hip fractures, and performance of weekly balance and muscle-strengthening activities can help prevent falls in older adults.
Supplements. In a separate recommendation, USPSTF recommends against daily supplementation with less than 400 IU of vitamin D and less than 1,000 mg of calcium for the primary prevention of fractures in community-dwelling, postmenopausal women. They found insufficient evidence on supplementation with higher doses of vitamin D and calcium in postmenopausal women, or at any dose in men and premenopausal women.
Recommendations from others
The National Osteoporosis Foundation and the International Society for Clinical Densitometry recommend BMD testing in all women older than 65 years, all men over 70 years, postmenopausal women younger than 65 years, and men aged 50-69 years with increased risk factors. The American Academy of Family Physicians recommends against DXA screening in women younger than 65 years and men younger than 70 years with no risk factors.
The bottom line
For all women older than 65 years and postmenopausal women younger than 65 years who are at increased risk, screen for and treat osteoporosis to prevent fractures. For men, there is insufficient evidence to screen.
Dr. Shrestha is a second-year resident in the Family Medicine Residency Program at Abington (Pa.) - Jefferson Health. Dr. Skolnik is a professor of family and community medicine at Jefferson Medical College, Philadelphia, and an associate director of the family medicine residency program at Abington - Jefferson Health.
References
1. U.S. Preventative Services Task Force. JAMA. 2018 Jun 26;319(24):2521-31.
2. U.S. Preventative Services Task Force. JAMA. 2018 Jun 26;319(24):2532-51.
The U.S. Preventive Services Task Force commissioned a systematic evidence review of 168 fair-good quality articles to examine newer evidence on screening for and treatment of osteoporotic fracture in women and men and update its 2011 guideline. For postmenopausal women older than 65 years and those younger than 65 years with increased risk of osteoporosis, USPSTF found convincing evidence that screening can detect osteoporosis and that treatment can provide at least a moderate benefit in preventing fractures (grade B). For men, they report inadequate evidence on the benefits and harms of screening for osteoporosis to reduce the risk of fractures (I statement).
Importance
Osteoporosis leads to increased bone fragility and risk of fractures, specifically hip fractures, that are associated with limitations in ambulation, chronic pain, disability and loss of independence, and decreased quality of life: 21%-30% of those who suffer hip fractures die within 1 year. Osteoporosis is usually asymptomatic until a fracture occurs, thus preventing fractures is the main goal of an osteoporosis screening strategy. With the increasing life expectancy of the U.S. population, the potential preventable burden is likely to increase in future years.
Screening tests
The most commonly used test is central dual energy x-ray absorptiometry (DXA), which provides measurement of bone mineral density (BMD) of the hip and lumbar spine. Most treatment guidelines already use central DXA BMD to define osteoporosis and the threshold at which to start drug therapies for prevention. Other lower-cost and more accessible alternatives include peripheral DXA, which measures BMD at lower forearm and heel, and quantitative ultrasound (QUS), which also evaluates peripheral sites like the calcaneus. QUS does not measure BMD. USPSTF found that the harms associated with screening were small (mainly radiation exposure from DXA and opportunity costs).
Population and risk assessment
The review included adults older than 40 years of age, mostly postmenopausal women, without a history of previous low-trauma fractures, without conditions or medications that may cause secondary osteoporosis, and without increased risk of falls.
Patients at increased risk of osteoporotic fractures include those with parental history of hip fractures, low body weight, excessive alcohol consumption, and smokers. For postmenopausal women younger than 65 years of age with at least one risk factor, a reasonable approach to determine who should be screened with BMD is to use one of the various clinical risk assessment tools available. The most frequently studied tools in women are the Osteoporosis Risk Assessment Instrument (ORAI), Osteoporosis Index of Risk (OSIRIS), Osteoporosis Self-Assessment Tool (OST), and Simple Calculated Osteoporosis Risk Estimation (SCORE). The Fracture Risk Assessment (FRAX) tool calculates the 10-year risk of a major osteoporotic fracture (MOF) using clinical risk factors. For example, one approach is to perform BMD in women younger than 65 years with a FRAX risk greater than 8.4% (the FRAX risk of a 65-year-old woman of mean height and weight without major risk factors).
In men, the prevalence of osteoporosis (4.3%) is generally lower than in women (15.4%). In the absence of other risk factors, it is not till age 80 that the prevalence of osteoporosis in white men starts to reach that of a 65-year-old white woman. While men have similar risk factors as women described above, men with hypogonadism, history of cerebrovascular accident, and history of diabetes are also at increased risk of fracture.
Preventative measures to reduce osteoporotic fractures
Approved drug therapies. The majority of studies were conducted in postmenopausal women. Bisphosphonates, most commonly used and studied, significantly reduced vertebral and nonvertebral fractures but not hip fractures (possibly because of underpowered studies). Raloxifene and parathyroid hormone reduced vertebral fractures but not nonvertebral fractures. Denosumab significantly reduced all three types of fractures. A 2011 review identified that estrogen reduced vertebral fractures, but no new studies were identified for the current review. Data from the Women’s Health Initiative show that women receiving estrogen with or without progesterone had an elevated risk of stroke, venous thromboembolism, and gallbladder disease; their risk for urinary incontinence was increased during the first year of follow-up. In addition, women receiving estrogen plus progestin had a higher risk of invasive breast cancer, coronary heart disease, and probable dementia. The risk of serious adverse events, upper-gastrointestinal events, or cardiovascular events associated with the most common class of medications used, bisphosphonates, is small. Evidence on the effectiveness of medications to treat osteoporosis in men is lacking (only two studies conducted).
Exercise. Engagement in 120-300 minutes of weekly moderate-intensity aerobic activity can reduce the risk of hip fractures, and performance of weekly balance and muscle-strengthening activities can help prevent falls in older adults.
Supplements. In a separate recommendation, USPSTF recommends against daily supplementation with less than 400 IU of vitamin D and less than 1,000 mg of calcium for the primary prevention of fractures in community-dwelling, postmenopausal women. They found insufficient evidence on supplementation with higher doses of vitamin D and calcium in postmenopausal women, or at any dose in men and premenopausal women.
Recommendations from others
The National Osteoporosis Foundation and the International Society for Clinical Densitometry recommend BMD testing in all women older than 65 years, all men over 70 years, postmenopausal women younger than 65 years, and men aged 50-69 years with increased risk factors. The American Academy of Family Physicians recommends against DXA screening in women younger than 65 years and men younger than 70 years with no risk factors.
The bottom line
For all women older than 65 years and postmenopausal women younger than 65 years who are at increased risk, screen for and treat osteoporosis to prevent fractures. For men, there is insufficient evidence to screen.
Dr. Shrestha is a second-year resident in the Family Medicine Residency Program at Abington (Pa.) - Jefferson Health. Dr. Skolnik is a professor of family and community medicine at Jefferson Medical College, Philadelphia, and an associate director of the family medicine residency program at Abington - Jefferson Health.
References
1. U.S. Preventative Services Task Force. JAMA. 2018 Jun 26;319(24):2521-31.
2. U.S. Preventative Services Task Force. JAMA. 2018 Jun 26;319(24):2532-51.
Fitbit Flex is feasible, provides nuanced step count data in MS patients
LOS ANGELES – The commercially available Fitbit Flex accelerometer proved useful and feasible for longitudinal measurement of average daily steps in a prospective, 1-year study of patients with multiple sclerosis.

The wrist-worn device was well received, with 79 of 96 participants (82%) completing follow-up, and it revealed changes in daily functioning that were not captured using more traditional disability metrics, Valerie J. Block, DPTSc, reported at the annual meeting of the American Academy of Neurology.
The study involved 61 adults with relapsing multiple sclerosis (MS) and 35 with progressive MS who were recruited into the University of California, San Francisco (UCSF) FITriMS cohort. All were able to walk at least 2 minutes at baseline, and their daily physical activity was recorded continuously by the device over 1 year. Performance-based measures, including the Expanded Disability Status Scale (EDSS) and timed 25-foot walk test, were evaluated at baseline and at 1 year, and patient-reported outcomes such as the 12-item MS walking scale were completed at baseline and at 1.5, 3, 6, 9, and 12 months. Nine patients withdrew, and eight were lost to follow-up.
“This was a fairly stable, actively treated cohort, and overall, there was no significant change in average daily steps (STEPS) over 1 year. However, there was a trend toward a decrease (–315 steps/day; P = .117), and 53% of patients had a decrease of more than 800 steps per day, which is a proposed minimal clinically important difference threshold,” Dr. Block, a postdoctoral scholar at UCSF, said in an interview.
Despite the modest, gradual reduction in STEPS over the year, most participants were able to complete the study, providing at least 1 valid week of STEPS data per month throughout the year, she said, noting that there was no difference in device use between relapsing MS and progressive MS participants.
A significant association between decreasing STEPS and worsening of clinic-based and patient-reported outcomes was demonstrated, but declining STEPS occurred even when disability levels, as measured by the EDSS, remained stable.
“Participants who started off the study with lower STEPS, below the cohort median of 4,766 STEPS, had fourfold higher odds of clinically-meaningful disability worsening at 1 year after adjusting for age, sex, and disease duration,” she said.
Further, earlier data published by Dr. Block and her colleagues showed there is wide variability in the change in steps over 1 year. In that study, the change in step count in patients whose EDSS score remained unchanged ranged from +814 to –3,718, suggesting that popular mainstream wearable technology is not only feasible but also can provide a more detailed and nuanced measure of how patients are functioning in their daily lives, she said.
Together, these findings suggest that remote accelerometry provides useful continuous information about physical activity in real-world setting, she said, concluding that “these results support the possibility of using STEPS as a more sensitive and granular outcome measure in clinical trials and for targeted interventions in clinical care.”
This study was supported by the National Center for Advancing Translational Sciences. Dr. Block reported having no disclosures.
SOURCE: Block VJ et al. Neurology. 2018 Apr 10;90(15 Suppl):N5.001.
LOS ANGELES – The commercially available Fitbit Flex accelerometer proved useful and feasible for longitudinal measurement of average daily steps in a prospective, 1-year study of patients with multiple sclerosis.
The wrist-worn device was well received, with 79 of 96 participants (82%) completing follow-up, and it revealed changes in daily functioning that were not captured using more traditional disability metrics, Valerie J. Block, DPTSc, reported at the annual meeting of the American Academy of Neurology.
The study involved 61 adults with relapsing multiple sclerosis (MS) and 35 with progressive MS who were recruited into the University of California, San Francisco (UCSF) FITriMS cohort. All were able to walk at least 2 minutes at baseline, and their daily physical activity was recorded continuously by the device over 1 year. Performance-based measures, including the Expanded Disability Status Scale (EDSS) and timed 25-foot walk test, were evaluated at baseline and at 1 year, and patient-reported outcomes such as the 12-item MS walking scale were completed at baseline and at 1.5, 3, 6, 9, and 12 months. Nine patients withdrew, and eight were lost to follow-up.
“This was a fairly stable, actively treated cohort, and overall, there was no significant change in average daily steps (STEPS) over 1 year. However, there was a trend toward a decrease (–315 steps/day; P = .117), and 53% of patients had a decrease of more than 800 steps per day, which is a proposed minimal clinically important difference threshold,” Dr. Block, a postdoctoral scholar at UCSF, said in an interview.
Despite the modest, gradual reduction in STEPS over the year, most participants were able to complete the study, providing at least 1 valid week of STEPS data per month throughout the year, she said, noting that there was no difference in device use between relapsing MS and progressive MS participants.
A significant association between decreasing STEPS and worsening of clinic-based and patient-reported outcomes was demonstrated, but declining STEPS occurred even when disability levels, as measured by the EDSS, remained stable.
“Participants who started off the study with lower STEPS, below the cohort median of 4,766 STEPS, had fourfold higher odds of clinically-meaningful disability worsening at 1 year after adjusting for age, sex, and disease duration,” she said.
Further, earlier data published by Dr. Block and her colleagues showed there is wide variability in the change in steps over 1 year. In that study, the change in step count in patients whose EDSS score remained unchanged ranged from +814 to –3,718, suggesting that popular mainstream wearable technology is not only feasible but also can provide a more detailed and nuanced measure of how patients are functioning in their daily lives, she said.
Together, these findings suggest that remote accelerometry provides useful continuous information about physical activity in real-world setting, she said, concluding that “these results support the possibility of using STEPS as a more sensitive and granular outcome measure in clinical trials and for targeted interventions in clinical care.”
This study was supported by the National Center for Advancing Translational Sciences. Dr. Block reported having no disclosures.
SOURCE: Block VJ et al. Neurology. 2018 Apr 10;90(15 Suppl):N5.001.
REPORTING FROM AAN 2018
Key clinical point: Wearable accelerometers like the Fitbit Flex are feasible and useful for daily step counts in MS patients.
Major finding: 79 of 96 participants (82%) completed follow-up,
Study details: A prospective, 1-year study of 96 patients with MS
Disclosures: This study was supported by the National Center for Advancing Translational Sciences. Dr. Block reported having no disclosures.
Source: Block VJ et al. Neurology. 2018 Apr 10;90(15 Suppl):N5.001.

Patients with chronic pain feel caught in an opioid-prescribing debate
It started with a rolled ankle during a routine Army training exercise. Shannon Hubbard never imagined it was the prologue to one of the most debilitating pain conditions known to exist, called complex regional pain syndrome.

The condition causes the nervous system to go haywire, creating pain disproportionate to the actual injury. It also can affect how the body regulates temperature and blood flow.
For Ms. Hubbard, it manifested years ago following surgery on her foot – a common way for it to take hold.
“My leg feels like it’s on fire pretty much all the time. It spreads to different parts of your body,” the 47-year-old veteran said.
Ms. Hubbard props up her leg, careful not to graze it against the kitchen table in her home east of Phoenix. It’s red and swollen, still scarred from an ulcer that landed her in the hospital a few months ago.
“That started as a little blister and 4 days later, it was like the size of a baseball,” she said. “They had to cut it open and then it got infected, and because I have blood flow issues, it doesn’t heal.”
She knows it’s likely to happen again.
“Over the past 3 years, I’ve been prescribed over 60 different medications and combinations; none have even touched the pain,” she said.
Ms. Hubbard said she’s had injections and even traveled across the country for infusions of ketamine, an anesthetic that can be used for pain in extreme cases. Her doctors have discussed amputating her leg because of the frequency of the infections.
“All I can do is manage the pain,” she said. “Opioids have become the best solution.”
For about 9 months, Ms. Hubbard was on a combination of short- and long-acting opioids. She said it gave her enough relief to start leaving the house again and doing physical therapy.
But in April that changed. At her monthly appointment, her pain doctor informed her the dose was being lowered. “They had to take one of the pills away,” she said.
Ms. Hubbard knew the rules were part of Arizona’s new opioid law, which places restrictions on prescribing and limits the maximum dose for most patients. She also knew the law wasn’t supposed to affect her – an existing patient with chronic pain.
She argued with the doctor, without success. “They didn’t indicate there was any medical reason for cutting me back. It was simply because of the pressure of the opioid rules.”
Her dose was lowered from 100 morphine milligram equivalents daily (MME) to 90, the highest dose allowed for many new patients in Arizona. She said her pain has been “terrible” ever since.
“It just hurts,” she said. “I don’t want to walk, I pretty much don’t want to do anything.”
Ms. Hubbard’s condition may be extreme, but her situation isn’t unique. Faced with skyrocketing drug overdoses, states are cracking down on opioid prescribing. Increasingly, some patients with chronic pain like Ms. Hubbard say they are becoming collateral damage.
New limits on prescribing
More than two dozen states have implemented laws or policies limiting opioid prescriptions in some way. The most common is to restrict a patient’s first prescription to a number of pills that should last a week or less. But some states like Arizona have gone further by placing a ceiling on the maximum dose for most patients.
The Arizona Opioid Epidemic Act, the culmination of months of outreach and planning by state health officials, was passed earlier this year with unanimous support.
It started in June 2017, when Arizona Gov. Doug Ducey, a Republican, declared a public health emergency, citing new data, showing that two people were dying every day in the state from opioid overdoses.
He has pledged to come after those responsible for the rising death toll.
“All bad actors will be held accountable – whether they are doctors, manufacturers, or just plain drug dealers,” the governor said in his annual State of the State address, in January 2018.
He cited statistics from one rural county in which four doctors prescribed 6 million pills in a single year, concluding “something has gone terribly, terribly wrong.”
Later in January, Gov. Ducey called a special session of the Arizona legislature and, in less than a week, he signed the Arizona Opioid Epidemic Act into law. He called it the “most comprehensive and thoughtful package any state has passed to address this issue and crisis to date.”
The law expands access to addiction treatment, ramps up oversight of prescribing and protects from prosecution drug users who call 911 to report an overdose, among other things.
Initially, Arizona’s major medical associations cautioned against what they saw as too much interference in clinical practice, especially since opioid prescriptions already were on the decline.
Gov. Ducey’s administration offered assurances that the law would “maintain access for chronic pain sufferers and others who rely on these drugs.” Restrictions would apply to new patients only. Cancer, trauma, end-of-life, and other serious cases were exempt. Ultimately, the medical establishment came out in favor of the law.
Pressure on doctors
Since the law’s passage, some doctors in Arizona report feeling pressure to lower patient doses, even for patients who have been on stable regimens of opioids for years without trouble.
Julian Grove, MD, knows the nuances of Arizona’s new law better than most physicians. A pain physician, Dr. Grove worked with the state on the prescribing rules.
“We moved the needle to a degree so that many patients wouldn’t be as severely affected,” said Dr. Grove, president of the Arizona Pain Society. “But I’ll be the first to say, this has certainly caused a lot of patients problems [and] anxiety.”
“Many people who are prescribing medications have moved to a much more conservative stance and, unfortunately, pain patients are being negatively affected.”
Like many states, Arizona has looked to its prescription-monitoring program as a key tool for tracking overprescribing. State law requires prescribers to check the online database. Report cards are sent out comparing each prescriber to the rest of their cohort. Clinicians consider their scores when deciding how to manage patients’ care, he said.
“A lot of practitioners are reducing opioid medications, not from a clinical perspective, but more from a legal and regulatory perspective for fear of investigation,” Dr. Grove said. “No practitioner wants to be the highest prescriber.”
Arizona’s new prescribing rules don’t apply to board-certified pain specialists like Dr. Grove, who are trained to care for patients with complex chronic pain. But, he said, the reality is that doctors – even pain specialists – were already facing pressure on many fronts to curtail opioids – from the Drug Enforcement Agency to health insurers down to state medical boards.
The new state law has made the reduction of opioids only “more fast and furious,” he said.
Dr. Grove traces the hypervigilance back to guidelines put out by the Centers for Disease Control and Prevention in 2016. The CDC spelled out the risks associated with higher doses of opioids and advised clinicians when starting a patient on opioids to prescribe the lowest effective dosage.
Sally Satel, MD, a psychiatrist and a fellow at the American Enterprise Institute, said those guidelines stipulated the decision to lower a patient’s dose should be decided on a case-by-case basis, not by means of a blanket policy.
“[The guidelines] have been grossly misinterpreted,” Dr. Satel said.
The guidelines were not intended for pain specialists, but rather for primary care physicians, a group that accounted for nearly half of all opioids dispensed from 2007 to 2012.
“There is no mandate to reduce doses on people who have been doing well,” Dr. Satel said.
In the rush to address the nation’s opioid overdose crisis, she said, the CDC’s guidelines have become the model for many regulators and state legislatures. “It’s a very, very unhealthy, deeply chilled environment in which doctors and patients who have chronic pain can no longer work together,” she said.
Dr. Satel called the notion that new prescribing laws will reverse the tide of drug overdose deaths “misguided.”
The rate of opioid prescribing nationally has declined in recent years, though it still soars above the levels of the 1990s. Meanwhile, more people are dying from illicit drugs like heroin and fentanyl than prescription opioids.
In Arizona, more than 1,300 people have died from opioid-related overdoses since June 2017, according to preliminary state numbers. Only a third of those deaths involved just a prescription painkiller.
Heroin is now almost as common as oxycodone in overdose cases in Arizona.
A range of views
Some physicians support the new rules, said Pete Wertheim, executive director of the Arizona Osteopathic Medical Association.
“For some, it has been a welcome relief,” he said. “They feel like it has given them an avenue, a means to confront patients.” Some doctors tell him it’s an opportunity to have a tough conversation with patients they believe to be at risk for addiction or overdose because of the medication.
The organization is striving to educate its members about Arizona’s prescribing rules and the exemptions. But, he said, most doctors now feel the message is clear: “We don’t want you prescribing opioids.”
Long before the law passed, Mr. Wertheim said, physicians were already telling him that they had stopped prescribing, because they “didn’t want the liability.”
He worries the current climate around prescribing will drive doctors out of pain management, especially in rural areas. There’s also a fear that some patients who can’t get prescription pills will try stronger street drugs, said Gerald Harris II, MD, an addiction treatment specialist in Glendale, Ariz.
Dr. Harris said he has seen an increase in referrals from doctors concerned that their patients with chronic pain are addicted to opioids. He receives new patients – almost daily, he said – whose physicians have stopped prescribing altogether.
“Their doctor is afraid and he’s cut them off,” Dr. Harris said. “Unfortunately, a great many patients turn to street heroin and other drugs to self-medicate because they couldn’t get the medications they need.”
Arizona’s Department of Health Services is working to reassure providers and dispel the myths, said Cara M. Christ, MD, who heads the agency and helped design the state’s opioid response. She pointed to the recently launched Opioid Assistance and Referral Line, created to help health care providers with complex cases. The state has also released a set of detailed prescribing guidelines for doctors.
Dr. Christ characterizes this as an “adjustment period” while physicians learn the new rules.
“The intent was never to stop prescribers from utilizing opioids,” she said. “It’s really meant to prevent a future generation from developing opioid use disorder, while not impacting current chronic pain patients.”
Dr. Christ said she just hasn’t heard of many patients losing access to medicine.
It’s still too early to gauge the law’s success, she said, but opioid prescriptions continue to decline in Arizona.
Arizona saw a 33% reduction in the number of opioid prescriptions in April, compared with the same period last year, state data show. Dr. Christ’s agency reports that more people are getting help for addiction: There has been about a 40% increase in hospitals referring patients for behavioral health treatment following an overdose.
Shannon Hubbard, the woman living with complex regional pain syndrome, considers herself fortunate that her doctors didn’t cut back her painkiller dose even more.
“I’m actually kind of lucky that I have such a severe case because at least they can’t say I’m crazy or it’s in my head,” she said.
Ms. Hubbard is well aware that people are dying every day from opioids. One of her family members struggles with heroin addiction, and she’s helping raise his daughter. But she’s adamant that there’s a better way to address the crisis.
“What they are doing is not working. They are having no effect on the guy who is on the street shooting heroin and is really in danger of overdosing,” she said. “Instead, they are hurting people that are actually helped by the drugs.”
This story is part of a partnership that includes KJZZ, NPR, and Kaiser Health News. Kaiser Health News is a nonprofit national health policy news service. It is an editorially independent program of the Henry J. Kaiser Family Foundation that is not affiliated with Kaiser Permanente.
It started with a rolled ankle during a routine Army training exercise. Shannon Hubbard never imagined it was the prologue to one of the most debilitating pain conditions known to exist, called complex regional pain syndrome.
The condition causes the nervous system to go haywire, creating pain disproportionate to the actual injury. It also can affect how the body regulates temperature and blood flow.
For Ms. Hubbard, it manifested years ago following surgery on her foot – a common way for it to take hold.
“My leg feels like it’s on fire pretty much all the time. It spreads to different parts of your body,” the 47-year-old veteran said.
Ms. Hubbard props up her leg, careful not to graze it against the kitchen table in her home east of Phoenix. It’s red and swollen, still scarred from an ulcer that landed her in the hospital a few months ago.
“That started as a little blister and 4 days later, it was like the size of a baseball,” she said. “They had to cut it open and then it got infected, and because I have blood flow issues, it doesn’t heal.”
She knows it’s likely to happen again.
“Over the past 3 years, I’ve been prescribed over 60 different medications and combinations; none have even touched the pain,” she said.
Ms. Hubbard said she’s had injections and even traveled across the country for infusions of ketamine, an anesthetic that can be used for pain in extreme cases. Her doctors have discussed amputating her leg because of the frequency of the infections.
“All I can do is manage the pain,” she said. “Opioids have become the best solution.”
For about 9 months, Ms. Hubbard was on a combination of short- and long-acting opioids. She said it gave her enough relief to start leaving the house again and doing physical therapy.
But in April that changed. At her monthly appointment, her pain doctor informed her the dose was being lowered. “They had to take one of the pills away,” she said.
Ms. Hubbard knew the rules were part of Arizona’s new opioid law, which places restrictions on prescribing and limits the maximum dose for most patients. She also knew the law wasn’t supposed to affect her – an existing patient with chronic pain.
She argued with the doctor, without success. “They didn’t indicate there was any medical reason for cutting me back. It was simply because of the pressure of the opioid rules.”
Her dose was lowered from 100 morphine milligram equivalents daily (MME) to 90, the highest dose allowed for many new patients in Arizona. She said her pain has been “terrible” ever since.
“It just hurts,” she said. “I don’t want to walk, I pretty much don’t want to do anything.”
Ms. Hubbard’s condition may be extreme, but her situation isn’t unique. Faced with skyrocketing drug overdoses, states are cracking down on opioid prescribing. Increasingly, some patients with chronic pain like Ms. Hubbard say they are becoming collateral damage.
New limits on prescribing
More than two dozen states have implemented laws or policies limiting opioid prescriptions in some way. The most common is to restrict a patient’s first prescription to a number of pills that should last a week or less. But some states like Arizona have gone further by placing a ceiling on the maximum dose for most patients.
The Arizona Opioid Epidemic Act, the culmination of months of outreach and planning by state health officials, was passed earlier this year with unanimous support.
It started in June 2017, when Arizona Gov. Doug Ducey, a Republican, declared a public health emergency, citing new data, showing that two people were dying every day in the state from opioid overdoses.
He has pledged to come after those responsible for the rising death toll.
“All bad actors will be held accountable – whether they are doctors, manufacturers, or just plain drug dealers,” the governor said in his annual State of the State address, in January 2018.
He cited statistics from one rural county in which four doctors prescribed 6 million pills in a single year, concluding “something has gone terribly, terribly wrong.”
Later in January, Gov. Ducey called a special session of the Arizona legislature and, in less than a week, he signed the Arizona Opioid Epidemic Act into law. He called it the “most comprehensive and thoughtful package any state has passed to address this issue and crisis to date.”
The law expands access to addiction treatment, ramps up oversight of prescribing and protects from prosecution drug users who call 911 to report an overdose, among other things.
Initially, Arizona’s major medical associations cautioned against what they saw as too much interference in clinical practice, especially since opioid prescriptions already were on the decline.
Gov. Ducey’s administration offered assurances that the law would “maintain access for chronic pain sufferers and others who rely on these drugs.” Restrictions would apply to new patients only. Cancer, trauma, end-of-life, and other serious cases were exempt. Ultimately, the medical establishment came out in favor of the law.
Pressure on doctors
Since the law’s passage, some doctors in Arizona report feeling pressure to lower patient doses, even for patients who have been on stable regimens of opioids for years without trouble.
Julian Grove, MD, knows the nuances of Arizona’s new law better than most physicians. A pain physician, Dr. Grove worked with the state on the prescribing rules.
“We moved the needle to a degree so that many patients wouldn’t be as severely affected,” said Dr. Grove, president of the Arizona Pain Society. “But I’ll be the first to say, this has certainly caused a lot of patients problems [and] anxiety.”
“Many people who are prescribing medications have moved to a much more conservative stance and, unfortunately, pain patients are being negatively affected.”
Like many states, Arizona has looked to its prescription-monitoring program as a key tool for tracking overprescribing. State law requires prescribers to check the online database. Report cards are sent out comparing each prescriber to the rest of their cohort. Clinicians consider their scores when deciding how to manage patients’ care, he said.
“A lot of practitioners are reducing opioid medications, not from a clinical perspective, but more from a legal and regulatory perspective for fear of investigation,” Dr. Grove said. “No practitioner wants to be the highest prescriber.”
Arizona’s new prescribing rules don’t apply to board-certified pain specialists like Dr. Grove, who are trained to care for patients with complex chronic pain. But, he said, the reality is that doctors – even pain specialists – were already facing pressure on many fronts to curtail opioids – from the Drug Enforcement Agency to health insurers down to state medical boards.
The new state law has made the reduction of opioids only “more fast and furious,” he said.
Dr. Grove traces the hypervigilance back to guidelines put out by the Centers for Disease Control and Prevention in 2016. The CDC spelled out the risks associated with higher doses of opioids and advised clinicians when starting a patient on opioids to prescribe the lowest effective dosage.
Sally Satel, MD, a psychiatrist and a fellow at the American Enterprise Institute, said those guidelines stipulated the decision to lower a patient’s dose should be decided on a case-by-case basis, not by means of a blanket policy.
“[The guidelines] have been grossly misinterpreted,” Dr. Satel said.
The guidelines were not intended for pain specialists, but rather for primary care physicians, a group that accounted for nearly half of all opioids dispensed from 2007 to 2012.
“There is no mandate to reduce doses on people who have been doing well,” Dr. Satel said.
In the rush to address the nation’s opioid overdose crisis, she said, the CDC’s guidelines have become the model for many regulators and state legislatures. “It’s a very, very unhealthy, deeply chilled environment in which doctors and patients who have chronic pain can no longer work together,” she said.
Dr. Satel called the notion that new prescribing laws will reverse the tide of drug overdose deaths “misguided.”
The rate of opioid prescribing nationally has declined in recent years, though it still soars above the levels of the 1990s. Meanwhile, more people are dying from illicit drugs like heroin and fentanyl than prescription opioids.
In Arizona, more than 1,300 people have died from opioid-related overdoses since June 2017, according to preliminary state numbers. Only a third of those deaths involved just a prescription painkiller.
Heroin is now almost as common as oxycodone in overdose cases in Arizona.
A range of views
Some physicians support the new rules, said Pete Wertheim, executive director of the Arizona Osteopathic Medical Association.
“For some, it has been a welcome relief,” he said. “They feel like it has given them an avenue, a means to confront patients.” Some doctors tell him it’s an opportunity to have a tough conversation with patients they believe to be at risk for addiction or overdose because of the medication.
The organization is striving to educate its members about Arizona’s prescribing rules and the exemptions. But, he said, most doctors now feel the message is clear: “We don’t want you prescribing opioids.”
Long before the law passed, Mr. Wertheim said, physicians were already telling him that they had stopped prescribing, because they “didn’t want the liability.”
He worries the current climate around prescribing will drive doctors out of pain management, especially in rural areas. There’s also a fear that some patients who can’t get prescription pills will try stronger street drugs, said Gerald Harris II, MD, an addiction treatment specialist in Glendale, Ariz.
Dr. Harris said he has seen an increase in referrals from doctors concerned that their patients with chronic pain are addicted to opioids. He receives new patients – almost daily, he said – whose physicians have stopped prescribing altogether.
“Their doctor is afraid and he’s cut them off,” Dr. Harris said. “Unfortunately, a great many patients turn to street heroin and other drugs to self-medicate because they couldn’t get the medications they need.”
Arizona’s Department of Health Services is working to reassure providers and dispel the myths, said Cara M. Christ, MD, who heads the agency and helped design the state’s opioid response. She pointed to the recently launched Opioid Assistance and Referral Line, created to help health care providers with complex cases. The state has also released a set of detailed prescribing guidelines for doctors.
Dr. Christ characterizes this as an “adjustment period” while physicians learn the new rules.
“The intent was never to stop prescribers from utilizing opioids,” she said. “It’s really meant to prevent a future generation from developing opioid use disorder, while not impacting current chronic pain patients.”
Dr. Christ said she just hasn’t heard of many patients losing access to medicine.
It’s still too early to gauge the law’s success, she said, but opioid prescriptions continue to decline in Arizona.
Arizona saw a 33% reduction in the number of opioid prescriptions in April, compared with the same period last year, state data show. Dr. Christ’s agency reports that more people are getting help for addiction: There has been about a 40% increase in hospitals referring patients for behavioral health treatment following an overdose.
Shannon Hubbard, the woman living with complex regional pain syndrome, considers herself fortunate that her doctors didn’t cut back her painkiller dose even more.
“I’m actually kind of lucky that I have such a severe case because at least they can’t say I’m crazy or it’s in my head,” she said.
Ms. Hubbard is well aware that people are dying every day from opioids. One of her family members struggles with heroin addiction, and she’s helping raise his daughter. But she’s adamant that there’s a better way to address the crisis.
“What they are doing is not working. They are having no effect on the guy who is on the street shooting heroin and is really in danger of overdosing,” she said. “Instead, they are hurting people that are actually helped by the drugs.”
This story is part of a partnership that includes KJZZ, NPR, and Kaiser Health News. Kaiser Health News is a nonprofit national health policy news service. It is an editorially independent program of the Henry J. Kaiser Family Foundation that is not affiliated with Kaiser Permanente.
FDA rejects mepolizumab on efficacy, but supports safety for COPD
Asthma drug mepolizumab could be added safely to inhaled corticosteroids for maintenance therapy to help reduce exacerbations in chronic obstructive pulmonary disease (COPD) patients who meet criteria for eosinophil counts, but the current data do not support its efficacy strongly enough for approval, according to a majority of members of the Food and Drug Administration’s Pulmonary-Allergy Drugs Advisory Committee.

The committee voted 16-3 that there was insufficient evidence of efficacy to support guided by eosinophil levels; they also voted 16-3 that the risk-benefit profile was not adequate to support approval.
However, on a voting question of safety, the committee voted 17-2 that the safety data on mepolizumab were sufficient to support approval.
Mepolizumab, a humanized monoclonal antibody, is currently approved for the treatment of asthma with eosinophilic phenotype for patients aged 12 years and older and for adults with eosinophilic granulomatosis with polyangiitis. Manufacturer GlaxoSmithKline is seeking approval for its use as an add-on therapy in COPD patients at a subcutaneous dose of 100 mg every 4 weeks. Mepolizumab works by binding to interleukin-5 (IL-5) and reducing eosinophil maturation and survival, which prompted GlaxoSmithKline to pursue an indication for COPD patients in a high-eosinophil stratum.
The application was supported in part by two concurrent randomized trials of 52 weeks’ duration.
Banu A. Karimi-Shah, MD, clinical team leader of the FDA’s Division of Pulmonary, Allergy, and Rheumatology Products, presented data from the two studies, referred to as Study 106 and Study 113.
In Study 106, researchers found statistically significant reductions in exacerbations for patients in the highest eosinophil group. However, challenges of the studies included a lack of consensus over the definition and possible relevance of an eosinophilic COPD phenotype, Dr. Karimi-Shah said in a presentation at the meeting.
In Study 113, mepolizumab had no significant impact on reducing moderate to severe exacerbations at either a 100-mg or 300-mg dose, Dr. Karimi-Shah said. In addition, most secondary endpoints, with the exception of reducing time to the first exacerbation among patients in the highest eosinophil group, did not consistently support the primary endpoint of exacerbation reduction in either study, she said.
Robert Busch, MD, also of the FDA’s Division of Pulmonary, Allergy, and Rheumatology products, served as a clinical reviewer and presented data on safety, efficacy, and risk-benefit profile of mepolizumab.
Dr. Busch noted that the variability in blood eosinophils make it challenging to use as a potential marker to identify patients who would benefit from mepolizumab as an add-on therapy.
Overall, most of the committee agreed on the existence of an eosinophilic COPD phenotype, but expressed concern about the threshold being used.
“The studies were not particularly well controlled regarding the characterization of patients,” said William J. Calhoun, MD, of the University of Texas Medical Branch, Galveston, who cast one of the ‘no’ votes on the question of efficacy.
By contrast, Jeffrey S. Wagener, MD, of the University of Colorado at Denver, Aurora, referenced his background in cystic fibrosis, and voted “yes” on the question of efficacy. “For patients that have no other option, this is a step forward,” he said.
Committee members on both sides of the vote emphasized the need for more research with larger numbers, better patient characterization, and more female patients. The committee members reported no relevant conflicts of interest.
Asthma drug mepolizumab could be added safely to inhaled corticosteroids for maintenance therapy to help reduce exacerbations in chronic obstructive pulmonary disease (COPD) patients who meet criteria for eosinophil counts, but the current data do not support its efficacy strongly enough for approval, according to a majority of members of the Food and Drug Administration’s Pulmonary-Allergy Drugs Advisory Committee.
The committee voted 16-3 that there was insufficient evidence of efficacy to support guided by eosinophil levels; they also voted 16-3 that the risk-benefit profile was not adequate to support approval.
However, on a voting question of safety, the committee voted 17-2 that the safety data on mepolizumab were sufficient to support approval.
Mepolizumab, a humanized monoclonal antibody, is currently approved for the treatment of asthma with eosinophilic phenotype for patients aged 12 years and older and for adults with eosinophilic granulomatosis with polyangiitis. Manufacturer GlaxoSmithKline is seeking approval for its use as an add-on therapy in COPD patients at a subcutaneous dose of 100 mg every 4 weeks. Mepolizumab works by binding to interleukin-5 (IL-5) and reducing eosinophil maturation and survival, which prompted GlaxoSmithKline to pursue an indication for COPD patients in a high-eosinophil stratum.
The application was supported in part by two concurrent randomized trials of 52 weeks’ duration.
Banu A. Karimi-Shah, MD, clinical team leader of the FDA’s Division of Pulmonary, Allergy, and Rheumatology Products, presented data from the two studies, referred to as Study 106 and Study 113.
In Study 106, researchers found statistically significant reductions in exacerbations for patients in the highest eosinophil group. However, challenges of the studies included a lack of consensus over the definition and possible relevance of an eosinophilic COPD phenotype, Dr. Karimi-Shah said in a presentation at the meeting.
In Study 113, mepolizumab had no significant impact on reducing moderate to severe exacerbations at either a 100-mg or 300-mg dose, Dr. Karimi-Shah said. In addition, most secondary endpoints, with the exception of reducing time to the first exacerbation among patients in the highest eosinophil group, did not consistently support the primary endpoint of exacerbation reduction in either study, she said.
Robert Busch, MD, also of the FDA’s Division of Pulmonary, Allergy, and Rheumatology products, served as a clinical reviewer and presented data on safety, efficacy, and risk-benefit profile of mepolizumab.
Dr. Busch noted that the variability in blood eosinophils make it challenging to use as a potential marker to identify patients who would benefit from mepolizumab as an add-on therapy.
Overall, most of the committee agreed on the existence of an eosinophilic COPD phenotype, but expressed concern about the threshold being used.
“The studies were not particularly well controlled regarding the characterization of patients,” said William J. Calhoun, MD, of the University of Texas Medical Branch, Galveston, who cast one of the ‘no’ votes on the question of efficacy.
By contrast, Jeffrey S. Wagener, MD, of the University of Colorado at Denver, Aurora, referenced his background in cystic fibrosis, and voted “yes” on the question of efficacy. “For patients that have no other option, this is a step forward,” he said.
Committee members on both sides of the vote emphasized the need for more research with larger numbers, better patient characterization, and more female patients. The committee members reported no relevant conflicts of interest.
FROM AN FDA ADVISORY COMMITTEE MEETING