User login
Liraglutide approved for cardiovascular event reduction
The type 2 diabetes treatment Victoza (liraglutide) has been approved by the Food and Drug Administration for a new indication – to reduce the risk of several adverse cardiovascular events, according to a press release from Novo Nordisk.
FDA approval was based on results from the LEADER (NCT01179048) trial, where people with type 2 diabetes who received liraglutide were 13% less likely to experience cardiovascular death, nonfatal heart attack, or nonfatal stroke then type 2 diabetes patients who received a placebo, with an absolute risk reduction of 1.9%. Notably, risk of cardiovascular death was reduced by 22% in the liraglutide group, compared with the control group, and all-cause death was reduced by 15%.
“Today’s news is significant for millions of Americans living with type 2 diabetes because, even when controlled, diabetes puts patients at a greater risk for cardiovascular events. More treatment options like Victoza that address critical aspects of diabetes care beyond glucose lowering are essential to confront this pervasive issue,” Steve Marso, MD, medical director at the Cardiovascular Services HCA Midwest Health Heart and Vascular Institute and one of the primary investigators in LEADER said in the press release.
Find the full press release on the Novo Nordisk website.
FDA approves once-daily treatment for hyperuricemia in gout
The Food and Drug Administration announced Aug. 21 the approval of Duzallo, a once-daily oral treatment for hyperuricemia associated with gout in patients who have not achieved target serum uric acid (sUA) levels with a medically appropriate daily dose of allopurinol alone.
Duzallo is a fixed-dose combination of lesinurad 200 mg and allopurinol 300 mg that will be marketed by Ironwood Pharmaceuticals. It will also be available in a lesinurad 200 mg plus allopurinol 200 mg dosage.
“With Duzallo, nearly twice as many patients with uncontrolled gout may be able to achieve target serum uric acid levels compared to those patients taking allopurinol alone, which is important, considering the significant unmet need among uncontrolled gout patients to get to goal of under 6 mg/dL,” said Tom McCourt, senior vice president of marketing and sales and chief commercial officer at Ironwood in an announcement from the company.
Duzallo is the first drug that combines the current standard of care for the treatment of hyperuricemia associated with gout, allopurinol, with the most recent FDA-approved treatment for gout, lesinurad (Zurampic). Allopurinol is an xanthine oxidase inhibitor whose action differs from that of uricosuric agents such as lesinurad. Allopurinol reduces the production of uric acid, whereas lesinurad increases renal excretion of uric acid by selectively inhibiting the action of URAT1, the uric acid transporter responsible for the majority of renal uric acid reabsorption.
Duzallo is not recommended for the treatment of asymptomatic hyperuricemia. It has a boxed warning regarding the risk of acute renal failure.
Duzallo is expected to be commercially available early in the fourth quarter of 2017.
Headache May Be Independent of Idiopathic Intracranial Hypertension
Headache in idiopathic intracranial hypertension (IIH) appears to be clinically independent of raised intracranial pressure and may require a different treatment approach than lowering intracranial pressure, according to a study published online ahead of print July 28 in Headache.

The researchers examined data from 165 patients with untreated IIH and mild vision loss. The participants had been randomized to weight loss plus acetazolamide or placebo as a part of the IIH Treatment Trial.
In the 139 patients with headaches at baseline, the researchers saw no significant correlation between lumbar puncture opening pressure, which was measured at baseline and six months, and Headache Impact Test-6 (HIT-6) scores, or with the presence or absence of headache.
The researchers found no significant difference in headache outcomes between the acetazolamide and placebo groups at six months. Headaches in both groups improved overall during the course of the study, however.
At baseline, participants with headache reported taking various symptomatic headache treatments, including acetaminophen, ibuprofen, naproxen, and combination medications. Some also reported taking hydrocodone, tramadol, or combination formulations containing codeine.
Approximately 37% of the participants overused symptomatic pain medication. Fifteen of these patients met the criteria for overuse of opioids or combination medications. The mean HIT-6 scores were significantly higher in those who were overusing medications, compared with those who were not.
The most common headache phenotype was migraine (52%), followed by tension-type headache (22%), probable migraine (16%), and probable tension-type headache (4%), with 7% unclassified. Patients with headache also experienced associated symptoms such as photophobia, phonophobia, nausea, vomiting, visual loss or obscurations, diplopia, and dizziness.
—Bianca Nogrady
Suggested Reading
Friedman DI, Quiros PA, Subramanian PS, et al. Headache in idiopathic intracranial hypertension: Findings from the Idiopathic Intracranial Hypertension Treatment Trial. Headache. 2017 July 28 [Epub ahead of print].
Yri HM, Rönnbäck C, Wegener M, et al. The course of headache in idiopathic intracranial hypertension: a 12-month prospective follow-up study. Eur J Neurol. 2014;21(12):1458-1464.
Headache in idiopathic intracranial hypertension (IIH) appears to be clinically independent of raised intracranial pressure and may require a different treatment approach than lowering intracranial pressure, according to a study published online ahead of print July 28 in Headache.
The researchers examined data from 165 patients with untreated IIH and mild vision loss. The participants had been randomized to weight loss plus acetazolamide or placebo as a part of the IIH Treatment Trial.
In the 139 patients with headaches at baseline, the researchers saw no significant correlation between lumbar puncture opening pressure, which was measured at baseline and six months, and Headache Impact Test-6 (HIT-6) scores, or with the presence or absence of headache.
The researchers found no significant difference in headache outcomes between the acetazolamide and placebo groups at six months. Headaches in both groups improved overall during the course of the study, however.
At baseline, participants with headache reported taking various symptomatic headache treatments, including acetaminophen, ibuprofen, naproxen, and combination medications. Some also reported taking hydrocodone, tramadol, or combination formulations containing codeine.
Approximately 37% of the participants overused symptomatic pain medication. Fifteen of these patients met the criteria for overuse of opioids or combination medications. The mean HIT-6 scores were significantly higher in those who were overusing medications, compared with those who were not.
The most common headache phenotype was migraine (52%), followed by tension-type headache (22%), probable migraine (16%), and probable tension-type headache (4%), with 7% unclassified. Patients with headache also experienced associated symptoms such as photophobia, phonophobia, nausea, vomiting, visual loss or obscurations, diplopia, and dizziness.
—Bianca Nogrady
Suggested Reading
Friedman DI, Quiros PA, Subramanian PS, et al. Headache in idiopathic intracranial hypertension: Findings from the Idiopathic Intracranial Hypertension Treatment Trial. Headache. 2017 July 28 [Epub ahead of print].
Yri HM, Rönnbäck C, Wegener M, et al. The course of headache in idiopathic intracranial hypertension: a 12-month prospective follow-up study. Eur J Neurol. 2014;21(12):1458-1464.
Extended-release amantadine approved for treatment of dyskinesia in Parkinson’s
An extended-release formulation of amantadine received approval from the Food and Drug Administration on Aug. 24 for the treatment of dyskinesia in patients with Parkinson’s disease. The significant increase in functional time for Parkinson’s disease patients with dyskinesia who took extended-release amantadine was attributable both to a reduction in off-time and to a decrease in troublesome dyskinesia during on-time.
This is the first FDA approval for a drug to treat levodopa therapy-related dyskinesia in patients with Parkinson’s disease, according to an announcement from its manufacturer, Adamas Pharmaceuticals.
The second study also showed clinically relevant and statistically significant results, with a 46% reduction on the UDysRS for those taking ER amantadine, compared with a 16% reduction for those taking placebo.
The oral ER amantadine formulation delivers 274 mg of amantadine once daily at bedtime, allowing sustained high levels of the drug during waking hours, with peak levels delivered during the morning and throughout the day and a trough near bedtime.
When investigators of the two studies analyzed diaries that had been kept by Parkinson’s disease patients, they found that patients in the two studies who were taking ER amantadine experienced a placebo-adjusted reduction in off-time of about 1 hour per day.
Patients in the ER amantadine arm of the first study also had an increase of 3.6 hours per day of functional time, compared with a 0.8-hour increase for patients taking placebo. In the second study, functional time went up by 4.0 hours per day for patients in the ER amantadine arm, compared with an increase of 2.1 hours per day for those on placebo. Functional time was defined as on-time without troublesome dyskinesia.
Adverse reactions to ER amantadine that occurred in more than 10% of patients in the active arms of the study, and which occurred more frequently than in those taking placebo, included hallucinations, falls, orthostatic hypotension, dizziness, peripheral edema, dry mouth, and constipation.
The medication is contraindicated in those with creatinine clearance below 15 mL/min/1.73 m2. Prescribing information advises that amantadine ER be avoided or used with caution in patients with a history of suicidality and depression, hallucinations or psychotic behavior, and orthostatic hypotension or dizziness.
Patients taking ER amantadine may also experience impulsivity and sexual, spending, or gambling urges. Abrupt withdrawal or rapid dose reduction may result in withdrawal-emergent hyperpyrexia or confusion, including delirium, hallucinations, stupor, and slurred speech.
The clinical trials upon which the approval is based were funded by Adamas Pharmaceuticals.
[email protected]
On Twitter @karioakes
The biliary tree and pancreas: An overview
The session titled “The biliary tree and pancreas” provided an overview of the most important pancreaticobiliary diseases, allowing experts to delineate their approaches to challenging aspects of these conditions.
Timothy Gardner, MD, MS, focused on the management and treatment of sequelae in patients with acute pancreatitis. He provided support for the use of lactated Ringer’s as the fluid of choice, cautioning against over-resuscitation. He advised early oral feeds, without clear preference for nasogastric or nasojejunal administration. Dr. Gardner emphasized the importance of classifying type of fluid collection to optimize clinical decision making. Endoscopic techniques appear to be safer and as efficacious as surgical approaches. Regarding thrombosis, anticoagulation was recommended unless an absolute contraindication exists. He also recommended addressing symptomatic ductal disruptions.

Douglas Adler, MD, AGAF, provided pointers on distinguishing between malignant and benign biliary strictures. Ruling out a malignant stricture entails use of multiple diagnostic modalities to image and to sample abnormalities, such as a dominant stricture in primary sclerosing cholangitis. Fluorescence in situ hybridization (FISH) and cholangioscopy are fairly widely used, while other techniques such as confocal laser endomicroscopy are used less frequently. Benign biliary strictures occur frequently in the liver transplant population, both anastomotic and nonanastomotic. Benign biliary strictures may also occur in chronic pancreatitis; importantly, these may mimic pancreatic cancer.
During my presentation, we focused on several aspects of pancreaticobiliary neoplasia. We reviewed the multiple genetic syndromes such as Peutz-Jeghers syndrome, hereditary pancreatitis, and Lynch syndrome, all of which confer increased risk for pancreatic cancer. Endoscopic ultrasound guidance and adjunctive techniques (e.g., elastography) may improve imaging in the pancreas and improve targeting of biopsies. Needle-based confocal laser endomicroscopy is also available to provide real time cellular data, improving our ability to accurately diagnose and differentiate pancreatic cystic neoplasms. Endoscopic ultrasound–guided needle injection and other therapeutic techniques allow endoscopists to intervene therapeutically. Accurate management of pancreatic cysts depends largely on the accurate identification of mucinous cystic neoplasms. Recent guidelines delineate high-risk stigmata and worrisome features of branch-duct intraductal papillary mucinous neoplasm. We also reviewed less common neoplasms such as pancreatic neuroendocrine tumors and biliary neoplasms.
Dr. Kim is an assistant professor of gastroenterology at Mount Sinai Hospital, acting director of endoscopy, and director of endoscopic ultrasound at Mount Sinai Hospital, New York. This is a summary provided by the moderator of one of the AGA Postgraduate Courses held at DDW 2017.
The session titled “The biliary tree and pancreas” provided an overview of the most important pancreaticobiliary diseases, allowing experts to delineate their approaches to challenging aspects of these conditions.
Timothy Gardner, MD, MS, focused on the management and treatment of sequelae in patients with acute pancreatitis. He provided support for the use of lactated Ringer’s as the fluid of choice, cautioning against over-resuscitation. He advised early oral feeds, without clear preference for nasogastric or nasojejunal administration. Dr. Gardner emphasized the importance of classifying type of fluid collection to optimize clinical decision making. Endoscopic techniques appear to be safer and as efficacious as surgical approaches. Regarding thrombosis, anticoagulation was recommended unless an absolute contraindication exists. He also recommended addressing symptomatic ductal disruptions.
Douglas Adler, MD, AGAF, provided pointers on distinguishing between malignant and benign biliary strictures. Ruling out a malignant stricture entails use of multiple diagnostic modalities to image and to sample abnormalities, such as a dominant stricture in primary sclerosing cholangitis. Fluorescence in situ hybridization (FISH) and cholangioscopy are fairly widely used, while other techniques such as confocal laser endomicroscopy are used less frequently. Benign biliary strictures occur frequently in the liver transplant population, both anastomotic and nonanastomotic. Benign biliary strictures may also occur in chronic pancreatitis; importantly, these may mimic pancreatic cancer.
During my presentation, we focused on several aspects of pancreaticobiliary neoplasia. We reviewed the multiple genetic syndromes such as Peutz-Jeghers syndrome, hereditary pancreatitis, and Lynch syndrome, all of which confer increased risk for pancreatic cancer. Endoscopic ultrasound guidance and adjunctive techniques (e.g., elastography) may improve imaging in the pancreas and improve targeting of biopsies. Needle-based confocal laser endomicroscopy is also available to provide real time cellular data, improving our ability to accurately diagnose and differentiate pancreatic cystic neoplasms. Endoscopic ultrasound–guided needle injection and other therapeutic techniques allow endoscopists to intervene therapeutically. Accurate management of pancreatic cysts depends largely on the accurate identification of mucinous cystic neoplasms. Recent guidelines delineate high-risk stigmata and worrisome features of branch-duct intraductal papillary mucinous neoplasm. We also reviewed less common neoplasms such as pancreatic neuroendocrine tumors and biliary neoplasms.
Dr. Kim is an assistant professor of gastroenterology at Mount Sinai Hospital, acting director of endoscopy, and director of endoscopic ultrasound at Mount Sinai Hospital, New York. This is a summary provided by the moderator of one of the AGA Postgraduate Courses held at DDW 2017.

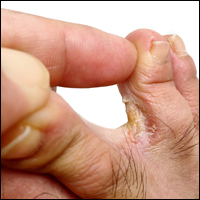
Cosmetic Corner: Dermatologists Weigh in on Athlete’s Foot Products
To improve patient care and outcomes, leading dermatologists offered their recommendations on athlete’s foot products. Consideration must be given to:
- LamisilAT Cream
GlaxoSmithKline plc
“I recommend Lamisil Cream twice daily for 2 to 4 weeks.”— Gary Goldenberg, MD, New York, New York
- LamisilAT Spray
GlaxoSmithKline plc
“This product is effective in treating fungus and allows for easy application with the ability of the spray to reach broad areas of the feet, including within the toe webs.”—Jeannette Graf, MD, New York, New York
- Tinactin Athlete’s Foot Powder Spray
Bayer
“I recommend all my patients with tinea pedis to spray this product in their shoes.”—Gary Goldenberg, MD, New York, New York
- Zeasorb Athlete’s Foot
Stiefel Laboratories, Inc
“I recommend this powder to treat tinea pedis and to prevent recurrences in patients who have been treated for onychomycosis.”—Shari Lipner, MD, PhD, New York, New York
Cutis invites readers to send us their recommendations. Postprocedural makeup, moisturizers for men, and wet skin moisturizer will be featured in upcoming editions of Cosmetic Corner. Please e-mail your recommendation(s) to the Editorial Office.
Disclaimer: Opinions expressed herein do not necessarily reflect those of Cutis or Frontline Medical Communications Inc. and shall not be used for product endorsement purposes. Any reference made to a specific commercial product does not indicate or imply that Cutis or Frontline Medical Communications Inc. endorses, recommends, or favors the product mentioned. No guarantee is given to the effects of recommended products.
Student Hospitalist Scholars: Strengthening research skills
Editor’s Note: The Society of Hospital Medicine’s (SHM’s) Physician in Training Committee launched a scholarship program in 2015 for medical students to help transform health care and revolutionize patient care. The program has been expanded for the 2017-18 year, offering two options for students to receive funding and engage in scholarly work during their 1st, 2nd, and 3rd years of medical school. As a part of the program, recipients are required to write about their experience on a biweekly basis.
I’m always surprised by how much I can learn in a few short weeks. I am now up to full speed with my project studying the utility of bone biopsies in the management of osteomyelitis.
This is a retrospective study, which means I’ll be collecting historical data from patient charts to be used for our analysis. My mentor – Ernie Esquivel, MD – has played an invaluable role in helping me get this project off the ground. He has worked with me on everything from project planning to successfully navigating the ever-confusing institutional review board (IRB) process. He has also provided advice in areas I thought I might actually have more experience, such as data collection and analysis methods.
This form has streamlined the data collection process and will save me a significant amount of time down the road when we have to code the data for statistical analysis programs. After putting in the hard work gathering all of this information, I look forward to beginning the process of analyzing and interpreting our results.
Dr. Esquivel has also helped me improve the value and credibility of this research by encouraging me to present our ideas in front of several groups of people from different departments and specialties. The feedback from these meetings has helped refine our study design and methods while also providing me with the opportunity to improve my communication and presentation skills.
I think such diverse input has helped shape this project into something that will be accessible to a broader audience, and has strengthened my understanding of why our work is important to both clinicians and patients.
Cole Hirschfeld is originally from Phoenix. He received undergraduate degrees in finance and entrepreneurship from the University of Arizona and went on to work in the finance industry for 2 years before deciding to change careers and attend medical school. He is now a 4th year medical student at Cornell University, New York, and plans to apply for residency in internal medicine.
Tips for Living With Bipolar Disorder
Click here to download the PDF. 
Click here to download the PDF.
Click here to download the PDF.

Study Details CTE in Football Players
In a case series of 202 former football players whose brains were donated for research, 87% of the participants had neuropathologic evidence of chronic traumatic encephalopathy (CTE), according to a study published in the July 25 issue of JAMA. Among 111 players who played in the National Football League (NFL), 99% had CTE. A progressive clinical course was common in players with mild and severe CTE pathology. The results suggest that CTE may be related to prior participation in football, the researchers said.

The report by Jesse Mez, MD, MS, Assistant Professor of Neurology at Boston University, and colleagues describes the largest CTE case series to date. A limitation of the study, however, is that brain donation programs are associated with ascertainment bias. Awareness of a possible link between repetitive head trauma and CTE may have motivated players with signs of brain injury and their families to participate in the study. “Therefore, caution must be used in interpreting the high frequency of CTE in this sample, and estimates of prevalence cannot be concluded or implied from this sample,” Dr. Mez and colleagues said.
Findings From a Brain Bank
CTE is a progressive neurodegenerative disease associated with repetitive head trauma. To study the neuropathology and clinical presentation of brain donors with exposure to repetitive head trauma, investigators in 2008 established the Veterans Affairs–Boston University–Concussion Legacy Foundation Brain Bank.
The present study assessed donors who participated in American football at any level of play. Outcomes included neuropathologic diagnoses of neurodegenerative diseases, including CTE; CTE neuropathologic severity; and informant-reported athletic history and clinical presentation.
Investigators conducted retrospective telephone clinical assessments with informants to determine participants’ clinical presentations, including timelines of behavior, mood, and cognitive symptoms. Neither the researchers nor the informants knew the participants’ neuropathology during the interview. Online questionnaires ascertained participants’ athletic and military histories. Pathologists were blinded to exposure data and clinical information.
Level of Play
Among the 202 former football players (median age at death, 66), CTE was neuropathologically diagnosed in 177 players. Participants with CTE had played football for a mean of 15.1 years.
Investigators diagnosed CTE in three of 14 players (21%) whose highest level of play was at the high school level, 48 of 53 players (91%) who played at the college level, nine of 14 players (64%) who played at the semiprofessional level, seven of eight players (88%) who played in the Canadian Football League, and 110 of 111 players (99%) who played in the NFL. Pathologists did not diagnose CTE in two participants whose highest level of play was before high school.
The three players with CTE whose highest level of play was in high school had mild CTE pathology (ie, stage I or II), whereas the majority of former college, semiprofessional, and professional players had severe pathology (ie, stage III or IV).
Among the 111 CTE cases with standardized informant reports on clinical symptoms, a progressive clinical course was reported in 85% of participants with mild CTE pathology and in 100% of participants with severe CTE pathology.
Among the 27 players with mild CTE pathology, 96% had behavioral or mood symptoms or both, 85% had cognitive symptoms, and 33% had signs of dementia. Among the 84 players with severe CTE pathology, 89% had behavioral or mood symptoms or both, 95% had cognitive symptoms, and 85% had signs of dementia.
“Nearly all of the former NFL players in this study had CTE pathology, and this pathology was frequently severe,” Dr. Mez and colleagues said. “These findings suggest that CTE may be related to prior participation in football and that a high level of play may be related to substantial disease burden.”
Future studies should assess how factors such as age at first exposure to football, duration of play, player position, cumulative hits, and linear and rotational acceleration of hits may influence outcomes, the researchers said.
Opportunities for Symptomatic Treatment
The rate of symptomatic CTE may be lower in an unselected population of former football players, said Gil D. Rabinovici, MD, Professor of Neurology at the University of California, San Francisco, in an accompanying editorial.
“The prevalence of cognitive and behavioral symptoms in the autopsy cohort was 88% and 95%, respectively,” he said. “In contrast, questionnaire-based ascertainment of neuropsychiatric symptoms among retired NFL players found that the prevalence of memory symptoms and depression was 5% to 20%. Acknowledging that questionnaires are an insensitive method for detecting neurodegenerative disease, the large discrepancy suggests that the rates of symptomatic CTE may be lower in an unselected cohort of former players.”
In addition, this study and prior studies suggest that there may be opportunities to improve care of patients with CTE. “Potentially treatable contributing factors are found in many patients, including high rates of substance abuse, affective disorders, headaches, and sleep disturbances,” Dr. Rabinovici said. “Thus, at-risk patients may benefit from a multidisciplinary medical team to optimize symptomatic treatment and maximize patient function and quality of life.”
—Jake Remaly
Suggested Reading
Mez J, Daneshvar DH, Kiernan PT, et al. Clinicopathological evaluation of chronic traumatic encephalopathy in players of American football. JAMA. 2017;318(4):360-370.
Rabinovici GD. Advances and gaps in understanding chronic traumatic encephalopathy: From pugilists to American football players. JAMA. 2017;318(4):338-340.
In a case series of 202 former football players whose brains were donated for research, 87% of the participants had neuropathologic evidence of chronic traumatic encephalopathy (CTE), according to a study published in the July 25 issue of JAMA. Among 111 players who played in the National Football League (NFL), 99% had CTE. A progressive clinical course was common in players with mild and severe CTE pathology. The results suggest that CTE may be related to prior participation in football, the researchers said.
The report by Jesse Mez, MD, MS, Assistant Professor of Neurology at Boston University, and colleagues describes the largest CTE case series to date. A limitation of the study, however, is that brain donation programs are associated with ascertainment bias. Awareness of a possible link between repetitive head trauma and CTE may have motivated players with signs of brain injury and their families to participate in the study. “Therefore, caution must be used in interpreting the high frequency of CTE in this sample, and estimates of prevalence cannot be concluded or implied from this sample,” Dr. Mez and colleagues said.
Findings From a Brain Bank
CTE is a progressive neurodegenerative disease associated with repetitive head trauma. To study the neuropathology and clinical presentation of brain donors with exposure to repetitive head trauma, investigators in 2008 established the Veterans Affairs–Boston University–Concussion Legacy Foundation Brain Bank.
The present study assessed donors who participated in American football at any level of play. Outcomes included neuropathologic diagnoses of neurodegenerative diseases, including CTE; CTE neuropathologic severity; and informant-reported athletic history and clinical presentation.
Investigators conducted retrospective telephone clinical assessments with informants to determine participants’ clinical presentations, including timelines of behavior, mood, and cognitive symptoms. Neither the researchers nor the informants knew the participants’ neuropathology during the interview. Online questionnaires ascertained participants’ athletic and military histories. Pathologists were blinded to exposure data and clinical information.
Level of Play
Among the 202 former football players (median age at death, 66), CTE was neuropathologically diagnosed in 177 players. Participants with CTE had played football for a mean of 15.1 years.
Investigators diagnosed CTE in three of 14 players (21%) whose highest level of play was at the high school level, 48 of 53 players (91%) who played at the college level, nine of 14 players (64%) who played at the semiprofessional level, seven of eight players (88%) who played in the Canadian Football League, and 110 of 111 players (99%) who played in the NFL. Pathologists did not diagnose CTE in two participants whose highest level of play was before high school.
The three players with CTE whose highest level of play was in high school had mild CTE pathology (ie, stage I or II), whereas the majority of former college, semiprofessional, and professional players had severe pathology (ie, stage III or IV).
Among the 111 CTE cases with standardized informant reports on clinical symptoms, a progressive clinical course was reported in 85% of participants with mild CTE pathology and in 100% of participants with severe CTE pathology.
Among the 27 players with mild CTE pathology, 96% had behavioral or mood symptoms or both, 85% had cognitive symptoms, and 33% had signs of dementia. Among the 84 players with severe CTE pathology, 89% had behavioral or mood symptoms or both, 95% had cognitive symptoms, and 85% had signs of dementia.
“Nearly all of the former NFL players in this study had CTE pathology, and this pathology was frequently severe,” Dr. Mez and colleagues said. “These findings suggest that CTE may be related to prior participation in football and that a high level of play may be related to substantial disease burden.”
Future studies should assess how factors such as age at first exposure to football, duration of play, player position, cumulative hits, and linear and rotational acceleration of hits may influence outcomes, the researchers said.
Opportunities for Symptomatic Treatment
The rate of symptomatic CTE may be lower in an unselected population of former football players, said Gil D. Rabinovici, MD, Professor of Neurology at the University of California, San Francisco, in an accompanying editorial.
“The prevalence of cognitive and behavioral symptoms in the autopsy cohort was 88% and 95%, respectively,” he said. “In contrast, questionnaire-based ascertainment of neuropsychiatric symptoms among retired NFL players found that the prevalence of memory symptoms and depression was 5% to 20%. Acknowledging that questionnaires are an insensitive method for detecting neurodegenerative disease, the large discrepancy suggests that the rates of symptomatic CTE may be lower in an unselected cohort of former players.”
In addition, this study and prior studies suggest that there may be opportunities to improve care of patients with CTE. “Potentially treatable contributing factors are found in many patients, including high rates of substance abuse, affective disorders, headaches, and sleep disturbances,” Dr. Rabinovici said. “Thus, at-risk patients may benefit from a multidisciplinary medical team to optimize symptomatic treatment and maximize patient function and quality of life.”
—Jake Remaly
Suggested Reading
Mez J, Daneshvar DH, Kiernan PT, et al. Clinicopathological evaluation of chronic traumatic encephalopathy in players of American football. JAMA. 2017;318(4):360-370.
Rabinovici GD. Advances and gaps in understanding chronic traumatic encephalopathy: From pugilists to American football players. JAMA. 2017;318(4):338-340.
More data show value of CBT for PTSD, anxiety, depression
So often in clinical practice, guidelines and directives about psychiatric treatments lag behind the results we see every day in our offices. Such is the case with cognitive-behavioral therapy.
Earlier this summer, the departments of Veterans Affairs and Defense deemed trauma-focused psychotherapies, such as CBT, as first-line treatments for posttraumatic stress disorder over medication management. Was I surprised by these findings? Absolutely not. Likewise, last year, the American College of Physicians released a guideline recommending CBT as first-line treatment for chronic insomnia disorder in adults. Surprising? Again, not in the least.
Pierre Janet, PhD, MD, the French psychiatrist, psychologist, and neurologist, more than a hundred years ago in his L’Automatisme Psychologique, advanced the idea that thoughts can be challenged and that perceptions leading to mental problems can be reversed. Dr. Janet completed his pioneering work, including an exploration of the power of hypnosis, even though the psychoanalytic movement was in full force and many parallel ideas about treating mental disorders were barely recognized.
By the middle of the 20th century, Albert Ellis, PhD, developed rational emotive behavior therapy, which focused on thoughtfully restructuring irrational beliefs into rational ones that led to improved skills and behaviors. A decade later, the great Aaron T. Beck, MD, developed a true form of CBT. Over the years, Dr. Beck went on to develop controlled clinical trials showing CBT to be more effective in treating a variety of psychiatric disorders, including depression, panic attacks, anxiety disorders, obsessive-compulsive disorders, various phobic disorders, and PTSD.
Yet, despite the effectiveness of CBT, too few young psychiatrists and mental health professionals learn how to use it, and fewer appear to practice it. Traditional psychiatric training, by and large, continues to rely on more psychodynamic approaches, which do have value but take longer to get results than does CBT.
Clearly, partnering with patients and helping them learn new constructs can lead to positive results. More and more research shows that CBT is efficacious for patients across many age and demographic groups.
In one randomized, controlled study of 96 Latino patients with depression, for example, researchers at the University of California, Berkeley, found that group CBT administered in a primary care setting led to a significant decrease in depressive symptoms as measured by the Spanish-language version of the Patient Health Questionnaire (PHQ-9) (Cog Behav Prac. 2017 Apr 17; doi: 10.1016/j.cbpra.2017.03.02). Of the 96 patients, 92 completed the PHQ-9 at least once, and 76 completed a baseline measure of the questionnaire on day 1 of group therapy, the researchers reported. At baseline, the average PHQ-9 score was 13.88, which points to the high end of moderate depression, moving toward moderately severe depression. For every week the patients were enrolled in the therapy, PHQ-9 scores fell by 0.15 points.
The spin on CBT that I created – which I call the learning, philosophizing, and action (LPA) technique – helps patients think through problematic issues and come away with new narratives. I developed and used the LPA technique as part of a smoking-cessation program I ran for many years at the New York University Langone Medical Center. In turn, that program developed into a short-term psychotherapy program with a focus on CBT and hypnosis/relaxation techniques.
We need better codification and organization on what kinds of therapies are and are not suited for specific diagnosable problems. It is hoped that a clearer understanding of genetics, laboratory testing, and imaging, as emphasized by the National Institute of Mental Health’s Research Domain Criteria, will better equip us to decide what works best. Again, for now, helping patients learn and relearn new ways of thinking and behaving, as developed through CBT, is among the best treatments available for many mental health problems.
Dr. London, a psychiatrist who practices in New York, developed and ran a short-term psychotherapy program for 20 years at NYU Langone Medical Center and has been writing columns for 35 years. His new book about helping people feel better fast is expected to be published in fall 2017. He has no disclosures.