User login
Statins may protect against HIV rebound
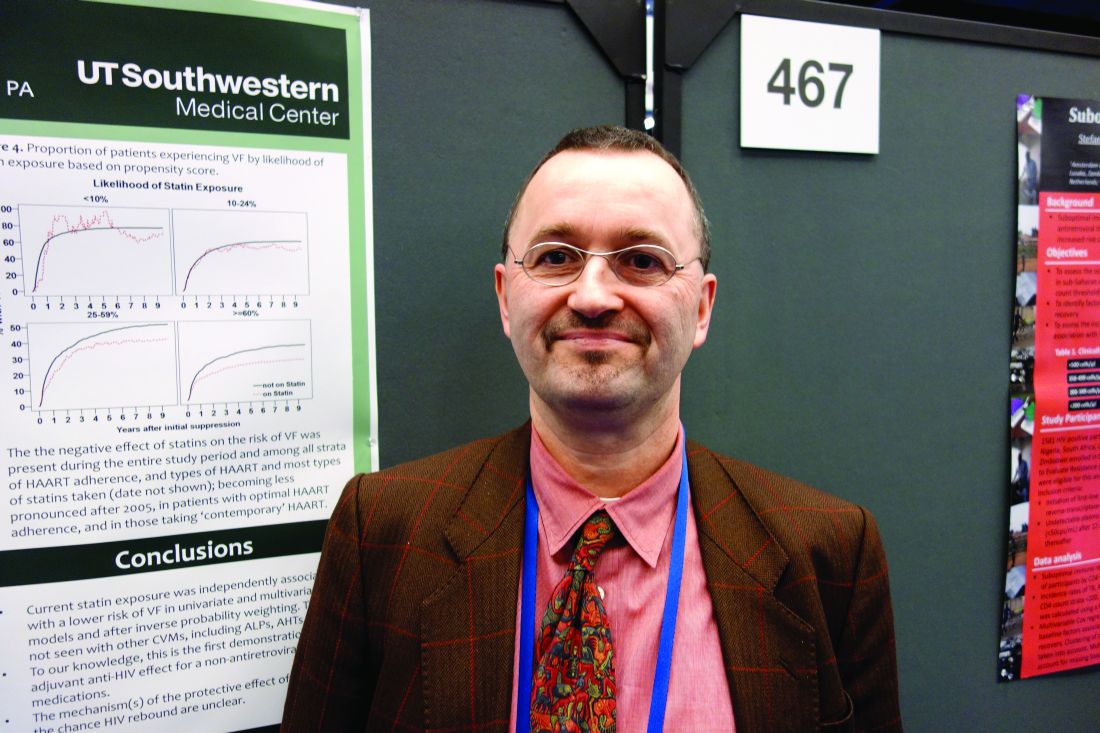
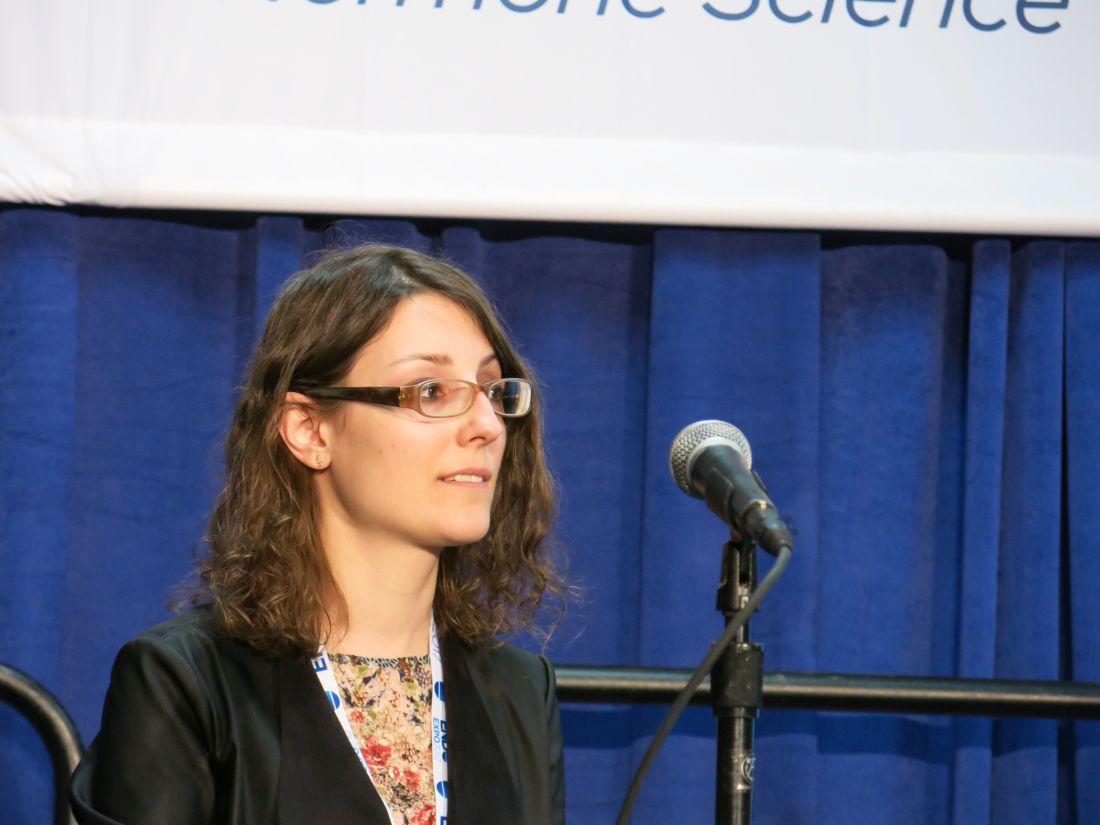
SEATTLE – Statins appeared to reduce the risk of viral rebound in HIV patients on antiretroviral therapy, suggesting modest antiviral activity, according to a review of 19,324 HIV-positive veterans who started combination ART from 1995-2011.
It’s been shown before that statins are active against HIV in vitro; the new study is likely the first to show an effect in actual patients, and it was only found in those who used statins consistently, perhaps because of the drugs’ short half-life. “In addition to their cardiovascular benefits, statins could increase the durability of successful antiretroviral therapy. Whether this effect is direct or mediated by [statins’] anti-inflammatory properties merits further evaluation,” concluded investigators led by Henning Drechsler, MD, an infectious disease specialist at the Dallas Veterans Affairs Medical Center.
After adjusting for a range of confounders, including demographics, substance use, and ART adherence assessed by pharmacy fill records, the team found that statins use within 7 days of testing was associated with almost a 20% drop in the risk of decreased risk of VF (adjusted HR 0.81, 95% 0.75-0.88), with a similar benefit for use within 3 months. There was no protective effect for blood pressure drugs, and a slight increase for patients on cardioprotective aspirin.
About a third of the patients – almost all men, around 48 years old – had at least tried statins, generally after their viral loads were suppressed and most often pravastatin or simvastatin. Statins’ protection against VF was present over the whole study period and among all types of ART and levels, but became less pronounced after 2005 in patients with optimal ART adherence, and in those taking newer options. The median observation time was 5.9 years.
“I am very confident that this is not a data fluke,” Dr. Drechsler said at the 2017 Conference on Retroviruses and Opportunistic Infections. He noted that there may even be role for statin use in HIV patients without dyslipidemia, but with the current study, “it’s hard to say. You really do need a prospect study.”
He plans to keep looking into the issue. Meanwhile, a large trial of statin use in HIV is underway.
Dr. Drechsler said he had no disclosures.
AT CROI 2017
Ebola vaccine maintains immune response after 1 year
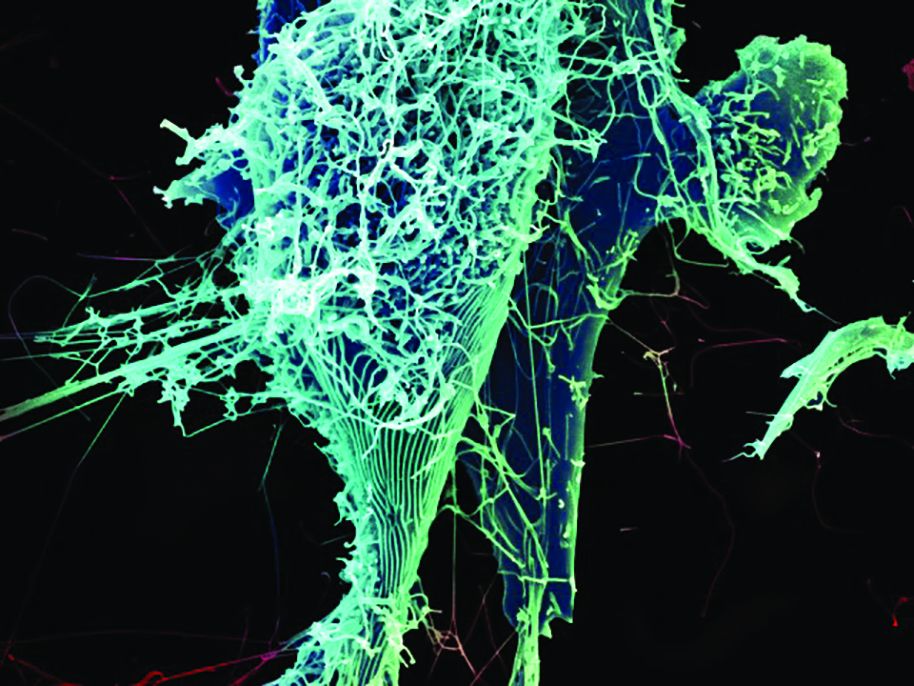
People who received an Ebola virus vaccine maintained immune response one year after vaccination, according to a research letter from Rebecca L.Winslow, MRCGP, of the University of Oxford (UK) and her associates.
The immune response of 64 vaccine recipients of European descent 360 days after receiving either adenovirus type 26 vector vaccine encoding Ebolavirus glycoprotein (Ad26.ZEBOV) followed by modified vaccinia virus Ankara vector vaccine (MVA-BN-Filo), or MVA-BN-Filo followed by Ad26.ZEBOV. The 360 day follow-up occurred 120 days after the previous follow-up, during which time no significant adverse events were reported.
“Immune responses may differ in a sub-Saharan African population; these vaccine candidates are being assessed in this region. Additional research is also warranted to explore the persistence of immunity beyond 1 year following immunization and response to booster doses of vaccine,” the investigators concluded.
Find the full research letter in JAMA (doi: 10.1001/jama.2016.20644)
FROM JAMA
Temozolomide may help half of patients with aggressive pituitary tumors
ORLANDO – Temozolomide, an alkylating agent approved for glioblastoma, improved long-term survival in about half of patients who took it for aggressive pituitary tumors, a retrospective study has determined.
The study, conducted by members of the French Society of Endocrinology, comprised 43 patients. Of the 51% who responded to the treatment, the median overall survival time was 44 months, compared to just 16 months for patients who didn’t respond, Gérald Raverot, MD, said at the annual meeting of the Endocrine Society.
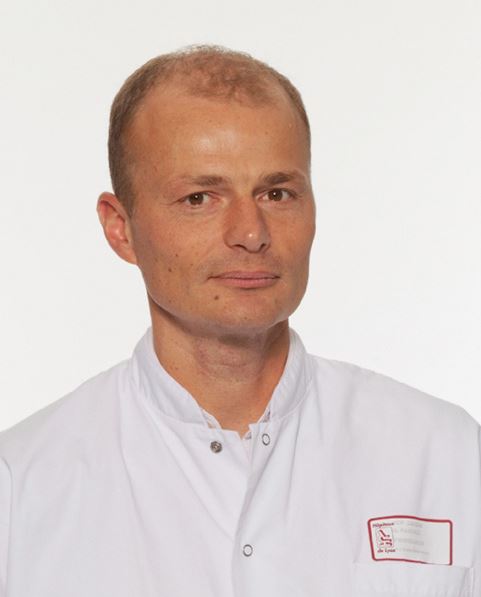
“Despite the very good response we saw in some patients, we also saw a high risk of recurrence, with a median of about 30 months,” for relapse, he noted. “And a second course of temozolomide always failed.”
When used for aggressive pituitary tumors, temozolomide is usually given in a conventional scheme of up to 12 cycles. It’s typically reserved for tumors that have responded poorly to other treatment regimens, Dr. Raverot said.
The drug has not been widely studied in patients with aggressive pituitary tumors, although there have been a number of case reports suggesting that can be beneficial. Data on about 90 patients have been published. The largest series to date appeared in 2015 and comprised 24 patients. It found about a 50% response rate to the drug. Two patients had a complete regression and seven patients had a partial regression of tumor mass. Tumor mass shrunk to less than 30% in three patients, less than 50% in three, and less than 75% in one.
Because of both the promise temozolomide shows in these very tough cases, and the paucity of descriptive and clinical data, Dr. Raverot and his colleagues conducted a multi-center study that spanned 21 facilities in France and comprised 43 patients who were treated from 2006-2016. The intent was to evaluate efficacy at the end of treatment, or at last follow-up in the case of those who were still being treated. Tumor response was defined as a decrease of more than 30% in the largest tumor diameter; hormonal response was more than a 50% decrease in baseline hormone levels. The endpoint was overall survival and relapse-free survival.
Of the 43 patients, 29 were men. The group’s mean age at diagnosis was 43 years, and the mean age at temozolomide treatment, 53 years. Fourteen of the tumors were carcinomas and 12 were silent or initially silent.
About half of the tumors (23) were adrenocorticotropic hormone-producing. Other tumor types were prolactin-secreting (13) and growth hormone-secreting (3); an additional three tumors secreted both prolactin and growth hormone.
Most patients (36) underwent a typical temozolomide protocol. This consisted of at least one 5-day cycle of 150 mg/m2/day every 28 days, followed by 250 mg/m2/day thereafter. The median number of cycles was 6.5, but this ranged from 1-24 cycles.
Six patients were treated according to the Stupp protocol for temozolomide in glioblastoma. This consists of daily temozolomide 75 mg/m2 with concomitant radiotherapy for 6 weeks, followed by a standard temozolomide protocol. Four patients underwent 6 cycles; one patient 12 cycles, and one patient, 17 cycles.
An additional four patients had concomitant radiotherapy within 4 months of their temozolomide treatment.
The overall response rate was 51% (22 patients). Dr. Raverot attempted to identify clinical characteristics predictive of response. There was no association with gender, age at diagnosis or age at temozolomide treatment, tumor type, whether or not the tumor was a carcinoma, or what type of hormone it secreted. Nor was there a response associated with hypermethylation of the O6-methylguanine-DNA-methyltransferase (MGMT) gene.
Dr. Raverot found only one positive association with response. Tumors that were silent or initially silent (12) were much less likely to respond than secreting tumors. Of the 21 nonresponsive tumors, 10 were silent (45%). Of the 22 responsive tumors, only 2 were silent (9%).
Dr. Raverot also analyzed response by protocol and found intriguing results. Of the 10 patients who had concomitant radiotherapy, seven responded and three did not. Patients who underwent the Stupp protocol also tended to do better, he said. “Of the six who had this, five responded, so this is interesting.”
However, he cautioned, both of these positive associations are based on such small numbers that it’s impossible to draw firm conclusions.
Dr. Raverot had survival data on 38 patients with a median follow-up of 16 months after the end of treatment. Of these, 20 were responders and 18 were non-responders. Death had occurred in 13 of the nonresponders and five responders.
Of the 20 responders, 10 were still controlled at the time of last follow-up, and 10 had relapsed at a median of 5 months after treatment cessation. Five of these patients had a second course of temozolomide, but none of them responded to it, Dr. Raverot said. Three of these patients have died and two are still living.
“We looked at other salvage treatments for them, but none of these therapies could control the disease. Unfortunately, we just don’t have good treatment options for these patients. And even among those with good treatment response, there is a risk of early recurrence, with a median time of 30 months to relapse. The second course of temozolomide always fails. So we have now some questions about who we should maintain on treatment. We don’t have this answered yet, and we need to.”
Dr. Raverot had no financial disclosures.
[email protected]
On Twitter @Alz_gal
ORLANDO – Temozolomide, an alkylating agent approved for glioblastoma, improved long-term survival in about half of patients who took it for aggressive pituitary tumors, a retrospective study has determined.
The study, conducted by members of the French Society of Endocrinology, comprised 43 patients. Of the 51% who responded to the treatment, the median overall survival time was 44 months, compared to just 16 months for patients who didn’t respond, Gérald Raverot, MD, said at the annual meeting of the Endocrine Society.
“Despite the very good response we saw in some patients, we also saw a high risk of recurrence, with a median of about 30 months,” for relapse, he noted. “And a second course of temozolomide always failed.”
When used for aggressive pituitary tumors, temozolomide is usually given in a conventional scheme of up to 12 cycles. It’s typically reserved for tumors that have responded poorly to other treatment regimens, Dr. Raverot said.
The drug has not been widely studied in patients with aggressive pituitary tumors, although there have been a number of case reports suggesting that can be beneficial. Data on about 90 patients have been published. The largest series to date appeared in 2015 and comprised 24 patients. It found about a 50% response rate to the drug. Two patients had a complete regression and seven patients had a partial regression of tumor mass. Tumor mass shrunk to less than 30% in three patients, less than 50% in three, and less than 75% in one.
Because of both the promise temozolomide shows in these very tough cases, and the paucity of descriptive and clinical data, Dr. Raverot and his colleagues conducted a multi-center study that spanned 21 facilities in France and comprised 43 patients who were treated from 2006-2016. The intent was to evaluate efficacy at the end of treatment, or at last follow-up in the case of those who were still being treated. Tumor response was defined as a decrease of more than 30% in the largest tumor diameter; hormonal response was more than a 50% decrease in baseline hormone levels. The endpoint was overall survival and relapse-free survival.
Of the 43 patients, 29 were men. The group’s mean age at diagnosis was 43 years, and the mean age at temozolomide treatment, 53 years. Fourteen of the tumors were carcinomas and 12 were silent or initially silent.
About half of the tumors (23) were adrenocorticotropic hormone-producing. Other tumor types were prolactin-secreting (13) and growth hormone-secreting (3); an additional three tumors secreted both prolactin and growth hormone.
Most patients (36) underwent a typical temozolomide protocol. This consisted of at least one 5-day cycle of 150 mg/m2/day every 28 days, followed by 250 mg/m2/day thereafter. The median number of cycles was 6.5, but this ranged from 1-24 cycles.
Six patients were treated according to the Stupp protocol for temozolomide in glioblastoma. This consists of daily temozolomide 75 mg/m2 with concomitant radiotherapy for 6 weeks, followed by a standard temozolomide protocol. Four patients underwent 6 cycles; one patient 12 cycles, and one patient, 17 cycles.
An additional four patients had concomitant radiotherapy within 4 months of their temozolomide treatment.
The overall response rate was 51% (22 patients). Dr. Raverot attempted to identify clinical characteristics predictive of response. There was no association with gender, age at diagnosis or age at temozolomide treatment, tumor type, whether or not the tumor was a carcinoma, or what type of hormone it secreted. Nor was there a response associated with hypermethylation of the O6-methylguanine-DNA-methyltransferase (MGMT) gene.
Dr. Raverot found only one positive association with response. Tumors that were silent or initially silent (12) were much less likely to respond than secreting tumors. Of the 21 nonresponsive tumors, 10 were silent (45%). Of the 22 responsive tumors, only 2 were silent (9%).
Dr. Raverot also analyzed response by protocol and found intriguing results. Of the 10 patients who had concomitant radiotherapy, seven responded and three did not. Patients who underwent the Stupp protocol also tended to do better, he said. “Of the six who had this, five responded, so this is interesting.”
However, he cautioned, both of these positive associations are based on such small numbers that it’s impossible to draw firm conclusions.
Dr. Raverot had survival data on 38 patients with a median follow-up of 16 months after the end of treatment. Of these, 20 were responders and 18 were non-responders. Death had occurred in 13 of the nonresponders and five responders.
Of the 20 responders, 10 were still controlled at the time of last follow-up, and 10 had relapsed at a median of 5 months after treatment cessation. Five of these patients had a second course of temozolomide, but none of them responded to it, Dr. Raverot said. Three of these patients have died and two are still living.
“We looked at other salvage treatments for them, but none of these therapies could control the disease. Unfortunately, we just don’t have good treatment options for these patients. And even among those with good treatment response, there is a risk of early recurrence, with a median time of 30 months to relapse. The second course of temozolomide always fails. So we have now some questions about who we should maintain on treatment. We don’t have this answered yet, and we need to.”
Dr. Raverot had no financial disclosures.
[email protected]
On Twitter @Alz_gal
AT ENDO 2017
Key clinical point:
Major finding: Of the 51% who responded to the treatment, the median overall survival time was 44 months, compared to just 16 months for patients who didn’t respond.
Data source: The retrospective study comprised 43 patients treated in France.
Disclosures: Dr. Raverot had no financial disclosures.
Thyroid cancer incidence: It’s not all good news
ORLANDO – The incidence of thyroid cancer in the United States between 2000-2013 has dropped in whites while increasing in blacks and Hispanics, Anupam Kotwal, MBBS, said during a press briefing at the annual meeting of the Endocrine Society.
Other recently reported data have shown a steady gradual incidence in thyroid cancer between 1974-2013 (JAMA. 2017 Mar 31. doi:10.1001/jama.2017.2719).
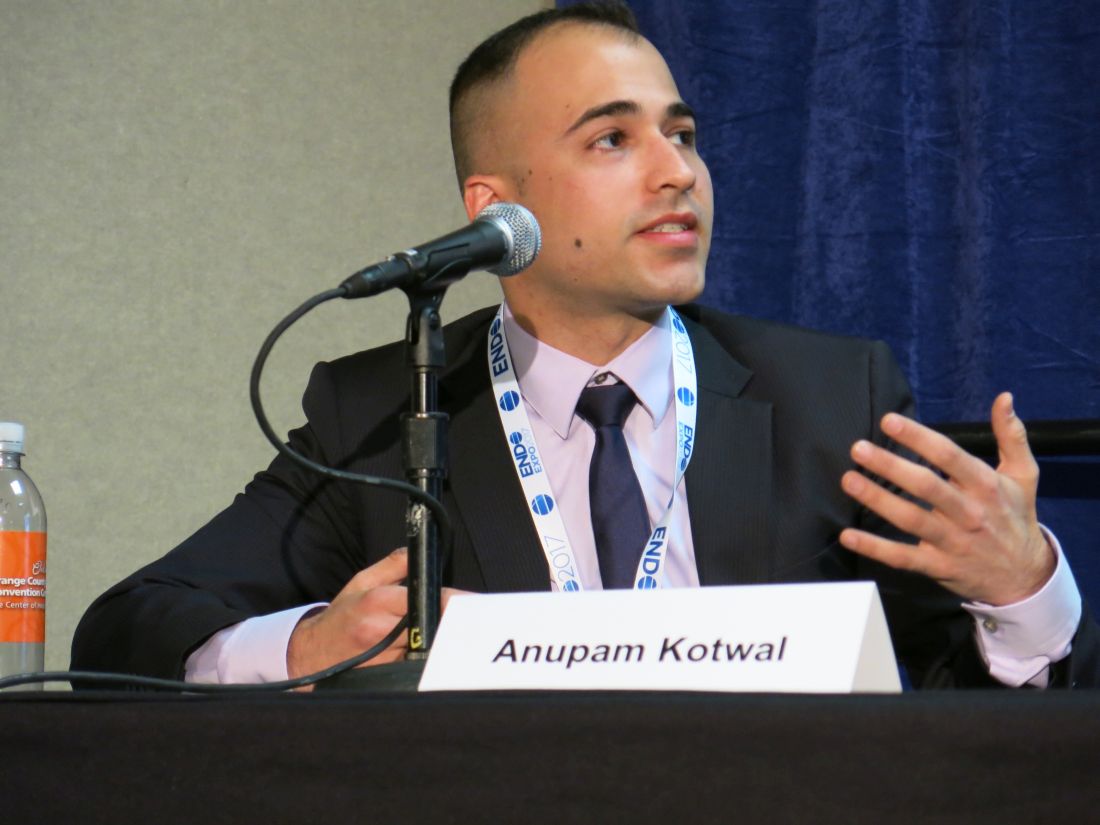
From 2000 to 2013, the incidence of thyroid cancer as a whole increased from 7.4 to 14.5 cases per 100,000 population with an annual percent increase of 6.7% from 2000-2009 (P less than .05) and 2.4% from 2010 to 2013 (P less than .05). In Hispanics and African-Americans, thyroid cancer incidence has continuously increased, with an annual percent increase of 4.7% (P less than .05) and 5.1% (P less than .05) respectively, whereas for non-Hispanic whites, the annual percent increase decelerated from 7.1% (P less than .05) before 2009 to 2.2% after 2009.
Looking at changes to incidence by age, non-Hispanic white women over the age of 75 are the only ones to see a decrease, from 6.5 cases per 100,000 in 2010 to 2.4 cases per 100,000 population in 2014. The investigations reported the same acceleration of incidence among everyone under the age of 20 years.
These findings are consistent with recent reports demonstrating that thyroid cancer is the 2nd most common cancer among Hispanic females, female adolescents and young adults.
Dr. Kotwal reported that he had no relevant conflicts of interest.
ORLANDO – The incidence of thyroid cancer in the United States between 2000-2013 has dropped in whites while increasing in blacks and Hispanics, Anupam Kotwal, MBBS, said during a press briefing at the annual meeting of the Endocrine Society.
Other recently reported data have shown a steady gradual incidence in thyroid cancer between 1974-2013 (JAMA. 2017 Mar 31. doi:10.1001/jama.2017.2719).
From 2000 to 2013, the incidence of thyroid cancer as a whole increased from 7.4 to 14.5 cases per 100,000 population with an annual percent increase of 6.7% from 2000-2009 (P less than .05) and 2.4% from 2010 to 2013 (P less than .05). In Hispanics and African-Americans, thyroid cancer incidence has continuously increased, with an annual percent increase of 4.7% (P less than .05) and 5.1% (P less than .05) respectively, whereas for non-Hispanic whites, the annual percent increase decelerated from 7.1% (P less than .05) before 2009 to 2.2% after 2009.
Looking at changes to incidence by age, non-Hispanic white women over the age of 75 are the only ones to see a decrease, from 6.5 cases per 100,000 in 2010 to 2.4 cases per 100,000 population in 2014. The investigations reported the same acceleration of incidence among everyone under the age of 20 years.
These findings are consistent with recent reports demonstrating that thyroid cancer is the 2nd most common cancer among Hispanic females, female adolescents and young adults.
Dr. Kotwal reported that he had no relevant conflicts of interest.
AT ENDO 2017
Key clinical point:
Major finding: The incidence of thyroid cancer has dropped from 7 cases per 100,000 in 2000 to 2.2 cases per 100,000 in 2013 among whites. Among blacks it has increased from 5 cases to 7 cases per 100,000 over that time frame and in Hispanics from 7 cases to 12 cases per 100,000.
Data source: Data from the National Cancer Institute’s Surveillance, Epidemiology, and End Results data base.
Disclosures: The study received no external funding. Dr. Kotwal reported he had no relevant financial conflicts of interest.
Rotterdam Study: High T4 levels increased the risk for atherosclerotic events, death
ORLANDO – Elevated serum levels of free T4 are associated with a greater risk of atherosclerotic events and, in some cases, death, among adults in their 60s, Arjola Bano, MD, said at a press briefing at the annual meeting of the Endocrine Society.
Earlier research has shown that high FT4 levels are associated with a greater likelihood of development of atherosclerosis. But no one has looked beyond that to see if an excess of FT4 can change the course of the disease.
The investigators used electron beam computed tomography to measure coronary artery calcification. Confounders such as age, sex, smoking, alcohol intake, body mass index, total cholesterol, triglycerides, systolic blood pressure, diabetes, and use of anti-hypertension or lipid lowering medications were controlled for using multivariable-adjusted Cox proportional and logistic regression models.
Dr. Bano reported that during a median follow-up of 8.8 years (range, 4.5-11.8 years), there were 580 ASCV deaths and 1,130 first-time hard ASCV events. The risk of ASCV mortality increased with higher FT4 levels (hazard ratio, 2.35; 95% confidence interval, 1.61-3.41 per 1 ng/dL) and lower TSH levels (HR, 0.92; 95% CI, 0.84-1.00/1 logTSH), predominantly among participants with prevalent ASCV disease (HR, 5.76; 95% CI, 2.79-11.89 for FT4; HR, 0.81; 95% CI, 0.69-0.95 for TSH).
In addition, higher FT4 levels were associated with higher risk of first-time hard ASCV event (HR, 1.87; 95% CI, 1.34-2.59). Also, FT4 levels were positively associated with having a high CAC score (OR, 2.34; 95% CI, 1.36-4.04).
It is noteworthy that results remained similar after restricting the analyses to participants with thyroid function within reference ranges, she stressed.
How to explain these findings? These data suggest that the link between thyroid function and atherosclerosis is mediated through yet unexplored cardiovascular risk factors or via alternative pathways.
Dr. Bano and her associates all report that they have no relevant financial conflicts of interest.
AT ENDO 2017
Key clinical point: Major finding: The odds of an atherosclerotic event were 2.28 times higher in adults with elevated FT4 levels than those with high TSH, even when the high levels were still within the normal range.
Data source: Prospective study of 9,231 adults followed over 8.8 years.
Disclosures: Dr. Bano and her associates all report that they have no relevant financial conflicts of interest.
Assay intended to aid PV diagnosis cleared for use in US

The US Food and Drug Administration has granted 510(k) clearance for QIAGEN’s ipsogen® JAK2 RGQ PCR Kit (ipsogen JAK2 assay), and the company has launched the assay in the US.
The ipsogen JAK2 assay is designed to detect the JAK2 V617F/G1849T allele in genomic DNA extracted from EDTA whole blood.
The assay is intended for use in conjunction with other clinicopathological factors to aid the diagnosis of polycythemia vera (PV).
The test does not detect less common mutations associated with PV, including mutations in exon 12, and is not intended for stand-alone diagnosis of PV.
The ipsogen JAK2 assay is a real-time polymerase chain reaction test performed on the QIAGEN Rotor-Gene Q MDx instrument.
Researchers evaluated the utility of the ipsogen JAK2 assay for PV diagnosis in a prospective trial enrolling more than 200 subjects.
Data from this trial have not been published. However, according to QIAGEN, the assay provided 94.6% sensitivity and 98.1% specificity, together with a 100% positive percentage agreement and a 99.4% negative percentage agreement to bi-directional sequencing.
QIAGEN said these results suggest the ipsogen JAK2 assay enables detection of PV in the majority of subjects with the disease and helps rule out PV in the majority of individuals without it.
“We are pleased to be able to offer our ipsogen JAK2 assay, which is already available in Europe and other markets, for use in the United States and make it easier for hematologists and oncologists to follow recommended diagnostic testing algorithms and international guidelines for suspected PV patients,” said Thierry Bernard, senior vice president and head of QIAGEN’s Molecular Diagnostics Business Area. ![]()
Degrees of Distinction
Thank you for stating that ARNPs “do not need physician endorsement for the advanced component” of their practice. ARNPs need to be responsible for themselves. In California, NPs are given a certificate, not a license, and operate under the rules of the state board of nursing and the board of business and professional codes. We must act in a prudent and competent manner. I think this has been demonstrated where full practice authority is in force.
The American Medical Association (AMA) and American Academy of Family Physicians (AAFP), which still want “supervision, collaboration, or participating” designations for PAs and NPs, have tripped on their own stethoscopes on this issue. In trying to suppress advanced practice providers, they have helped create a provider shortage. Many NPs will not work in a state that has practice limitations.
In Humboldt County, California, family practice doctors are so overworked due to provider shortages that they are leaving the area. Enter locum tenens to fill the gap. But at a point, there is no benefit to being in such demand. The cost of health care has risen, and patients are unhappy with the care they receive. New patients cannot see doctors in a timely manner; when they are finally seen, they have a few minutes to share their concerns with the provider, who rarely sits down or looks away from the computer screen to make eye contact with them.
We are already seeing the push for advanced education for our NPs and PAs. We have witnessed the changeover to NP programs that culminate in a doctorate (not a master’s) degree. By 2021, PA programs will be required to be master’s level; although the process has started, there are still a few holdouts. But I consider Washington State to be a front-runner in this area.
This, for me, is the area we need to address: degree designation and equivalency. Rather than give “diplomat” or similar status to someone whose base degree is an associate’s, a better idea—and one more palatable to AMA and AAFP—might be to bring everyone to at least a master’s level. For example, the Academy of Integrative Pain Management (AIPM) gives “Fellow” designation to those with master’s preparation who successfully pass AIPM’s examination, and “Diplomat” status to doctorate-prepared practitioners who have also passed the exam.
At the end of the day, many patients prefer to see a PA or NP rather than a medical doctor. Yes, patients care about credentials—but they care more about their provider being respectful, listening, remembering their history, connecting the history from their previous provider, and offering the proper treatment for the correct diagnosis.
Jan Morgan, MS, ARNP
Fellow, Academy of Integrative Pain Management
Eureka, California
You’re a PA? Sorry, Not Eligible for This Job
Thank you for your thoughtful commentary on the pertinent topic of full practice authority for PAs (2017;27[2]:12-14). In more than 30 years as a PA, I have rarely regretted my career choice. In 1982, when I was planning my career path, I chose to become a PA instead of an NP because I didn’t want to further my nursing training (I was already an LPN) to advance my practice, and my impression was that PAs and NPs were equivalent in the workforce. This perception held true until the past few years; I have lost job opportunities specifically because the employer didn’t want to deal with the administrative details of PA supervisory requirements here in Colorado. I find this frustrating, as well as perplexing.
Although I’ve become more comfortable with autonomy throughout my years of practice, I’ve always reserved the right to consult when necessary and appropriate, based on my own judgment and comfort level. I certainly wouldn’t mind more relaxed supervision, but I wouldn’t want to be cut entirely loose, either. On the other hand, I resent being ineligible for job opportunities simply for administrative reasons. While this is surely misguided on the part of the employers, it is a reality that practitioners encounter.
I learned recently—to my astonishment—that my NP colleagues pay about a tenth of what I do for malpractice insurance. Apparently the underwriters (and/or the plaintiffs) haven’t caught up with the nuances of responsibility and autonomy! From my perspective, PAs and NPs have more in common in the practice setting than NPs and RNs do. The fact that NPs are governed by nursing boards and insured as nurses is more an antiquated accident than a reflection of function in the workforce.
Ideally, there should be a governing body dedicated to the entire spectrum of nonphysician providers who are qualified to diagnose, treat, and prescribe. Since that is not likely to happen, it is our responsibility as PAs to match NPs in the marketplace while maintaining our integrity as providers.
Elizabeth Upper, PA-C
Denver, Colorado
Milk interferes with levothyroxine absorption
ORLANDO – Consuming milk and levothyroxine at the same time reduced the absorption of the thyroid hormone replacement, according to Deborah Chon, MD, speaking at a press briefing at the annual meeting of the Endocrine Society.
This finding comes from a small study of 10 healthy adults with normal TSH concentration at baseline. The study participants had a mean age of 34 years and 6 were men.
The total serum T4 absorption over 6 hours, calculated as area under the curve, was significantly lower when participants took levothyroxine and milk concurrently, compared with taking it alone (67.26 vs. 73.48; P equals .02).
The best interval between taking levothyroxine and drinking milk has yet to be established, according to Dr. Chon, who is on the faculty of the University of California, Los Angeles. Findings from earlier research showed that use of elemental calcium supplements interfere with absorption of levothyroxine.
In 2014, levothyroxine became the most commonly prescribed drug in the United States, according to a survey by the IMS Institute for Healthcare Informatics, now QuintilesIMS. Patients who need to take it because of Hashimoto’s thyroiditis or after thyroidectomy are often unhappy with how they feel. Dose adjustments are common as endocrinologists struggle to improve patients’ quality of life. It may be that a simple strategy of not taking the thyroid replacement at the same time as milk might leave patients feeling better.
Dr. Chon reported having no relevant financial conflicts of interest.
This article was updated 4/10/17.
AT ENDO 2017
Key clinical point:
Major finding: Calculated as an area under the curve, simultaneous consumption of levothyroxine and milk reduced absorption of the supplement by a mean of 67.26 vs. 73.48 when taken without milk.
Data source: A pharmacokinetic study of 10 healthy subjects.
Disclosures: Dr. Chon reported having no relevant conflicts of interest.
From the Vascular Community
In memoriam: Edward B. Diethrich
Edward B. Diethrich, MD, the world-renowned cardiovascular/endovascular surgeon, inventor, and philanthropist, succumbed after a brave fight with a brain tumor on February 23, 2017, at the age of 81.
Dr. Diethrich was a pioneer in noninvasive cardiovascular and vascular disease diagnosis and innovative in surgical and endovascular therapy. He obtained his undergraduate and medical degrees at the University of Michigan and completed his surgical residency at St. Joseph’s Mercy Hospital in Ann Arbor and the Henry Ford Hospital in Detroit. He went on to complete his cardiovascular surgery training under Michael DeBakey at the Baylor College of Medicine in Houston, where he played an important role in the development of human heart transplantation.
One of his first accomplishments was the invention of the sternal saw in 1962, which is still used today for open-chest surgery. He also contributed to the development of a preservation chamber for heart transplantation and established one of the first ultrasound companies. Dr. Diethrich spent a lifetime developing new technologies, from a bubble oxygenator for open-heart surgery to developing and manufacturing stent grafts for aortic aneurysms. He remained actively involved in advancing the practice of vascular surgery and keeping it up-to-date with the changing times: He founded a company that develops and manufactures endoluminal grafts, established a Translational Research Center that is dedicated to clinical research and developing new technologies, and started a company devoted to the prevention and management of cardiovascular disease. His contributions to surgical education are also legendary. He organized an annual meeting that attracted physicians from all over the world and show-cased state-of-the-art techniques and innovations. He authored over 400 scientific articles, several textbooks, and lay publications and produced hundreds of educational videos and films. In fact, he organized the first live international telecast of open-heart surgery. Above all, Dr. Diethrich trained several hundred surgeons and other specialists in cardiovascular surgery and endovascular techniques, and traveled the world to demonstrate his techniques and teach local physicians. He recently endowed the Edward B. Diethrich Research Professorship in Biomedical Engineering and Vascular Surgery at the University of Michigan to recognize the collaboration that is required between surgeons and engineers.
Dr. Diethrich has received several honors, such as the Frederick A. Coller Award; Presidency of the Denton A. Cooley Cardiovascular Surgical Society; the Medal for Innovation in Vascular Surgery from the Society for Vascular Surgery; the Medal of Independence from King Hussein of Jordan; and an honorary fellowship from the Royal College of Surgeons, Glasgow. The Edward B. Diethrich Vascular Surgical Society was established by several hundred of his trainees. I was honored to serve as the first President of that society.
It’s ironic that Dr. Diethrich was an early supporter of ceiling-mounted radiographic equipment, which is essential to endovascular interventions. Even with the most advanced radiation protection, Dr. Diethrich paid the ultimate price for his nearly daily exposure to radiation, which led to his 4-year battle with glioma, and, ultimately, his death. But true to form, he even used this unfortunate illness to educate others by working with the Organization for Occupational Radiation Safety in Interventional Fluoroscopy to produce a documentary on the ill effects of radiation.
Dr. Diethrich recently completed his memoirs (SLED: The Serendipitous Life of Edward Diethrich), which recounts his extraordinary 50-year career, from his early days of working and training with the world’s most renowned surgeons to his legendary international success as a cardiovascular surgeon and innovator.
In summary, Dr. Diethrich was a multifaceted, passionate, and charismatic man: a sportsman, musician, scientist, inventor, author, film producer, media personality, along with many others. His confidence, dexterity, and technical expertise were evident in both the operating room and the endovascular suite. Dr. Diethrich was a world-renowned leader and pioneer in Vascular Surgery. He was an eloquent speaker, prolific innovative scholar, and dedicated teacher. His energy was endless, and his manners were impeccable. He will be sorely missed, but his legendary contributions to medicine/vascular surgery, his trainees, and the many people he influenced will live on.
Dr. Diethrich is survived by his wife of 61 years, Gloria; daughter Lynne; son Tad; son-in-law Joe Jackson; daughter-in-law Terri Diethrich, and grandchildren Danielle Diethrich-Vargas, Courtney, Reese, and Trey Diethrich; Mackenzie, Tatum, Peyton, and Zack Jackson.
A celebration of his life will be planned in the near future. Details will be posted at drteddiethrich.com.