User login
Tertiary center repeat CT scans find additional trauma injuries
HOLLYWOOD, FLA. – Imaging obtained at nontertiary trauma centers probably doesn’t tell the whole story of a trauma patent’s injuries, according to a new retrospective study.
Repeat scans done at a Level 1 trauma center identified new injuries in 76% of patients who were transferred, Morgan Bonds, MD, reported at the annual scientific assembly of the Eastern Association for the Surgery of Trauma. About half of these previously unobserved injuries were considered clinically significant, said Dr. Bonds, a surgical resident at the University of Oklahoma, Oklahoma City.
Her study examined imaging and clinical assessment of 203 trauma patients who were initially worked up at a nontertiary trauma center (NTC), and then transferred to the Level 1 University of Oklahoma tertiary trauma Center (TTC). The facility’s primary radiologist reviewed all of the initial CT scans while blinded to the NTC interpretation. The initial scans and interpretations were then compared with those done at the TTC.

The team split imaging and interpretation disconnects into four categories:
• Type A errors: A missed injury on the NTC scan. “This represents the expertise and experience of our primary radiologist,” Dr. Bonds said.
• Type B errors: Missed injuries on scans where NTC radiologists saw other injuries that the TTC radiologist did not confirm. “This represents the experience of our radiologist and also the inexperience and overreaction of the NTC radiologists.
• Type C errors: New injuries seen on additional TTC imaging of the same body area. “This represents the quality of the image.”
• Type D errors: New injuries found upon any new imaging, whether of a previously scanned or newly scanned body area. “This represents quality of work-up – the decision of the trauma team to more fully investigate the patient’s injuries, as well as the quality of the CT tech performing the scan.”
During the study period, 203 patients presented at the TTC with prior scans conducted at an NTC.
The mean age of the patients was 43 years; most (67%) were men. The mean Injury Severity Score was 16; 97% had experienced blunt trauma. Shock was present in 3% and a traumatic brain injury in 8%. Repeat scans were most common for neck and cervical spine injuries (54%) and thoracic/lumbar spine injuries (53%) and least common for chest injuries (32%).
An inadequate NTC work-up as judged by the TTC attending was the most common reason for getting new images (76%). Poor image quality was the next most common reason (31%).
Among the 203 patients, 99 (49%) had a type A error. Of these injuries missed on the initial scan, 90% were considered to be clinically significant.
Type B errors occurred in 15% of patients.
Type C errors (new injuries in different body area) occurred in 54% of patients and, of these, 76% were considered clinically significant. Type D errors (new injuries seen in any imaging of any area) occurred in 73% of patients.
“This study confirms that images are often repeated or completed after having images done at nontertiary trauma centers,” Dr. Bonds said. “Relying on NTC image interpretation can lead to undertreating our patients. One potential solution to this issue could be image sharing between NTCs and TTCs. This might reduce both the rate of missed injuries and the need for repeat scans.”
Dr. Bonds had no financial disclosures.
On Twitter @Alz_Gal
HOLLYWOOD, FLA. – Imaging obtained at nontertiary trauma centers probably doesn’t tell the whole story of a trauma patent’s injuries, according to a new retrospective study.
Repeat scans done at a Level 1 trauma center identified new injuries in 76% of patients who were transferred, Morgan Bonds, MD, reported at the annual scientific assembly of the Eastern Association for the Surgery of Trauma. About half of these previously unobserved injuries were considered clinically significant, said Dr. Bonds, a surgical resident at the University of Oklahoma, Oklahoma City.
Her study examined imaging and clinical assessment of 203 trauma patients who were initially worked up at a nontertiary trauma center (NTC), and then transferred to the Level 1 University of Oklahoma tertiary trauma Center (TTC). The facility’s primary radiologist reviewed all of the initial CT scans while blinded to the NTC interpretation. The initial scans and interpretations were then compared with those done at the TTC.
The team split imaging and interpretation disconnects into four categories:
• Type A errors: A missed injury on the NTC scan. “This represents the expertise and experience of our primary radiologist,” Dr. Bonds said.
• Type B errors: Missed injuries on scans where NTC radiologists saw other injuries that the TTC radiologist did not confirm. “This represents the experience of our radiologist and also the inexperience and overreaction of the NTC radiologists.
• Type C errors: New injuries seen on additional TTC imaging of the same body area. “This represents the quality of the image.”
• Type D errors: New injuries found upon any new imaging, whether of a previously scanned or newly scanned body area. “This represents quality of work-up – the decision of the trauma team to more fully investigate the patient’s injuries, as well as the quality of the CT tech performing the scan.”
During the study period, 203 patients presented at the TTC with prior scans conducted at an NTC.
The mean age of the patients was 43 years; most (67%) were men. The mean Injury Severity Score was 16; 97% had experienced blunt trauma. Shock was present in 3% and a traumatic brain injury in 8%. Repeat scans were most common for neck and cervical spine injuries (54%) and thoracic/lumbar spine injuries (53%) and least common for chest injuries (32%).
An inadequate NTC work-up as judged by the TTC attending was the most common reason for getting new images (76%). Poor image quality was the next most common reason (31%).
Among the 203 patients, 99 (49%) had a type A error. Of these injuries missed on the initial scan, 90% were considered to be clinically significant.
Type B errors occurred in 15% of patients.
Type C errors (new injuries in different body area) occurred in 54% of patients and, of these, 76% were considered clinically significant. Type D errors (new injuries seen in any imaging of any area) occurred in 73% of patients.
“This study confirms that images are often repeated or completed after having images done at nontertiary trauma centers,” Dr. Bonds said. “Relying on NTC image interpretation can lead to undertreating our patients. One potential solution to this issue could be image sharing between NTCs and TTCs. This might reduce both the rate of missed injuries and the need for repeat scans.”
Dr. Bonds had no financial disclosures.
On Twitter @Alz_Gal
Key clinical point:
Major finding: Overall, 76% of patients had missed injuries on their initial CT scans.
Data source: A study of 203 trauma patients.
Disclosures: Dr. Bonds had no financial disclosures.
Overcoming glucocorticoid resistance in lymphoma

Image by Ed Uthman
Targeting RUNX1 could combat glucocorticoid resistance in patients with lymphoma, according to research published in the Journal of Cellular Biochemistry.
Researchers found an over activity of RUNX1 in lymphoma cells interfered with sphingolipids and caused cells to become resistant to dexamethasone.
Dexamethasone works, in part, through the control of sphingolipid enzymes, which play a role in instructing cells to live or die.
Specifically, the researchers said they found that ectopic expression of RUNX1 in lymphoma cells consistently perturbs the sphingolipid rheostat and confers increased resistance to glucocorticoid-mediated apoptosis.
The team also described the mechanism of cross-talk between glucocorticoid and sphingolipid metabolism through the enzyme Sgpp1.
The researchers said dexamethasone induces expression of Sgpp1 in T-lymphoma cells and drives cell death, which is reduced by partial knockdown of Sgpp1 with short hairpin RNA or direct transcriptional repression of Sgpp1 by ectopic RUNX1.
These findings suggest that drugs targeting RUNX1 may be able to reverse glucocorticoid resistance in lymphoma patients.
“The possibility of making existing therapies more active and specific by combining [them] with drugs that inhibit RUNX is a new and exciting prospect,” said study author James Neil, of The University of Glasgow in Scotland.
“Our collaborators in the US have recently developed drugs that inhibit RUNX, and we plan to test these with existing therapies in blood cancers where MYC and RUNX are both implicated, including multiple myeloma and Burkitt lymphoma.”
An earlier study by Dr Neil and his colleagues suggested that RUNX1 was a potential therapeutic target in MYC-driven lymphomas. ![]()
Reducing the risk of device-related thrombosis

“superomniphobic” surface.
Photo from the Kota lab
at Colorado State University
Researchers say they have engineered “superhemophobic” titanium surfaces that could be used to create implantable medical devices that don’t pose a risk of thrombosis.
The team described this work in Advanced Healthcare Materials.
The undesirable interaction of blood with foreign materials is an ongoing problem in medical research, said study author Ketul Popat, PhD, of Colorado State University in Fort Collins, Colorado.
He and his colleagues noted that, when implanted medical devices come in contact with blood, platelet adhesion and activation occur, which may lead to thrombosis and device failure.
“If we can design materials where blood barely contacts the surface, there is virtually no chance of clotting, which is a coordinated set of events,” Dr Popat said. “Here, we’re targeting the prevention of the first set of events.”
Dr Popat and his colleagues started with sheets of titanium, which are commonly used in medical devices. The team then grew chemically altered surfaces that act as barriers between the titanium and blood.
They analyzed variations of titanium surfaces, including different textures and chemistries, and compared the extent of platelet adhesion and activation.
These experiments revealed that fluorinated nanotubes offered the best protection against clotting.
Having implantable medical devices that repel blood might seem counterintuitive, the researchers noted, as biomedical scientists often use materials with an affinity to blood to make them biologically compatible.
“What we are doing is the exact opposite,” said study author Arun Kota, PhD, of Colorado State University.
“We are taking a material that blood hates to come in contact with, in order to make it compatible with blood.”
In essence, the titanium surface is so repellent that blood is “tricked” into “believing” there’s virtually no foreign material there at all.
Growing a surface and testing it in the lab is only the beginning, the researchers said. They want to continue examining other clotting factors, and eventually, to test real medical devices. ![]()
Diabetes: Health Literacy Education Improves Veteran Outcomes
According to the National Academy of Medicine (NAM), health literacy is “the degree to which individuals have the capacity to obtain, process and understand basic health information and services needed to make appropriate health decisions.”1 Studies suggest that millions of patients have inadequate health literacy and cannot make fully informed decisions because of this lack of knowledge.2-4 A 2007 National Patient Safety Foundation report calculated that inadequate health literacy burdens the U.S. health care system with an additional $106 to $238 billion annually.5
In 2014, the American Diabetes Association reported that diabetes affects 29.1 million Americans (9.3%) and that by 2050 1 in 3 Americans will have diabetes.6 People with diabetes have health care costs 2.3 times higher than the cost for nondiabetic patients. The cost of taking care of patients with diabetes annually is about $245 billion.6 Without interventions that address health literacy and effective self-management to reduce the risks of complications and comorbidity, health care costs related to diabetes will continue to increase.
Literature Review
According to a U.S. Department of Education assessment on adult health literacy in 2003, 88% of adults in the U.S. have inadequate health literacy.2 About 90 million Americans lack health literacy skills, according to a 2004 NAM report.3 Heinrich, who conducted a review of U.S. studies on health literacy, concluded that about 25% of Americans have low health literacy.4
The Newest Vital Sign Tool
The Newest Vital Sign (NVS) tool is a free tool developed by Pfizer (New York, NY) for assessing health literacy. Participants are asked 6 questions about nutrition based on an ice cream nutrition label (Figure). The researcher records the participant’s responses, which accommodates participants who may have difficulty reading. The tool is scored from 0 to 6. A score of below 4 indicates the possibility of limited health literacy.7 This test can be completed in about 3 minutes, is widely accepted, and provides results comparable to more extensive literacy tests.8 A study conducted by Welch and colleagues suggested the NVS tool is both cost and time efficient.9 Ryan and colleagues found that 98% of patients in their study (n = 289) did not have objections to taking the NVS assessment.10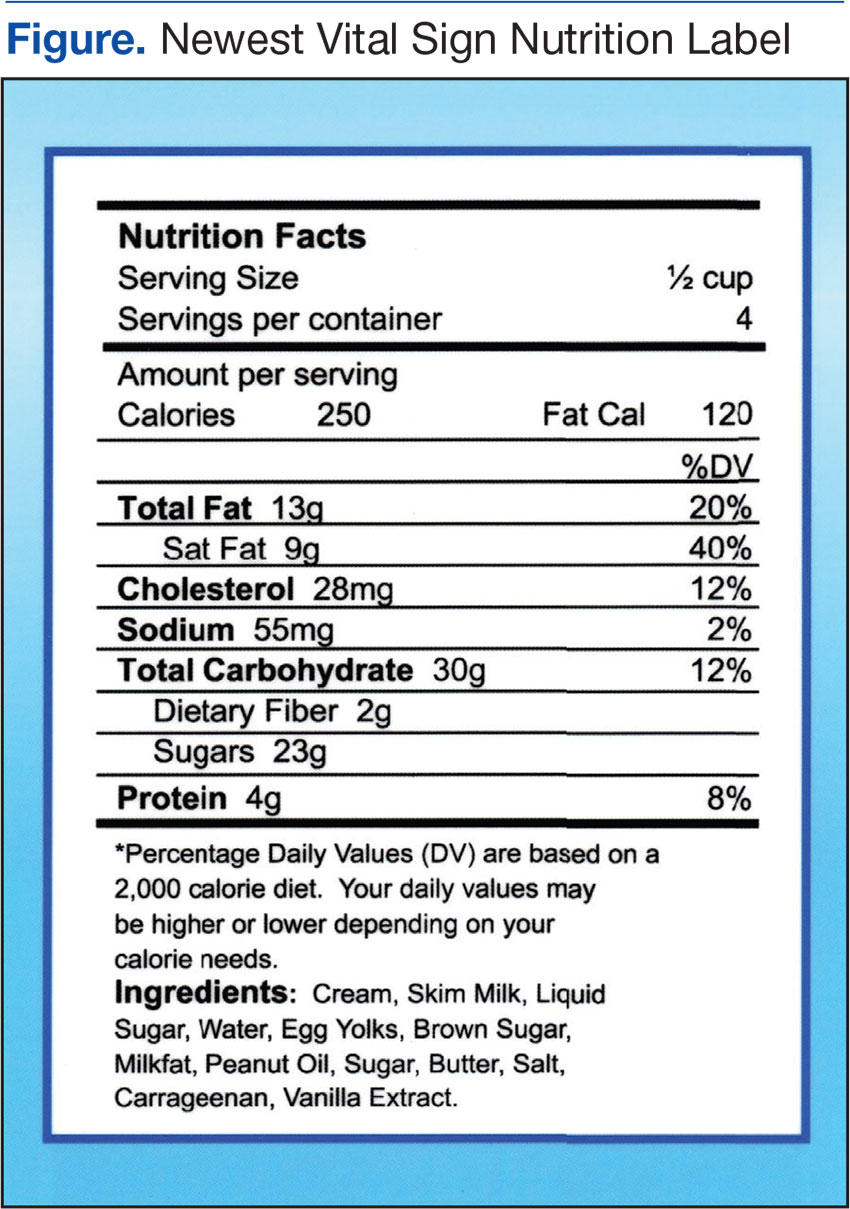
Escobedo and Weismuller’s study used the NVS health literacy tool to assess the health literacy of renal patients.3 In 2004, about 50,000 American patients with diabetes began treatment for kidney failure due to diabetes complications.6 Escobedo and Weismuller found that patients with diabetes with limited health literacy knowledge are more likely to be hospitalized, thus increasing health care costs.3 In addition, they discovered that these patients demonstrated poor adherence to prescribed treatment protocols. Welch, VanGeest, and Caskey conducted a case study on time, cost, and clinical utilization of the NVS health literacy tool and found that a patient’s lack of health literacy was linked to limited participation in personal medical decisions.7,9 Patient’s lack of knowledge was associated with delays in seeking treatment, poor self-management of the disease, and more hospital admissions.
Health Literacy and Diabetes
Studies specific to diabetes and inadequate health literacy support the premise that better health literacy leads to improved patient outcomes. Using the NVS tool, Heinrich conducted a study of the health literacy of 54 patients with diabetes in a primary care setting. The study showed that 65% had inadequate health literacy and that patients with diabetes with inadequate health literacy were more likely to have poor glycemic control compared with patients with diabetes and adequate health literacy levels.4 McCleary-Jones examined diet, foot care, and exercise of 50 African American participants with diabetes from a community health center, finding a positive relationship between health literacy and diabetes knowledge.11
Long and Gambling conducted a 2-year prospective, observational study that incorporated motivational interviewing and patient-centered care into a self-management program, examining the effectiveness of scheduled phone interventions to assist patients with diabetes in the management of their disease.12 The interventions used structured and consistent questions supported by a protocol and script that examined medication adherence and lifestyle choices. Long and Gambling concluded that “the findings demonstrate not only changes in the depth and detail of diabetes-related knowledge and confidence, but also enhanced competence in translating knowledge into every day self-care.”12 These researchers concluded that increased knowledge translated into better patient self-management of their disease. The Long and Gambling study included general self-management characteristics of monitoring HbA1c, diet, exercise, medication management, and general self-care. These researchers contend that diabetes self-management education must be a long-term endeavor to promote change.12
Mendoza and Rosenburg’s meta-analysis on self-management programs for diabetes and chronic conditions found a statistically significant 0.81% reduction in hemoglobin A1c (HbA1c). Characteristics of self-management programs that were linked to improved outcomes included nurse and provider education on medications, diet and/or exercise, and demonstrated use of motivational interviewing and biofeedback. Mendoza and Rosenburg suggested motivational interviewing focuses on the patient’s perspective and facilitates the process that the patient uses to assess their needs and to think about possible solutions.13 Mulimba and Bryo-Daniel found that motivational interviewing is a valuable tool for primary care nurses’ health promotion practice, and Thompson and colleagues found that it was effective in changing behavior.14,15
Nurse’s Role in Health Literacy
Nurses play a vital role in educating and securing adherence of patients in the management of their disease(s).13 In addition to educating patients, families, and friends of the family, nurses assist with helping them make informed decisions.16 The VHA uses the Specialty Care Access Network-Extension for Community Healthcare Outcomes (SCAN-ECHO) to teach health care staff about diabetes self-management education (DSME). Tisdel and colleagues found that DSME established through telemedicine or clinical mentoring improved patient outcomes.17 Mendoza and Rosenburgfound nurse-led DSME was linked to minimizing cardiovascular risk factors and improvements in HbA1c.13
Background
Staunton Community Based Outpatient Clinic (CBOC) in rural Virginia is a primary care clinic that serves veterans in the surrounding area. About one-fourth of the Staunton patients have diabetes. According to June 2014 data from the VHA Support Service Center, the physician at the Staunton CBOC was responsible for 946 patients (225 with diabetes) and the nurse practitioner was responsible for 707 (184 with diabetes). The VHA Support Service Center 2014 data indicated that veterans with poorly self-managed diabetes were at increased risk for poor outcomes, such as kidney failure, cardiovascular disease, and limb amputation. Veterans with diabetes use the emergency department more often and are admitted to the hospital more often than are veterans who do not have diabetes.18
Methods
The primary objective of this pilot study was to explore whether weekly structured nursing education sessions lasting 45 minutes and subsequent follow-up weekly conferences would improve their HbA1c for veterans identified as having ≥ 9 HbA1c and ≤ 3 health literacy score on the NVS 7 study assessment. Most recent HbA1c prior to beginning the study was used to identify potential participants. After completion of 12 weekly education interventions, an additional HbA1c was obtained.
The Salem VAMC and Eastern Mennonite University Institutional Review Board approved the study. Veterans’ questions were answered prior to signing consent forms. All data collected were kept confidential.
Veterans with ≥ 9 HbA1c were evaluated for possible participation. Forty-nine veterans met the criteria to participate in this pilot study. Exclusion criteria included diagnosis of any cognitive disorder, such as dementia, Alzheimer disease, or memory impairment. In addition, veterans unwilling or unable to commit to weekly follow-up sessions were excluded. The veterans eligible for participation were contacted by telephone, and 9 agreed to participate in the pilot study. Inclusion criteria included those aged ≥ 18 years and a diagnosis of diabetes with most recent HbA1c of ≥ 9 and a score of < 4 on the NVS health literacy assessment. After taking the NVS health literacy assessment, 6 of the 9 participants qualified to continue in the study.
Education interventions included assessing medication adherence, discussing diet, reviewing physical activity for the previous week (based on diet and activity logs), and reviewing home blood glucose monitoring. Weekly education sessions were either face-to-face or by telephone. This choice was given to accommodate veterans who may have had transportation issues. A total of 12 weekly appointments were scheduled for each participant, and education was directed at the specific needs and goals of each participant. Interventions for education were based on those found in previous studies.13,14,18,19
Data Collection and Analysis
All 6 participants were white male veterans who were diagnosed with diabetes for at least 3 years. Their ages ranged from 59 to 72. Three participants were service connected for diabetes and 3 were not. One participant dropped from the study after completing 4 appointments, stating he was just too busy to be available for a weekly appointment. Another participant completed 6 appointments and removed himself from the study due to time constraints. The 4 participants who completed the pilot study were followed for 12 weeks by a registered nurse (RN), and all had reductions in their HbA1c.
Participants were assessed at weekly appointments using a predetermined template for medication adherence, diet, activity, and blood glucose monitoring. Responses of the participants guided the education interventions to meet the individual veteran’s learning needs. For example, one veteran was given specific education on carbohydrate counting and another was educated on how to read food labels. Participants were also encouraged to express satisfaction, frustration, anger, or other emotions in managing their chronic illness. The premise for spending additional time with the veteran was to promote positive self-management behaviors as recommended by Radhakrishnan.19
Veterans who completed the study stated that the education interventions positively impacted their health status. One veteran was able to delay dialysis due to self-directed improvement in his lifestyle (exercising and watching his diet), which improved his HbA1c. This veteran attributed his health improvement to the individualized education sessions with the RN and knowing he had to be accountable to someone. Additionally, it was found there was a strong familial-social component to diabetes self-management. Several veterans were knowledgeable about diabetes self-management as evidenced by their responses to weekly questions. However, disease management for these veterans was strongly impacted by family and life events.
One veteran did not manage his disease for an entire week due to “being busy with a death in the family and planning for a wedding.” This veteran took his medication but did not check his blood glucose or monitor his diet. Another veteran spoke of eating ice cream and other concentrated sweets because his young grandson was with him for the week. A third veteran was able to manage his diet better when his wife packed snacks for him but when left to his own accord did not do well with his food selection. Even though these veterans understood how to effectively manage their diabetes, they may have chosen to inconsistently translate that knowledge into practice if they perceive those familial-social forces to be more important or more powerful.
Discussion
The findings from this small pilot study from a single clinic cannot be generalized. However, this pilot study adds to the literature of the positive impact of individualized, structured, tailored nursing interventions delivered with careful consideration of the participants’ personal goals and health care needs for diabetes self-management.
Participants monitored home blood glucose levels, diet, and activity and maintained adherence with prescribed diabetes medications. The HbA1c level for participants decreased by the end of the program. During the course of the pilot study a pharmacist managed the veterans’ medications. Participant 1 began a new medication regimen the first day of the study. Previously, the patient was self-regulating his medication. However, during the 12-week study, he had no medication adjustments. Participant 4 had several increases to his insulin dose (insulin aspart protamine and insulin aspart rdna origin) during the course of the study. Participants 5 and 6 had no medication adjustments during the study.
Even though participants had medication adjustments, which contributed to the HbA1c decrease, they became more aware of the medical need to control their blood sugar through the one-on-one education provided. Although there was variation in the depth and detail that participants maintained their food/activity log and home blood glucose monitoring, all participants agreed that they were more likely to be adherent with prescribed self-monitoring “knowing they were going to have to report self-monitoring information” to the RN.
Health care professionals may not realize the impact of familial-social events on blood glucose control. Veterans in this study found that having weekly sessions with the RN helped them through such events, even though they did not adhere strictly to their regimen. One suggestion is having veterans anticipate future familial-social events that may trigger nonadherence to their diabetes health plan and then discuss those events with the health care professional.
Future Research
This small exploratory pilot study has implications for future research. Increasing the study’s sample size and using a control group is recommended to compare veterans who have an educational intervention with those that do not and the impact it has on blood glucose control. The study was limited to 1 CBOC. Incorporating additional CBOCs could increase the sample size. Additionally, although this study was only 3 months in duration, a longer study could reveal significant patterns of change over time as well as the long-term benefit of a tailored educational intervention. In addition, adjusting the study inclusion criteria of > 9 HbA1c to include those with > 8 HbA1c also may increase the sample size.
Limited financial resources for the study could have negatively impacted the sample size. Incorporating recruitment or advertising strategy may increase the number of participants. Research also is needed on education interventions with a diverse group of male and female veterans that extends beyond 3 months. Exploring the value of including the veteran’s family in the education sessions is needed. Finally, this study examined only diabetes education. Researchers need to consider other diseases and the value of individualized education.
Limitations
Limitations included a small sample size and no control group. Due to the study’s small sample size, extrapolating data from it becomes difficult. However, this pilot study sets the groundwork for other researchers to expand the importance of education interventions and health literacy. Recruitment was challenging since an eligibility criterion was the NVS score, and patients were sometimes difficult to contact.7 The pilot study started with 6 white male participants but only 4 finished. During the course of the pilot study, 1 veteran had medication adjustments as part of routine care and 1 veteran had medication adjustments prior to the study, which could have altered the HbA1c results.
In hindsight, using the NVS to assess both prestudy with poststudy health literacy scores would have provided additional information about the education intervention. There is possible bias because the researcher was a VAMC employee, and the RN that implemented the interventions had previously worked with the patients.
Conclusion
Although this is a small descriptive pilot study, it adds to the body of research on the value of nurse-driven interventions to help veterans manage diabetes by enhancing their health literacy. It also raises questions and opportunities for further research into the power of familial-social influences on a veteran’s willingness to manage their diabetes. The majority of veterans who declined to participate in this study, even though they qualified, stated that they would “not follow any recommendations.” Further investigation is needed about why some veterans elect not to obtain help that could positively impact their health and possibly extend their life. Additionally, scientific quantitative and qualitative research is needed to evaluate the statistical significance between health care literacy and educational intervention on patient adherence among individuals diagnosed with diabetes.
1. Stiles E. Promoting health literacy in patients with diabetes. Nurs Stand. 2011;26(8):35-40.
2. Baum NH, Dowling RA. Health literacy: how do your patients rate? http://urologytimes.modernmedicine.com/urology-times/news/modernmedicine/modern-medicine-now/health-literacy-how-do-your-patients-rate. Published August 1, 2011. Accessed December 2, 2016.
3. Escobedo W, Weismuller P. Assessing health literacy in renal failure and kidney transplant patients. Prog Transplant. 2013;23(1):47-54.
4. Heinrich C. Health literacy: the sixth vital sign. J Am Acad Nurse Pract. 2012;24(4):218-223.
5. Roett MA, Wessel L. Help your patient “get” what you just said: health literacy guide. J Fam Pract. 2012;61(4):190-196.
6. American Diabetes Association. Statistics about diabetes. http://www.diabetes.org/diabetes-basics/statistics/?loc=feat1.Updated December 12, 2016. Accessed December 14, 2016.
7. Pfizer. The newest vital sign. http://www.pfizer.com/files/health/nvs_flipbook_english_final.pdf. Published February 2011. Accessed December 2, 2016.
8. Shah LC, West P, Bremmeyr K, Savoy-Moore RT. Health literacy instrument in family medicine: the “newest vital sign” ease of use and correlates. J Am Board Fam Med. 2010;23(2):195-203.
9. Welch VL, VanGeest JB, Caskey R. Time, costs, and clinical utilization of screening for health literacy: a case study using the Newest Vital Sign (NVS) instrument. J Am Board Fam Med. 2011;24(3):281-289.
10. Ryan JG, Leguen F, Weiss BD, et al. Will patients agree to have their literacy skills assessed in clinical practice? Health Educ Res. 2008;23(4):603-611.
11. McCleary-Jones V. Health literacy and its association with diabetes knowledge, self-efficacy and disease self-management among African Americans with diabetes mellitus. ABNF J. 2011;22(2):25-32.
12. Long AF, Gambling T. Enhancing health literacy and behavioral change within a tele-care education and support intervention for people with type 2 diabetes. Health Expect. 2012;15(3):267-282.
13. Mendoza M, Rosenberg T. Self-management of type 2 diabetes: A good idea-or not? J Fam Pract. 2013;62(5):244-248.
14. A Clifford Mulimba A, Byron-Daniel J. Motivational interviewing-based interventions and diabetes mellitus. Br J Nurs. 2014;23(1):8-14.
15. Thompson DR, Chair SY, Chan SW, Astin F, Davidson PM, Ski CF. Motivational interviewing: a useful approach to improving cardiovascular health? J Clin Nurs. 2011;20;(9-10):1236-1244.
16. Protheroe J, Rowlands G. Matching clinical information with levels of patient health literacy. Nurs Manag (Harrow). 2013;20(3):20-21.
17. Tisdel KA, Bedwell M, Tarkington PE, Mundy A, Fredrickson SK. Diabetes specialists share experience remotely with RN care managers. Fed Pract. 2013;30(suppl 7):15S-20S.
18. U.S. Department of Veterans Affairs, Veterans Health Administration Support Service Center. http://vssc.med.va.gov/AlphaIndex.asp?Ltr=D.
19. Radhakrishnan K. The efficacy of tailored interventions for self-management outcomes of type 2 diabetes, hypertension, or heart disease: a systemic review. J Adv Nurs. 2012;68(3):496-510.
According to the National Academy of Medicine (NAM), health literacy is “the degree to which individuals have the capacity to obtain, process and understand basic health information and services needed to make appropriate health decisions.”1 Studies suggest that millions of patients have inadequate health literacy and cannot make fully informed decisions because of this lack of knowledge.2-4 A 2007 National Patient Safety Foundation report calculated that inadequate health literacy burdens the U.S. health care system with an additional $106 to $238 billion annually.5
In 2014, the American Diabetes Association reported that diabetes affects 29.1 million Americans (9.3%) and that by 2050 1 in 3 Americans will have diabetes.6 People with diabetes have health care costs 2.3 times higher than the cost for nondiabetic patients. The cost of taking care of patients with diabetes annually is about $245 billion.6 Without interventions that address health literacy and effective self-management to reduce the risks of complications and comorbidity, health care costs related to diabetes will continue to increase.
Literature Review
According to a U.S. Department of Education assessment on adult health literacy in 2003, 88% of adults in the U.S. have inadequate health literacy.2 About 90 million Americans lack health literacy skills, according to a 2004 NAM report.3 Heinrich, who conducted a review of U.S. studies on health literacy, concluded that about 25% of Americans have low health literacy.4
The Newest Vital Sign Tool
The Newest Vital Sign (NVS) tool is a free tool developed by Pfizer (New York, NY) for assessing health literacy. Participants are asked 6 questions about nutrition based on an ice cream nutrition label (Figure). The researcher records the participant’s responses, which accommodates participants who may have difficulty reading. The tool is scored from 0 to 6. A score of below 4 indicates the possibility of limited health literacy.7 This test can be completed in about 3 minutes, is widely accepted, and provides results comparable to more extensive literacy tests.8 A study conducted by Welch and colleagues suggested the NVS tool is both cost and time efficient.9 Ryan and colleagues found that 98% of patients in their study (n = 289) did not have objections to taking the NVS assessment.10
Escobedo and Weismuller’s study used the NVS health literacy tool to assess the health literacy of renal patients.3 In 2004, about 50,000 American patients with diabetes began treatment for kidney failure due to diabetes complications.6 Escobedo and Weismuller found that patients with diabetes with limited health literacy knowledge are more likely to be hospitalized, thus increasing health care costs.3 In addition, they discovered that these patients demonstrated poor adherence to prescribed treatment protocols. Welch, VanGeest, and Caskey conducted a case study on time, cost, and clinical utilization of the NVS health literacy tool and found that a patient’s lack of health literacy was linked to limited participation in personal medical decisions.7,9 Patient’s lack of knowledge was associated with delays in seeking treatment, poor self-management of the disease, and more hospital admissions.
Health Literacy and Diabetes
Studies specific to diabetes and inadequate health literacy support the premise that better health literacy leads to improved patient outcomes. Using the NVS tool, Heinrich conducted a study of the health literacy of 54 patients with diabetes in a primary care setting. The study showed that 65% had inadequate health literacy and that patients with diabetes with inadequate health literacy were more likely to have poor glycemic control compared with patients with diabetes and adequate health literacy levels.4 McCleary-Jones examined diet, foot care, and exercise of 50 African American participants with diabetes from a community health center, finding a positive relationship between health literacy and diabetes knowledge.11
Long and Gambling conducted a 2-year prospective, observational study that incorporated motivational interviewing and patient-centered care into a self-management program, examining the effectiveness of scheduled phone interventions to assist patients with diabetes in the management of their disease.12 The interventions used structured and consistent questions supported by a protocol and script that examined medication adherence and lifestyle choices. Long and Gambling concluded that “the findings demonstrate not only changes in the depth and detail of diabetes-related knowledge and confidence, but also enhanced competence in translating knowledge into every day self-care.”12 These researchers concluded that increased knowledge translated into better patient self-management of their disease. The Long and Gambling study included general self-management characteristics of monitoring HbA1c, diet, exercise, medication management, and general self-care. These researchers contend that diabetes self-management education must be a long-term endeavor to promote change.12
Mendoza and Rosenburg’s meta-analysis on self-management programs for diabetes and chronic conditions found a statistically significant 0.81% reduction in hemoglobin A1c (HbA1c). Characteristics of self-management programs that were linked to improved outcomes included nurse and provider education on medications, diet and/or exercise, and demonstrated use of motivational interviewing and biofeedback. Mendoza and Rosenburg suggested motivational interviewing focuses on the patient’s perspective and facilitates the process that the patient uses to assess their needs and to think about possible solutions.13 Mulimba and Bryo-Daniel found that motivational interviewing is a valuable tool for primary care nurses’ health promotion practice, and Thompson and colleagues found that it was effective in changing behavior.14,15
Nurse’s Role in Health Literacy
Nurses play a vital role in educating and securing adherence of patients in the management of their disease(s).13 In addition to educating patients, families, and friends of the family, nurses assist with helping them make informed decisions.16 The VHA uses the Specialty Care Access Network-Extension for Community Healthcare Outcomes (SCAN-ECHO) to teach health care staff about diabetes self-management education (DSME). Tisdel and colleagues found that DSME established through telemedicine or clinical mentoring improved patient outcomes.17 Mendoza and Rosenburgfound nurse-led DSME was linked to minimizing cardiovascular risk factors and improvements in HbA1c.13
Background
Staunton Community Based Outpatient Clinic (CBOC) in rural Virginia is a primary care clinic that serves veterans in the surrounding area. About one-fourth of the Staunton patients have diabetes. According to June 2014 data from the VHA Support Service Center, the physician at the Staunton CBOC was responsible for 946 patients (225 with diabetes) and the nurse practitioner was responsible for 707 (184 with diabetes). The VHA Support Service Center 2014 data indicated that veterans with poorly self-managed diabetes were at increased risk for poor outcomes, such as kidney failure, cardiovascular disease, and limb amputation. Veterans with diabetes use the emergency department more often and are admitted to the hospital more often than are veterans who do not have diabetes.18
Methods
The primary objective of this pilot study was to explore whether weekly structured nursing education sessions lasting 45 minutes and subsequent follow-up weekly conferences would improve their HbA1c for veterans identified as having ≥ 9 HbA1c and ≤ 3 health literacy score on the NVS 7 study assessment. Most recent HbA1c prior to beginning the study was used to identify potential participants. After completion of 12 weekly education interventions, an additional HbA1c was obtained.
The Salem VAMC and Eastern Mennonite University Institutional Review Board approved the study. Veterans’ questions were answered prior to signing consent forms. All data collected were kept confidential.
Veterans with ≥ 9 HbA1c were evaluated for possible participation. Forty-nine veterans met the criteria to participate in this pilot study. Exclusion criteria included diagnosis of any cognitive disorder, such as dementia, Alzheimer disease, or memory impairment. In addition, veterans unwilling or unable to commit to weekly follow-up sessions were excluded. The veterans eligible for participation were contacted by telephone, and 9 agreed to participate in the pilot study. Inclusion criteria included those aged ≥ 18 years and a diagnosis of diabetes with most recent HbA1c of ≥ 9 and a score of < 4 on the NVS health literacy assessment. After taking the NVS health literacy assessment, 6 of the 9 participants qualified to continue in the study.
Education interventions included assessing medication adherence, discussing diet, reviewing physical activity for the previous week (based on diet and activity logs), and reviewing home blood glucose monitoring. Weekly education sessions were either face-to-face or by telephone. This choice was given to accommodate veterans who may have had transportation issues. A total of 12 weekly appointments were scheduled for each participant, and education was directed at the specific needs and goals of each participant. Interventions for education were based on those found in previous studies.13,14,18,19
Data Collection and Analysis
All 6 participants were white male veterans who were diagnosed with diabetes for at least 3 years. Their ages ranged from 59 to 72. Three participants were service connected for diabetes and 3 were not. One participant dropped from the study after completing 4 appointments, stating he was just too busy to be available for a weekly appointment. Another participant completed 6 appointments and removed himself from the study due to time constraints. The 4 participants who completed the pilot study were followed for 12 weeks by a registered nurse (RN), and all had reductions in their HbA1c.
Participants were assessed at weekly appointments using a predetermined template for medication adherence, diet, activity, and blood glucose monitoring. Responses of the participants guided the education interventions to meet the individual veteran’s learning needs. For example, one veteran was given specific education on carbohydrate counting and another was educated on how to read food labels. Participants were also encouraged to express satisfaction, frustration, anger, or other emotions in managing their chronic illness. The premise for spending additional time with the veteran was to promote positive self-management behaviors as recommended by Radhakrishnan.19
Veterans who completed the study stated that the education interventions positively impacted their health status. One veteran was able to delay dialysis due to self-directed improvement in his lifestyle (exercising and watching his diet), which improved his HbA1c. This veteran attributed his health improvement to the individualized education sessions with the RN and knowing he had to be accountable to someone. Additionally, it was found there was a strong familial-social component to diabetes self-management. Several veterans were knowledgeable about diabetes self-management as evidenced by their responses to weekly questions. However, disease management for these veterans was strongly impacted by family and life events.
One veteran did not manage his disease for an entire week due to “being busy with a death in the family and planning for a wedding.” This veteran took his medication but did not check his blood glucose or monitor his diet. Another veteran spoke of eating ice cream and other concentrated sweets because his young grandson was with him for the week. A third veteran was able to manage his diet better when his wife packed snacks for him but when left to his own accord did not do well with his food selection. Even though these veterans understood how to effectively manage their diabetes, they may have chosen to inconsistently translate that knowledge into practice if they perceive those familial-social forces to be more important or more powerful.
Discussion
The findings from this small pilot study from a single clinic cannot be generalized. However, this pilot study adds to the literature of the positive impact of individualized, structured, tailored nursing interventions delivered with careful consideration of the participants’ personal goals and health care needs for diabetes self-management.
Participants monitored home blood glucose levels, diet, and activity and maintained adherence with prescribed diabetes medications. The HbA1c level for participants decreased by the end of the program. During the course of the pilot study a pharmacist managed the veterans’ medications. Participant 1 began a new medication regimen the first day of the study. Previously, the patient was self-regulating his medication. However, during the 12-week study, he had no medication adjustments. Participant 4 had several increases to his insulin dose (insulin aspart protamine and insulin aspart rdna origin) during the course of the study. Participants 5 and 6 had no medication adjustments during the study.
Even though participants had medication adjustments, which contributed to the HbA1c decrease, they became more aware of the medical need to control their blood sugar through the one-on-one education provided. Although there was variation in the depth and detail that participants maintained their food/activity log and home blood glucose monitoring, all participants agreed that they were more likely to be adherent with prescribed self-monitoring “knowing they were going to have to report self-monitoring information” to the RN.
Health care professionals may not realize the impact of familial-social events on blood glucose control. Veterans in this study found that having weekly sessions with the RN helped them through such events, even though they did not adhere strictly to their regimen. One suggestion is having veterans anticipate future familial-social events that may trigger nonadherence to their diabetes health plan and then discuss those events with the health care professional.
Future Research
This small exploratory pilot study has implications for future research. Increasing the study’s sample size and using a control group is recommended to compare veterans who have an educational intervention with those that do not and the impact it has on blood glucose control. The study was limited to 1 CBOC. Incorporating additional CBOCs could increase the sample size. Additionally, although this study was only 3 months in duration, a longer study could reveal significant patterns of change over time as well as the long-term benefit of a tailored educational intervention. In addition, adjusting the study inclusion criteria of > 9 HbA1c to include those with > 8 HbA1c also may increase the sample size.
Limited financial resources for the study could have negatively impacted the sample size. Incorporating recruitment or advertising strategy may increase the number of participants. Research also is needed on education interventions with a diverse group of male and female veterans that extends beyond 3 months. Exploring the value of including the veteran’s family in the education sessions is needed. Finally, this study examined only diabetes education. Researchers need to consider other diseases and the value of individualized education.
Limitations
Limitations included a small sample size and no control group. Due to the study’s small sample size, extrapolating data from it becomes difficult. However, this pilot study sets the groundwork for other researchers to expand the importance of education interventions and health literacy. Recruitment was challenging since an eligibility criterion was the NVS score, and patients were sometimes difficult to contact.7 The pilot study started with 6 white male participants but only 4 finished. During the course of the pilot study, 1 veteran had medication adjustments as part of routine care and 1 veteran had medication adjustments prior to the study, which could have altered the HbA1c results.
In hindsight, using the NVS to assess both prestudy with poststudy health literacy scores would have provided additional information about the education intervention. There is possible bias because the researcher was a VAMC employee, and the RN that implemented the interventions had previously worked with the patients.
Conclusion
Although this is a small descriptive pilot study, it adds to the body of research on the value of nurse-driven interventions to help veterans manage diabetes by enhancing their health literacy. It also raises questions and opportunities for further research into the power of familial-social influences on a veteran’s willingness to manage their diabetes. The majority of veterans who declined to participate in this study, even though they qualified, stated that they would “not follow any recommendations.” Further investigation is needed about why some veterans elect not to obtain help that could positively impact their health and possibly extend their life. Additionally, scientific quantitative and qualitative research is needed to evaluate the statistical significance between health care literacy and educational intervention on patient adherence among individuals diagnosed with diabetes.
1. Stiles E. Promoting health literacy in patients with diabetes. Nurs Stand. 2011;26(8):35-40.
2. Baum NH, Dowling RA. Health literacy: how do your patients rate? http://urologytimes.modernmedicine.com/urology-times/news/modernmedicine/modern-medicine-now/health-literacy-how-do-your-patients-rate. Published August 1, 2011. Accessed December 2, 2016.
3. Escobedo W, Weismuller P. Assessing health literacy in renal failure and kidney transplant patients. Prog Transplant. 2013;23(1):47-54.
4. Heinrich C. Health literacy: the sixth vital sign. J Am Acad Nurse Pract. 2012;24(4):218-223.
5. Roett MA, Wessel L. Help your patient “get” what you just said: health literacy guide. J Fam Pract. 2012;61(4):190-196.
6. American Diabetes Association. Statistics about diabetes. http://www.diabetes.org/diabetes-basics/statistics/?loc=feat1.Updated December 12, 2016. Accessed December 14, 2016.
7. Pfizer. The newest vital sign. http://www.pfizer.com/files/health/nvs_flipbook_english_final.pdf. Published February 2011. Accessed December 2, 2016.
8. Shah LC, West P, Bremmeyr K, Savoy-Moore RT. Health literacy instrument in family medicine: the “newest vital sign” ease of use and correlates. J Am Board Fam Med. 2010;23(2):195-203.
9. Welch VL, VanGeest JB, Caskey R. Time, costs, and clinical utilization of screening for health literacy: a case study using the Newest Vital Sign (NVS) instrument. J Am Board Fam Med. 2011;24(3):281-289.
10. Ryan JG, Leguen F, Weiss BD, et al. Will patients agree to have their literacy skills assessed in clinical practice? Health Educ Res. 2008;23(4):603-611.
11. McCleary-Jones V. Health literacy and its association with diabetes knowledge, self-efficacy and disease self-management among African Americans with diabetes mellitus. ABNF J. 2011;22(2):25-32.
12. Long AF, Gambling T. Enhancing health literacy and behavioral change within a tele-care education and support intervention for people with type 2 diabetes. Health Expect. 2012;15(3):267-282.
13. Mendoza M, Rosenberg T. Self-management of type 2 diabetes: A good idea-or not? J Fam Pract. 2013;62(5):244-248.
14. A Clifford Mulimba A, Byron-Daniel J. Motivational interviewing-based interventions and diabetes mellitus. Br J Nurs. 2014;23(1):8-14.
15. Thompson DR, Chair SY, Chan SW, Astin F, Davidson PM, Ski CF. Motivational interviewing: a useful approach to improving cardiovascular health? J Clin Nurs. 2011;20;(9-10):1236-1244.
16. Protheroe J, Rowlands G. Matching clinical information with levels of patient health literacy. Nurs Manag (Harrow). 2013;20(3):20-21.
17. Tisdel KA, Bedwell M, Tarkington PE, Mundy A, Fredrickson SK. Diabetes specialists share experience remotely with RN care managers. Fed Pract. 2013;30(suppl 7):15S-20S.
18. U.S. Department of Veterans Affairs, Veterans Health Administration Support Service Center. http://vssc.med.va.gov/AlphaIndex.asp?Ltr=D.
19. Radhakrishnan K. The efficacy of tailored interventions for self-management outcomes of type 2 diabetes, hypertension, or heart disease: a systemic review. J Adv Nurs. 2012;68(3):496-510.
Survey finds link between e-cigarette use and high-risk behaviors
High school students who use electronic vapor products (EVPs), whether alone or in combination with cigarette smoking, are more likely to engage in violence, substance abuse, and other high-risk behaviors, compared with nonusers, according to the results of a national survey.
“Given that EVPs are relatively new to the U.S. marketplace, little is known about the use of these products in the context of other health behaviors, which can persist throughout life and contribute to significant morbidity and mortality during adolescence and adulthood,” Zewditu Demissie, PhD, and her associates wrote in a study published online in the Jan. 23, 2017, issue of Pediatrics. They went on to note that to date, “studies on the association between EVPs and health-risk behaviors among adolescents and young adults has been limited to examining the associations between e-cigarette and substance use. These studies have found that use of e-cigarettes was associated with alcohol use, binge drinking, and marijuana use.”
Of the 15,624 respondents, 74% reported that they did not smoke cigarettes or use EVPs, while 3% smoked cigarettes only, 16% used EVPs only, and 8% used both cigarettes and EVPs.
Compared with nonusers, cigarette-only smokers, EVP-only users, and dual users were significantly more likely to:
• Engage in a physical fight (prevalence ratio range, 1.7-2.9).
• Attempt suicide (PR range, 1.9-4.0).
• Currently drink alcohol (PR range, 2.6-3.3).
• Currently use marijuana (PR range, 3.5-5.2).
• Report nonmedical use of prescription drugs (PR range, 2.3-4.1).
• Be currently sexually active (PR range, 1.9-2.3).
“Engaging in health-risk behaviors did not generally differ between EVP-only users and cigarette-only smokers,” the researchers wrote. “However, cigarette-only smokers were significantly more likely than EVP-only users to attempt suicide, ever use synthetic marijuana, have four or more lifetime sexual partners, drink soda three or more times/day, and be physically active less than 7 days in the 7 days before the survey.”
Dr. Demissie and her associates concluded that the findings “underscore the importance of comprehensive efforts to address health-risk behaviors among adolescents, including prevention strategies focused on all forms of tobacco use, including EVPs. Additionally, educational and counseling efforts focusing on the harms associated with adolescent tobacco use, including EVPs, are critical.”
They acknowledged certain limitations of the study, including its observational design and the fact that Youth Risk Behavior Survey data are self-reported.
The investigators reported having no relevant financial disclosures.
“Recent longitudinal research has provided an unpleasant surprise: Among initial nonsmokers, those who use e-cigarettes are more likely to start smoking combustible cigarettes. This puts a somewhat different light on the situation. If e-cigarettes are without risk, it does not matter much if they attract new users. Being related to smoking onset, however, puts a behavioral risk into the picture. The finding of associations with other health-risk behaviors augments concern because, as the authors note, the odds of experiencing poor health increase with the addition of each unhealthy behavior. And importantly, Demissie et al. show that among adolescent smokers, those who use e-cigarettes actually smoke more frequently, an effect that is contrary to the hopes of harm reduction advocates and has now been found internationally.
“Are e-cigarettes going to replace traditional cigarettes, or are they operating to recruit a new audience of adolescents to tobacco products? Our wish is for the former. But at present the empirical evidence looks more like the latter. We need surveillance and mechanism research to understand what e-cigarettes will mean for youth risk status. However, there is enough evidence now to advocate programs for educating teenagers about e-cigarettes.”
Thomas A. Wills, PhD., is with the Cancer Prevention and Control Program at the University of Hawaii Cancer Center, Honolulu. His views are excerpted from a commentary published online in response to the study by Dr. Demissie et al. (Pediatrics. 2017 Jan 23. doi: 10.1542/peds.2016-3736). This work was supported by grants from the National Cancer Institute. Dr. Wills reported having no relevant financial disclosures.
High school students who use electronic vapor products (EVPs), whether alone or in combination with cigarette smoking, are more likely to engage in violence, substance abuse, and other high-risk behaviors, compared with nonusers, according to the results of a national survey.
“Given that EVPs are relatively new to the U.S. marketplace, little is known about the use of these products in the context of other health behaviors, which can persist throughout life and contribute to significant morbidity and mortality during adolescence and adulthood,” Zewditu Demissie, PhD, and her associates wrote in a study published online in the Jan. 23, 2017, issue of Pediatrics. They went on to note that to date, “studies on the association between EVPs and health-risk behaviors among adolescents and young adults has been limited to examining the associations between e-cigarette and substance use. These studies have found that use of e-cigarettes was associated with alcohol use, binge drinking, and marijuana use.”
Of the 15,624 respondents, 74% reported that they did not smoke cigarettes or use EVPs, while 3% smoked cigarettes only, 16% used EVPs only, and 8% used both cigarettes and EVPs.
Compared with nonusers, cigarette-only smokers, EVP-only users, and dual users were significantly more likely to:
• Engage in a physical fight (prevalence ratio range, 1.7-2.9).
• Attempt suicide (PR range, 1.9-4.0).
• Currently drink alcohol (PR range, 2.6-3.3).
• Currently use marijuana (PR range, 3.5-5.2).
• Report nonmedical use of prescription drugs (PR range, 2.3-4.1).
• Be currently sexually active (PR range, 1.9-2.3).
“Engaging in health-risk behaviors did not generally differ between EVP-only users and cigarette-only smokers,” the researchers wrote. “However, cigarette-only smokers were significantly more likely than EVP-only users to attempt suicide, ever use synthetic marijuana, have four or more lifetime sexual partners, drink soda three or more times/day, and be physically active less than 7 days in the 7 days before the survey.”
Dr. Demissie and her associates concluded that the findings “underscore the importance of comprehensive efforts to address health-risk behaviors among adolescents, including prevention strategies focused on all forms of tobacco use, including EVPs. Additionally, educational and counseling efforts focusing on the harms associated with adolescent tobacco use, including EVPs, are critical.”
They acknowledged certain limitations of the study, including its observational design and the fact that Youth Risk Behavior Survey data are self-reported.
The investigators reported having no relevant financial disclosures.
FROM PEDIATRICS
Key clinical point:
Major finding: Compared with nonusers, cigarette-only smokers, electronic vapor products–only users, and dual users were significantly more likely to engage in a physical fight (prevalence ratio range, 1.7-2.3), to currently use marijuana (PR range, 3.5-5.2), and to be currently sexually active (PR range, 1.9-2.3).
Data source: An analysis of responses from 15,624 high school students who completed the 2015 national Youth Risk Behavior Survey.
Disclosures: The researchers reported having no relevant financial disclosures.
Join AGA in Supporting GI Research
Decades of research have revolutionized the care of many digestive disease patients. These patients, as well as everyone in the GI field, clinicians and researchers alike, have benefited from the discoveries of dedicated investigators, past and present. As the charitable arm of the American Gastroenterological Association (AGA), the AGA Research Foundation contributes to this tradition of discovery to combat the continued lower quality of life and suffering brought on by digestive diseases.

“Using this award, I plan to study the cytoskeletal intermediate filament proteins that are expressed in digestive-type epithelia, allowing me to better understand the molecular basis of GI diseases. My goal is to create a career in medical research and develop more ways to make biomedical research meaningful for clinical health-care professionals, and ultimately for patients,” said Rani Richardson, the 2016 AGA Investing in the Future Student Research Fellowship Award Recipient.
By joining others in donating to the AGA Research Foundation, you can help fill the funding gap and protect the next generation of investigators.
Help provide critical funding to young researchers today by making a donation to the AGA Research Foundation on the foundation’s website at www.gastro.org/contribute or by mail to 4930 Del Ray Avenue, Bethesda, MD 20814.
Decades of research have revolutionized the care of many digestive disease patients. These patients, as well as everyone in the GI field, clinicians and researchers alike, have benefited from the discoveries of dedicated investigators, past and present. As the charitable arm of the American Gastroenterological Association (AGA), the AGA Research Foundation contributes to this tradition of discovery to combat the continued lower quality of life and suffering brought on by digestive diseases.
“Using this award, I plan to study the cytoskeletal intermediate filament proteins that are expressed in digestive-type epithelia, allowing me to better understand the molecular basis of GI diseases. My goal is to create a career in medical research and develop more ways to make biomedical research meaningful for clinical health-care professionals, and ultimately for patients,” said Rani Richardson, the 2016 AGA Investing in the Future Student Research Fellowship Award Recipient.
By joining others in donating to the AGA Research Foundation, you can help fill the funding gap and protect the next generation of investigators.
Help provide critical funding to young researchers today by making a donation to the AGA Research Foundation on the foundation’s website at www.gastro.org/contribute or by mail to 4930 Del Ray Avenue, Bethesda, MD 20814.
Serum magnesium level reflects risk of death, irrespective of CKD
CHICAGO – Low levels of serum magnesium were associated with increased all-cause mortality, whether or not patients had chronic kidney disease, in a single center, retrospective study of 3,551 people.
The association was independent of sociodemographic factors, comorbidities, and use of diuretics.
If causality is shown, “magnesium supplementation could be a simple therapy to lessen the chance of death in CKD patients,” study investigator Silvia Ferrè, PhD, University of Texas Southwestern, Dallas, said in an interview regarding the results of the Dallas Heart Study, which was presented at the annual meeting of the American Society of Nephrology.
In both groups, the subjects with low serum magnesium were younger, more likely to be female, had a higher body mass index, and were more burdened by comorbidities including type 2 diabetes mellitus and hypertension. Subjects without CKD and low serum magnesium were significantly more likely to use diuretics. Diuretic use was comparable in subjects with CKD regardless of serum magnesium level.
Irrespective of CKD status, survival was significantly lower in subjects with low serum magnesium in the median 12.3-year follow-up compared to the other two serum magnesium tertiles (P less than 0.001 and P equal to 0.03, respectively). Following adjustment for age, gender, race/ethnicity, body mass index, phosphorus, calcium, bicarbonate, albumin, intact parathyroid hormone, total cholesterol, high-density lipoprotein, and use of diuretics and supplements, low serum magnesium was independently associated with all-cause death in subjects with CKD (Hazard Ratio, 1.92; 9%% Confidence Interval, 1.03 to 3.59; P equal to 0.04) and those without CKD (HR, 1.43; 1.43; 95% CI, 0.95 to 2.15; P equal to 0.09), when compared to high serum magnesium as the referent.
Dr. Ferrè said that screening for serum magnesium and supplementation with magnesium as part of routine blood testing might improve survival. Low magnesium level alsonhas been linked with osteoporosis, diabetes, and cardiovascular disease.
The Dallas Heart Study was a multiethnic, population-based study involving 6,101 adults residing in Dallas County. The study, which ran from 2000 to the end of 2011, was designed to explore the early detection of cardiovascular disease and the social, behavioral, and environmental factors associated with risk, with the goal of interventions that can be provided at the community level.
The study sponsor was University of Texas Southwestern Medical Center. The study was funded by the National Institutes of Health and the Donald W. Reynolds Foundation. Dr. Ferrè reported having no financial disclosures.
AT THE ANNUAL MEETING OF THE AMERICAN SOCIETY FOR NEPHROLOGY
Key clinical point: If causality is shown, magnesium supplementation could be a simple therapy to reduce mortality in patients with chronic kidney disease.
Major finding: Low serum magnesium was significantly associated with risk of death in patients without CKD (P less than 0.01) and patients with CKD (P equal to 0.03).
Data source: A single-center, retrospective cohort of 3,551 patients in the Dallas Heart Study.
Disclosures: The study sponsor was University of Texas Southwestern Medical Center. The study was funded by the National Institutes of Health and the Donald W. Reynolds Foundation. Dr. Ferrè reported having no financial disclosures.
Constipation severity linked with chronic kidney disease and decline in kidney function
CHICAGO – Constipation was associated with poor kidney health in a large nationwide cohort of 3.5 million United States veterans, and researchers are considering whether effectively treating constipation could help prevent or treat kidney disease.
“In this large nationwide cohort ... patients with constipation had higher risks of developing chronic kidney disease and end-stage renal disease, and were more likely to experience rapid decline in kidney function, even after adjusting for various known risk factors. We also found that more severe constipation was associated with an incrementally higher risk for both incident CKD (chronic kidney disease) and ESRD (end-stage renal disease),” said Keiichi Sumida, MD, a visiting scholar at the University of Tennessee Health Science Center in Memphis.

In a multivariable analysis, those with constipation had a 13% higher likelihood of developing CKD (Hazard Ratio, 1.13; 95% Confidence Interval, 1.11 to 1.14) and a 9% higher likelihood of developing ESRD (HR, 1.09; 95% CI, 1.01 to 1.18) compared to those without constipation. As well, those with constipation experienced a faster decline in estimated glomerular filtration ratio (eGFR).
Scrutiny of US Veterans Administration databases identified nearly 4.5 million patients with serum creatinine measurements obtained between October 2004 and September 2006. Of these, 3,504,732 patients had an eGFR greater than or equal to 60 ml/min/1.73 m2 but no other symptoms of CKD. All were followed through 2013.
Constipation was defined as at least two ICD-9-CM diagnoses for constipation made at least 60 days apart or two or more prescriptions for laxatives separated by 60 days for up to a year. The severity of constipation was based on the number of different type of laxatives prescribed, with no laxative use being considered as absence of constipation, one laxative type being indicative of mild constipation, and two or more types of laxatives being indicative of severe constipation.
Co-primary outcomes were incident CKD, incident ESRD, and change in eGFR from baseline. As expected in the propensity-matched cohort, baseline demographic and clinical characteristics were comparable for the 3,251,291 individuals who experienced constipation and the 253,441 individuals who did not.
“Our findings highlight the plausible link between the gut and the kidneys, and provide additional insights into the pathogenesis of kidney disease progression. Our results suggest the need for careful observation of kidney function in patients with constipation, particularly among those with more severe constipation,” Dr. Sumida concluded.
Dr. Sumida hypothesized that altered gut microflora in constipation may result in inflammation, changes in metabolites, or accumulation of toxins. Alternative explanations increased serotonin related to laxative use, nephrotoxicity, dehydration, or electrolyte imbalance.
These possibilities need to be examined, as does the idea that relieving constipation could prevent renal decline. “Given the high prevalence of constipation in the general population and the simplicity of its assessment in primary care settings, the management of constipation through lifestyle modifications and/or use of probiotics rather than laxatives could become a useful tool in preventing the development of CKD, or in retarding the progression of existing CKD,” Dr. Sumida said.
CHICAGO – Constipation was associated with poor kidney health in a large nationwide cohort of 3.5 million United States veterans, and researchers are considering whether effectively treating constipation could help prevent or treat kidney disease.
“In this large nationwide cohort ... patients with constipation had higher risks of developing chronic kidney disease and end-stage renal disease, and were more likely to experience rapid decline in kidney function, even after adjusting for various known risk factors. We also found that more severe constipation was associated with an incrementally higher risk for both incident CKD (chronic kidney disease) and ESRD (end-stage renal disease),” said Keiichi Sumida, MD, a visiting scholar at the University of Tennessee Health Science Center in Memphis.
In a multivariable analysis, those with constipation had a 13% higher likelihood of developing CKD (Hazard Ratio, 1.13; 95% Confidence Interval, 1.11 to 1.14) and a 9% higher likelihood of developing ESRD (HR, 1.09; 95% CI, 1.01 to 1.18) compared to those without constipation. As well, those with constipation experienced a faster decline in estimated glomerular filtration ratio (eGFR).
Scrutiny of US Veterans Administration databases identified nearly 4.5 million patients with serum creatinine measurements obtained between October 2004 and September 2006. Of these, 3,504,732 patients had an eGFR greater than or equal to 60 ml/min/1.73 m2 but no other symptoms of CKD. All were followed through 2013.
Constipation was defined as at least two ICD-9-CM diagnoses for constipation made at least 60 days apart or two or more prescriptions for laxatives separated by 60 days for up to a year. The severity of constipation was based on the number of different type of laxatives prescribed, with no laxative use being considered as absence of constipation, one laxative type being indicative of mild constipation, and two or more types of laxatives being indicative of severe constipation.
Co-primary outcomes were incident CKD, incident ESRD, and change in eGFR from baseline. As expected in the propensity-matched cohort, baseline demographic and clinical characteristics were comparable for the 3,251,291 individuals who experienced constipation and the 253,441 individuals who did not.
“Our findings highlight the plausible link between the gut and the kidneys, and provide additional insights into the pathogenesis of kidney disease progression. Our results suggest the need for careful observation of kidney function in patients with constipation, particularly among those with more severe constipation,” Dr. Sumida concluded.
Dr. Sumida hypothesized that altered gut microflora in constipation may result in inflammation, changes in metabolites, or accumulation of toxins. Alternative explanations increased serotonin related to laxative use, nephrotoxicity, dehydration, or electrolyte imbalance.
These possibilities need to be examined, as does the idea that relieving constipation could prevent renal decline. “Given the high prevalence of constipation in the general population and the simplicity of its assessment in primary care settings, the management of constipation through lifestyle modifications and/or use of probiotics rather than laxatives could become a useful tool in preventing the development of CKD, or in retarding the progression of existing CKD,” Dr. Sumida said.
AT THE ANNUAL MEETING OF THE AMERICAN SOCIETY FOR NEPHROLOGY
Key clinical point: Presence and severity of constipation increases the risks of developing chronic kidney disease and end stage renal disease, and accelerates the decline in kidney function.
Major finding: Individuals with constipation were 13% more likely to develop chronic kidney disease and 9% more likely to develop end stage renal disease compared to those without constipation.
Data source: Retrospective analysis of Veteran’s Administration databases. The study included 3,504,732 subjects.
Disclosures: The study sponsor was the University of Tennessee Health Science Center. Funding was provided by the United States Department of Veterans Affairs. Dr. Sumida reported having no financial disclosures.
Cell ratios predict short-term possibility of death in patients beginning hemodialysis
CHICAGO – Two simple-to-calculate ratios – neutrophil lymphocyte ratio and platelet lymphocyte ratio – may be able to predict impending death in patients who have recently begun hemodialysis, based on data from 108,548 incident hemodialysis patients in the database of DaVita HealthCare Partners from 2007 to 2011.
“Neutrophil lymphocyte ratio (NLR) and platelet lymphocyte ratio (PLR), and inflammatory and nutritional indices, which are calculated from complete blood count, were identified as strong predictors of impending death ... and thus are inexpensive and immediately available markers for predicting short-term mortality,” said Yoshitsugu Obi, MD, PhD, a visiting scholar at the Harold Simmons Center for Kidney Disease Research & Epidemiology, University of California Irvine School of Medicine, Irvine, California.

The data were obtained from the database of a large dialysis organization; 108,548 patients who began hemodialysis from 2007 to 2011 were included. The range of NLR values were divided into 12 categories with ratios of less than 1.5 and greater than or equal to 6.5 as the bracketing ratios. The 10 other intervening ratios differed incrementally by 0.5. Eight SLR categories were created with the bracketing ratios being less than 5 and greater than or equal to 35. The intervening six ratios differed incrementally by 5.
The mean age of the cohort was 63 ± 15 years. Males predominated (56%), 59% of the subjects were diabetic, and 31% were African American. At baseline the median NLR and PLR were 3.64 and 13.12, respectively.
In an unadjusted regression analysis, the categories of NLR and PLR had a strong and linear relationship with all-cause mortality. In an analysis that adjusted for covariates, including demographics and comorbidities, as well as markers of malnutrition and inflammation, the association of the two ratios with all-cause mortality persisted.
Unlike previous small and inconclusive studies, the size of the present study makes robust the connection between these cell ratios and death in dialysis patients, he said. The plan now is to compare the mortality predictability of NLR and PLR with other established risk factors including albumin, phosphorus, and alkaline phosphatase.
CHICAGO – Two simple-to-calculate ratios – neutrophil lymphocyte ratio and platelet lymphocyte ratio – may be able to predict impending death in patients who have recently begun hemodialysis, based on data from 108,548 incident hemodialysis patients in the database of DaVita HealthCare Partners from 2007 to 2011.
“Neutrophil lymphocyte ratio (NLR) and platelet lymphocyte ratio (PLR), and inflammatory and nutritional indices, which are calculated from complete blood count, were identified as strong predictors of impending death ... and thus are inexpensive and immediately available markers for predicting short-term mortality,” said Yoshitsugu Obi, MD, PhD, a visiting scholar at the Harold Simmons Center for Kidney Disease Research & Epidemiology, University of California Irvine School of Medicine, Irvine, California.
The data were obtained from the database of a large dialysis organization; 108,548 patients who began hemodialysis from 2007 to 2011 were included. The range of NLR values were divided into 12 categories with ratios of less than 1.5 and greater than or equal to 6.5 as the bracketing ratios. The 10 other intervening ratios differed incrementally by 0.5. Eight SLR categories were created with the bracketing ratios being less than 5 and greater than or equal to 35. The intervening six ratios differed incrementally by 5.
The mean age of the cohort was 63 ± 15 years. Males predominated (56%), 59% of the subjects were diabetic, and 31% were African American. At baseline the median NLR and PLR were 3.64 and 13.12, respectively.
In an unadjusted regression analysis, the categories of NLR and PLR had a strong and linear relationship with all-cause mortality. In an analysis that adjusted for covariates, including demographics and comorbidities, as well as markers of malnutrition and inflammation, the association of the two ratios with all-cause mortality persisted.
Unlike previous small and inconclusive studies, the size of the present study makes robust the connection between these cell ratios and death in dialysis patients, he said. The plan now is to compare the mortality predictability of NLR and PLR with other established risk factors including albumin, phosphorus, and alkaline phosphatase.
AT THE ANNUAL MEETING OF THE AMERICAN SOCIETY FOR NEPHROLOGY
Key clinical point: The neutrophil lymphocyte ratio (NLR) and platelet lymphocyte ratio (PLR) are strongly associated with imminent death in patients who have recently started hemodialysis.
Major finding: Increasing NLR and PLR were linearly associated with death in 108,548 hemodialysis patients.
Data source: Database of DaVita HealthCare Partners from 2007 to 2011.
Disclosures: The study was sponsored by University of Irvine School of Medicine. The study was funded by the National Institutes of Health. Dr. Obi had no disclosures.
Subclinical AF found in 1/3 of asymptomatic elderly
NEW ORLEANS – About a third of elderly people at high cardiovascular risk but otherwise healthy and asymptomatic had subclinical atrial fibrillation in a multicenter study of 273 people.
This finding that subclinical atrial fibrillation (AF) is “extremely common” in elderly people with cardiovascular risk factors “weakens the case that detecting subclinical AF in patients following a stroke implies causality” of the stroke “because subclinical AF is so prevalent,” Jeff S. Healey, MD, said at the American Heart Association Scientific Sessions.

“I think that subclinical AF is a distinct subgroup of AF, with a risk for stroke that is quite low, about 1.5%-2% per year,” said Dr. Healey, a cardiologist at McMaster University in Hamilton, Canada. “Given that this was an elderly population [study participants averaged 74 years old] with bleeding risk, it’s reasonable to question” whether many people with subclinical AF need anticoagulation. The question of whether “45 seconds of AF seen 6 months after a stroke is worthy of treatment with an anticoagulant should give people pause,” he said.
The Prevalence of Sub-Clinical Atrial Fibrillation Using an Implantable Cardiac Monitor (ASSERT-II) study initially enrolled 273 people at 26 sites in Canada and The Netherlands. Researchers actually placed a loop recorder in 256, and complete follow-up of at least 9 months occurred for 252. Enrolled patients had to be at 65 years old, and have at least one of these risk factors for AF or stroke: a CHA2DS2-VASc score of 2 or greater; documented obstructive sleep apnea; or a body mass index greater than 30 kg/m2. In addition, enrollees also had to have one of these risk factors for AF: a left atrial volume of at least 58 ml; a left atrial diameter of at least 4.4 cm; or a serum NT-proBNP level of at least 290 pg/mL.
Dr. Healey and his associates prespecified subclinical AF as at least 5 minutes of AF seen in the loop recording during follow-up, which occurred in 34% of the participants during an average 16 months of follow-up, he reported. At least 30 minutes of AF occurred in 22% during follow-up, at least 6 hours in 7%, and at least 24 hours in 3%.
In a prespecified set of subgroup analyses, people with a large left atrium formed the only subgroup with a statistically significant association with outcome. People with a left atrial size at or above the study median of 73.5 ml had an 85% increased rate of subclinical AF compared with those with smaller left atria in the multivariate analysis. But increased left atrial size alone did not fully explain subclinical atrial fibrillation. Even among participants in the lowest quartile for left atrial diameter, less than 4.3 cm, the prevalence of subclinical AF was 27%, Dr. Healey noted.
[email protected]
On Twitter @mitchelzoler
The results reported by Dr. Healey provide robust data that bridges a major gap we have had in our understanding of atrial fibrillation. The new finding of a high prevalence of subclinical atrial fibrillation in elderly people with cardiovascular risk factors, regardless of whether they had a prior stroke, substantially weakens the case that subclinical atrial fibrillation detected following a stroke has a causal relationship to the stroke. This implication is quite important.

Many questions remain about the meaning of subclinical atrial fibrillation. What relationship does it have with stroke, and what thresholds exist for atrial fibrillation to raise stroke risk? Also, what are the risks and benefits of anticoagulation in people with subclinical AF and is intermittent anticoagulation helpful?
N.A. Mark Estes III, MD , is professor of medicine and director of the New England Cardiac Arrhythmia Center at Tufts Medical Center in Boston. He has been a consultant to Boston Scientific, Medtronic and St. Jude. He made these comments as designated discussant for ASSERT-II.
The results reported by Dr. Healey provide robust data that bridges a major gap we have had in our understanding of atrial fibrillation. The new finding of a high prevalence of subclinical atrial fibrillation in elderly people with cardiovascular risk factors, regardless of whether they had a prior stroke, substantially weakens the case that subclinical atrial fibrillation detected following a stroke has a causal relationship to the stroke. This implication is quite important.
Many questions remain about the meaning of subclinical atrial fibrillation. What relationship does it have with stroke, and what thresholds exist for atrial fibrillation to raise stroke risk? Also, what are the risks and benefits of anticoagulation in people with subclinical AF and is intermittent anticoagulation helpful?
N.A. Mark Estes III, MD , is professor of medicine and director of the New England Cardiac Arrhythmia Center at Tufts Medical Center in Boston. He has been a consultant to Boston Scientific, Medtronic and St. Jude. He made these comments as designated discussant for ASSERT-II.
NEW ORLEANS – About a third of elderly people at high cardiovascular risk but otherwise healthy and asymptomatic had subclinical atrial fibrillation in a multicenter study of 273 people.
This finding that subclinical atrial fibrillation (AF) is “extremely common” in elderly people with cardiovascular risk factors “weakens the case that detecting subclinical AF in patients following a stroke implies causality” of the stroke “because subclinical AF is so prevalent,” Jeff S. Healey, MD, said at the American Heart Association Scientific Sessions.
“I think that subclinical AF is a distinct subgroup of AF, with a risk for stroke that is quite low, about 1.5%-2% per year,” said Dr. Healey, a cardiologist at McMaster University in Hamilton, Canada. “Given that this was an elderly population [study participants averaged 74 years old] with bleeding risk, it’s reasonable to question” whether many people with subclinical AF need anticoagulation. The question of whether “45 seconds of AF seen 6 months after a stroke is worthy of treatment with an anticoagulant should give people pause,” he said.
The Prevalence of Sub-Clinical Atrial Fibrillation Using an Implantable Cardiac Monitor (ASSERT-II) study initially enrolled 273 people at 26 sites in Canada and The Netherlands. Researchers actually placed a loop recorder in 256, and complete follow-up of at least 9 months occurred for 252. Enrolled patients had to be at 65 years old, and have at least one of these risk factors for AF or stroke: a CHA2DS2-VASc score of 2 or greater; documented obstructive sleep apnea; or a body mass index greater than 30 kg/m2. In addition, enrollees also had to have one of these risk factors for AF: a left atrial volume of at least 58 ml; a left atrial diameter of at least 4.4 cm; or a serum NT-proBNP level of at least 290 pg/mL.
Dr. Healey and his associates prespecified subclinical AF as at least 5 minutes of AF seen in the loop recording during follow-up, which occurred in 34% of the participants during an average 16 months of follow-up, he reported. At least 30 minutes of AF occurred in 22% during follow-up, at least 6 hours in 7%, and at least 24 hours in 3%.
In a prespecified set of subgroup analyses, people with a large left atrium formed the only subgroup with a statistically significant association with outcome. People with a left atrial size at or above the study median of 73.5 ml had an 85% increased rate of subclinical AF compared with those with smaller left atria in the multivariate analysis. But increased left atrial size alone did not fully explain subclinical atrial fibrillation. Even among participants in the lowest quartile for left atrial diameter, less than 4.3 cm, the prevalence of subclinical AF was 27%, Dr. Healey noted.
[email protected]
On Twitter @mitchelzoler
AT THE AHA SCIENTIFIC SESSIONS
Key clinical point:
Major finding: One-third of asymptomatic elderly people with cardiovascular risk factors had subclinical atrial fibrillation.
Data source: A multicenter study with 252 people followed for an average of 16 months.
Disclosures: Dr. Healey has been a consultant to or received honoraria from Bayer, Medtronic, Pfizer and Servier. He has received research support from Boehringer Ingelheim, Boston Scientific, Bristol-Myers Squibb, Medtronic and St. Jude.