User login
‘Negative’ appendectomy = longer LOS, higher morbidity
Among adults, “negative” appendectomy, or appendectomy in which the surgeon discovers there is no appendicitis, is associated with a prolonged hospital stay, greater morbidity, and higher costs than is curative nonperforated appendectomy, according to a report in the American Journal of Surgery.
“Many argue that negative appendectomy is justified to decrease the risk of perforated appendicitis, as it has been accepted that an inverse relationship exists between the rates of negative appendectomy and perforated appendicitis. However, with the increasing prevalence of preoperative imaging, the rate of negative appendectomy has been decreasing, whereas the rate of perforated appendicitis has remained largely the same,” said Kyle Mock, MD, of the department of surgery, Harbor-University of California Los Angeles Medical Center, and his associates (Am J Surg. 2016;212[6]:1076-82). The study found that the prevalence of negative appendectomy decreased from 4.5% to 2.8% in California from 2005 to 2011, while the prevalence of perforated appendicitis decreased from 23.1% to 21.7%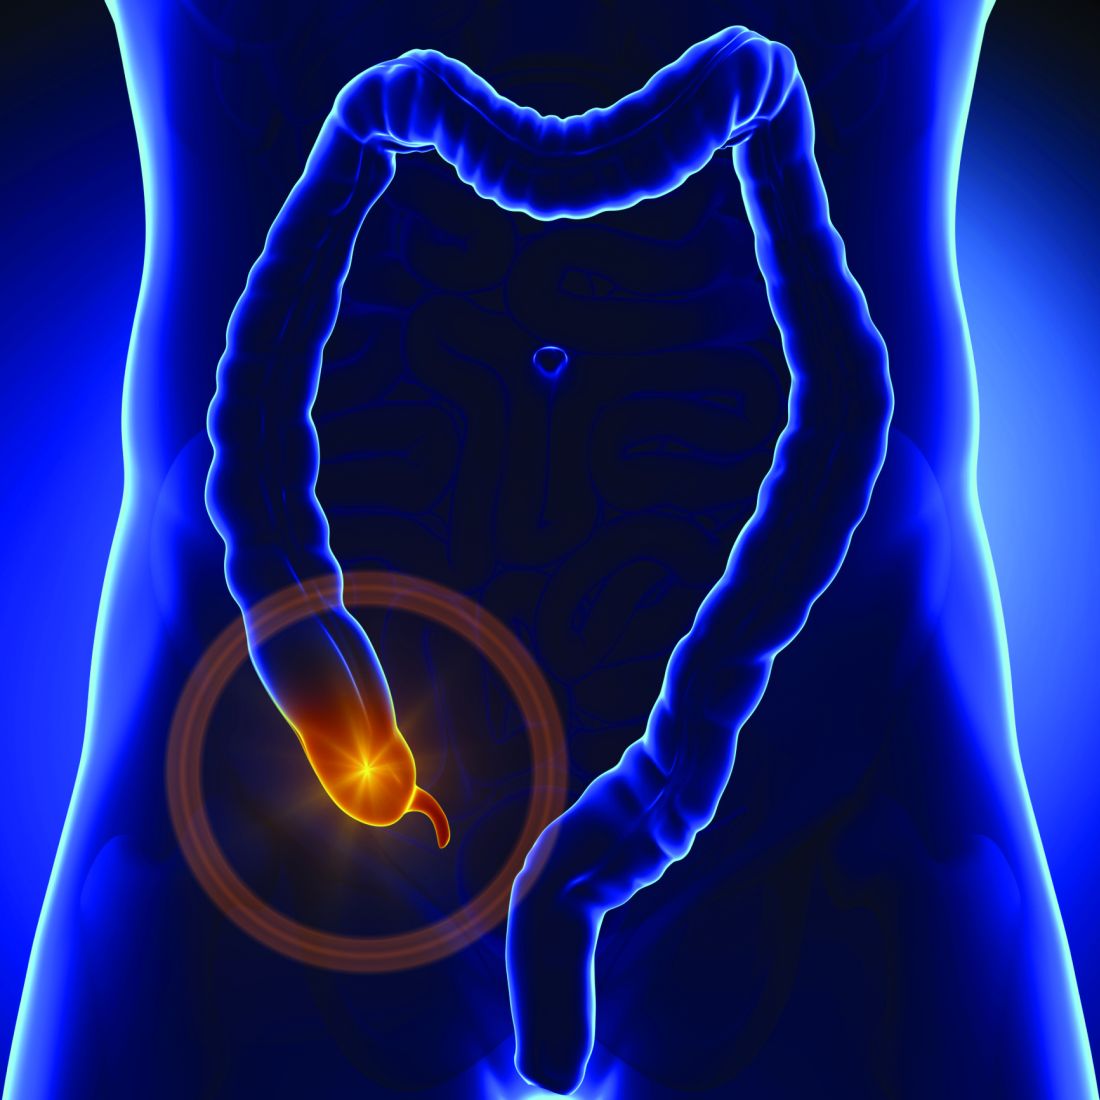
To examine this issue, Dr. Mock and his associates analyzed information from a statewide California inpatient database, focusing on 180,958 adult appendectomy admissions during a 6-year period. Compared with nonperforated appendectomy, negative appendectomy required an additional 0.8 days in length of stay, was associated with greater morbidity, and cost approximately $1,063 more per patient. Rates of negative appendectomy also did not correlate with rates of appendiceal perforation, so negative appendectomy cannot be said to prevent what otherwise would have been a ruptured appendix.
“Consequently, negative appendectomy should no longer be thought of as a benign procedure,” the investigators said.
It is important to note that patients who undergo negative appendectomy likely have other disease processes underlying their signs and symptoms, and they likely require longer hospitalization and incur greater morbidity and costs to identify and treat these alternative disorders. In contrast, patients who undergo routine appendectomy usually are discharged home the same day, Dr. Mock and his associates added.
This researchers had no financial relationships or sources of support in the form of grants, equipment, or drugs. Dr. Mock and his associates reported having no relevant conflicts of interest.
Key clinical point: In adults, “negative” appendectomy – appendectomy in which the surgeon discovers there is no appendicitis – is associated with longer length of stay, higher morbidity, and higher costs than curative appendectomy.
Major finding: Compared with nonperforated appendectomy, negative appendectomy required an additional 0.8 days in length of stay, was associated with greater morbidity, and cost approximately $1,063 more per patient.
Data source: An analysis of information regarding 180,958 appendectomies performed during a 6-year period and detailed in a state (California) inpatient database.
Disclosures: The researchers had no financial relationships or sources of support in the form of grants, equipment, or drugs. Dr. Mock and his associates reported having no relevant conflicts of interest.
Clinical, practice, and policy trends: a round-up and review of the 2016 oncology landscape
We end this year with yet another encouraging list from the US Food and Drug Administration (FDA) of new drugs or expanded uses for some previously approved drugs for patients with life-threatening cancers. As clinicians focused on delivering quality, cost-effective care to our patients, that is exciting, but the overarching issues of dosing specificity, increasingly specific gene mutation testing, and complex therapy sequencing requirements explain another major trend of 2016: the increasing adoption of standardized pathways. In addition, given the continued explosion in drug pricing and the expanding use of high-cost drugs in more common diseases and in more lines of therapy, payers and providers are working to incorporate expanded decision support tools such as pathways to guide and optimally monitor therapies for patients.
Click on the PDF icon below to read the full article.
Unless it is diagnosed, obesity won’t be treated
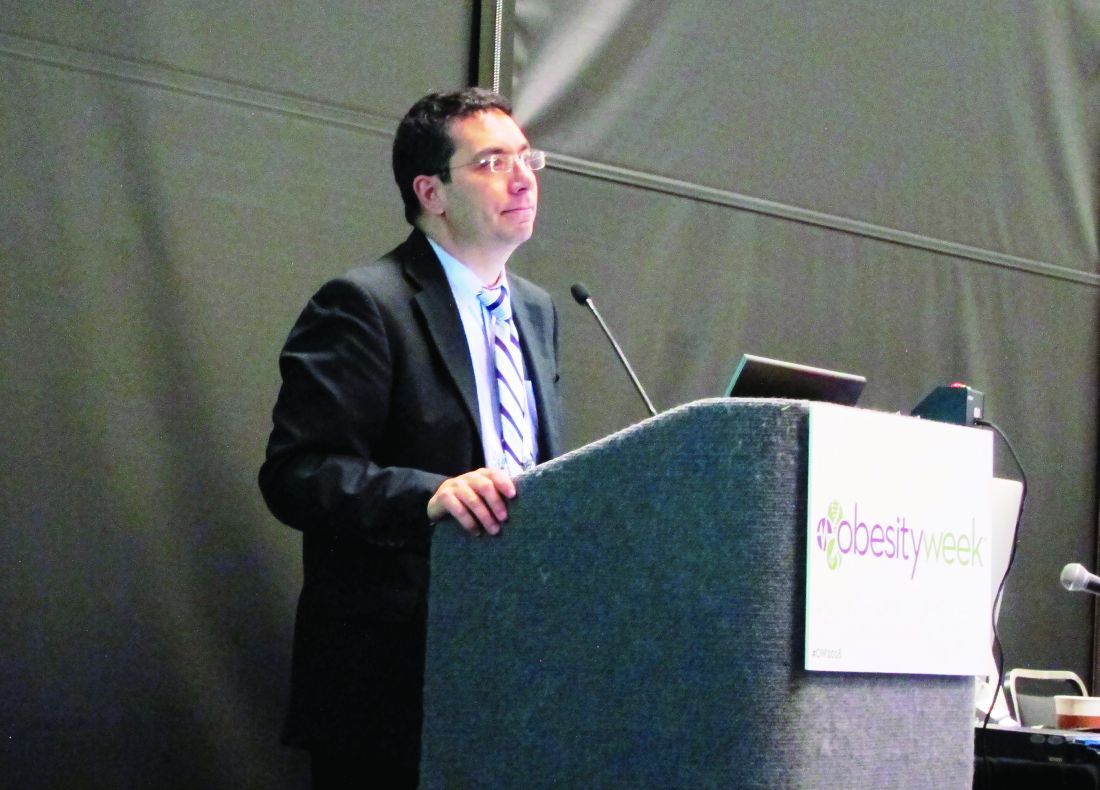
NEW ORLEANS – Obesity has been formally diagnosed in less than half of patients with a body-mass index of 30 kg/m2 or higher in the Cleveland Clinic’s large multispecialty database, and Bartolome Burguera, MD, believes it’s the same story elsewhere.
“I think pretty much all over the country obesity is really not well diagnosed,” Dr. Burguera, director of obesity programs at the Cleveland Clinic, said at Obesity Week 2016.
And that which hasn’t been diagnosed doesn’t get treated.
The diagnosis rate went up with higher BMIs; still, of the 25,137 patients with obesity class 3 as defined by a BMI of 40 kg/m2 or higher, only 75% had a formal diagnosis of obesity in their record, the endocrinologist said at the meeting presented by the Obesity Society and the American Society for Metabolic and Bariatric Surgery.
“For many years, physicians thought that obesity is not a disease. And even though it was considered a disease by some, they didn’t feel they had the tools, the knowledge, the support, the medications, or the time to take care of obesity, especially when they thought of it as a self-inflicted disease,” Dr. Burguera explained in an interview. He believes physician attitudes are slowly changing.
“In our clinic we’ve taken measures to change attitudes, for sure. Now, when we look in the electronic health record we get an automatic alert if the patient has a BMI of 30 or more,” he said.
“I think, in general, many more people now think of obesity as a disease. But it’s a chronic disease and you have to have chronic therapy. We have to make sure we make the diagnosis, and once you make the diagnosis you have to discuss treatment with the patient. If you don’t feel comfortable for whatever reason, I think you have to refer the patient to a colleague to take care of the obesity. Because when you take care of the obesity all the comorbidities get better: the diabetes, the blood pressure, the cholesterol. Obesity is the primary problem in so many other comorbidities. We have put little effort to this point in taking care of the obesity. We’ve put more effort into treating the diabetes and the other comorbidities,” Dr. Burguera said.
The Medicare obesity benefit provides reimbursement in primary care settings for intensive behavioral therapy with face-to-face counseling and motivational interviewing. The billing code is G0447. Coverage is provided for 22 visits over the course of a year, each lasting 15 minutes.
Dr. Batsis presented highlights of his published serial cross-sectional analysis of fee-for-service Medicare claims data for 2012 and 2013. Among Medicare beneficiaries eligible for the obesity benefit because they had a BMI of 30 kg/m2 or above, only 0.35% used the benefit in 2012. There was a tiny uptick to 0.6% in 2013, but even in the tiny fraction of eligible patients who availed themselves of the benefit, the average number of behavioral therapy sessions was just 2.1 visits out of the 22 for which physician reimbursement is available (Obesity. 2016 Sep;24[9]:1983-8).
“Let’s hope the 2014 data look a little better,” commented Dr. Batsis of the Dartmouth Institute for Health Policy and Clinical Practice in Lebanon, N.H.
There was marked regional variation in utilization of the Medicare obesity benefit across the U.S. in 2013. Rates were highest in Colorado – the state with the lowest obesity rate in the country – as well as Nebraska, Wisconsin, Vermont, and New Hampshire. Rates were lowest across the Southwest.
Dr. Burguera’s study was funded by Novo Nordisk. Dr. Batsis reported having no financial conflicts of interest.
AT OBESITY WEEK 2016
Key clinical point:
Major finding: Only 48% of a large group of patients with a BMI of 30 kg/m2 or higher had a formal diagnosis of obesity in their medical record.
Data source: This was a cross-sectional study of the electronic health records of nearly 325,000 active patients in the Cleveland Clinic database, 41.5% of whom had a BMI of 30 kg/m2 or higher.
Disclosures: The study was funded by Novo Nordisk.
How Can VA Expand Best Practices in Cancer Care?
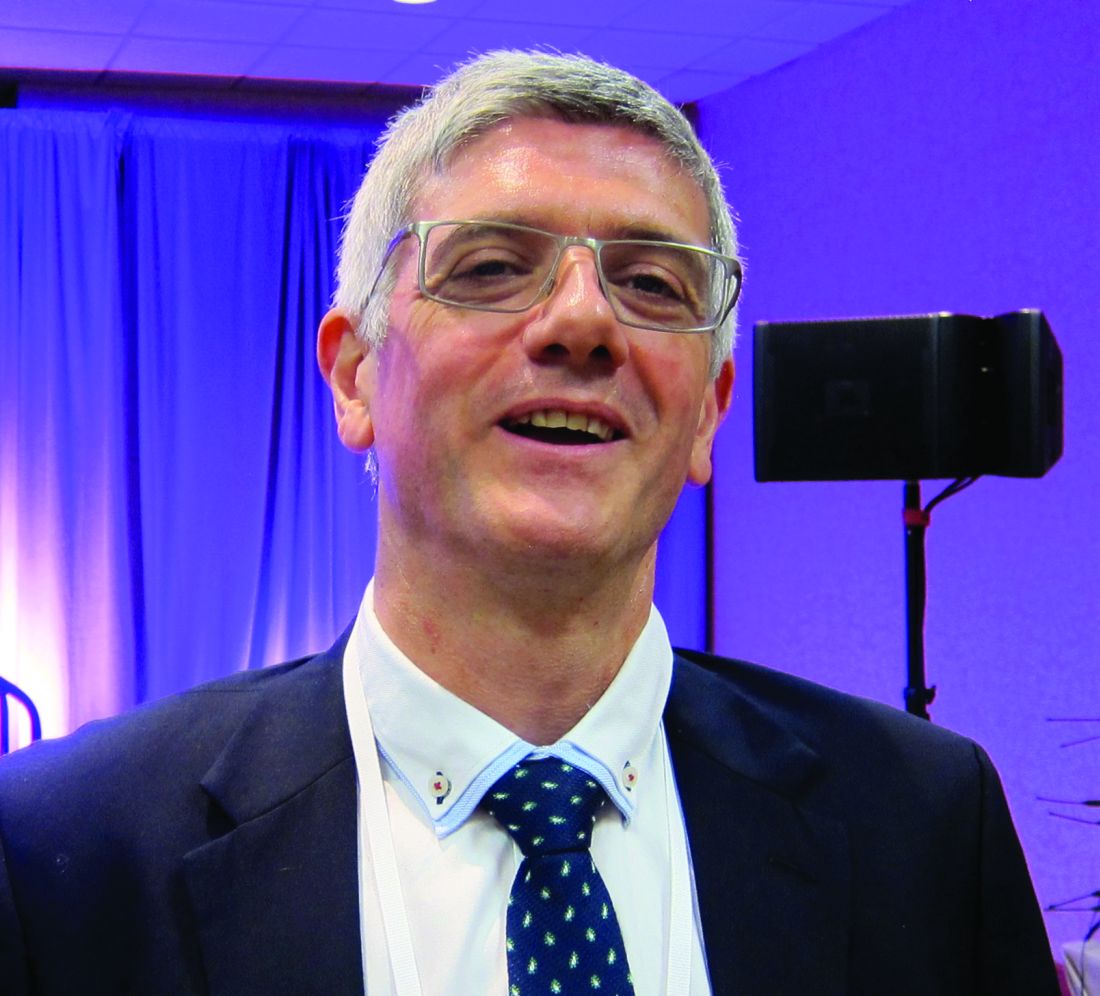
What are the clinical best practices and how can the VA expand these specialty care innovations and patient care advances across the entire health care system? To understand the progress being made by the VA, Federal Practitioner sat down with Assistant Deputy Under Secretary for Health, for Quality, Safety, and Value Shereef M. Elnahal, MD, MBA, at the Launch Pad: Pathways to Cancer Innovation summit to discuss the Diffusion of Excellence program he is currently leading.
Dr. Elnahal discusses the development of virtual tumor, clinical pharmacy specialists, and the more than 400 other programs under consideration as well as the many programs already being replicated across multiple sites.
The video associated with this article is no longer available on this site. Please view all of our videos on the MDedge YouTube channel
Assay could make blood supply safer, groups say

Photo by Alex Luster
with The Storyhive
Two groups of researchers have reported that an assay can accurately diagnose patients with variant Creutzfeldt-Jakob disease (vCJD), and this could allow for effective detection of prion contamination in donated blood.
The groups both said they were able to detect vCJD with 100% sensitivity and specificity.
One group even detected abnormal prion proteins in the blood of 2 subjects before the individuals exhibited any signs of vCJD.
The researchers said this work paves the way to a noninvasive, early diagnostic screen for vCJD and possibly other conditions involving protein misfolding.
Both studies were published in Science Translational Medicine.
“Our findings, which need to be confirmed in further studies, suggest that our method of detection could be useful for the noninvasive diagnosis of this disease in pre-symptomatic individuals,” said Claudio Soto, MD, author of one of the studies and a professor at the University of Texas Medical School in Houston.
“Early diagnosis would allow any potential therapy to be given before substantial brain damage has occurred. In the case of the blood supply, availability of a procedure to efficiently detect small quantities of the infectious agent would allow removal of blood units contaminated with prions so that new cases can be minimized substantially.”
For their study, Dr Soto and his colleagues used a protein misfolding cyclic amplification assay (PMCA) they developed, which mimics the prion replication process in vitro that occurs in prion disease.
The team used the assay to screen for abnormal prion proteins in blood from 14 individuals with vCJD and 153 control subjects.
In another study, Daisy Bougard, PhD, of Etablissement Français du Sang, INSERM, Université de Montpellier in France, and her colleagues tested a similar technique on blood samples from 18 individuals with vCJD and 238 without vCJD.
Dr Bougard’s group used the same PMCA as Dr Soto’s group. But Dr Bougard and her colleagues first captured prions from blood using plasminogen-coated beads.
In both studies, the PMCA diagnosed vCJD with 100% sensitivity and 100% specificity.
Dr Bougard and her colleagues were able to detect small amounts of prions in 2 blood donors more than a year before the onset of symptoms.
The researchers stressed that these results will need to be confirmed in a larger number of blood samples. ![]()
G-CHOP no better than R-CHOP in previously untreated DLBCL
SAN DIEGO—Substituting obinutuzumab for rituximab in combination with CHOP chemotherapy does not improve outcomes in patients with previously untreated diffuse large B-cell lymphoma (DLBCL), according to a study presented at the 2016 ASH Annual Meeting.
In this phase 3 trial, known as GOYA, researchers compared obinutuzumab plus CHOP (G-CHOP) to rituximab plus CHOP (R-CHOP) in patients with previously untreated DLBCL.
There were no significant differences between the treatment arms with regard to response rates, progression-free survival (PFS), or overall survival (OS).
In addition, grade 3-5 adverse events (AEs) and serious AEs were more common with G-CHOP than with R-CHOP.
“Rituximab plus CHOP remains the standard of care in this setting,” said study investigator Umberto Vitolo, MD, of the Universitaria Città della Salute e della Scienza di Torino in Torino, Italy.
“Further analyses of the data from this trial will inform and shape the direction of future research activities in DLBCL.”
Dr Vitolo presented results from GOYA at ASH as abstract 470.
Obinutuzumab is a glycoengineered, type II, anti-CD20 monoclonal antibody said to have greater direct cell death induction and antibody-dependent cellular cytotoxicity/phagocytosis activity than rituximab.
In the phase 2 GATHER trial, G-CHOP demonstrated manageable toxicity and promising preliminary efficacy in patients with advanced, untreated DLBCL.
So with the phase 3 GOYA trial, researchers wanted to compare G-CHOP to R-CHOP in DLBCL. The trial enrolled 1418 patients (median age 62) with previously untreated DLBCL.
Patients from 207 centers around the world were randomized to receive eight 21-day cycles of obinutuzumab at 1000 mg intravenously on days 1, 8, and 15 in cycle 1 and day 1 in cycles 2 to 8 (n=706) or rituximab at 375 mg/m2 intravenously on day 1 (n=712) in combination with 6 or 8 cycles of CHOP. Preplanned radiotherapy was allowed for bulky or extranodal disease.
Dr Vitolo said baseline characteristics were well balanced between the 2 treatment arms. Cell-of-origin distribution, as assessed by gene-expression profiling, was similar in both arms.
Virtually all (88%) of the patients received more than 90% of the planned cumulative dose of chemotherapy. Antibody dose delays were more common in the G-CHOP arm.
Efficacy
The median follow-up was 29 months.
For the primary endpoint of investigator-assessed PFS, there was no significant difference between the G-CHOP and R-CHOP arms. The 3-year PFS was 69.6% for G-CHOP and 66.9% for R-CHOP (hazard ratio [HR]=0.92, P=0.3868).
There were no clinically meaningful differences observed between the treatment arms in terms of secondary endpoints, including OS, end-of-treatment overall response rate, and complete response rate, with or without PET scanning.
At the end of treatment, the overall response rates, according to CT and PET, were 77.9% in the R-CHOP arm and 77.4% in the G-CHOP arm. The complete response rates were 59.5% and 56.7%, respectively.
The 3-year OS rate was 81.4% in the R-CHOP arm and 81.2% in the G-CHOP arm (HR=1.00, P=0.9982).
In a pre-specified subgroup analysis of investigator-assessed PFS, there was a slight trend toward improved PFS in favor of G-CHOP for patients with GCB DLBCL, with a 3-year PFS of 79% vs 70% for R-CHOP (HR=0.72).
Safety
No new safety signals were identified. Grade 3 or higher AEs and serious AEs were more common in the G-CHOP arm than the R-CHOP arm. The incidence of grade 3-5 AEs was 73.7% and 64.7%, respectively. The incidence of serious AEs was 42.6% and 37.6%, respectively.
Certain grade 3-5 AEs were more common with G-CHOP than R-CHOP, including neutropenia (46.2% vs 38.1%), infusion-related reactions (2.8% vs 0.6%), infections (19.2% vs 15.5%), and thrombocytopenia 4.4% vs 1.4%).
AEs resulting in withdrawal from treatment and AEs with fatal outcomes were slightly more common with G-CHOP than with R-CHOP. AEs leading to withdrawal occurred in 11.9% and 8.5% of patients, respectively.
Fatal AEs (listed by preferred term) in the G-CHOP arm included septic shock (n=6, 0.9%), pneumonia (n=5, 0.7%), death (n=3, 0.4%), pulmonary embolism (n=2, 1.3%), and cerebrovascular accident (n=2, 0.3%).
Fatal AEs in the R-CHOP arm included pneumonia (n=6, 0.9%), sepsis (n=3, 0.4%), cerebrovascular accident (n=2, 0.3%), and death (n=2, 0.3%). ![]()
Combined checkpoint blockade promising in HL
© Todd Buchanan 2016
SAN DIEGO—Immune checkpoint blockade with nivolumab plus ipilimumab has shown promise in treating hematologic malignancies, particularly classical Hodgkin lymphoma (HL), based on results of the combination cohort of the phase 1 CheckMate 039 study.
Thirty-one heavily pre-treated HL patients achieved an overall response rate (ORR) of 74%, including 6 complete responses.
And in transplant-naïve HL patients, the combination produced an ORR of 67%.
“Most in the room would be familiar with the excellent results that we have seen with monotherapy with nivolumab,” Stephen Ansell, MD, PhD, of the Mayo Clinic in Rochester, Minnesota, said at the 2016 ASH Annual Meeting.
“In classical Hodgkin lymphoma, we’ve seen meaningful and clinically quite stellar results and durable responses.”
“Our plan was, as part of this trial [CheckMate 039], to then move to see whether adding a further checkpoint, ipilimumab, could enhance the results seen with nivolumab.”
Dr Ansell presented the findings for the checkpoint combination as abstract 183. He disclosed research funding from Bristol-Myers Squibb, the company that funded the study.
Checkpoint inhibitors
Nivolumab and ipilimumab are both fully human monoclonal antibodies, but ipilimumab “works in a slightly different fashion from nivolumab,” Dr Ansell said.
Nivolumab targets the programmed death receptor-1 (PD-1) and disrupts PD-1 pathway signaling and restores anti-tumor T-cell function.
Ipilimumab targets cytotoxic T-lymphocyte antigen 4 (CTLA-4) and induces anti-tumor immunity.
The combination has shown superior efficacy, compared to either agent alone, in preclinical studies and a phase 1 trial of patients with advanced melanoma.
So the investigators added a combination cohort to CheckMate 039.
Combination cohort study design
Patients were eligible to enroll if they had relapsed or refractory HL, B-cell non-Hodgkin lymphoma (NHL, including follicular or diffuse large B-cell lymphoma), T-cell NHL (including cutaneous or peripheral T-cell lymphoma), or multiple myeloma (MM).
Patients could not have had prior organ or allogeneic stem cell transplant and no prior immune checkpoint blockade therapy.
Treatment consisted of nivolumab at 3 mg/kg IV plus ipilimumab at 1 mg/kg IV every 3 weeks for 4 doses. The combination phase was followed by nivolumab monotherapy at the same dose every 2 weeks for 2 years.
The primary endpoint was safety and tolerability. Secondary endpoints included investigator-assessed best overall response, duration of response, progression-free survival (PFS), and biomarker analyses.
Patient characteristics
The investigators enrolled 31 HL, 15 B-cell NHL, 11 T-cell NHL, and 7 MM patients. Most patients, Dr Ansell noted, were heavily pretreated.
HL patients were 42% male, 52% had an ECOG status of 1, and they had a median of 4 (range, 2 to 10) prior systemic therapies. Forty-two percent had prior autologous stem cell transplant (ASCT).
“Interestingly, in the Hodgkin cohort, a number of patients had not proceeded to an autologous transplant, but predominantly because these were chemo-refractory or chemo-resistant patients not eligible for a transplant,” Dr Ansell pointed out.
Of the HL patients, 18 were transplant-naïve, 13 were chemo-resistant, 3 were ineligible for ASCT, and 2 declined the procedure.
B-cell NHL patients were 73% male, and 80% had an ECOG status of 1. They had a median of 3 (range, 1 to 16) prior systemic therapies. Seven percent had a prior ASCT.
T-cell NHL patients were 55% male, 73% had an ECOG status of 1, and they had a median of 4 (range, 1 to 11) prior systemic therapies. None had a prior ASCT.
MM patients were 86% male, 71% had an ECOG status of 1, and they had a median of 5 (range, 2 to 20) prior systemic therapies. More than half had a prior ASCT.
Patient disposition
With follow-up approaching a year, more patients with HL are still on treatment (39%) compared with B-cell NHL (13%), T-cell NHL (18%), and MM (0%) patients.
“Of note, however, is that the reasons for going off treatment were predominantly disease progression,” Dr Ansell said.
“The vast majority of patients who came off treatment came off treatment because their disease progressed, and the numbers that came off because of toxicity were relatively low.”
Seven HL patients went off treatment due to disease progression and 2 due to study drug toxicity.
Eleven B-cell NHL patients went off treatment due to disease progression and 2 withdrew due to unrelated adverse events (AEs).
Five T-cell NHL patients went off treatment due to disease progression and 2 due to study drug toxicity.
And 4 MM patients withdrew due to disease progression, 1 due to study drug toxicity, and 1 due to AEs unrelated to the study drug.
About two-thirds of HL patients, over 90% of B-cell NHL patients, about 80% of T-cell NHL patients, and about 70% of MM patients received 90% or more of the intended dose of each drug.
Safety
One patient with primary mediastinal B-cell lymphoma was included in the safety analysis, for a total of 65 patients treated.
“The majority of patients had some degree of adverse event,” Dr Ansell explained. “But if one looks at the grade 3 and 4 adverse events, those were seen in a more modest number of patients, in a minority of patients. And most importantly, if one looks at the adverse events that led to discontinuation, one can see that this was in a significant minority of patients.”
Five patients discontinued due to treatment-related AEs, which were pneumonitis (n=3), pneumonia and pneumonitis (n=1), and diabetic ketoacidosis (n=1).
Overall, 51 patients (78%) experienced an AE; 19 (29%) had a grade 3–4 AE, 14 (22%) had a serious AE, and 5 (8%) discontinued due to an AE.
Of 31 HL patients, 28 (90%) had an AE, 8 (26%) had a grade 3–4 AE, 6 (19%) had a serious AE, and 2 (6%) discontinued due to an AE.
All 11 T-cell NHL patients experienced an AE, 5 patients (45%) a grade 3-4 AE, 4 patients (36%) had a serious AE, and 2 patients (18%) discontinued because of an AE.
About half of B-cell NHL and MM patients experienced an AE, with 1 MM patient discontinuing as a result of it and no B-cell NHL patient discontinuing due to an AE.
“I would highlight that most of the adverse events were, as expected, immunological in nature . . . . ,” Dr Ansell said. “A very modest number of patients had grade 3 and 4 toxicities.”
The most common drug-related AEs of any grade were fatigue (n=17; 26%), pyrexia (n=15; 23%), rash (n=7; 11%), diarrhea (n=12; 18%), and nausea, pneumonitis, cough, and infusion-related reactions, with 9 patients each (14%).
Efficacy
Twenty-three HL patients (74%) achieved an overall response, including 6 patients (19%) with a complete response and 17 (55%) with a partial response. Three patients (10%) had stable disease, and 3 (10%) had relapsed or progressive disease. Response was not reported for 2 patients (6%).
“Most of these responses are durable, and, very encouraging, you can see patients out approaching a year continuing on therapy,” Dr Ansell said.
The ORR in the 18 transplant-naive patients was 67% (n=67).
The median duration of response for HL patients was not reached and ranged from 0.0 to 13.4 months.
B-cell NHL patients had an ORR of 20% (n=3). There were no complete responses and 3 (20%) partial responses. One patient (7%) had stable disease, and 8 (53%) had relapsed or progressive disase. The median duration of partial response was not reached and ranged from 11.0 to 12.7 months.
T-cell NHL patients had an ORR of 9% (n=1). There were no complete responses and 1 (9%) partial response. Four patients (36%) had stable disease, and 3 (27%) had relapsed or progressive disease. The median duration of partial response was not reached and was 3.9 months.
Except for 1 patient with stable disease, MM patients did not respond to therapy.
Biomarker analysis
All 19 HL patients with a known PD-L1 status at baseline saw their tumor burden decrease to below baseline levels. This may be because HL is characterized by high PD-L1 expression and high responsiveness to checkpoint blockade.
Patients with NHL, on the other hand, have a diverse group of tumors characterized by variable PD-L1 expression. Eight of 13 patients with known expression saw their tumor burden decrease with treatment to below baseline.
Encouraged by the results, the investigators believe further investigation of the combination is in order, as the combination, with limited follow-up, achieved a high and durable ORR in HL patients, including those who were transplant-naïve. ![]()
Drug granted fast track designation for PNH
The US Food and Drug Administration (FDA) has granted fast track designation for the complement C3 inhibitor APL-2.
The designation applies to APL-2 in the treatment of patients with paroxysmal nocturnal hemoglobinuria (PNH) who continue to experience hemolysis and require red blood cell transfusions despite receiving therapy with eculizumab.
APL-2 is also being developed as a treatment for PNH patients not previously treated with eculizumab.
The company developing APL-2 is Apellis Pharmaceuticals, Inc.
APL-2 is a synthetic cyclic peptide conjugated to a polyethylene glycol polymer that binds specifically to C3 and C3b, blocking all 3 pathways of complement activation (classical, lectin, and alternative).
According to Apellis, this comprehensive inhibition of complement-mediated pathology may have the potential to control symptoms and modify underlying disease in patients with PNH.
Results from a pair of phase 1 studies of APL-2 in healthy volunteers were recently presented at the 2016 ASH Annual Meeting (abstract 1251).
Now, Apellis is evaluating APL-2 in a pair of phase 1b clinical trials of patients with PNH.
In PADDOCK (NCT02588833), researchers are assessing the safety, tolerability, pharmacokinetics, pharmacodynamics, and preliminary efficacy of multiple doses of APL-2 administered by daily subcutaneous injection in patients with PNH who have not received the standard of care in the past.
In PHAROAH (NCT02264639), researchers are assessing the safety, tolerability, pharmacokinetics, and pharmacodynamics of single and multiple doses of APL-2 administered by subcutaneous injection as an add-on to the standard of care in patients with PNH.
About fast track designation
The FDA’s fast track program is designed to facilitate the development and expedite the review of products intended to treat or prevent serious or life-threatening conditions and address unmet medical need.
Through the FDA’s fast track program, a product may be eligible for priority review. In addition, the company developing the product may be allowed to submit sections of the biologic license application or new drug application on a rolling basis as data become available.
Fast track designation also provides the company with opportunities for more frequent meetings and written communications with the FDA. ![]()
Malodorous, itchy feet
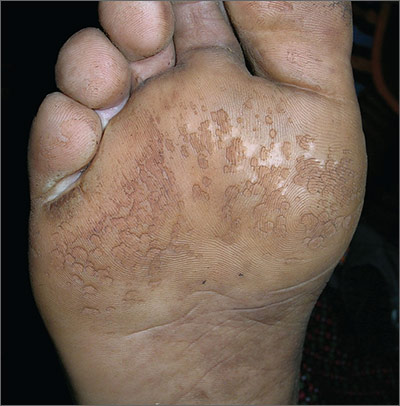
This patient was suffering from pitted keratolysis and interdigital tinea pedis. Pitted keratolysis is caused by the bacterium Kytococcus sedentarius. Like tinea pedis, moist and sweaty feet provide a great environment for growth of this organism. The patient admitted to having sweaty feet—especially while playing soccer for hours. He also didn’t use shower shoes in the gym shower.
In pitted keratolysis, the bacteria live on the dead cells of the stratum corneum of the sole and form visible pits. In interdigital tinea pedis, the skin between the toes is white in appearance.
The FP recommended that the patient wear shower shoes and change his socks during the day if they become sweaty. He also prescribed topical 2% erythromycin solution to apply twice daily to the area with visible pits. In addition, the FP recommended that the patient buy over-the-counter topical terbinafine cream and apply it between the toes once or twice daily—especially after drying his feet well after a shower. A month later, both infections were clear.
Photos and text for Photo Rounds Friday courtesy of Richard P. Usatine, MD. This case was adapted from: Usatine R, Reppa R. Tinea pedis. In: Usatine R, Smith M, Mayeaux EJ, et al, eds. Color Atlas of Family Medicine. 2nd ed. New York, NY: McGraw-Hill; 2013:799-804.
To learn more about the Color Atlas of Family Medicine, see: www.amazon.com/Color-Family-Medicine-Richard-Usatine/dp/0071769641/
You can now get the second edition of the Color Atlas of Family Medicine as an app by clicking on this link: usatinemedia.com
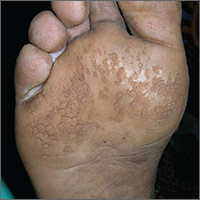
Pain after hernia repair shows improvement at 6 months
Patients who have undergone open ventral abdominal hernia repair see significant improvements in some self-reported pain measures at 6 or more months after surgery, according to results from a new study.
The investigators, led by Eugene Park, MD, of Northwestern University, Chicago, suggested that the timing of the improvements may have to do with the mesh used in the surgeries.
For their research, published in the January issue of The American Journal of Surgery (2017;213:58-63), Dr. Park and his colleagues recruited 77 patients scheduled for midline incisional ventral hernia repair between 2010 and 2013 (mean age, 54 years; 45% female), who completed detailed pain surveys before surgery and during all postoperative visits; 38 patients completed surveys at least 6 months after surgery. All surgeries were performed by one of the study authors, Gregory A. Dumanian, MD, also of Northwestern.
The investigators used pain surveys from the Patient-Reported Outcomes Measurement Information System (PROMIS), which was developed under the National Institutes of Health. The investigators called the PROMIS surveys, which are computer based, a “rigorous and reliable tool” to measure patient feedback in clinical research and healthcare settings. PROMIS is designed to measure, among other things, how pain impacts a patient’s behavior and interferes with his or her everyday functioning.
Dr. Park and his colleagues reported that the patients with at least 6 months of follow-up saw significant improvement in measures of pain interference (P less than 0.05), though not in pain behavior.
The researchers wrote in their analysis that the mesh used in securing the hernia repair – all patients in the study were treated with some type of mesh – might be why pain scores were seen to improve significantly at around 6 months.
“The changes noted in pain interference at the 4- to 8-month time frame may represent a physiologic change as the mesh solidly integrates and begins to contribute to a patient’s increasing ability to perform tasks.”
The mesh used in the study, the researchers also noted, was narrower than that generally reported for hernia repairs of this type.
Dr. Park and his colleagues described as limitations of their study the relatively small number of patients completing long-term follow-up. Also, the investigators noted, the PROMIS pain interference and pain behavior surveys “were not designed specifically with ventral hernia patients in mind, which may limit the scope of hernia-related symptoms covered” and that data on patients’ use of pain medications was not recorded.
The study authors reported no outside funding or conflicts of interest related to their findings.
Key clinical point: People undergoing open ventral hernia repair saw significant improvements in self-reported pain starting at about 6 months after their procedures.
Major finding: Reported reductions of pain interference were significant among patients with 6 or more months’ follow-up (P less than .05).
Data source: 77 patients undergoing open ventral hernia repairs who completed validated pain questionnaires pre- and post-surgery; of these, 38 had follow-up of 6 months or longer.
Disclosures: None.