User login
Ibuprofen plus acetaminophen works well for postop Mohs pain
EXPERT ANALYSIS FROM THE ACMS ANNUAL MEETING
ORLANDO – An alternating schedule of ibuprofen and acetaminophen every 3 hours is an excellent method of managing postoperative pain associated with Mohs surgery, especially if the initial dose is taken at the start of the procedure.
By starting with ibuprofen, the regimen capitalizes on the drug’s anti-inflammatory component to reduce overall postoperative analgesic requirement, Dr. Bryan Carroll said at the annual meeting of the American College of Mohs Surgery.

“This combination has even been shown to be superior to narcotics, both alone and in combination,” said Dr. Carroll, director of dermatologic surgery at Eastern Virginia Medical School, Norfolk. “This finding has been reinforced in the Mohs literature,” he added, citing a study that found the combination of acetaminophen and ibuprofen was more effective than acetaminophen alone or acetaminophen with codeine in controlling pain after Mohs surgery and reconstruction (Dermatol Surg. 2011 Jul;37[7]:1007-13).
Alternately layering the analgesics allows both to build to a maximum concentration in the blood without any nadirs where pain can get a foothold, an important concept in pain management, Dr. Carroll said.
And having two medications on board allows simultaneous targeting of different portions of the pain signaling pathway, he added. Ibuprofen works at the points of transduction and transmission, while acetaminophen works at the points of transmission and perception.
Dr. Carroll’s regimen starts at the time of surgery, when patients receive 400 mg ibuprofen. Three hours later, they receive 1 gram of acetaminophen; this dose should be adjusted for patients older than 60 years, who should not get more than 3 grams in 24 hours, and for those with liver failure, who should be limited to 2 grams over 24 hours.
This alternating dose is repeated every 3 hours. By the time of discharge, most patients have had at least two doses. This schedule is usually sufficient for patients at moderate to high risk of uncontrolled pain, who can then manage their discomfort with either drug the next day, he said.
Patients at higher risk of uncontrolled pain can use the regimen for the first day, and then titrate off according to their comfort. Some of these patients, however, may benefit from oxycodone, with the addition of laxative and an antiemetic, he noted.
The layering technique provides consistent postoperative pain relief that’s effective for most patients – even those who undergo substantial reconstruction, Dr. Carroll said in an interview. “This schedule is sufficient for all of our procedures, including larger reconstructions such as forehead flaps and cervicofacial rotation flaps. But additional interventions are indicated for patients with a high risk of uncontrolled pain. It’s the patient, not the procedure, which determines need for escalation.”
Teasing out those patients who may need more assertive pain management should be done in a preoperative assessment, Dr. Carroll said. A patient’s expectations of pain and history of chronic pain are some of the biggest factors in predicting a patient who will have uncontrolled pain.
“The experience of pain in Mohs surgery has limited studies,” he said. “Only a handful of investigations have looked at predictors that could help us plan. But of these, two things do stand out: a patient’s expectation of pain and a patient’s history of chronic pain.”
Surprisingly, he said, studies have determined that even a modestly elevated expectation of pain is enough to tip patients into a high-risk category. “If a patient predicted that his pain would be a 4 on a 1-10 scale, that was correlated with a lack of pain control during the operative experience. Maybe we’d expect this correlation if the expectation was an 8 or a 10, but a 4 was surprising. If a patient has even that amount of concern, I start thinking about additional interventions I can provide to maximize comfort.”
A patient’s past experience with pain is also a very large factor in how that person will experience postoperative pain. “Chronic pain does correlate with uncontrolled pain during surgery. I always ask about it. And this talk also helps drive your conversation about what you will be doing to keep them comfortable.”
That chat should include an explanation of how chronic and acute pain differ, Dr. Carroll said. “Chronic and acute pain involve different pathways and need different interventions. If the patient expresses fear, saying something like, ‘Tylenol is like water to me,’ believe him. It is like water for chronic pain. But you can also tell that patient that chronic pain is different from acute pain, and that acetaminophen will be a part of successfully managing it.”
Dr. Carroll had no financial disclosures.
EXPERT ANALYSIS FROM THE ACMS ANNUAL MEETING
ORLANDO – An alternating schedule of ibuprofen and acetaminophen every 3 hours is an excellent method of managing postoperative pain associated with Mohs surgery, especially if the initial dose is taken at the start of the procedure.
By starting with ibuprofen, the regimen capitalizes on the drug’s anti-inflammatory component to reduce overall postoperative analgesic requirement, Dr. Bryan Carroll said at the annual meeting of the American College of Mohs Surgery.
“This combination has even been shown to be superior to narcotics, both alone and in combination,” said Dr. Carroll, director of dermatologic surgery at Eastern Virginia Medical School, Norfolk. “This finding has been reinforced in the Mohs literature,” he added, citing a study that found the combination of acetaminophen and ibuprofen was more effective than acetaminophen alone or acetaminophen with codeine in controlling pain after Mohs surgery and reconstruction (Dermatol Surg. 2011 Jul;37[7]:1007-13).
Alternately layering the analgesics allows both to build to a maximum concentration in the blood without any nadirs where pain can get a foothold, an important concept in pain management, Dr. Carroll said.
And having two medications on board allows simultaneous targeting of different portions of the pain signaling pathway, he added. Ibuprofen works at the points of transduction and transmission, while acetaminophen works at the points of transmission and perception.
Dr. Carroll’s regimen starts at the time of surgery, when patients receive 400 mg ibuprofen. Three hours later, they receive 1 gram of acetaminophen; this dose should be adjusted for patients older than 60 years, who should not get more than 3 grams in 24 hours, and for those with liver failure, who should be limited to 2 grams over 24 hours.
This alternating dose is repeated every 3 hours. By the time of discharge, most patients have had at least two doses. This schedule is usually sufficient for patients at moderate to high risk of uncontrolled pain, who can then manage their discomfort with either drug the next day, he said.
Patients at higher risk of uncontrolled pain can use the regimen for the first day, and then titrate off according to their comfort. Some of these patients, however, may benefit from oxycodone, with the addition of laxative and an antiemetic, he noted.
The layering technique provides consistent postoperative pain relief that’s effective for most patients – even those who undergo substantial reconstruction, Dr. Carroll said in an interview. “This schedule is sufficient for all of our procedures, including larger reconstructions such as forehead flaps and cervicofacial rotation flaps. But additional interventions are indicated for patients with a high risk of uncontrolled pain. It’s the patient, not the procedure, which determines need for escalation.”
Teasing out those patients who may need more assertive pain management should be done in a preoperative assessment, Dr. Carroll said. A patient’s expectations of pain and history of chronic pain are some of the biggest factors in predicting a patient who will have uncontrolled pain.
“The experience of pain in Mohs surgery has limited studies,” he said. “Only a handful of investigations have looked at predictors that could help us plan. But of these, two things do stand out: a patient’s expectation of pain and a patient’s history of chronic pain.”
Surprisingly, he said, studies have determined that even a modestly elevated expectation of pain is enough to tip patients into a high-risk category. “If a patient predicted that his pain would be a 4 on a 1-10 scale, that was correlated with a lack of pain control during the operative experience. Maybe we’d expect this correlation if the expectation was an 8 or a 10, but a 4 was surprising. If a patient has even that amount of concern, I start thinking about additional interventions I can provide to maximize comfort.”
A patient’s past experience with pain is also a very large factor in how that person will experience postoperative pain. “Chronic pain does correlate with uncontrolled pain during surgery. I always ask about it. And this talk also helps drive your conversation about what you will be doing to keep them comfortable.”
That chat should include an explanation of how chronic and acute pain differ, Dr. Carroll said. “Chronic and acute pain involve different pathways and need different interventions. If the patient expresses fear, saying something like, ‘Tylenol is like water to me,’ believe him. It is like water for chronic pain. But you can also tell that patient that chronic pain is different from acute pain, and that acetaminophen will be a part of successfully managing it.”
Dr. Carroll had no financial disclosures.

Drug Reactions
Review the PDF of the fact sheet on drug reactions with board-relevant, easy-to-review material. This month's fact sheet will review common drug reactions including their clinical presentation, associated signs, symptoms and laboratory abnormalities, time of onset, implicated drugs, pathology, and treatment and mortality.
Practice Questions
1. RegiSCAR is a scoring method used for what drug reaction?
a. RegiSCAR is a diagnostic scoring method for DRESS/DIHS
b. RegiSCAR is a diagnostic scoring method for FDE
c. RegiSCAR is a diagnostic scoring method for SJS
d. RegiSCAR predicts mortality rate for AGEP
e. RegiSCAR predicts mortality rate for SJS
2. DRESS/DIHS is associated with what mortality rate?
a. 0%
b. 1%–5%
c. 5%–10%
d. 5%–30%
e. 10%–40%
3. Unlike other drug eruptions that typically develop 1 to 2 weeks after drug initiation, which drug eruption has a relatively late onset, often 3 weeks after drug initiation?
a. AGEP
b. DRESS/DIHS
c. exanthematous/morbilliform drug eruption
d. FDE
e. SJS
4. A patient develops a morbilliform eruption 14 days after starting an anticonvulsant. What additional finding(s) make DRESS/DIHS more likely than a common morbilliform drug rash?
a. hypocalcemia
b. lymphadenopathy
c. prominent facial edema
d. A and C
e. B and C
5. Which drug is commonly implicated in the nonpigmenting variant of FDE?
a. barbiturates
b. carbamazepine
c. NSAIDs
d. pseudoephedrine
e. sulfonamides
Answers to practice questions provided on next page
Practice Question Answers
1. RegiSCAR is a scoring method used for what drug reaction?
a. RegiSCAR is a diagnostic scoring method for DRESS/DIHS
b. RegiSCAR is a diagnostic scoring method for FDE
c. RegiSCAR is a diagnostic scoring method for SJS
d. RegiSCAR predicts mortality rate for AGEP
e. RegiSCAR predicts mortality rate for SJS
2. DRESS/DIHS is associated with what mortality rate?
a. 0%
b. 1%–5%
c. 5%–10%
d. 5%–30%
e. 10%–40%
3. Unlike other drug eruptions that typically develop 1 to 2 weeks after drug initiation, which drug eruption has a relatively late onset, often 3 weeks after drug initiation?
a. AGEP
b. DRESS/DIHS
c. exanthematous/morbilliform drug eruption
d. FDE
e. SJS
4. A patient develops a morbilliform eruption 14 days after starting an anticonvulsant. What additional finding(s) make DRESS/DIHS more likely than a common morbilliform drug rash?
a. hypocalcemia
b. lymphadenopath
c. prominent facial edema
d. A and C
e. B and C
5. Which drug is commonly implicated in the nonpigmenting variant of FDE?
a. barbiturates
b. carbamazepine
c. NSAIDs
d. pseudoephedrine
e. sulfonamides

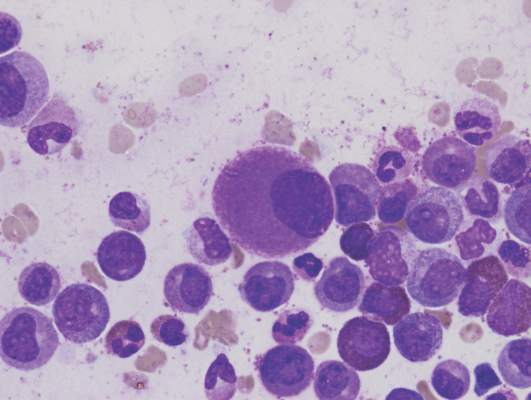
Dasatinib bests imatinib on molecular, cytogenic response rates in CML
Overall survival and progression-free survival were similar at 5 years in chronic myeloid leukemia patients receiving dasatinib or imatinib, but those given dasatinib had higher major molecular response rates and complete cytogenic response rates without a higher rate of adverse events, based on an extension study of previously published data from the DASISION trial.
The DASISION phase III clinical trial included 519 patients with newly diagnosed and treatment-naive chronic myeloid leukemia. Participants were randomly assigned to receive either 100 mg of dasatinib daily (259 patients) or 400 mg of imatinib daily (260 patients). Dosage was altered on a per-patient basis if adverse events or suboptimal responses were observed. The median average daily dose was 99 mg for dasatinib and 400 mg for imatinib after 5 years.

“Initial results showed that dasatinib had met its primary end point of superior efficacy compared with imatinib and had an acceptable safety profile, leading to its approval for first-line use,” reported Dr. Jorge Cortes of the University of Texas MD Anderson Cancer Center, Houston, and his associates (J Clin Oncol. 2016 May 23. doi: 10.1200/JCO.2015.64.8899). Given the faster and deeper molecular responses seen in patients taking dasatinib, “dasatinib should continue to be considered a standard first-line therapy for patients with newly diagnosed” chronic myeloid leukemia, they wrote.
In DASISION (Dasatinib Versus Imatinib Study in Treatment-Naive Chronic Myeloid Leukemia Patients), complete cytogenic response, major molecular response, overall survival, and progression-free survival were measured.
The major molecular response rate was significantly higher for patients receiving dasatinib, compared with patients receiving imatinib (76% vs. 64%, P = .0022).
The rate of complete cytogenic response was 28% for dasatinib and 26% for imatinib.
The 5-year overall survival for patients receiving dasatinib was 91% and was not significantly different than the overall survival rate for patients receiving imatinib (90%, P = .1192). Five-year progression-free survival was 85% for patients receiving dasatinib and 86% for patients receiving imatinib.
Grade 3 or 4 adverse events were seen in 15% of patients receiving dasatinib and 11% of patients receiving imatinib. After 5 years, 26 patients had died in each experimental group.
This study was supported by Bristol-Myers Squibb. Eleven investigators reported serving in advisory roles or receiving financial compensation from multiple companies. One investigator had no disclosures to report.
On Twitter @JessCraig_OP
Overall survival and progression-free survival were similar at 5 years in chronic myeloid leukemia patients receiving dasatinib or imatinib, but those given dasatinib had higher major molecular response rates and complete cytogenic response rates without a higher rate of adverse events, based on an extension study of previously published data from the DASISION trial.
The DASISION phase III clinical trial included 519 patients with newly diagnosed and treatment-naive chronic myeloid leukemia. Participants were randomly assigned to receive either 100 mg of dasatinib daily (259 patients) or 400 mg of imatinib daily (260 patients). Dosage was altered on a per-patient basis if adverse events or suboptimal responses were observed. The median average daily dose was 99 mg for dasatinib and 400 mg for imatinib after 5 years.
“Initial results showed that dasatinib had met its primary end point of superior efficacy compared with imatinib and had an acceptable safety profile, leading to its approval for first-line use,” reported Dr. Jorge Cortes of the University of Texas MD Anderson Cancer Center, Houston, and his associates (J Clin Oncol. 2016 May 23. doi: 10.1200/JCO.2015.64.8899). Given the faster and deeper molecular responses seen in patients taking dasatinib, “dasatinib should continue to be considered a standard first-line therapy for patients with newly diagnosed” chronic myeloid leukemia, they wrote.
In DASISION (Dasatinib Versus Imatinib Study in Treatment-Naive Chronic Myeloid Leukemia Patients), complete cytogenic response, major molecular response, overall survival, and progression-free survival were measured.
The major molecular response rate was significantly higher for patients receiving dasatinib, compared with patients receiving imatinib (76% vs. 64%, P = .0022).
The rate of complete cytogenic response was 28% for dasatinib and 26% for imatinib.
The 5-year overall survival for patients receiving dasatinib was 91% and was not significantly different than the overall survival rate for patients receiving imatinib (90%, P = .1192). Five-year progression-free survival was 85% for patients receiving dasatinib and 86% for patients receiving imatinib.
Grade 3 or 4 adverse events were seen in 15% of patients receiving dasatinib and 11% of patients receiving imatinib. After 5 years, 26 patients had died in each experimental group.
This study was supported by Bristol-Myers Squibb. Eleven investigators reported serving in advisory roles or receiving financial compensation from multiple companies. One investigator had no disclosures to report.
On Twitter @JessCraig_OP
FROM THE JOURNAL OF CLINICAL ONCOLOGY
Key clinical point: Patients with chronic myeloid leukemia who received dasatinib experienced higher rates of major molecular response and cytogenic response than did patients treated with imatinib. The improvement in response rate did not come with significantly more adverse events.
Major finding: The major molecular response rate was significantly higher at 76% for patients receiving dasatinib, compared with 64% for patients receiving imatinib (P = .0022).
Data source: A multinational, open-label, phase III trial of 519 patients with treatment-naive myeloid leukemia.
Disclosures: This study was supported by Bristol-Myers Squibb. Eleven investigators reported serving in advisory roles or receiving financial compensation from multiple companies. One investigator had no disclosures to report.
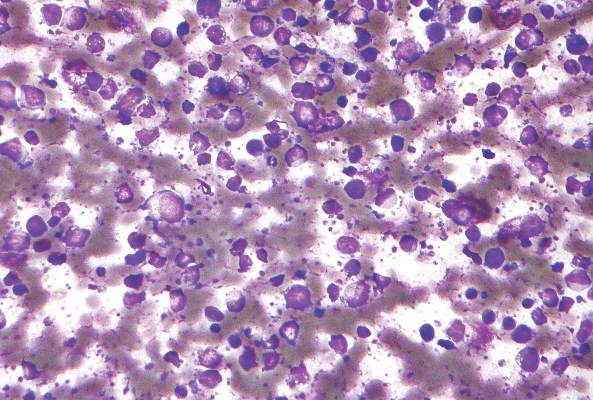
Enzastaurin flops as maintenance in treated DLBCL
Maintenance therapy with enzastaurin, an experimental agent directed against B-cell malignancies, did not improve disease-free survival among patients with high-risk diffuse large B-cell lymphomas following complete responses to chemotherapy with rituximab.
In a randomized, double-blind trial, after a median follow-up of 48 months, the hazard ratio for disease-free survival with enzastaurin vs. placebo, the primary endpoint, was 0.92 (P = .541), reported Dr. Michael Crump of Princess Margaret Cancer Centre in Toronto, and colleagues.
“The risk of treatment failure, however defined, is likely to be different in the subpopulation of patients who achieve remission after that treatment. Furthermore, identifying the value of specific biomarkers in predicting therapeutic response to novel targeted agents may be necessary in guiding future trials within defined subgroups of patients with DLBCL,” they wrote in the study, published online May 23 in Journal of Clinical Oncology.
Enzastaurin is a selective inhibitor of the protein kinase C-beta isoform (PKC-beta) expressed in both normal and malignant B cells. It has been shown to decrease tumor proliferation and induced apoptosis in cancer cells, and has been shown to have activity against relapsed or refractory DLBCL, mantle cell lymphoma, and follicular lymphoma, the authors explained.
Dr. Crump and colleagues conducted a phase III study to determine whether enzastaurin could be effective as maintenance therapy in patients with DLBCL at high risk for relapse after having had complete responses to first-line therapy with rituximab, cyclophosphamide, doxorubicin, vincristine, and prednisone (R-CHOP).
They enrolled 758 patients with stage II bulky DLBCL or stage III-IV disease who had three or more International Prognostic Index risk factors at diagnosis, and who had achieved either a confirmed or unconfirmed complete response after six to eight cycles of R-CHOP.
The patients were randomly assigned on a 2:1 basis to receive either oral enzastaurin 500 mg daily or placebo for 3 years, or until disease progression or unacceptable toxicity,
As noted, there was no significant difference in DFS with the active drug vs. placebo. In addition, in correlative analyses looking for biomarkers of response by cell of origin (i.e., germinal-center or non–germinal-center B cell) or by PKC-beta protein expression, the authors found no significant associations with either DFS or overall survival.
Enzastaurin was generally safe, with minor and manageable adverse events. More patients in the enzastaurin arm had episodes of QTc prolongation, but these did not require discontinuation of the drug.
Dr. Crump and coauthors disclosed consulting, advising, research funding and other relationships with various companies, including Eli Lilly. Five coauthors are Lilly employees.
FROM JOURNAL OF CLINICAL ONCOLOGY
Key clinical point: The experimental agent enzastaurin was no better than placebo as maintenance therapy in patients who had achieved a complete response to R-CHOP.
Major finding: At 48 months median follow-up, the hazard ratio for enzastaurin was 0.92 (P = ns).
Data source: Randomized, double-blind, placebo controlled trial of 758 patients with diffuse large B-cell lymphoma in complete remission after first-line therapy with R-CHOP.
Disclosures: Dr. Crump and coauthors disclosed consulting, advising, research funding and other relationships with various companies, including Eli Lilly. Five coauthors are Lilly employees.

Survivorship care planning in a comprehensive cancer center using an implementation framework
Cancer survivorship care plans have been recommended to improve clinical care and patient outcomes. We describe here how we established routine SCP delivery at the Robert H Lurie Comprehensive Cancer Center in Chicago, Illinois, using the Quality Implementation Framework. We evaluated local practices, gathered clinician and patient stakeholder input, developed customized SCP templates within the electronic health record, and implemented 2 complementary delivery models.
Click on the PDF icon at the top of this introduction to read the full article.
Trabectedin expands treatment options for some forms of advanced soft tissue sarcoma
Click on the PDF icon at the top of this introduction to read the full article.
Click on the PDF icon at the top of this introduction to read the full article.
Click on the PDF icon at the top of this introduction to read the full article.
Mining for information, participation in clinical trials
Click on the PDF icon at the top of this introduction to read the full article.
Click on the PDF icon at the top of this introduction to read the full article.
Click on the PDF icon at the top of this introduction to read the full article.
Judge says feds overstepped on ACA cost-sharing subsidies
The Obama administration suffered another legal judgment against the Affordable Care Act when a district court judge ruled that the government has wrongly spent billions of dollars to repay insurers for health insurance provided to certain low-income patients
Congress never appropriated the money for those payments and “no public money can be spent without [an appropriation],” Judge Rosemary M. Collyer of the U.S. District Court for the District of Columbia wrote in her May 12 opinion.

If the ruling stands, the reimbursements could end, making health insurance too expensive for the millions of low-income patients who benefit from the ACA’s cost-sharing subsides, according to Jay Mark Waxman, a Boston-based health law attorney.
“If premiums become too expensive, you have people pulling out, then you have the so-called death spiral,” Mr. Waxman said in an interview. “The law could remain intact, but you could end up with not having very many people taking advantage of the marketplace, particularly the Silver Plan.”
The case in question, U.S. House of Representatives v. Burwell, revolves around two sections of the ACA. Section 1401 provides tax credits to certain patients in order to make insurance premiums more affordable, while Section 1402 requires insurers to reduce copayments, deductibles, and other out-of-pocket costs for certain low-income patients. The health law requires the federal government to reimburse insurers for the cost of these two sections.
While the first section received funding through the congressional appropriations process, the second section did not. In January 2014, HHS started repaying repay cost-sharing subsidies to insurers using federal funds. The House sued, claiming that HHS is illegally spending monies that Congress never appropriated. HHS has argued that other statutory provisions of the ACA authorize expenditures for cost-sharing reimbursements.
Judge Collyer ruled in the House’s favor, writing that paying out reimbursements without an appropriation violates the Constitution.
House members praised the court decision, calling it a victory for “the rule of law and the American taxpayer.”

“We received vindication of what we have known for quite some time – that the administration does not have the authority to spend over $150 billion for payments to insurance companies without an appropriation from Congress,” House Energy and Commerce Committee Chairman Fred Upton (R-Mich.) said in a statement. “The court’s message was clear: Complying with Article I of the Constitution is not optional for President Obama.”
White House Press Secretary Josh Earnest countered that the administration has seen its share of lawsuits over the ACA and that such legal challenges generally end in a government victory.
“This is not the first time that we’ve seen opponents of the Affordable Care Act go through the motions to try to win this political fight in the court system,” Mr. Earnest said during a press conference. “And it’s unfortunate that Republicans have resorted to a taxpayer-funded lawsuit to refight a political fight that they keep losing. They’ve been losing this fight for 6 years. And they’ll lose it again.”

It’s too early to predict how the legal case might be resolved, said Katherine Hempstead, who directs health insurance coverage for the Robert Wood Johnson Foundation.
“There’s a lot of potential endings that don’t lead to people losing their cost-sharing reductions,” Ms. Hempstead said in an interview. “There are a lot of twists and turns ahead, and the probability of people losing their reductions is remote.”
The House could lose the case on appeal, she said. Such a ruling could be made on the merits of the case or on procedural grounds. Whether the House has standing to sue HHS has been questioned as well, she noted. HHS continues to argue that the House has not established a concrete or imminent injury and therefore, the suit should be thrown out. In addition, some have suggested that the federal ruling could be interpreted as requiring Congress to appropriate money to pay for the cost-sharing reductions, she said.
The ultimate resolution could come from the U.S. Supreme Court, Mr. Waxman added. Another possibility is that the next administration will decline to pursue the case.
“Depending on the timing, it could just stop in the court of appeals,” he said. “The next administration could say, ‘We’re happy with where it is and not take it up. You don’t know what’s going to happen.”
Mr. Earnest said the U.S. Department of Justice is reviewing the ruling and will make an announcement about the next step after the analysis.
On Twitter @legal_med
The Obama administration suffered another legal judgment against the Affordable Care Act when a district court judge ruled that the government has wrongly spent billions of dollars to repay insurers for health insurance provided to certain low-income patients
Congress never appropriated the money for those payments and “no public money can be spent without [an appropriation],” Judge Rosemary M. Collyer of the U.S. District Court for the District of Columbia wrote in her May 12 opinion.
If the ruling stands, the reimbursements could end, making health insurance too expensive for the millions of low-income patients who benefit from the ACA’s cost-sharing subsides, according to Jay Mark Waxman, a Boston-based health law attorney.
“If premiums become too expensive, you have people pulling out, then you have the so-called death spiral,” Mr. Waxman said in an interview. “The law could remain intact, but you could end up with not having very many people taking advantage of the marketplace, particularly the Silver Plan.”
The case in question, U.S. House of Representatives v. Burwell, revolves around two sections of the ACA. Section 1401 provides tax credits to certain patients in order to make insurance premiums more affordable, while Section 1402 requires insurers to reduce copayments, deductibles, and other out-of-pocket costs for certain low-income patients. The health law requires the federal government to reimburse insurers for the cost of these two sections.
While the first section received funding through the congressional appropriations process, the second section did not. In January 2014, HHS started repaying repay cost-sharing subsidies to insurers using federal funds. The House sued, claiming that HHS is illegally spending monies that Congress never appropriated. HHS has argued that other statutory provisions of the ACA authorize expenditures for cost-sharing reimbursements.
Judge Collyer ruled in the House’s favor, writing that paying out reimbursements without an appropriation violates the Constitution.
House members praised the court decision, calling it a victory for “the rule of law and the American taxpayer.”
“We received vindication of what we have known for quite some time – that the administration does not have the authority to spend over $150 billion for payments to insurance companies without an appropriation from Congress,” House Energy and Commerce Committee Chairman Fred Upton (R-Mich.) said in a statement. “The court’s message was clear: Complying with Article I of the Constitution is not optional for President Obama.”
White House Press Secretary Josh Earnest countered that the administration has seen its share of lawsuits over the ACA and that such legal challenges generally end in a government victory.
“This is not the first time that we’ve seen opponents of the Affordable Care Act go through the motions to try to win this political fight in the court system,” Mr. Earnest said during a press conference. “And it’s unfortunate that Republicans have resorted to a taxpayer-funded lawsuit to refight a political fight that they keep losing. They’ve been losing this fight for 6 years. And they’ll lose it again.”
It’s too early to predict how the legal case might be resolved, said Katherine Hempstead, who directs health insurance coverage for the Robert Wood Johnson Foundation.
“There’s a lot of potential endings that don’t lead to people losing their cost-sharing reductions,” Ms. Hempstead said in an interview. “There are a lot of twists and turns ahead, and the probability of people losing their reductions is remote.”
The House could lose the case on appeal, she said. Such a ruling could be made on the merits of the case or on procedural grounds. Whether the House has standing to sue HHS has been questioned as well, she noted. HHS continues to argue that the House has not established a concrete or imminent injury and therefore, the suit should be thrown out. In addition, some have suggested that the federal ruling could be interpreted as requiring Congress to appropriate money to pay for the cost-sharing reductions, she said.
The ultimate resolution could come from the U.S. Supreme Court, Mr. Waxman added. Another possibility is that the next administration will decline to pursue the case.
“Depending on the timing, it could just stop in the court of appeals,” he said. “The next administration could say, ‘We’re happy with where it is and not take it up. You don’t know what’s going to happen.”
Mr. Earnest said the U.S. Department of Justice is reviewing the ruling and will make an announcement about the next step after the analysis.
On Twitter @legal_med
Persistent SIRS, leukocytosis linked to unrecognized necrotizing pancreatitis
SAN DIEGO – Patients who have persistent leukocytosis (greater than 12 x 109 white blood cells per liter) or persistent systemic inflammatory response syndrome (SIRS) on the day of scheduled cholecystectomy may have unrecognized pancreatic necrosis, which increases the risk of postsurgical organ failure and infected necrosis, Dr. Wilson Kwong reported.
For these patients, “we recommend performing a contrast-enhanced CT scan on day 4 or 5 to reassess for necrosis,” Dr. Kwong of the gastroenterology department at the University California, San Diego, said in an interview. “Patients who have necrosis should undergo interval cholecystectomy instead, while those without necrosis are likely safe to proceed with laparoscopic cholecystectomy,” he added.
Guidelines recommend same-admission cholecystectomy for mild acute gallstone pancreatitis, although this approach will send some patients with unrecognized necrotizing pancreatitis to surgery, “with unknown consequences,” Dr. Kwong said at the annual Digestive Diseases Week.
To better understand presurgical predictors of necrotizing pancreatitis, Dr. Kwong and his coauthor, Dr. Santhi Swaroop Vege of the Mayo Clinic, Rochester, Minn., studied 46 Mayo Clinic patients with apparent mild acute gallstone pancreatitis who in fact had necrotizing pancreatitis diagnosed during same-admission laparoscopic cholecystectomies (SALCs).
The most frequent characteristics of patients with unrecognized necrotizing pancreatitis included persistent SIRS (area under the curve, 0.96) and persistent leukocytosis (AUC, 0.92) on the day of cholecystectomy (both P less than .0001). However, 82% of patients with unrecognized necrotizing pancreatitis met criteria for SIRS by their second day in the hospital, with SIRS continuing until the day of planned cholecystectomy.
Next, the investigators compared the SALC patients with 48 patients who had necrotizing pancreatitis, but did not undergo SALC. In all, 24% of SALC patients developed new organ failure, compared with none of the comparison group (P = .0003). The SALC patients also had nearly double the rate of culture-confirmed infected necrosis (52% vs. 27%, P = .02), and stayed about 1.5 days longer in the hospital (26 vs. 24.5 days, P = .049). The chances of undergoing an intervention for necrotizing pancreatitis, conversion to open cholecystectomy, or death were slightly higher for SALC patients, compared with controls, but none of these differences reached statistical significance. Two SALC patients (4%) died, compared with 2% of patients who did not undergo SALC, the investigators reported.
The researchers also compared the SALC patients with a second control group of 48 patients who were later confirmed during SALC to have true mild acute gallstone pancreatitis. Fully 91% of patients with necrotizing pancreatitis met criteria for SIRS on the day of surgery, compared with none of the patients with acute gallstone pancreatitis (P less than .0001). Furthermore, all 11 patients with necrotizing pancreatitis and available test results had persistent leukocytosis on the day of surgery, compared with only 21% of the gallstone pancreatitis group (P less than .0001).
Finally, the researchers looked at the magnitude of the problem of unrecognized necrotizing pancreatitis. “From January 2014 to August 2015, 102 consecutive patients were directly admitted to Mayo Clinic, Rochester, with acute gallstone pancreatitis and underwent SALC,” they reported. “After laparoscopic cholecystectomy, seven of these patients were discovered to have previously unrecognized necrotizing pancreatitis, thus giving a 7% occurrence rate for this complication during this recent time period.” Accurately identifying patients with emerging necrotizing pancreatitis is crucial to help prevent potentially severe complications after SALC, they emphasized.
Dr. Kwong had no relevant financial disclosures. Dr. Vege disclosed consulting fees and other compensation from Takeda and several other companies.
AT DDW® 2016
Key clinical point: Persistent leukocytosis (greater than 12 x 109 white blood cells per liter) and SIRS on the day of scheduled laparoscopic cholecystectomy may indicate unrecognized necrotizing pancreatitis.
Major finding: The highest areas under the curve were for SIRS (0.96), followed by a WBC at or above 12 x 109/L (0.92; both P less than .0001).
Data source: A single-center retrospective study of 46 patients with unrecognized pancreatitis who underwent same-admission laparoscopic cholecystectomy, 48 patients with necrotizing pancreatitis who did not undergo SALC, and 48 patients with true mild acute gallstone pancreatitis.
Disclosures: Dr. Kwong had no relevant financial disclosures. Dr. Vege disclosed consulting fees and other compensation from Takeda and several other companies.
Sentinel node biopsies may be useful in head and neck squamous cell carcinoma
ORLANDO – Sentinel node biopsies may be a useful staging tool for patients with cutaneous squamous cell carcinomas of the head and neck.
These patients – especially those with compromised immune systems – appear to be at sufficiently high risk of metastasis to justify the procedure, Dr. Jonathan Lopez said at the annual meeting of the American College of Mohs Surgery.
“We found that sentinel lymph node biopsy in our clinic had a 91% negative predictive value for local recurrence, nodal recurrence, and disease-specific death. It provides valuable prognostic information for patients at increased risk of nodal metastasis,” said Dr. Lopez, a dermatology resident at the Mayo Clinic, Rochester, Minn.

He and his associates conducted a chart review of 24 patients treated at the Mayo Clinic from 2000 to 2014 for a cutaneous squamous cell carcinoma (SCC) of the head or neck. Of these, 11 patients were immunosuppressed. Five had undergone a kidney transplant and three a lung transplant. One patient had Hodgkin’s lymphoma, one had cutaneous lymphocytic leukemia, and one, metastatic urothelial carcinoma.
Before sentinel node biopsy, eight patients had a wide local excision; 12 were treated with Mohs micrographic surgery only; and four had a Mohs procedure followed by resection for better margins.
The biopsies identified two patients with nodal disease, but failed to identify a third who had it, Dr. Lopez said.
Patient No. 1 had a primary SCC on the nasal tip that was stage 2, according to the American Joint Committee on Cancer (AJCC) staging system, and 2b according to the Brigham and Women’s Hospital (BWH) system. He had undergone a prior double lung transplant and his lymph node dissection showed no nodal metastasis. He declined radiotherapy and died within 2 months of the biopsy, of unclear causes that were not related to his skin cancer.
Patient No. 2 had a primary lesion on the right cheek, and a history of kidney transplant. His cancer was stage 2 by the AJCC system and 2b by the BWH system. His lymph node dissection of the right parotid and neck was negative. At last follow-up of 3.5 years, he was cancer free. However, Dr. Lopez noted, the patient died at 4 years’ follow-up of unknown causes.
The final patient had a primary lesion on the right conchal bowl. It was a stage 2 cancer by the AJCC system and 2a by the BWH system. His sentinel node biopsy was negative. However, the otolaryngologist who performed the biopsy also took seven superficial parotid nodes and one of those was positive. This patient had no recurrence at the last visit, 1.5 years after the biopsy.
The sentinel node biopsies were negative in the 21 other patients. Of these, 14 had no evidence of recurrence at a mean of 3 years’ follow-up after the sentinel lymph node biopsy. Two developed local recurrence and two others, both of whom had a history of multiple squamous cell carcinomas, developed nodal spread and died of metastatic disease. Three have died of causes unrelated to their cancer.
Dr. Lopez had no financial disclosures.
ORLANDO – Sentinel node biopsies may be a useful staging tool for patients with cutaneous squamous cell carcinomas of the head and neck.
These patients – especially those with compromised immune systems – appear to be at sufficiently high risk of metastasis to justify the procedure, Dr. Jonathan Lopez said at the annual meeting of the American College of Mohs Surgery.
“We found that sentinel lymph node biopsy in our clinic had a 91% negative predictive value for local recurrence, nodal recurrence, and disease-specific death. It provides valuable prognostic information for patients at increased risk of nodal metastasis,” said Dr. Lopez, a dermatology resident at the Mayo Clinic, Rochester, Minn.
He and his associates conducted a chart review of 24 patients treated at the Mayo Clinic from 2000 to 2014 for a cutaneous squamous cell carcinoma (SCC) of the head or neck. Of these, 11 patients were immunosuppressed. Five had undergone a kidney transplant and three a lung transplant. One patient had Hodgkin’s lymphoma, one had cutaneous lymphocytic leukemia, and one, metastatic urothelial carcinoma.
Before sentinel node biopsy, eight patients had a wide local excision; 12 were treated with Mohs micrographic surgery only; and four had a Mohs procedure followed by resection for better margins.
The biopsies identified two patients with nodal disease, but failed to identify a third who had it, Dr. Lopez said.
Patient No. 1 had a primary SCC on the nasal tip that was stage 2, according to the American Joint Committee on Cancer (AJCC) staging system, and 2b according to the Brigham and Women’s Hospital (BWH) system. He had undergone a prior double lung transplant and his lymph node dissection showed no nodal metastasis. He declined radiotherapy and died within 2 months of the biopsy, of unclear causes that were not related to his skin cancer.
Patient No. 2 had a primary lesion on the right cheek, and a history of kidney transplant. His cancer was stage 2 by the AJCC system and 2b by the BWH system. His lymph node dissection of the right parotid and neck was negative. At last follow-up of 3.5 years, he was cancer free. However, Dr. Lopez noted, the patient died at 4 years’ follow-up of unknown causes.
The final patient had a primary lesion on the right conchal bowl. It was a stage 2 cancer by the AJCC system and 2a by the BWH system. His sentinel node biopsy was negative. However, the otolaryngologist who performed the biopsy also took seven superficial parotid nodes and one of those was positive. This patient had no recurrence at the last visit, 1.5 years after the biopsy.
The sentinel node biopsies were negative in the 21 other patients. Of these, 14 had no evidence of recurrence at a mean of 3 years’ follow-up after the sentinel lymph node biopsy. Two developed local recurrence and two others, both of whom had a history of multiple squamous cell carcinomas, developed nodal spread and died of metastatic disease. Three have died of causes unrelated to their cancer.
Dr. Lopez had no financial disclosures.
AT THE ACMS ANNUAL MEETING
Key clinical point: Sentinel node biopsies identified nodal spread in some patients with cutaneous SCC of the head and neck
Major finding: The procedure had a 91% negative predictive value for nodal spread and disease-specific death.
Data source: The retrospective chart review comprised of 24 patients, treated at the Mayo Clinic for cutaneous SCC of the head and neck from 2000 to 2014.
Disclosures: Dr. Lopez had no financial disclosures.