User login
Complete Closing Wedge Osteotomy for Correction of Blount Disease (Tibia Vara): A Technique
Blount disease (tibia vara) is an angular tibia deformity that includes varus, increased posterior slope, and internal rotation. This deformity was first described in 1922 by Erlacher1 in Germany. In 1937, Walter Blount2 reported on it in the United States. It is the most common cause of pathologic genu varum in adolescence and childhood.
An oblique incomplete closing wedge osteotomy of the proximal tibial metaphysis was described by Wagner3 for the treatment of unicompartmental osteoarthrosis of the knee in adults. Laurencin and colleagues4 applied this technique to the treatment of pediatric tibia vara with favorable results. They spared the medial cortex of the tibia in their incomplete closing wedge osteotomy technique. In each of the 9 cases we treated and describe here, we accidentally completed the tibial osteotomy when attempting the Laurencin technique. Given that the osteotomy was completed, we modified the Laurencin technique by using a 6-hole, 4.5-mm compression plate rather than a 5-hole semitubular plate, and added a large oblique screw from the medial side to compress the osteotomy site and to protect the plate from fracture. In addition, in 2 patients who weighed more than 250 pounds, we used an external fixator for additional stability. In this article, we report the outcomes of correcting adolescent tibia vara with a complete closing wedge tibial osteotomy and an oblique fibular osteotomy.
Materials and Methods
This study was approved by the Institutional Review Board at Pennsylvania State University. Between 2009 and 2012, we performed 9 complete oblique proximal tibial lateral closing wedge osteotomies on 8 patients (2 girls, 6 boys). In each case, the primary diagnosis was Blount disease. One patient also had renal dysplasia and was receiving dialysis. Mean age at time of operation was 15 years (range, 13-17 years). Mean preoperative weight was 215 pounds (range, 119-317 lb). Mean weight gain at follow-up was 4.39 pounds (range, –10 to 19 lb). Mean body mass index (BMI) was 38 (range, 25-48) (Table). All patients had varus angulation of the proximal tibia before surgery. Mean preoperative varus on standing films was 22° (range, 10°-36°). Because of the patients’ size, we used standing long-leg radiographs, on individual cassettes, for each leg.
Surgical Technique
Before surgery, we use paper cutouts to template the osteotomy wedge. We also use perioperative antibiotics and a standard time-out. For visualization of the entire leg for accurate correction, we prepare and drape the entire leg. A sterile tourniquet is used. At the midshaft of the fibula, a 4-cm incision is made, and dissection is carefully carried down to the fibula. Subperiosteal dissection is performed about the fibula, allowing adequate clearance for an oblique osteotomy. The osteotomy removes about 1 cm of fibula, which is to be used as bone graft for the tibial osteotomy. In addition, a lateral compartment fasciotomy is performed to prevent swelling-related complications. The wound is irrigated and injected with bupivacaine and closed in routine fashion.
We then make an inverted hockey-stick incision over the proximal tibia, centered down to the tibial tubercle. After dissecting down to the anterior compartment, we perform a fasciotomy of about 8 cm to accommodate swelling. Subperiosteal dissection is then performed around the proximal tibia. The medial soft tissues are left attached to increase blood supply and healing. During subperiosteal dissection, soft elevators are used to gently retract the lateral soft tissues along with the inferior and posterior structures. We use fluoroscopic imaging to guide the osteotomy as well as screw and plate placement. We use a 6-hole, 4.5-mm compression plate and screws for fixation. The 2 proximal screws of the plate are predrilled in place to allow for application of the plate after completion of the osteotomy. The plate is then rotated out of position on 1 screw, and the osteotomy is identified under fluoroscopy with the appropriate position distal to the second hole of the 6-hole plate.
An oscillating saw and osteotomes are used to perform the oblique osteotomy. The pre-estimated bone wedge is removed. Wedge size is adjusted, if needed. The bone wedge is morselized for bone graft. The osteotomy is then closed, correcting both varus and internal tibial torsion. Our goal is 5° valgus. After correction is obtained, the plate is placed, and the proximal screw is snugly seated. Three cortical screws are placed distally to hold the plate in place under compression mode, and a cancellous screw is placed superiorly at the proximal portion of the plate for additional fixation. The screw placed proximal to the osteotomy site is a fully threaded cortical screw with excellent compression. Correction and proper placement of hardware are verified with fluoroscopy.
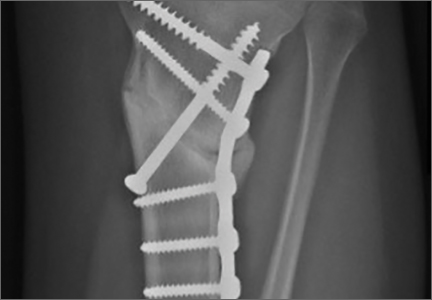
The wound is irrigated and injected with bupivacaine. Bone graft is then placed at the osteotomy site. Additional bone graft is placed posteriorly between the osteotomy site and the muscle mass to stimulate additional healing. Another screw is placed obliquely from the medial side across the osteotomy site to provide additional fixation (Figure 1).
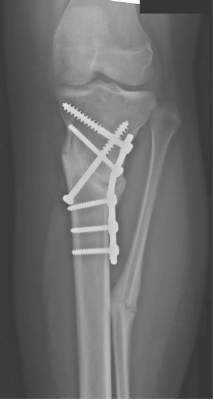
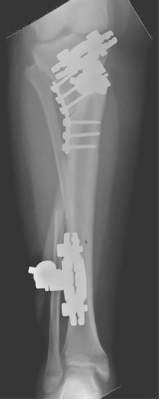
A deep drain is placed and connected to bulb suction for 24 hours after surgery. The wound is then closed in routine fashion. In 2 patients who weighed more than 250 pounds, we used an external fixator for additional stability (Figure 2).
Postoperative Care
The incisions are dressed with antibiotic ointment and 4×4-in bandages and then wrapped with sterile cotton under-cast padding. The leg is placed into a well-padded cylinder cast with the knee flexed 10°. The leg is aligned to about 5° valgus. The cast is then split on the side and spread to allow for swelling and to prevent compartment syndrome.5 We also use a drain hooked to bulb suction, which is removed 24 hours after surgery. Toe-touch weight-bearing with crutches is allowed immediately after surgery. The cast is removed at 6 weeks, and a hinged range-of-motion knee brace is worn for another 6 weeks. All patients are allowed to resume normal activity after 4 months. In our 2 external-fixator cases, a cast was not used, and toe-touch weight-bearing and knee motion were allowed immediately. The external fixators were removed at about 10 weeks.
Results
Mean postoperative mechanical femoral-tibial angle was 3°, and mean correction was 26° (range, 16°-43°) (Table). Lateral distal femoral angle did not show significant femoral deformity in our sample. Mean medial proximal tibial angle was 74° (range, 63°-79°). In each case, the varus deformity was primarily in the tibia. Mean tourniquet time was 88 minutes (range, 50-119 min). Our complication rate was 11% (1 knee). In our first case, in which we did not use an extra medial screw, the 4.5-mm plate fractured at the osteotomy site 2.5 months after surgery. The 250-pound patient subsequently lost 17° of correction, and valgus alignment was not achieved. Preoperative varus was 25°, and postoperative alignment was 8° varus. This plate fracture led us to use an extra medial screw for additional stability in all subsequent cases and to consider using an external fixator for patients weighing more than 250 pounds. After the first case, there were no other plate fractures. A potential problem with closing wedge osteotomy is shortening, but varus correction restores some length. Mean postoperative leg-length difference was 10 mm (range, 0-16 mm). No patient complained of leg-length difference during the postoperative follow-up.
Eight and a half months after surgery, 1 patient had hardware removed, at the family’s request. No patient experienced perioperative infection or neurovascular damage. Our overall patient population was obese—mean BMI was 38 (range, 25-48), and mean postoperative weight was 219 pounds. Three of our 8 patients were overweight (BMI, 25-30), and 5 were obese (BMI, >30). For prevention of plate failure, we recommend using an extra oblique screw in all patients and considering an external fixator for patients who weigh more than 250 pounds.
Discussion
Correction of adolescent tibia vara can be challenging because of patient obesity. The technique described here—a modification of the technique of Laurencin and colleagues4—is practical and reproducible in this population. The goals in performing osteotomy are to correct the deformity, restore joint alignment, preserve leg length, and prevent recurrent deformity and other complications, such as neurovascular injury, nonunion, and infection.3,6-8 Our technique minimizes the risk for these complications. For example, the fasciotomy provides excellent decompression of the anterior and lateral compartments, minimizing neurovascular ischemia and the risk for compartment syndrome. During cast placement, splitting and spreading reduce the risk for compartment syndrome as well.5
Wagner3,9 demonstrated the utility of a closing wedge proximal tibial osteotomy in adults. Laurencin and colleagues4 showed this technique is effective in correcting tibia vara in a pediatric population. However, they did not specify patient weight and used a small semitubular plate for fixation, and some of their patients had infantile Blount disease. We modified the technique in 3 ways. First, we performed a complete osteotomy. Second, because our patients were adolescents and very large, we used a 6-hole, 4.5-mm compression plate and screws. Third, we used an external fixator for increased stability in patients who weighed more than 250 pounds.
The reported technique, using an oblique metaphyseal closing wedge osteotomy with internal fixation in obese patients, is practical, safe, and reliable. This technique is a useful alternative to an external fixator. We used it on 9 knees with tibia vara, and it was completely successful in 8 cases and partially successful in 1 (hardware breakage occurred). An external fixator was used to prevent hardware breakage in 2 patients who weighed more than 250 pounds. This technique is a valuable treatment option for surgical correction, especially in obese patients.
1. Erlacher P. Deformierende Prozesse der Epiphysengegend bei Kindem. Archiv Orthop Unfall-Chir. 1922;20:81-96.
2. Blount WP. Tibia vara. J Bone Joint Surg. 1937;29:1-28.
3. Wagner H. Principles of corrective osteotomies in osteoarthrosis of the knee. In: Weal UH, ed. Joint Preserving Procedures of the Lower Extremity. New York, NY: Springer; 1980:77-102.
4. Laurencin CT, Ferriter PJ, Millis MB. Oblique proximal tibial osteotomy for the correction of tibia vara in the young. Clin Orthop Relat Res. 1996;(327):218-224.
5. Garfin SR, Mubarak SJ, Evans KL, Hargens AR, Akeson WH. Quantification of intracompartmental pressure and volume under plaster casts. J Bone Joint Surg Am. 1981;63(3):449-453.
6. Mycoskie PJ. Complications of osteotomies about the knee in children. Orthopedics. 1981;4(9):1005-1015.
7. Matsen FA, Staheli LT. Neurovascular complications following tibial osteotomy in children. A case report. Clin Orthop Relat Res. 1975;(110):210-214.
8. Steel HH, Sandrew RE, Sullivan PD. Complications of tibial osteotomy in children for genu varum or valgum. Evidence that neurological changes are due to ischemia. J Bone Joint Surg Am. 1971;53(8):1629-1635.
9. Wagner H. The displacement osteotomy as a correction principle. In: Heirholzer G, Muller KH, eds. Corrective Osteotomies of the Lower Extremity After Trauma. Berlin, Germany: Springer; 1985:141-150.
Blount disease (tibia vara) is an angular tibia deformity that includes varus, increased posterior slope, and internal rotation. This deformity was first described in 1922 by Erlacher1 in Germany. In 1937, Walter Blount2 reported on it in the United States. It is the most common cause of pathologic genu varum in adolescence and childhood.
An oblique incomplete closing wedge osteotomy of the proximal tibial metaphysis was described by Wagner3 for the treatment of unicompartmental osteoarthrosis of the knee in adults. Laurencin and colleagues4 applied this technique to the treatment of pediatric tibia vara with favorable results. They spared the medial cortex of the tibia in their incomplete closing wedge osteotomy technique. In each of the 9 cases we treated and describe here, we accidentally completed the tibial osteotomy when attempting the Laurencin technique. Given that the osteotomy was completed, we modified the Laurencin technique by using a 6-hole, 4.5-mm compression plate rather than a 5-hole semitubular plate, and added a large oblique screw from the medial side to compress the osteotomy site and to protect the plate from fracture. In addition, in 2 patients who weighed more than 250 pounds, we used an external fixator for additional stability. In this article, we report the outcomes of correcting adolescent tibia vara with a complete closing wedge tibial osteotomy and an oblique fibular osteotomy.
Materials and Methods
This study was approved by the Institutional Review Board at Pennsylvania State University. Between 2009 and 2012, we performed 9 complete oblique proximal tibial lateral closing wedge osteotomies on 8 patients (2 girls, 6 boys). In each case, the primary diagnosis was Blount disease. One patient also had renal dysplasia and was receiving dialysis. Mean age at time of operation was 15 years (range, 13-17 years). Mean preoperative weight was 215 pounds (range, 119-317 lb). Mean weight gain at follow-up was 4.39 pounds (range, –10 to 19 lb). Mean body mass index (BMI) was 38 (range, 25-48) (Table). All patients had varus angulation of the proximal tibia before surgery. Mean preoperative varus on standing films was 22° (range, 10°-36°). Because of the patients’ size, we used standing long-leg radiographs, on individual cassettes, for each leg.
Surgical Technique
Before surgery, we use paper cutouts to template the osteotomy wedge. We also use perioperative antibiotics and a standard time-out. For visualization of the entire leg for accurate correction, we prepare and drape the entire leg. A sterile tourniquet is used. At the midshaft of the fibula, a 4-cm incision is made, and dissection is carefully carried down to the fibula. Subperiosteal dissection is performed about the fibula, allowing adequate clearance for an oblique osteotomy. The osteotomy removes about 1 cm of fibula, which is to be used as bone graft for the tibial osteotomy. In addition, a lateral compartment fasciotomy is performed to prevent swelling-related complications. The wound is irrigated and injected with bupivacaine and closed in routine fashion.
We then make an inverted hockey-stick incision over the proximal tibia, centered down to the tibial tubercle. After dissecting down to the anterior compartment, we perform a fasciotomy of about 8 cm to accommodate swelling. Subperiosteal dissection is then performed around the proximal tibia. The medial soft tissues are left attached to increase blood supply and healing. During subperiosteal dissection, soft elevators are used to gently retract the lateral soft tissues along with the inferior and posterior structures. We use fluoroscopic imaging to guide the osteotomy as well as screw and plate placement. We use a 6-hole, 4.5-mm compression plate and screws for fixation. The 2 proximal screws of the plate are predrilled in place to allow for application of the plate after completion of the osteotomy. The plate is then rotated out of position on 1 screw, and the osteotomy is identified under fluoroscopy with the appropriate position distal to the second hole of the 6-hole plate.
An oscillating saw and osteotomes are used to perform the oblique osteotomy. The pre-estimated bone wedge is removed. Wedge size is adjusted, if needed. The bone wedge is morselized for bone graft. The osteotomy is then closed, correcting both varus and internal tibial torsion. Our goal is 5° valgus. After correction is obtained, the plate is placed, and the proximal screw is snugly seated. Three cortical screws are placed distally to hold the plate in place under compression mode, and a cancellous screw is placed superiorly at the proximal portion of the plate for additional fixation. The screw placed proximal to the osteotomy site is a fully threaded cortical screw with excellent compression. Correction and proper placement of hardware are verified with fluoroscopy.
The wound is irrigated and injected with bupivacaine. Bone graft is then placed at the osteotomy site. Additional bone graft is placed posteriorly between the osteotomy site and the muscle mass to stimulate additional healing. Another screw is placed obliquely from the medial side across the osteotomy site to provide additional fixation (Figure 1).
A deep drain is placed and connected to bulb suction for 24 hours after surgery. The wound is then closed in routine fashion. In 2 patients who weighed more than 250 pounds, we used an external fixator for additional stability (Figure 2).
Postoperative Care
The incisions are dressed with antibiotic ointment and 4×4-in bandages and then wrapped with sterile cotton under-cast padding. The leg is placed into a well-padded cylinder cast with the knee flexed 10°. The leg is aligned to about 5° valgus. The cast is then split on the side and spread to allow for swelling and to prevent compartment syndrome.5 We also use a drain hooked to bulb suction, which is removed 24 hours after surgery. Toe-touch weight-bearing with crutches is allowed immediately after surgery. The cast is removed at 6 weeks, and a hinged range-of-motion knee brace is worn for another 6 weeks. All patients are allowed to resume normal activity after 4 months. In our 2 external-fixator cases, a cast was not used, and toe-touch weight-bearing and knee motion were allowed immediately. The external fixators were removed at about 10 weeks.
Results
Mean postoperative mechanical femoral-tibial angle was 3°, and mean correction was 26° (range, 16°-43°) (Table). Lateral distal femoral angle did not show significant femoral deformity in our sample. Mean medial proximal tibial angle was 74° (range, 63°-79°). In each case, the varus deformity was primarily in the tibia. Mean tourniquet time was 88 minutes (range, 50-119 min). Our complication rate was 11% (1 knee). In our first case, in which we did not use an extra medial screw, the 4.5-mm plate fractured at the osteotomy site 2.5 months after surgery. The 250-pound patient subsequently lost 17° of correction, and valgus alignment was not achieved. Preoperative varus was 25°, and postoperative alignment was 8° varus. This plate fracture led us to use an extra medial screw for additional stability in all subsequent cases and to consider using an external fixator for patients weighing more than 250 pounds. After the first case, there were no other plate fractures. A potential problem with closing wedge osteotomy is shortening, but varus correction restores some length. Mean postoperative leg-length difference was 10 mm (range, 0-16 mm). No patient complained of leg-length difference during the postoperative follow-up.
Eight and a half months after surgery, 1 patient had hardware removed, at the family’s request. No patient experienced perioperative infection or neurovascular damage. Our overall patient population was obese—mean BMI was 38 (range, 25-48), and mean postoperative weight was 219 pounds. Three of our 8 patients were overweight (BMI, 25-30), and 5 were obese (BMI, >30). For prevention of plate failure, we recommend using an extra oblique screw in all patients and considering an external fixator for patients who weigh more than 250 pounds.
Discussion
Correction of adolescent tibia vara can be challenging because of patient obesity. The technique described here—a modification of the technique of Laurencin and colleagues4—is practical and reproducible in this population. The goals in performing osteotomy are to correct the deformity, restore joint alignment, preserve leg length, and prevent recurrent deformity and other complications, such as neurovascular injury, nonunion, and infection.3,6-8 Our technique minimizes the risk for these complications. For example, the fasciotomy provides excellent decompression of the anterior and lateral compartments, minimizing neurovascular ischemia and the risk for compartment syndrome. During cast placement, splitting and spreading reduce the risk for compartment syndrome as well.5
Wagner3,9 demonstrated the utility of a closing wedge proximal tibial osteotomy in adults. Laurencin and colleagues4 showed this technique is effective in correcting tibia vara in a pediatric population. However, they did not specify patient weight and used a small semitubular plate for fixation, and some of their patients had infantile Blount disease. We modified the technique in 3 ways. First, we performed a complete osteotomy. Second, because our patients were adolescents and very large, we used a 6-hole, 4.5-mm compression plate and screws. Third, we used an external fixator for increased stability in patients who weighed more than 250 pounds.
The reported technique, using an oblique metaphyseal closing wedge osteotomy with internal fixation in obese patients, is practical, safe, and reliable. This technique is a useful alternative to an external fixator. We used it on 9 knees with tibia vara, and it was completely successful in 8 cases and partially successful in 1 (hardware breakage occurred). An external fixator was used to prevent hardware breakage in 2 patients who weighed more than 250 pounds. This technique is a valuable treatment option for surgical correction, especially in obese patients.
1. Erlacher P. Deformierende Prozesse der Epiphysengegend bei Kindem. Archiv Orthop Unfall-Chir. 1922;20:81-96.
2. Blount WP. Tibia vara. J Bone Joint Surg. 1937;29:1-28.
3. Wagner H. Principles of corrective osteotomies in osteoarthrosis of the knee. In: Weal UH, ed. Joint Preserving Procedures of the Lower Extremity. New York, NY: Springer; 1980:77-102.
4. Laurencin CT, Ferriter PJ, Millis MB. Oblique proximal tibial osteotomy for the correction of tibia vara in the young. Clin Orthop Relat Res. 1996;(327):218-224.
5. Garfin SR, Mubarak SJ, Evans KL, Hargens AR, Akeson WH. Quantification of intracompartmental pressure and volume under plaster casts. J Bone Joint Surg Am. 1981;63(3):449-453.
6. Mycoskie PJ. Complications of osteotomies about the knee in children. Orthopedics. 1981;4(9):1005-1015.
7. Matsen FA, Staheli LT. Neurovascular complications following tibial osteotomy in children. A case report. Clin Orthop Relat Res. 1975;(110):210-214.
8. Steel HH, Sandrew RE, Sullivan PD. Complications of tibial osteotomy in children for genu varum or valgum. Evidence that neurological changes are due to ischemia. J Bone Joint Surg Am. 1971;53(8):1629-1635.
9. Wagner H. The displacement osteotomy as a correction principle. In: Heirholzer G, Muller KH, eds. Corrective Osteotomies of the Lower Extremity After Trauma. Berlin, Germany: Springer; 1985:141-150.
Wide variation in clinical management of thyroid nodules seen in first-ever survey
LAKE BUENA VISTA, FLA. – When making diagnostic and treatment decisions about thyroid nodules, many endocrinologists are not following current clinical practice guidelines, according to a recent survey. Further, according to a recent international survey of endocrinologists, there is wide regional variation in the use of molecular testing and calcitonin levels.
Dr. Nicole Vietor of the department of endocrinology at Walter Reed National Military Medical Center, Bethesda, Md., and her collaborators contacted members of the American Thyroid Association (ATA), the Endocrine Society (TES), and the American Association of Clinical Endocrinologists (AACE). Members of these societies were contacted directly by investigators and asked to complete a web-based survey regarding their practices for diagnosing and managing thyroid nodules.

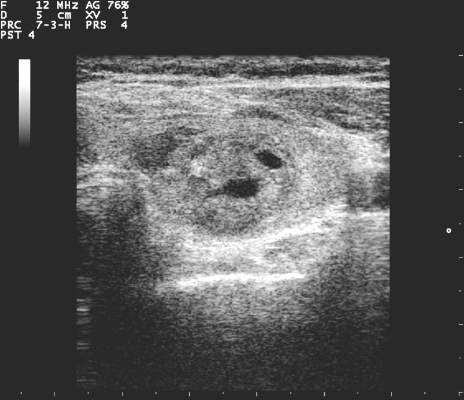
The survey consisted of 36 questions, with an index case with variations presented to respondents, who then answered questions about diagnostic and management decisionmaking practices. The hypothetical index patient was a 52 year old woman with an incidental finding of a 1.5 cm right thyroid nodule. The patient was healthy and without risk factors; the patient’s nodule was not palpable on physical exam and she had no cervical lymphadenopathy.
Almost all respondents (99.4%) would order a thyroid-stimulating hormone for initial lab testing. Other commonly ordered exams included free T4 levels and thyroid peroxidase antibody requested by 41.5% and 24.3% of respondents, respectively. Fewer than 15% of respondents would have ordered any further lab exams.
All but 1.5% of respondents would order an anatomic or functional test for this index patient, with 57.2% ordering a thyroid ultrasound to be performed in radiology and 52.1% ordering an ultrasound in clinic (multiple responses were permitted). Cervical lymph nodes were included in the initial ultrasound assessment by 68.5% of respondents. Overall, more than half (56.6%) of thyroid ultrasounds were performed by endocrinologists, and about a third (31.9%) done by radiologists.
Practice variation from guidelines became apparent when respondents were asked how various nodule characteristics affected the decision to perform a fine needle aspiration (FNA). For a 1.5-cm solid hypoechoic nodule, 93.8% of respondents would perform FNA, while two thirds (67.0%) would perform an FNA for a 0.7-cm hypoechoic nodule with microcalcifications.
When performing FNAs, 83.3% of respondents use ultrasound to guide the biopsy, with most operators performing two (19.2%), three (28.5%), or four (23.0%) passes per nodule.
Of the 897 respondents, 80.5% were TES members, 56.5% were AACE members, and 44.5% were ATA members; most respondents belonged to more than one society. Almost two thirds of respondents (63.0%) were from North America, while 12.2% were from Europe, 10.8% were from Latin America, 6.5% were from Asia, 5.6% were from the Middle East or Africa, and just 1.9% were from Oceania. More men (60.2%) than women responded.
The AACE issued clinical practice guidelines for the management of thyroid nodules in 2010, as did the ATA in 2009 and 2015.
“In summary, management of a thyroid nodule is highly variable and differs from societal guidelines in multiple areas,” wrote Dr. Vietor and her colleagues in the presentation abstract.
On Twitter @karioakes
LAKE BUENA VISTA, FLA. – When making diagnostic and treatment decisions about thyroid nodules, many endocrinologists are not following current clinical practice guidelines, according to a recent survey. Further, according to a recent international survey of endocrinologists, there is wide regional variation in the use of molecular testing and calcitonin levels.
Dr. Nicole Vietor of the department of endocrinology at Walter Reed National Military Medical Center, Bethesda, Md., and her collaborators contacted members of the American Thyroid Association (ATA), the Endocrine Society (TES), and the American Association of Clinical Endocrinologists (AACE). Members of these societies were contacted directly by investigators and asked to complete a web-based survey regarding their practices for diagnosing and managing thyroid nodules.
The survey consisted of 36 questions, with an index case with variations presented to respondents, who then answered questions about diagnostic and management decisionmaking practices. The hypothetical index patient was a 52 year old woman with an incidental finding of a 1.5 cm right thyroid nodule. The patient was healthy and without risk factors; the patient’s nodule was not palpable on physical exam and she had no cervical lymphadenopathy.
Almost all respondents (99.4%) would order a thyroid-stimulating hormone for initial lab testing. Other commonly ordered exams included free T4 levels and thyroid peroxidase antibody requested by 41.5% and 24.3% of respondents, respectively. Fewer than 15% of respondents would have ordered any further lab exams.
All but 1.5% of respondents would order an anatomic or functional test for this index patient, with 57.2% ordering a thyroid ultrasound to be performed in radiology and 52.1% ordering an ultrasound in clinic (multiple responses were permitted). Cervical lymph nodes were included in the initial ultrasound assessment by 68.5% of respondents. Overall, more than half (56.6%) of thyroid ultrasounds were performed by endocrinologists, and about a third (31.9%) done by radiologists.
Practice variation from guidelines became apparent when respondents were asked how various nodule characteristics affected the decision to perform a fine needle aspiration (FNA). For a 1.5-cm solid hypoechoic nodule, 93.8% of respondents would perform FNA, while two thirds (67.0%) would perform an FNA for a 0.7-cm hypoechoic nodule with microcalcifications.
When performing FNAs, 83.3% of respondents use ultrasound to guide the biopsy, with most operators performing two (19.2%), three (28.5%), or four (23.0%) passes per nodule.
Of the 897 respondents, 80.5% were TES members, 56.5% were AACE members, and 44.5% were ATA members; most respondents belonged to more than one society. Almost two thirds of respondents (63.0%) were from North America, while 12.2% were from Europe, 10.8% were from Latin America, 6.5% were from Asia, 5.6% were from the Middle East or Africa, and just 1.9% were from Oceania. More men (60.2%) than women responded.
The AACE issued clinical practice guidelines for the management of thyroid nodules in 2010, as did the ATA in 2009 and 2015.
“In summary, management of a thyroid nodule is highly variable and differs from societal guidelines in multiple areas,” wrote Dr. Vietor and her colleagues in the presentation abstract.
On Twitter @karioakes
AT THE 15TH INTERNATIONAL THYROID CONGRESS
Key clinical point: A first-ever international survey of endocrinologists showed wide variation in clinical management of thyroid nodules.
Major finding: Respondents reported performing more fine needle aspiration (FNA) biopsies of thyroid nodules than recommended by practice guidelines.
Data source: Web-based survey of 897 members of three different professional organizations.
Disclosures: No disclosures were identified.
FDA finalizes 1-year blood donor deferral for gay, bisexual men
The Food and Drug Administration announced finalized blood-donor deferral guidance that includes cutting the deferral for men who have sex with men from indefinitely to 1 year from the most recent sexual contact of this type.
The finalized guidance, which had been in development since its initial announcement in December 2014, contains 10 recommended questions that the blood industry should pose to potential donors to exclude those at greatest risk for potentially transmitting HIV in their blood.
In addition to reducing the deferral period for men who have had sex with men, the finalized guidance also cuts the deferral period for a woman who has had sex with a man who had sex with men from indefinitely to 12 months, and also reduces the deferral period for any person who has had sex with someone with a history of a positive test for HIV from indefinitely to 12 months.
The new guidance continues to recommend indefinite deferral for people who have ever tested positive for HIV, those who have exchanged sex for money or drugs, and those with a history of nonprescription injection drug use.
The FDA’s guidance document highlights that these are recommended steps for the blood products industry to take and are not required by law or legally enforceable.
The finalized guidance, which followed a public comment period on essentially unchanged draft guidance issued last May, received quick support in a statement from Dr. Andrew W. Gurman, president-elect of the American Medical Association.
“The American Medical Association commends the U.S. Food and Drug Administration for ending the lifetime ban that prohibits men who have had sex with men from donating blood,” Dr. Gurman said. “The AMA has been a strong advocate for eliminating public policies that do not align with scientific evidence and best ethical practices in public policy. The FDA’s final guidance takes important steps to improve the balance among ensuring health equity, engaging with high-risk populations, and protecting the safety of the national blood supply.”
However, a highly critical comment came from Daniel Bruner, senior director of policy for Whitman-Walker Health, a Washington-based health center focused on the LGBT community and HIV care.
“Although some may argue that a 12-month ban is better than a grossly outdated lifetime ban, the updated policy is still discriminatory and not rooted in the reality of HIV testing today,” Mr. Bruner said in a statement. “As we called for in our recommendations, the deferral period should be no longer than 30 days, given that with current testing technology an HIV infection can be detected in donated blood within several weeks of exposure.
“And even then, those that would be subject to the deferral period should be able to donate blood if they agree to return for an HIV test 30 days after donating,” Mr. Bruner said. “Sadly, and also not in line with modern science, the new guidelines continue the discriminatory lifetime bans on individuals who have ever engaged in sex work or ever used nonprescription injection drugs.”
Mr. Bruner added, “We are also disheartened that the FDA has failed to give clear guidance to prevent discrimination against transgender individuals, which occurs too often at blood donation centers. The FDA must do better than this slow chipping away at antiquated bans.”
On Twitter @mitchelzoler
SF-6D best quality of life measure in cervical spine patients
SAN DIEGO – Among patients undergoing elective surgical spine procedures, the Short Form–6D derived from the Neck Disability Index was more valid and a better responsive measure of general health and quality of life, compared with the Short Form–6D derived from the Short Form–12 or the EuroQol-5D, results from a single-center study showed.
For such quality of life measures to be useful and meaningful, they “should be reproducible, responsive, economical, easy to use, and sensitive to responder burden,” Dr. John A. Sielatycki said at the annual meeting of the Cervical Spine Research Society.

“The EQ-5D is well established and commonly used in many of these studies, as is SF-6D, which in some cases has been shown to be more sensitive in certain disease states,” explained Dr. Sielatycki, a resident in the department of orthopedics at Vanderbilt University, Nashville, Tenn. “The differences between SF-6D and EQ-5D have been studied in a wide variety of disease conditions, but to our knowledge few have looked at this specifically in the setting of cervical spine operations.”
To analyze the validity and responsiveness of the SF-6D (derived from both the SF-12 and the NDI) and the EQ-5D in determining overall health and quality of life following elective cervical spine procedures, Dr. Sielatycki and his associates compared the three tools in 420 consecutive patients who presented over the course of 2 years. Trauma and workers’ compensation cases were excluded from the study, as were patients who had a tumor or an infection.
The researchers collected outcome measures at baseline, 3 months, 6 months, 12 months, and yearly thereafter, and defined meaningful improvement as having a North American Spine Society patient satisfaction score of 1, indicating the procedure “met the patient’s expectations.” Next, they generated receiver operating characteristic curves to discriminate between meaningful and nonmeaningful improvement.
The SF-6D (NDI) was a more valid discriminator of meaningful improvement, compared with the SF-6D (SF-12) or the EQ-5D (area under the curve of .69, .65, and .62, respectively). It was also a more responsive measure, compared with the SF-6D (SF-12) and the EQ-5D (standardized response means difference of .66, .48, and .44, respectively).
“Surgeons, outcomes researchers, and payers should use health metrics that are most responsive to changes in the particular disease in question,” Dr. Sielatycki said. “Based on this analysis, SF-6D derived from NDI may be a more valid and responsive measure of improvement in patients undergoing cervical procedures. We suggest that this metric be used in cost-effectiveness analysis and in calculating quality-adjusted life years for cervical spine patients.”
Dr. Sielatycki acknowledged certain limitations of the study, including the fact that it “should have some external validation done to further corroborate our findings. Our gold standard of meaningful improvement has not been established.”
Dr. Sielatycki reported having no financial disclosures.
SAN DIEGO – Among patients undergoing elective surgical spine procedures, the Short Form–6D derived from the Neck Disability Index was more valid and a better responsive measure of general health and quality of life, compared with the Short Form–6D derived from the Short Form–12 or the EuroQol-5D, results from a single-center study showed.
For such quality of life measures to be useful and meaningful, they “should be reproducible, responsive, economical, easy to use, and sensitive to responder burden,” Dr. John A. Sielatycki said at the annual meeting of the Cervical Spine Research Society.
“The EQ-5D is well established and commonly used in many of these studies, as is SF-6D, which in some cases has been shown to be more sensitive in certain disease states,” explained Dr. Sielatycki, a resident in the department of orthopedics at Vanderbilt University, Nashville, Tenn. “The differences between SF-6D and EQ-5D have been studied in a wide variety of disease conditions, but to our knowledge few have looked at this specifically in the setting of cervical spine operations.”
To analyze the validity and responsiveness of the SF-6D (derived from both the SF-12 and the NDI) and the EQ-5D in determining overall health and quality of life following elective cervical spine procedures, Dr. Sielatycki and his associates compared the three tools in 420 consecutive patients who presented over the course of 2 years. Trauma and workers’ compensation cases were excluded from the study, as were patients who had a tumor or an infection.
The researchers collected outcome measures at baseline, 3 months, 6 months, 12 months, and yearly thereafter, and defined meaningful improvement as having a North American Spine Society patient satisfaction score of 1, indicating the procedure “met the patient’s expectations.” Next, they generated receiver operating characteristic curves to discriminate between meaningful and nonmeaningful improvement.
The SF-6D (NDI) was a more valid discriminator of meaningful improvement, compared with the SF-6D (SF-12) or the EQ-5D (area under the curve of .69, .65, and .62, respectively). It was also a more responsive measure, compared with the SF-6D (SF-12) and the EQ-5D (standardized response means difference of .66, .48, and .44, respectively).
“Surgeons, outcomes researchers, and payers should use health metrics that are most responsive to changes in the particular disease in question,” Dr. Sielatycki said. “Based on this analysis, SF-6D derived from NDI may be a more valid and responsive measure of improvement in patients undergoing cervical procedures. We suggest that this metric be used in cost-effectiveness analysis and in calculating quality-adjusted life years for cervical spine patients.”
Dr. Sielatycki acknowledged certain limitations of the study, including the fact that it “should have some external validation done to further corroborate our findings. Our gold standard of meaningful improvement has not been established.”
Dr. Sielatycki reported having no financial disclosures.
AT CSRS 2015
Key clinical point: The Short Form–6D derived from the Neck Disability Index is an effective measure of outcomes in cervical spine patients.
Major finding: The Short Form–6D derived from the Neck Disability Index was a more valid discriminator of meaningful improvement, compared with the Short Form–6D derived from the Short Form–12 or the EuroQol-5D (AUC of .69, .65, and .62, respectively).
Data source: A single-center study that compared three quality of life measures in 420 patients presenting for elective surgical spine procedures.
Disclosures: Dr. Sielatycki reported having no financial disclosures.
‘Hot’ Joints May Predict RA Joint Damage
Recording the temperature of skin over an inflamed joint may identify rheumatoid arthritis patients at high risk of joint damage, an exploratory study suggested.
Dermal joint temperature could become a screening test to “quickly and accurately” identify individual RA patients at high risk for radiographic damage and those who may benefit from biologic therapy, said Dr. Maria Greenwald, a rheumatologist in group practice in Palm Desert, Calif., and her colleagues.

During 2009-2014, the investigators enrolled seropositive RA patients who were on stable doses of methotrexate (20-25 mg/wk) for the past 3 months and did not use biologics or other disease-modifying antirheumatic drugs. It took 9 months to enroll 104 patients with cool joints and 42 months to enroll 104 patients with hot joints, suggesting “that at a single office visit, RA patients on methotrexate are five times more likely to have cool joints than hot joints,” the researchers reported.
The results showed that patients in the hot-joint cohort had a nearly fourfold higher risk of x-ray damage at 1-year follow-up, compared with those with cool joints (change in modified van der Heijde total Sharp score [mTSS]: 8.7 vs. 2.5; P less than .001). Patients with hot joints had an average joint temperature exceeding central forehead body temperature by 1.1° F, whereas those with cool joints had an average joint temperature of 4.3° F below central forehead body temperature.
In the cohort of patients with hot joints, 74% had clear x-ray evidence of new joint damage (mTSS of 5 or greater), compared with 7% of cold-joint cohort patients at 1-year follow-up. Joint temperature at the hand or wrist predicted x-ray damage in the next year with 92% sensitivity and 78% specificity(Arthritis Care Res. 2015 Dec 14. doi: 10.1002/acr.22813).
Patients in the hot-joint cohort were younger, had more recent onset of RA, and had a significantly higher Westergren erythrocyte sedimentation rate than patients in the cool-joint cohort, the investigators noted.
They suggested a future study might define a hot-joint cohort as RA patients with a joint that measures over a set point such as 98° F. “Such a cutoff would make assessment very simple and would maintain the specificity and sensitivity of the model,” they said.
No conflicts of interest were disclosed.
Recording the temperature of skin over an inflamed joint may identify rheumatoid arthritis patients at high risk of joint damage, an exploratory study suggested.
Dermal joint temperature could become a screening test to “quickly and accurately” identify individual RA patients at high risk for radiographic damage and those who may benefit from biologic therapy, said Dr. Maria Greenwald, a rheumatologist in group practice in Palm Desert, Calif., and her colleagues.
During 2009-2014, the investigators enrolled seropositive RA patients who were on stable doses of methotrexate (20-25 mg/wk) for the past 3 months and did not use biologics or other disease-modifying antirheumatic drugs. It took 9 months to enroll 104 patients with cool joints and 42 months to enroll 104 patients with hot joints, suggesting “that at a single office visit, RA patients on methotrexate are five times more likely to have cool joints than hot joints,” the researchers reported.
The results showed that patients in the hot-joint cohort had a nearly fourfold higher risk of x-ray damage at 1-year follow-up, compared with those with cool joints (change in modified van der Heijde total Sharp score [mTSS]: 8.7 vs. 2.5; P less than .001). Patients with hot joints had an average joint temperature exceeding central forehead body temperature by 1.1° F, whereas those with cool joints had an average joint temperature of 4.3° F below central forehead body temperature.
In the cohort of patients with hot joints, 74% had clear x-ray evidence of new joint damage (mTSS of 5 or greater), compared with 7% of cold-joint cohort patients at 1-year follow-up. Joint temperature at the hand or wrist predicted x-ray damage in the next year with 92% sensitivity and 78% specificity(Arthritis Care Res. 2015 Dec 14. doi: 10.1002/acr.22813).
Patients in the hot-joint cohort were younger, had more recent onset of RA, and had a significantly higher Westergren erythrocyte sedimentation rate than patients in the cool-joint cohort, the investigators noted.
They suggested a future study might define a hot-joint cohort as RA patients with a joint that measures over a set point such as 98° F. “Such a cutoff would make assessment very simple and would maintain the specificity and sensitivity of the model,” they said.
No conflicts of interest were disclosed.
FROM ARTHRITIS CARE & RESEARCH

Thigh muscle weakness a risk factor for knee replacement in women
Women with knee osteoarthritis who had low thigh muscle strength were more likely to need a knee replacement in a case-control study of participants in the Osteoarthritis Initiative (OAI).
In particular, predictors of knee replacement included knee extensor weakness in the year prior to knee replacement and longitudinal deterioration in knee extensor strength over a 2-year observation period prior to surgery. Measurement of knee extensor strength in women with knee osteoarthritis may then indicate who could benefit from weight training exercises to potentially delay or prevent the need for knee replacement surgery, said the researchers, led by Dr. Adam Culvenor of Paracelsus Medical University in Salzburg, Austria (Arthritis Rheumatol. 2015 Dec 14. doi: 10.1002/art.39540).
The optimal knee extensor strength threshold for differentiating those with and without knee replacement risk was approximately 200 N or 0.9 Nm/kg; or prevention of any loss of knee extensor strength over 2 years.

“There appears to be a considerable window for women below this threshold to obtain realistic strength gains and potentially lower the risk of knee replacement,” the study authors concluded.
In the multicenter, longitudinal, case-control study of 4,796 participants in the OAI (60% of whom were women), the investigators identified 136 participants who had received a knee replacement and matched them with controls who had not received a knee replacement and were similar in age, body mass index (BMI), and radiographic stage. The mean age of the women was 65 years and the mean BMI was 29 kg/m2.
The results showed that knee extensor strength at the examination prior to knee replacement (time T0), which occurred 2 years or less before surgery, was significantly lower in females who had received a knee replacement than in matched controls (pain-adjusted odds ratio, 1.72; 95% confidence interval, 1.16-2.56; P = .007). Measurement of the longitudinal change in knee extensor and flexor strength between T0 and 2 years prior to T0 (T-2) also provided similar results (pain-adjusted OR, 4.30; 95% CI, 1.34-13.79; P = .014). The findings were independent of age, BMI, and radiographic disease severity, the researchers noted.
The investigators found no relationship between knee extensor or flexor muscle strength in men and subsequent need for knee replacement surgery. The relationship between thigh muscle strength and knee replacement for women did not extend to measurements made at T-2 or T-4 or the change in thigh muscle strength between T-2 and T-4.
The OAI receives funding from the National Institutes of Health, Merck Research Laboratories, Novartis, GlaxoSmithKline, and Pfizer. The work was also funded by a grant from the European Union Seventh Framework Programme. One author disclosed consulting or preparing educational sessions for pharmaceutical companies and for receiving research support. Two authors reported being employees of Chondrometrics GmbH, a company providing MR image analysis services to academic researchers and to industry.
Women with knee osteoarthritis who had low thigh muscle strength were more likely to need a knee replacement in a case-control study of participants in the Osteoarthritis Initiative (OAI).
In particular, predictors of knee replacement included knee extensor weakness in the year prior to knee replacement and longitudinal deterioration in knee extensor strength over a 2-year observation period prior to surgery. Measurement of knee extensor strength in women with knee osteoarthritis may then indicate who could benefit from weight training exercises to potentially delay or prevent the need for knee replacement surgery, said the researchers, led by Dr. Adam Culvenor of Paracelsus Medical University in Salzburg, Austria (Arthritis Rheumatol. 2015 Dec 14. doi: 10.1002/art.39540).
The optimal knee extensor strength threshold for differentiating those with and without knee replacement risk was approximately 200 N or 0.9 Nm/kg; or prevention of any loss of knee extensor strength over 2 years.
“There appears to be a considerable window for women below this threshold to obtain realistic strength gains and potentially lower the risk of knee replacement,” the study authors concluded.
In the multicenter, longitudinal, case-control study of 4,796 participants in the OAI (60% of whom were women), the investigators identified 136 participants who had received a knee replacement and matched them with controls who had not received a knee replacement and were similar in age, body mass index (BMI), and radiographic stage. The mean age of the women was 65 years and the mean BMI was 29 kg/m2.
The results showed that knee extensor strength at the examination prior to knee replacement (time T0), which occurred 2 years or less before surgery, was significantly lower in females who had received a knee replacement than in matched controls (pain-adjusted odds ratio, 1.72; 95% confidence interval, 1.16-2.56; P = .007). Measurement of the longitudinal change in knee extensor and flexor strength between T0 and 2 years prior to T0 (T-2) also provided similar results (pain-adjusted OR, 4.30; 95% CI, 1.34-13.79; P = .014). The findings were independent of age, BMI, and radiographic disease severity, the researchers noted.
The investigators found no relationship between knee extensor or flexor muscle strength in men and subsequent need for knee replacement surgery. The relationship between thigh muscle strength and knee replacement for women did not extend to measurements made at T-2 or T-4 or the change in thigh muscle strength between T-2 and T-4.
The OAI receives funding from the National Institutes of Health, Merck Research Laboratories, Novartis, GlaxoSmithKline, and Pfizer. The work was also funded by a grant from the European Union Seventh Framework Programme. One author disclosed consulting or preparing educational sessions for pharmaceutical companies and for receiving research support. Two authors reported being employees of Chondrometrics GmbH, a company providing MR image analysis services to academic researchers and to industry.
FROM ARTHRITIS & RHEUMATOLOGY
Key clinical point: A window of opportunity exists for women with knee osteoarthritis and low thigh muscle strength to potentially lower their risk of knee replacement.
Major finding: Women who underwent knee replacement had significantly lower thigh muscle strength compared to matched controls who had not had knee surgery.
Data source: A multicenter longitudinal case control study involving 4,796 participants in the Osteoarthritis Initiative (OAI).
Disclosures: The OAI receives funding from the National Institutes of Health, Merck Research Laboratories, Novartis, GlaxoSmithKline, and Pfizer. The work was also funded by a grant from the European Union Seventh Framework Programme. One author disclosed consulting or preparing educational sessions for pharmaceutical companies and for receiving research support. Two authors reported being employees of Chondrometrics GmbH, a company providing MR image analysis services to academic researchers and to industry.
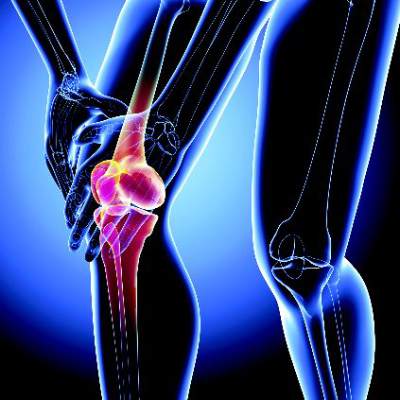
Effectiveness of Antipsychotics in Treatment of Delirium
Clinical questions: Are antipsychotics for the treatment of delirium safe and effective? Does efficacy differ between ICU and non-ICU settings? Does efficacy differ between first- and second-generation antipsychotics (SGA)?

Background: Delirium is common in hospitalized patients. Data are mixed about the use of antipsychotics for treatment of delirium, and safety concerns are well founded. A 2007 Cochrane review failed to show compelling evidence for their efficacy, yet they remain widely used for this purpose.
Study design: Systematic review and meta-analysis.
Setting: Fifteen RCTs of adults with delirium.
Synopsis: The primary outcome measure was response rate at the study endpoint, defined using severity of delirium and global scales.
In a comparison of pooled or individual antipsychotics vs. placebo or usual care (UC), antipsychotics were found to be superior, with a response rate of 0.22 (95% CI, 0.15-0.34, P<.00001), NNT=2. Subgroup analysis revealed this superiority to be greater in non-ICU settings, with ICU antipsychotic use only marginally better than UC. Antipsychotics were superior in time to response (TTR). Mortality rates were no different.
There were no differences between chlorpromazine and haloperidol in any outcomes. Among head-to-head comparisons of SGAs, no differences were found. Pooled or individual SGAs, however, had the same overall efficacy as haloperidol but shorter TTR and fewer extrapyramidal side effects. Subgroup analysis showed a small but significant advantage in the use of SGAs over haloperidol in the ICU.
Bottom line: Antipsychotics are more effective than placebo or usual care in the treatment of delirium. There appears to be a benefit to using second-generation antipsychotics over haloperidol.
Citation: Kishi T, Hirota T, Matsunaga S, Iwata N. Antipsychotic medications for the treatment of delirium: a systematic review and meta-analysis of randomised controlled trials. J Neurol Neurosurg Psychiatry. 2015;0:1-8.
Clinical questions: Are antipsychotics for the treatment of delirium safe and effective? Does efficacy differ between ICU and non-ICU settings? Does efficacy differ between first- and second-generation antipsychotics (SGA)?
Background: Delirium is common in hospitalized patients. Data are mixed about the use of antipsychotics for treatment of delirium, and safety concerns are well founded. A 2007 Cochrane review failed to show compelling evidence for their efficacy, yet they remain widely used for this purpose.
Study design: Systematic review and meta-analysis.
Setting: Fifteen RCTs of adults with delirium.
Synopsis: The primary outcome measure was response rate at the study endpoint, defined using severity of delirium and global scales.
In a comparison of pooled or individual antipsychotics vs. placebo or usual care (UC), antipsychotics were found to be superior, with a response rate of 0.22 (95% CI, 0.15-0.34, P<.00001), NNT=2. Subgroup analysis revealed this superiority to be greater in non-ICU settings, with ICU antipsychotic use only marginally better than UC. Antipsychotics were superior in time to response (TTR). Mortality rates were no different.
There were no differences between chlorpromazine and haloperidol in any outcomes. Among head-to-head comparisons of SGAs, no differences were found. Pooled or individual SGAs, however, had the same overall efficacy as haloperidol but shorter TTR and fewer extrapyramidal side effects. Subgroup analysis showed a small but significant advantage in the use of SGAs over haloperidol in the ICU.
Bottom line: Antipsychotics are more effective than placebo or usual care in the treatment of delirium. There appears to be a benefit to using second-generation antipsychotics over haloperidol.
Citation: Kishi T, Hirota T, Matsunaga S, Iwata N. Antipsychotic medications for the treatment of delirium: a systematic review and meta-analysis of randomised controlled trials. J Neurol Neurosurg Psychiatry. 2015;0:1-8.

Potential new alternative in CML when TKI therapy fails

ASH Annual Meeting
Photo courtesy of ASH
ORLANDO, FL—ABL001, an allosteric inhibitor of BCR-ABL1, has shown early evidence of single-agent activity in a multicenter, first-in-human, first-in-class trial of heavily treated patients with chronic myeloid leukemia (CML) that is resistant to or intolerant of prior tyrosine kinase inhibitors (TKIs), even at the lowest dose evaluated.
ABL001 and classical TKIs exhibit complementary mutation profiles, with ABL001 showing activity against TKI resistance mutations.
When combined with nilotinib in a mouse model of CML, ABL001 prevented the emergence of resistant disease even after treatment was discontinued.
“This produces a new therapeutic concept—that of allosteric inhibition,” said Oliver G. Ottmann, MD, of Cardiff University in the UK.
The ABL001 binding site is located in a region remote from the kinase domain and has the potential to combine with TKIs for greater pharmacologic control of BCR-ABL1.
“This obviously has the opportunity both for combining different treatments and for overcoming resistance to one or the other,” Dr Ottmann added.
Based on preliminary pharmacokinetic data and preclinical evidence, investigators proceeded to evaluate ABL001 in a phase 1 dose-escalation and dose-expansion study.
Their primary objective was to determine the maximum tolerated dose (MTD) in humans and the recommended dose for expansion (RDE). Secondary objectives were to evaluate the safety, tolerability, preliminary anti-CML activity, and pharmacokinetic and pharmacodynamic profile.
Dr Ottmann presented the findings during the 2015 ASH Annual Meeting as abstract 138.*
Study design
Patients received ABL001 orally as a single agent twice a day (BID) continuously until disease progression, unacceptable toxicity, consent withdrawal, or death.
The dose-escalation schema followed a Bayesian logistic regression model based on dose-limiting toxicities during cycle 1. Doses ranged from 10 mg to 200 mg BID.
A subsequent dose-expansion phase was planned to augment the data generated in the dose-escalation phase and to include patients with Ph-positive acute lymphoblastic leukemia resistant or intolerant to prior TKI therapy.
Dr Ottmann noted that there were 2 protocol amendments. The first amendment was made to include a once-daily (QD) dosing of ABL001 at 120 mg and 200 mg. The second amendment was made to evaluate the combination of 40 mg of ABL001 BID with nilotinib at 300 mg BID.
Inclusion/exclusion criteria
Patients had to be at least 18 years old with CML in chronic or accelerated phase. They had to have failed at least 2 prior TKIs or be intolerant of TKIs. Their performance status had to be 0–2.
Patients were excluded from the trial if they had an absolute neutrophil count less than 500/mm3, a platelet count less than 50,000/mm3, bilirubin level more than 1.5 x the upper limit of normal (ULN) or more than 3.0 x ULN in patients with Gilberts syndrome.
Their aspartate aminotransferase or alanine aminotransferase could not be above 3 x ULN, and creatinine could not be above 1.5 x ULN.
Patients were also excluded if they needed treatment with strong inhibitors or inducers of CYP3A4 or its substrates with narrow therapeutic index.
Patient demographics
Fifty-nine patients were enrolled on the trial at the time of the presentation and they had “typical” characteristics of patients at this stage, Dr Ottmann said.
Their median age was 56 (range, 23–78). Almost two-thirds (61%) were male and 39% female.
All but 1 patient had an ECOG performance status of 0, and patients had a median of 3.5 (range, 2–5) prior lines of therapy. Twenty-four patients (41%) had 2 prior TKIs, and 35 (59%) had 3 or more TKIs. Forty-five patients (76%) were resistant and 14 (24%) were intolerant to their prior TKI.
All but 1 patient had chronic phase CML, 18 (31%) were TKD nonmutated, 14 (24%) were mutated, and 17 (46%) were not evaluable.
Patient disposition
Of the 43 patients in the monotherapy BID cohort, 1 was treated at the 10 mg dose level, 5 at the 20 mg level, 12 at the 40 mg level, 12 at the 80 mg level, 8 at the 150 mg level, and 5 at the 200 mg level. They had a median duration of drug exposure ranging from 25 weeks to 67 weeks.
Of the 11 patients in the monotherapy QD group, 5 were treated at the 120 mg dose level and 6 at the 200 mg level. Their drug exposure was a median of 26 weeks for those receiving 120 mg and 9.8 weeks for those receiving the 200 mg dose.
And the 5 patients in the ABL001-plus-nilotinib group had a median of 6.3 weeks of drug exposure.
“We had a remarkably low rate of discontinuation to date,” Dr Ottmann pointed out.
Ten patients discontinued therapy, all in the monotherapy BID group, 1 at 10 mg, 2 at 40 mg, 2 at 80 mg, 3 at 150 mg, and 2 at 200 mg.
Seven patients discontinued for adverse events. Two patients withdrew consent, and 1 patient in the 40 mg group had disease progression, which is “quite remarkable in a phase 1,” Dr Ottmann said.
Pharmacokinetic profile
ABL001 is rapidly absorbed in a median of 2 to 3 hours, and there is a dose-proportional increase in exposure following single and repeated dosing.
The drug has an approximately 2-fold or lower accumulation on repeated dosing and a short elimination half-life of 5 to 6 hours.
Safety
“We have excellent tolerability,” Dr Ottmann said, with a small number of grade 3/4 adverse events (AEs).
Grade 3/4 AEs considered to be drug-related were mostly associated with hematologic suppression. Four patients (7%) had thrombocytopenia, 4 (7%) neutropenia, 3 (5%) anemia, 4 (7%) lipase increase, and 1 (2%) hypercholesterolemia.
AEs of all grades suspected of being related to the study drug and occurring in 5% or more of patients included thrombocytopenia (19%), neutropenia (15%), anemia (10%), nausea/vomiting/diarrhea (29%), arthralgia/myalgia (20%), rash (17%), fatigue (15%), lipase increase (14%), headache (14%), pruritus (10%), dry skin (7%), hypophosphatemia (7%), and acute pancreatitis (5%).
“The pancreatitis was reversible upon interruption or discontinuation of the drug,” Dr Ottmann explained.
There were 5 dose-limiting toxicities. Two patients had grade 3 lipase elevation in the 40 mg BID and 200 mg QD cohorts. One patient had grade 2 myalgia/arthralgia at 80 mg BID, 1 patient had a grade 3 acute coronary event at 150 mg BID, and 1 patient had a grade 3 bronchospasm at 200 mg BID.
No deaths occurred on the study, and the dose escalation is still ongoing.
Response
Twenty-nine patients with 3 months or more of follow-up were evaluable for response.
Twelve patients, who at baseline had hematologic relapse, achieved complete hematologic response within 2 months, and 8 who had cytogenetic relapse at baseline achieved a complete cytogenetic response within 3 to 6 months.
Of the 29 patients who had molecular relapse at baseline, 10 (34.5%) achieved a molecular response within 6 months, 7 (24.1%) had 1 log or more reduction in BCR-ABL1, 9 (31.0%) had less than a log reduction, and 3 (10.3%) had no reduction.
“The obvious question from the preclinical data,” Dr Ottmann said, “is do the mutations respond?”
And ABL001 has shown clinical activity across TKI-resistant mutations, such as V299L, F317L, and Y253H.
“So to conclude,” he said, “we have a new class, a new therapeutic category of drug, ABL001, which is quite well tolerated in extremely heavily treated patients with CML. We do consider this a promising approach.”
The trial was sponsored by Novartis. ![]()
*Data in the abstract differ from the presentation.
CHMP recommends FVIII product for hemophilia A
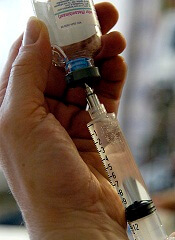
The European Medicines Agency’s Committee for Medicinal Products for Human Use (CHMP) has recommended BAY 81-8973, a recombinant factor VIII (FVIII) compound, for approval in the European Union.
BAY 81-8973 is an unmodified, full-length, recombinant FVIII compound intended for the treatment and prophylaxis of bleeding in hemophilia A patients of all ages.
The CHMP’s recommendation has been relayed to the European Commission, which is expected to make a decision regarding BAY 81-8973 in the coming weeks.
If approved, BAY 81-8973 will be marketed for the aforementioned indication in the 28 member countries of the European Union, as well as Iceland, Liechtenstein, and Norway.
The CHMP’s recommendation is based on results from the LEOPOLD trials, which were presented at the National Hemophilia Foundation’s 67th Annual Meeting last August.
LEOPOLD trials
The LEOPOLD Clinical Development Program consists of 3 multinational clinical trials designed to evaluate the pharmacokinetics, efficacy, and safety of BAY 81-8973 in subjects with severe hemophilia A (<1% FVIII:C).
LEOPOLD I is an open-label, cross-over, phase 3 study of males ages 12 to 65. The objectives were to demonstrate the efficacy and safety of BAY 81-8973 when used as prophylaxis, for the treatment of bleeding episodes, and for maintaining hemostasis during surgery. In LEOPOLD I, investigators assigned subjects to either the 2- or 3-times-weekly dosing regimens based on each patient’s phenotype, prior bleeding history and other factors.
LEOPOLD II is a randomized, cross-over, open-label trial conducted in male subjects ages 12 to 65. In this phase 3 study, 80 subjects were randomized to receive BAY 81-8973 either as a low-dose prophylaxis regimen (20-30 IU/kg; n=28) twice per week, high-dose prophylaxis (30-40 IU/kg; n=31) 3 times a week, or on-demand (n=21).
The primary objective was to demonstrate the superiority of prophylaxis over on-demand therapy, with the primary endpoint being bleeding frequency at 12 months.
LEOPOLD Kids is an open-label, non-randomized, phase 3 study. Part A is designed to evaluate the efficacy and safety of BAY 81-8973 for prophylaxis, treatment of bleeds, and surgical management in previously treated children at least 12 years of age with twice or 3 times per week or every other day prophylaxis regimens. Part B of the study, which involves previously untreated patients, is ongoing.
Bayer HealthCare AG has submitted marketing applications for BAY 81-8973 in the US and several other countries and is pursuing regulatory approvals worldwide. ![]()
Six factors predicted poor surgical outcomes in toxic colitis
Older age, female sex, preoperative chronic steroid use, azotemia, respiratory insufficiency, and coagulopathy all predicted death within a month of colectomy in patients with toxic colitis in the National Surgical Quality Improvement Project database.
The study is the largest to evaluate patients undergoing colectomy for toxic colitis, according to lead investigator Dr. Anand Dayama of the University of California, Davis, and his associates.
“In a case such as multiorgan failure with toxic colitis, the decision whether ... to operate can be an immensely difficult one,” Dr. Dayama and his colleagues wrote. “This study can help in making informed decisions in order to avoid the medicolegal ramifications of either performing an unnecessary procedure or withholding a lifesaving one,” they wrote in the American Journal of Surgery.
Surgical salvage remains the preferred treatment for patients with medically refractory toxic colitis. To assess outcomes in these patients, the researchers queried the National Surgical Quality Improvement Project database for relevant International Classification of Diseases, Ninth Revision codes between 2005 and 2012 (Am J Surg. 2015 Nov;210[5]:852-8).
The results underscored the severity of toxic colitis, they said. Of 189 patients, more than 26% died within 30 days after surgery, one in five developed postsurgical sepsis, about 17% had cardiovascular complications, 15% had wound complications, and 13% had renal complications. Furthermore, patients who were 70-80 years old had 3.5 times greater odds of dying, compared with younger patients (95% confidence interval, 1.0-12.8), and the increased likelihood of death rose by 22.2 when patients were older than 80 years (95% CI, 5.7-86.4).
Other baseline predictors of 30-day mortality included female sex (odds ratio, 4.1), blood urea nitrogen levels above 40 mg/dL (OR, 4.1), an international normalized ratio exceeding 2 (OR, 7.7), preoperative respiratory insufficiency (OR, 2.73), and a history of chronic steroid use (OR, 3.9), the researchers said. In addition, patients who died within 30 days after surgery were more likely than survivors to have undergone prolonged mechanical ventilation (56% vs. 27%), to have returned to the operating room (18% vs. 14%), to have acute renal failure (28% vs. 6%), or to have suffered a cardiac arrest that required cardiopulmonary resuscitation (18% vs. 7%). Survivors averaged about 2 fewer days in the hospital, compared with patients who died after surgery.
“The high morbidity and mortality of toxic colitis requires early and intensive medical management with IV [intravenous] steroids, antibiotics, decompressive maneuvers, and other resuscitative measures to treat the underlying cause,” they emphasized. “If there is no sign of improvement within 7 days or if there are any signs of deterioration, urgent surgical intervention should be considered.”
The link between female sex and mortality might reflect hormonal changes associated with menopause, but the study did not assess hormonal status or use of hormone therapy, the investigators noted. The association between chronic steroid use and postoperative death “is highly relevant” because long-term steroids are so often used in inflammatory bowel disease, they added. Clinical guidelines (Am J Gastroenterol. 2012 Feb;107:179-94) recommend that patients with acute severe ulcerative colitis proceed to second-line therapy or surgery if they do not respond to 3 days of intravenous steroids, because unnecessary delays can increase the risk of postoperative complications, they added.
The researchers reported no funding sources and had no disclosures.
FROM THE AMERICAN JOURNAL OF SURGERY
Key clinical point: Older age, female sex, preoperative azotemia, chronic steroid use, preoperative respiratory failure, and coagulopathy predicted adverse surgical outcomes in patients with toxic colitis.
Major finding: Odds ratios for these factors in the multivariate model ranged from 2.7 (preoperative respiratory failure) to 22.2 (age older than 80 years).
Data source: A multicenter prospective analysis of data from the National Surgical Quality Improvement Project.
Disclosures: The investigators reported no funding sources and had no disclosures.
