User login
Greater Auricular Nerve Palsy After Arthroscopic Anterior-Inferior and Posterior-Inferior Labral Tear Repair Using Beach-Chair Positioning and a Standard Universal Headrest
Anterior-inferior and posterior-inferior labral tears are common injuries treated with arthroscopic surgery1 typically performed with beach-chair2,3 or lateral decubitus1,2 positioning and variable headrest positioning. Iatrogenic nerve damage that occurs after arthroscopic shoulder surgery—including damage to the suprascapular, axillary, musculocutaneous, subscapular, and spinal accessory nerves—has recently been reported to be more common than previously recognized.2,4
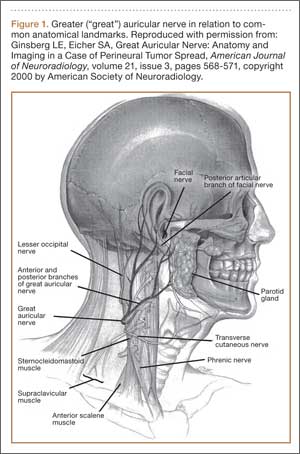
Although iatrogenic nerve injuries are in general being recognized,1,2,4 reports of greater auricular nerve injuries are limited. The greater auricular nerve is a superficial cutaneous nerve that arises from the cervical plexus at the C2 and C3 spinal nerves, obliquely crosses the sternocleidomastoid muscle, and splits into anterior and posterior portions that innervate the skin over the mastoid process and parotid gland.5,6 In particular, as illustrated by Ginsberg and Eicher6 (Figure 1), its superficial anatomy lies very near where a headrest is positioned during arthroscopic surgery, and increased pressure on the nerve throughout arthroscopic shoulder surgery may lead to neurapraxia.6,7 In 2 case series, authors reported on a total of 5 patients who had greater auricular nerve palsy after uncomplicated shoulder surgery using beach-chair positioning and a horseshoe headrest.7,8 The authors attributed these palsies to the horseshoe headrest, which they believed was compressing the greater auricular nerve during the entire surgery.7,8 However, standard universal headrests, which are thought to distribute pressures that would theoretically place the greater auricular nerve at risk for palsy, previously had not been described as contributing to palsy of the greater auricular nerve.
In this article, we report on a case of greater auricular nerve palsy that occurred after the patient’s anterior-inferior and posterior-inferior labral tear was arthroscopically repaired using beach-chair positioning and a standard universal headrest. The patient provided written informed consent for print and electronic publication of this case report.
Case Report
An 18-year-old right-hand–dominant high school American football player was referred for orthopedic evaluation of left chronic glenohumeral instability after 6 months of physical therapy. Physical examination revealed a positive apprehension test with the shoulder abducted and externally rotated at 90° and a positive relocation test. The patient complained of pain and instability when his arm was placed in a cross-chest adducted position and a posteroinferiorly directed axial load was applied. Magnetic resonance arthrogram showed an anterior-inferior labral Bankart tear with a small Hill-Sachs lesion to the humeral head but did not clearly reveal the posterior-inferior labral tear. Because of persistent left shoulder instability with most overhead activities and continued pain, the patient decided to undergo left shoulder arthroscopic Bankart repair with inferior capsular shift and posterior-inferior labral repair with capsulorraphy. He had no significant past medical history or known drug allergies.
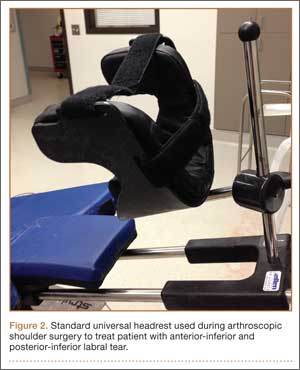
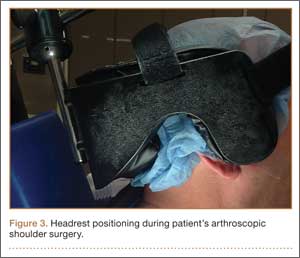
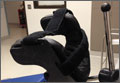
The patient was placed in the standard beach-chair position: upright at 45° to the floor, hips flexed at 60°, knees flexed at 30°.1 Pneumatic compression devices were placed on his lower extremities. His head was secured in neutral position to a standard universal headrest (model A-90026; Allen Medical Systems, Acton, Massachusetts) (Figures 2, 3). Care was taken to protect the deep neurovascular structures and bony prominences throughout. The patient was in this position for 122 minutes of the operation, from positioning and draping to wound closure and dressing application. Before draping, the anesthesiologist, head nurse, and circulating nurse ensured that head and neck were in neutral position. The anesthesiologist monitored positioning throughout the perioperative period to ensure head and neck were in neutral, and the head did not need to be repositioned during surgery. Standard preoperative intravenous antibiotics were given.
General anesthesia and postoperative interscalene block were used. Standard preparation and draping were performed. Three standard arthroscopic portal incisions were used: posterior, anterior, and anterosuperolateral. Findings included extensive labral pathology, small bony Hill-Sachs lesion to humeral head, small bony anterior glenoid deficiency, and deficient anterior-inferior and posterior-inferior labral remnant. These were repaired arthroscopically in a standard fashion using bioabsorbable suture anchors. There were no arthroscopic complications. After surgery, a standard well-fitted shoulder immobilizer was placed. The anesthesiologist provided interscalene regional analgesia (15 mL of bupivacaine 0.5%) in the recovery area after surgery.
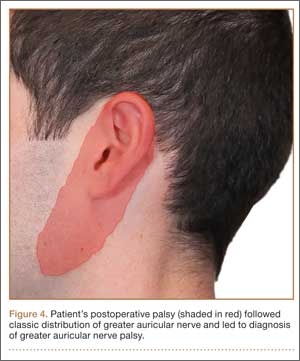
Postoperative neurovascular examination in the recovery room revealed no discomfort. The patient was discharged the same day. At a scheduled 1-week follow-up, he complained of numbness and dysesthesia on the left side of the greater auricular nerve distribution. A diagnosis of greater auricular nerve palsy was made by physical examination; the symptoms were along the classic greater auricular nerve distribution affecting the lower face and ear (Figure 4). The patient had no pain, skin lesions, or soft-tissue swelling. Otolaryngology confirmed the diagnosis and recommended observation-only treatment of symptoms. Symptoms lessened over the next 3 months, and the altered sensation resolved without deficit by 6 months. In addition, by 6 months the patient had returned to full activities (including collision sports) pain-free and with normal left shoulder function. Because symptoms continued to improve, the patient was followed with clinical observation, and a formal work-up was not necessary.
Discussion
The most important finding in this case is the greater auricular nerve palsy that occurred after arthroscopic anterior-inferior and posterior-inferior labral repairs in beach-chair positioning. This greater auricular nerve palsy was the first encountered by Dr. Foad, who over 17 years in a primarily shoulder practice setting has used beach-chair positioning exclusively. Previous reports have described a palsy occurring after arthroscopic shoulder surgery using beach-chair positioning and a horseshoe headrest.7,8 Ng and Page7 discontinued and recommended against use of this headrest because of the complications of the palsy, and Park and Kim8 recommended a headrest redesign. We think the present case report is the first to describe a greater auricular nerve palsy that occurred after arthroscopic surgery using a standard universal headrest, which theoretically should prevent compression of the greater auricular nerve. Increased awareness of the possibility of greater auricular nerve palsy, even when proper precautions are taken,1 is therefore warranted.
Based on the location of our patient’s palsy, we think his paralysis was most likely the result of nerve compression by the headrest during the shoulder surgery. Other factors, though unlikely, may have played a role. These include operative time (increases duration of nerve compression) and head positioning. However, 122 minutes is not unusually long for a patient’s head to be in this position during a procedure, and over the past 10 years the same anesthesiologist, head nurse, and circulating nurse have routinely used the same beach-chair positioning and headrest for Dr. Foad’s patients. Second, the postoperative interscalene block theoretically could have caused the palsy, but we think this is unlikely, as the block is placed lower on the neck, at the C6 level, and the greater auricular nerve branches off the C2–C3 spinal nerves. As described by Rains and colleagues,9 other authors have reported transient neuropathies to the brachial plexus, which originates in the C5–C8 region, but not to the greater auricular nerve. Last, it cannot be ruled out that a variant of the greater auricular nerve could have played a role, given the variation in the greater auricular nerve.10,11 However, Brennan and colleagues10 reported that 2 of 25 neck dissections involved a variant in which the anterior division of the greater auricular nerve passed into the submandibular triangle and joined the mandibular region of the facial nerve. Stimulation of this nerve resulted in activity of the depressor of the lower lip, which was not the location of our patient’s palsy. In addition, our patient’s symptoms followed a classic nerve distribution of the greater auricular nerve (Figures 1, 4), which would seem to decrease the likelihood that a variant was the source of the palsy.
The superficial nature of the greater auricular nerve, which runs roughly parallel with the sternocleidomastoid muscle and innervates much of the superficial region of the skin over the mastoid, parotid gland, and mandible,5-7 theoretically places the nerve at risk for compressive forces from the headrest during arthroscopic shoulder surgery. Skyhar and colleagues3 first described beach-chair positioning as an alternative to lateral decubitus positioning, which had been reported to result in neurologic injury in about 10% of surgical cases.9 The theoretical advantages of beach-chair positioning are lack of traction needed and ease of setup, which would therefore decrease the possibility of neuropathy.1,3 However, as seen in this and other case reports,7,8 greater auricular nerve neuropathy should still be considered a possible complication, even when using beach-chair positioning.
Besides neuropathy after arthroscopic shoulder surgery, as described in previous case reports7,8 and in the present report, greater auricular nerve injury has been described as arising from other stimuli. Greater auricular nerve injury has arisen after perineural tumor metastasis,6 neuroma of greater auricular nerve after endolympathic shunt surgery,12 internal fixation of mandibular condyle,13 and carotid endarterectomy.14,15 Given the superficial nature of the greater auricular nerve, it may not be all that surprising that a palsy could also develop after headrest compression during arthroscopic shoulder surgery.
This case report brings to light a possible complication of greater auricular nerve palsy during arthroscopic shoulder surgery using beach-chair positioning and a standard universal headrest. Studies should now investigate whether greater auricular nerve palsy is more common than realized, especially with regard to specific headrests in beach-chair positioning. For now, though, Dr. Foad’s intention is not to change to a different headrest or discontinue beach-chair positioning but to draw attention to this rare complication. Additional attention should be given to the location of the headrest in relation to the greater auricular nerve, especially in cases in which operative time may be longer.
Conclusion
We have reported a greater auricular nerve palsy that occurred after arthroscopic shoulder surgery for an anterior-inferior and posterior-inferior labral tear. This is the first report of a greater auricular nerve palsy occurring with beach-chair positioning and a standard universal headrest. Symptoms resolved within 6 months. New studies should investigate the incidence of greater auricular nerve palsy after arthroscopic shoulder surgery.
1. Paxton ES, Backus J, Keener J, Brophy RH. Shoulder arthroscopy: basic principles of positioning, anesthesia, and portal anatomy. J Am Acad Orthop Surg. 2013;21(6):332-342.
2. Scully WF, Wilson DJ, Parada SA, Arrington ED. Iatrogenic nerve injuries in shoulder surgery. J Am Acad Orthop Surg. 2013;21(12):717-726.
3. Skyhar MJ, Altchek DW, Warren RF, Wickiewicz TL, O’Brien SJ. Shoulder arthroscopy with the patient in the beach-chair position. Arthroscopy. 1988;4(4):256-259.
4. Zhang J, Moore AE, Stringer MD. Iatrogenic upper limb nerve injuries: a systematic review. ANZ J Surg. 2011;81(4):227-236.
5. Alberti PW. The greater auricular nerve. Donor for facial nerve grafts: a note on its topographical anatomy. Arch Otolaryngol. 1962;76:422-424.
6. Ginsberg LE, Eicher SA. Great auricular nerve: anatomy and imaging in a case of perineural tumor spread. AJNR Am J Neuroradiol. 2000;21(3):568-571.
7. Ng AK, Page RS. Greater auricular nerve neuropraxia with beach chair positioning during shoulder surgery. Int J Shoulder Surg. 2010;4(2):48-50.
8. Park TS, Kim YS. Neuropraxia of the cutaneous nerve of the cervical plexus after shoulder arthroscopy. Arthroscopy. 2005;21(5):631.e1-e3.
9. Rains DD, Rooke GA, Wahl CJ. Pathomechanisms and complications related to patient positioning and anesthesia during shoulder arthroscopy. Arthroscopy. 2011;27(4):532-541.
10. Brennan PA, Al Gholmy M, Ounnas H, Zaki GA, Puxeddu R, Standring S. Communication of the anterior branch of the great auricular nerve with the marginal mandibular nerve: a prospective study of 25 neck dissections. Br J Oral Maxillofac Surg. 2010;48(6):431-433.
11. Sand T, Becser N. Neurophysiological and anatomical variability of the greater auricular nerve. Acta Neurol Scand. 1998;98(5):333-339.
12. Vorobeichik L, Fallucco MA, Hagan RR. Chronic daily headaches secondary to greater auricular and lesser occipital neuromas following endolymphatic shunt surgery. BMJ Case Rep. 2012;2012. pii: bcr-2012-007189. doi:10.1136/bcr-2012-007189.
13. Sverzut CE, Trivellato AE, Serra EC, Ferraz EP, Sverzut AT. Frey’s syndrome after condylar fracture: case report. Braz Dent J. 2004;15(2):159-162.
14. AbuRahma AF, Choueiri MA. Cranial and cervical nerve injuries after repeat carotid endarterectomy. J Vasc Surg. 2000;32(4):649-654.
15. Ballotta E, Da Giau G, Renon L, et al. Cranial and cervical nerve injuries after carotid endarterectomy: a prospective study. Surgery. 1999;125(1):85-91.
Anterior-inferior and posterior-inferior labral tears are common injuries treated with arthroscopic surgery1 typically performed with beach-chair2,3 or lateral decubitus1,2 positioning and variable headrest positioning. Iatrogenic nerve damage that occurs after arthroscopic shoulder surgery—including damage to the suprascapular, axillary, musculocutaneous, subscapular, and spinal accessory nerves—has recently been reported to be more common than previously recognized.2,4
Although iatrogenic nerve injuries are in general being recognized,1,2,4 reports of greater auricular nerve injuries are limited. The greater auricular nerve is a superficial cutaneous nerve that arises from the cervical plexus at the C2 and C3 spinal nerves, obliquely crosses the sternocleidomastoid muscle, and splits into anterior and posterior portions that innervate the skin over the mastoid process and parotid gland.5,6 In particular, as illustrated by Ginsberg and Eicher6 (Figure 1), its superficial anatomy lies very near where a headrest is positioned during arthroscopic surgery, and increased pressure on the nerve throughout arthroscopic shoulder surgery may lead to neurapraxia.6,7 In 2 case series, authors reported on a total of 5 patients who had greater auricular nerve palsy after uncomplicated shoulder surgery using beach-chair positioning and a horseshoe headrest.7,8 The authors attributed these palsies to the horseshoe headrest, which they believed was compressing the greater auricular nerve during the entire surgery.7,8 However, standard universal headrests, which are thought to distribute pressures that would theoretically place the greater auricular nerve at risk for palsy, previously had not been described as contributing to palsy of the greater auricular nerve.
In this article, we report on a case of greater auricular nerve palsy that occurred after the patient’s anterior-inferior and posterior-inferior labral tear was arthroscopically repaired using beach-chair positioning and a standard universal headrest. The patient provided written informed consent for print and electronic publication of this case report.
Case Report
An 18-year-old right-hand–dominant high school American football player was referred for orthopedic evaluation of left chronic glenohumeral instability after 6 months of physical therapy. Physical examination revealed a positive apprehension test with the shoulder abducted and externally rotated at 90° and a positive relocation test. The patient complained of pain and instability when his arm was placed in a cross-chest adducted position and a posteroinferiorly directed axial load was applied. Magnetic resonance arthrogram showed an anterior-inferior labral Bankart tear with a small Hill-Sachs lesion to the humeral head but did not clearly reveal the posterior-inferior labral tear. Because of persistent left shoulder instability with most overhead activities and continued pain, the patient decided to undergo left shoulder arthroscopic Bankart repair with inferior capsular shift and posterior-inferior labral repair with capsulorraphy. He had no significant past medical history or known drug allergies.
The patient was placed in the standard beach-chair position: upright at 45° to the floor, hips flexed at 60°, knees flexed at 30°.1 Pneumatic compression devices were placed on his lower extremities. His head was secured in neutral position to a standard universal headrest (model A-90026; Allen Medical Systems, Acton, Massachusetts) (Figures 2, 3). Care was taken to protect the deep neurovascular structures and bony prominences throughout. The patient was in this position for 122 minutes of the operation, from positioning and draping to wound closure and dressing application. Before draping, the anesthesiologist, head nurse, and circulating nurse ensured that head and neck were in neutral position. The anesthesiologist monitored positioning throughout the perioperative period to ensure head and neck were in neutral, and the head did not need to be repositioned during surgery. Standard preoperative intravenous antibiotics were given.
General anesthesia and postoperative interscalene block were used. Standard preparation and draping were performed. Three standard arthroscopic portal incisions were used: posterior, anterior, and anterosuperolateral. Findings included extensive labral pathology, small bony Hill-Sachs lesion to humeral head, small bony anterior glenoid deficiency, and deficient anterior-inferior and posterior-inferior labral remnant. These were repaired arthroscopically in a standard fashion using bioabsorbable suture anchors. There were no arthroscopic complications. After surgery, a standard well-fitted shoulder immobilizer was placed. The anesthesiologist provided interscalene regional analgesia (15 mL of bupivacaine 0.5%) in the recovery area after surgery.
Postoperative neurovascular examination in the recovery room revealed no discomfort. The patient was discharged the same day. At a scheduled 1-week follow-up, he complained of numbness and dysesthesia on the left side of the greater auricular nerve distribution. A diagnosis of greater auricular nerve palsy was made by physical examination; the symptoms were along the classic greater auricular nerve distribution affecting the lower face and ear (Figure 4). The patient had no pain, skin lesions, or soft-tissue swelling. Otolaryngology confirmed the diagnosis and recommended observation-only treatment of symptoms. Symptoms lessened over the next 3 months, and the altered sensation resolved without deficit by 6 months. In addition, by 6 months the patient had returned to full activities (including collision sports) pain-free and with normal left shoulder function. Because symptoms continued to improve, the patient was followed with clinical observation, and a formal work-up was not necessary.
Discussion
The most important finding in this case is the greater auricular nerve palsy that occurred after arthroscopic anterior-inferior and posterior-inferior labral repairs in beach-chair positioning. This greater auricular nerve palsy was the first encountered by Dr. Foad, who over 17 years in a primarily shoulder practice setting has used beach-chair positioning exclusively. Previous reports have described a palsy occurring after arthroscopic shoulder surgery using beach-chair positioning and a horseshoe headrest.7,8 Ng and Page7 discontinued and recommended against use of this headrest because of the complications of the palsy, and Park and Kim8 recommended a headrest redesign. We think the present case report is the first to describe a greater auricular nerve palsy that occurred after arthroscopic surgery using a standard universal headrest, which theoretically should prevent compression of the greater auricular nerve. Increased awareness of the possibility of greater auricular nerve palsy, even when proper precautions are taken,1 is therefore warranted.
Based on the location of our patient’s palsy, we think his paralysis was most likely the result of nerve compression by the headrest during the shoulder surgery. Other factors, though unlikely, may have played a role. These include operative time (increases duration of nerve compression) and head positioning. However, 122 minutes is not unusually long for a patient’s head to be in this position during a procedure, and over the past 10 years the same anesthesiologist, head nurse, and circulating nurse have routinely used the same beach-chair positioning and headrest for Dr. Foad’s patients. Second, the postoperative interscalene block theoretically could have caused the palsy, but we think this is unlikely, as the block is placed lower on the neck, at the C6 level, and the greater auricular nerve branches off the C2–C3 spinal nerves. As described by Rains and colleagues,9 other authors have reported transient neuropathies to the brachial plexus, which originates in the C5–C8 region, but not to the greater auricular nerve. Last, it cannot be ruled out that a variant of the greater auricular nerve could have played a role, given the variation in the greater auricular nerve.10,11 However, Brennan and colleagues10 reported that 2 of 25 neck dissections involved a variant in which the anterior division of the greater auricular nerve passed into the submandibular triangle and joined the mandibular region of the facial nerve. Stimulation of this nerve resulted in activity of the depressor of the lower lip, which was not the location of our patient’s palsy. In addition, our patient’s symptoms followed a classic nerve distribution of the greater auricular nerve (Figures 1, 4), which would seem to decrease the likelihood that a variant was the source of the palsy.
The superficial nature of the greater auricular nerve, which runs roughly parallel with the sternocleidomastoid muscle and innervates much of the superficial region of the skin over the mastoid, parotid gland, and mandible,5-7 theoretically places the nerve at risk for compressive forces from the headrest during arthroscopic shoulder surgery. Skyhar and colleagues3 first described beach-chair positioning as an alternative to lateral decubitus positioning, which had been reported to result in neurologic injury in about 10% of surgical cases.9 The theoretical advantages of beach-chair positioning are lack of traction needed and ease of setup, which would therefore decrease the possibility of neuropathy.1,3 However, as seen in this and other case reports,7,8 greater auricular nerve neuropathy should still be considered a possible complication, even when using beach-chair positioning.
Besides neuropathy after arthroscopic shoulder surgery, as described in previous case reports7,8 and in the present report, greater auricular nerve injury has been described as arising from other stimuli. Greater auricular nerve injury has arisen after perineural tumor metastasis,6 neuroma of greater auricular nerve after endolympathic shunt surgery,12 internal fixation of mandibular condyle,13 and carotid endarterectomy.14,15 Given the superficial nature of the greater auricular nerve, it may not be all that surprising that a palsy could also develop after headrest compression during arthroscopic shoulder surgery.
This case report brings to light a possible complication of greater auricular nerve palsy during arthroscopic shoulder surgery using beach-chair positioning and a standard universal headrest. Studies should now investigate whether greater auricular nerve palsy is more common than realized, especially with regard to specific headrests in beach-chair positioning. For now, though, Dr. Foad’s intention is not to change to a different headrest or discontinue beach-chair positioning but to draw attention to this rare complication. Additional attention should be given to the location of the headrest in relation to the greater auricular nerve, especially in cases in which operative time may be longer.
Conclusion
We have reported a greater auricular nerve palsy that occurred after arthroscopic shoulder surgery for an anterior-inferior and posterior-inferior labral tear. This is the first report of a greater auricular nerve palsy occurring with beach-chair positioning and a standard universal headrest. Symptoms resolved within 6 months. New studies should investigate the incidence of greater auricular nerve palsy after arthroscopic shoulder surgery.
1. Paxton ES, Backus J, Keener J, Brophy RH. Shoulder arthroscopy: basic principles of positioning, anesthesia, and portal anatomy. J Am Acad Orthop Surg. 2013;21(6):332-342.
2. Scully WF, Wilson DJ, Parada SA, Arrington ED. Iatrogenic nerve injuries in shoulder surgery. J Am Acad Orthop Surg. 2013;21(12):717-726.
3. Skyhar MJ, Altchek DW, Warren RF, Wickiewicz TL, O’Brien SJ. Shoulder arthroscopy with the patient in the beach-chair position. Arthroscopy. 1988;4(4):256-259.
4. Zhang J, Moore AE, Stringer MD. Iatrogenic upper limb nerve injuries: a systematic review. ANZ J Surg. 2011;81(4):227-236.
5. Alberti PW. The greater auricular nerve. Donor for facial nerve grafts: a note on its topographical anatomy. Arch Otolaryngol. 1962;76:422-424.
6. Ginsberg LE, Eicher SA. Great auricular nerve: anatomy and imaging in a case of perineural tumor spread. AJNR Am J Neuroradiol. 2000;21(3):568-571.
7. Ng AK, Page RS. Greater auricular nerve neuropraxia with beach chair positioning during shoulder surgery. Int J Shoulder Surg. 2010;4(2):48-50.
8. Park TS, Kim YS. Neuropraxia of the cutaneous nerve of the cervical plexus after shoulder arthroscopy. Arthroscopy. 2005;21(5):631.e1-e3.
9. Rains DD, Rooke GA, Wahl CJ. Pathomechanisms and complications related to patient positioning and anesthesia during shoulder arthroscopy. Arthroscopy. 2011;27(4):532-541.
10. Brennan PA, Al Gholmy M, Ounnas H, Zaki GA, Puxeddu R, Standring S. Communication of the anterior branch of the great auricular nerve with the marginal mandibular nerve: a prospective study of 25 neck dissections. Br J Oral Maxillofac Surg. 2010;48(6):431-433.
11. Sand T, Becser N. Neurophysiological and anatomical variability of the greater auricular nerve. Acta Neurol Scand. 1998;98(5):333-339.
12. Vorobeichik L, Fallucco MA, Hagan RR. Chronic daily headaches secondary to greater auricular and lesser occipital neuromas following endolymphatic shunt surgery. BMJ Case Rep. 2012;2012. pii: bcr-2012-007189. doi:10.1136/bcr-2012-007189.
13. Sverzut CE, Trivellato AE, Serra EC, Ferraz EP, Sverzut AT. Frey’s syndrome after condylar fracture: case report. Braz Dent J. 2004;15(2):159-162.
14. AbuRahma AF, Choueiri MA. Cranial and cervical nerve injuries after repeat carotid endarterectomy. J Vasc Surg. 2000;32(4):649-654.
15. Ballotta E, Da Giau G, Renon L, et al. Cranial and cervical nerve injuries after carotid endarterectomy: a prospective study. Surgery. 1999;125(1):85-91.
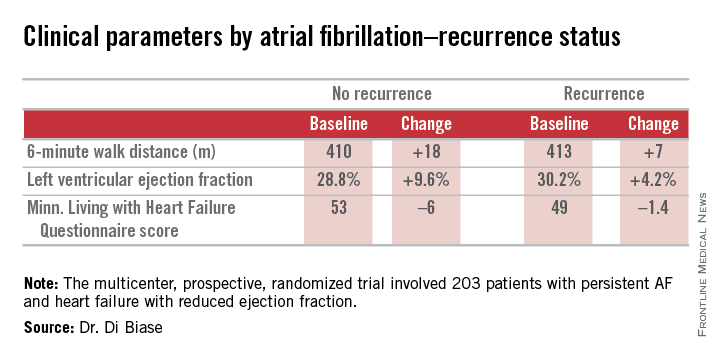
Private-academic surgeon salary gap raises concerns Lifestyle choice important Not just the money
LAKE BUENA VISTA, FLA. – Academic surgeons earn an average of 10% or $1.3 million less in gross income across their lifetime than surgeons in private practice, an analysis shows.
Some surgical specialties fare better than others, with academic neurosurgeons having the largest reduction in gross income at $4.2 million (–24.2%), while academic pediatric surgeons earn $238,376 more (1.53%) than their private practice counterparts. They were the only ones to do so.
Several academic surgical specialties did not make the 10% average, including trauma surgeons whose lifetime earnings were down 12% or $2.4 million, vascular surgeons at 13.8% or $1.7 million, and surgical oncologists at 12.2% or $1.3 million.

“The concern that we have is that the academic surgeons are where the education of the future lies,” lead study author Dr. Joseph Martin Lopez said at the annual scientific assembly of the Eastern Association for the Surgery of Trauma (EAST).
Every year a new class of surgeons is faced with the question of academic practice or private practice, but they are also struggling with increasing student loan debt and longer training as more surgical residents elect to enter fellowship rather than general practice.
This growing financial liability coupled with declining physician reimbursement could rapidly shift physician practices and thus threaten the fiscal viability of certain surgical fields or academic surgical careers.
“The more financially irresponsible you make it to become an academic surgeon, the more we put at risk our current mode of training,” Dr. Lopez of Wake Forest University in Winston-Salem, N.C., said.
To account for additional factors outside gross income, the investigators ran the numbers using a second analysis, a net present value calculation, however, and came up with roughly the same salary gap to contend with.
Net present value (NPV) calculations are commonly used in business to calculate the profitability of an investment and also have been used in the medical field to gauge return on investment for various careers. The NPV calculation accounts for positive and negative cash flows over the entire length of a career, using in this case, a 5% discount rate and adjusting for inflation, Dr. Lopez explained.
Both the lifetime gross income and 5% NPV calculation used data from the Medical Group Management Association’s 2012 physician salary report, the 2012 Association of American Medical Colleges physician salary report, and the AAMC database for residency and fellow salary.
The NPV assumed a career length of 37-39 years, based on a retirement age of 65 years for all specialties. Positive cash flows included annual salary less federal income tax. Negative cash flows included the average principal for student loans, according to the AAMC, and interest at 5%, the average for the three largest student loan lenders in 2014, he said. Student loan repayment was calculated for a fixed-rate loan to be paid over 25 years beginning after residency or any required fellowship.
The average reduction in 5% NPV across surgical specialties for an academic surgeon versus a privately employed surgeon was 12.8% or $246,499, Dr. Lopez said.
Once again, academic neurosurgeons had the largest reduction in 5% NPV at 25.5% or a loss of $619,681, followed closely by trauma surgeons (23% or $381,179) and surgical oncologists (16.3% or $256,373). Academic pediatric surgeons had the smallest reduction in 5% NPV at 4.2% or $88,827.
During a discussion of the provocative poster, attendees questioned whether it was fair to say that private surgeons make more money without acknowledging the risk they face, compared with surgeons employed in an academic setting.
Dr. Lopez countered that, increasingly, even private surgeons are no longer truly private surgeons.
“More and more surgical groups are being bought up by hospitals, and even the private surgical groups are being bought up by hospitals, which does stabilize your income to some extent,” he said.
“We all still have [relative value unit] goals to meet and RVU incentives that make it so you can get paid a little more, but it’s something that’s a consideration. It is a risk-reward to be a private surgeon. Depending on how your contract is structured or how your group decides to pay the partners, it may be that if you don’t take very much call or take that many cases, you’ll end up on the short end of the stick.”
Dr. Ben L. Zarzaur, a general surgeon at Indiana University in Indianapolis who comoderated the poster discussion, pointed out that market pressures unaccounted for in the model can dramatically influence a surgeon’s salary over a lifetime.
Dr. Lopez agreed, citing how the increasing number of stent placements by cardiologists, for example, has impacted the bottom line of cardiothoracic surgeons. The NPV calculation was specifically used, however, because it gets at market forces such as inflation and return on investment, not addressed by gross income figures alone.
Finally, Dr. Zarzaur turned and asked the relatively young crowd what they would do if offered $600,000 a year, but had to work 110 hours a week or could get $250,000 and work only 40 hours a week.
Most responded that they’d choose the former to repay their student loans and then switch to the lower-paying position.
Responders made much of job satisfaction, work-life balance, and the ability of surgeons in academic practice to take time away from clinical work to conduct research, their ready access to continuing medical education, and their ability to educate the next generation of surgeons.
“Any time we see this academic-private disparity, you have to think about these secondary gains,” Dr. Zarzaur said.
“This is really interesting work. It gets into why we choose what we do, why we’d take $600,000, work 110 hours a week, and get our rear ends kicked. The flip side is, if I saw this, why would you ever go into academics? But people still choose to do it. I’m in academics so there’s a bias, but we choose to do it anyway up to a point. I don’t know where that point is, but up to a point we do.”
Not just the money
|
| Dr. Laura Drudi |
In the United States, academic vascular surgeons earn 13.8% or $1.7 million less than private vascular surgeons. This financial incentive may influence graduating residents and fellows to enter into private practice. This article indicates that this financial disparity may cost academic institutions the expertise needed to train future physicians. Unfortunately, I believe this analysis falls into one of the many myths between academic and private practice; that is, it’s not only about making the most money possible.
The ongoing debate of academic versus private practice shouldn’t really be a debate at all. It is all about personal choices concerning research, education, work-life balance, and finances to name a few. In the end, anyone can shape the ideal practice they want to have. There are many private practices that are involved in resident education, publish extensively and present at national and international meetings. No job is weaved perfectly, but there will usually be a job that fits an individual’s specific goals and desires.
Dr. Laura Drudi is the resident medical editor for Vascular Specialist.
Lifestyle choice important
The basic finding of the disparity is in fact true leaving aside the flawed methodology of too many assumptions by including all academic ranks, practitioners of different durations in practice, difference in benefits, tuition assistance, and assuming student loans for all surgeons plus a risk free rate that is too high.
Our analysis of both vascular and general surgeon compensation points to a larger disparity at junior academic ranks over the last decade. With our own studies showing a shortage of vascular surgeons, retention of practitioners is paramount for all health systems. Academic centers rely on faculty giving up a percentage of their compensation for the pleasure of teaching, research and intellectual stimulation. The unanswered question is: How much of a disparity will junior academic surgeons tolerate, and how do they value lifestyle against additional compensation? Time will tell.
Dr. Bhagwan Satiani is a professor of vascular surgery at the Wexner Medical Center, Ohio State University.
Not just the money
|
|
| Dr. Laura Drudi |
In the United States, academic vascular surgeons earn 13.8% or $1.7 million less than private vascular surgeons. This financial incentive may influence graduating residents and fellows to enter into private practice. This article indicates that this financial disparity may cost academic institutions the expertise needed to train future physicians. Unfortunately, I believe this analysis falls into one of the many myths between academic and private practice; that is, it’s not only about making the most money possible.
The ongoing debate of academic versus private practice shouldn’t really be a debate at all. It is all about personal choices concerning research, education, work-life balance, and finances to name a few. In the end, anyone can shape the ideal practice they want to have. There are many private practices that are involved in resident education, publish extensively and present at national and international meetings. No job is weaved perfectly, but there will usually be a job that fits an individual’s specific goals and desires.
Dr. Laura Drudi is the resident medical editor for Vascular Specialist.
Lifestyle choice important
The basic finding of the disparity is in fact true leaving aside the flawed methodology of too many assumptions by including all academic ranks, practitioners of different durations in practice, difference in benefits, tuition assistance, and assuming student loans for all surgeons plus a risk free rate that is too high.
Our analysis of both vascular and general surgeon compensation points to a larger disparity at junior academic ranks over the last decade. With our own studies showing a shortage of vascular surgeons, retention of practitioners is paramount for all health systems. Academic centers rely on faculty giving up a percentage of their compensation for the pleasure of teaching, research and intellectual stimulation. The unanswered question is: How much of a disparity will junior academic surgeons tolerate, and how do they value lifestyle against additional compensation? Time will tell.
Dr. Bhagwan Satiani is a professor of vascular surgery at the Wexner Medical Center, Ohio State University.
LAKE BUENA VISTA, FLA. – Academic surgeons earn an average of 10% or $1.3 million less in gross income across their lifetime than surgeons in private practice, an analysis shows.
Some surgical specialties fare better than others, with academic neurosurgeons having the largest reduction in gross income at $4.2 million (–24.2%), while academic pediatric surgeons earn $238,376 more (1.53%) than their private practice counterparts. They were the only ones to do so.
Several academic surgical specialties did not make the 10% average, including trauma surgeons whose lifetime earnings were down 12% or $2.4 million, vascular surgeons at 13.8% or $1.7 million, and surgical oncologists at 12.2% or $1.3 million.
“The concern that we have is that the academic surgeons are where the education of the future lies,” lead study author Dr. Joseph Martin Lopez said at the annual scientific assembly of the Eastern Association for the Surgery of Trauma (EAST).
Every year a new class of surgeons is faced with the question of academic practice or private practice, but they are also struggling with increasing student loan debt and longer training as more surgical residents elect to enter fellowship rather than general practice.
This growing financial liability coupled with declining physician reimbursement could rapidly shift physician practices and thus threaten the fiscal viability of certain surgical fields or academic surgical careers.
“The more financially irresponsible you make it to become an academic surgeon, the more we put at risk our current mode of training,” Dr. Lopez of Wake Forest University in Winston-Salem, N.C., said.
To account for additional factors outside gross income, the investigators ran the numbers using a second analysis, a net present value calculation, however, and came up with roughly the same salary gap to contend with.
Net present value (NPV) calculations are commonly used in business to calculate the profitability of an investment and also have been used in the medical field to gauge return on investment for various careers. The NPV calculation accounts for positive and negative cash flows over the entire length of a career, using in this case, a 5% discount rate and adjusting for inflation, Dr. Lopez explained.
Both the lifetime gross income and 5% NPV calculation used data from the Medical Group Management Association’s 2012 physician salary report, the 2012 Association of American Medical Colleges physician salary report, and the AAMC database for residency and fellow salary.
The NPV assumed a career length of 37-39 years, based on a retirement age of 65 years for all specialties. Positive cash flows included annual salary less federal income tax. Negative cash flows included the average principal for student loans, according to the AAMC, and interest at 5%, the average for the three largest student loan lenders in 2014, he said. Student loan repayment was calculated for a fixed-rate loan to be paid over 25 years beginning after residency or any required fellowship.
The average reduction in 5% NPV across surgical specialties for an academic surgeon versus a privately employed surgeon was 12.8% or $246,499, Dr. Lopez said.
Once again, academic neurosurgeons had the largest reduction in 5% NPV at 25.5% or a loss of $619,681, followed closely by trauma surgeons (23% or $381,179) and surgical oncologists (16.3% or $256,373). Academic pediatric surgeons had the smallest reduction in 5% NPV at 4.2% or $88,827.
During a discussion of the provocative poster, attendees questioned whether it was fair to say that private surgeons make more money without acknowledging the risk they face, compared with surgeons employed in an academic setting.
Dr. Lopez countered that, increasingly, even private surgeons are no longer truly private surgeons.
“More and more surgical groups are being bought up by hospitals, and even the private surgical groups are being bought up by hospitals, which does stabilize your income to some extent,” he said.
“We all still have [relative value unit] goals to meet and RVU incentives that make it so you can get paid a little more, but it’s something that’s a consideration. It is a risk-reward to be a private surgeon. Depending on how your contract is structured or how your group decides to pay the partners, it may be that if you don’t take very much call or take that many cases, you’ll end up on the short end of the stick.”
Dr. Ben L. Zarzaur, a general surgeon at Indiana University in Indianapolis who comoderated the poster discussion, pointed out that market pressures unaccounted for in the model can dramatically influence a surgeon’s salary over a lifetime.
Dr. Lopez agreed, citing how the increasing number of stent placements by cardiologists, for example, has impacted the bottom line of cardiothoracic surgeons. The NPV calculation was specifically used, however, because it gets at market forces such as inflation and return on investment, not addressed by gross income figures alone.
Finally, Dr. Zarzaur turned and asked the relatively young crowd what they would do if offered $600,000 a year, but had to work 110 hours a week or could get $250,000 and work only 40 hours a week.
Most responded that they’d choose the former to repay their student loans and then switch to the lower-paying position.
Responders made much of job satisfaction, work-life balance, and the ability of surgeons in academic practice to take time away from clinical work to conduct research, their ready access to continuing medical education, and their ability to educate the next generation of surgeons.
“Any time we see this academic-private disparity, you have to think about these secondary gains,” Dr. Zarzaur said.
“This is really interesting work. It gets into why we choose what we do, why we’d take $600,000, work 110 hours a week, and get our rear ends kicked. The flip side is, if I saw this, why would you ever go into academics? But people still choose to do it. I’m in academics so there’s a bias, but we choose to do it anyway up to a point. I don’t know where that point is, but up to a point we do.”
In Vitro and In Situ Characterization of Arthroscopic Loop Security and Knot Security of Braided Polyblend Sutures: A Biomechanical Study
Open-surgery knot tying is easily learned and performed, but knot tying during arthroscopic procedures can be both challenging and frustrating. According to Burkhart and colleagues,1,2 knot security is defined as the effectiveness of the knot in resisting slippage when load is applied, whereas loop security is the effectiveness in maintaining a tight suture loop while a knot is being tied. Arthroscopic knots commonly begin with an initial slipknot locked in place with a series of half-hitches. During arthroscopic surgery, the surgeon usually must tie an arthroscopic knot to obtain secure tissue fixation, an essential component of soft-tissue repair. A secure knot provides optimal tissue apposition for healing, which will ultimately improve functional outcome. For a knot to be effective, it must have both knot security and loop security. Knot security depends on knot configuration, the coefficient of friction, ductility, handling properties, solubility and diameter of suture material, internal interference, slack between throws, and surgeon experience. Tissue fluid and tissue reaction to suture material may affect knot and loop security.
The ideal knot would be easy to tie and reproducible and would not slip or stretch before tissue is healed. The ideal suture material should provide adequate strength to hold soft tissue in an anatomically correct position until healing can occur. It should also be easily and efficiently manipulated by arthroscopic means when tissues are being secured with knots and secure suture loops. Studies have been conducted to evaluate the security of knots tied with arthroscopic techniques, knot configurations, and suture materials, and these investigations have often evaluated knot performance under single load-to-failure (LTF) test scenarios and cyclic loading in vitro (dry environment) in a room-temperature environment.2-10 To our knowledge, few if any attempts have been made to simulate in situ conditions at body temperature when testing knot security. The fluid environment and the temperature could potentially affect the effectiveness of knots, as knot security depends on friction, internal interference, and slack between throws.1
We conducted a study to evaluate biomechanical performance (knot security, loop security) during destructive testing of several different suture materials with various arthroscopic knot configurations. The study was performed under in vitro (dry environment) and in situ (wet environment) conditions by surgeons with different levels of experience.
Materials and Methods
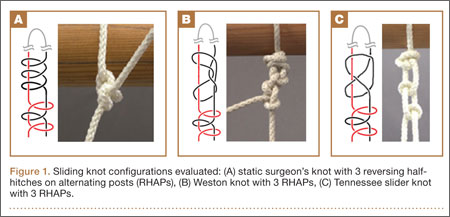
This investigation was conducted at the Orthopaedic Research Institute at Via Christi Health in Wichita, Kansas. The study compared 4 different suture materials tied with 3 different commonly used arthroscopic knots by 3 surgeons with different levels of experience. The 4 types of braided polyblend polyethylene sutures were Fiberwire (Arthrex, Naples, Florida), ForceFiber (Stryker, San Jose, California), Orthocord (DePuy-Mitek, Warsaw, Indiana), and Ultrabraid (Smith & Nephew, Memphis, Tennessee). Each suture material was tied with 3 arthroscopic knots—static surgeon’s knot, Weston knot,11 Tennessee slider12—and a series of 3 reversing half-hitches on alternating posts (RHAPs) (Figure 1). These knots were chosen based on studies showing they have a higher maximum force to failure when combined with 3 RHAPs.1,2,5,9,13-17
We evaluated performer variability with the help of 3 investigator-surgeons who differed in their level of experience tying arthroscopic knots. This experience was defined on the basis of total number of arthroscopies performed—one of the most important factors predicting basic arthroscopic skills. Our surgeon A was a sports medicine fellowship–trained surgeon with 10 years of experience and a significant number of arthroscopies performed annually (350); surgeon B was a sports medicine fellowship–trained surgeon with 3 years of experience and an annual arthroscopy volume of more than 250 procedures; and surgeon C was a third-year orthopedic resident with about 100 arthroscopies performed.
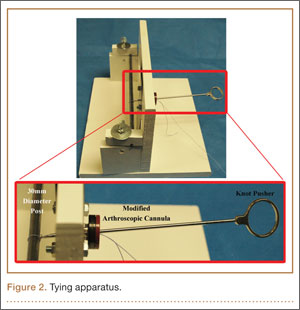
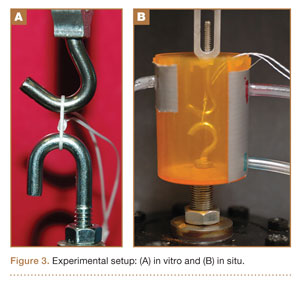
All knots were tied on a standardized post 30 mm in circumference, which provided a consistent starting circumference for each knot and replicated the suture loop created during arthroscopic rotator cuff repair. All knots were tied using standard arthroscopic techniques, with a standard knot pusher and a modified arthroscopic cannula, in a dry environment (Figure 2). Servohydraulic materials testing system instruments (model 810; MTS Systems, Eden Prairie, Minnesota) were used to test the knot security and loop security of each combination of knots and suture types. Two round hooks (diameter, 3.9 mm) were attached to the actuator and the load cell (Figure 3). Loops were preloaded to 6 N to avoid potential errors caused by slack in the loops or by stretching of suture materials and to provide a well-defined starting point for data recording.
LTF testing was performed for both in vitro and in situ conditions using 10 samples of each suture–knot configuration for each mechanical testing. Each type of testing was conducted for a total of 240 suture–knot combinations per investigator. For the in vitro condition, each suture loop was initiated with 5 preconditioning loading cycles, from 6 N to 30 N at 1 Hz. The load was then applied continuously at a crosshead speed of 1 mm/s until “clinical failure” (3 mm crosshead displacement). We used this criterion for clinical failure, as studies have indicated that 3 mm is the point at which tissue apposition is lost.15,18-21 After the crosshead reached the 3-mm displacement, the loads (under load control) were held for 5 minutes at maximum load, and then load was applied continuously at a crosshead speed of 1 mm/s until complete structure failure. Load and displacement data were collected at a frequency of 20 Hz.
For the in situ condition, the same test parameters were used, except that each combination of the suture loop was preloaded to 6 N and soaked in physiologic solution bath (human blood plasma) at 37°C (body temperature) for 24 hours before testing in an effort to simulate the aqueous medium in vivo after surgery. The in situ tests were performed under physiologic solution maintained at 37°C to approximate postoperative physical conditions.
Statistical Analysis
Means and standard deviations of the knot security and loop security achieved by the surgeons (different experience levels) were calculated for each test configuration and each test condition. These values were used to determine the statistical relevance of the difference in arthroscopic loop security and knot security in each configuration. One-way analysis of variance (ANOVA) performed with SPSS Version 19.0 software (SPSS, Chicago, Illinois) with the least significant difference (LSD) multiple comparisons post hoc analysis was used to determine if any observed differences between the types of braided polyblend sutures, the types of sliding knots, the test conditions (in vitro, in situ), and the levels of surgeon experience were significant for each knot configuration. The level of significance of differences was set at P < .001.
Results
Figure 4 shows the mean maximum clinical failure load (3 mm of displacement) of different arthroscopic knot configurations for different braided polyblend sutures by surgeons of different levels of experience. In the comparison of biomechanical performance (knot and loop security) under in vitro and in situ conditions, no significant difference was detected when Ultrabraid suture material was used, regardless of surgeon experience, for all knot configurations. For surgeon B, there was no significant difference between in vitro and in situ conditions for any knot configurations or suture materials. When Orthocord suture material was used, Weston knots tied by surgeon A, and static surgeon’s knots by surgeons A and C, resulted in a significant difference between the in vitro and in situ conditions. When ForceFiber suture material was used, only Weston knots and Tennessee slider knots by surgeon A had a significant difference between in vitro and in situ conditions. Weston knots by surgeon A exhibited a significant difference between in vitro and in situ conditions, except when Ultrabraid suture material was used.
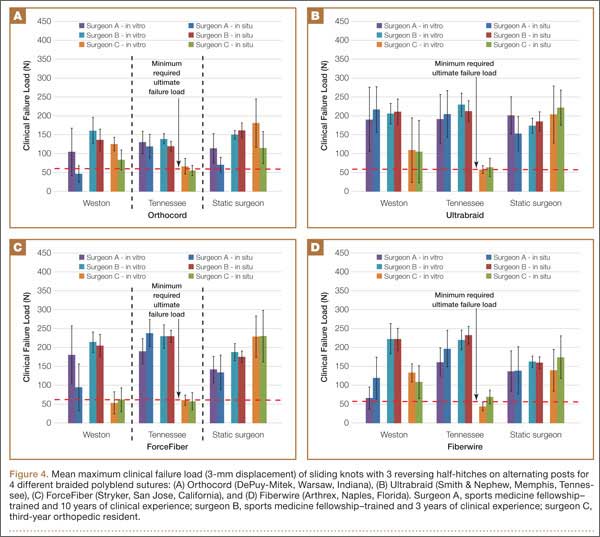
Surgeon C’s Tennessee slider knots with all polyblend sutures showed significantly lower loads at clinical failure compared with all the other knot configurations and with knots tied by the other 2 surgeons under both in vitro and in situ conditions. Overall, knots tied by surgeon B had higher clinical failure load than knots tied by the other 2 surgeons.
Figure 5 shows the mean ultimate failure load (complete structural failure) of different arthroscopic knot configurations for different braided polyblend sutures by surgeons of different levels of experience. Knots tied with Orthocord suture material had the overall lower ultimate failure load compared with other suture materials, whereas knots tied with Ultrabraid suture material had the overall highest ultimate failure load. However, the ultimate failure loads for all the knots tied using any suture material, regardless of surgeon experience, were more than 61 N, which is the estimated minimum required ultimate load per suture during a maximum muscle contraction.1
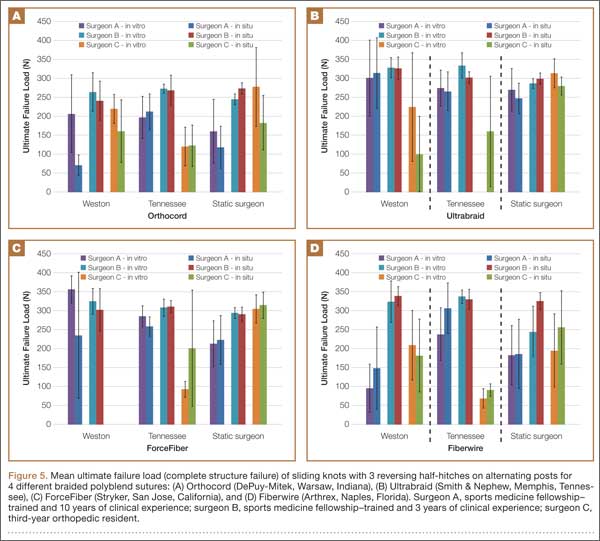
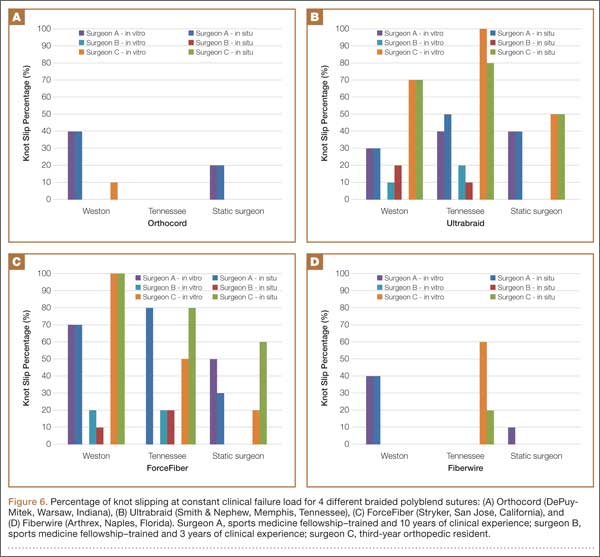
Figure 6 shows the percentage of knot slipping at constant clinical failure load. Orthocord and Fiberwire suture materials had the lowest incidence of knot slippage. Surgeon C had complete knot slippage at constant clinical failure load using ForceFiber with the Weston knot and Ultrabraid with the Tennessee slider knot. When using Ultrabraid or ForceFiber, surgeons A and C had at least 2 knots slip for all knot configurations.
Discussion
Optimization of knot security for any given knot configuration, suture material, and surgeon experience level during arthroscopic knot tying is crucial.1-10 Our study results showed that, under single LTF test scenarios, there was a significant difference between in vitro and in situ conditions with respect to both knot configuration and surgeon experience level, except when Ultrabraid suture material was used. Arthroscopic sliding knots are lockable or nonlockable.7,12 With lockable sliding knots, slippage may be prevented by tensioning the wrapping limb, which distorts the post in the distal part of the knot, resulting in a kink in the post, thereby increasing the internal interference that increases the resistance of the knot from backing off. With nonlockable sliding knots, slippage may be prevented by the tight grip of the wrappings around the initial post.7 The static surgeon’s knot and the Tennessee slider knot are nonlockable, whereas the Weston knot is a distal lockable sliding knot. Compared with nonlockable sliding knots, lockable sliding knots cause less suture loop enlargement. In 1976, Tera and Aberg22 studied the strength of knotted thread for 12 different types of suture knots combined with 11 types of suture material. They conducted their study 1 week after suture material was inserted into the subcutaneous tissue of rabbits. Their results show a greater propensity for certain suture materials to slip when tested in an aqueous environment. In 1998, Babetty and colleagues23 used Wistar rats to compare the in vivo strength, knot efficiency, and knot security of 4 types of sliding knots and to assess tissue reaction as a result of knot configuration, knot volume, and suture size. They found that 4/0 knots lost more strength than 2/0 knots did, and they concluded that the tissue response to all the knots, except 2/0 nylon, was similar. They indicated that the inflammatory sheath volume varied with knot volume, suture size, and knot configuration. Our results agree with observations that exposure to an aqueous environment alters the force to clinical failure of comparable suture and knot configurations.
In addition, our findings indicate that surgeon familiarity with certain knots has a major effect on knot security. The difference in our 3 surgeons’ levels of familiarity with certain knots was somewhat minimized by the knot tying they practiced before submitting knots for testing. The findings contrast with those of Milia and colleagues,24 who conducted a biomechanical study to determine the effect of experience level on knot security. They compared an experienced arthroscopic shoulder surgeon with a junior-level orthopedic resident surgeon and concluded that experience did not affect knot security. However, the knots in their study were tied by hand, not through an arthroscopic cannula with instruments. Our findings suggest that both experienced and less experienced orthopedic residents should be encouraged to practice arthroscopic knot tying in a nonsurgical environment in order to become comfortable tying arthroscopic knots.
Braided nonabsorbable polyester suture traditionally has been found to be stronger than monofilament absorbable polydioxanone (PDS) and to have less slippage potential.8,9,25 Several studies have determined that the braided polyblend sutures now commonly used for arthroscopic knots have better strength profiles over more traditional materials.12,26,27 Orthocord has a dyed absorbable core (PDS, 68%), an undyed nonabsorbable ultrahigh-molecular-weight polyethylene (UHMWPE, 32%) sleeve, and a polyglactin coating.9,10 Both Ultrabraid and ForceFiber are made with braided UHMWPE and have just a few variations in weave patterns. Fiberwire has a multifiber UHMWPE core covered with braided polyester suture material. Several biomechanical studies25,26,28 have evaluated different arthroscopic sliding knot configurations with different suture materials, and all concluded that a surgeon who is choosing an arthroscopic repair technique should know the differences in suture materials and the knot strengths afforded by different knot configurations, as suture material is an important aspect of loop security. Our findings agree with their findings, that suture materials have a major effect on knot security, even with a series of 3 RHAPs, as in theory the RHAPs should minimize suture friction, internal interference, and slack between knot loops—emphasizing the effect of material selection. Furthermore, our findings also indicated that suture materials with a core in their design (Fiberwire, Orthocord) tend to have the lowest incidence of knot slippage. We had suspected that suture surface characteristics and suture construction could be important factors in knot slippage.
Our experimental design had its limitations. First, although we simulated factors such as temperature, plasma environment, and surgeon experience, tying a knot on a standardized post (30 mm in circumference) differed from what is typically done clinically. Second, the metal hooks used in this study were not compressible and did not interpose in the substance of the knot as soft tissue does in the clinical setting. Third, knots were tied with no tension against the sutures, whereas clinically knots are tied under tension as tissues are pulled together in reconstructions. Fourth, it was assumed that soaking in a physiologic solution bath (human blood plasma) at 37°C (body temperature) for 24 hours before testing was sufficient to simulate the aqueous medium in vivo after surgery, but these parameters may not represent conditions in a patient who has just undergone an arthroscopic shoulder repair and adheres to a passive motion protocol. Fifth, there was no blinding of knot type, and there was no randomization of tying order or testing order. Sixth, only a single LTF test was performed, and incremental cyclic loading can be more useful, as it has long been recognized as a leading source of failure in orthopedic repairs.
Conclusion
These study results advance our overall understanding of the biomechanics of the different knot configurations and loop security levels of the different braided polyblend sutures used in arthroscopic procedures through LTF in both in vitro and in situ conditions. Overall, no suture material was superior to any other in a fluid environment, as the combination of aqueous environment and surgeon level of experience with arthroscopic knot tying has a major effect on knot security under single LTF test scenarios. However, our data showed that Ultrabraid suture material had no effect on knot effectiveness over the fluid environment and the temperature. Furthermore, the study showed that the Tennessee slider knot had the steepest learning curve. This study may provide an alternative arthroscopic knots option for soft-tissue repair in which use of certain suture materials is limited.
1. Burkhart SS, Wirth MA, Simonich M, Salem D, Lanctot D, Athanasiou K. Knot security in simple sliding knots and its relationship to rotator cuff repair: how secure must the knot be? Arthroscopy. 2000;16(2):202-207.
2. Burkhart SS, Wirth MA, Simonich M, Salem D, Lanctot D, Athanasiou K. Loop security as a determinant of tissue fixation security. Arthroscopy. 1998;14(7):773-776.
3. Elkousy H, Hammerman SM, Edwards TB, et al. The arthroscopic square knot: a biomechanical comparison with open and arthroscopic knots. Arthroscopy. 2006;22(7):736-741.
4. Elkousy HA, Sekiya JK, Stabile KJ, McMahon PJ. A biomechanical comparison of arthroscopic sliding and sliding-locking knots. Arthroscopy. 2005;21(2):204-210.
5. Ilahi OA, Younas SA, Alexander J, Noble PC. Cyclic testing of arthroscopic knot security. Arthroscopy. 2004;20(1):62-68.
6. Loutzenheiser TD, Harryman DT 2nd, Ziegler DW, Yung SW. Optimizing arthroscopic knots using braided or monofilament suture. Arthroscopy. 1998;14(1):57-65.
7. Chan KC, Burkhart SS, Thiagarajan P, Goh JC. Optimization of stacked half-hitch knots for arthroscopic surgery. Arthroscopy. 2001;17(7):752-759.
8. Lee TQ, Matsuura PA, Fogolin RP, Lin AC, Kim D, McMahon PJ. Arthroscopic suture tying: a comparison of knot types and suture materials. Arthroscopy. 2001;17(4):348-352.
9. Mishra DK, Cannon WD Jr, Lucas DJ, Belzer JP. Elongation of arthroscopically tied knots. Am J Sports Med. 1997;25(1):113-117.
10. Kim SH, Ha KI, Kim SH, Kim JS. Significance of the internal locking mechanism for loop security enhancement in the arthroscopic knot. Arthroscopy. 2001;17(8):850-855.
11. Weston PV. A new clinch knot. Obstet Gynecol. 1991;78(1):144-147.
12. Lo IK, Burkhart SS, Chan KC, Athanasiou K. Arthroscopic knots: determining the optimal balance of loop security and knot security. Arthroscopy. 2004;20(5):489-502.
13. Lo IK, Burkhart SS, Athanasiou K. Abrasion resistance of two types of nonabsorbable braided suture. Arthroscopy. 2004;20(4):407-413.
14. De Beer JF, van Rooyen K, Boezaart AP. Nicky’s knot—a new slip knot for arthroscopic surgery. Arthroscopy. 1998;14(1):109-110.
15. Loutzenheiser TD, Harryman DT 2nd, Yung SW, France MP, Sidles JA. Optimizing arthroscopic knots. Arthroscopy. 1995;11(2):199-206.
16. Wetzler MJ, Bartolozzi AR, Gillespie MJ, et al. Fatigue properties of suture anchors in anterior shoulder reconstructions: Mitek GII. Arthroscopy. 1996;12(6):687-693.
17. Barber FA, Herbert MA, Beavis RC. Cyclic load and failure behavior of arthroscopic knots and high strength sutures. Arthroscopy. 2009;25(2):192-199.
18. Richmond JC. A comparison of ultrasonic suture welding and traditional knot tying. Am J Sports Med. 200;29(3):297-299.
19. James JD, Wu MM, Batra EK, Rodeheaver GT, Edlich RF. Technical considerations in manual and instrument tying techniques. J Emerg Med. 1992;10(4):469-480.
20. Batra EK, Franz DA, Towler MA, et al. Influence of emergency physician’s tying technique on knot security. J Emerg Med. 1992;10(3):309-316.
21. Livermore RW, Chong AC, Prohaska DJ, Cooke FW, Jones TL. Knot security, loop security and elongation of braided polyblend sutures used for arthroscopic knots. Am J Orthop. 2010;39(12):569-576.
22. Tera H, Aberg C. The strength of suture knots after one week in vivo. Acta Chir Scand. 1976;142(4):301-307.
23. Babetty Z, Sümer A, Altintaş S, Ergüney S, Göksel S. Changes in knot-holding capacity of sliding knots in vivo and tissue reaction. Arch Surg. 1998;133(7):727-734.
24. Milia MJ, Peindl RD, Connor PM. Arthroscopic knot tying: the role of instrumentation in achieving knot security. Arthroscopy. 2005;21(1):69-76.
25. Lieurance RK, Pflaster DS, Abbott D, Nottage WM. Failure characteristics of various arthroscopically tied knots. Clin Orthop. 2003;(408):311-318.
26. Abbi G, Espinoza L, Odell T, Mahar A, Pedowitz R. Evaluation of 5 knots and 2 suture materials for arthroscopic rotator cuff repair: very strong sutures can still slip. Arthroscopy. 2006;22(1):38-43.
27. Wüst DM, Meyer DC, Favre P, Gerber C. Mechanical and handling properties of braided polyblend polyethylene sutures in comparison to braided polyester and monofilament polydioxanone sutures. Arthroscopy. 2006;22(11):1146-1153.
28. Mahar AT, Moezzi DM, Serra-Hsu F, Pedowitz RA. Comparison and performance characteristics of 3 different knots when tied with 2 suture materials used for shoulder arthroscopy. Arthroscopy. 2006;22(6):614.e1-e2.
Open-surgery knot tying is easily learned and performed, but knot tying during arthroscopic procedures can be both challenging and frustrating. According to Burkhart and colleagues,1,2 knot security is defined as the effectiveness of the knot in resisting slippage when load is applied, whereas loop security is the effectiveness in maintaining a tight suture loop while a knot is being tied. Arthroscopic knots commonly begin with an initial slipknot locked in place with a series of half-hitches. During arthroscopic surgery, the surgeon usually must tie an arthroscopic knot to obtain secure tissue fixation, an essential component of soft-tissue repair. A secure knot provides optimal tissue apposition for healing, which will ultimately improve functional outcome. For a knot to be effective, it must have both knot security and loop security. Knot security depends on knot configuration, the coefficient of friction, ductility, handling properties, solubility and diameter of suture material, internal interference, slack between throws, and surgeon experience. Tissue fluid and tissue reaction to suture material may affect knot and loop security.
The ideal knot would be easy to tie and reproducible and would not slip or stretch before tissue is healed. The ideal suture material should provide adequate strength to hold soft tissue in an anatomically correct position until healing can occur. It should also be easily and efficiently manipulated by arthroscopic means when tissues are being secured with knots and secure suture loops. Studies have been conducted to evaluate the security of knots tied with arthroscopic techniques, knot configurations, and suture materials, and these investigations have often evaluated knot performance under single load-to-failure (LTF) test scenarios and cyclic loading in vitro (dry environment) in a room-temperature environment.2-10 To our knowledge, few if any attempts have been made to simulate in situ conditions at body temperature when testing knot security. The fluid environment and the temperature could potentially affect the effectiveness of knots, as knot security depends on friction, internal interference, and slack between throws.1
We conducted a study to evaluate biomechanical performance (knot security, loop security) during destructive testing of several different suture materials with various arthroscopic knot configurations. The study was performed under in vitro (dry environment) and in situ (wet environment) conditions by surgeons with different levels of experience.
Materials and Methods
This investigation was conducted at the Orthopaedic Research Institute at Via Christi Health in Wichita, Kansas. The study compared 4 different suture materials tied with 3 different commonly used arthroscopic knots by 3 surgeons with different levels of experience. The 4 types of braided polyblend polyethylene sutures were Fiberwire (Arthrex, Naples, Florida), ForceFiber (Stryker, San Jose, California), Orthocord (DePuy-Mitek, Warsaw, Indiana), and Ultrabraid (Smith & Nephew, Memphis, Tennessee). Each suture material was tied with 3 arthroscopic knots—static surgeon’s knot, Weston knot,11 Tennessee slider12—and a series of 3 reversing half-hitches on alternating posts (RHAPs) (Figure 1). These knots were chosen based on studies showing they have a higher maximum force to failure when combined with 3 RHAPs.1,2,5,9,13-17
We evaluated performer variability with the help of 3 investigator-surgeons who differed in their level of experience tying arthroscopic knots. This experience was defined on the basis of total number of arthroscopies performed—one of the most important factors predicting basic arthroscopic skills. Our surgeon A was a sports medicine fellowship–trained surgeon with 10 years of experience and a significant number of arthroscopies performed annually (350); surgeon B was a sports medicine fellowship–trained surgeon with 3 years of experience and an annual arthroscopy volume of more than 250 procedures; and surgeon C was a third-year orthopedic resident with about 100 arthroscopies performed.
All knots were tied on a standardized post 30 mm in circumference, which provided a consistent starting circumference for each knot and replicated the suture loop created during arthroscopic rotator cuff repair. All knots were tied using standard arthroscopic techniques, with a standard knot pusher and a modified arthroscopic cannula, in a dry environment (Figure 2). Servohydraulic materials testing system instruments (model 810; MTS Systems, Eden Prairie, Minnesota) were used to test the knot security and loop security of each combination of knots and suture types. Two round hooks (diameter, 3.9 mm) were attached to the actuator and the load cell (Figure 3). Loops were preloaded to 6 N to avoid potential errors caused by slack in the loops or by stretching of suture materials and to provide a well-defined starting point for data recording.
LTF testing was performed for both in vitro and in situ conditions using 10 samples of each suture–knot configuration for each mechanical testing. Each type of testing was conducted for a total of 240 suture–knot combinations per investigator. For the in vitro condition, each suture loop was initiated with 5 preconditioning loading cycles, from 6 N to 30 N at 1 Hz. The load was then applied continuously at a crosshead speed of 1 mm/s until “clinical failure” (3 mm crosshead displacement). We used this criterion for clinical failure, as studies have indicated that 3 mm is the point at which tissue apposition is lost.15,18-21 After the crosshead reached the 3-mm displacement, the loads (under load control) were held for 5 minutes at maximum load, and then load was applied continuously at a crosshead speed of 1 mm/s until complete structure failure. Load and displacement data were collected at a frequency of 20 Hz.
For the in situ condition, the same test parameters were used, except that each combination of the suture loop was preloaded to 6 N and soaked in physiologic solution bath (human blood plasma) at 37°C (body temperature) for 24 hours before testing in an effort to simulate the aqueous medium in vivo after surgery. The in situ tests were performed under physiologic solution maintained at 37°C to approximate postoperative physical conditions.
Statistical Analysis
Means and standard deviations of the knot security and loop security achieved by the surgeons (different experience levels) were calculated for each test configuration and each test condition. These values were used to determine the statistical relevance of the difference in arthroscopic loop security and knot security in each configuration. One-way analysis of variance (ANOVA) performed with SPSS Version 19.0 software (SPSS, Chicago, Illinois) with the least significant difference (LSD) multiple comparisons post hoc analysis was used to determine if any observed differences between the types of braided polyblend sutures, the types of sliding knots, the test conditions (in vitro, in situ), and the levels of surgeon experience were significant for each knot configuration. The level of significance of differences was set at P < .001.
Results
Figure 4 shows the mean maximum clinical failure load (3 mm of displacement) of different arthroscopic knot configurations for different braided polyblend sutures by surgeons of different levels of experience. In the comparison of biomechanical performance (knot and loop security) under in vitro and in situ conditions, no significant difference was detected when Ultrabraid suture material was used, regardless of surgeon experience, for all knot configurations. For surgeon B, there was no significant difference between in vitro and in situ conditions for any knot configurations or suture materials. When Orthocord suture material was used, Weston knots tied by surgeon A, and static surgeon’s knots by surgeons A and C, resulted in a significant difference between the in vitro and in situ conditions. When ForceFiber suture material was used, only Weston knots and Tennessee slider knots by surgeon A had a significant difference between in vitro and in situ conditions. Weston knots by surgeon A exhibited a significant difference between in vitro and in situ conditions, except when Ultrabraid suture material was used.
Surgeon C’s Tennessee slider knots with all polyblend sutures showed significantly lower loads at clinical failure compared with all the other knot configurations and with knots tied by the other 2 surgeons under both in vitro and in situ conditions. Overall, knots tied by surgeon B had higher clinical failure load than knots tied by the other 2 surgeons.
Figure 5 shows the mean ultimate failure load (complete structural failure) of different arthroscopic knot configurations for different braided polyblend sutures by surgeons of different levels of experience. Knots tied with Orthocord suture material had the overall lower ultimate failure load compared with other suture materials, whereas knots tied with Ultrabraid suture material had the overall highest ultimate failure load. However, the ultimate failure loads for all the knots tied using any suture material, regardless of surgeon experience, were more than 61 N, which is the estimated minimum required ultimate load per suture during a maximum muscle contraction.1
Figure 6 shows the percentage of knot slipping at constant clinical failure load. Orthocord and Fiberwire suture materials had the lowest incidence of knot slippage. Surgeon C had complete knot slippage at constant clinical failure load using ForceFiber with the Weston knot and Ultrabraid with the Tennessee slider knot. When using Ultrabraid or ForceFiber, surgeons A and C had at least 2 knots slip for all knot configurations.
Discussion
Optimization of knot security for any given knot configuration, suture material, and surgeon experience level during arthroscopic knot tying is crucial.1-10 Our study results showed that, under single LTF test scenarios, there was a significant difference between in vitro and in situ conditions with respect to both knot configuration and surgeon experience level, except when Ultrabraid suture material was used. Arthroscopic sliding knots are lockable or nonlockable.7,12 With lockable sliding knots, slippage may be prevented by tensioning the wrapping limb, which distorts the post in the distal part of the knot, resulting in a kink in the post, thereby increasing the internal interference that increases the resistance of the knot from backing off. With nonlockable sliding knots, slippage may be prevented by the tight grip of the wrappings around the initial post.7 The static surgeon’s knot and the Tennessee slider knot are nonlockable, whereas the Weston knot is a distal lockable sliding knot. Compared with nonlockable sliding knots, lockable sliding knots cause less suture loop enlargement. In 1976, Tera and Aberg22 studied the strength of knotted thread for 12 different types of suture knots combined with 11 types of suture material. They conducted their study 1 week after suture material was inserted into the subcutaneous tissue of rabbits. Their results show a greater propensity for certain suture materials to slip when tested in an aqueous environment. In 1998, Babetty and colleagues23 used Wistar rats to compare the in vivo strength, knot efficiency, and knot security of 4 types of sliding knots and to assess tissue reaction as a result of knot configuration, knot volume, and suture size. They found that 4/0 knots lost more strength than 2/0 knots did, and they concluded that the tissue response to all the knots, except 2/0 nylon, was similar. They indicated that the inflammatory sheath volume varied with knot volume, suture size, and knot configuration. Our results agree with observations that exposure to an aqueous environment alters the force to clinical failure of comparable suture and knot configurations.
In addition, our findings indicate that surgeon familiarity with certain knots has a major effect on knot security. The difference in our 3 surgeons’ levels of familiarity with certain knots was somewhat minimized by the knot tying they practiced before submitting knots for testing. The findings contrast with those of Milia and colleagues,24 who conducted a biomechanical study to determine the effect of experience level on knot security. They compared an experienced arthroscopic shoulder surgeon with a junior-level orthopedic resident surgeon and concluded that experience did not affect knot security. However, the knots in their study were tied by hand, not through an arthroscopic cannula with instruments. Our findings suggest that both experienced and less experienced orthopedic residents should be encouraged to practice arthroscopic knot tying in a nonsurgical environment in order to become comfortable tying arthroscopic knots.
Braided nonabsorbable polyester suture traditionally has been found to be stronger than monofilament absorbable polydioxanone (PDS) and to have less slippage potential.8,9,25 Several studies have determined that the braided polyblend sutures now commonly used for arthroscopic knots have better strength profiles over more traditional materials.12,26,27 Orthocord has a dyed absorbable core (PDS, 68%), an undyed nonabsorbable ultrahigh-molecular-weight polyethylene (UHMWPE, 32%) sleeve, and a polyglactin coating.9,10 Both Ultrabraid and ForceFiber are made with braided UHMWPE and have just a few variations in weave patterns. Fiberwire has a multifiber UHMWPE core covered with braided polyester suture material. Several biomechanical studies25,26,28 have evaluated different arthroscopic sliding knot configurations with different suture materials, and all concluded that a surgeon who is choosing an arthroscopic repair technique should know the differences in suture materials and the knot strengths afforded by different knot configurations, as suture material is an important aspect of loop security. Our findings agree with their findings, that suture materials have a major effect on knot security, even with a series of 3 RHAPs, as in theory the RHAPs should minimize suture friction, internal interference, and slack between knot loops—emphasizing the effect of material selection. Furthermore, our findings also indicated that suture materials with a core in their design (Fiberwire, Orthocord) tend to have the lowest incidence of knot slippage. We had suspected that suture surface characteristics and suture construction could be important factors in knot slippage.
Our experimental design had its limitations. First, although we simulated factors such as temperature, plasma environment, and surgeon experience, tying a knot on a standardized post (30 mm in circumference) differed from what is typically done clinically. Second, the metal hooks used in this study were not compressible and did not interpose in the substance of the knot as soft tissue does in the clinical setting. Third, knots were tied with no tension against the sutures, whereas clinically knots are tied under tension as tissues are pulled together in reconstructions. Fourth, it was assumed that soaking in a physiologic solution bath (human blood plasma) at 37°C (body temperature) for 24 hours before testing was sufficient to simulate the aqueous medium in vivo after surgery, but these parameters may not represent conditions in a patient who has just undergone an arthroscopic shoulder repair and adheres to a passive motion protocol. Fifth, there was no blinding of knot type, and there was no randomization of tying order or testing order. Sixth, only a single LTF test was performed, and incremental cyclic loading can be more useful, as it has long been recognized as a leading source of failure in orthopedic repairs.
Conclusion
These study results advance our overall understanding of the biomechanics of the different knot configurations and loop security levels of the different braided polyblend sutures used in arthroscopic procedures through LTF in both in vitro and in situ conditions. Overall, no suture material was superior to any other in a fluid environment, as the combination of aqueous environment and surgeon level of experience with arthroscopic knot tying has a major effect on knot security under single LTF test scenarios. However, our data showed that Ultrabraid suture material had no effect on knot effectiveness over the fluid environment and the temperature. Furthermore, the study showed that the Tennessee slider knot had the steepest learning curve. This study may provide an alternative arthroscopic knots option for soft-tissue repair in which use of certain suture materials is limited.
1. Burkhart SS, Wirth MA, Simonich M, Salem D, Lanctot D, Athanasiou K. Knot security in simple sliding knots and its relationship to rotator cuff repair: how secure must the knot be? Arthroscopy. 2000;16(2):202-207.
2. Burkhart SS, Wirth MA, Simonich M, Salem D, Lanctot D, Athanasiou K. Loop security as a determinant of tissue fixation security. Arthroscopy. 1998;14(7):773-776.
3. Elkousy H, Hammerman SM, Edwards TB, et al. The arthroscopic square knot: a biomechanical comparison with open and arthroscopic knots. Arthroscopy. 2006;22(7):736-741.
4. Elkousy HA, Sekiya JK, Stabile KJ, McMahon PJ. A biomechanical comparison of arthroscopic sliding and sliding-locking knots. Arthroscopy. 2005;21(2):204-210.
5. Ilahi OA, Younas SA, Alexander J, Noble PC. Cyclic testing of arthroscopic knot security. Arthroscopy. 2004;20(1):62-68.
6. Loutzenheiser TD, Harryman DT 2nd, Ziegler DW, Yung SW. Optimizing arthroscopic knots using braided or monofilament suture. Arthroscopy. 1998;14(1):57-65.
7. Chan KC, Burkhart SS, Thiagarajan P, Goh JC. Optimization of stacked half-hitch knots for arthroscopic surgery. Arthroscopy. 2001;17(7):752-759.
8. Lee TQ, Matsuura PA, Fogolin RP, Lin AC, Kim D, McMahon PJ. Arthroscopic suture tying: a comparison of knot types and suture materials. Arthroscopy. 2001;17(4):348-352.
9. Mishra DK, Cannon WD Jr, Lucas DJ, Belzer JP. Elongation of arthroscopically tied knots. Am J Sports Med. 1997;25(1):113-117.
10. Kim SH, Ha KI, Kim SH, Kim JS. Significance of the internal locking mechanism for loop security enhancement in the arthroscopic knot. Arthroscopy. 2001;17(8):850-855.
11. Weston PV. A new clinch knot. Obstet Gynecol. 1991;78(1):144-147.
12. Lo IK, Burkhart SS, Chan KC, Athanasiou K. Arthroscopic knots: determining the optimal balance of loop security and knot security. Arthroscopy. 2004;20(5):489-502.
13. Lo IK, Burkhart SS, Athanasiou K. Abrasion resistance of two types of nonabsorbable braided suture. Arthroscopy. 2004;20(4):407-413.
14. De Beer JF, van Rooyen K, Boezaart AP. Nicky’s knot—a new slip knot for arthroscopic surgery. Arthroscopy. 1998;14(1):109-110.
15. Loutzenheiser TD, Harryman DT 2nd, Yung SW, France MP, Sidles JA. Optimizing arthroscopic knots. Arthroscopy. 1995;11(2):199-206.
16. Wetzler MJ, Bartolozzi AR, Gillespie MJ, et al. Fatigue properties of suture anchors in anterior shoulder reconstructions: Mitek GII. Arthroscopy. 1996;12(6):687-693.
17. Barber FA, Herbert MA, Beavis RC. Cyclic load and failure behavior of arthroscopic knots and high strength sutures. Arthroscopy. 2009;25(2):192-199.
18. Richmond JC. A comparison of ultrasonic suture welding and traditional knot tying. Am J Sports Med. 200;29(3):297-299.
19. James JD, Wu MM, Batra EK, Rodeheaver GT, Edlich RF. Technical considerations in manual and instrument tying techniques. J Emerg Med. 1992;10(4):469-480.
20. Batra EK, Franz DA, Towler MA, et al. Influence of emergency physician’s tying technique on knot security. J Emerg Med. 1992;10(3):309-316.
21. Livermore RW, Chong AC, Prohaska DJ, Cooke FW, Jones TL. Knot security, loop security and elongation of braided polyblend sutures used for arthroscopic knots. Am J Orthop. 2010;39(12):569-576.
22. Tera H, Aberg C. The strength of suture knots after one week in vivo. Acta Chir Scand. 1976;142(4):301-307.
23. Babetty Z, Sümer A, Altintaş S, Ergüney S, Göksel S. Changes in knot-holding capacity of sliding knots in vivo and tissue reaction. Arch Surg. 1998;133(7):727-734.
24. Milia MJ, Peindl RD, Connor PM. Arthroscopic knot tying: the role of instrumentation in achieving knot security. Arthroscopy. 2005;21(1):69-76.
25. Lieurance RK, Pflaster DS, Abbott D, Nottage WM. Failure characteristics of various arthroscopically tied knots. Clin Orthop. 2003;(408):311-318.
26. Abbi G, Espinoza L, Odell T, Mahar A, Pedowitz R. Evaluation of 5 knots and 2 suture materials for arthroscopic rotator cuff repair: very strong sutures can still slip. Arthroscopy. 2006;22(1):38-43.
27. Wüst DM, Meyer DC, Favre P, Gerber C. Mechanical and handling properties of braided polyblend polyethylene sutures in comparison to braided polyester and monofilament polydioxanone sutures. Arthroscopy. 2006;22(11):1146-1153.
28. Mahar AT, Moezzi DM, Serra-Hsu F, Pedowitz RA. Comparison and performance characteristics of 3 different knots when tied with 2 suture materials used for shoulder arthroscopy. Arthroscopy. 2006;22(6):614.e1-e2.
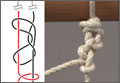
Arthroscopic Anterior Cruciate Ligament Reconstruction Using a Flexible Guide Pin With a Rigid Reamer
Anterior cruciate ligament (ACL) injuries are common, and arthroscopic ACL reconstruction is a routine procedure. Successful ACL reconstruction requires correct placement of the graft within the anatomical insertion of the native ACL.1-3 Errors in surgical technique—specifically, improper femoral tunnel placement—are the most common cause of graft failure in patients who present with recurrent instability after ACL reconstruction.4 There has been much emphasis on placing the tunnel more centrally in the ACL footprint as well as in a more horizontal position, which is thought to provide better rotational control and anterior-to-posterior translational stability.5-7
Two common techniques for creating the femoral tunnel, transtibial and anteromedial drilling, have their unique limitations. Transtibial drilling can place the tunnel high in the notch, resulting in nonanatomical, vertical graft placement.8,9 This technique can be modified to obtain a more anatomical tunnel, but the risk is the tunnel will be short and close to the joint line.10 To avoid these difficulties, surgeons began using an anteromedial portal.11,12 Although anteromedial drilling places the tunnel in a more anatomical position, it too has drawbacks, including the need to hyperflex the knee, a short tunnel, damage to articular cartilage, proximity to neurovascular structures, and difficulty in visualization during drilling.13-16
Femoral tunnel drilling techniques using flexible guide pins and reamers have been developed to address the limitations of rigid instruments. When we first started using flexible instruments through anteromedial portals, there were multiple incidents of reamer breakage during drilling. We therefore developed a technique that uses a flexible guide pin with a rigid reamer to place the femoral tunnel in an anatomical position. The patient described in this article provided written informed consent for print and electronic publication of this report.
Technique
We begin with our standard arthroscopic portals, including superolateral outflow, lateral parapatellar, and medial parapatellar portals. The medial parapatellar portal is placed under direct visualization with insertion of an 18-gauge spinal needle, ensuring the trajectory reaches the anatomical location of the native ACL on the lateral femoral condyle (LFC). The ACL stump is débrided with a shaver and a radiofrequency ablator, leaving a remnant of tissue to assist with tunnel placement. We do not routinely perform a notchplasty unless there is a concern about possible graft impingement, or the notch is abnormally small. The anatomical footprint is marked with a small awl (Figure 1), and the arthroscope is moved into the anteromedial portal to confirm anatomical placement of the awl mark (Figure 2).
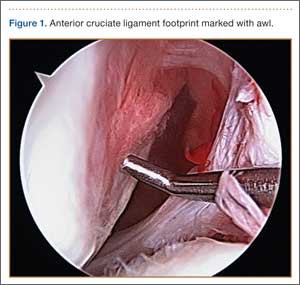
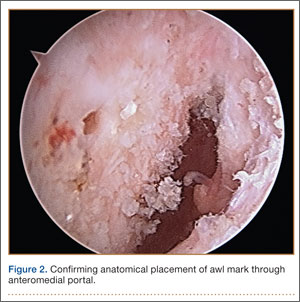
With the knee flexed to 100° to 110°, a flexible 2.7-mm nitonol guide pin (Smith & Nephew, Memphis, Tennessee) is placed freehand through the anteromedial portal into the anatomical footprint of the ACL, marked by the awl, and is passed through the femur before exiting the lateral skin. In most cases, we prefer freehand placement of the awl and pin; however, a femoral drill guide may be used to place the pin into the anatomical footprint of the ACL (Figure 3). The flexible pin allows for knee hyperflexion, clearance of the medial femoral condyle, central placement of the pin between the footprints of the anteromedial and posterolateral bundles for anatomical single-bundle reconstruction, and drilling of a long tunnel (average, 35-40 mm). The pin has a black laser marking that should be placed at the edge of the articular surface of the LFC to ensure appropriate depth of insertion (Figure 4).
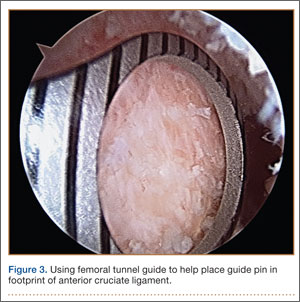
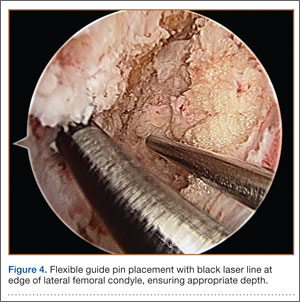
A small incision is then made around the guide wire on the lateral thigh, and an outside-in depth gauge is used to obtain an accurate length for the femoral tunnel. The gauge must abut the femoral cortex for accurate assessment of tunnel length. We use an Endobutton (Smith & Nephew) for fixation of the graft in the tunnel. The measured length of the tunnel is used to select an Endobutton of appropriate size and the proper reaming depth for suspension. We routinely use a 10- or 15-mm Endobutton, which provides an average 20 to 25 mm of graft inside the bony tunnel. The knee may then be relaxed to a normal resting flexion angle off the side of the bed, and the arthroscope is inserted into a medial portal or an accessory anteromedial portal to ensure anatomical placement of the pin. Using a flexible guide pin allows the knee to be relatively extended, providing good visualization of overall positioning in relation to the posterior wall of the LFC, whereas keeping the knee in a flexed position (as with a rigid guide pin) can often compromise this visualization.
Using a solid reamer corresponding to the size of the graft, we drill over the guide pin to the appropriate depth, again with the knee hyperflexed (Figure 5), making sure not to breach the lateral femoral cortex, which would compromise fixation with the Endobutton. After drilling with the rigid reamer is completed, placement of the tunnel in an anatomical position is again confirmed with the knee in the normal resting flexion angle (Figure 6). Once the tibial tunnel is drilled at the anatomical footprint, the graft is passed with the proper-length Endobutton and is fixed on the tibial side with a bioabsorbable interference screw 1 to 2 mm larger than the soft-tissue graft and tibial tunnel size. The knee is flexed to 30° while the tibial screw is placed. Graft tension and impingement are then checked (Figure 7). Postoperative anteroposterior and lateral radiographs of the knee may be obtained to confirm anatomical placement of the tunnels as well as proper positioning of the Endobutton (Figures 8A, 8B).
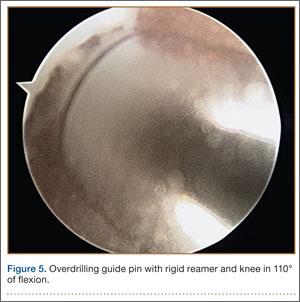
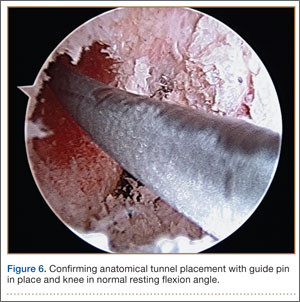
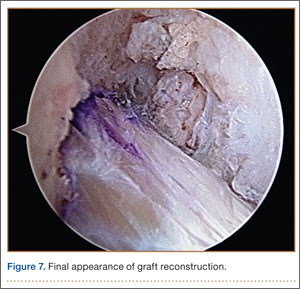
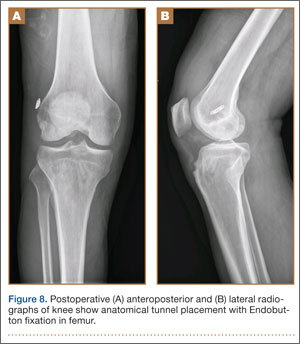
Discussion
Successful ACL reconstruction depends heavily on anatomical tunnel positioning. Failure to place the femoral tunnel in the anatomical footprint of the native ACL results in incomplete restoration of knee kinematics, rotational instability, and graft failure.1-7 Two common techniques for creating this tunnel, transtibial and anteromedial drilling, can reliably place it in an anatomical position. Each technique, however, has limitations. Transtibial drilling can place the tunnel too vertical and high in the notch, or produce a short tibial tunnel close to the joint line.8-10 Anteromedial drilling requires knee hyperflexion, risks damaging the articular cartilage and nearby neurovascular structures, and makes visualization difficult.13-16
One option for addressing some of the difficulties and limitations with anteromedial drilling is to use flexible guide pins and reamers, as first introduced by Cain and Clancy.1 In a cadaveric study, Silver and colleagues17 demonstrated that interosseous tunnels drilled with flexible guide pins were on average more than 6 mm longer than those drilled with rigid pins and consistently were 40 mm or longer. In addition, all tunnels drilled with flexible guide pins were on average 42.3 mm away from the peroneal nerve and 26.1 mm away from the femoral origin of the lateral collateral ligament—safe distances.
Steiner and Smart18 compared flexible and rigid instruments used to drill transtibial and anteromedial (without hyperflexion) anatomical femoral tunnels in ACL reconstruction in cadaveric knees. Although transtibial drilling with flexible pins produced anatomical tunnels, the tunnels were shorter, and the pins exited more posterior in comparison with anteromedial drilling with flexible pins. Transtibial tunnels drilled with rigid pins were nonanatomical and exited more superior and anterior on the femur, resulting in longer tunnels. Anteromedial tunnels drilled with rigid and flexible pins were placed anatomically, but flexible pins produced longer tunnels, did not require hyperflexion (120°), could easily be placed with the knee in 90° of flexion, and did not violate the posterior femoral cortex.
Five times in our early experience with flexible guide pins and reamers, the reamer broke when LFC reaming was initiated. In each case, the broken reamer was retrieved. However, these complications resulted in increased surgical time and cost. In addition, an unretrievable reamer could have caused further injury and suboptimal outcomes. We subsequently developed an anteromedial technique that uses a flexible guide pin with a rigid reamer to place the femoral tunnel in an anatomical position (Figure 9). The flexible pin provides consistent placement of anatomical tunnels averaging 35 to 40 mm in length. Use of the flexible pin does not require constant hyperflexion of the knee, and it allows for better visualization of the posterior wall of the LFC, ensures anatomical graft placement, and decreases the risk of damaging articular cartilage and causing neurovascular injury. Use of the rigid reamer negates the risks and additional costs associated with reamer breakage. It is unclear why 5 flexible reamers broke during our early use of flexible guide pins and reamers, but it is possible that, because of the patients’ anatomy, placement of the pin in the correct anatomical position in the ACL footprint put a significant amount of abnormal stress on the reamer during tunnel reaming, leading to breakage and failure.
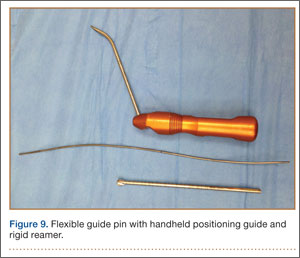
A short femoral tunnel is a common complication of using an anteromedial portal for tunnel drilling.13-16 With the technique we have been using, tunnel lengths average 35 to 40 mm. To address the occasional shorter tunnel, we use Endobutton Direct (Smith & Nephew), which allows for direct fixation of the graft on the button, maximizing the amount of graft in the femoral tunnel and minimizing graft–tunnel length mismatch. In the event there is a lateral wall breach during overdrilling with the reamer, the femoral graft may be secured with screw and post, with interference screw, or with the larger Xtendobuton (Smith & Nephew).
We have successfully used this technique with bone–patellar tendon–bone (BPTB) and hamstring autografts, as well as allografts. Complications, such as graft–tunnel length mismatch, have been uncommon, but, when using BPTB grafts, passing the bone block into the femoral tunnel can be difficult because of the sharp turn required.
Conclusion
Successful ACL reconstruction depends heavily on placement of the graft within the anatomical insertion of the native ACL. With the development of techniques that use flexible guide pins and reamers, it has become possible to place longer anatomical femoral tunnels without the need for hyperflexion. Use of a flexible guide pin with a rigid reamer allows placement of longer anatomical tunnels through an anteromedial portal, reduces time spent with the knee in hyperflexion, provides better viewing, poses less risk of damage to the articular cartilage and neurovascular structures, and at a lower cost with less risk of reamer breakage. In addition, this technique can be used with a variety of graft options, including BPTB grafts, hamstring autografts, and allografts.
1. Cain EL Jr, Clancy WG Jr. Anatomic endoscopic anterior cruciate ligament reconstruction with patella tendon autograft. Orthop Clin North Am. 2002;33(4):717-725.
2. Chhabra A, Starman JS, Ferretti M, Vidal AF, Zantop T, Fu FH. Anatomic, radiographic, biomechanical, and kinematic evaluation of the anterior cruciate ligament and its two functional bundles. J Bone Joint Surg Am. 2006;88(suppl 4):2-10.
3. Christel P, Sahasrabudhe A, Basdekis G. Anatomic double-bundle anterior cruciate ligament reconstruction with anatomic aimers. Arthroscopy. 2008;24(10):1146-1151.
4. Allen CR, Giffin JR, Harner CD. Revision anterior cruciate ligament reconstruction. Orthop Clin North Am. 2003;34(1):79-98.
5. Miller CD, Gerdeman AC, Hart JM, et al. A comparison of 2 drilling techniques on the femoral tunnel for anterior cruciate ligament reconstruction. Arthroscopy. 2011;27(3):372-379.
6. Seon JK, Park SJ, Lee KB, Seo HY, Kim MS, Song EK. In vivo stability and clinical comparison of anterior cruciate ligament reconstruction using low or high femoral tunnel positions. Am J Sports Med. 2011;39(1):127-133.
7. Steiner ME, Battaglia TC, Heming JF, Rand JD, Festa A, Baria M. Independent drilling outperforms conventional transtibial drilling in anterior cruciate ligament reconstruction. Am J Sports Med. 2009;37(10):1912-1919.
8. Kopf S, Forsythe B, Wong AK, et al. Nonanatomic tunnel position in traditional transtibial single-bundle anterior cruciate ligament reconstruction evaluated by three-dimensional computed tomography. J Bone Joint Surg Am. 2010;92(6):1427-1431.
9. Tompkins M, Milewski MD, Brockmeier SF, Gaskin CM, Hart JM, Miller MD. Anatomic femoral tunnel drilling in anterior cruciate ligament reconstruction: use of an accessory medial portal versus traditional transtibial drilling. Am J Sports Med. 2012;40(6):1313-1321.
10. Heming JF, Rand J, Steiner ME. Anatomical limitations of transtibial drilling in anterior cruciate ligament reconstruction. Am J Sports Med. 2007;35(10):1708-1715.
11. Harner CD, Honkamp NJ, Ranawat AS. Anteromedial portal technique for creating the anterior cruciate ligament femoral tunnel. Arthroscopy. 2008;24(1):113-115.
12. Lubowitz JH. Anteromedial portal technique for the anterior cruciate ligament femoral socket: pitfalls and solutions. Arthroscopy. 2009;25(1):95-101.
13. Basdekis G, Abisafi C, Christel P. Influence of knee flexion angle on femoral tunnel characteristics when drilled through the anteromedial portal during anterior cruciate ligament reconstruction. Arthroscopy. 2008;24(4):459-464.
14. Zantop T, Haase AK, Fu FH, Petersen W. Potential risk of cartilage damage in double bundle ACL reconstruction: impact of knee flexion angle and portal location on the femoral PL bundle tunnel. Arch Orthop Trauma Surg. 2008;128(5):509-513.
15. Farrow LD, Parker RD. The relationship of lateral anatomic structures to exiting guide pins during femoral tunnel preparation utilizing an accessory medial portal. Knee Surg Sports Traumatol Arthrosc. 2010;18(6):747-753.
16. Nakamura M, Deie M, Shibuya H, et al. Potential risks of femoral tunnel drilling through the far anteromedial portal: a cadaveric study. Arthroscopy. 2009;25(5):481-487.
17. Silver AG, Kaar SG, Grisell MK, Reagan JM, Farrow LD. Comparison between rigid and flexible systems for drilling the femoral tunnel through an anteromedial portal in anterior cruciate ligament reconstruction. Arthroscopy. 2010;26(6):790-795.
18. Steiner ME, Smart LR. Flexible instruments outperform rigid instruments to place anatomic anterior cruciate ligament femoral tunnels without hyperflexion. Arthroscopy. 2012;28(6):835-843.
Anterior cruciate ligament (ACL) injuries are common, and arthroscopic ACL reconstruction is a routine procedure. Successful ACL reconstruction requires correct placement of the graft within the anatomical insertion of the native ACL.1-3 Errors in surgical technique—specifically, improper femoral tunnel placement—are the most common cause of graft failure in patients who present with recurrent instability after ACL reconstruction.4 There has been much emphasis on placing the tunnel more centrally in the ACL footprint as well as in a more horizontal position, which is thought to provide better rotational control and anterior-to-posterior translational stability.5-7
Two common techniques for creating the femoral tunnel, transtibial and anteromedial drilling, have their unique limitations. Transtibial drilling can place the tunnel high in the notch, resulting in nonanatomical, vertical graft placement.8,9 This technique can be modified to obtain a more anatomical tunnel, but the risk is the tunnel will be short and close to the joint line.10 To avoid these difficulties, surgeons began using an anteromedial portal.11,12 Although anteromedial drilling places the tunnel in a more anatomical position, it too has drawbacks, including the need to hyperflex the knee, a short tunnel, damage to articular cartilage, proximity to neurovascular structures, and difficulty in visualization during drilling.13-16
Femoral tunnel drilling techniques using flexible guide pins and reamers have been developed to address the limitations of rigid instruments. When we first started using flexible instruments through anteromedial portals, there were multiple incidents of reamer breakage during drilling. We therefore developed a technique that uses a flexible guide pin with a rigid reamer to place the femoral tunnel in an anatomical position. The patient described in this article provided written informed consent for print and electronic publication of this report.
Technique
We begin with our standard arthroscopic portals, including superolateral outflow, lateral parapatellar, and medial parapatellar portals. The medial parapatellar portal is placed under direct visualization with insertion of an 18-gauge spinal needle, ensuring the trajectory reaches the anatomical location of the native ACL on the lateral femoral condyle (LFC). The ACL stump is débrided with a shaver and a radiofrequency ablator, leaving a remnant of tissue to assist with tunnel placement. We do not routinely perform a notchplasty unless there is a concern about possible graft impingement, or the notch is abnormally small. The anatomical footprint is marked with a small awl (Figure 1), and the arthroscope is moved into the anteromedial portal to confirm anatomical placement of the awl mark (Figure 2).
With the knee flexed to 100° to 110°, a flexible 2.7-mm nitonol guide pin (Smith & Nephew, Memphis, Tennessee) is placed freehand through the anteromedial portal into the anatomical footprint of the ACL, marked by the awl, and is passed through the femur before exiting the lateral skin. In most cases, we prefer freehand placement of the awl and pin; however, a femoral drill guide may be used to place the pin into the anatomical footprint of the ACL (Figure 3). The flexible pin allows for knee hyperflexion, clearance of the medial femoral condyle, central placement of the pin between the footprints of the anteromedial and posterolateral bundles for anatomical single-bundle reconstruction, and drilling of a long tunnel (average, 35-40 mm). The pin has a black laser marking that should be placed at the edge of the articular surface of the LFC to ensure appropriate depth of insertion (Figure 4).
A small incision is then made around the guide wire on the lateral thigh, and an outside-in depth gauge is used to obtain an accurate length for the femoral tunnel. The gauge must abut the femoral cortex for accurate assessment of tunnel length. We use an Endobutton (Smith & Nephew) for fixation of the graft in the tunnel. The measured length of the tunnel is used to select an Endobutton of appropriate size and the proper reaming depth for suspension. We routinely use a 10- or 15-mm Endobutton, which provides an average 20 to 25 mm of graft inside the bony tunnel. The knee may then be relaxed to a normal resting flexion angle off the side of the bed, and the arthroscope is inserted into a medial portal or an accessory anteromedial portal to ensure anatomical placement of the pin. Using a flexible guide pin allows the knee to be relatively extended, providing good visualization of overall positioning in relation to the posterior wall of the LFC, whereas keeping the knee in a flexed position (as with a rigid guide pin) can often compromise this visualization.
Using a solid reamer corresponding to the size of the graft, we drill over the guide pin to the appropriate depth, again with the knee hyperflexed (Figure 5), making sure not to breach the lateral femoral cortex, which would compromise fixation with the Endobutton. After drilling with the rigid reamer is completed, placement of the tunnel in an anatomical position is again confirmed with the knee in the normal resting flexion angle (Figure 6). Once the tibial tunnel is drilled at the anatomical footprint, the graft is passed with the proper-length Endobutton and is fixed on the tibial side with a bioabsorbable interference screw 1 to 2 mm larger than the soft-tissue graft and tibial tunnel size. The knee is flexed to 30° while the tibial screw is placed. Graft tension and impingement are then checked (Figure 7). Postoperative anteroposterior and lateral radiographs of the knee may be obtained to confirm anatomical placement of the tunnels as well as proper positioning of the Endobutton (Figures 8A, 8B).
Discussion
Successful ACL reconstruction depends heavily on anatomical tunnel positioning. Failure to place the femoral tunnel in the anatomical footprint of the native ACL results in incomplete restoration of knee kinematics, rotational instability, and graft failure.1-7 Two common techniques for creating this tunnel, transtibial and anteromedial drilling, can reliably place it in an anatomical position. Each technique, however, has limitations. Transtibial drilling can place the tunnel too vertical and high in the notch, or produce a short tibial tunnel close to the joint line.8-10 Anteromedial drilling requires knee hyperflexion, risks damaging the articular cartilage and nearby neurovascular structures, and makes visualization difficult.13-16
One option for addressing some of the difficulties and limitations with anteromedial drilling is to use flexible guide pins and reamers, as first introduced by Cain and Clancy.1 In a cadaveric study, Silver and colleagues17 demonstrated that interosseous tunnels drilled with flexible guide pins were on average more than 6 mm longer than those drilled with rigid pins and consistently were 40 mm or longer. In addition, all tunnels drilled with flexible guide pins were on average 42.3 mm away from the peroneal nerve and 26.1 mm away from the femoral origin of the lateral collateral ligament—safe distances.
Steiner and Smart18 compared flexible and rigid instruments used to drill transtibial and anteromedial (without hyperflexion) anatomical femoral tunnels in ACL reconstruction in cadaveric knees. Although transtibial drilling with flexible pins produced anatomical tunnels, the tunnels were shorter, and the pins exited more posterior in comparison with anteromedial drilling with flexible pins. Transtibial tunnels drilled with rigid pins were nonanatomical and exited more superior and anterior on the femur, resulting in longer tunnels. Anteromedial tunnels drilled with rigid and flexible pins were placed anatomically, but flexible pins produced longer tunnels, did not require hyperflexion (120°), could easily be placed with the knee in 90° of flexion, and did not violate the posterior femoral cortex.
Five times in our early experience with flexible guide pins and reamers, the reamer broke when LFC reaming was initiated. In each case, the broken reamer was retrieved. However, these complications resulted in increased surgical time and cost. In addition, an unretrievable reamer could have caused further injury and suboptimal outcomes. We subsequently developed an anteromedial technique that uses a flexible guide pin with a rigid reamer to place the femoral tunnel in an anatomical position (Figure 9). The flexible pin provides consistent placement of anatomical tunnels averaging 35 to 40 mm in length. Use of the flexible pin does not require constant hyperflexion of the knee, and it allows for better visualization of the posterior wall of the LFC, ensures anatomical graft placement, and decreases the risk of damaging articular cartilage and causing neurovascular injury. Use of the rigid reamer negates the risks and additional costs associated with reamer breakage. It is unclear why 5 flexible reamers broke during our early use of flexible guide pins and reamers, but it is possible that, because of the patients’ anatomy, placement of the pin in the correct anatomical position in the ACL footprint put a significant amount of abnormal stress on the reamer during tunnel reaming, leading to breakage and failure.
A short femoral tunnel is a common complication of using an anteromedial portal for tunnel drilling.13-16 With the technique we have been using, tunnel lengths average 35 to 40 mm. To address the occasional shorter tunnel, we use Endobutton Direct (Smith & Nephew), which allows for direct fixation of the graft on the button, maximizing the amount of graft in the femoral tunnel and minimizing graft–tunnel length mismatch. In the event there is a lateral wall breach during overdrilling with the reamer, the femoral graft may be secured with screw and post, with interference screw, or with the larger Xtendobuton (Smith & Nephew).
We have successfully used this technique with bone–patellar tendon–bone (BPTB) and hamstring autografts, as well as allografts. Complications, such as graft–tunnel length mismatch, have been uncommon, but, when using BPTB grafts, passing the bone block into the femoral tunnel can be difficult because of the sharp turn required.
Conclusion
Successful ACL reconstruction depends heavily on placement of the graft within the anatomical insertion of the native ACL. With the development of techniques that use flexible guide pins and reamers, it has become possible to place longer anatomical femoral tunnels without the need for hyperflexion. Use of a flexible guide pin with a rigid reamer allows placement of longer anatomical tunnels through an anteromedial portal, reduces time spent with the knee in hyperflexion, provides better viewing, poses less risk of damage to the articular cartilage and neurovascular structures, and at a lower cost with less risk of reamer breakage. In addition, this technique can be used with a variety of graft options, including BPTB grafts, hamstring autografts, and allografts.
1. Cain EL Jr, Clancy WG Jr. Anatomic endoscopic anterior cruciate ligament reconstruction with patella tendon autograft. Orthop Clin North Am. 2002;33(4):717-725.
2. Chhabra A, Starman JS, Ferretti M, Vidal AF, Zantop T, Fu FH. Anatomic, radiographic, biomechanical, and kinematic evaluation of the anterior cruciate ligament and its two functional bundles. J Bone Joint Surg Am. 2006;88(suppl 4):2-10.
3. Christel P, Sahasrabudhe A, Basdekis G. Anatomic double-bundle anterior cruciate ligament reconstruction with anatomic aimers. Arthroscopy. 2008;24(10):1146-1151.
4. Allen CR, Giffin JR, Harner CD. Revision anterior cruciate ligament reconstruction. Orthop Clin North Am. 2003;34(1):79-98.
5. Miller CD, Gerdeman AC, Hart JM, et al. A comparison of 2 drilling techniques on the femoral tunnel for anterior cruciate ligament reconstruction. Arthroscopy. 2011;27(3):372-379.
6. Seon JK, Park SJ, Lee KB, Seo HY, Kim MS, Song EK. In vivo stability and clinical comparison of anterior cruciate ligament reconstruction using low or high femoral tunnel positions. Am J Sports Med. 2011;39(1):127-133.
7. Steiner ME, Battaglia TC, Heming JF, Rand JD, Festa A, Baria M. Independent drilling outperforms conventional transtibial drilling in anterior cruciate ligament reconstruction. Am J Sports Med. 2009;37(10):1912-1919.
8. Kopf S, Forsythe B, Wong AK, et al. Nonanatomic tunnel position in traditional transtibial single-bundle anterior cruciate ligament reconstruction evaluated by three-dimensional computed tomography. J Bone Joint Surg Am. 2010;92(6):1427-1431.
9. Tompkins M, Milewski MD, Brockmeier SF, Gaskin CM, Hart JM, Miller MD. Anatomic femoral tunnel drilling in anterior cruciate ligament reconstruction: use of an accessory medial portal versus traditional transtibial drilling. Am J Sports Med. 2012;40(6):1313-1321.
10. Heming JF, Rand J, Steiner ME. Anatomical limitations of transtibial drilling in anterior cruciate ligament reconstruction. Am J Sports Med. 2007;35(10):1708-1715.
11. Harner CD, Honkamp NJ, Ranawat AS. Anteromedial portal technique for creating the anterior cruciate ligament femoral tunnel. Arthroscopy. 2008;24(1):113-115.
12. Lubowitz JH. Anteromedial portal technique for the anterior cruciate ligament femoral socket: pitfalls and solutions. Arthroscopy. 2009;25(1):95-101.
13. Basdekis G, Abisafi C, Christel P. Influence of knee flexion angle on femoral tunnel characteristics when drilled through the anteromedial portal during anterior cruciate ligament reconstruction. Arthroscopy. 2008;24(4):459-464.
14. Zantop T, Haase AK, Fu FH, Petersen W. Potential risk of cartilage damage in double bundle ACL reconstruction: impact of knee flexion angle and portal location on the femoral PL bundle tunnel. Arch Orthop Trauma Surg. 2008;128(5):509-513.
15. Farrow LD, Parker RD. The relationship of lateral anatomic structures to exiting guide pins during femoral tunnel preparation utilizing an accessory medial portal. Knee Surg Sports Traumatol Arthrosc. 2010;18(6):747-753.
16. Nakamura M, Deie M, Shibuya H, et al. Potential risks of femoral tunnel drilling through the far anteromedial portal: a cadaveric study. Arthroscopy. 2009;25(5):481-487.
17. Silver AG, Kaar SG, Grisell MK, Reagan JM, Farrow LD. Comparison between rigid and flexible systems for drilling the femoral tunnel through an anteromedial portal in anterior cruciate ligament reconstruction. Arthroscopy. 2010;26(6):790-795.
18. Steiner ME, Smart LR. Flexible instruments outperform rigid instruments to place anatomic anterior cruciate ligament femoral tunnels without hyperflexion. Arthroscopy. 2012;28(6):835-843.
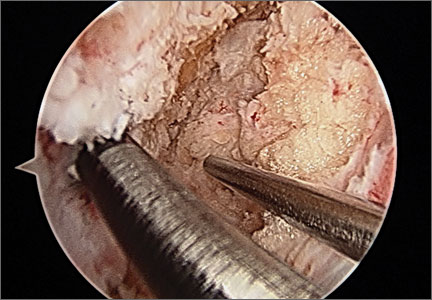
VIDEO: Data support switching to transradial PCI access
SAN DIEGO – Cardiologists should switch from transfemoral to transradial access in acute coronary syndrome patients undergoing percutaneous coronary intervention, given the reduced mortality rates associated with the transradial approach in the MATRIX study and other studies, Dr. Cindy L. Grines said at the annual meeting of the American College of Cardiology.
Because U.S. interventionalists are “under the clock” when treating patients with ST-elevation myocardial infarction, “many physicians have been unwilling to risk having a difficult transradial case that would take too much time,” explained Dr. Grines, an interventional cardiologist at the Detroit Medical Center.
The video associated with this article is no longer available on this site. Please view all of our videos on the MDedge YouTube channel
For that and other reasons, American interventionalists have been “slow adopters” of the transradial approach, currently using it for about 20% of PCIs, compared with a worldwide rate of about 70%.
It may take instituting incentives to get U.S. cardiologists to change their practice, Dr. Grines suggested in an interview. That could involve increased reimbursement for PCIs done transradially, an increased allowance on acceptable door-to-balloon times for STEMI patients treated transradially, or imposition of new standards for quality assurance that mandate use of transradial in a certain percentage of PCI cases, she said.
The MATRIX study included a second, independent, prespecified analysis that compared outcomes in patients randomized to treatment with two different antithrombin drugs, either bivalirudin (Angiomax) or unfractionated heparin.
That part of the study showed that while treatment with either of the two drugs resulted in no statistically significant difference in the study’s two primary endpoints, treatment with bivalirudin led to statistically significant reductions in all-cause death and cardiovascular death, as well as in major bleeding events, compared with patients treated with unfractionated heparin (Lancet 2015 [doi:10.1016/S0140-6736(15)60292-6]).
Although bivalirudin has generally been the more commonly used antithrombin drug in this clinical setting by U.S. interventionalists in recent years, results reported last year from the HEAT-PCI trial (Lancet 2014;384:1849-58) that showed better outcomes with unfractionated heparin have led to reduced use of bivalirudin, Dr. Grines said.
The new results from MATRIX coupled with results from other trials that compared those drugs can make clinicians “more confident about the benefit of bivalirudin,” she said.
Dr. Grines has been a consultant to and received honoraria from the Medicines Company, which markets Angiomax, and from Abbott Vascular, Merck, and the Volcano Group.
On Twitter @mitchelzoler
EXPERT ANALYSIS FROM ACC 15
Pathway appears critical to HSC aging

in the bone marrow
Scientists say they’ve identified a molecular pathway that is critical to hematopoietic stem cell (HSC) aging and can be manipulated to rejuvenate blood.
The researchers found that HSCs’ ability to repair damage caused by inappropriate protein folding in the mitochondria is essential for the cells’ survival and regenerative capacity.
The discovery has implications for research on reversing the signs of aging, a process thought to be caused by increased cellular stress and damage.
“Ultimately, a cell dies when it can’t deal well with stress,” said study author Danica Chen, PhD, of the University of California, Berkeley.
“We found that by slowing down the activity of mitochondria in the blood stem cells of mice, we were able to enhance their capacity to handle stress and rejuvenate old blood. This confirms the significance of this pathway in the aging process.”
Mitochondria host a multitude of proteins that must be folded properly to function correctly. When the folding goes awry, the mitochondrial unfolded-protein response (UPRmt) kicks in to boost the production of specific proteins to fix or remove the misfolded protein.
There has been little research on the UPRmt pathway, but studies in roundworms suggest its activity increases when there is a burst of mitochondrial growth.
Dr Chen and her colleagues noted that adult stem cells are normally in a quiescent state with little mitochondrial activity. They are activated only when needed to replenish tissue.
At that time, the mitochondrial activity increases, and stem cells proliferate and differentiate. When protein-folding problems occur, this fast growth could lead to more harm.
Dr Chen’s lab stumbled upon the importance of UPRmt in HSC aging while studying sirtuins, a class of proteins recognized as stress-resistance regulators.
The researchers noticed that levels of one particular sirtuin, SIRT7, increase as a way to help cells cope with stress from misfolded proteins in the mitochondria. But SIRT7 levels decline with age.
“We isolated blood stem cells from aged mice and found that when we increased the levels of SIRT7, we were able to reduce mitochondrial protein-folding stress,” Dr Chen said. “We then transplanted the blood stem cells back into mice, and SIRT7 improved the blood stem cells’ regenerative capacity.”
The researchers also found that HSCs deficient in SIRT7 proliferate more. This faster growth is due to increased protein production and increased activity of the mitochondria, and slowing things down appears to be a critical step in giving cells time to recover from stress.
Dr Chen likened this to an auto accident or stalled car stopping traffic on a freeway.
“When there’s a mitochondrial protein-folding problem, there is a traffic jam in the mitochondria,” she said. “If you prevent more proteins from being created and added to the mitochondria, you are helping to reduce the jam.”
Until this study, it was unclear which stress signals regulate HSCs’ transition to and from the quiescent state and how that related to tissue regeneration during aging.
“Identifying the role of this mitochondrial pathway in blood stem cells gives us a new target for controlling the aging process,” Dr Chen said.
She and her colleagues described this work in Science. ![]()
Predicting pregnancy complications in SCD patients
Photo by Nina Matthews
Results of a new analysis may help physicians predict the likelihood of complications in pregnant women with sickle cell disease (SCD).
The research showed that pregnant women with SCD had an increased risk of stillbirth, pre-eclampsia, preterm delivery, having infants who were born small for their gestational age, and other adverse outcomes.
Women with severe SCD, but not those with milder SCD, had a substantially higher risk of mortality than their healthy peers.
Researchers reported these findings in Blood.
“While we know that women with sickle cell disease will have high-risk pregnancies, we have lacked the evidence that would allow us to confidently tell these patients how likely they are to experience one complication over another,” said study author Eugene Oteng-Ntim, MD, of the Guy’s and St. Thomas’ NHS Foundation Trust in London, England.
“This reality makes it difficult for us as care providers to properly counsel our sickle cell patients considering pregnancy.”
To better estimate pregnancy-related complications in women with SCD, Dr Oteng-Ntim and his colleagues examined 21 published observational studies.
The team analyzed data on 26,349 pregnant women with SCD and 26,151,746 pregnant women who shared attributes with the SCD population, such as ethnicity or location, but were otherwise healthy.
The researchers classified the SCD population based on genotype, including 1276 women with the classic form (HbSS genotype), 279 with a milder form (HbSC genotype), and 24,794 whose disease genotype was unreported (non-specified SCD).
Thirteen of the studies originated from high-income countries ($30,000 income per capita or greater), and the remaining were from low- to median-income countries.
Compared to women without SCD, patients with HbSS genotype had an increased risk of death, with a risk ratio (RR) of 5.98. Women with non-specified SCD had an increased risk of death as well, with an RR of 18.51. There was only 1 death among women who were known to have HbSC SCD.
There was an increased risk of stillbirth among women with SCD, compared to those without the disease. The RRs were 3.94 for HbSS disease, 1.78 for HbSC disease, and 3.49 for non-specified SCD.
The researchers found a significantly lower risk of maternal mortality (odds ratio [OR]=0.15) and stillbirth (OR=0.28) in SCD patients from countries with a gross national income of $30,000 or greater. But income had no significant impact on pre-eclampsia, preterm delivery, or infants being small for their gestational age.
Women with all types of SCD had an increase in the risk of pre-eclampsia, compared to healthy women. The RRs were 2.43 for HbSS disease, 2.03 for HbSC disease, and 2.06 for non-specified SCD.
Women with SCD also had an increased risk of preterm delivery. The RRs were 2.21 for HbSS disease, 1.45 for HbSC disease, and 1.59 for non-specified SCD.
And women with SCD were more likely to have infants who were born small for their gestational age. The RRs were 3.72 for HbSS disease, 1.98 for HbSC disease, and 2.23 for non-specified SCD.
Analyses revealed that genotype (HbSS vs HbSC) had a significant impact on stillbirth, preterm delivery, and small infants, but it did not appear to impact the risk of pre-eclampsia.
The researchers said this study provides useful estimates of the morbidity and mortality associated with SCD in pregnancy.
“By improving care providers’ ability to more accurately predict adverse outcomes, this analysis is a first step toward improving universal care for all who suffer from this disease,” Dr Oteng-Ntim concluded. ![]()
Drug granted orphan designation for GVHD
The European Commission has granted orphan drug designation for intravenous (IV) alpha-1 antitrypsin (AAT) to treat graft-versus-host disease (GVHD).
AAT is a protein derived from human plasma that has demonstrated immunomodulatory, anti-inflammatory, tissue-protective, antimicrobial, and anti-apoptotic properties.
AAT may attenuate inflammation by lowering levels of pro-inflammatory mediators such as cytokines, chemokines, and proteases associated with GVHD.
The European Commission granted IV AAT orphan designation based on preliminary clinical and preclinical research.
Orphan designation is granted to a medicine intended to treat a rare condition occurring in not more than 5 in 10,000 people in the European Union. The designation allows the drug’s maker to benefit from incentives such as a 10-year period of market exclusivity, reduced regulatory fees, and protocol assistance from the European Medicines Agency.
IV AAT also has orphan designation to treat GVHD in the US.
Studies of AAT
AAT is being investigated in a phase 1/2 study involving 24 patients with GVHD who had an inadequate response to steroid treatment. The patients are enrolled in 4 dose cohorts, in which they receive up to 8 doses of AAT.
Interim results from this study were presented at the 2014 ASH Annual Meeting (abstract 3927). Preliminary results indicated that continuous administration of AAT as therapy for steroid-resistant gut GVHD is feasible in the subject population.
Following AAT administration, the researchers observed a decrease in diarrhea, a decrease in intestinal AAT loss, and improvement in endoscopic evaluation. In addition, AAT administration suppressed serum levels of pro-inflammatory cytokines and interfered with GVHD biomarkers.
Investigators have also published research on AAT in Blood. This study suggested that AAT has a protective effect against GVHD and enhances graft-vs-leukemia effects.
Kamada Ltd., the company developing IV AAT, plans to begin a phase 3 trial of the treatment in 2016 and get the product to market in 2019 or later. ![]()
Team advocates liver MRI to measure iron
Magnetic resonance imaging (MRI) should be the gold standard for measuring liver iron concentration (LIC) in patients receiving ongoing transfusion therapy, according to a group of researchers.
The team found evidence suggesting that liver MRI is more accurate than liver biopsy in determining total body iron balance in patients with sickle cell disease and other disorders requiring regular blood transfusions.
The findings have been published in Magnetic Resonance Imaging.
“Measuring total body iron using MRI is safer and less painful than biopsy,” said study author John Wood, MD, PhD, of Children’s Hospital Los Angeles in California.
“In this study, we’ve demonstrated that it is also more accurate. MRI should be recognized as the new gold standard for determining iron accumulation in the body.”
Dr Wood and his colleagues came to this conclusion after analyzing data from 49 patients who were undergoing treatment with deferitazole, an experimental chelating agent.
The team looked at the amount of iron the patients were receiving by transfusion and the amount of chelating agent they consumed, providing insights into the expected changes in iron levels at 12, 24, and 48 weeks after the start of deferitazole.
To compare MRI and liver biopsy, the researchers used serial estimates of iron chelation efficiency (ICE) calculated by R2 and R2* MRI LIC estimates as well as by simulated liver biopsy (over all physically reasonable sampling variability).
The estimates suggested that MRI liver iron measurements (R2 and R2*) are more accurate than a physically realizable liver biopsy (which has a sampling error of 10% or higher).
For R2, the standard deviation of ICE was 44.8% at 12 weeks, 14.8% at 24 weeks, and 7.4% at 48 weeks. For R2*, the standard deviation was 22.9% at 12 weeks, 9.3% at 24 weeks, and 5.7% at 48 weeks.
For a biopsy with a sampling error of 0%, the standard deviation of ICE was 25.9% at 12 weeks, 12.8% at 24 weeks, and 6.7% at 48 weeks. For a biopsy with a sampling error of 10%, it was 32.8%, 16.5%, and 8.7%, respectively.
For a biopsy with a sampling error of 20%, the standard deviation of ICE was 49.1% at 12 weeks, 24.9% at 24 weeks, and 13% at 48 weeks. For a biopsy with a sampling error of 30%, it was 68.1%, 34.5%, and 18%, respectively. And for a biopsy with a sampling error of 40%, it was 88.1%, 44.6%, and 23.2%, respectively.
In practice, the accuracy of MRI compared to liver biopsy is likely even greater than these estimates suggest, Dr Wood said. ![]()
Ablation cuts AF recurrence 2.5-fold vs. amiodarone in heart failure
SAN DIEGO – Catheter ablation proved superior to amiodarone for treatment of persistent atrial fibrillation in patients with systolic heart failure in the randomized AATAC-AF trial.
The rate of the primary study endpoint – freedom from recurrent AF through 26 months of prospective follow-up– was 70% in the catheter ablation group, twice the 34% rate with amiodarone, Dr. Luigi Di Biase reported at the annual meeting of the American College of Cardiology. After covariate adjustment, the investigators found that recurrence was 2.5 times more likely in the patients treated with amiodarone.
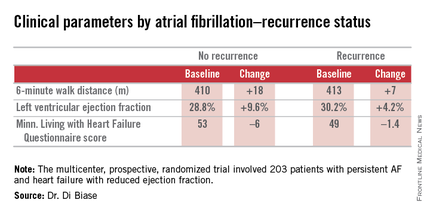
But he added a major caveat: pulmonary vein antrum isolation (PVI) alone was no better than the antiarrhythmic drug. The high overall treatment success rate seen with catheter ablation in the trial was achieved by operators who performed PVI plus some additional form of ablation of their own choosing, such as elimination of non–pulmonary vein triggers, ablation of complex fractionated electrograms, and/or additional linear ablation lesions, according to Dr. Di Biase, head of electrophysiology at the Albert Einstein College of Medicine, New York.
AATAC-AF (Ablation versus Amiodarone for Treatment of Atrial Fibrillation in Patients with Congestive Heart Failure and an Implanted ICD/CRTD) was a multicenter, prospective, randomized trial involving 203 patients with persistent AF and heart failure with reduced ejection fraction. Patients randomized to ablation had to receive PVI at a minimum; operators could perform additional ablation according to their preference. Twenty percent of patients randomized to ablation received PVI alone; 80% underwent additional posterior wall and non–pulmonary vein trigger ablation. The 26-month rate of freedom from recurrence of AF was 36% in patients who received PVI alone and 79% in those who underwent more extensive ablations. A particular strength of the AATAC study was that all participants had an implantable cardioverter-defibrillator and/or cardiac resynchronization therapy device, permitting detection of AF with a much higher degree of accuracy than possible in most AF ablation trials.
Any recurrent AF episodes during the first 3 months of follow-up were excluded from the analysis, regardless of whether patients were in the ablation or amiodarone arms, in accord with the 3-month blanking period that’s standard among electrophysiologists. Patients averaged 1.4 ablation sessions during the first 3 months of the trial.
Regardless of treatment, patients in whom AF did not recur showed significantly greater improvement in left ventricular ejection fraction, exercise capacity, and heart failure–related quality of life.
In addition, all-cause mortality during follow-up was significantly lower in the ablation group: 8%, compared with 18% in patients assigned to amiodarone. Moreover, the rate of hospitalization for arrhythmia or worsening heart failure was 31% in the ablation group versus 57% in patients on amiodarone. The economic implications of this sharp reduction in hospitalizations will be the subject of further study, according to Dr. Di Biase.
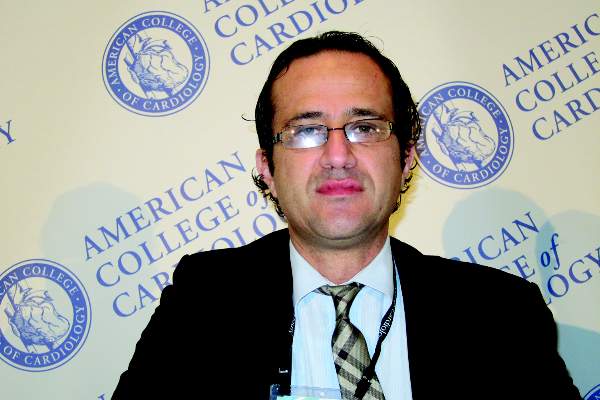
Also noteworthy was the finding that seven patients had to discontinue amiodarone due to serious side effects: four because of thyroid toxicity, two for pulmonary toxicity, and one owing to hepatic dysfunction, he continued.
Discussant Dr. Richard I. Fogel, current president of the Heart Rhythm Society, commented that “the 70% arrhythmia-free follow-up was a little surprising to me.”
“That seems a little bit high, particularly in a group with persistent atrial fibrillation,” observed Dr. Fogel, who is chief executive officer at St. Vincent Medical Group, Indianapolis.
Dr. Di Biase attributed the high success rate to two factors: One, only highly experienced operators participated in AATAC, and two, most of them weren’t content to stick to PVI alone.
“If you try to do a more extensive procedure addressing non–pulmonary vein triggers in other areas in the left atrium, the success rate is increased by far,” the electrophysiologist said.
As for a possible mechanism for the mortality benefit seen with ablation, “several studies have shown that in a population with heart failure with reduced ejection fraction, atrial fibrillation is an independent predictor of mortality,” Dr. Di Biase said. “So I believe that staying in sinus rhythm may have affected the long-term mortality. If you have a treatment that reduces the amount of time in atrial fibrillation, you may reduce mortality.”
While catheter ablation is an increasingly popular treatment strategy in patients with drug-refractory paroxysmal AF, it has been understudied in the setting of AF and comorbid heart failure. These two conditions are commonly coexistent, and they feed on each other in a destructive way: AF worsens heart failure, and heart failure tends to make AF worse.
AATAC was funded by the participating investigators and institutions without external financial support. Dr. Di Biase reported serving as a consultant to Biosense Webster and St. Jude Medical and serving as a paid speaker for Atricure, Biotronik, Medtronic, Boston Scientific, and Epi EP.
SAN DIEGO – Catheter ablation proved superior to amiodarone for treatment of persistent atrial fibrillation in patients with systolic heart failure in the randomized AATAC-AF trial.
The rate of the primary study endpoint – freedom from recurrent AF through 26 months of prospective follow-up– was 70% in the catheter ablation group, twice the 34% rate with amiodarone, Dr. Luigi Di Biase reported at the annual meeting of the American College of Cardiology. After covariate adjustment, the investigators found that recurrence was 2.5 times more likely in the patients treated with amiodarone.
But he added a major caveat: pulmonary vein antrum isolation (PVI) alone was no better than the antiarrhythmic drug. The high overall treatment success rate seen with catheter ablation in the trial was achieved by operators who performed PVI plus some additional form of ablation of their own choosing, such as elimination of non–pulmonary vein triggers, ablation of complex fractionated electrograms, and/or additional linear ablation lesions, according to Dr. Di Biase, head of electrophysiology at the Albert Einstein College of Medicine, New York.
AATAC-AF (Ablation versus Amiodarone for Treatment of Atrial Fibrillation in Patients with Congestive Heart Failure and an Implanted ICD/CRTD) was a multicenter, prospective, randomized trial involving 203 patients with persistent AF and heart failure with reduced ejection fraction. Patients randomized to ablation had to receive PVI at a minimum; operators could perform additional ablation according to their preference. Twenty percent of patients randomized to ablation received PVI alone; 80% underwent additional posterior wall and non–pulmonary vein trigger ablation. The 26-month rate of freedom from recurrence of AF was 36% in patients who received PVI alone and 79% in those who underwent more extensive ablations. A particular strength of the AATAC study was that all participants had an implantable cardioverter-defibrillator and/or cardiac resynchronization therapy device, permitting detection of AF with a much higher degree of accuracy than possible in most AF ablation trials.
Any recurrent AF episodes during the first 3 months of follow-up were excluded from the analysis, regardless of whether patients were in the ablation or amiodarone arms, in accord with the 3-month blanking period that’s standard among electrophysiologists. Patients averaged 1.4 ablation sessions during the first 3 months of the trial.
Regardless of treatment, patients in whom AF did not recur showed significantly greater improvement in left ventricular ejection fraction, exercise capacity, and heart failure–related quality of life.
In addition, all-cause mortality during follow-up was significantly lower in the ablation group: 8%, compared with 18% in patients assigned to amiodarone. Moreover, the rate of hospitalization for arrhythmia or worsening heart failure was 31% in the ablation group versus 57% in patients on amiodarone. The economic implications of this sharp reduction in hospitalizations will be the subject of further study, according to Dr. Di Biase.
Also noteworthy was the finding that seven patients had to discontinue amiodarone due to serious side effects: four because of thyroid toxicity, two for pulmonary toxicity, and one owing to hepatic dysfunction, he continued.
Discussant Dr. Richard I. Fogel, current president of the Heart Rhythm Society, commented that “the 70% arrhythmia-free follow-up was a little surprising to me.”
“That seems a little bit high, particularly in a group with persistent atrial fibrillation,” observed Dr. Fogel, who is chief executive officer at St. Vincent Medical Group, Indianapolis.
Dr. Di Biase attributed the high success rate to two factors: One, only highly experienced operators participated in AATAC, and two, most of them weren’t content to stick to PVI alone.
“If you try to do a more extensive procedure addressing non–pulmonary vein triggers in other areas in the left atrium, the success rate is increased by far,” the electrophysiologist said.
As for a possible mechanism for the mortality benefit seen with ablation, “several studies have shown that in a population with heart failure with reduced ejection fraction, atrial fibrillation is an independent predictor of mortality,” Dr. Di Biase said. “So I believe that staying in sinus rhythm may have affected the long-term mortality. If you have a treatment that reduces the amount of time in atrial fibrillation, you may reduce mortality.”
While catheter ablation is an increasingly popular treatment strategy in patients with drug-refractory paroxysmal AF, it has been understudied in the setting of AF and comorbid heart failure. These two conditions are commonly coexistent, and they feed on each other in a destructive way: AF worsens heart failure, and heart failure tends to make AF worse.
AATAC was funded by the participating investigators and institutions without external financial support. Dr. Di Biase reported serving as a consultant to Biosense Webster and St. Jude Medical and serving as a paid speaker for Atricure, Biotronik, Medtronic, Boston Scientific, and Epi EP.
AT ACC 15
Key clinical point: Catheter ablation is hands down more effective than amiodarone for the treatment of persistent atrial fibrillation in patients with systolic heart failure.
Major finding: The rate of freedom from recurrent atrial fibrillation during 26 months of follow-up was 70% in patients randomized to catheter ablation, compared with 34% in those assigned to amiodarone.
Data source: The AATAC-AF study was a multicenter, randomized, prospective clinical trial inc 203 patients.
Disclosures: The trial was funded by the participating investigators and institutions without commercial support. Dr. Di Biase reported serving as a consultant to Biosense Webster and St. Jude Medical and serving as a paid speaker for Atricure, Biotronik, Medtronic, Boston Scientific, and Epi EP.