User login
Limitations of Best Practice Alerts on Curbing Blood Transfusions
Clinical question: Why do providers continue to transfuse blood products outside of recommended guidelines, despite best practice alerts (BPAs)?
Background: There is evidence that a restrictive approach to blood transfusion versus a liberal approach is beneficial in reducing cost, morbidity, and mortality. It is unclear why providers continue to order transfusions outside of recommended guidelines in spite of interruptive prompts.
Study design: Retrospective cohort.
Setting: Academic, tertiary care medical care center in California.
Synopsis: Researchers reviewed 10,642 blood transfusion-triggered BPAs. The BPA led to abortion of only 2% of the transfusions in this study. From the predefined institutional accepted transfusion indication list, acute bleeding was the most common (34%), followed by protocol-driven behaviors in specialty services, i.e., stem cell transplant service.
“Other” accounted for 56% of the responses; of these, only 37% entered a free text comment elaborating on the reason to override. Symptomatic anemia was the most common indication cited for these blood transfusions, followed by peri-operative transfusion and anticipation of imminent discharge. The vast majority of providers who interacted with the BPA were resident physicians (55%).
The major limitation of this study is the substantial portion (>60%) of nonspecific “other” overrides.
Bottom line: Protocol-driven behaviors and subjective indications for transfusion, such as symptomatic anemia, are unlikely to be influenced by BPAs.
Peri-Operative Atrial Fibrillation, Long-Term Risk of Ischemic Stroke
Clinical question: Is there an association between peri-operative AF and long-term risk of ischemic stroke in patients undergoing any type of surgery?
Background: Peri-operative AF is usually viewed as a transient response to physiological stress, and the long-term risk of stroke after peri-operative AF is unclear. The incidence of peri-operative AF ranges widely, from 1% to 40%. Data are scarce regarding the long-term risk of stroke from peri-operative AF in patients undergoing various types of surgery.
Study design: Retrospective cohort.
Setting: Nonfederal California acute care hospitals.
Synopsis: The goal of this study was to evaluate the relationship between peri-operative AF and long-term post-operative ischemic stroke by measuring newly diagnosed AF during the index hospitalization among 1,729,360 adult patients who underwent inpatient cardiac and noncardiac surgeries between 2007 and 2010. The main outcome variable was ischemic stroke in any hospital discharge diagnosis, which was adjusted for age, sex, race, insurance status, and cardiovascular comorbidities (hypertension, diabetes mellitus, coronary heart disease, congestive heart failure, peripheral vascular disease, chronic kidney disease, and chronic obstructive pulmonary disease). Kaplan-Meier survival statistics were used to calculate cumulative rates of stroke after surgery; cumulative stroke rates were stratified by the CHA2DS2VASc score.
Of 1.73 million eligible patients with diagnoses of ischemic strokes after discharge from the index hospitalization for surgery, 24,711 had new-onset peri-operative AF during the index hospitalization, and 13,952 experienced a stroke after discharge.
At one year after hospitalization for cardiac surgery, cumulative rates of stroke were 0.99% in those with peri-operative AF and 0.83% in those without AF. At one year after noncardiac surgery, cumulative rates of stroke were 1.47% in those with peri-operative AF and 0.36% in those without AF.
In a Cox proportional hazards analysis accounting for potential confounders, peri-operative AF was associated with subsequent stroke after both cardiac and noncardiac surgery.
Bottom line: Among patients hospitalized for surgery, peri-operative AF was associated with an increased long-term risk of ischemic stroke, especially following noncardiac surgery.
Lower Health Literacy Contributes to Post-Discharge Medication Errors
Clinical question: What patient characteristics contribute to post-discharge medication errors?
Background: Post-discharge medication errors are common, but the characteristics of patients associated with those errors are not well understood.
Study design: Prospective study with patient data collected via baseline interview while hospitalized and then follow-up telephone calls at three, 30, and 90 days post discharge.
Setting: Vanderbilt Hospital, Nashville, Tenn.
Synopsis: Baseline information (race, ethnicity, education, marital status, income, social support, functional health literacy, cognition, self-rated health status, depression, preadmission medication adherence, and numeracy) was collected on adult hospitalized patients with acute coronary syndrome or acute decompensated heart failure. Post-discharge telephone interviews collected data on what medications (prescription and over the counter) patients were actually taking. Binomial logistic regression was used to determine patient characteristics that predicted discordance between the discharge medication list and the patient-reported list during the post-discharge medication review.
Of the 471 patients in the study (with a mean age of 59 years and mean total number of medications of 12), over half (51.4%) of patients were taking one or more discordant medications; 27.4% did not report a medication that was on their discharge list (omission); and 35.7% reported a medication that was not on their discharge list (commission). Further, over half (59.2%) of patients misunderstood an indication (i.e., clopidogrel is “for my stomach”), a dose, or a frequency.
Bottom line: Post-discharge medication errors are common. Lower health numeracy (the ability to use and understand numbers in daily life) and lower health literacy contributes to post-discharge medication errors.
Use, Interpretation of SpO2 Treatment for Pediatric Bronchiolitis Is Questioned
Clinical question: Does artificial elevation of pulse oximetry measurement in bronchiolitis patients during ED evaluations affect hospitalization rates?
Background: Bronchiolitis is the leading cause of hospitalization for infants younger than one year, leading to direct medical costs in the U.S. of $543 million in 2002. Compromised oxyhemoglobin saturation in bronchiolitis often leads to hospitalization and is assessed by pulse oximetry (SpO2) more commonly than by arterial blood gas (SaO2) due to ease, cost, and comfort considerations.
SpO2 can vary due to fever, acidosis, hemoglobinopathies, underperfusion, and poor probe placement. An American Academy of Pediatrics clinical practice guideline published in 2006 recommended supplemental oxygen if SpO2 drops below 90% in previously healthy infants, but the data supporting this cutoff are sparse.
Recommendations for supplemental oxygen, and thus hospitalization, are variable, with recommended minimum SpO2 ranging from 90 to 95%.
Study design: Single-center randomized, double-blind, parallel-group trial.
Setting: ED at 370-bed, urban, tertiary care children’s hospital.
Synopsis: Over a 50-month period, previously healthy infants aged four weeks to 12 months who were diagnosed with bronchiolitis in the ED and had initial triage SpO2 above 88% were enrolled by investigators. Subjects were excluded if severe respiratory distress, as measured by the Respiratory Distress Assessment Instrument (RDAI), or impending respiratory failure was present. Subjects were randomized to two groups: The control group had their true SpO2 displayed during their ED stay, and the intervention group had an SpO2 that was three points higher displayed. ED physicians were not aware of the primary hypothesis being tested. All subjects underwent concealed continuous oximetry for safety reasons, with monitors alarming if SpO2 dropped below 92%. Study nurses telephoned participants discharged home 72 hours after enrollment.
The primary outcome of hospitalization was defined as admission to an inpatient ward, hospital care provided for more than six hours in the ED if no hospital beds were available, or hospitalization after discharge if within 72 hours of enrollment. Secondary outcomes included supplemental oxygen administration, length of stay in the ED, and unscheduled return visits for bronchiolitis within 72 hours. Exploratory outcomes included delayed hospitalizations within 72 hours, active hospital treatment for more than six hours (with inhaled bronchodilators, oxygen, or intravenous fluids), and hospitalization at the index visit.
Of 1,812 patients assessed, 213 were randomized after exclusion criteria and consent. The “true” group and the “altered” group were similar in initial RDAI (8.0 vs. 8.3 respectively); 41% of children in the “true” oximetry group were hospitalized within 72 hours, compared with 25% in the “high” oximetry group (P 0.005). There were no significant differences in the secondary outcomes. The only exploratory outcome to show a significant difference was treatment for longer than six hours, with 37% of the “true group” receiving treatment for longer than six hours, compared to 20% of the “altered” group (P 0.01).
Bottom line: Perception of improved oxygenation based on falsely elevated SpO2 alone can reduce the inclination of a clinician to admit children with bronchiolitis. This brings into question the use and interpretation of SpO2 in treating children with bronchiolitis.
Citation: Schuh S, Freedman S, Coates A, et al. Effect of oximetry on hospitalization in bronchiolitis: a randomized clinical trial. JAMA. 2014;312(7):712-728.
Hospitalist Joshua Allen-Dicker, MD, MPH, Optimistic About Future of Hospital Medicine
As a young student and resident, Joshua Allen-Dicker, MD, MPH, was stunned to see the flip side of medicine—miscommunication, disenfranchised patients, unnecessary testing, and, worst of all, medical errors. But then he saw a cast of doctors working against that tide and realized he wanted to be one of them.
“I was shocked at the existence of these problems but struck by the fervor of those physicians who worked to build systems that promoted safe and effective care,” Dr. Allen-Dicker says. “More often than not, these physicians were hospitalists. I was inspired to learn more about hospital medicine. I found that the core skills of the hospitalist—teamwork, problem-solving, communication, and leadership—were key areas that I wanted to develop.”

And so he has. Dr. Allen-Dicker recently joined the division of general medicine and primary care at Beth Israel Deaconess Medical Center in Boston. He’s also an instructor in medicine at Harvard Medical School and was previously in the division of hospital medicine at Icahn School of Medicine at Mount Sinai in New York City. He is a member of SHM’s Physicians in Training Committee, is on the faculty for HM15 in Washington, D.C., and is scheduled to speak as part of the new Young Hospitalists track.
Dr. Allen-Dicker, one of six new members of Team Hospitalist, The Hospitalist’s volunteer editorial advisory group, clearly loves his chosen profession. But as a young doctor in HM, a specialty that is itself often described as being in its adolescence, he admits there is one irksome question he hears a lot.
Hospitalists can be residency program directors, hospital administrators, important academics, lauded teachers, and even the CMO of Medicare. None of those things are possible without first being a good clinical hospitalist, which is what I’m focusing on right now.–Dr. Allen-Dicker
“I struggle with the question, ‘So what do you want to be when you grow up?’” he says. “Hospital medicine is a young field, and many patients, families, and occasionally some older physicians are not aware that [it] is a long-term career option. As hospitalists continue to demonstrate leadership in clinical care, academics, and education, this question will fade away.”
Question: What’s the best advice you ever received?
Answer: Just be yourself. People are exceptionally skilled at identifying when you’re not being authentic with them.
Q: What’s the worst advice you ever received?
A: Just be yourself. People rarely get things consistently right in healthcare without the right training. I say, “Be yourself, but practice first.”
Q: Did you have a mentor during training?
A: It wasn’t until I moved to New York City for my hospitalist position that I clearly saw how much I owed my residency mentors. I recognized that, with each interaction we have—with nurses, patients, families, other physicians—we make a decision about what kind of doctor we are going to be that day. For me, choosing to channel little parts of my mentors made my move to a new city less lonely and helped me to figure out how to be the doctor I wanted to be. ‘How would Tony answer that question? What would Anjala do right now?’ And if I didn’t know the answer, I acted as if there were someone who might want to channel me someday.
Q: Have you tried to mentor others?
A: There is a new generation of future hospitalists—students who never experienced a hospital without hospitalists and young physicians who have known they wanted a career in hospital medicine since beginning medical school. They are hungry for guidance and eager to be engaged. We are starting a hospital medicine interest group at my hospital to help create a formal pathway for those interested in hospital medicine mentorship. I am really excited about this project.
Q: What’s the biggest change you would like to see in HM?
A: I’m interested to see how hospital medicine engages students and trainees who are interested in hospital medicine. How we educate them, and how much we allow them to educate and change us, will be a defining issue as hospital medicine comes of age.
Q: What aspect of teaching in the 21st century is most difficult? And, what is most enjoyable?
A: As technology becomes increasingly integrated into healthcare and education, there are so many different modalities for engaging learners. Picking a topic and learning points is easy—picking how to teach it is the tough part! Seeing learners take knowledge you’ve imparted—whether it relates to management of renal failure, high-value care, or the patient experience—and put it into clinical practice is amazing.
Q: What is your biggest professional reward?
A: Remaining open to new ideas is a challenge and reward. It’s easy to get caught up in “this is the way we’ve always done this and thought about this.” For me, part of trying to become a better doctor means learning something new each day. I don’t always succeed, but it feels so good when I do.
Q: What SHM event has made the most lasting impression on you?
A: My first national HM conference as a PGY-2 resident. It was an amazing and energizing feeling to sit in the large plenary session with 3,000 hospitalists. I thought to myself, ‘This is a movement that is changing healthcare. I want in.’
Q: Where do you see yourself in 10 years?
A: One of the great things about hospital medicine is how flexible it can be as a career choice. Hospitalists can be residency program directors, hospital administrators, important academics, lauded teachers, and even the CMO of Medicare. None of those things are possible without first being a good clinical hospitalist, which is what I’m focusing on right now.
Q: What impact do you feel devices like smartphones and tablets have had on HM?
A: It’s amazing to see how much bottom-up innovation Apple and Google have inspired with their products. Without waiting for large, hospital-wide investments (e.g. electronic health records), physicians, start-ups, and patients are empowering themselves and changing healthcare. I would just recommend avoiding the mentality that every problem can be solved by buying patients/physicians/staff an iPad. Technology is not a substitute for well-designed healthcare delivery systems.
Richard Quinn is a freelance writer in New Jersey.
As a young student and resident, Joshua Allen-Dicker, MD, MPH, was stunned to see the flip side of medicine—miscommunication, disenfranchised patients, unnecessary testing, and, worst of all, medical errors. But then he saw a cast of doctors working against that tide and realized he wanted to be one of them.
“I was shocked at the existence of these problems but struck by the fervor of those physicians who worked to build systems that promoted safe and effective care,” Dr. Allen-Dicker says. “More often than not, these physicians were hospitalists. I was inspired to learn more about hospital medicine. I found that the core skills of the hospitalist—teamwork, problem-solving, communication, and leadership—were key areas that I wanted to develop.”
And so he has. Dr. Allen-Dicker recently joined the division of general medicine and primary care at Beth Israel Deaconess Medical Center in Boston. He’s also an instructor in medicine at Harvard Medical School and was previously in the division of hospital medicine at Icahn School of Medicine at Mount Sinai in New York City. He is a member of SHM’s Physicians in Training Committee, is on the faculty for HM15 in Washington, D.C., and is scheduled to speak as part of the new Young Hospitalists track.
Dr. Allen-Dicker, one of six new members of Team Hospitalist, The Hospitalist’s volunteer editorial advisory group, clearly loves his chosen profession. But as a young doctor in HM, a specialty that is itself often described as being in its adolescence, he admits there is one irksome question he hears a lot.
Hospitalists can be residency program directors, hospital administrators, important academics, lauded teachers, and even the CMO of Medicare. None of those things are possible without first being a good clinical hospitalist, which is what I’m focusing on right now.–Dr. Allen-Dicker
“I struggle with the question, ‘So what do you want to be when you grow up?’” he says. “Hospital medicine is a young field, and many patients, families, and occasionally some older physicians are not aware that [it] is a long-term career option. As hospitalists continue to demonstrate leadership in clinical care, academics, and education, this question will fade away.”
Question: What’s the best advice you ever received?
Answer: Just be yourself. People are exceptionally skilled at identifying when you’re not being authentic with them.
Q: What’s the worst advice you ever received?
A: Just be yourself. People rarely get things consistently right in healthcare without the right training. I say, “Be yourself, but practice first.”
Q: Did you have a mentor during training?
A: It wasn’t until I moved to New York City for my hospitalist position that I clearly saw how much I owed my residency mentors. I recognized that, with each interaction we have—with nurses, patients, families, other physicians—we make a decision about what kind of doctor we are going to be that day. For me, choosing to channel little parts of my mentors made my move to a new city less lonely and helped me to figure out how to be the doctor I wanted to be. ‘How would Tony answer that question? What would Anjala do right now?’ And if I didn’t know the answer, I acted as if there were someone who might want to channel me someday.
Q: Have you tried to mentor others?
A: There is a new generation of future hospitalists—students who never experienced a hospital without hospitalists and young physicians who have known they wanted a career in hospital medicine since beginning medical school. They are hungry for guidance and eager to be engaged. We are starting a hospital medicine interest group at my hospital to help create a formal pathway for those interested in hospital medicine mentorship. I am really excited about this project.
Q: What’s the biggest change you would like to see in HM?
A: I’m interested to see how hospital medicine engages students and trainees who are interested in hospital medicine. How we educate them, and how much we allow them to educate and change us, will be a defining issue as hospital medicine comes of age.
Q: What aspect of teaching in the 21st century is most difficult? And, what is most enjoyable?
A: As technology becomes increasingly integrated into healthcare and education, there are so many different modalities for engaging learners. Picking a topic and learning points is easy—picking how to teach it is the tough part! Seeing learners take knowledge you’ve imparted—whether it relates to management of renal failure, high-value care, or the patient experience—and put it into clinical practice is amazing.
Q: What is your biggest professional reward?
A: Remaining open to new ideas is a challenge and reward. It’s easy to get caught up in “this is the way we’ve always done this and thought about this.” For me, part of trying to become a better doctor means learning something new each day. I don’t always succeed, but it feels so good when I do.
Q: What SHM event has made the most lasting impression on you?
A: My first national HM conference as a PGY-2 resident. It was an amazing and energizing feeling to sit in the large plenary session with 3,000 hospitalists. I thought to myself, ‘This is a movement that is changing healthcare. I want in.’
Q: Where do you see yourself in 10 years?
A: One of the great things about hospital medicine is how flexible it can be as a career choice. Hospitalists can be residency program directors, hospital administrators, important academics, lauded teachers, and even the CMO of Medicare. None of those things are possible without first being a good clinical hospitalist, which is what I’m focusing on right now.
Q: What impact do you feel devices like smartphones and tablets have had on HM?
A: It’s amazing to see how much bottom-up innovation Apple and Google have inspired with their products. Without waiting for large, hospital-wide investments (e.g. electronic health records), physicians, start-ups, and patients are empowering themselves and changing healthcare. I would just recommend avoiding the mentality that every problem can be solved by buying patients/physicians/staff an iPad. Technology is not a substitute for well-designed healthcare delivery systems.
Richard Quinn is a freelance writer in New Jersey.
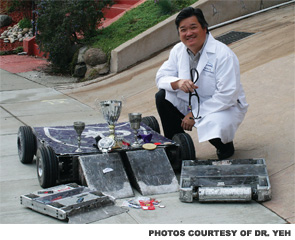
Hospitalist Energized by Designing, Building Fighting Robots After Hours
“The box is locked, the lights are on. It’s robot fighting time. Sewer Snake charges first. He’s lifting Ragin Scotsman high in the air. Ragin Scotsman manages to escape his death grip and slams Sewer Snake against the wall. Oh no! His front wheel just fell off!”
Jim Yeh, DO, has better things to do with his spare time than watch TV or play golf. For the past dozen years, he has been designing and building robots that fight other robots at events that attract techies nationwide.
It all started harmlessly, when he and his six-year-old son, Forrest, were watching a comedy sketch on TV featuring battling robots. When Forrest suggested they build robots together, Dr. Yeh reluctantly agreed.
Since then, he has enjoyed crushing his opponents. Destroying them, actually. He’s entered his robots in more than 20 events and has placed 10 times, winning ribbons, medals, and international recognition.
“We’d always heard of these secret robot fights that go on in local warehouses,” says Dr. Yeh, president at Alameda Inpatient Medical, a 10-hospitalist group in Alameda, Calif. “I’ve always been interested in building things you can destroy.”
Sounds a bit ironic for a physician who has dedicated his life to healing people. But when it comes to nuts, bolts, and titanium, let the fights begin.
Big, Bad, and Bold
Over the past decade, Dr. Yeh has designed and built five robots in his garage, learning his newfound trade from books, other builders, and more recently, the Internet. His first robot took six months to build, he says. Named Robo Master by his son, it had a titanium shell, four-wheel drive, and was strong enough to lift 300 pounds.
Unfortunately, Robo Master made the ultimate sacrifice. During its very first fight, it was slammed against a wall. Its death was premature but quick. It did not suffer. Its body parts were later donated to science—actually, to other robots built by Dr. Yeh.
Several of Dr. Yeh’s robots are still very much alive, however.
At 30 pounds, “The Bully” is considered a featherweight and ranked second in its weight class in the world by BotRank.com. With help from his dad, Forrest drives the robot during events, controlling it remotely.
To encourage his wife, Buffy, to join in the family fun, Dr. Yeh built a 60-pound robot for her in 2004; named “Come To Mama,” the robot is now ranked 22nd in the world in its weight class. It features a drum that spins about 2,000 RPMs and has placed first, second, and third in various competitions.
“She tried driving it but didn’t like it,” says Dr. Yeh, explaining that a robot’s performance in the ring is based 10% on robot, 90% on driver. “But how else was I going to convince my wife to let me build a big toy?”
Building such toys isn’t exactly cheap. While Dr. Yeh says the price of each of his robots was in the four-figure range, he knows other builders who equate their cost to a college education.
Dr. Yeh’s latest prodigy is called “Ragin Scotsman.” At 220 pounds, this heavyweight stands about 10 inches tall and is roughly 2.5 square feet. When his son was a member of his high school’s robotics club, he grew tired of the featherweight division and wanted to fight a bigger robot.
Ragin Scotsman is, indeed, bigger and badder. Built in 2011, its superpowers would intimidate Ironman. According to Dr. Yeh, it has the “acceleration of a race car and the aggressiveness of a bulldog.” It can get under its opponents and forcibly throw them against the wall. Not to mention its flame thrower, which can melt their electronics.
At one 2012 event, the Science Channel was filming fights for a new show called “Killer Robots.” Initially, Ragin Scotsman wasn’t one of the stars; however, after the producer watched its aggressiveness and, of course, its flame-throwing ability, Ragin Scotsman was filmed fighting other robots.
Despite its toughness, Dr. Yeh says this robot rarely beats top-ranked rivals, “Sewer Snake” and “Original Sin.”
“These robots are very talented,” he says, adding that they have fought over 100 times. “Ragin Scotsman probably has 40 fights under its belt. Every time we fight, we will win one out of four fights against them.”
He says drivers must learn to anticipate the other drivers’ moves, which takes practice. Some of his friends analyze each fight, studying driver habits so they can predict maneuvers. For example, after every hit, one driver may always signal his robot to turn left.
For the most part, he believes good drivers are able to “negotiate that sweet [vulnerable] spot” before destroying the other robot. He refers to some robots as one-hit wonders. After performing the single task they were designed to do, they have nothing new to offer and end up losing.
Break ‘Em, Build ‘Em
Win or lose, what attracts Dr. Yeh to the hobby is the engineering, building, and camaraderie. He says the robotics community is one big, happy family. Even if his robot gets destroyed, friends will help him rebuild it so it can later fight other robots, including their own.
There may be one more robot in Dr. Yeh’s future. Although he hasn’t made any commitments, he envisions that it would involve pneumatics, using pressurized gas to lift or flip challenging robots on their heads or vault them against walls.
Until then, Dr. Yeh keeps asking himself one question—how can he use his mechanical, engineering, and electrical talent in medicine?
“I’m still trying to figure out if there’s a connection between the two,” he says. “Where’s the bridge?”
Regardless of the outcome, he’ll continue enjoying this hobby. Unlike his day job, he says this is one activity where no one demands anything from him.
Carol Patton is a freelance writer in Las Vegas.
How to Use Hospitalist Productivity, Compensation Survey Data
The 2014 State of Hospital Medicine report (SOHM), published by SHM in the fall of even years, is unquestionably the most robust and informative data available to understand the hospitalist workforce marketplace. And if you are the person who returned a completed survey for your practice, you get a free copy of the report mailed to you.
Keep in mind that the Medical Group Management Association (MGMA) surveys and reports data on hospitalist productivity and compensation every year. And the data acquired by MGMA in even years is simply folded into the SOHM, along with a ton of additional information added by a separate SHM survey, including things like the amount of financial support provided to hospitalist groups by hospitals (now up to a median of $156, 063 per full-time equivalent, or FTE).
I’ve written previously about some of the ways that the data reported in both of these surveys can be tricky to interpret (September 2013 and October 2013), and in this column I’ll go a little deeper into how to use the data reported on number of shifts worked and productivity.
A Common Question
Assume that, to address a staffing shortage or simply as a way to boost their income, some of the doctors in your group are willing to work more shifts than required for full-time status. And, in your group, some portion of a doctor’s compensation is a function of their individual work relevant value unit (wRVU) productivity—for example, a bonus for wRVUs above a certain threshold. You want to know whether the wRVU productivity generated by a doctor on their extra shifts should factor into compensation the same way it does for “regular” shifts.
You might turn to the MGMA and SOHM surveys to see how other groups handle this issue. But here is where it gets tricky.
First, you need to realize that the MGMA surveys, and similar ones from the American Medical Group Association and others, report wRVUs and compensation per physician, not per FTE. So wRVUs generated by these doctors on extra shifts are included, and you can’t tell from the aggregate data what portion of wRVUs came from regular shifts and what portion came from extra shifts.
And it is critical to keep in mind that any doctor who works at least 0.8 FTE as defined by that particular practice is reported as full time. Those working 79% or less of full time are counted by MGMA as part time.
To summarize: The MGMA and similar surveys don’t provide data on wRVU productivity per FTE, even though in most cases that is how everyone describes the data. Instead, the surveys provide data per individual doctor, many of whom work more or less than 1.0 FTE. So, despite the fact that most people, including me, tend to quote data from the surveys as though it is per FTE, as in “The 2014 MGMA data shows median hospitalist compensation is $253,977 per FTE,” we should say “per doctor” instead.
Theoretically, doctors working slightly less than 1.0 FTE should offset the doctors working slightly more than 1.0 FTE. But, while I think that’s a reasonable assumption for most specialties, such a significant portion of hospitalist groups have had chronic staffing shortages that a lot of hospitalists across the country are working extra shifts, probably more than are working between 0.8 and 1.0 FTE. So the hospitalist survey wRVU data is probably at least a little higher than it would be if it were reported per FTE.
Unfortunately, there is no way to confirm my suspicion, because MGMA doesn’t allow any individual doctor to be reported as more than 1.0 FTE, even if he works far more shifts than the number that defines full time for that practice. In other words, extra shifts just aren’t accounted for in the MGMA survey.
Implications of Individual vs. FTE
For most purposes, it probably doesn’t make any difference if you are erroneously thinking about the compensation and productivity survey numbers on a per FTE basis. But, for some purposes, and for those who work significantly more shifts than most hospitalists, it can start to matter.
Now back to the original question. You’re thinking about whether wRVUs generated by the doctors in your group on extra shifts should count toward the wRVU bonus just like those generated on regular shifts. You’d like to handle this the same way as other groups, but, unfortunately, survey data just isn’t helpful here. You’ll have to decide this for yourself.
I think some, but probably not all, extra shift productivity should count toward your wRVU bonus. You might, for example, say that productivity for somewhere between three or five extra shifts per quarter—that’s totally arbitrary, and of course this would be a negotiation between you and hospital leadership—should count toward the productivity target, and the rest wouldn’t, or that those extra shifts above an agreed-upon number would result in an increase in the wRVU target. The biggest problem with this is that it would be a nightmare to administer—essentially impossible for many practices. But you could accomplish the same thing by including the first few shifts per quarter in the “base” FTE calculation and then, after that, adjusting each person’s FTE value up as they work more shifts.
One more thing about productivity targets…
It’s also important to remember that productivity targets make the most sense at the group—not the individual—level. The MGMA data includes hospitalists who work night shifts (including nocturnists) and doctors who work low-production shifts (i.e., pager or ED triage shifts), as well as daytime rounding doctors. So, if you have a doctor who only works days, you would expect him to generate wRVUs in excess of the global target of wRVUs per FTE to make up for the low-productivity shifts that other doctors have to work.
For example, your practice might decide the group as a whole is expected to generate the MGMA yearly median 4,298 wRVUs per doctor, multiplied by the number of FTEs in the group. But the nocturnists would be expected to generate fewer, while those who work most or all of their shifts in a daytime rounder would be expected to generate more. So the threshold to begin paying the wRVU bonus for daytime rounding doctors might be adjusted up to something like 4,500 wRVUs.
The above example is just as an illustration, of course, and there are all kinds of reasons it might be more appropriate to choose different thresholds for your practice. But it’s a good place to start the thinking.
Elderly Patient Care Guide Goes Beyond Textbooks, Treatment Guidelines

Summary
Older patients comprise an increasingly large part of the population we serve as hospitalists. We are all very familiar with the standard medical problems—congestive heart failure, COPD, or stroke—that these individuals present to us in the inpatient setting; however, this patient population has special needs and challenges that often are inadequately covered in textbooks and treatment guidelines.
The Hospitalists’ Guide to the Care of Older Patients serves as an excellent guide for the day-to-day management of geriatric patients. All 13 of its chapters are written in a concise, to-the-point style. The authors have a sound understanding of the needs and challenges of today’s practicing hospitalists.
The authors focus entire chapters on geriatric assessment and exam and communication with older patients. They remind hospitalists to be aware that these patients need a thoughtful approach in our interactions, because vision, hearing, or cognition might be impaired.
The 269-page book provides a great overview on decision making and decision-making capacity (DMC). Patients might have partial DMC, in spite of cognitive impairment or neurological or psychiatric illness. Surrogate decision makers and their limitations also are discussed.
One chapter is dedicated to end-of-life care, with special attention to debility and dementia.
Another major focus is geriatric pharmacotherapy and polypharmacy in the elderly. Attention is given to the fact that drug studies frequently fail to include the elderly and that pharmacokinetics may be significantly altered in this population. The chapter includes a table of “high-risk meds” prescribed by hospitalists.
Delirium and management of behavioral disturbances are described in two chapters and include very helpful tables to guide in its treatment.
The authors also review nutrition management, including a customized approach to patients with dysphagia at risk for aspiration and managing complex medical patients with hip fractures, including pre-op evaluation, post-op care, pain management, and delirium. Narcotic pain medications are of obvious concern in the elderly, but it is pointed out that uncontrolled pain in itself can cause delirium.
Special attention is given to mobility and fall risk, as well as prevention strategies, in hospitalized patients.
Pressure ulcers are a concern in all patients but especially the elderly. This guide outlines mechanisms of ulcer formation, staging, and treatment options.
The book concludes with a chapter on transitional care planning for a safe discharge. It describes potential risks for errors and poor handoffs, including failure to adequately communicate complex discharge plans to elderly patients.
Analysis
The Hospitalists’ Guide to the Care of Older Patients is an excellent, hands-on manual for managing elderly patients. It describes standard situations frequently encountered by hospitalists and provides pertinent information that can be acted upon.
Written with a genuine understanding of what matters most for hospitalists in their daily practice, the chapters are focused and concise enough to serve as a quick reference, yet detailed enough to supply the hospitalist with sufficient information to be able to put a patient management plan into action.
After reading this book, hospitalists will have a solid and rational basis for the thoughtful and effective management of elderly patients.
Dr. Suehler is a hospitalist with Midwest Internal Medicine Hospitalists at Mercy Hospital in Coon Rapids, Minn., and a member of Team Hospitalist since 2013.

HIV doesn’t hinder lymphoma patients’ response to ASCT

a cultured lymphocyte
Credit: CDC
SAN FRANCISCO—Patients with HIV-related lymphoma (HRL) should not be excluded from clinical trials of autologous stem cell transplant (ASCT) due to their HIV status, new research suggests.
Investigators found no significant difference in rates of treatment failure, disease progression, or survival between transplant-treated historical controls who had lymphoma but not HIV and patients with HRL who received the modified BEAM regimen followed by ASCT on a phase 2 trial.
This suggests patients with chemotherapy-sensitive, relapsed/refractory HRL can be treated successfully with the modified BEAM regimen, said study investigator Joseph Alvarnas, MD, of City of Hope National Medical Center in Duarte, California.
“Patients with treatment-responsive HIV infection and HIV-related lymphoma should be considered candidates for autologous transplant if they meet standard transplant criteria,” he added. “And we would argue that exclusion from clinical trials on the basis of HIV infection alone is no longer justified.”
Dr Alvarnas presented this viewpoint and the research to support it at the 2014 ASH Annual Meeting as abstract 674.
The trial enrolled 43 patients with treatable HIV-1 infection, adequate organ function, and aggressive lymphoma. Three patients were excluded because they could not undergo transplant due to lymphoma progression.
Of the 40 remaining patients, 5 were female, and their median age was 46.9 years (range, 22.5-62.2). They had diffuse large B-cell lymphoma (n=16), plasmablastic lymphoma (n=2), Burkitt/Burkitt-like lymphoma (n=7), and Hodgkin lymphoma (n=15).
The pre-ASCT HIV viral load was undetectable in 31 patients. In the patients with detectable HIV, the median viral load pre-ASCT was 84 copies/μL (range, 50-17,455). The median CD4 count was 250.5/µL (range, 39-797).
Before transplant, 30 patients (75%) were in complete remission, 8 (20%) were in partial remission, and 2 (5%) had relapsed/progressive disease.
The patients underwent ASCT after conditioning with the modified BEAM regimen—carmustine at 300 mg/m2 (day -6), etoposide at 100 mg/m2 twice daily (days -5 to -2), cytarabine at 100 mg/m2 (days -5 to -2), and melphalan at 140 mg/m2 (day -1).
Combination antiretroviral therapy (cART) was held during the preparative regimen and resumed after the resolution of gastrointestinal toxicity. The investigators switched efavirenz to an alternative agent 2 or more weeks prior to the planned interruption of cART, as the drug has a long half-life. And AZT was prohibited due to its myelosuppressive effects.
Treatment results
The median follow-up was 24 months. At 100 days post-transplant, the investigators assessed 39 patients for response. One patient was not evaluable due to early death.
Thirty-six of the patients (92.3%) were in complete remission, 1 (2.6%) was in partial remission, and 2 (5.1%) had relapsed or progressive disease.
Fifteen patients reported grade 3 or higher toxicities within a year of transplant. Of the 13 unexpected grade 3-5 adverse events (reported in 9 patients), 5 were infection/sepsis, 1 was acute appendicitis, 1 was acute coronary syndrome, 2 were deep vein thromboses, 2 were gastrointestinal toxicities, and 2 were metabolic abnormalities.
Seventeen patients reported at least 1 infectious episode, 42 events in total, 9 of which were severe. Fourteen patients required readmission to the hospital after transplant.
Within a year of transplant, 5 patients had died—3 from recurrent/persistent disease, 1 due to a fungal infection, and 1 from cardiac arrest. Two additional patients died after the 1-year mark—1 of recurrent/persistent disease and 1 of heart failure.
At 12 months, the rate of overall survival was 86.6%, progression-free survival was 82.3%, progression was 12.5%, and non-relapse mortality was 5.2%.
“In order to place this within context, we had the opportunity to compare our patient experience with 151 matched controls [without HIV] from CIBMTR,” Dr Alvarnas said. “Ninety-three percent of these patients were actually transplanted within 2 years so that they were the time-concordant group, and they were matched for performance score, disease, and disease stage.”
The investigators found no significant difference between their patient group and the HIV-free controls with regard to overall mortality (P=0.56), treatment failure (P=0.10), progression (P=0.06), and treatment-related mortality (P=0.97).
Likewise, there was no significant difference in overall survival between the HRL patients and controls—86.6% and 87.7%, respectively (P=0.56). And the same was true of progression-free survival—82.3% and 69.5%, respectively (P=0.10). ![]()
Maintenance prolongs PFS, not OS, in relapsed CLL

Credit: Linda Bartlett
SAN FRANCISCO—Maintenance therapy with the anti-CD20 monoclonal antibody ofatumumab improves progression-free survival (PFS), but not overall survival (OS), in patients with relapsed chronic lymphocytic leukemia (CLL), according to an interim analysis of the PROLONG study.
The median PFS was about 29 months in patients who received ofatumumab and about 15 months for patients who did not receive maintenance (P<0.0001).
But there was no significant difference in the median OS, which was not reached in either treatment arm.
Marinus H.J. van Oers, MD, PhD, of the Academisch Medisch Centrum and HOVON in Amsterdam, The Netherlands, reported these results at the 2014 ASH Annual Meeting (abstract 21*). The study was sponsored by GlaxoSmithKline, makers of ofatumumab.
“[A]s of 2014, still we cannot say that we are able to cure CLL,” Dr van Oers noted. “And CLL is characterized by decreasing response duration with subsequent lines of treatment. In this respect, but also a number of other respects, there are similarities in biological behavior between CLL and follicular lymphoma.”
“There is definitely a role—although it’s somewhat debated—for maintenance treatment in follicular lymphoma. Therefore, it is rational to explore safe and effective maintenance treatment in CLL as well.”
To that end, Dr van Oers and his colleagues compared ofatumumab maintenance to observation in patients who were in remission after induction treatment for relapsed CLL. The team enrolled 474 patients who were in complete or partial remission after their 2nd- or 3rd-line treatment for CLL.
Patients were randomized to observation (n=236) or to receive ofatumumab (n=238) at 300 mg, followed 1 week later by 1000 mg every 8 weeks for up to 2 years. Patients on ofatumumab also received premedication with acetaminophen, antihistamine, and glucocorticoid.
The patients were stratified by the number and type of prior therapy, as well as remission status after induction treatment, and baseline characteristics were similar between the two treatment arms.
“The median age was about 65, and about 30% of patients were older than 70 years,” Dr van Oers noted. “[There was] a male preponderance, as you would expect, and the time since diagnosis was somewhere between 5 and 6 years.”
“Most patients were in [partial response], actually 80%, and most patients had received 2 prior regimens, about 70%. As for prior treatments, 80% of patients had received effective immuno-chemotherapy.”
“In both arms, there were only a few patients with unfavorable cytogenetics—11q and 17p deletion. [As for] β2 microglobulin, two-thirds [of patients in both arms] had low levels. And, in both arms, there were almost twice as many IGVH-mutated as unmutated patients.”
Patient outcomes
The median follow-up was 19.1 months. The study’s primary endpoint was PFS, which was defined as the time from randomization to the date of disease progression or death from any cause.
The median PFS was significantly longer in the ofatumumab arm than in the observation arm, at 29.4 months and 15.2 months, respectively (hazard ratio [HR]=0.50; P<0.0001).
Similarly, the time to the start of patients’ next therapy was significantly longer in the ofatumumab arm than in the in observation arm—a median of 38 months and 31.1 months, respectively (HR=0.66, P=0.108).
However, there was no significant difference in OS, which was not reached in either arm (HR=0.85, P=0.4877).
Adverse events (AEs) occurred in 86% of patients in the ofatumumab arm and 72% of patients in the observation arm (P<0.001). Sixty percent of AEs were considered related to ofatumumab. None of the AEs led to study withdrawal.
Grade 3 or higher AEs occurred in 46% of patients in the ofatumumab arm and 28% in the observation arm. They included neutropenia (24% and 10%, respectively; P<0.001), infections (13% and 8%, respectively), thrombocytopenia (2% and 3%, respectively), and infusion-related reactions (1% and 0%, respectively).
There were 5 deaths in the observation arm—1 due to progression and 4 due to causes other than progression, infection, or secondary malignancy. There were 2 deaths in the ofatumumab arm—1 due to infection/sepsis and 1 due to an “other” cause.
“So based on this planned interim analysis, we can conclude that ofatumumab maintenance in relapsed CLL results in a highly significant and clinically meaningful improvement of progression-free survival,” Dr van Oers said in closing.
“It significantly prolongs time to next treatment, it’s well-tolerated, and it’s associated with an adverse event profile which is quite characteristic of anti-CD20 monoclonal antibodies.” ![]()
*Information in the abstract differs from that presented at the meeting.