User login
Ramelteon Reduces Risk of Delirium in Hospitalized Patients
Clinical question
Does ramelteon, a melatonin agonist, prevent delirium in hospitalized patients?
Bottom line
In this small, single-blinded study, ramelteon was shown to be effective in preventing delirium in elderly patients who required hospitalization for acute illness. You would have to treat 3 patients with ramelteon to prevent one episode of delirium. (LOE = 1b)
Reference
Study design
Randomized controlled trial (single-blinded)
Funding source
Government
Allocation
Concealed
Setting
Inpatient (any location)
Synopsis
Using concealed allocation, these investigators randomized 67 hospitalized patients (24 admitted to intensive care units, 43 admitted to general wards) to receive either ramelteon 8 mg or placebo nightly up to 7 days or until the onset of delirium. Eligible patients were 65 years to 89 years old, were admitted to the hospital via the emergency department, were able to take oral medications, and had an expected length of stay of greater than 48 hours. Patients with psychiatric disorders, severe liver disease, Lewy body disease, or alcohol dependency were excluded. Nurses provided similar delirium prevention care to all patients, including frequent reorientation, adequate lighting, and noise reduction. If patients required treatment for insomnia, hydroxyzine was used with a dose limit of 25 mg per night. Baseline characteristics were similar in the 2 groups, with a mean age of 78 years. For the primary outcome of onset of delirium, experienced psychiatrists, masked to study group, assessed patients in the mornings and afternoons for up to 7 days using a delirium rating scale. Only 1 patient in the ramelteon group was diagnosed with delirium as compared with 11 patients in the placebo group (3% vs 32%; number needed to treat = 3; P = .003). Interestingly, there were no significant differences between the groups in sleep metrics such as difficulty falling asleep and poor sleep quality, although the sample was likely too small to detect such differences. Note that the patients were not masked in this study, which could have potentially affected the overall outcomes. No adverse effects attributed to the study drug were reported.
Dr. Kulkarni is an assistant professor of hospital medicine at Northwestern University in Chicago.
HACs may not tell the whole story
The Affordable Care Act has essentially overhauled Medicare’s payment system for hospitals in an effort to improve quality while minimizing wasteful spending.
One such change centers on HACs, or hospital-acquired conditions. These conditions were deemed potentially preventable by the Centers for Medicare & Medicaid Services in 2009 and are a major target for Medicare payment penalties and hospital quality initiatives. Hospitalizations that are complicated by one of these conditions, for instance, the development of diabetic ketoacidosis from poor glycemic control, do not qualify for higher paying diagnosis-related group payment, leaving a gaping hole between the cost of care delivered and the amount reimbursed by Medicare.
Yet to come in fiscal year 2015, Medicare payments for all discharges will be cut by 1% for those hospitals that score in the top quartile for the rate of hospital-acquired conditions, compared with national average.
Upon initially hearing about this provision in the ACA, I was shocked and felt it was both unfair and realistic, but as time has passed, it is clear that a variety of innovative hospital-based quality initiatives have made significant headway into minimizing at least some of the HACs.
Help is also available through the government. The Medicare Shared Savings and Pioneer ACO Models offer participating hospitals a share of the savings if they can reduce spending below historical benchmarks. A healthier bottom line for our hospitals has the potential to ultimately translate into improved resources and support systems to enhance our ability to provide excellent care for our patients, while making our days run more smoothly.
However, a recent study shows that HACs do not appear to be the bottom line in hospital savings after all. Identifying hospital-wide harm associated with increased cost, length of stay, and mortality in U.S. hospitals, was recently released by the Premier health care alliance, and was based on peer-reviewed research in the American Journal of Medical Quality.
Premier evaluated more than 5.5 million deidentified ICD-9 discharge records from hospitals and medical centers in 47 states. They identified 86 potential inpatient complications that were associated with higher cost, increased length of stay, and/or higher mortality.
Surprisingly, this study concluded that the current HACs used by the CMS cover only a fraction of the complications and that of the 86 high-impact conditions they evaluated, only 22 are addressed through the CMS’s federal payment policies. Conditions such as acute renal failure, which was associated with close to $490 million in costs, and hypotension, which had $200 million in costs in this study were far more significant than were the HACs such as air embolism and blood incompatibility, seen in 23 and 8 patients, respectively, in more than 5 million records.
While some of the 86 conditions identified may not be easy to prevent, others, such as acute renal failure and hypotension, have the potential to be significantly reduced through vigilant monitoring of parameters such as nephrotoxin use and blood pressure trends.
Dr. A. Maria Hester is a hospitalist with Baltimore-Washington Medical Center, Glen Burnie, Md., who has a passion for empowering patients to partner in their health care. She is the creator of the Patient Whiz, a patient-engagement app for iOS.

Factors that lead to gout often differ in men and women
PARIS – Women have different predisposing risk factors for gout than do men, who more often fit the stereotypical profile of patients with gout who consume foods that increase the risk of the disease.
In the study based on data collected from participants in the Consortium of Rheumatology Researchers of North America (CORRONA) gout registry, women with gout were more likely to have taken predisposing medications and to have more gout-associated comorbidities, whereas men were more likely to consume foods linked to the disorder, such as alcohol and red meat, according to Dr. Leslie Harrold, scientific director of the CORRONA gout registry.

"We live in an era of personalized medicine," she said in an interview. "These findings speak to the need to tailor our evaluations and treatments based on the patient. There cannot be a one-size-fits-all approach. We need to approach women with gout differently than men with gout."
Patients in the gout study were enrolled in 2012-2013. Data gathered from patients and their rheumatologists at study enrollment included demographics, predisposing factors (comorbid conditions, medications, diet), gout disease characteristics, current treatments, and physical exam findings.
The 54 participating rheumatologists enrolled 1,167 gout patients (239 women). Women were significantly older than men (71 years vs. 61 years) and had higher body mass index (34 kg/m2 vs. 23 kg/m2). They also were significantly more likely to have hypertension (77% vs. 57%), diabetes (28% vs. 17%), and renal disease (25% vs. 14%).
Women also had a shorter duration of gout when enrolled (6 years vs. 11 years) and were less likely to have a crystal-proven diagnosis (26% vs. 35%).
Medication risk factors for gout, such as diuretics, were more common in women (49% vs. 22%), while dietary risk factors were more frequent in men, who consumed significantly more beer, hard liquor, beef, and pork, Dr. Harrold reported at the annual European Congress of Rheumatology.
Although the clinical features of gout were similar between the genders at the time of initial diagnosis, women reported more frequent disability. Women were more likely to have contraindications to treatment with NSAIDs or colchicine, but women with tophi or active disease – defined as two or more flares per year – used urate-lowering therapy at a rate that was not statistically different from men (78% vs. 84%).
"I think what is most interesting is that the profile of men and women with gout differs," said Dr. Harrold of the division of rheumatology at the University of Massachusetts, Worcester. "Doctors usually have a single concept of the typical patient. But instead, here we have to realize that the typical woman with gout is different than the typical man with gout. That should frame our evaluation of suspected cases."
A number of pharmaceutical companies have financially supported the CORRONA registry. In the last 5 years, Dr. Harrold has received research funding from Takeda and has a pending grant with AstraZeneca.
PARIS – Women have different predisposing risk factors for gout than do men, who more often fit the stereotypical profile of patients with gout who consume foods that increase the risk of the disease.
In the study based on data collected from participants in the Consortium of Rheumatology Researchers of North America (CORRONA) gout registry, women with gout were more likely to have taken predisposing medications and to have more gout-associated comorbidities, whereas men were more likely to consume foods linked to the disorder, such as alcohol and red meat, according to Dr. Leslie Harrold, scientific director of the CORRONA gout registry.
"We live in an era of personalized medicine," she said in an interview. "These findings speak to the need to tailor our evaluations and treatments based on the patient. There cannot be a one-size-fits-all approach. We need to approach women with gout differently than men with gout."
Patients in the gout study were enrolled in 2012-2013. Data gathered from patients and their rheumatologists at study enrollment included demographics, predisposing factors (comorbid conditions, medications, diet), gout disease characteristics, current treatments, and physical exam findings.
The 54 participating rheumatologists enrolled 1,167 gout patients (239 women). Women were significantly older than men (71 years vs. 61 years) and had higher body mass index (34 kg/m2 vs. 23 kg/m2). They also were significantly more likely to have hypertension (77% vs. 57%), diabetes (28% vs. 17%), and renal disease (25% vs. 14%).
Women also had a shorter duration of gout when enrolled (6 years vs. 11 years) and were less likely to have a crystal-proven diagnosis (26% vs. 35%).
Medication risk factors for gout, such as diuretics, were more common in women (49% vs. 22%), while dietary risk factors were more frequent in men, who consumed significantly more beer, hard liquor, beef, and pork, Dr. Harrold reported at the annual European Congress of Rheumatology.
Although the clinical features of gout were similar between the genders at the time of initial diagnosis, women reported more frequent disability. Women were more likely to have contraindications to treatment with NSAIDs or colchicine, but women with tophi or active disease – defined as two or more flares per year – used urate-lowering therapy at a rate that was not statistically different from men (78% vs. 84%).
"I think what is most interesting is that the profile of men and women with gout differs," said Dr. Harrold of the division of rheumatology at the University of Massachusetts, Worcester. "Doctors usually have a single concept of the typical patient. But instead, here we have to realize that the typical woman with gout is different than the typical man with gout. That should frame our evaluation of suspected cases."
A number of pharmaceutical companies have financially supported the CORRONA registry. In the last 5 years, Dr. Harrold has received research funding from Takeda and has a pending grant with AstraZeneca.
AT THE EULAR CONGRESS 2014
Key clinical point: Clinicians should consider the differences in the presentation of gout between women and men and tailor their evaluation and treatment accordingly.
Major finding: Medication risk factors for gout, such as diuretics, were more common in women (49% vs. 22%), while dietary risk factors were more frequent in men, who consumed significantly more beer, hard liquor, beef, and pork.
Data source: A retrospective cohort study of 1,167 patients in the CORRONA gout registry.
Disclosures: A number of pharmaceutical companies have financially supported the CORRONA registry. In the last 5 years, Dr. Harrold has received research funding from Takeda and has a pending grant with AstraZeneca.

AG-221 sparked durable responses in hematologic cancers
MILAN – The investigational drug AG-221 induced responses in more than half of patients with advanced IDH2 mutation–positive hematologic cancers, updated phase I data showed.
Among 25 evaluable patients, 14 responded to treatment with AG-221: 6 had complete responses, 2 had complete responses with incomplete platelet count recovery, 1 had a complete response with incomplete hematologic recovery, and 5 had partial responses.
Twelve of 14 responses are ongoing, and five patients with stable disease remain on study.
Responses are seen in acute myelogenous leukemia, myelodysplastic syndromes, and chronic myelomonocytic leukemia, Dr. Stéphane de Botton said during a late-breaking abstract session at the annual congress of the European Hematology Association.
"Very interestingly, at least in five patients, the duration of the responses has reached greater than 2.5 months," he said.
AG-221 is a first-in-class inhibitor of the isocitrate dehydrogenase–2 (IDH2) protein and was just granted orphan drug status by the Food and Drug Administration for the treatment of acute myelogenous leukemia (AML).
About 15% of patients with AML carry an IDH2 mutation, as do 5% with myelodysplastic syndromes.
An initial report from this phase I, multicenter study showed five of seven patients evaluable at that time had a complete response or platelet count recovery after treatment with AG-221.
Of the 35 patients now enrolled, 27 had relapsed or refractory AML, 4 had myelodysplastic syndromes, 2 had untreated AML, 1 had chronic myelomonocytic leukemia, and 1 had granulocytic sarcoma. Patients’ mean age was 66 years, 31 had IDH2 R140Q mutations, and 4 had IDH2 R172K mutations.
Up to 100% plasma 2-hydroxyglutarate inhibition was seen after multiple doses in R140Q patients and up to 60% plasma 2-HG inhibition, in R172K patients, said Dr. de Botton, head of hematology, Institut Gustave Roussy, Villejuif, France.
Dose escalation has continued with single-agent oral dosing ranging from 30 mg twice daily to 150 mg once daily in 28-day cycles. The results were very similar with 50 mg b.i.d. and 100 mg every day.
AG-221 was also "remarkably well tolerated," with the maximum tolerated dose yet to be reached, he said.
The majority of adverse events are grade 1 and 2, notably edema, leukocytosis, nausea, sepsis, and thrombocytopenia.
Grade 3 or higher events in 18 evaluable patients included 3 cases each of thrombocytopenia and febrile neutropenia, 2 of leukocytosis, and 1 case each of diarrhea and rash, he said.
There have been four possible treatment-related serious adverse events: grade 3 confusion and grade 5 respiratory failure in a patient with severe sepsis, one case of grade 3 leukocytosis along with grade 3 anorexia and grade 1 nausea, one case of grade 3 diarrhea, and one case of grade 3 leukocytosis.
There have been seven deaths within 30 days of study drug termination: five stemming from complications of disease-related sepsis, one from complications of a humeral fracture not related to the study drug, and one from stroke, also unrelated to treatment, Dr. de Botton said.
"AG-221 is safe and well tolerated to date with durable clinical activity," he concluded.
Dr. de Botton reported research funding from Agios Pharmaceuticals, the study sponsor.
AT THE EHA CONGRESS
Key clinical point: AG-221 could shift the treatment for IDH2 mutation-positive hematologic cancers.
Major finding: Fourteen of 25 patients responded to treatment with AG-221.
Data source: A prospective phase I dose-escalation study in 35 patients with hematologic cancers.
Disclosures: Dr. de Botton reported research funding from Agios Pharmaceuticals, the study sponsor.
Post-World War II psychiatry: 70 years of momentous change
A large percentage of psychiatrists practicing today are Boomers, and have experienced the tumultuous change in their profession since the end of World War II. At a recent Grand Rounds presentation in the Department of Neurology & Psychiatry at Saint Louis University, participants examined major changes and paradigm shifts that have reshaped psychiatry since 1946. The audience, which included me, contributed historical observations to the list of those changes and shifts, which I’ve classified here for your benefit, whether or not you are a Boomer.
Medical advances
Consider these discoveries and developments:
• Penicillin in 1947, which led to a reduction in cases of psychosis caused by tertiary syphilis, a disease that accounted for 10% to 15% of state hospital admissions.
• Lithium in 1948, the first pharmaceutical treatment for mania.
• Chlorpromazine, the first antipsychotic drug, in 1952, launching the psychopharmacology era and ending lifetime institutional sequestration as the only “treatment” for serious mental disorders.
• Monoamine oxidase inhibitors in 1959, from observations that iproniazid, a drug used in tuberculosis sanitariums, improved the mood of tuberculosis patients. This was the first pharmacotherapy for depression, which had been treated with electroconvulsive therapy (ECT), developed in the 1930s.
• Tricyclic antidepressants, starting with imipramine in the late 1950s, during attempts to synthesize additional phenothiazine antipsychotics.
• Diazepam, introduced in 1963 for its anti-anxiety effects, became the most widely used drug in the world over the next 2 decades.
• Pre-frontal lobotomy to treat severe psychiatric disorders. The neurosurgeon-inventor of this so-called medical advance won the 1949 Nobel Prize for Medicine or Physiology. The procedure was rapidly discredited after the development of antipsychotic drugs.
• Fluoxetine, the first selective serotonin reuptake inhibitor, in 1987, revolutionized the treatment of depression, especially in primary care settings.
• Clozapine, as an effective treatment for refractory and suicidal schizophrenia, and the spawning of second-generation antipsychotics. These newer agents shifted focus from neurologic adverse effects (extrapyramidal symptoms, tardive dyskinesia) to cardio-metabolic side effects (obesity, diabetes, dyslipidemia, and hypertension).
Changes to the landscape of health care
Three noteworthy developments made the list:
• The Community Mental Health Act of 1963, signed into law by President John F. Kennedy, revolutionized psychiatric care by shifting delivery of care from inpatient, hospital-based facilities to outpatient, clinic-based centers. There are now close to 800 community mental health centers in the United States, where care is dominated by non-physician mental health providers—in contrast to the era of state hospitals, during which physicians and nurses provided care for mentally ill patients.
• Deinstitutionalization. This move-ment gathered momentum in the 1970s and 1980s, leading to closing of the majority of state hospitals, with tragic consequences for the seriously mentally ill—including early demise, homelessness, substance abuse, and incarceration. In fact, the large percentage of mentally ill people in U.S. jails and prisons, instead of in a hospital, represents what has been labeled trans-institutionalization (see my March 2008 editorial, “Bring back the asylums?,” available at CurrentPsychiatry.com).
• Managed care, emerging in the late 1980s and early 1990s, caused a seismic disturbance in the delivery of, and reimbursement for, psychiatric care. The result was a significant decline in access to, and quality of, care—especially the so-called carve-out model that reduced payment for psychiatric care even more drastically than for general medical care. Under managed care, the priority became saving money, rather than saving lives. Average hospital stay for patients who had a psychiatric disorder, which was years in the pre-pharmacotherapy era, and weeks or months after that, shrunk to a few days under managed care.
Changes in professional direction
Two major shifts in the complexion of the specialty were identified:
• The decline of psychoanalysis, which had dominated psychiatry for decades (the 1940s through the 1970s), was a major shift in the conceptualization, training, and delivery of care in psychiatry. The rise of biological psychiatry and the medical model of psychiatric brain disorders, as well as the emergence of evidence-based (and briefer) psychotherapies (eg, cognitive-behavioral therapy, dialectical behavior therapy, and interpersonal therapy), gradually replaced the Freudian model of mental illness.
As a result, it became no longer necessary to be a certified psychoanalyst to be named chair of a department of psychiatry. The impact of this change on psychiatric training has been profound, because medical management by psychiatrists superseded psychotherapy— given the brief hospitalization that is required and the diminishing coverage for psychotherapy by insurers.
• Delegation of psychosocial treatments to non-psychiatrists. The unintended consequences of psychiatrists’ change of focus to 1) consultation on medical/surgical patients and 2) the medical evaluation, diagnosis, and pharmacotherapy of mental disorders led to the so-called “dual treatment model” for the most seriously mentally ill patients: The physician provides medical management and non-physician mental health professionals provide counseling, psychosocial therapy, and rehabilitation.
Disruptive breakthroughs
Several are notable:
• National Institute of Mental Health (NIMH). Establishment of NIMH in April 1949 was a major step toward funding research into psychiatric disorders. Billions of dollars have been invested to generate knowledge about the causes, treatment, course, and prevention of mental illness. No other country has spent as much on psychiatric research. It would have been nearly impossible to discover what we know today without the work of NIMH.
• Neuroscience. The meteoric rise of neuroscience from the 1960s to the present has had a dramatic effect, transforming old psychiatry and the study and therapy of the mind to a focus on the brain-mind continuum and the prospects of brain repair and neuroplasticity. Psychiatry is now regarded as a clinical neuroscience specialty of brain disorders that manifest as changes in thought, affect, mood, cognition, and behavior.
• Brain imaging. Techniques developed since the 1970s—the veritable alphabet soup of CT, PET, SPECT, MRI, MRS, fMRI, and DTI— has revolutionized understanding of brain structure and function in all psychiatric disorders but especially in psychotic and mood disorders.
• Molecular genetics. Advances over the past 2 decades have shed unprecedented light on the complex genetics of psychiatric disorders. It is becoming apparent that most psychiatric disorders are caused via gene-by-environment interaction; etiology is therefore a consequence of genetic and non-genetic variables. Risk genes, copy number variants, and de novo mutations are being discovered almost weekly, and progress in epigenetics holds promise for preventing medical disorders, including psychiatric illness.
• Neuromodulation. Advances represent an important paradigm shift, from pharmacotherapy to brain stimulation. Several techniques have been approved by the FDA, including transcranial magnetic stimulation, vagus nerve stimulation, and deep brain stimulation, to supplement, and perhaps eventually supplant, ECT.
Legal intrusiveness
No other medical specialty has been subject to laws governing clinical practice as psychiatry has been. Progressive intrusion of laws (ostensibly, enacted to protect the civil rights of “the disabled”) ends up hurting patients who refuse admission and then often harm themselves or others or decline urgent treatment, which can be associated with loss of brain tissue in acute psychotic, manic, and depressed states. No legal shackles apply to treating unconscious stroke patients, delirious geriatric patients, or semiconscious myocardial infarction patients when they are admitted to a hospital.
Distortions of the anti-psychiatry movement
The antipsychiatry movement preceded the Baby Boomer era by a century but has continued unabated. The movement gained momentum and became more defamatory after release of the movie One Flew Over the Cuckoo’s Nest in 1975, which portrayed psychiatry in a purely negative light. Despite progress in public understanding of psychiatry, and tangible improvements in practice, the stigma of mental illness persists. Media portrayals, including motion pictures, continue to distort the good that psychiatrists do for their patients.
Gender and sexuality
• Gender distribution of psychiatrists. A major shift occurred over the past 7 decades, reflecting the same pattern that has been documented in other medical specialties. At least one-half of psychiatry residents are now women—a welcome change from the pre-1946 era, when nearly all psychiatrists were men. This demographic transformation has had an impact on the dynamics of psychiatric practice.
• Acceptance and depathologization of homosexuality. Until 1974, homosexuality was considered a psychiatric disorder, and many homosexual persons sought treatment. That year, membership of the American Psychiatric Association voted to remove homosexuality from DSM-II and to no longer regard it as a behavioral abnormality. This was a huge step toward de-pathologizing same-sex orientation and love, and might have been the major impetus for the progressive social acceptance of gay, lesbian, and transgendered people over the past 4 decades.
The DSM paradigm shift in psychiatric diagnosis
• DSM-III. Perhaps the most radical change in the diagnostic criteria of psychiatric disorders occurred in 1980, with introduction of DSM-III to replace DSM-I and DSM-II, which were absurdly vague, unreliable, and with poor validity.
The move toward more operational and reliable diagnostic requirements began with the Research Diagnostic Criteria, developed by the Department of Psychiatry at Washington University in St. Louis. DSM-III represented a complete paradigm shift in psychiatric diagnosis. Subsequent editions maintained the same methodology, with relatively modest changes. The field expects continued evolution in DSM diagnostic criteria, including the future inclusion of biomarkers, based on sound, controlled studies.
• Recognizing PTSD. Develop-ment of posttraumatic stress disorder (PTSD) as a diagnostic entity, and its inclusion in DSM-III, were major changes in psychiatric nosology. At last, the old terms—shell shock, battle fatigue, neurasthenia—were legitimized as a recognizable syndrome secondary to major life trauma, including war and rape. That legitimacy has instigated substantial clinical and research interest in identifying how serious psychopathology can be triggered by life events.
Pharmaceutical industry debacle
Few industries have fallen so far from grace in the eyes of psychiatric professionals and the public as the manufacturers of psychotropic drugs.
At the dawn of the psychopharmacology era (the 1950s, 1960s, and 1970s) pharmaceutical companies were respected and regarded by physicians and patients as a vital partner in health care for their discovery and development of medications to treat psychiatric disorders. That image was tarnished in the 1990s, however, with the approval and release of several atypical antipsychotics. Cutthroat competition, questionable publication methods, concealment of negative findings, and excessive spending on marketing, including FDA-approved educational programs for clinicians on efficacy, safety, and dosing, all contributed to escalating cynicism about the industry. Academic faculty who received research grants to conduct FDA-required clinical trials of new agents were painted with the same brush.
Disclosure of potential conflict of interest became a mandatory procedure at universities and for NIMH grant applicants and journal publishers. Class-action lawsuits against companies that manufacture second-generation antipsychotics—filed for lack of transparency about metabolic side effects—exacerbated the intensity of criticism and condemnation.
Although new drug development has become measurably more rigorous and ethical because of self-regulation, combined with vigorous government scrutiny and regulation, demonization of the pharmaceutical industry remains unabated. That might be the reason why several major pharmaceutical companies have abandoned research and development of psychotropic drugs. That is likely to impede progress in psychopharmacotherapeutics; after all, no other private or government entity develops drugs for patients who have a psychiatric illness. The need for such agents is great: There is no FDA-indicated drug for the majority of DSM-5 diagnoses.
We entrust the future to next generations
Momentous events have transformed psychiatry during the lifespan of Baby Boomers like me and many of you. Because the cohort of 80 million Baby Boomers has comprised a significant percentage of the nation’s scientists, media representatives, members of the American Psychiatric Association, academicians, and community leaders over the past few decades, it is conceivable that the Baby Boomer generation helped trigger most of the transformative changes in psychiatry we have seen over the past 70 years.
I can only wonder: What direction will psychiatry take in the age of Generation X, Generation Y, and the Millennials? Only this is certain: Psychiatry will continue to evolve— long after Baby Boomers are gone.

Inhibitor shows promise for hematologic disorders

Photo courtesy of EHA
MILAN—The IDH2 inhibitor AG-221 is well-tolerated and exhibits durable clinical activity in patients with hematologic disorders, results of a phase 1 study suggest.
The drug prompted responses in patients with myelodysplastic syndromes (MDS), acute myeloid leukemia (AML), or chronic myelomonocytic leukemia (CMML).
Fourteen of 25 patients achieved a response, and 12 of those responses are ongoing.
Most adverse events (AEs) were grade 1 or 2 in nature. However, 4 patients did have serious AEs that were possibly related to treatment.
Stéphane de Botton, MD, PhD, of Institut Gustave Roussy in Villejuif, France, presented these results at the 19th Annual Congress of the European Hematology Association (EHA) as abstract LB2434.
Dr de Botton and his colleagues enrolled 35 patients who had a median age of 68 years (range, 48-81).
Twenty-seven patients had relapsed/refractory AML, 4 had relapsed/refractory MDS, 2 had untreated AML, 1 had CMML, and 1 had granulocytic sarcoma. Thirty-one patients had R140Q IDH2 mutations, and 4 had R172K IDH2 mutations.
The patients received AG-221 at 30 mg BID (n=7), 50 mg BID (n=7), 75 mg BID (n=6), 100 mg QD (n=5), 100 mg BID (n=5), or 150 mg QD (n=5). Patients completed a median of 1 cycle of treatment (range, <1-5+) and a mean of 2 cycles.
Safety data
“AG-221 was remarkable well-tolerated, and the [maximum tolerated dose] has not been reached,” Dr de Botton said. “The majority of adverse events were grade 1 and 2.”
Eighteen patients were evaluable for safety. AEs of all grades included nausea (n=4), pyrexia (n=4), thrombocytopenia (n=4), anemia (n=3), dizziness (n=3), febrile neutropenia (n=3), peripheral edema (n=3), sepsis (n=3), cough (n=2), diarrhea (n=2), fatigue (n=2), leukocytosis (n=2), neutropenia (n=2), petechiae (n=2), and rash (n=2).
Grade 3 or higher AEs included thrombocytopenia (n=3), anemia (n=1), febrile neutropenia (n=3), sepsis (n=3), diarrhea (n=1), fatigue (n=1), leukocytosis (n=2), neutropenia (n=1), and rash (n=1). Dr de Botton noted that diarrhea and rash were not expected events.
Four patients had serious AEs possibly related to treatment. One patient had grade 3 confusion and grade 5 respiratory failure. One patient had grade 3 leukocytosis, grade 3 anorexia, and grade 1 nausea. One patient had grade 3 diarrhea. And 1 patient had grade 3 leukocytosis.
Seven patients died within 30 days of study drug termination: 4 in the 30-mg cohort, 2 in the 50-mg cohort, and 1 in the 100-mg-BID cohort.
Five deaths were due to complications of disease-related sepsis (all in cycle 1), 1 complication of a humeral fracture, and 1 complication of a stroke.
Activity and response data
The researchers observed high AG-221 accumulation after multiple doses. And results were “really very similar” between the 30-mg-BID cohort and the 100-mg-QD cohort, Dr de Botton noted.
He also said AG-221 was “very efficient” at inhibiting 2-HG in the plasma. 2-HG was inhibited up to 100% in subjects with R140Q mutations and up to 60% in subjects with R172K mutations.
Twenty-five patients were evaluable for response. The remaining 10 patients did not have day-28 marrow assessments, either due to early termination (n=7) or receiving less than 28 days of treatment although they were still on the study (n=3).
In all, there were 6 complete responses (CRs), 2 CRs with incomplete platelet recovery (CRps), 1 CR with incomplete hematologic recovery (CRi), and 5 partial responses (PRs). Five patients had stable disease (SD), and 6 had progressive disease (PD).
The most responses occurred in the 50-mg group, which had 3 CRs, 1 CRi, and 1 PR. This was followed by the 30-mg group, which had 2 CRs, 1 CRp, and 1 PR.
“The majority of responses occurred in cycle 1,” Dr de Botton noted, “except in the first cohort [30 mg], where responses occurred late, at the end of cycle 3 and cycle 4.”
Twelve of the 14 responses are ongoing. Of the 8 patients who achieved a CR or CRp, 5 have lasted more than 2.5 months (range, 1-4+ months). And the 5 patients with SD remain on study.
This study is sponsored by Celgene Corporation and Agios Pharmaceuticals Inc., the companies developing AG-221. ![]()
Engineered protein targets EBV lymphoma
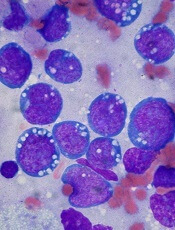
Credit: Ed Uthman
Preclinical research suggests a newly engineered protein can suppress tumor growth and extend survival in a mouse model of lymphoma.
The molecule, called BINDI (BHRF1-inhibiting design acting intracellularly), was designed to trigger the self-destruction of cancer cells infected with the Epstein-Barr virus (EBV).
EBV can disrupt the body’s clearance of old, abnormal, infected, and damaged cells. And BINDI works by overriding this interference.
Erik Procko, PhD, of the University of Washington in Seattle, and his colleagues described results observed with BINDI in Cell.
The researchers used computational design and experimental optimization to generate BINDI. The protein was designed to recognize and attach itself to an EBV protein called BHRF1 and to ignore similar proteins. BHRF1 keeps cancer cells alive, but, when bound to BINDI, it can no longer fend off cell death.
By examining the crystal structure of BINDI, the researchers saw that it nearly matched their computationally designed architecture for the protein molecule.
Furthermore, experiments showed that BINDI could prompt EBV-infected cancer cell lines to shrivel, disassemble their components, and burst into small pieces.
The researchers also tested BINDI in a mouse model of EBV-positive lymphoma. They delivered BINDI into cancer cells via an antibody-targeted nanocarrier designed to deliver protein cargo to intracellular cancer targets.
And BINDI behaved as ordered. It suppressed tumor growth and enabled the mice to live longer than control mice.
The researchers said this work demonstrates the potential to develop new classes of more effective, intracellular protein drugs, as current protein therapeutics are limited to extracellular targets. ![]()
Tool may predict cancer patients’ risk of financial stress

patient and her father
Credit: Rhoda Baer
A new questionnaire can measure a cancer patient’s risk for financial stress, according to a paper published in Cancer.
Researchers developed the 11-item questionnaire, called the COmprehensive Score for financial Toxicity (COST), through conversations with more than 150 cancer patients.
The team used the term “financial toxicity” to describe the expense, anxiety, and loss of confidence confronting patients who face big, unpredictable costs of cancer treatment.
And the researchers said financial toxicity can be considered another side effect of cancer care.
“Few physicians discuss this increasingly significant side effect with their patients,” said study author Jonas de Souza, MD, of the University of Chicago Medicine in Illinois.
“Physicians aren’t trained to do this. It makes them, as well as patients, feel uncomfortable. [However,] we believe that a thoughtful, concise tool that could help predict a patient’s risk for financial toxicity might open the lines of communication. This gives us a way to launch that discussion.”
Development of the COST questionnaire began with a literature review and a series of extensive interviews. Dr de Souza and his colleagues spoke with 20 patients and 6 cancer professionals, as well as nurses and social workers, and this produced a list of 147 questions.
The researchers pared the list down to 58 questions. Then, they asked 35 patients to help them decide which of the remaining questions were the most important. And the patients narrowed the list down to 30.
“In the end, 155 patients led us, with some judicious editing, to a set of 11 statements,” Dr de Souza said. “This was sufficiently brief to prevent annoying those responding to the questions but thorough enough to get us the information we need.”
All 11 entries are short and easy to understand, according to the researchers. For example, item 2 states, “My out-of-pocket medical expenses are more than I thought they would be.” And item 7 states, “I am able to meet my monthly expenses.”
For each question, patients choose from 5 potential responses: “not at all”, “a little bit,” “somewhat,” “quite a bit,” or “very much.”
Learning how a patient responds may help caregivers determine who is likely to need education, financial counseling, or referral to a support network. The quiz may also predict who is likely to have problems and require interventions.
All patients who helped develop the study had been in treatment for at least 2 months and had received bills. Excluding the top 10% and the bottom 10%, patients in the study earned between $37,000 and $111,000. The median annual income for these patients was about $63,000.
The researchers expected that financial toxicity would correlate with income.
“But, in our small sample, that did not hold up,” Dr de Souza said. “People with less education seemed to have more financial distress, but variations in income did not make much difference. We need bigger studies to confirm that, but at least we now have a tool we can use to study this.”
The researchers are now conducting a larger study to validate these findings and correlate the newly developed scale with quality of life and anxiety in cancer patients.
“We need to assess outcomes that are important for patients,” Dr de Souza said. “[T]his is another important piece of information in the shared-decision-making process.” ![]()
Low-dose T-cell transfer can fight CMV

CMV infection
A new study indicates that transferring low doses of immune cells may be sufficient to protect against cytomegalovirus (CMV) infection in patients receiving allogeneic stem cell transplant.
The researchers noted that the adoptive transfer of donor-derived, virus-specific, memory T cells is a promising strategy for treating and preventing CMV infection.
But transferring too many of these cells can increase the risk of graft-vs-host disease.
So Christian Stemberger, PhD, of Technische Universitaet Muenchen in Germany, and his colleagues set out to establish a lower limit for successful adoptive T-cell therapy.
The team reported their results—observed in mice and 2 human patients—in Blood.
The researchers first conducted low-dose CD8+ T-cell transfers in the murine Listeria monocytogenes infection model.
And they found these MHC-Streptamer-enriched, antigen-specific, CD62Lhi, CD8+ memory T cells proliferated, differentiated, and protected against Listeria monocytogenes infections.
“The most astonishing result was that the offspring cells of just 1 transferred donor cell were enough to completely protect the animals,” Dr Stemberger said.
Next, the researchers used virus-specific T cells to treat 2 critically ill pediatric patients—1 with severe combined immunodeficiency (SCID) and the other with B-cell acute lymphoblastic leukemia.
The patients had received allogeneic transplants and subsequently developed CMV infections.
The patients received low-dose transfers of Streptamer-enriched, CMV-specific, CD8+ T cells—3750 cells per kilogram of body weight for the SCID patient and 5130 cells per kilogram of body weight for the leukemia patient.
In both patients, the researchers observed “strong, pathogen-specific T-cell expansion.” The CMV-specific, CD8+ T cells proliferated, and the CMV viral load decreased. Furthermore, neither patient developed graft-vs-host disease.
“It is a great advantage that even just a few cells can provide protection [from CMV],” said study author Michael Neuenhahn, Dr med, also of Technische Universitaet Muenchen.
“This means that the cells can be used for preventive treatment in low doses that are gentler on the organism.”
The researchers are now testing the potential of the CMV-specific, CD8+ T cells in a clinical study. ![]()
Vascular reconstruction may have a role in pancreatic adenocarcinoma resection
BOSTON – In skilled hands, various vascular reconstructive methods used during pancreatic resections for adenocarcinoma result in early survival rates that are comparable to those in patients who undergo resection without vascular reconstruction, according to a retrospective review of cases.
This is important because up to 25% of cases in high-volume centers are borderline for resection using pancreaticoduodenectomy (Whipple procedure) because of vascular involvement. Resection is the only curative option for the disease, Dr. Michael D. Sgroi said at a meeting hosted by the Society for Vascular Surgery.
Of 270 Whipple procedures and total pancreatectomy procedures performed from January 2003 to February 2013 at a single institution, 147 were for pancreatic adenocarcinoma that involved the surrounding vasculature (T3 lesions); 60 of these involved vascular reconstructions (including 49 venous and 11 arterial reconstructions) and 87 were Whipple procedures without reconstruction, The venous reconstructions included 37 primary repairs, four reconstructions with CryoVein, three repairs using an autologous vein patch, three autologous saphenous reconstructions, and two portacaval shunts. The arterial reconstructions included seven hepatic artery reconstructions, and four were superior mesenteric artery reconstructions.
All were performed by the vascular surgery service, said Dr. Sgroi of the department of surgery, University of California, Irvine Medical Center, Orange.
Overall survival was greater than 18 months in the vascular reconstruction group, with no statistically significant difference seen between the various types of procedures or compared with the Whipple-only group. One perioperative death occurred (1.7%), and survival at 1 year for all reconstructions was 70.3% – a rate similar to the 72.6% survival among patients with T3 lesions who did not undergo vascular reconstruction.
Survival in the two groups remained similar at 3 years, but a survival advantage among those in the Whipple-only group emerged by year 4 and was statistically significant by year 5, Dr. Sgroi said.
No factors were found to be significantly associated with outcome, but there was a trend toward significance for positive lymph nodes and positive margins as predictors of survival. Positive margins were present in 22% of patients in the vascular reconstruction group, compared with only 11% of those in the Whipple-only group, he noted.
"Pancreatic adenocarcinoma is one of the most deadly neoplasms, with 1- and 5-year survival rates for all stages being 25% and 5%, respectively," he said, noting that resection is associated with high rates of morbidity.
Currently the only curative option for this disease is a margin-negative resection, but because most cases are not detected until they are in later stages, only about 20% of patients undergo resection, he said.
"As the morbidity and mortality rates have declined postoperatively following Whipple operations, the National Comprehensive Cancer Network guidelines have also changed to now consider borderline resectable or stage 2 tumors for resection. These are tumors that have portal vein, superior mesenteric vein, or confluence involvement as well as arterial involvement of less than 180 degrees of the common hepatic or right hepatic artery," he explained, adding that "in general, superior mesenteric artery or celiac access involvement is a contraindication to surgery, and these cases now account for about 25% of all Whipples performed in high-volume institutions."
The various approaches to reconstruction that can be performed have been used with acceptable patency rates and outcomes, and multiple single-institution reviews have demonstrated that both venous and arterial resections performed concomitantly with Whipple procedures have equivalent morbidity and mortality rates to Whipple performed without reconstruction.
"A flaw of these studies has always been that their sample size is small, diminishing the power of the study," Dr. Sgroi noted.
Further complicating the issue are two recent manuscripts demonstrating significantly increased morbidity and mortality with vascular reconstruction, while a review of the National Surgical Quality Improvement Program database showed that when vascular surgeons are involved, outcomes are comparable with and without reconstruction – with the exception of increased blood loss and time in the operating room with vascular reconstruction.
The findings of the current study support the latter finding.
Notably, with the advances in chemotherapy agents it is now protocol that all patients at the University of California, Irvine receive neoadjuvant chemotherapy, and survival was improved in those who received both vascular reconstruction and neoadjuvant chemotherapy, compared with those who received vascular reconstruction without neoadjuvant chemotherapy.
"We believe that experience matters with this operation and that there is a learning curve," he said.
An example involves the need for packed red blood cells. The average number of units of packed red blood cells given with each case declined over time, and now less than one unit is used per case, he noted.
"Pancreatic adenocarcinoma is a dismal disease with poor long-term survival. Performing a Whipple on T3 lesions with vascular invasion will allow for an increased amount of surgical resections, and it is possible to achieve equivalent survival outcomes, compared with patients who receive a Whipple only," he said, adding that further study is needed to determine if any of the multiple vascular reconstruction options is superior to the others.
"It is our recommendation that a multidisciplinary team with surgeons experienced with vascular reconstruction perform these operations, and that, if possible, these patients be referred to a high-volume institution for the best outcome," he concluded.
Dr. Sgroi reported having no disclosures.
AT THE 2014 VASCULAR ANNUAL MEETING
Key clinical point: Performing a Whipple on borderline T3 lesions with vascular invasion may allow for an increased amount of surgical resections.
Major finding: One-year survival was 70.3% with Whipple plus reconstruction and 72.6% with a Whipple-only procedure, but a survival advantage among those in the Whipple-only group emerged by year 4 and was statistically significant by year 5.
Data source: A retrospective review of 147 cases.
Disclosures: Dr. Sgroi reported having no disclosures.