User login
Is injectable PrEP superior to oral therapy for HIV protection?
ILLUSTRATIVE CASE
A 24-year-old cisgender man with no significant past medical history comes to your office requesting PrEP after starting a new sexual relationship. His partner is a 26-year-old cisgender man with known HIV. The patient reports that balancing graduate school and work has made him very forgetful, and he worries that he won’t remember to take a daily pill. Are there any other PrEP methods you can offer?
The efficacy of PrEP to reduce HIV acquisition has been established across varying populations at high risk for transmission.1 PrEP has been found to reduce the risk for sexual acquisition of HIV by nearly 99%.2
Although the use of PrEP in the United States has increased steadily since 2012, adherence to an oral formulation remains a significant issue. One study of > 13,000 people found that daily oral PrEP was discontinued by 52% of participants, only 60% of whom reinitiated the therapy after discontinuation.2 Although the federal government has required Medicaid and other insurance providers to cover PrEP in an effort to increase access to the medication, this does not necessarily increase adherence to a daily medication in an often otherwise healthy population.
Long-acting injectable forms of PrEP, which have a reduced dosing frequency that may support adherence, have been studied to potentially replace daily oral pills. This latest study compared cabotegravir (CAB-LA), a long-acting IM injection given every 8 weeks, to daily oral PrEP with tenofovir disoproxil fumarate–emtricitabine (TDF-FTC).1
STUDY SUMMARY
Decreased seroconversion without daily pills
This randomized, double-blind, double-dummy, noninferiority trial compared long-acting injectable vs daily oral PrEP formulations for the prevention of HIV across an international population. Patients were randomized to receive either CAB-LA 600 mg IM every 8 weeks or TDF-FTC 300/200 mg orally daily. The double-dummy methodology meant that those patients receiving active CAB-LA also received a daily oral placebo, while those patients receiving active TDF-FTC also received a placebo injection every 8 weeks.
Study participants were cisgender MSM or transgender women who have sex with men; ages 18 years and older; and in good health but considered to be at high risk for HIV infection. To be included, participants had to have a negative HIV serologic test at enrollment, undetectable blood HIV RNA viral load within 14 days of enrollment, and creatinine clearance ≥ 60 mL/min. Exclusion criteria included intravenous (IV) drug use within 90 days of enrollment, coagulopathy, buttock implants or fillers, a seizure disorder, or a QTc interval > 500 ms.1
The intention-to-treat population included 4566 patients: 2282 in the CAB-LA group and 2284 in the TDF-FTC group. Demographic characteristics—including age, race, geographic region, and cohort (MSM vs transgender women)—were not significantly different between groups at baseline. The study lasted 153 weeks, and > 86% of patients were retained at 1 year (median follow-up, 1.4 years; interquartile range, 0.8-1.9).
Continue to: The primary efficacy and safety...
The primary efficacy and safety outcomes of interest were HIV infection and occurrence of a grade ≥ 2 adverse drug reaction, respectively. HIV seroconversion occurred in 13 of 2282 (0.57%) patients in the CAB-LA group and 39 of 2284 (1.7%) patients in the TDF-FTC group (hazard ratio = 0.34; 95% CI, 0.18-0.62). The rate of severe adverse drug reactions was similar between groups. The study was stopped early due to the superiority of CAB-LA.
WHAT’S NEW
Demonstrated superiority of injectable vs oral PrEP
The results of this study could have a monumental impact on the spread of HIV. Since adherence is a known limitation of daily oral PrEP, a long-acting injectable is an intriguing option. The 8-week period between injections offers convenience, allowing primary care physicians (PCPs) to schedule their patients in advance. And because every injection is administered in the office, this option would help PCPs track adherence. Witnessed adherence to the medication, and its demonstrated superiority, could have a significant effect on HIV prevention.
The limited serious adverse effects reported by both groups may ease some PCPs’ hesitation to prescribe CAB-LA.
CAVEATS
More injection-site reactions (but little impact on adherence)
Notably, 81.4% of patients in the CAB-LA group had injection-site reactions vs 31.3% in the TDF-FTC group. However, only 2.4% of patients in the CAB-LA group opted to stop receiving the injections because of these reactions.
Standard PrEP reduces the risk for HIV acquisition from IV drug use by 74%.2 However, because IV drug use was an exclusion criterion in this study, future research will need to assess CAB-LA’s effectiveness in that population.
CHALLENGES TO IMPLEMENTATION
Price and storage requirementsof CAB-LA may create issues
CAB-LA is expensive, costing more than $25,000 per year—significantly outpricing TDF-FTC, which costs approximately $8300 per year.3 Insurance coverage for PrEP, including CAB-LA, varies widely. Given the superiority reflected in this study, more efforts should be made to lower the cost of the medication.
Another hurdle for CAB-LA is that it requires refrigeration for storage. Although likely not an issue in most of the United States, it will make adoption of this method difficult in other parts of the world.
1. Landovitz RJ, Donnell D, Clement ME, et al; HPTN 083 Study Team. Cabotegravir for HIV prevention in cisgender men and transgender women. N Engl J Med. 2021;385:595-608. doi: 10.1056/NEJMoa2101016
2. Hojilla JC, Hurley LB, Marcus JL, et al. Characterization of HIV preexposure prophylaxis use behaviors and HIV incidence among US adults in an integrated health care system. JAMA Netw Open. 2021;4:e2122692. doi: 10.1001/jamanetworkopen.2021.22692
3. Neilan AM, Landovitz RJ, Le MH, et al. Cost-effectiveness of long-acting injectable HIV preexposure prophylaxis in the United States: a cost-effectiveness analysis. Ann Intern Med. 2022;175:479-489. doi: 10.7326/M21-1548
ILLUSTRATIVE CASE
A 24-year-old cisgender man with no significant past medical history comes to your office requesting PrEP after starting a new sexual relationship. His partner is a 26-year-old cisgender man with known HIV. The patient reports that balancing graduate school and work has made him very forgetful, and he worries that he won’t remember to take a daily pill. Are there any other PrEP methods you can offer?
The efficacy of PrEP to reduce HIV acquisition has been established across varying populations at high risk for transmission.1 PrEP has been found to reduce the risk for sexual acquisition of HIV by nearly 99%.2
Although the use of PrEP in the United States has increased steadily since 2012, adherence to an oral formulation remains a significant issue. One study of > 13,000 people found that daily oral PrEP was discontinued by 52% of participants, only 60% of whom reinitiated the therapy after discontinuation.2 Although the federal government has required Medicaid and other insurance providers to cover PrEP in an effort to increase access to the medication, this does not necessarily increase adherence to a daily medication in an often otherwise healthy population.
Long-acting injectable forms of PrEP, which have a reduced dosing frequency that may support adherence, have been studied to potentially replace daily oral pills. This latest study compared cabotegravir (CAB-LA), a long-acting IM injection given every 8 weeks, to daily oral PrEP with tenofovir disoproxil fumarate–emtricitabine (TDF-FTC).1
STUDY SUMMARY
Decreased seroconversion without daily pills
This randomized, double-blind, double-dummy, noninferiority trial compared long-acting injectable vs daily oral PrEP formulations for the prevention of HIV across an international population. Patients were randomized to receive either CAB-LA 600 mg IM every 8 weeks or TDF-FTC 300/200 mg orally daily. The double-dummy methodology meant that those patients receiving active CAB-LA also received a daily oral placebo, while those patients receiving active TDF-FTC also received a placebo injection every 8 weeks.
Study participants were cisgender MSM or transgender women who have sex with men; ages 18 years and older; and in good health but considered to be at high risk for HIV infection. To be included, participants had to have a negative HIV serologic test at enrollment, undetectable blood HIV RNA viral load within 14 days of enrollment, and creatinine clearance ≥ 60 mL/min. Exclusion criteria included intravenous (IV) drug use within 90 days of enrollment, coagulopathy, buttock implants or fillers, a seizure disorder, or a QTc interval > 500 ms.1
The intention-to-treat population included 4566 patients: 2282 in the CAB-LA group and 2284 in the TDF-FTC group. Demographic characteristics—including age, race, geographic region, and cohort (MSM vs transgender women)—were not significantly different between groups at baseline. The study lasted 153 weeks, and > 86% of patients were retained at 1 year (median follow-up, 1.4 years; interquartile range, 0.8-1.9).
Continue to: The primary efficacy and safety...
The primary efficacy and safety outcomes of interest were HIV infection and occurrence of a grade ≥ 2 adverse drug reaction, respectively. HIV seroconversion occurred in 13 of 2282 (0.57%) patients in the CAB-LA group and 39 of 2284 (1.7%) patients in the TDF-FTC group (hazard ratio = 0.34; 95% CI, 0.18-0.62). The rate of severe adverse drug reactions was similar between groups. The study was stopped early due to the superiority of CAB-LA.
WHAT’S NEW
Demonstrated superiority of injectable vs oral PrEP
The results of this study could have a monumental impact on the spread of HIV. Since adherence is a known limitation of daily oral PrEP, a long-acting injectable is an intriguing option. The 8-week period between injections offers convenience, allowing primary care physicians (PCPs) to schedule their patients in advance. And because every injection is administered in the office, this option would help PCPs track adherence. Witnessed adherence to the medication, and its demonstrated superiority, could have a significant effect on HIV prevention.
The limited serious adverse effects reported by both groups may ease some PCPs’ hesitation to prescribe CAB-LA.
CAVEATS
More injection-site reactions (but little impact on adherence)
Notably, 81.4% of patients in the CAB-LA group had injection-site reactions vs 31.3% in the TDF-FTC group. However, only 2.4% of patients in the CAB-LA group opted to stop receiving the injections because of these reactions.
Standard PrEP reduces the risk for HIV acquisition from IV drug use by 74%.2 However, because IV drug use was an exclusion criterion in this study, future research will need to assess CAB-LA’s effectiveness in that population.
CHALLENGES TO IMPLEMENTATION
Price and storage requirementsof CAB-LA may create issues
CAB-LA is expensive, costing more than $25,000 per year—significantly outpricing TDF-FTC, which costs approximately $8300 per year.3 Insurance coverage for PrEP, including CAB-LA, varies widely. Given the superiority reflected in this study, more efforts should be made to lower the cost of the medication.
Another hurdle for CAB-LA is that it requires refrigeration for storage. Although likely not an issue in most of the United States, it will make adoption of this method difficult in other parts of the world.
1. Landovitz RJ, Donnell D, Clement ME, et al; HPTN 083 Study Team. Cabotegravir for HIV prevention in cisgender men and transgender women. N Engl J Med. 2021;385:595-608. doi: 10.1056/NEJMoa2101016
2. Hojilla JC, Hurley LB, Marcus JL, et al. Characterization of HIV preexposure prophylaxis use behaviors and HIV incidence among US adults in an integrated health care system. JAMA Netw Open. 2021;4:e2122692. doi: 10.1001/jamanetworkopen.2021.22692
3. Neilan AM, Landovitz RJ, Le MH, et al. Cost-effectiveness of long-acting injectable HIV preexposure prophylaxis in the United States: a cost-effectiveness analysis. Ann Intern Med. 2022;175:479-489. doi: 10.7326/M21-1548
PRACTICE CHANGER
Consider intramuscular (IM) injectable cabotegravir every 8 weeks for HIV preexposure prophylaxis (PrEP) in cisgender men who have sex with men (MSM) and in transgender women.
STRENGTH OF RECOMMENDATION
B: Based on a single randomized controlled trial.1
Landovitz RJ, Donnell D, Clement ME, et al; HPTN 083 Study Team. Cabotegravir for HIV prevention in cisgender men and transgender women. N Engl J Med. 2021;385:595-608. doi: 10.1056/NEJMoa2101016

Screening for hepatitis B: Where the CDC and USPSTF diverge
The Centers for Disease Control and Prevention (CDC) recently published new recommendations on screening for hepatitis B infection.1 They recommend screening all adults (ages 18 years and older) at least once.
These recommendations differ in a few ways from those of the US Preventive Services Task Force (USPSTF).2 This Practice Alert will highlight these differences but also point out areas of agreement between the 2 sets of recommendations—and discuss why 2 separate agencies in the US Department of Health and Human Services reached different conclusions on some issues.
First, some background on hepatitis B
An estimated 580,000 to 2.4 million people in the United States have chronic hepatitis B (CHB) infection—and as many as two-thirds are unaware of it.3 In 2020, the Department of Health and Human Services published the Viral Hepatitis National Strategic Plan for the United States with a stated goal of increasing awareness of infection status among those with hepatitis B virus (HBV) from 32% to 90% by 2030.4 People living in the United States but born outside the country are at highest risk for CHB; they account for 69% of those with the infection.5
The incidence of acute HBV infection has declined markedly since the HBV vaccine was recommended for high-risk adults in 1982 and universally for infants in 1991.6,7 Overall rates of HBV infection declined fairly steadily starting around 1987—but in 2014, rates began to increase, especially in those ages 40 to 59 years.8,9 In 2019, 3192 cases were reported; but when one factors in underreporting, the CDC estimates that the number is likely closer to 20,700.10 This uptick is one reason the Advisory Committee on Immunization Practices changed its HBV vaccination recommendation for adults from a risk-based to a universal recommendation for all unvaccinated adults through age 60 years.10
Chronic hepatitis B infection has serious consequences
The proportion of those infected with HBV who develop CHB differs by age at infection: 80% to 90% if infected during infancy, 30% if infected before age 6 years, and 1% to 12% if infected as an older child or adult.8
CHB infection can lead to chronic liver disease, including cirrhosis of the liver, liver cancer, and liver failure. About 25% of those who develop CHB infection during childhood and 15% of those who develop chronic infection after childhood will die prematurely from cirrhosis or liver cancer.8
The American Association for the Study of Liver Diseases (AASLD) classifies CHB into 4 phases that reflect the rate of viral replication and the patient’s immune response.11 These phases are:
- immune-tolerant (minimal inflammation and fibrosis)
- hepatitis B e-antigen (HBeAg)-positive immune-active (moderate-to-severe inflammation or fibrosis)
- inactive CHB (minimal necroinflammation but variable fibrosis), and
- HBeAg-negative immune reactivation (moderate-to-severe inflammation or fibrosis).11
Continue to: The progression from one phase...
The progression from one phase to the next varies by patient, and not all patients will progress through each phase. The AASLD recommends periodically monitoring the HBV DNA and alanine aminotransferase (ALT) levels in those with CHB to track the progression from one phase to the next and to guide treatment decisions.
Treatment can be beneficial for those who meet criteria
The evidence report prepared for USPSTF found that antiviral treatment of those with CHB infection resulted in improved intermediate outcomes (histologic improvement, loss of hepatitis B surface antigen [HBsAg], loss of HBeAg, HBeAg seroconversion, virologic suppression, and normalization of ALT levels). The magnitude of benefit varied by location and study design.12
In addition, the evidence review found that antiviral therapy was associated with a decreased risk for overall mortality (relative risk [RR] = 0.15; 95% CI, 0.03-0.69), cirrhosis (RR = 0.72; 95% CI, 0.29-1.77), and hepatocellular carcinoma (RR = 0.60; 95% CI, 0.16-2.33). However, these results came from studies that were “limited due to small numbers of trials, few events, and insufficient duration of follow-up.”12
The USPSTF and the CDC both judged that the intermediate outcome results, as well as findings that improved intermediate outcomes lead to decreases in chronic liver disease, are strong enough evidence for their recommendations.
However, not all patients with CHB infection require treatment; estimates of patients with HBV infection meeting AASLD criteria for treatment range from 24% to 48%.1 The AASLD guideline on the treatment of CHB infection is an excellent resource that makes recommendations on the initial evaluation, ongoing monitoring, and treatment decisions for those with CHB.11
Continue to: How CDC and USPSTF guidance on HBV screeinng differs
How CDC and USPSTF guidance on HBV screening differs
The CDC and USPSTF recommendations for HBV screening differ in 3 aspects: whom to screen, whom to classify as at high risk for HBV infection, and what tests to use for screening.
Who should be screened?
The USPSTF recommends screening adults and adolescents who are at high risk for HBV. The CDC recommends screening all adults at least once. Both entities agree that those who are at increased risk should be screened periodically, although the optimal frequency has not been established. The USPSTF does not recommend against screening for the general population, so universal screening (as advocated by the CDC) is not in direct conflict with the USPSTF’s recommendations.
Who is at increased risk for HBV infection?
The CDC and the USPSTF differ slightly on the factors they consider to constitute increased risk for HBV infection. These are listed in TABLE 1.1,2

The CDC lists 6 categories that the USPSTF does not mention. However, 4 of these categories are mentioned indirectly in the USPSTF evidence report that accompanies the recommendations, via statements that certain settings have high proportions of people at risk for HBV infection: sexually transmitted infection clinics; HIV testing and treatment centers; health care settings that target services toward people who inject drugs and men who have sex with men; correctional facilities; hemodialysis facilities; and institutions and nonresidential daycare centers for developmentally disabled persons. People who are served at most of these facilities are also at risk for hepatitis C virus infection.
Three categories are listed by the CDC and not by the USPSTF, in either the recommendation or evidence report. These include a history of multiple sex partners; elevated ALT or aspartate aminotransferase levels of unknown origin; and patient request for testing (because they may not want to reveal risk factors).
Continue to: What test(s) should be ordered?
What test(s) should be ordered?
The USPSTF recommends screening using HBsAg. The CDC recommends using triple-panel screening: HBsAg, anti-hepatitis B surface antigen (anti-HBs), and total antibody to hepatitis B core antigen (anti-HBc).
HBsAg indicates HBV infection, either acute or chronic, or a recent dose of HBV vaccine. Anti-HBs indicate recovery from HBV infection, response to HBV vaccine, or recent receipt of hepatitis B immune globulin. Total anti-HBc develops in all HBV infections, resolved or current, and usually persists for life. Vaccine-induced immunity does not cause anti-HBc to develop.
The USPSTF’s rationale is that testing for HBsAg is more than 98% sensitive and specific for detecting HBV infections.2 The CDC recommends triple testing because it can detect those with asymptomatic active HBV infections (this would be a rare occurrence); those who have resolved infection and might be susceptible to reactivation (eg, those who are immunosuppressed); and those who are susceptible and need vaccination.
Interpretation of HBV test results and suggested actions are described in TABLE 2.1,8,13

Why do the CDC and USPSTF differ?
While it would be optimal if the CDC and the USPSTF coordinated and harmonized recommendations, this is difficult to achieve given their different missions. The USPSTF is charged to make evidence-based recommendations about preventive services such as screenings, behavioral counseling, and preventive medications, which are provided by clinicians to individual patients. The Task Force uses a very strict evidence-based process and will not make recommendations unless there is adequate evidence of efficacy and safety. Members of the Task Force are primary care professionals, and their collaborating professional organizations are primary care focused.
The CDC takes a community-wide, public health perspective. The professionals that work there are not always clinicians. They strive to prevent as much illness as possible, using public health measures and making recommendations to clinicians. They collaborate with professional organizations; on topics such as hepatitis and other infectious diseases, they collaborate with specialty-oriented societies. Given the imperative to act with the best evidence available, their evidence assessment process is not as strict.
The result, at times, is slight differences in recommendations. However, the HBV screening recommendations from the CDC and the USPSTF agree more than they do not. Based on practice-specific characteristics, family physicians should decide if they want to screen all adults or only those at increased risk, and whether to use single- or triple-test screening.
1. Conners EE, Panagiotakopoulos L, Hofmeister MG, et al. Screening and testing for hepatitis B virus infection: CDC recommendations—United States, 2023. MMWR Recomm Rep. 2023;72:1-25. doi: 10.15585/mmwr.rr7201a1
2. USPSTF. Hepatitis B virus infection in adolescents and adults: screening. Final recommendation statement. Published December 15, 2020. Access June 21, 2023. www.uspreventiveser vicestaskforce.org/uspstf/recommendation/hepatitis-b-virus-infection-screening
3. Roberts H, Ly KN, Yin S, et al. Prevalence of HBV infection, vaccine-induced immunity, and susceptibility among at-risk populations: US households, 2013-2018. Hepatology. 2021;74:2353-2365. doi: 10.1002/hep.31991
4. US Department of Health and Human Services. Viral hepatitis national strategic plan for the United States: a roadmap to elimination (2021-2025). Published January 7, 2021. Accessed June 21, 2023. www.hhs.gov/sites/default/files/Viral-Hepatitis-National-Strategic-Plan-2021-2025.pdf
5. Wong RJ, Brosgart CL, Welch S, et al. An updated assessment of chronic hepatitis B prevalence among foreign-born persons living in the United States. Hepatology. 2021;74:607-626. doi: 10.1002/hep.31782
6. CDC. Recommendation of the Immunization Practices Advisory Committee (ACIP): inactivated hepatitis B virus vaccine. MMWR Morb Mortal Wkly Rep. 1982;31:317-318, 327-288.
7. CDC. Hepatitis B virus: a comprehensive strategy for eliminating transmission in the United States through universal childhood vaccination: recommendations of the Immunization Practices Advisory Committee. MMWR Morb Mortal Wkly Rep. 1991;40:1-25.
8. Schillie S, Vellozzi C, Reingold A, et al. Prevention of hepatitis B virus infection in the United States: recommendations of the Advisory Committee on Immunization Practices. MMWR Recomm Rep. 2018;67:1-31. doi: 10.15585/mmwr.rr6701a1
9. CDC. Viral hepatitis surveillance 2019. Published July 2021. Accessed June 29, 2023. www.cdc.gov/hepatitis/statistics/2019surveillance/
10. Weng MK, Doshani M, Khan MA, et al. Universal hepatitis B vaccination in adults aged 19-59 years: updated recommendations of the Advisory Committee on Immunization Practices—United States, 2022. MMWR Morb Mortal Wkly Rep. 2022;71:477-483. doi: 10.15585/mmwr.mm7113a1
11. Terrault NA, Bzowej NH, Chang KM, et al; American Association for the Study of Liver Diseases. AASLD guidelines for treatment of chronic hepatitis B. Hepatology. 2016;63:261-283. doi: 10.1002/hep.28156
12. Chou R, Blazina I, Bougatsos C, et al. Screening for hepatitis B virus infection in nonpregnant adolescents and adults: updated evidence report and systematic review for the US Preventive Services Task Force. JAMA. 2020;324:2423-2436. doi: 10.1001/jama.2020.19750
13. Abara WE, Qaseem A, Schillie S, et al. Hepatitis B vaccination, screening, and linkage to care: best practice advice from the American College of Physicians and the Centers for Disease Control and Prevention. Ann Intern Med. 2017;167:794-804. doi: 10.7326/M17-110
The Centers for Disease Control and Prevention (CDC) recently published new recommendations on screening for hepatitis B infection.1 They recommend screening all adults (ages 18 years and older) at least once.
These recommendations differ in a few ways from those of the US Preventive Services Task Force (USPSTF).2 This Practice Alert will highlight these differences but also point out areas of agreement between the 2 sets of recommendations—and discuss why 2 separate agencies in the US Department of Health and Human Services reached different conclusions on some issues.
First, some background on hepatitis B
An estimated 580,000 to 2.4 million people in the United States have chronic hepatitis B (CHB) infection—and as many as two-thirds are unaware of it.3 In 2020, the Department of Health and Human Services published the Viral Hepatitis National Strategic Plan for the United States with a stated goal of increasing awareness of infection status among those with hepatitis B virus (HBV) from 32% to 90% by 2030.4 People living in the United States but born outside the country are at highest risk for CHB; they account for 69% of those with the infection.5
The incidence of acute HBV infection has declined markedly since the HBV vaccine was recommended for high-risk adults in 1982 and universally for infants in 1991.6,7 Overall rates of HBV infection declined fairly steadily starting around 1987—but in 2014, rates began to increase, especially in those ages 40 to 59 years.8,9 In 2019, 3192 cases were reported; but when one factors in underreporting, the CDC estimates that the number is likely closer to 20,700.10 This uptick is one reason the Advisory Committee on Immunization Practices changed its HBV vaccination recommendation for adults from a risk-based to a universal recommendation for all unvaccinated adults through age 60 years.10
Chronic hepatitis B infection has serious consequences
The proportion of those infected with HBV who develop CHB differs by age at infection: 80% to 90% if infected during infancy, 30% if infected before age 6 years, and 1% to 12% if infected as an older child or adult.8
CHB infection can lead to chronic liver disease, including cirrhosis of the liver, liver cancer, and liver failure. About 25% of those who develop CHB infection during childhood and 15% of those who develop chronic infection after childhood will die prematurely from cirrhosis or liver cancer.8
The American Association for the Study of Liver Diseases (AASLD) classifies CHB into 4 phases that reflect the rate of viral replication and the patient’s immune response.11 These phases are:
- immune-tolerant (minimal inflammation and fibrosis)
- hepatitis B e-antigen (HBeAg)-positive immune-active (moderate-to-severe inflammation or fibrosis)
- inactive CHB (minimal necroinflammation but variable fibrosis), and
- HBeAg-negative immune reactivation (moderate-to-severe inflammation or fibrosis).11
Continue to: The progression from one phase...
The progression from one phase to the next varies by patient, and not all patients will progress through each phase. The AASLD recommends periodically monitoring the HBV DNA and alanine aminotransferase (ALT) levels in those with CHB to track the progression from one phase to the next and to guide treatment decisions.
Treatment can be beneficial for those who meet criteria
The evidence report prepared for USPSTF found that antiviral treatment of those with CHB infection resulted in improved intermediate outcomes (histologic improvement, loss of hepatitis B surface antigen [HBsAg], loss of HBeAg, HBeAg seroconversion, virologic suppression, and normalization of ALT levels). The magnitude of benefit varied by location and study design.12
In addition, the evidence review found that antiviral therapy was associated with a decreased risk for overall mortality (relative risk [RR] = 0.15; 95% CI, 0.03-0.69), cirrhosis (RR = 0.72; 95% CI, 0.29-1.77), and hepatocellular carcinoma (RR = 0.60; 95% CI, 0.16-2.33). However, these results came from studies that were “limited due to small numbers of trials, few events, and insufficient duration of follow-up.”12
The USPSTF and the CDC both judged that the intermediate outcome results, as well as findings that improved intermediate outcomes lead to decreases in chronic liver disease, are strong enough evidence for their recommendations.
However, not all patients with CHB infection require treatment; estimates of patients with HBV infection meeting AASLD criteria for treatment range from 24% to 48%.1 The AASLD guideline on the treatment of CHB infection is an excellent resource that makes recommendations on the initial evaluation, ongoing monitoring, and treatment decisions for those with CHB.11
Continue to: How CDC and USPSTF guidance on HBV screeinng differs
How CDC and USPSTF guidance on HBV screening differs
The CDC and USPSTF recommendations for HBV screening differ in 3 aspects: whom to screen, whom to classify as at high risk for HBV infection, and what tests to use for screening.
Who should be screened?
The USPSTF recommends screening adults and adolescents who are at high risk for HBV. The CDC recommends screening all adults at least once. Both entities agree that those who are at increased risk should be screened periodically, although the optimal frequency has not been established. The USPSTF does not recommend against screening for the general population, so universal screening (as advocated by the CDC) is not in direct conflict with the USPSTF’s recommendations.
Who is at increased risk for HBV infection?
The CDC and the USPSTF differ slightly on the factors they consider to constitute increased risk for HBV infection. These are listed in TABLE 1.1,2
The CDC lists 6 categories that the USPSTF does not mention. However, 4 of these categories are mentioned indirectly in the USPSTF evidence report that accompanies the recommendations, via statements that certain settings have high proportions of people at risk for HBV infection: sexually transmitted infection clinics; HIV testing and treatment centers; health care settings that target services toward people who inject drugs and men who have sex with men; correctional facilities; hemodialysis facilities; and institutions and nonresidential daycare centers for developmentally disabled persons. People who are served at most of these facilities are also at risk for hepatitis C virus infection.
Three categories are listed by the CDC and not by the USPSTF, in either the recommendation or evidence report. These include a history of multiple sex partners; elevated ALT or aspartate aminotransferase levels of unknown origin; and patient request for testing (because they may not want to reveal risk factors).
Continue to: What test(s) should be ordered?
What test(s) should be ordered?
The USPSTF recommends screening using HBsAg. The CDC recommends using triple-panel screening: HBsAg, anti-hepatitis B surface antigen (anti-HBs), and total antibody to hepatitis B core antigen (anti-HBc).
HBsAg indicates HBV infection, either acute or chronic, or a recent dose of HBV vaccine. Anti-HBs indicate recovery from HBV infection, response to HBV vaccine, or recent receipt of hepatitis B immune globulin. Total anti-HBc develops in all HBV infections, resolved or current, and usually persists for life. Vaccine-induced immunity does not cause anti-HBc to develop.
The USPSTF’s rationale is that testing for HBsAg is more than 98% sensitive and specific for detecting HBV infections.2 The CDC recommends triple testing because it can detect those with asymptomatic active HBV infections (this would be a rare occurrence); those who have resolved infection and might be susceptible to reactivation (eg, those who are immunosuppressed); and those who are susceptible and need vaccination.
Interpretation of HBV test results and suggested actions are described in TABLE 2.1,8,13
Why do the CDC and USPSTF differ?
While it would be optimal if the CDC and the USPSTF coordinated and harmonized recommendations, this is difficult to achieve given their different missions. The USPSTF is charged to make evidence-based recommendations about preventive services such as screenings, behavioral counseling, and preventive medications, which are provided by clinicians to individual patients. The Task Force uses a very strict evidence-based process and will not make recommendations unless there is adequate evidence of efficacy and safety. Members of the Task Force are primary care professionals, and their collaborating professional organizations are primary care focused.
The CDC takes a community-wide, public health perspective. The professionals that work there are not always clinicians. They strive to prevent as much illness as possible, using public health measures and making recommendations to clinicians. They collaborate with professional organizations; on topics such as hepatitis and other infectious diseases, they collaborate with specialty-oriented societies. Given the imperative to act with the best evidence available, their evidence assessment process is not as strict.
The result, at times, is slight differences in recommendations. However, the HBV screening recommendations from the CDC and the USPSTF agree more than they do not. Based on practice-specific characteristics, family physicians should decide if they want to screen all adults or only those at increased risk, and whether to use single- or triple-test screening.
1. Conners EE, Panagiotakopoulos L, Hofmeister MG, et al. Screening and testing for hepatitis B virus infection: CDC recommendations—United States, 2023. MMWR Recomm Rep. 2023;72:1-25. doi: 10.15585/mmwr.rr7201a1
2. USPSTF. Hepatitis B virus infection in adolescents and adults: screening. Final recommendation statement. Published December 15, 2020. Access June 21, 2023. www.uspreventiveser vicestaskforce.org/uspstf/recommendation/hepatitis-b-virus-infection-screening
3. Roberts H, Ly KN, Yin S, et al. Prevalence of HBV infection, vaccine-induced immunity, and susceptibility among at-risk populations: US households, 2013-2018. Hepatology. 2021;74:2353-2365. doi: 10.1002/hep.31991
4. US Department of Health and Human Services. Viral hepatitis national strategic plan for the United States: a roadmap to elimination (2021-2025). Published January 7, 2021. Accessed June 21, 2023. www.hhs.gov/sites/default/files/Viral-Hepatitis-National-Strategic-Plan-2021-2025.pdf
5. Wong RJ, Brosgart CL, Welch S, et al. An updated assessment of chronic hepatitis B prevalence among foreign-born persons living in the United States. Hepatology. 2021;74:607-626. doi: 10.1002/hep.31782
6. CDC. Recommendation of the Immunization Practices Advisory Committee (ACIP): inactivated hepatitis B virus vaccine. MMWR Morb Mortal Wkly Rep. 1982;31:317-318, 327-288.
7. CDC. Hepatitis B virus: a comprehensive strategy for eliminating transmission in the United States through universal childhood vaccination: recommendations of the Immunization Practices Advisory Committee. MMWR Morb Mortal Wkly Rep. 1991;40:1-25.
8. Schillie S, Vellozzi C, Reingold A, et al. Prevention of hepatitis B virus infection in the United States: recommendations of the Advisory Committee on Immunization Practices. MMWR Recomm Rep. 2018;67:1-31. doi: 10.15585/mmwr.rr6701a1
9. CDC. Viral hepatitis surveillance 2019. Published July 2021. Accessed June 29, 2023. www.cdc.gov/hepatitis/statistics/2019surveillance/
10. Weng MK, Doshani M, Khan MA, et al. Universal hepatitis B vaccination in adults aged 19-59 years: updated recommendations of the Advisory Committee on Immunization Practices—United States, 2022. MMWR Morb Mortal Wkly Rep. 2022;71:477-483. doi: 10.15585/mmwr.mm7113a1
11. Terrault NA, Bzowej NH, Chang KM, et al; American Association for the Study of Liver Diseases. AASLD guidelines for treatment of chronic hepatitis B. Hepatology. 2016;63:261-283. doi: 10.1002/hep.28156
12. Chou R, Blazina I, Bougatsos C, et al. Screening for hepatitis B virus infection in nonpregnant adolescents and adults: updated evidence report and systematic review for the US Preventive Services Task Force. JAMA. 2020;324:2423-2436. doi: 10.1001/jama.2020.19750
13. Abara WE, Qaseem A, Schillie S, et al. Hepatitis B vaccination, screening, and linkage to care: best practice advice from the American College of Physicians and the Centers for Disease Control and Prevention. Ann Intern Med. 2017;167:794-804. doi: 10.7326/M17-110

Knee pain and injury: When is a surgical consult needed?
Evidence supports what family physicians know to be true: Knee pain is an exceedingly common presenting problem in the primary care office. Estimates of lifetime incidence reach as high as 54%,1 and the prevalence of knee pain in the general population is increasing.2 Knee disability can result from acute or traumatic injuries as well as chronic, degenerative conditions such as osteoarthritis (OA). The decision to pursue orthopedic consultation for a particular injury or painful knee condition can be challenging. To address this, we highlight specific knee diagnoses known to cause pain, with the aim of describing which conditions likely will necessitate surgical consultation—and which won’t.
Acute or nondegenerative knee injuries and pain
Acute knee injuries range in severity from simple contusions and sprains to high-energy, traumatic injuries with resulting joint instability and potential neurovascular compromise. While conservative treatment often is successful for many simple injuries, surgical management—sometimes urgently or emergently—is needed in other cases, as will be detailed shortly.
Neurovascular injury associated with knee dislocations
Acute neurovascular injuries often require emergent surgical intervention. Although rare, tibiofemoral (knee) dislocations pose a significant challenge to the clinician in both diagnosis and management. The reported frequency of popliteal artery injury or rupture following a dislocation varies widely, with rates ranging from 5% to 64%, according to older studies; more recent data, however, suggest the rate is actually as low as 3.3%.3
Immediate immobilization and emergency department transport for monitoring, orthopedics consultation, and vascular studies or vascular surgery consultation is recommended in the case of a suspected knee dislocation. In one cross-sectional cohort study, the surgical management of knee dislocations yielded favorable outcomes in > 75% of cases.5
Tibial plateau fracture
This fracture often occurs as a result of high-energy trauma, such as contact sports or motor vehicle accidents, and is characterized by a proximal tibial fracture line with extension to the articular surface. X-rays often are sufficient for initial diagnosis. Computed tomography can help rule out a fracture line when clinical suspicion is high and x-rays are nondiagnostic. As noted earlier, any suggestion of neurovascular compromise on physical exam requires an emergent orthopedic surgeon consultation for a possible displaced and unstable (or more complex) injury (FIGURE 1).6-8

Nondisplaced tibial plateau fractures without supraphysiologic ligamentous laxity on valgus or varus stress testing can be managed safely with protection and early mobilization, gradual progression of weight-bearing, and serial x-rays to ensure fracture healing and stability.
Gross joint instability identified by positive valgus or varus stress testing, positive anterior or posterior drawer testing, or patient inability to tolerate these maneuvers due to pain similarly should raise suspicion for a more significant fracture at risk for concurrent neurovascular injury. Acute compartment syndrome also is a known complication of tibial plateau fractures and similarly requires emergent operative management. Urgent surgical consultation is recommended for fractures with displaced fracture fragments, tibial articular surface step-off or depression, fractures with concurrent joint laxity, or medial plateau fractures.6-8
Continue to: Patella fractures
Patella fractures
These fractures occur as a direct blow to the front of the knee, such as falling forward onto a hard surface, or indirectly due to a sudden extreme eccentric contraction of the quadriceps muscle. Nondisplaced fractures with an intact knee extension mechanism, which is examined via a supine straight-leg raise or seated knee extension, are managed with weight-bearing as tolerated in strict immobilization in full extension for 4 to 6 weeks, with active range-of-motion and isometric quadriceps exercises beginning in 1 to 2 weeks. Serial x-rays also are obtained to ensure fracture displacement does not occur during the rehabilitation process.9
High-quality evidence guiding follow-up care and comparing outcomes of surgical and nonsurgical management of patella fractures is lacking, and studies comparing different surgical techniques are of lower methodological quality.10 Nevertheless, displaced or comminuted patellar fractures are referred urgently to orthopedic surgical care for fixation, as are those with concurrent loose bodies, chondral surface injuries or articular step-off, or osteochondral fractures.9 Inability to perform a straight-leg raise (ie, clinical loss of the knee extension mechanism) suggests a fracture under tension that likely also requires surgical fixation for successful recovery. Neurovascular injuries are unlikely in most patellar fractures but would require emergent surgical consultation.9
Ligamentous injury
Tibiofemoral joint laxity occurs as a result of ligamentous injury, with or without tibial plateau fracture. The anterior cruciate ligament (ACL), posterior cruciate ligament (PCL), medial collateral ligament (MCL), and lateral collateral ligament (LCL) comprise the 4 main ligaments of the knee. The ACL resists anterior tibial translation and rotational forces, while the PCL resists posterior tibial translation. The MCL and LCL resist valgus and varus stress, respectively.
Ligament injuries are classified as Grades 1 to 311:
- Grade 1 sprains. The ligament is stretched, but there is no macroscopic tearing; joint stability is maintained.
- Grade 2 sprains. There are partial macroscopic ligament tears. There is joint laxity due to the partial loss of the ligament’s structural integrity.
- Grade 3 sprains. The ligament is fully avulsed or ruptured with resultant gross joint instability.
Continue to: ACL tears
ACL tears occur most commonly via a noncontact event, as when an individual plants their foot and suddenly changes direction during sport or other physical activity. Treatment hinges on patient activity levels and participation in sports. Patients who do not plan to engage in athletic movements (that require changes in direction or planting and twisting) and who otherwise maintain satisfactory joint stability during activities of daily living may elect to defer or even altogether avoid surgical reconstruction of isolated ACL tears. One pair of studies demonstrated equivalent outcomes in surgical and nonsurgical management in 121 young, nonelite athletes at 2- and 5-year follow-up, although the crossover from the nonsurgical to surgical groups was high.12,13 Athletes who regain satisfactory function and stability nonoperatively can defer surgical intervention. However, the majority of active patients and athletes will require surgical ACL reconstruction to return to pre-injury functional levels.14
PCL sprains occur as a result of sudden posteriorly directed force on the tibia, such as when the knee is hyperextended or a patient falls directly onto a flexed knee. Patients with Grade 1 and 2 isolated sprains generally will recover with conservative care, as will patients with some Grade 3 complete tears that do not fully compromise joint stability. However, high-grade PCL injuries often are comorbid with posterolateral corner or other injuries, leading to a higher likelihood of joint instability and thus the need for surgical intervention for the best chance at an optimal outcome.15
MCL sprain. Surgical management is not required in an isolated Grade 1 or 2 MCL sprain, as the hallmarks of recovery—return of joint stability, knee strength and range of motion, and pain reduction—can be achieved successfully with conservative management. Isolated Grade 3 MCL sprains are also successfully managed nonoperatively16 except in specific cases, such as a concurrent large avulsion fracture.17
LCL sprain. Similarly, isolated Grade 1 and 2 LCL sprains generally do not require surgical intervention. However, Grade 3 LCL injuries usually do, as persistent joint instability and poor functional outcomes are more common with nonsurgical management.18-20 Additionally, high-grade LCL injuries frequently manifest with comorbid meniscus injuries or sprains of the posterolateral corner of the knee, a complex anatomic structure that provides both static and dynamic tibiofemoral joint stability. Surgical repair or reconstruction of the posterolateral corner frequently is necessary for optimal functional outcomes.21
Multiligamentous sprains frequently lead to gross joint instability and necessitate orthopedic surgeon consultation to determine the best treatment plan; this should be done emergently if neurovascular compromise is suspected. A common injury combination is simultaneous ACL and MCL sprains with or without meniscus injury. In these cases, some surgeons will choose to defer ACL reconstruction until after MCL healing is achieved. This allows the patient to regain valgus stability of the joint prior to performing ACL reconstruction to regain rotational and anterior stability.20
Continue to: Patellar dislocations
Patellar dislocations represent a relatively common knee injury in young active patients, often occurring in a noncontact fashion when a valgus force is applied to an externally rotated and planted lower leg.
Major tendon rupture
Patellar tendon ruptures occur when a sudden eccentric force is applied to the knee, such as when landing from a jump with the knee flexed. Patellar tendon ruptures frequently are clinically apparent, with patients demonstrating a high-riding patella and loss of active knee extension. Quadriceps tendon ruptures often result from a similar injury mechanism in older patients, with a similar loss of active knee extension and a palpable gap superior to the patella.24
Partial tears in patients who can maintain full extension of the knee against gravity are treated nonoperatively, but early surgical repair is indicated for complete quadriceps or patellar tendon ruptures to achieve optimal outcomes.
Even with prompt treatment, return to sport is not guaranteed. According to a recent systematic review, athletes returned to play 88.9% and 89.8% of the time following patellar and quadriceps tendon repairs, respectively. However, returning to the same level of play was less common and achieved 80.8% (patellar tendon repair) and 70% (quadriceps tendon repair) of the time. Return-to-work rates were higher, at 96% for both surgical treatments.29
Locked knee and acute meniscus tears in younger patients
In some acute knee injuries, meniscus tears, loose cartilage bodies or osteochondral defects, or other internal structures can become interposed between the femoral and tibial surfaces, preventing both active and passive knee extension. Such injuries are often severely painful and functionally debilitating. While manipulation under anesthesia can acutely restore joint function,30 diagnostic and therapeutic arthroscopy often is pursued for definitive treatment.31 Compared to the gold standard of diagnostic arthroscopy, preoperative magnetic resonance imaging (MRI) carries positive and negative predictive values of 85% and 77%, respectively, in identifying or ruling out the anatomic structure responsible for a locked knee. 32 As such,
Continue to: Depending on the location...
Depending on the location, size, and shape of an acute meniscus tear in younger patients, surgical repair may be an option to preserve long-term joint function. In one case series of patients younger than 20 years, 62% of meniscus repairs yielded good outcomes after a mean follow-up period of 16.8 years.33
Osteochondritis dissecans
Osteochondritis dissecans is characterized by subchondral bone osteonecrosis that most often occurs in pediatric patients, potentially causing the separation of a fragment of articular cartilage and subchondral bone into the joint space (FIGURE 2). In early stages, nonoperative treatment consisting of prolonged rest followed by physical therapy to gradually return to activity is recommended to prevent small, low-grade lesions from progressing to unstable or separated fragments. Arthroscopy, which consists of microfracture or other surgical resurfacing techniques to restore joint integrity, is pursued in more advanced cases of unstable or separated fragments.

High-quality data guiding the management of osteochondritis dissecans are lacking, and these recommendations are based on consensus guidelines.34
Septic arthritis
Septic arthritis is a medical emergency caused by the hematogenous spread of microorganisms, most often staphylococci and streptococci species. Less commonly, it arises from direct inoculation through an open wound or, rarely, iatrogenically following a joint injection procedure. Clinical signs of septic arthritis include joint pain, joint swelling, and fever. Passive range of motion of the joint is often severely painful. Synovial fluid studies consistent with septic arthritis include an elevated white blood cell count greater than 25,000/mcL with polymorphonuclear cell predominance.35 The knee accounts for more than 50% of septic arthritis cases, and surgical drainage usually is required to achieve infection source control and decrease morbidity and mortality due to destruction of articular cartilage when treatment is delayed.36
Chronic knee injuries and pain
Surgical intervention for chronic knee injuries and pain generally is considered when patients demonstrate significant functional impairment and persistent symptoms despite pursuing numerous nonsurgical treatment options. A significant portion of chronic knee pain is due to degenerative processes such as OA or meniscus injuries, or tears without a history of trauma that do not cause locking of the knee. Treatments for degenerative knee pain include supervised exercise, physical therapy, bracing, offloading with a cane or other equipment, topical or oral anti-inflammatories or analgesics, and injectable therapies such as intra-articular corticosteroids.37
Continue to: Other common causes...
Other common causes of chronic knee pain include chronic tendinopathy or biomechanical syndromes such as patellofemoral pain syndrome or iliotibial band syndrome. Surgical treatment of these conditions is pursued in select cases and only after exhausting nonoperative treatment programs, as recommended by international consensus statements,38 societal guidelines,39 and expert opinion.40 High-quality data on the effectiveness, or ineffectiveness, of surgical intervention for these conditions are lacking.
Despite being one of the most commonly performed surgical procedures in the United States,41 arthroscopic partial meniscectomy treatment of degenerative meniscus tears does not lead to improved outcomes compared to nonsurgical management, according to multiple recent studies.42-45 Evidence does not support routine arthroscopic intervention for degenerative meniscus tears or OA,42 and recent guidelines recommend against it46 or to pursue it only after nonsurgical treatments have failed.37
Surgical management of degenerative knee conditions generally consists of partial or total arthroplasty and is similarly considered after failure of conservative measures. Appropriate use criteria that account for multiple clinical and patient factors are used to enhance patient selection for the procedure.47
Takeaways
Primary care clinicians will treat patients sustaining knee injuries and see many patients with knee pain in the outpatient setting. Treatment options vary considerably depending on the underlying diagnosis and resulting functional losses. Several categories of clinical presentation, including neurovascular injury, unstable or displaced fractures, joint instability, major tendon rupture, significant mechanical symptoms such as a locked knee, certain osteochondral injuries, and septic arthritis, likely or almost always warrant surgical consultation (TABLE3-10,12-36). Occasionally, as in the case of neurovascular injury or septic arthritis, such consultation should be emergent.

CORRESPONDENCE
David M. Siebert, MD, Sports Medicine Center at Husky Stadium, 3800 Montlake Boulevard NE, Seattle, WA 98195; [email protected]
1. Baker P, Reading I, Cooper C, et al. Knee disorders in the general population and their relation to occupation. Occup Environ Med. 2003;60:794-797. doi: 10.1136/oem.60.10.794
2. Nguyen UD, Zhang Y, Zhu Y, et al. Increasing prevalence of knee pain and symptomatic knee osteoarthritis: survey and cohort data. Ann Intern Med. 20116;155:725-732. doi: 10.7326/0003-4819-155-11-201112060-00004
3. Natsuhara KM, Yeranosian MG, Cohen JR, et al. What is the frequency of vascular injury after knee dislocation? Clin Orthop Relat Res. 2014;472:2615-2620. doi: 10.1007/s11999-014-3566-1
4. Seroyer ST, Musahl V, Harner CD. Management of the acute knee dislocation: the Pittsburgh experience. Injury. 2008;39:710-718. doi: 10.1016/j.injury.2007.11.022
5. Sinan SM, Elsoe R, Mikkelsen C, et al. Clinical, functional, and patient-reported outcome of traumatic knee dislocations: a retrospective cohort study of 75 patients with 6.5-year follow up. Arch Orthop Trauma Surg. 2023;143:2589-2597. doi: 10.1007/s00402-022-04578-z
6. Schatzker J, Kfuri M. Revisiting the management of tibial plateau fractures. Injury. 2022;53:2207-2218. doi: 10.1016/j.injury.2022.04.006
7. Rudran B, Little C, Wiik A, et al. Tibial plateau fracture: anatomy, diagnosis and management. Br J Hosp Med (Lond). 2020;81:1-9. doi: 10.12968/hmed.2020.0339
8. Tscherne H, Lobenhoffer P. Tibial plateau fractures: management and expected results. Clin Orthop Relat Res. 1993;(292):87-100.
9. Melvin JS, Mehta S. Patellar fractures in adults. J Am Acad Orthop Surg. 2011;19:198-207. doi: 10.5435/00124635-201104000-00004
10. Filho JS, Lenza M, Tamaoki MJ, et al. Interventions for treating fractures of the patella in adults. Cochrane Database Syst Rev. 2021;2:CD009651. doi: 10.1002/14651858.CD009651.pub3
11. Palmer W, Bancroft L, Bonar F, et al. Glossary of terms for musculoskeletal radiology. Skeletal Radiol. 2020;49(suppl 1):1-33. doi: 10.1007/s00256-020-03465-1
12. Frobell RB, Roos EM, Roos HP, et al. A randomized trial of treatment for acute anterior cruciate ligament tears. N Engl J Med. 2010;363:331-342. doi: 10.1056/NEJMoa0907797
13. Frobell RB, Roos HP, Roos EM, et al. Treatment for acute anterior cruciate ligament tear: five year outcome of randomized trial. Br J Sports Med. 2015;49:700. doi: 10.1136/bmj.f232
14. Diermeier TA, Rothrauff BB, Engebretsen L, et al; Panther Symposium ACL Treatment Consensus Group. Treatment after anterior cruciate ligament injury: Panther Symposium ACL Treatment Consensus Group. Br J Sports Med. 2021;55:14-22. doi: 10.1136/bjsports-2020-102200
15. Bedi A, Musahl V, Cowan JB. Management of posterior cruciate ligament injuries: an evidence-based review. J Am Acad Orthop Surg. 2016;24:277-289. doi: 10.5435/JAAOS-D-14-00326
16. Edson CJ. Conservative and postoperative rehabilitation of isolated and combined injuries of the medial collateral ligament. Sports Med Arthrosc Rev. 2006;14:105-110. doi: 10.1097/01.jsa.0000212308.32076.f2
17. Vosoughi F, Dogahe RR, Nuri A, et al. Medial collateral ligament injury of the knee: a review on current concept and management. Arch Bone Jt Surg. 2021;9:255-262. doi: 10.22038/abjs.2021.48458.2401
18. Kannus P. Nonoperative treatment of grade II and III sprains of the lateral ligament compartment of the knee. Am J Sports Med. 1989;17:83-88. doi: 10.1177/036354658901700114
19. Krukhaug Y, Mølster A, Rodt A, et al. Lateral ligament injuries of the knee. Knee Surg Sports Traumatol Arthrosc. 1998;6:21-25. doi: 10.1007/s001670050067
20. Grawe B, Schroeder AJ, Kakazu R, et al. Lateral collateral ligament injury about the knee: anatomy, evaluation, and management. J Am Acad Orthop Surg. 2018 15;26:e120-127. doi: 10.5435/JAAOS-D-16-00028
21. Ranawat A, Baker III CL, Henry S, et al. Posterolateral corner injury of the knee: evaluation and management. J Am Acad Orthop Surg. 2008;16:506-518.
22. Palmu S, Kallio PE, Donell ST, et al. Acute patellar dislocation in children and adolescents: a randomized clinical trial. J Bone Joint Surg Am. 2008;90:463-470. doi: 10.2106/JBJS.G.00072
23. Cohen D, Le N, Zakharia A, et al. MPFL reconstruction results in lower redislocation rates and higher functional outcomes than rehabilitation: a systematic review and meta-analysis. Knee Surg Sports Traumatol Arthrosc. 2022;30:3784-3795. doi: 10.1007/s00167-022-07003-5
24. Siwek CW, Rao JP. Ruptures of the extensor mechanism of the knee joint. J Bone Joint Surg Am. 1981;63:932-937.
25. Konrath GA, Chen D, Lock T, et al. Outcomes following repair of quadriceps tendon ruptures. J Orthop Trauma. 1998;12:273-279. doi: 10.1097/00005131-199805000-00010
26. Rasul Jr. AT, Fischer DA. Primary repair of quadriceps tendon ruptures: results of treatment. Clin Orthop Relat Res. 1993;(289):205-207.
27. Rougraff BT, Reeck CC, Essenmacher J. Complete quadriceps tendon ruptures. Orthopedics. 1996;19:509-514.
28. Bui CN, Learned JR, Scolaro JA. Treatment of patellar fractures and injuries to the extensor mechanism of the knee: a critical analysis review. JBJS Rev. 2018;6:e1. doi: 10.2106/JBJS.RVW.17.00172
29. Haskel JD, Fried JW, Hurley ET, et al. High rates of return to play and work follow knee extensor tendon ruptures but low rate of return to pre-injury level of play. Knee Surg Sports Traumatol Arthrosc. 2021;29:2695-2700. doi: 10.1007/s00167-021-06537-4
30. Critchley IJ, Bracey DJ. The acutely locked knee—is a manipulation worth while? Injury. 1985;16:281-283. doi: 10.1016/s0020-1383(85)80020-6
31. Allum RL, Jones JR. The locked knee. Injury. 1986;17:256-258. doi: 10.1016/0020-1383(86)90231-7
32. Helmark IC, Neergaard K, Krogsgaard MR. Traumatic knee extension deficit (the locked knee): can MRI reduce the need for arthroscopy? Knee Surg Sports Traumatol Arthrosc. 2007;15:863-868. doi: 10.1007/s00167-006-0244-1
33. Noyes FR, Chen RC, Barber-Westin SD, et al. Greater than 10-year results of red-white longitudinal meniscal repairs in patients 20 years of age or younger. Am J Sports Med. 2011;39:1008-1017. doi: 10.1177/0363546510392014
34. Chambers HG, Shea KG, Anderson AF, et al; American Academy of Orthopedic Surgeons. Diagnosis and treatment of osteochondritis dissecans. J Am Acad Orthop Surg. 2011;19:297-306. doi: 10.5435/00124635-201105000-00007
35. Margaretten ME, Kohlwes J, Moore D, et al. Does this adult patient have septic arthritis? JAMA. 2007;297:1478-1488. doi: 10.1001/jama.297.13.1478
36. Gupta MN, Sturrock RD, Field M. A prospective 2-year study of 75 patients with adult-onset septic arthritis. Rheumatology (Oxford). 2001;40:24-30. doi: 10.1093/rheumatology/40.1.24
37. Brophy RH, Fillingham YA. AAOS clinical practice guideline summary: management of osteoarthritis of the knee (nonarthroplasty), 3rd edition. J Am Acad Orthop Surg. 2022;30:e721-729. doi: 10.5435/JAAOS-D-21-01233
38. Collins NJ, Barton CJ, van Middelkoop M, et al. 2018 Consensus statement on exercise therapy and physical interventions (orthoses, taping and manual therapy) to treat patellofemoral pain: recommendations from the 5th International Patellofemoral Pain Research Retreat, Gold Coast, Australia, 2017. Br J Sports Med. 2018;52:1170-1178. doi: 10.1136/bjsports-2018-099397
39. Strauss EJ, Kim S, Calcei JG, et al. Iliotibial band syndrome: evaluation and management. J Am Acad Orthop Surg. 2011;19:728-736. doi: 10.5435/00124635-201112000-00003
40. Millar NL, Murrell GAC, Kirwan P. Time to put down the scalpel? The role of surgery in tendinopathy. Br J Sports Med. 2020;54:441-442. doi: 10.1136/bjsports-2019-101084
41. Hall MJ, Schwartzman A, Zhang J, et al. Ambulatory surgery data from hospitals and ambulatory surgery centers: United States, 2010. Natl Health Stat Report. 2017;(102):1-15.
42. Kise NJ, Risberg MA, Stensrud S, et al. Exercise therapy versus arthroscopic partial meniscectomy for degenerative meniscal tear in middle aged patients: randomized controlled trial with two year follow-up. BMJ. 2016;354:i3740. doi: 10.1136/bmj.i3740
43. Sihvonen R, Paavola M, Malmivaara A, et al, FIDELITY (Finnish Degenerative Meniscus Lesion Study) Investigators. Arthroscopic partial meniscectomy for a degenerative meniscus tear: a 5 year follow-up of the placebo-surgery controlled FIDELITY (Finnish Degenerative Meniscus Lesion Study) trial. Br J Sports Med. 2020;54:1332-1339. doi: 10.1136/bjsports-2020-102813
44. Pihl K, Ensor J, Peat G, et al. Wild goose chase—no predictable patient subgroups benefit from meniscal surgery: patient-reported outcomes of 641 patients 1 year after surgery. Br J Sports Med. 2020;54:13-22. doi: 10.1136/bjsports-2018-100321
45. O’Connor D, Johnston RV, Brignardello-Petersen R, et al. Athroscopic surgery for degenerative knee disease (osteoarthritis including degenerative meniscal tears). Cochrane Database Syst Rev. 2022;3:CD014328. doi: 10.1002/14651858.CD014328
46. Siemieniuk RAC, Harris IA, Agoritsas T, et al. Arthroscopic surgery for degenerative knee arthritis and meniscal tears: a clinical practice guideline. Br J Sports Med. 2018;52:313. doi: 10.1136/bjsports-2017-j1982rep
47. Manner PA, Tubb CC, Levine BR. AAOS appropriate use criteria: surgical management of osteoarthritis of the knee. J Am Acad Orthop Surg. 2018;26:e194-197. doi: 10.5435/JAAOS-D-17-00425
Evidence supports what family physicians know to be true: Knee pain is an exceedingly common presenting problem in the primary care office. Estimates of lifetime incidence reach as high as 54%,1 and the prevalence of knee pain in the general population is increasing.2 Knee disability can result from acute or traumatic injuries as well as chronic, degenerative conditions such as osteoarthritis (OA). The decision to pursue orthopedic consultation for a particular injury or painful knee condition can be challenging. To address this, we highlight specific knee diagnoses known to cause pain, with the aim of describing which conditions likely will necessitate surgical consultation—and which won’t.
Acute or nondegenerative knee injuries and pain
Acute knee injuries range in severity from simple contusions and sprains to high-energy, traumatic injuries with resulting joint instability and potential neurovascular compromise. While conservative treatment often is successful for many simple injuries, surgical management—sometimes urgently or emergently—is needed in other cases, as will be detailed shortly.
Neurovascular injury associated with knee dislocations
Acute neurovascular injuries often require emergent surgical intervention. Although rare, tibiofemoral (knee) dislocations pose a significant challenge to the clinician in both diagnosis and management. The reported frequency of popliteal artery injury or rupture following a dislocation varies widely, with rates ranging from 5% to 64%, according to older studies; more recent data, however, suggest the rate is actually as low as 3.3%.3
Immediate immobilization and emergency department transport for monitoring, orthopedics consultation, and vascular studies or vascular surgery consultation is recommended in the case of a suspected knee dislocation. In one cross-sectional cohort study, the surgical management of knee dislocations yielded favorable outcomes in > 75% of cases.5
Tibial plateau fracture
This fracture often occurs as a result of high-energy trauma, such as contact sports or motor vehicle accidents, and is characterized by a proximal tibial fracture line with extension to the articular surface. X-rays often are sufficient for initial diagnosis. Computed tomography can help rule out a fracture line when clinical suspicion is high and x-rays are nondiagnostic. As noted earlier, any suggestion of neurovascular compromise on physical exam requires an emergent orthopedic surgeon consultation for a possible displaced and unstable (or more complex) injury (FIGURE 1).6-8
Nondisplaced tibial plateau fractures without supraphysiologic ligamentous laxity on valgus or varus stress testing can be managed safely with protection and early mobilization, gradual progression of weight-bearing, and serial x-rays to ensure fracture healing and stability.
Gross joint instability identified by positive valgus or varus stress testing, positive anterior or posterior drawer testing, or patient inability to tolerate these maneuvers due to pain similarly should raise suspicion for a more significant fracture at risk for concurrent neurovascular injury. Acute compartment syndrome also is a known complication of tibial plateau fractures and similarly requires emergent operative management. Urgent surgical consultation is recommended for fractures with displaced fracture fragments, tibial articular surface step-off or depression, fractures with concurrent joint laxity, or medial plateau fractures.6-8
Continue to: Patella fractures
Patella fractures
These fractures occur as a direct blow to the front of the knee, such as falling forward onto a hard surface, or indirectly due to a sudden extreme eccentric contraction of the quadriceps muscle. Nondisplaced fractures with an intact knee extension mechanism, which is examined via a supine straight-leg raise or seated knee extension, are managed with weight-bearing as tolerated in strict immobilization in full extension for 4 to 6 weeks, with active range-of-motion and isometric quadriceps exercises beginning in 1 to 2 weeks. Serial x-rays also are obtained to ensure fracture displacement does not occur during the rehabilitation process.9
High-quality evidence guiding follow-up care and comparing outcomes of surgical and nonsurgical management of patella fractures is lacking, and studies comparing different surgical techniques are of lower methodological quality.10 Nevertheless, displaced or comminuted patellar fractures are referred urgently to orthopedic surgical care for fixation, as are those with concurrent loose bodies, chondral surface injuries or articular step-off, or osteochondral fractures.9 Inability to perform a straight-leg raise (ie, clinical loss of the knee extension mechanism) suggests a fracture under tension that likely also requires surgical fixation for successful recovery. Neurovascular injuries are unlikely in most patellar fractures but would require emergent surgical consultation.9
Ligamentous injury
Tibiofemoral joint laxity occurs as a result of ligamentous injury, with or without tibial plateau fracture. The anterior cruciate ligament (ACL), posterior cruciate ligament (PCL), medial collateral ligament (MCL), and lateral collateral ligament (LCL) comprise the 4 main ligaments of the knee. The ACL resists anterior tibial translation and rotational forces, while the PCL resists posterior tibial translation. The MCL and LCL resist valgus and varus stress, respectively.
Ligament injuries are classified as Grades 1 to 311:
- Grade 1 sprains. The ligament is stretched, but there is no macroscopic tearing; joint stability is maintained.
- Grade 2 sprains. There are partial macroscopic ligament tears. There is joint laxity due to the partial loss of the ligament’s structural integrity.
- Grade 3 sprains. The ligament is fully avulsed or ruptured with resultant gross joint instability.
Continue to: ACL tears
ACL tears occur most commonly via a noncontact event, as when an individual plants their foot and suddenly changes direction during sport or other physical activity. Treatment hinges on patient activity levels and participation in sports. Patients who do not plan to engage in athletic movements (that require changes in direction or planting and twisting) and who otherwise maintain satisfactory joint stability during activities of daily living may elect to defer or even altogether avoid surgical reconstruction of isolated ACL tears. One pair of studies demonstrated equivalent outcomes in surgical and nonsurgical management in 121 young, nonelite athletes at 2- and 5-year follow-up, although the crossover from the nonsurgical to surgical groups was high.12,13 Athletes who regain satisfactory function and stability nonoperatively can defer surgical intervention. However, the majority of active patients and athletes will require surgical ACL reconstruction to return to pre-injury functional levels.14
PCL sprains occur as a result of sudden posteriorly directed force on the tibia, such as when the knee is hyperextended or a patient falls directly onto a flexed knee. Patients with Grade 1 and 2 isolated sprains generally will recover with conservative care, as will patients with some Grade 3 complete tears that do not fully compromise joint stability. However, high-grade PCL injuries often are comorbid with posterolateral corner or other injuries, leading to a higher likelihood of joint instability and thus the need for surgical intervention for the best chance at an optimal outcome.15
MCL sprain. Surgical management is not required in an isolated Grade 1 or 2 MCL sprain, as the hallmarks of recovery—return of joint stability, knee strength and range of motion, and pain reduction—can be achieved successfully with conservative management. Isolated Grade 3 MCL sprains are also successfully managed nonoperatively16 except in specific cases, such as a concurrent large avulsion fracture.17
LCL sprain. Similarly, isolated Grade 1 and 2 LCL sprains generally do not require surgical intervention. However, Grade 3 LCL injuries usually do, as persistent joint instability and poor functional outcomes are more common with nonsurgical management.18-20 Additionally, high-grade LCL injuries frequently manifest with comorbid meniscus injuries or sprains of the posterolateral corner of the knee, a complex anatomic structure that provides both static and dynamic tibiofemoral joint stability. Surgical repair or reconstruction of the posterolateral corner frequently is necessary for optimal functional outcomes.21
Multiligamentous sprains frequently lead to gross joint instability and necessitate orthopedic surgeon consultation to determine the best treatment plan; this should be done emergently if neurovascular compromise is suspected. A common injury combination is simultaneous ACL and MCL sprains with or without meniscus injury. In these cases, some surgeons will choose to defer ACL reconstruction until after MCL healing is achieved. This allows the patient to regain valgus stability of the joint prior to performing ACL reconstruction to regain rotational and anterior stability.20
Continue to: Patellar dislocations
Patellar dislocations represent a relatively common knee injury in young active patients, often occurring in a noncontact fashion when a valgus force is applied to an externally rotated and planted lower leg.
Major tendon rupture
Patellar tendon ruptures occur when a sudden eccentric force is applied to the knee, such as when landing from a jump with the knee flexed. Patellar tendon ruptures frequently are clinically apparent, with patients demonstrating a high-riding patella and loss of active knee extension. Quadriceps tendon ruptures often result from a similar injury mechanism in older patients, with a similar loss of active knee extension and a palpable gap superior to the patella.24
Partial tears in patients who can maintain full extension of the knee against gravity are treated nonoperatively, but early surgical repair is indicated for complete quadriceps or patellar tendon ruptures to achieve optimal outcomes.
Even with prompt treatment, return to sport is not guaranteed. According to a recent systematic review, athletes returned to play 88.9% and 89.8% of the time following patellar and quadriceps tendon repairs, respectively. However, returning to the same level of play was less common and achieved 80.8% (patellar tendon repair) and 70% (quadriceps tendon repair) of the time. Return-to-work rates were higher, at 96% for both surgical treatments.29
Locked knee and acute meniscus tears in younger patients
In some acute knee injuries, meniscus tears, loose cartilage bodies or osteochondral defects, or other internal structures can become interposed between the femoral and tibial surfaces, preventing both active and passive knee extension. Such injuries are often severely painful and functionally debilitating. While manipulation under anesthesia can acutely restore joint function,30 diagnostic and therapeutic arthroscopy often is pursued for definitive treatment.31 Compared to the gold standard of diagnostic arthroscopy, preoperative magnetic resonance imaging (MRI) carries positive and negative predictive values of 85% and 77%, respectively, in identifying or ruling out the anatomic structure responsible for a locked knee. 32 As such,
Continue to: Depending on the location...
Depending on the location, size, and shape of an acute meniscus tear in younger patients, surgical repair may be an option to preserve long-term joint function. In one case series of patients younger than 20 years, 62% of meniscus repairs yielded good outcomes after a mean follow-up period of 16.8 years.33
Osteochondritis dissecans
Osteochondritis dissecans is characterized by subchondral bone osteonecrosis that most often occurs in pediatric patients, potentially causing the separation of a fragment of articular cartilage and subchondral bone into the joint space (FIGURE 2). In early stages, nonoperative treatment consisting of prolonged rest followed by physical therapy to gradually return to activity is recommended to prevent small, low-grade lesions from progressing to unstable or separated fragments. Arthroscopy, which consists of microfracture or other surgical resurfacing techniques to restore joint integrity, is pursued in more advanced cases of unstable or separated fragments.
High-quality data guiding the management of osteochondritis dissecans are lacking, and these recommendations are based on consensus guidelines.34
Septic arthritis
Septic arthritis is a medical emergency caused by the hematogenous spread of microorganisms, most often staphylococci and streptococci species. Less commonly, it arises from direct inoculation through an open wound or, rarely, iatrogenically following a joint injection procedure. Clinical signs of septic arthritis include joint pain, joint swelling, and fever. Passive range of motion of the joint is often severely painful. Synovial fluid studies consistent with septic arthritis include an elevated white blood cell count greater than 25,000/mcL with polymorphonuclear cell predominance.35 The knee accounts for more than 50% of septic arthritis cases, and surgical drainage usually is required to achieve infection source control and decrease morbidity and mortality due to destruction of articular cartilage when treatment is delayed.36
Chronic knee injuries and pain
Surgical intervention for chronic knee injuries and pain generally is considered when patients demonstrate significant functional impairment and persistent symptoms despite pursuing numerous nonsurgical treatment options. A significant portion of chronic knee pain is due to degenerative processes such as OA or meniscus injuries, or tears without a history of trauma that do not cause locking of the knee. Treatments for degenerative knee pain include supervised exercise, physical therapy, bracing, offloading with a cane or other equipment, topical or oral anti-inflammatories or analgesics, and injectable therapies such as intra-articular corticosteroids.37
Continue to: Other common causes...
Other common causes of chronic knee pain include chronic tendinopathy or biomechanical syndromes such as patellofemoral pain syndrome or iliotibial band syndrome. Surgical treatment of these conditions is pursued in select cases and only after exhausting nonoperative treatment programs, as recommended by international consensus statements,38 societal guidelines,39 and expert opinion.40 High-quality data on the effectiveness, or ineffectiveness, of surgical intervention for these conditions are lacking.
Despite being one of the most commonly performed surgical procedures in the United States,41 arthroscopic partial meniscectomy treatment of degenerative meniscus tears does not lead to improved outcomes compared to nonsurgical management, according to multiple recent studies.42-45 Evidence does not support routine arthroscopic intervention for degenerative meniscus tears or OA,42 and recent guidelines recommend against it46 or to pursue it only after nonsurgical treatments have failed.37
Surgical management of degenerative knee conditions generally consists of partial or total arthroplasty and is similarly considered after failure of conservative measures. Appropriate use criteria that account for multiple clinical and patient factors are used to enhance patient selection for the procedure.47
Takeaways
Primary care clinicians will treat patients sustaining knee injuries and see many patients with knee pain in the outpatient setting. Treatment options vary considerably depending on the underlying diagnosis and resulting functional losses. Several categories of clinical presentation, including neurovascular injury, unstable or displaced fractures, joint instability, major tendon rupture, significant mechanical symptoms such as a locked knee, certain osteochondral injuries, and septic arthritis, likely or almost always warrant surgical consultation (TABLE3-10,12-36). Occasionally, as in the case of neurovascular injury or septic arthritis, such consultation should be emergent.
CORRESPONDENCE
David M. Siebert, MD, Sports Medicine Center at Husky Stadium, 3800 Montlake Boulevard NE, Seattle, WA 98195; [email protected]
1. Baker P, Reading I, Cooper C, et al. Knee disorders in the general population and their relation to occupation. Occup Environ Med. 2003;60:794-797. doi: 10.1136/oem.60.10.794
2. Nguyen UD, Zhang Y, Zhu Y, et al. Increasing prevalence of knee pain and symptomatic knee osteoarthritis: survey and cohort data. Ann Intern Med. 20116;155:725-732. doi: 10.7326/0003-4819-155-11-201112060-00004
3. Natsuhara KM, Yeranosian MG, Cohen JR, et al. What is the frequency of vascular injury after knee dislocation? Clin Orthop Relat Res. 2014;472:2615-2620. doi: 10.1007/s11999-014-3566-1
4. Seroyer ST, Musahl V, Harner CD. Management of the acute knee dislocation: the Pittsburgh experience. Injury. 2008;39:710-718. doi: 10.1016/j.injury.2007.11.022
5. Sinan SM, Elsoe R, Mikkelsen C, et al. Clinical, functional, and patient-reported outcome of traumatic knee dislocations: a retrospective cohort study of 75 patients with 6.5-year follow up. Arch Orthop Trauma Surg. 2023;143:2589-2597. doi: 10.1007/s00402-022-04578-z
6. Schatzker J, Kfuri M. Revisiting the management of tibial plateau fractures. Injury. 2022;53:2207-2218. doi: 10.1016/j.injury.2022.04.006
7. Rudran B, Little C, Wiik A, et al. Tibial plateau fracture: anatomy, diagnosis and management. Br J Hosp Med (Lond). 2020;81:1-9. doi: 10.12968/hmed.2020.0339
8. Tscherne H, Lobenhoffer P. Tibial plateau fractures: management and expected results. Clin Orthop Relat Res. 1993;(292):87-100.
9. Melvin JS, Mehta S. Patellar fractures in adults. J Am Acad Orthop Surg. 2011;19:198-207. doi: 10.5435/00124635-201104000-00004
10. Filho JS, Lenza M, Tamaoki MJ, et al. Interventions for treating fractures of the patella in adults. Cochrane Database Syst Rev. 2021;2:CD009651. doi: 10.1002/14651858.CD009651.pub3
11. Palmer W, Bancroft L, Bonar F, et al. Glossary of terms for musculoskeletal radiology. Skeletal Radiol. 2020;49(suppl 1):1-33. doi: 10.1007/s00256-020-03465-1
12. Frobell RB, Roos EM, Roos HP, et al. A randomized trial of treatment for acute anterior cruciate ligament tears. N Engl J Med. 2010;363:331-342. doi: 10.1056/NEJMoa0907797
13. Frobell RB, Roos HP, Roos EM, et al. Treatment for acute anterior cruciate ligament tear: five year outcome of randomized trial. Br J Sports Med. 2015;49:700. doi: 10.1136/bmj.f232
14. Diermeier TA, Rothrauff BB, Engebretsen L, et al; Panther Symposium ACL Treatment Consensus Group. Treatment after anterior cruciate ligament injury: Panther Symposium ACL Treatment Consensus Group. Br J Sports Med. 2021;55:14-22. doi: 10.1136/bjsports-2020-102200
15. Bedi A, Musahl V, Cowan JB. Management of posterior cruciate ligament injuries: an evidence-based review. J Am Acad Orthop Surg. 2016;24:277-289. doi: 10.5435/JAAOS-D-14-00326
16. Edson CJ. Conservative and postoperative rehabilitation of isolated and combined injuries of the medial collateral ligament. Sports Med Arthrosc Rev. 2006;14:105-110. doi: 10.1097/01.jsa.0000212308.32076.f2
17. Vosoughi F, Dogahe RR, Nuri A, et al. Medial collateral ligament injury of the knee: a review on current concept and management. Arch Bone Jt Surg. 2021;9:255-262. doi: 10.22038/abjs.2021.48458.2401
18. Kannus P. Nonoperative treatment of grade II and III sprains of the lateral ligament compartment of the knee. Am J Sports Med. 1989;17:83-88. doi: 10.1177/036354658901700114
19. Krukhaug Y, Mølster A, Rodt A, et al. Lateral ligament injuries of the knee. Knee Surg Sports Traumatol Arthrosc. 1998;6:21-25. doi: 10.1007/s001670050067
20. Grawe B, Schroeder AJ, Kakazu R, et al. Lateral collateral ligament injury about the knee: anatomy, evaluation, and management. J Am Acad Orthop Surg. 2018 15;26:e120-127. doi: 10.5435/JAAOS-D-16-00028
21. Ranawat A, Baker III CL, Henry S, et al. Posterolateral corner injury of the knee: evaluation and management. J Am Acad Orthop Surg. 2008;16:506-518.
22. Palmu S, Kallio PE, Donell ST, et al. Acute patellar dislocation in children and adolescents: a randomized clinical trial. J Bone Joint Surg Am. 2008;90:463-470. doi: 10.2106/JBJS.G.00072
23. Cohen D, Le N, Zakharia A, et al. MPFL reconstruction results in lower redislocation rates and higher functional outcomes than rehabilitation: a systematic review and meta-analysis. Knee Surg Sports Traumatol Arthrosc. 2022;30:3784-3795. doi: 10.1007/s00167-022-07003-5
24. Siwek CW, Rao JP. Ruptures of the extensor mechanism of the knee joint. J Bone Joint Surg Am. 1981;63:932-937.
25. Konrath GA, Chen D, Lock T, et al. Outcomes following repair of quadriceps tendon ruptures. J Orthop Trauma. 1998;12:273-279. doi: 10.1097/00005131-199805000-00010
26. Rasul Jr. AT, Fischer DA. Primary repair of quadriceps tendon ruptures: results of treatment. Clin Orthop Relat Res. 1993;(289):205-207.
27. Rougraff BT, Reeck CC, Essenmacher J. Complete quadriceps tendon ruptures. Orthopedics. 1996;19:509-514.
28. Bui CN, Learned JR, Scolaro JA. Treatment of patellar fractures and injuries to the extensor mechanism of the knee: a critical analysis review. JBJS Rev. 2018;6:e1. doi: 10.2106/JBJS.RVW.17.00172
29. Haskel JD, Fried JW, Hurley ET, et al. High rates of return to play and work follow knee extensor tendon ruptures but low rate of return to pre-injury level of play. Knee Surg Sports Traumatol Arthrosc. 2021;29:2695-2700. doi: 10.1007/s00167-021-06537-4
30. Critchley IJ, Bracey DJ. The acutely locked knee—is a manipulation worth while? Injury. 1985;16:281-283. doi: 10.1016/s0020-1383(85)80020-6
31. Allum RL, Jones JR. The locked knee. Injury. 1986;17:256-258. doi: 10.1016/0020-1383(86)90231-7
32. Helmark IC, Neergaard K, Krogsgaard MR. Traumatic knee extension deficit (the locked knee): can MRI reduce the need for arthroscopy? Knee Surg Sports Traumatol Arthrosc. 2007;15:863-868. doi: 10.1007/s00167-006-0244-1
33. Noyes FR, Chen RC, Barber-Westin SD, et al. Greater than 10-year results of red-white longitudinal meniscal repairs in patients 20 years of age or younger. Am J Sports Med. 2011;39:1008-1017. doi: 10.1177/0363546510392014
34. Chambers HG, Shea KG, Anderson AF, et al; American Academy of Orthopedic Surgeons. Diagnosis and treatment of osteochondritis dissecans. J Am Acad Orthop Surg. 2011;19:297-306. doi: 10.5435/00124635-201105000-00007
35. Margaretten ME, Kohlwes J, Moore D, et al. Does this adult patient have septic arthritis? JAMA. 2007;297:1478-1488. doi: 10.1001/jama.297.13.1478
36. Gupta MN, Sturrock RD, Field M. A prospective 2-year study of 75 patients with adult-onset septic arthritis. Rheumatology (Oxford). 2001;40:24-30. doi: 10.1093/rheumatology/40.1.24
37. Brophy RH, Fillingham YA. AAOS clinical practice guideline summary: management of osteoarthritis of the knee (nonarthroplasty), 3rd edition. J Am Acad Orthop Surg. 2022;30:e721-729. doi: 10.5435/JAAOS-D-21-01233
38. Collins NJ, Barton CJ, van Middelkoop M, et al. 2018 Consensus statement on exercise therapy and physical interventions (orthoses, taping and manual therapy) to treat patellofemoral pain: recommendations from the 5th International Patellofemoral Pain Research Retreat, Gold Coast, Australia, 2017. Br J Sports Med. 2018;52:1170-1178. doi: 10.1136/bjsports-2018-099397
39. Strauss EJ, Kim S, Calcei JG, et al. Iliotibial band syndrome: evaluation and management. J Am Acad Orthop Surg. 2011;19:728-736. doi: 10.5435/00124635-201112000-00003
40. Millar NL, Murrell GAC, Kirwan P. Time to put down the scalpel? The role of surgery in tendinopathy. Br J Sports Med. 2020;54:441-442. doi: 10.1136/bjsports-2019-101084
41. Hall MJ, Schwartzman A, Zhang J, et al. Ambulatory surgery data from hospitals and ambulatory surgery centers: United States, 2010. Natl Health Stat Report. 2017;(102):1-15.
42. Kise NJ, Risberg MA, Stensrud S, et al. Exercise therapy versus arthroscopic partial meniscectomy for degenerative meniscal tear in middle aged patients: randomized controlled trial with two year follow-up. BMJ. 2016;354:i3740. doi: 10.1136/bmj.i3740
43. Sihvonen R, Paavola M, Malmivaara A, et al, FIDELITY (Finnish Degenerative Meniscus Lesion Study) Investigators. Arthroscopic partial meniscectomy for a degenerative meniscus tear: a 5 year follow-up of the placebo-surgery controlled FIDELITY (Finnish Degenerative Meniscus Lesion Study) trial. Br J Sports Med. 2020;54:1332-1339. doi: 10.1136/bjsports-2020-102813
44. Pihl K, Ensor J, Peat G, et al. Wild goose chase—no predictable patient subgroups benefit from meniscal surgery: patient-reported outcomes of 641 patients 1 year after surgery. Br J Sports Med. 2020;54:13-22. doi: 10.1136/bjsports-2018-100321
45. O’Connor D, Johnston RV, Brignardello-Petersen R, et al. Athroscopic surgery for degenerative knee disease (osteoarthritis including degenerative meniscal tears). Cochrane Database Syst Rev. 2022;3:CD014328. doi: 10.1002/14651858.CD014328
46. Siemieniuk RAC, Harris IA, Agoritsas T, et al. Arthroscopic surgery for degenerative knee arthritis and meniscal tears: a clinical practice guideline. Br J Sports Med. 2018;52:313. doi: 10.1136/bjsports-2017-j1982rep
47. Manner PA, Tubb CC, Levine BR. AAOS appropriate use criteria: surgical management of osteoarthritis of the knee. J Am Acad Orthop Surg. 2018;26:e194-197. doi: 10.5435/JAAOS-D-17-00425
PRACTICE RECOMMENDATIONS
› Consider surgical management, potentially emergently, for acute knee injuries that result in significant joint instability, unstable fractures, or neurovascular compromise. A
› Avoid arthroscopy for chronic, degenerative sources of knee pain, such as osteoarthritis and degenerative meniscus tears, as it is no longer routinely recommended. A
› Treat osteoarthritis surgically after nonsurgical treatments have failed. A
Strength of recommendation (SOR)
A Good-quality patient-oriented evidence
B Inconsistent or limited-quality patient-oriented evidence
C Consensus, usual practice, opinion, disease-oriented evidence, case series

Prescribing DOACs with specific patient populations in mind
Four medications comprise the drug category known as direct oral anticoagulants (DOACs). Dabigatran (Pradaxa)1 was the first to gain approval. It was approved by the US Food and Drug Administration (FDA) in 2010 for the reduction of stroke and systemic embolism in patients with nonvalvular atrial fibrillation (AF). This was followed by approvals for rivaroxaban (Xarelto)2 in 2011, apixaban (Eliquis)3 in 2012, and edoxaban (Savaysa)4 in 2015. Betrixaban (Bevyxxa)5 was approved in 2017 for venous thromboembolism (VTE) prophylaxis in acutely ill hospitalized patients with restricted mobility, but it was removed from the market in 2020.

In addition to stroke prevention in nonvalvular AF, each DOAC has been approved for other indications and has been addressed further in guideline-based recommendations outside FDA-approved indications.

Overview of DOACs
Dabigatran is the only direct thrombin inhibitor; the other agents inhibit factor Xa. TABLE 11-4 summarizes FDA-approved indications and dosing and guideline-based dosing. Dabigatran and edoxaban require parenteral anticoagulation for 5 to 10 days prior to initiation for acute VTE, limiting their use.1,4 TABLE 21-4 highlights pharmacokinetic differences among the agents. For example, dabigatran is 80% renally cleared, is somewhat dialyzable, and can accumulate in patients with renal dysfunction.1 Edoxaban is contraindicated for nonvalvular AF in patients with a creatinine clearance (CrCl) > 95 mL/min because an increased stroke risk was demonstrated.4 Therefore, rivaroxaban and apixaban are prescribed most often in the United States.6,7

Applications in special patient populations
Obesity
As of 2020, more than 40% of adults in the United States were obese (body mass index [BMI] ≥ 30), with 9% classified as class 3 or severely obese (BMI ≥ 40).8 Altered drug pharmacokinetics in patients with severe obesity raises concern for undertreatment with fixed-dose DOACs. Phase III DOAC approval trials included patients with obesity, but weight cutoffs differed, making extrapolating efficacy and safety data difficult across different obesity stages.9 Although no FDA-labeled dosing adjustments exist for patients with obesity, the International Society on Thrombosis and Haemostasis (ISTH) does provide such recommendations.
ISTH changes position on measuring drug levels. ISTH previously recommended avoiding DOACs in those with a BMI > 40 or body weight > 120 kg. If a DOAC was used, ISTH advised obtaining peak and trough drug levels.10 However, DOAC drug levels have not been associated with clinical outcomes or sufficient degrees of anticoagulation.11
Men and women are affected equally by fibrolipomas. Prevalence does not differ by race or ethnicity.
In April 2021, ISTH updated guidance on DOACs in obesity, indicating standard doses of rivaroxaban or apixaban can be used for the treatment and prevention of VTE in all patients regardless of weight or BMI. Because data in obesity are lacking for dabigatran and edoxaban, avoid using these agents in patients with a BMI > 40 or weight > 120 kg. Additionally, assessing drug levels is no longer recommended, as there is insufficient evidence that these impact clinical outcomes.12
The 2021 American College of Chest Physicians (CHEST) guideline update
Continue to: Effectiveness of DOACs for AF in patients with obesity isn't clear
Effectiveness of DOACs for AF in patients with obesity isn’t clear, as most data are from retrospective cohort analyses. In patients weighing > 120 kg, dabigatran has shown efficacy in thrombosis prevention similar to that achieved in those weighing ≤ 120 kg, but it has increased the risk for gastrointestinal (GI) bleeding.15 Another study indicated a 15-mg dose of rivaroxaban may be associated with increased thromboembolic complications in patients with a BMI ≥ 35.16 Alternatively, another retrospective study of rivaroxaban demonstrated a small absolute risk reduction in ischemic stroke among patients in all stages of obesity and no difference in significant bleeding events.17 One further retrospective cohort showed that, in patients with a BMI ≥ 50 kg, the effectiveness of rivaroxaban and apixaban in thrombosis prevention and bleeding safety outcomes was comparable to that seen in those with a BMI < 30.18
As a result of conflicting data, and a lack of prospective randomized controlled trials (RCTs), ISTH continued recommending international normalized ratio (INR)–based dosing of warfarin for class 3 or severely obese patients with AF. The 2018 CHEST guidelines19 and the 2020 ESC guidelines20 make no mention of DOAC avoidance in patients with obesity and AF.
Advanced and end-stage renal disease
DOACs are renally dosed based on indication, drug-drug interactions, and degree of renal function (TABLE 31-4). For example, patients with AF who are anticoagulated with apixaban are prescribed 2.5 mg twice daily when 2 of the 3 following criteria are met: age ≥ 80 years, body weight ≤ 60 kg, serum creatinine ≥ 1.5 mg/dL. However, no dosage adjustment is necessary for VTE treatment or prophylaxis with apixaban regardless of renal function.3

Data supporting the safety and efficacy of DOACs in end-stage renal disease (ESRD) are sparse. All DOACs are renally cleared to varying degrees (TABLE 21-4), theoretically increasing bleeding risk as kidney disease progresses. Apixaban is the least renally cleared of the DOACs and has been evaluated in the greatest number of trials for patients with ESRD for both VTE treatment and prevention and nonvalvular AF.21 As a result, the FDA approved standard-dose apixaban (5 mg twice daily) for VTE treatment and prevention and nonvalvular AF in patients with ESRD, even those requiring dialysis. Use the reduced apixaban dose (2.5 mg twice daily) in patients with ESRD and AF only if they are ≥ 80 years of age or their body weight is ≤ 60 kg.3
Patients with cancer
Cancer-associated acute VTE treatment. Cancer is an established risk factor for acute VTE but it also increases the risk for treatment-associated bleeding compared with patients without cancer.22 Historically, low-molecular-weight heparin (LMWH) was recommended over warfarin and DOACs for cancer-associated thromboses (CAT).23 Compared with warfarin, LMWH reduced the rate of recurrent VTE and had similar or reduced bleeding rates at 6 to 12 months.24-26 However, clinicians and patients often chose warfarin to avoid subcutaneous injections.27
CHEST guidelines recommend oral Xa inhibitors over LMWH for the treatment of CAT.13 The 2020 guidelines of the National Institute for Health and Care Excellence (NICE) recommend DOACs as an option for CAT along with LMWH or LMWH transitioned to warfarin.28 The American Society of Clinical Oncology (ASCO) recommends rivaroxaban for acute VTE treatment in CAT. No head-to-head trials have evaluated comparative efficacy of DOACs for CAT. However, edoxaban and rivaroxaban are associated with a greater risk for GI bleeding; therefore, apixaban is preferred in patients with GI malignancies.29 Standard DOAC VTE treatment dosing is recommended for all 3 agents.2-4
When using DOACs for patients with CAT, consider potential drug-drug interactions with chemotherapy regimens. All DOACs are transported by p-glycoprotein, while rivaroxaban and apixaban are substrates of cytochrome P450, leading to potentially significant drug-drug interactions.30 These interactions could affect the patient’s chemotherapeutic regimen, decrease the efficacy of the DOAC, or increase the risk for bleeding. Therefore, anticoagulation choice should be made in collaboration with the hematology/oncology team.
Continue to: Cancer-associated VTE prophylaxis...
Cancer-associated VTE prophylaxis. VTE prophylaxis for patients with cancer is complex and necessitates a global assessment of cancer location and treatment regimen and setting. Hospitalized patients receiving chemotherapy are at high risk for VTE if mobility is reduced or if other VTE risk factors are present. The International Initiative on Thrombosis and Cancer (ITAC)31 and ISTH32 recommend VTE prophylaxis with unfractionated heparin or LMWH (ISTH recommends LMWH more strongly). The 2020 ASCO Guidelines recommend pharmacologic anticoagulation but make no drug-specific recommendation.29 Parenteral treatment in hospitalized patients is not as burdensome as it is in ambulatory patients; therefore, these recommendations are less likely to elicit inpatient opposition.
In the ambulatory setting, patient avoidance of subcutaneous injections necessitates consideration of DOACs for CAT prophylaxis. The Khorana Risk Score (KRS) is a validated tool (scale, 0-7) to predict VTE risk in ambulatory patients receiving chemotherapy.33 KRS scores ≥ 2 indicate high thrombotic risk and the need for prophylactic anticoagulation. ASCO recommends apixaban, rivaroxaban, or LMWH.29 ISTH and ITAC both recommend apixaban or rivaroxaban over LMWH.31,34 An RCT published in June 2023 confirmed that, for adults with cancer and VTE, DOACs were noninferior to LMWH for preventing recurrent VTE for 6 months.35 The recommended doses for apixaban (2.5 mg twice daily) and rivaroxaban (10 mg daily) for CAT VTE prophylaxis are lower than FDA-approved treatment doses.31
Patients with thrombophilia: VTE prevention
Thrombophilias are broadly categorized as inherited or acquired, with inherited thrombophilia being more prevalent. The Factor V Leiden (FVL) variant affects 2% to 7% of the population, and prothrombin gene mutation (PGM) affects 1% to 2% of the population.36 Other forms of inherited thrombophilia, such as protein C deficiency, protein S deficiency, and antithrombin deficiency, occur less commonly (< 0.7% of the population).36 Antiphospholipid syndrome (APS), the most common acquired thrombophilia, affects approximately 2% of the population.36 APS involves multiple antibodies: anticardiolipin antibodies, lupus anticoagulant, and anti-beta-2 glycoprotein 1 antibodies. Establishing risk for thrombosis across the varying types of thrombophilia has proven difficult, but APS is considered the most thrombogenic thrombophilia apart from extremely rare homozygous inherited thrombophilias.36 Therefore, DOAC recommendations are thrombophilia specific.
A prospective cohort study evaluated DOACs compared with heparin/warfarin for VTE treatment in patients with inherited thrombophilias.37 Although all 4 available DOACs were included, most patients (61.1%) received rivaroxaban. Patients with an array of inherited thrombophilias, including rare homozygous mutations, were enrolled in this trial. While most patients (66.9%) had a “mild thrombophilia” defined as either FVL or PGM, the remainder had more severe thrombophilias.37 VTE recurrence was similar and uncommon in the DOAC and heparin/warfarin groups, consistent with a previous meta-analysis.38 Surprisingly, an increase in the cumulative risk for bleeding was seen in the DOAC group compared with the warfarin group, a finding inconsistent with prior trials.38 There were no major bleeding events in the DOAC group, but 3 such events occurred in the heparin/warfarin group, including 2 intracranial hemorrhages.
Currently NICE, CHEST, and ISTH do not make a recommendation for a preferred agent in patients with an acute VTE and inherited thrombophilia; however, DOACs would not be inappropriate.23,28,32 The American Society of Hematology (ASH) had planned to release recommendations related to the treatment of thrombophilia in 2020, but they were delayed by the COVID-19 pandemic.39
APS presents challenges for acute VTE anticoagulation. First, it causes a strongly thrombogenic state necessitating therapeutic anticoagulation. Second, for patients with positive lupus anticoagulant, INR monitoring and standardized INR goals may be inadequate.40 Therefore, using fixed-dose DOACs without the need for therapeutic monitoring is appealing, but significant concerns exist for using DOACs in patients with APS.41-45 ISTH and CHEST recommend warfarin for the treatment and prevention of acute VTE in patients with APS, especially those with triple-positive (anticardiolipin, lupus anticoagulant, and anti-beta-2 glycoprotein 1) APS.13,46 Package labeling for all DOACs recommends avoidance in triple-positive APS.1-4
ASTRO-APS is the most recent RCT to compare apixaban and warfarin for patients with APS,47 and it was terminated early after 6 of 23 patients in the apixaban group had thrombotic events, while no one in the warfarin group had such an event.48 Subsequently, a meta-analysis49 demonstrated that patients with thrombotic APS appear to have a greater risk for arterial thrombosis when treated with DOACs compared with warfarin. These 2 studies may lead to changes in recommendations to avoid DOACs in all patients with APS or may prompt more focused trials for DOAC use in patients with APS plus an antiplatelet to mitigate arterial thrombotic risk.
Continue to: Expanded clinical indications
Expanded clinical indications
Superficial vein thrombosis
Superficial thrombophlebitis or superficial vein thrombosis (SVT) is estimated to occur 6 times more frequently than VTE.50 Management of patients with isolated, uncomplicated thrombophlebitis who are at low risk for extension of the SVT involves symptomatic treatment with nonsteroidal anti-inflammatory drugs, topical agents, or compression therapy. However, depending on risk for progression, anticoagulation may be recommended.51
Patients at intermediate risk for extension or propagation of SVT are candidates for anticoagulation. The CHEST guidelines recommend
Certain situations should prompt one to consider using a treatment dose of a DOAC for 3 months. These include cases in which the SVT is located within 3 cm of the deep venous system, expands despite an appropriate prophylactic regimen, or recurs after discontinuation of prophylactic anticoagulation.13,50
Acute coronary syndrome
The American College of Cardiology/American Heart Association (ACC/AHA) recommend combination antiplatelet therapy and anticoagulation for management of acute coronary syndrome in hospitalized patients.52 Data are mixed regarding longer-term anticoagulation in addition to dual antiplatelet therapy in outpatient settings to prevent thrombosis recurrence in the absence of AF.
The APPRAISE-2 trial enrolled high-risk patients with ACS within 7 days of the event.53 Apixaban 5 mg twice daily was compared with placebo in patients taking aspirin or aspirin plus clopidogrel. The trial was terminated early because major bleeding events increased with apixaban without reduction in recurrent ischemic events. The ATLAS ACS-TIMI 46 trial evaluated different rivaroxaban doses (5-20 mg daily) in ACS patients.54 The study revealed possible thrombosis benefit but also increased risk for bleeding, particularly at higher doses. As a result, another study—ATLAS ACS 2-TIMI 51—was conducted and compared the use of low-dose rivaroxaban (2.5 mg twice daily or 5 mg twice daily) vs placebo for patients with recent ACS.55 All patients were receiving low-dose aspirin, and approximately 93% of patients in each group also were receiving clopidogrel or ticlopidine. As in the APPRAISE-2 trial, rivaroxaban increased the rate of major bleeding and intracranial hemorrhage; however, it did not increase the incidence of fatal bleeding. Unlike APPRAISE-2, rivaroxaban significantly reduced the primary efficacy end point, a composite of death from cardiovascular causes, myocardial infarction, or stroke (absolute risk reduction = 1.8%; number needed to treat = 56 for combined rivaroxaban doses).55
A secondary subgroup analysis combined data from the ATLAS ACMS-TIMI 46 and ATLAS ACS 2-TIMI 51 trials to evaluate outcomes in patients receiving aspirin monotherapy when combined with rivaroxaban 2.5 mg twice daily or 5 mg twice daily or with placebo.56 The primary efficacy end point was a composite of cardiovascular death, myocardial infarction, or stroke. When the 2 trials were evaluated separately, neither rivaroxaban dose was associated with reduction of the primary efficacy outcomes compared with aspirin alone. However, when the data were pooled, both the combined rivaroxaban doses (particularly the 5-mg dose) were associated with reduced cardiovascular outcomes. From a safety perspective, the 2.5-mg twice-daily dose of rivaroxaban was the only dose not associated with increased major bleeding risk. Thus, the 2.5-mg twice-daily dose of rivaroxaban may not provide sufficient cardiovascular benefit in patients with ACS, while the larger dose may increase the risk for nonfatal major bleeding events.56
The European Medicines Agency57 approved rivaroxaban 2.5 mg twice daily for ACS, and the 2020 ESC guidelines58 consider it an appropriate therapeutic option in addition to aspirin for patients at high ischemic risk and low bleeding risk. ACS is not an FDA-approved indication for DOACs, and the ACC/AHA Guideline for the Management of ACS, last updated in 2014, does not include DOACs for ACS unless patients have AF.52 Ongoing trials are further investigating rivaroxaban for ACS, so the use of DOACs in the post-acute phase of ACS may become clearer in the future.59
Continue to: Heparin-induced thrombocytopenia
Heparin-induced thrombocytopenia
Historically, nonheparin parenteral anticoagulants argatroban, bivalirudin, and fondaparinux were recommended for patients at risk for or who had heparin-induced thrombocytopenia (HIT). Argatroban is the only drug FDA approved for the treatment and prophylaxis of HIT; recommendations for the others are based on guideline recommendations.23,60,61 The nonheparin parenteral anticoagulants cost between $700 and $1500 per day; therefore most patients with HIT are transitioned to warfarin.62 However, protein C and S inhibition and a subsequent prothrombotic state conveyed by warfarin initiation necessitates a minimum 5-day bridge to therapeutic warfarin with a nonheparin parenteral anticoagulant.
In vitro tests show that DOACs do not promote development of HIT antibodies63 or affect platelet activation or aggregation.64 A literature summary of DOACs for HIT determined that in 104 patients, all but 1 achieved platelet recovery (defined as > 150,000/mcL) within a median time of 7 days. Therapeutically, DOACs prevented new or recurrent VTE in 102/104 cases (98%), and only 3% of patients experienced significant bleeding events.62
The 2018 ASH guidelines for VTE management in HIT include (with very low certainty of evidence) dabigatran, rivaroxaban, or apixaban for consideration in addition to previously recommended nonheparin parenteral anticoagulants.61 The dosing of each agent is contingent upon treatment of patients with HIT and an acute thrombosis (HITT) or HIT in the absence of VTE. For patients with HITT, treatment doses for acute VTE should be used for the appropriate duration of therapy (ie, 3 months). Importantly, dabigatran requires a 5-day pretreatment period with a parenteral anticoagulant, so it is not an ideal option. When treating isolated HIT (in the absence of VTE), ASH recommends all agents be dosed twice daily—dabigatran 150 mg twice daily (no 5-day parenteral pretreatment necessary), rivaroxaban 15 mg twice daily, or apixaban 5 mg twice daily—until platelet recovery (≥ 150,000/mcL) is achieved.61
CORRESPONDENCE
Kevin Schleich, PharmD, BCACP, Departments of Pharmaceutical Care and Family Medicine, University of Iowa, 200 Hawkins Drive, 01102-D PFP, Iowa City, IA, 52242; [email protected]
1. Dabigatran. Package Insert. Boehringer Ingelheim Pharmaceuticals, Inc.; 2021.
2. Rivaroxaban. Package insert. Janssen Pharmaceuticals, Inc; 2022.
3. Apixaban. Package insert. Bristol-Myers Squibb; 2021.
4. Edoxaban. Package insert. Daiichi Sankyo, Inc; 2015.
5. Betrixaban. Package insert. Portola Pharmaceuticals, Inc; 2017.
6. Wheelock KM, Ross JS, Murugiah K, et al. Clinician trends in prescribing direct oral anticoagulants for US Medicare beneficiaries. JAMA Netw Open. 2021;4:e2137288. doi: 10.1001/jamanetworkopen.2021.37288
7. Colacci M, Tseng EK, Sacks CA, et al. Oral anticoagulant utilization in the United States and United Kingdom. J Gen Intern Med. 2020;35:2505-2507. doi: 10.1007/s11606-020-05904-0
8. CDC. Adult obesity facts. Accessed May 9, 2023. www.cdc.gov/obesity/data/adult.html
9. Mocini D, Di Fusco SA, Mocini E, et al. Direct oral anticoagulants in patients with obesity and atrial fibrillation: position paper of Italian National Association of Hospital Cardiologists (ANMCO). J Clin Med. 2021;10:4185. doi: 10.3390/jcm10184185
10. Martin K, Beyer-Westendorf J, Davidson BL, et al. Use of the direct oral anticoagulants in obese patients: guidance from the SSC of the ISTH. J Thromb Haemost. 2016;14:1308-1313. doi: 10.1111/jth.13323
11. Gu TM, Garcia DA, Sabath DE. Assessment of direct oral anticoagulant assay use in clinical practice. J Thromb Thrombolysis. 2019;47:403-408. doi: 10.1007/s11239-018-1793-0
12. Martin KA, Beyer-Westendorf J, Davidson BL, et al. Use of direct oral anticoagulants in patients with obesity for treatment and prevention of venous thromboembolism: updated communication from the ISTH SSC Subcommittee on Control of Anticoagulation. J Thromb Haemost. 2021;19:1874-1882. doi: 10.1111/jth.15358
13. Stevens SM, Woller SC, Kreuziger LB, et al. Antithrombotic therapy for VTE disease: second update of the CHEST Guideline and Expert Panel Report. Chest. 2021;160:e545-e608. doi: 10.1016/j.chest.2021.07.055
14. Konstantinides SV, Meyer G, Becattini C, et al. 2019 ESC Guidelines for the diagnosis and management of acute pulmonary embolism developed in collaboration with the European Respiratory Society (ERS). Eur Heart J. 2020;41:543-603. doi: 10.1093/eurheartj/ehz405
15. Coates J, Bitton E, Hendje A, et al. Clinical outcomes of dabigatran use in patients with non-valvular atrial fibrillation and weight >120 kg. Thromb Res. 2021;208:176-180. doi: 10.1016/j.thromres.2021.11.007
16. Li X, Zuo C, Ji Q, et al. Body mass index influence on the clinical outcomes for nonvalvular atrial fibrillation patients admitted to a hospital treated with direct oral anticoagulants: a retrospective cohort study. Drug Des Devel Ther. 2021;15:1931-1943. doi: 10.2147/dddt.S303219
17. Barakat AF, Jain S, Masri A, et al. Outcomes of direct oral anticoagulants in atrial fibrillation patients across different body mass index categories. JACC Clin Electrophysiol. 2021;7:649-658. doi: 10.1016/j.jacep.2021.02.002
18. O’Kane CP, Avalon JCO, Lacoste JL, et al. Apixaban and rivaroxaban use for atrial fibrillation in patients with obesity and BMI ≥50 kg/m2. Pharmacotherapy. 2022;42:112-118. doi: https://doi.org/10.1002/phar.2651
19. Lip GYH, Banerjee A, Boriani G, et al. Antithrombotic therapy for atrial fibrillation: CHEST Guideline and Expert Panel Report. Chest. 2018;154:1121-1201. doi: 10.1016/j.chest.2018.07.040
20. Sepehri Shamloo A, Dagres N, Hindricks G. [2020 ESC guidelines on atrial fibrillation: summary of the most relevant recommendations and innovations]. Herz. 2021;46:28-37. doi: 10.1007/s00059-020-05005-y
21. Chokesuwattanaskul R, Thongprayoon C, Tanawuttiwat T, et al. Safety and efficacy of apixaban versus warfarin in patients with end-stage renal disease: meta-analysis. Pacing Clin Electrophysiol. 2018;41:627-634. doi: 10.1111/pace.13331
22. Wang T-F, Li A, Garcia D. Managing thrombosis in cancer patients. Res Pract Thromb Haemost. 2018;2:429-438. doi: https://doi.org/10.1002/rth2.12102
23. Kearon C, Akl EA, Ornelas J, et al. Antithrombotic therapy for VTE disease: CHEST Guideline and Expert Panel Report. CHEST. 2016;149:315-352. doi: 10.1016/j.chest.2015.11.026
24. Lee AY, Levine MN, Baker RI, et al. Low-molecular-weight heparin versus a coumarin for the prevention of recurrent venous thromboembolism in patients with cancer. N Engl J Med. 2003;349:146-153. doi: 10.1056/NEJMoa025313
25. Meyer G, Marjanovic Z, Valcke J, et al. Comparison of low-molecular-weight heparin and warfarin for the secondary prevention of venous thromboembolism in patients with cancer: a randomized controlled study. Arch Intern Med. 2002;162:1729-1735. doi: 10.1001/archinte.162.15.1729
26. Hull RD, Pineo GF, Brant RF, et al. Long-term low-molecular-weight heparin versus usual care in proximal-vein thrombosis patients with cancer. Am J Med. 2006;119:1062-1072. doi: 10.1016/j.amjmed.2006.02.022
27. Lee AYY, Kamphuisen PW, Meyer G, et al. Tinzaparin vs warfarin for treatment of acute venous thromboembolism in patients with active cancer: a randomized clinical trial. JAMA. 2015;314:677-686. doi: 10.1001/jama.2015.9243
28. NICE Guideline. Venous thromboembolic diseases: diagnosis, management and thrombophilia testing. Accessed May 9, 2023. www.ncbi.nlm.nih.gov/books/NBK556698/
29. Key NS, Khorana AA, Kuderer NM, et al. Venous thromboembolism prophylaxis and treatment in patients with cancer: ASCO Clinical Practice Guideline Update. J Clin Oncol. 2020;38:496-520. doi: 10.1200/jco.19.01461
30. Galgani A, Palleria C, Iannone LF, et al. Pharmacokinetic interactions of clinical interest between direct oral anticoagulants and antiepileptic drugs. Front Neurol. 2018;9:1067. doi: 10.3389/fneur.2018.01067
31. Farge D, Frere C, Connors JM, et al. 2019 International clinical practice guidelines for the treatment and prophylaxis of venous thromboembolism in patients with cancer. Lancet Oncol. 2019;20:e566-e581. doi: 10.1016/s1470-2045(19)30336-5
32. Di Nisio M, Carrier M, Lyman GH, et al. Prevention of venous thromboembolism in hospitalized medical cancer patients: guidance from the SSC of the ISTH. J Thromb Haemost. 2014;12:1746-1749. doi: 10.1111/jth.12683
33. Khorana AA, Kuderer NM, Culakova E, et al. Development and validation of a predictive model for chemotherapy-associated thrombosis. Blood. 2008;111:4902-4907. doi: 10.1182/blood-2007-10-116327
34. Wang TF, Zwicker JI, Ay C, et al. The use of direct oral anticoagulants for primary thromboprophylaxis in ambulatory cancer patients: guidance from the SSC of the ISTH. J Thromb Haemost. 2019;17:1772-1778. doi: 10.1111/jth.14564
35. Schrag D, Uno H, Rosovsky R, et al. Direct oral anticoagulants vs low-molecular-weight heparin and recurrent VTE in patients with cancer: a randomized clinical trial. JAMA. 2023;329:1924-1933. doi: 10.1001/jama.2023.7843
36. Stevens SM, Woller SC, Bauer KA, et al. Guidance for the evaluation and treatment of hereditary and acquired thrombophilia. J Thromb Thrombolysis. 2016;41:154-164. doi: 10.1007/s11239-015-1316-1
37. Campello E, Spiezia L, Simion C, et al. Direct oral anticoagulants in patients with inherited thrombophilia and venous thromboembolism: a prospective cohort study. J Am Heart Assoc. 2020;9:e018917. doi: 10.1161/jaha.120.018917
38. Elsebaie MAT, van Es N, Langston A, et al. Direct oral anticoagulants in patients with venous thromboembolism and thrombophilia: a systematic review and meta-analysis. J Thromb Haemost. 2019;17:645-656. doi: 10.1111/jth.14398
39. ASH. ASH Clinical Practice Guidelines on Venous Thromboembolism. Accessed May 10, 2023. www.hematology.org/education/clinicians/guidelines-and-quality-care/clinical-practice-guidelines/venous-thromboembolism-guidelines
40. Baquero-Salamanca M, Téllez-Arévalo AM, Calderon-Ospina C. Variability in the international normalised ratio (INR) in patients with antiphospholipid syndrome and positive lupus anticoagulant: should the INR targets be higher? BMJ Case Rep. 2015;2015:bcr2014209013. doi: 10.1136/bcr-2014-209013
41. Pengo V, Denas G, Zoppellaro G, et al. Rivaroxaban vs warfarin in high-risk patients with antiphospholipid syndrome. Blood. 2018;132:1365-1371. doi: 10.1182/blood-2018-04-848333
42. Ordi-Ros J, Sáez-Comet L, Pérez-Conesa M, et al. Rivaroxaban versus vitamin K antagonist in antiphospholipid syndrome: a randomized noninferiority trial. Ann Intern Med. 2019;171:685-694. doi: 10.7326/m19-0291
43. Sato T, Nakamura H, Fujieda Y, et al. Factor Xa inhibitors for preventing recurrent thrombosis in patients with antiphospholipid syndrome: a longitudinal cohort study. Lupus. 2019;28:1577-1582. doi: 10.1177/0961203319881200
44. Malec K, Broniatowska E, Undas A. Direct oral anticoagulants in patients with antiphospholipid syndrome: a cohort study. Lupus. 2020;29:37-44. doi: 10.1177/0961203319889156
45. Rivaroxaban versus warfarin to treat patients with thrombotic antiphospholipid syndrome. Dr. Hannah Cohen about the results of the RAPS trial (Lancet Haematol 2016; 3: e426-36). Rheumatology (Oxford). 2017;56:e23. doi: 10.1093/rheumatology/kex290
46. Zuily S, Cohen H, Isenberg D, et al. Use of direct oral anticoagulants in patients with thrombotic antiphospholipid syndrome: guidance from the Scientific and Standardization Committee of the International Society on Thrombosis and Haemostasis. J Thromb Haemost. 2020;18:2126-2137. doi: https://doi.org/10.1111/jth.14935
47. NIH. ClinicalTrials.gov. Apixaban for the secondary prevention of thromboembolism among patients with antiphospholipid syndrome (ASTRO-APS). Accessed May 10, 2023. https://clinicaltrials.gov/ct2/show/NCT02295475?term=apixaban&cond=Anti+Phospholipid+Syndrome&draw=2&rank=1
48. Woller SC, Stevens SM, Kaplan D, et al. Apixaban compared with warfarin to prevent thrombosis in thrombotic antiphospholipid syndrome: a randomized trial. Blood Adv. 2022;6:1661-1670. doi: 10.1182/bloodadvances.2021005808
49. Khairani CD, Bejjani A, Piazza G, et al. Direct oral anticoagulants vs vitamin K antagonists in patients with antiphospholipid syndromes: meta-analysis of randomized trials. J Am Coll Cardiol. 2023;81:16-30. doi: 10.1016/j.jacc.2022.10.008
50. Superficial thrombophlebitis, superficial vein thrombosis. 2021. Accessed May 10, 2023. thrombosiscanada.ca/wp-content/uploads/2021/07/47.-Superficial-Vein-Thrombosis_16July2021.pdf
51. Di Nisio M, Wichers IM, Middeldorp S. Treatment for superficial thrombophlebitis of the leg. Cochrane Database Syst Rev. 2018;2:CD004982. doi: 10.1002/14651858.CD004982.pub6
52. Amsterdam EA, Wenger NK, Brindis RG, et al. 2014 AHA/ACC Guideline for the Management of Patients With Non–ST-Elevation Acute Coronary Syndromes: a report of the American College of Cardiology/American Heart Association Task Force on Practice Guidelines. J Am Coll Cardiol. 2014;64:e139-e228. doi: 10.1016/j.jacc.2014.09.017
53. Alexander JH, Lopes RD, James S, et al. Apixaban with antiplatelet therapy after acute coronary syndrome. N Engl J Med. 2011;365:699-708. doi: 10.1056/NEJMoa1105819
54. Mega JL, Braunwald E, Mohanavelu S, et al. Rivaroxaban versus placebo in patients with acute coronary syndromes (ATLAS ACS-TIMI 46): a randomised, double-blind, phase II trial. Lancet. 2009;374:29-38. doi: 10.1016/s0140-6736(09)60738-8
55. Mega JL, Braunwald E, Wiviott SD, et al. Rivaroxaban in patients with a recent acute coronary syndrome. N Engl J Med. 2012;366:9-19. doi: 10.1056/NEJMoa1112277
56. Gibson WJ, Gibson CM, Yee MK, et al. Safety and efficacy of rivaroxaban when added to aspirin monotherapy among stabilized post‐acute coronary syndrome patients: a pooled analysis study of ATLAS ACS‐TIMI 46 and ATLAS ACS 2‐TIMI 51. J Am Heart Assoc. 2019. Accessed May 10, 2023. Doi: 10.1161/JAHA.118.009451
57. European Medicines Agency. Xarelto (rivaroxaban). 2008. Accessed June 23, 2023.
58. Collet JP, Thiele H, Barbato E, et al. 2020 ESC Guidelines for the management of acute coronary syndromes in patients presenting without persistent ST-segment elevation. Eur Heart J. 2021;42:1289-1367. doi: 10.1093/eurheartj/ehaa575
59. NIH. ClinicalTrials.gov. Accessed May 10, 2023. www.clinicaltrials.gov/ct2/results?cond=Acute+Coronary+Syndrome&term=rivaroxaban+&cntry=&state=&city=&dist=#
60. Watson H, Davidson S, Keeling D. Guidelines on the diagnosis and management of heparin-induced thrombocytopenia: second edition. Br J Haematol. 2012;159:528-40. doi: 10.1111/bjh.12059
61. Cuker A, Arepally GM, Chong BH, et al. American Society of Hematology 2018 guidelines for management of venous thromboembolism: heparin-induced thrombocytopenia. Blood Adv. 2018;2:3360-3392. doi: 10.1182/bloodadvances.2018024489
62. Momin J, Lee C-S. The role of direct oral anticoagulants in the management of heparin-induced thrombocytopenia US Pharmacist. 2020;45:3-10. Accessed May 10, 2023. www.uspharmacist.com/article/the-role-of-direct-oral-anticoagulants-in-the-management-of-heparininduced-thrombocytopenia
63. Warkentin TE, Pai M, Linkins LA. Direct oral anticoagulants for treatment of HIT: update of Hamilton experience and literature review. Blood. 2017;130:1104-1113. doi: 10.1182/blood-2017-04-778993
64. Krauel K, Hackbarth C, Fürll B, et al. Heparin-induced thrombocytopenia: in vitro studies on the interaction of dabigatran, rivaroxaban, and low-sulfated heparin, with platelet factor 4 and anti-PF4/heparin antibodies. Blood. 2012;119:1248-1255. doi: 10.1182/blood-2011-05-353391
Four medications comprise the drug category known as direct oral anticoagulants (DOACs). Dabigatran (Pradaxa)1 was the first to gain approval. It was approved by the US Food and Drug Administration (FDA) in 2010 for the reduction of stroke and systemic embolism in patients with nonvalvular atrial fibrillation (AF). This was followed by approvals for rivaroxaban (Xarelto)2 in 2011, apixaban (Eliquis)3 in 2012, and edoxaban (Savaysa)4 in 2015. Betrixaban (Bevyxxa)5 was approved in 2017 for venous thromboembolism (VTE) prophylaxis in acutely ill hospitalized patients with restricted mobility, but it was removed from the market in 2020.
In addition to stroke prevention in nonvalvular AF, each DOAC has been approved for other indications and has been addressed further in guideline-based recommendations outside FDA-approved indications.
Overview of DOACs
Dabigatran is the only direct thrombin inhibitor; the other agents inhibit factor Xa. TABLE 11-4 summarizes FDA-approved indications and dosing and guideline-based dosing. Dabigatran and edoxaban require parenteral anticoagulation for 5 to 10 days prior to initiation for acute VTE, limiting their use.1,4 TABLE 21-4 highlights pharmacokinetic differences among the agents. For example, dabigatran is 80% renally cleared, is somewhat dialyzable, and can accumulate in patients with renal dysfunction.1 Edoxaban is contraindicated for nonvalvular AF in patients with a creatinine clearance (CrCl) > 95 mL/min because an increased stroke risk was demonstrated.4 Therefore, rivaroxaban and apixaban are prescribed most often in the United States.6,7
Applications in special patient populations
Obesity
As of 2020, more than 40% of adults in the United States were obese (body mass index [BMI] ≥ 30), with 9% classified as class 3 or severely obese (BMI ≥ 40).8 Altered drug pharmacokinetics in patients with severe obesity raises concern for undertreatment with fixed-dose DOACs. Phase III DOAC approval trials included patients with obesity, but weight cutoffs differed, making extrapolating efficacy and safety data difficult across different obesity stages.9 Although no FDA-labeled dosing adjustments exist for patients with obesity, the International Society on Thrombosis and Haemostasis (ISTH) does provide such recommendations.
ISTH changes position on measuring drug levels. ISTH previously recommended avoiding DOACs in those with a BMI > 40 or body weight > 120 kg. If a DOAC was used, ISTH advised obtaining peak and trough drug levels.10 However, DOAC drug levels have not been associated with clinical outcomes or sufficient degrees of anticoagulation.11
Men and women are affected equally by fibrolipomas. Prevalence does not differ by race or ethnicity.
In April 2021, ISTH updated guidance on DOACs in obesity, indicating standard doses of rivaroxaban or apixaban can be used for the treatment and prevention of VTE in all patients regardless of weight or BMI. Because data in obesity are lacking for dabigatran and edoxaban, avoid using these agents in patients with a BMI > 40 or weight > 120 kg. Additionally, assessing drug levels is no longer recommended, as there is insufficient evidence that these impact clinical outcomes.12
The 2021 American College of Chest Physicians (CHEST) guideline update
Continue to: Effectiveness of DOACs for AF in patients with obesity isn't clear
Effectiveness of DOACs for AF in patients with obesity isn’t clear, as most data are from retrospective cohort analyses. In patients weighing > 120 kg, dabigatran has shown efficacy in thrombosis prevention similar to that achieved in those weighing ≤ 120 kg, but it has increased the risk for gastrointestinal (GI) bleeding.15 Another study indicated a 15-mg dose of rivaroxaban may be associated with increased thromboembolic complications in patients with a BMI ≥ 35.16 Alternatively, another retrospective study of rivaroxaban demonstrated a small absolute risk reduction in ischemic stroke among patients in all stages of obesity and no difference in significant bleeding events.17 One further retrospective cohort showed that, in patients with a BMI ≥ 50 kg, the effectiveness of rivaroxaban and apixaban in thrombosis prevention and bleeding safety outcomes was comparable to that seen in those with a BMI < 30.18
As a result of conflicting data, and a lack of prospective randomized controlled trials (RCTs), ISTH continued recommending international normalized ratio (INR)–based dosing of warfarin for class 3 or severely obese patients with AF. The 2018 CHEST guidelines19 and the 2020 ESC guidelines20 make no mention of DOAC avoidance in patients with obesity and AF.
Advanced and end-stage renal disease
DOACs are renally dosed based on indication, drug-drug interactions, and degree of renal function (TABLE 31-4). For example, patients with AF who are anticoagulated with apixaban are prescribed 2.5 mg twice daily when 2 of the 3 following criteria are met: age ≥ 80 years, body weight ≤ 60 kg, serum creatinine ≥ 1.5 mg/dL. However, no dosage adjustment is necessary for VTE treatment or prophylaxis with apixaban regardless of renal function.3
Data supporting the safety and efficacy of DOACs in end-stage renal disease (ESRD) are sparse. All DOACs are renally cleared to varying degrees (TABLE 21-4), theoretically increasing bleeding risk as kidney disease progresses. Apixaban is the least renally cleared of the DOACs and has been evaluated in the greatest number of trials for patients with ESRD for both VTE treatment and prevention and nonvalvular AF.21 As a result, the FDA approved standard-dose apixaban (5 mg twice daily) for VTE treatment and prevention and nonvalvular AF in patients with ESRD, even those requiring dialysis. Use the reduced apixaban dose (2.5 mg twice daily) in patients with ESRD and AF only if they are ≥ 80 years of age or their body weight is ≤ 60 kg.3
Patients with cancer
Cancer-associated acute VTE treatment. Cancer is an established risk factor for acute VTE but it also increases the risk for treatment-associated bleeding compared with patients without cancer.22 Historically, low-molecular-weight heparin (LMWH) was recommended over warfarin and DOACs for cancer-associated thromboses (CAT).23 Compared with warfarin, LMWH reduced the rate of recurrent VTE and had similar or reduced bleeding rates at 6 to 12 months.24-26 However, clinicians and patients often chose warfarin to avoid subcutaneous injections.27
CHEST guidelines recommend oral Xa inhibitors over LMWH for the treatment of CAT.13 The 2020 guidelines of the National Institute for Health and Care Excellence (NICE) recommend DOACs as an option for CAT along with LMWH or LMWH transitioned to warfarin.28 The American Society of Clinical Oncology (ASCO) recommends rivaroxaban for acute VTE treatment in CAT. No head-to-head trials have evaluated comparative efficacy of DOACs for CAT. However, edoxaban and rivaroxaban are associated with a greater risk for GI bleeding; therefore, apixaban is preferred in patients with GI malignancies.29 Standard DOAC VTE treatment dosing is recommended for all 3 agents.2-4
When using DOACs for patients with CAT, consider potential drug-drug interactions with chemotherapy regimens. All DOACs are transported by p-glycoprotein, while rivaroxaban and apixaban are substrates of cytochrome P450, leading to potentially significant drug-drug interactions.30 These interactions could affect the patient’s chemotherapeutic regimen, decrease the efficacy of the DOAC, or increase the risk for bleeding. Therefore, anticoagulation choice should be made in collaboration with the hematology/oncology team.
Continue to: Cancer-associated VTE prophylaxis...
Cancer-associated VTE prophylaxis. VTE prophylaxis for patients with cancer is complex and necessitates a global assessment of cancer location and treatment regimen and setting. Hospitalized patients receiving chemotherapy are at high risk for VTE if mobility is reduced or if other VTE risk factors are present. The International Initiative on Thrombosis and Cancer (ITAC)31 and ISTH32 recommend VTE prophylaxis with unfractionated heparin or LMWH (ISTH recommends LMWH more strongly). The 2020 ASCO Guidelines recommend pharmacologic anticoagulation but make no drug-specific recommendation.29 Parenteral treatment in hospitalized patients is not as burdensome as it is in ambulatory patients; therefore, these recommendations are less likely to elicit inpatient opposition.
In the ambulatory setting, patient avoidance of subcutaneous injections necessitates consideration of DOACs for CAT prophylaxis. The Khorana Risk Score (KRS) is a validated tool (scale, 0-7) to predict VTE risk in ambulatory patients receiving chemotherapy.33 KRS scores ≥ 2 indicate high thrombotic risk and the need for prophylactic anticoagulation. ASCO recommends apixaban, rivaroxaban, or LMWH.29 ISTH and ITAC both recommend apixaban or rivaroxaban over LMWH.31,34 An RCT published in June 2023 confirmed that, for adults with cancer and VTE, DOACs were noninferior to LMWH for preventing recurrent VTE for 6 months.35 The recommended doses for apixaban (2.5 mg twice daily) and rivaroxaban (10 mg daily) for CAT VTE prophylaxis are lower than FDA-approved treatment doses.31
Patients with thrombophilia: VTE prevention
Thrombophilias are broadly categorized as inherited or acquired, with inherited thrombophilia being more prevalent. The Factor V Leiden (FVL) variant affects 2% to 7% of the population, and prothrombin gene mutation (PGM) affects 1% to 2% of the population.36 Other forms of inherited thrombophilia, such as protein C deficiency, protein S deficiency, and antithrombin deficiency, occur less commonly (< 0.7% of the population).36 Antiphospholipid syndrome (APS), the most common acquired thrombophilia, affects approximately 2% of the population.36 APS involves multiple antibodies: anticardiolipin antibodies, lupus anticoagulant, and anti-beta-2 glycoprotein 1 antibodies. Establishing risk for thrombosis across the varying types of thrombophilia has proven difficult, but APS is considered the most thrombogenic thrombophilia apart from extremely rare homozygous inherited thrombophilias.36 Therefore, DOAC recommendations are thrombophilia specific.
A prospective cohort study evaluated DOACs compared with heparin/warfarin for VTE treatment in patients with inherited thrombophilias.37 Although all 4 available DOACs were included, most patients (61.1%) received rivaroxaban. Patients with an array of inherited thrombophilias, including rare homozygous mutations, were enrolled in this trial. While most patients (66.9%) had a “mild thrombophilia” defined as either FVL or PGM, the remainder had more severe thrombophilias.37 VTE recurrence was similar and uncommon in the DOAC and heparin/warfarin groups, consistent with a previous meta-analysis.38 Surprisingly, an increase in the cumulative risk for bleeding was seen in the DOAC group compared with the warfarin group, a finding inconsistent with prior trials.38 There were no major bleeding events in the DOAC group, but 3 such events occurred in the heparin/warfarin group, including 2 intracranial hemorrhages.
Currently NICE, CHEST, and ISTH do not make a recommendation for a preferred agent in patients with an acute VTE and inherited thrombophilia; however, DOACs would not be inappropriate.23,28,32 The American Society of Hematology (ASH) had planned to release recommendations related to the treatment of thrombophilia in 2020, but they were delayed by the COVID-19 pandemic.39
APS presents challenges for acute VTE anticoagulation. First, it causes a strongly thrombogenic state necessitating therapeutic anticoagulation. Second, for patients with positive lupus anticoagulant, INR monitoring and standardized INR goals may be inadequate.40 Therefore, using fixed-dose DOACs without the need for therapeutic monitoring is appealing, but significant concerns exist for using DOACs in patients with APS.41-45 ISTH and CHEST recommend warfarin for the treatment and prevention of acute VTE in patients with APS, especially those with triple-positive (anticardiolipin, lupus anticoagulant, and anti-beta-2 glycoprotein 1) APS.13,46 Package labeling for all DOACs recommends avoidance in triple-positive APS.1-4
ASTRO-APS is the most recent RCT to compare apixaban and warfarin for patients with APS,47 and it was terminated early after 6 of 23 patients in the apixaban group had thrombotic events, while no one in the warfarin group had such an event.48 Subsequently, a meta-analysis49 demonstrated that patients with thrombotic APS appear to have a greater risk for arterial thrombosis when treated with DOACs compared with warfarin. These 2 studies may lead to changes in recommendations to avoid DOACs in all patients with APS or may prompt more focused trials for DOAC use in patients with APS plus an antiplatelet to mitigate arterial thrombotic risk.
Continue to: Expanded clinical indications
Expanded clinical indications
Superficial vein thrombosis
Superficial thrombophlebitis or superficial vein thrombosis (SVT) is estimated to occur 6 times more frequently than VTE.50 Management of patients with isolated, uncomplicated thrombophlebitis who are at low risk for extension of the SVT involves symptomatic treatment with nonsteroidal anti-inflammatory drugs, topical agents, or compression therapy. However, depending on risk for progression, anticoagulation may be recommended.51
Patients at intermediate risk for extension or propagation of SVT are candidates for anticoagulation. The CHEST guidelines recommend
Certain situations should prompt one to consider using a treatment dose of a DOAC for 3 months. These include cases in which the SVT is located within 3 cm of the deep venous system, expands despite an appropriate prophylactic regimen, or recurs after discontinuation of prophylactic anticoagulation.13,50
Acute coronary syndrome
The American College of Cardiology/American Heart Association (ACC/AHA) recommend combination antiplatelet therapy and anticoagulation for management of acute coronary syndrome in hospitalized patients.52 Data are mixed regarding longer-term anticoagulation in addition to dual antiplatelet therapy in outpatient settings to prevent thrombosis recurrence in the absence of AF.
The APPRAISE-2 trial enrolled high-risk patients with ACS within 7 days of the event.53 Apixaban 5 mg twice daily was compared with placebo in patients taking aspirin or aspirin plus clopidogrel. The trial was terminated early because major bleeding events increased with apixaban without reduction in recurrent ischemic events. The ATLAS ACS-TIMI 46 trial evaluated different rivaroxaban doses (5-20 mg daily) in ACS patients.54 The study revealed possible thrombosis benefit but also increased risk for bleeding, particularly at higher doses. As a result, another study—ATLAS ACS 2-TIMI 51—was conducted and compared the use of low-dose rivaroxaban (2.5 mg twice daily or 5 mg twice daily) vs placebo for patients with recent ACS.55 All patients were receiving low-dose aspirin, and approximately 93% of patients in each group also were receiving clopidogrel or ticlopidine. As in the APPRAISE-2 trial, rivaroxaban increased the rate of major bleeding and intracranial hemorrhage; however, it did not increase the incidence of fatal bleeding. Unlike APPRAISE-2, rivaroxaban significantly reduced the primary efficacy end point, a composite of death from cardiovascular causes, myocardial infarction, or stroke (absolute risk reduction = 1.8%; number needed to treat = 56 for combined rivaroxaban doses).55
A secondary subgroup analysis combined data from the ATLAS ACMS-TIMI 46 and ATLAS ACS 2-TIMI 51 trials to evaluate outcomes in patients receiving aspirin monotherapy when combined with rivaroxaban 2.5 mg twice daily or 5 mg twice daily or with placebo.56 The primary efficacy end point was a composite of cardiovascular death, myocardial infarction, or stroke. When the 2 trials were evaluated separately, neither rivaroxaban dose was associated with reduction of the primary efficacy outcomes compared with aspirin alone. However, when the data were pooled, both the combined rivaroxaban doses (particularly the 5-mg dose) were associated with reduced cardiovascular outcomes. From a safety perspective, the 2.5-mg twice-daily dose of rivaroxaban was the only dose not associated with increased major bleeding risk. Thus, the 2.5-mg twice-daily dose of rivaroxaban may not provide sufficient cardiovascular benefit in patients with ACS, while the larger dose may increase the risk for nonfatal major bleeding events.56
The European Medicines Agency57 approved rivaroxaban 2.5 mg twice daily for ACS, and the 2020 ESC guidelines58 consider it an appropriate therapeutic option in addition to aspirin for patients at high ischemic risk and low bleeding risk. ACS is not an FDA-approved indication for DOACs, and the ACC/AHA Guideline for the Management of ACS, last updated in 2014, does not include DOACs for ACS unless patients have AF.52 Ongoing trials are further investigating rivaroxaban for ACS, so the use of DOACs in the post-acute phase of ACS may become clearer in the future.59
Continue to: Heparin-induced thrombocytopenia
Heparin-induced thrombocytopenia
Historically, nonheparin parenteral anticoagulants argatroban, bivalirudin, and fondaparinux were recommended for patients at risk for or who had heparin-induced thrombocytopenia (HIT). Argatroban is the only drug FDA approved for the treatment and prophylaxis of HIT; recommendations for the others are based on guideline recommendations.23,60,61 The nonheparin parenteral anticoagulants cost between $700 and $1500 per day; therefore most patients with HIT are transitioned to warfarin.62 However, protein C and S inhibition and a subsequent prothrombotic state conveyed by warfarin initiation necessitates a minimum 5-day bridge to therapeutic warfarin with a nonheparin parenteral anticoagulant.
In vitro tests show that DOACs do not promote development of HIT antibodies63 or affect platelet activation or aggregation.64 A literature summary of DOACs for HIT determined that in 104 patients, all but 1 achieved platelet recovery (defined as > 150,000/mcL) within a median time of 7 days. Therapeutically, DOACs prevented new or recurrent VTE in 102/104 cases (98%), and only 3% of patients experienced significant bleeding events.62
The 2018 ASH guidelines for VTE management in HIT include (with very low certainty of evidence) dabigatran, rivaroxaban, or apixaban for consideration in addition to previously recommended nonheparin parenteral anticoagulants.61 The dosing of each agent is contingent upon treatment of patients with HIT and an acute thrombosis (HITT) or HIT in the absence of VTE. For patients with HITT, treatment doses for acute VTE should be used for the appropriate duration of therapy (ie, 3 months). Importantly, dabigatran requires a 5-day pretreatment period with a parenteral anticoagulant, so it is not an ideal option. When treating isolated HIT (in the absence of VTE), ASH recommends all agents be dosed twice daily—dabigatran 150 mg twice daily (no 5-day parenteral pretreatment necessary), rivaroxaban 15 mg twice daily, or apixaban 5 mg twice daily—until platelet recovery (≥ 150,000/mcL) is achieved.61
CORRESPONDENCE
Kevin Schleich, PharmD, BCACP, Departments of Pharmaceutical Care and Family Medicine, University of Iowa, 200 Hawkins Drive, 01102-D PFP, Iowa City, IA, 52242; [email protected]
1. Dabigatran. Package Insert. Boehringer Ingelheim Pharmaceuticals, Inc.; 2021.
2. Rivaroxaban. Package insert. Janssen Pharmaceuticals, Inc; 2022.
3. Apixaban. Package insert. Bristol-Myers Squibb; 2021.
4. Edoxaban. Package insert. Daiichi Sankyo, Inc; 2015.
5. Betrixaban. Package insert. Portola Pharmaceuticals, Inc; 2017.
6. Wheelock KM, Ross JS, Murugiah K, et al. Clinician trends in prescribing direct oral anticoagulants for US Medicare beneficiaries. JAMA Netw Open. 2021;4:e2137288. doi: 10.1001/jamanetworkopen.2021.37288
7. Colacci M, Tseng EK, Sacks CA, et al. Oral anticoagulant utilization in the United States and United Kingdom. J Gen Intern Med. 2020;35:2505-2507. doi: 10.1007/s11606-020-05904-0
8. CDC. Adult obesity facts. Accessed May 9, 2023. www.cdc.gov/obesity/data/adult.html
9. Mocini D, Di Fusco SA, Mocini E, et al. Direct oral anticoagulants in patients with obesity and atrial fibrillation: position paper of Italian National Association of Hospital Cardiologists (ANMCO). J Clin Med. 2021;10:4185. doi: 10.3390/jcm10184185
10. Martin K, Beyer-Westendorf J, Davidson BL, et al. Use of the direct oral anticoagulants in obese patients: guidance from the SSC of the ISTH. J Thromb Haemost. 2016;14:1308-1313. doi: 10.1111/jth.13323
11. Gu TM, Garcia DA, Sabath DE. Assessment of direct oral anticoagulant assay use in clinical practice. J Thromb Thrombolysis. 2019;47:403-408. doi: 10.1007/s11239-018-1793-0
12. Martin KA, Beyer-Westendorf J, Davidson BL, et al. Use of direct oral anticoagulants in patients with obesity for treatment and prevention of venous thromboembolism: updated communication from the ISTH SSC Subcommittee on Control of Anticoagulation. J Thromb Haemost. 2021;19:1874-1882. doi: 10.1111/jth.15358
13. Stevens SM, Woller SC, Kreuziger LB, et al. Antithrombotic therapy for VTE disease: second update of the CHEST Guideline and Expert Panel Report. Chest. 2021;160:e545-e608. doi: 10.1016/j.chest.2021.07.055
14. Konstantinides SV, Meyer G, Becattini C, et al. 2019 ESC Guidelines for the diagnosis and management of acute pulmonary embolism developed in collaboration with the European Respiratory Society (ERS). Eur Heart J. 2020;41:543-603. doi: 10.1093/eurheartj/ehz405
15. Coates J, Bitton E, Hendje A, et al. Clinical outcomes of dabigatran use in patients with non-valvular atrial fibrillation and weight >120 kg. Thromb Res. 2021;208:176-180. doi: 10.1016/j.thromres.2021.11.007
16. Li X, Zuo C, Ji Q, et al. Body mass index influence on the clinical outcomes for nonvalvular atrial fibrillation patients admitted to a hospital treated with direct oral anticoagulants: a retrospective cohort study. Drug Des Devel Ther. 2021;15:1931-1943. doi: 10.2147/dddt.S303219
17. Barakat AF, Jain S, Masri A, et al. Outcomes of direct oral anticoagulants in atrial fibrillation patients across different body mass index categories. JACC Clin Electrophysiol. 2021;7:649-658. doi: 10.1016/j.jacep.2021.02.002
18. O’Kane CP, Avalon JCO, Lacoste JL, et al. Apixaban and rivaroxaban use for atrial fibrillation in patients with obesity and BMI ≥50 kg/m2. Pharmacotherapy. 2022;42:112-118. doi: https://doi.org/10.1002/phar.2651
19. Lip GYH, Banerjee A, Boriani G, et al. Antithrombotic therapy for atrial fibrillation: CHEST Guideline and Expert Panel Report. Chest. 2018;154:1121-1201. doi: 10.1016/j.chest.2018.07.040
20. Sepehri Shamloo A, Dagres N, Hindricks G. [2020 ESC guidelines on atrial fibrillation: summary of the most relevant recommendations and innovations]. Herz. 2021;46:28-37. doi: 10.1007/s00059-020-05005-y
21. Chokesuwattanaskul R, Thongprayoon C, Tanawuttiwat T, et al. Safety and efficacy of apixaban versus warfarin in patients with end-stage renal disease: meta-analysis. Pacing Clin Electrophysiol. 2018;41:627-634. doi: 10.1111/pace.13331
22. Wang T-F, Li A, Garcia D. Managing thrombosis in cancer patients. Res Pract Thromb Haemost. 2018;2:429-438. doi: https://doi.org/10.1002/rth2.12102
23. Kearon C, Akl EA, Ornelas J, et al. Antithrombotic therapy for VTE disease: CHEST Guideline and Expert Panel Report. CHEST. 2016;149:315-352. doi: 10.1016/j.chest.2015.11.026
24. Lee AY, Levine MN, Baker RI, et al. Low-molecular-weight heparin versus a coumarin for the prevention of recurrent venous thromboembolism in patients with cancer. N Engl J Med. 2003;349:146-153. doi: 10.1056/NEJMoa025313
25. Meyer G, Marjanovic Z, Valcke J, et al. Comparison of low-molecular-weight heparin and warfarin for the secondary prevention of venous thromboembolism in patients with cancer: a randomized controlled study. Arch Intern Med. 2002;162:1729-1735. doi: 10.1001/archinte.162.15.1729
26. Hull RD, Pineo GF, Brant RF, et al. Long-term low-molecular-weight heparin versus usual care in proximal-vein thrombosis patients with cancer. Am J Med. 2006;119:1062-1072. doi: 10.1016/j.amjmed.2006.02.022
27. Lee AYY, Kamphuisen PW, Meyer G, et al. Tinzaparin vs warfarin for treatment of acute venous thromboembolism in patients with active cancer: a randomized clinical trial. JAMA. 2015;314:677-686. doi: 10.1001/jama.2015.9243
28. NICE Guideline. Venous thromboembolic diseases: diagnosis, management and thrombophilia testing. Accessed May 9, 2023. www.ncbi.nlm.nih.gov/books/NBK556698/
29. Key NS, Khorana AA, Kuderer NM, et al. Venous thromboembolism prophylaxis and treatment in patients with cancer: ASCO Clinical Practice Guideline Update. J Clin Oncol. 2020;38:496-520. doi: 10.1200/jco.19.01461
30. Galgani A, Palleria C, Iannone LF, et al. Pharmacokinetic interactions of clinical interest between direct oral anticoagulants and antiepileptic drugs. Front Neurol. 2018;9:1067. doi: 10.3389/fneur.2018.01067
31. Farge D, Frere C, Connors JM, et al. 2019 International clinical practice guidelines for the treatment and prophylaxis of venous thromboembolism in patients with cancer. Lancet Oncol. 2019;20:e566-e581. doi: 10.1016/s1470-2045(19)30336-5
32. Di Nisio M, Carrier M, Lyman GH, et al. Prevention of venous thromboembolism in hospitalized medical cancer patients: guidance from the SSC of the ISTH. J Thromb Haemost. 2014;12:1746-1749. doi: 10.1111/jth.12683
33. Khorana AA, Kuderer NM, Culakova E, et al. Development and validation of a predictive model for chemotherapy-associated thrombosis. Blood. 2008;111:4902-4907. doi: 10.1182/blood-2007-10-116327
34. Wang TF, Zwicker JI, Ay C, et al. The use of direct oral anticoagulants for primary thromboprophylaxis in ambulatory cancer patients: guidance from the SSC of the ISTH. J Thromb Haemost. 2019;17:1772-1778. doi: 10.1111/jth.14564
35. Schrag D, Uno H, Rosovsky R, et al. Direct oral anticoagulants vs low-molecular-weight heparin and recurrent VTE in patients with cancer: a randomized clinical trial. JAMA. 2023;329:1924-1933. doi: 10.1001/jama.2023.7843
36. Stevens SM, Woller SC, Bauer KA, et al. Guidance for the evaluation and treatment of hereditary and acquired thrombophilia. J Thromb Thrombolysis. 2016;41:154-164. doi: 10.1007/s11239-015-1316-1
37. Campello E, Spiezia L, Simion C, et al. Direct oral anticoagulants in patients with inherited thrombophilia and venous thromboembolism: a prospective cohort study. J Am Heart Assoc. 2020;9:e018917. doi: 10.1161/jaha.120.018917
38. Elsebaie MAT, van Es N, Langston A, et al. Direct oral anticoagulants in patients with venous thromboembolism and thrombophilia: a systematic review and meta-analysis. J Thromb Haemost. 2019;17:645-656. doi: 10.1111/jth.14398
39. ASH. ASH Clinical Practice Guidelines on Venous Thromboembolism. Accessed May 10, 2023. www.hematology.org/education/clinicians/guidelines-and-quality-care/clinical-practice-guidelines/venous-thromboembolism-guidelines
40. Baquero-Salamanca M, Téllez-Arévalo AM, Calderon-Ospina C. Variability in the international normalised ratio (INR) in patients with antiphospholipid syndrome and positive lupus anticoagulant: should the INR targets be higher? BMJ Case Rep. 2015;2015:bcr2014209013. doi: 10.1136/bcr-2014-209013
41. Pengo V, Denas G, Zoppellaro G, et al. Rivaroxaban vs warfarin in high-risk patients with antiphospholipid syndrome. Blood. 2018;132:1365-1371. doi: 10.1182/blood-2018-04-848333
42. Ordi-Ros J, Sáez-Comet L, Pérez-Conesa M, et al. Rivaroxaban versus vitamin K antagonist in antiphospholipid syndrome: a randomized noninferiority trial. Ann Intern Med. 2019;171:685-694. doi: 10.7326/m19-0291
43. Sato T, Nakamura H, Fujieda Y, et al. Factor Xa inhibitors for preventing recurrent thrombosis in patients with antiphospholipid syndrome: a longitudinal cohort study. Lupus. 2019;28:1577-1582. doi: 10.1177/0961203319881200
44. Malec K, Broniatowska E, Undas A. Direct oral anticoagulants in patients with antiphospholipid syndrome: a cohort study. Lupus. 2020;29:37-44. doi: 10.1177/0961203319889156
45. Rivaroxaban versus warfarin to treat patients with thrombotic antiphospholipid syndrome. Dr. Hannah Cohen about the results of the RAPS trial (Lancet Haematol 2016; 3: e426-36). Rheumatology (Oxford). 2017;56:e23. doi: 10.1093/rheumatology/kex290
46. Zuily S, Cohen H, Isenberg D, et al. Use of direct oral anticoagulants in patients with thrombotic antiphospholipid syndrome: guidance from the Scientific and Standardization Committee of the International Society on Thrombosis and Haemostasis. J Thromb Haemost. 2020;18:2126-2137. doi: https://doi.org/10.1111/jth.14935
47. NIH. ClinicalTrials.gov. Apixaban for the secondary prevention of thromboembolism among patients with antiphospholipid syndrome (ASTRO-APS). Accessed May 10, 2023. https://clinicaltrials.gov/ct2/show/NCT02295475?term=apixaban&cond=Anti+Phospholipid+Syndrome&draw=2&rank=1
48. Woller SC, Stevens SM, Kaplan D, et al. Apixaban compared with warfarin to prevent thrombosis in thrombotic antiphospholipid syndrome: a randomized trial. Blood Adv. 2022;6:1661-1670. doi: 10.1182/bloodadvances.2021005808
49. Khairani CD, Bejjani A, Piazza G, et al. Direct oral anticoagulants vs vitamin K antagonists in patients with antiphospholipid syndromes: meta-analysis of randomized trials. J Am Coll Cardiol. 2023;81:16-30. doi: 10.1016/j.jacc.2022.10.008
50. Superficial thrombophlebitis, superficial vein thrombosis. 2021. Accessed May 10, 2023. thrombosiscanada.ca/wp-content/uploads/2021/07/47.-Superficial-Vein-Thrombosis_16July2021.pdf
51. Di Nisio M, Wichers IM, Middeldorp S. Treatment for superficial thrombophlebitis of the leg. Cochrane Database Syst Rev. 2018;2:CD004982. doi: 10.1002/14651858.CD004982.pub6
52. Amsterdam EA, Wenger NK, Brindis RG, et al. 2014 AHA/ACC Guideline for the Management of Patients With Non–ST-Elevation Acute Coronary Syndromes: a report of the American College of Cardiology/American Heart Association Task Force on Practice Guidelines. J Am Coll Cardiol. 2014;64:e139-e228. doi: 10.1016/j.jacc.2014.09.017
53. Alexander JH, Lopes RD, James S, et al. Apixaban with antiplatelet therapy after acute coronary syndrome. N Engl J Med. 2011;365:699-708. doi: 10.1056/NEJMoa1105819
54. Mega JL, Braunwald E, Mohanavelu S, et al. Rivaroxaban versus placebo in patients with acute coronary syndromes (ATLAS ACS-TIMI 46): a randomised, double-blind, phase II trial. Lancet. 2009;374:29-38. doi: 10.1016/s0140-6736(09)60738-8
55. Mega JL, Braunwald E, Wiviott SD, et al. Rivaroxaban in patients with a recent acute coronary syndrome. N Engl J Med. 2012;366:9-19. doi: 10.1056/NEJMoa1112277
56. Gibson WJ, Gibson CM, Yee MK, et al. Safety and efficacy of rivaroxaban when added to aspirin monotherapy among stabilized post‐acute coronary syndrome patients: a pooled analysis study of ATLAS ACS‐TIMI 46 and ATLAS ACS 2‐TIMI 51. J Am Heart Assoc. 2019. Accessed May 10, 2023. Doi: 10.1161/JAHA.118.009451
57. European Medicines Agency. Xarelto (rivaroxaban). 2008. Accessed June 23, 2023.
58. Collet JP, Thiele H, Barbato E, et al. 2020 ESC Guidelines for the management of acute coronary syndromes in patients presenting without persistent ST-segment elevation. Eur Heart J. 2021;42:1289-1367. doi: 10.1093/eurheartj/ehaa575
59. NIH. ClinicalTrials.gov. Accessed May 10, 2023. www.clinicaltrials.gov/ct2/results?cond=Acute+Coronary+Syndrome&term=rivaroxaban+&cntry=&state=&city=&dist=#
60. Watson H, Davidson S, Keeling D. Guidelines on the diagnosis and management of heparin-induced thrombocytopenia: second edition. Br J Haematol. 2012;159:528-40. doi: 10.1111/bjh.12059
61. Cuker A, Arepally GM, Chong BH, et al. American Society of Hematology 2018 guidelines for management of venous thromboembolism: heparin-induced thrombocytopenia. Blood Adv. 2018;2:3360-3392. doi: 10.1182/bloodadvances.2018024489
62. Momin J, Lee C-S. The role of direct oral anticoagulants in the management of heparin-induced thrombocytopenia US Pharmacist. 2020;45:3-10. Accessed May 10, 2023. www.uspharmacist.com/article/the-role-of-direct-oral-anticoagulants-in-the-management-of-heparininduced-thrombocytopenia
63. Warkentin TE, Pai M, Linkins LA. Direct oral anticoagulants for treatment of HIT: update of Hamilton experience and literature review. Blood. 2017;130:1104-1113. doi: 10.1182/blood-2017-04-778993
64. Krauel K, Hackbarth C, Fürll B, et al. Heparin-induced thrombocytopenia: in vitro studies on the interaction of dabigatran, rivaroxaban, and low-sulfated heparin, with platelet factor 4 and anti-PF4/heparin antibodies. Blood. 2012;119:1248-1255. doi: 10.1182/blood-2011-05-353391
PRACTICE RECOMMENDATIONS
› Consider a direct oral anticoagulant (DOAC) when treating venous thromboembolism (VTE) in patients with advanced chronic kidney disease or obesity. C
› Select apixaban for treatment of VTE or nonvalvular atrial fibrillation in patients with end-stage renal disease, due to its minimal renal clearance compared with other DOACs. B
› Consider DOACs such as dabigatran, rivaroxaban, or apixaban for treatment of VTE in the context of heparin-induced thrombocytopenia. C
Strength of recommendation (SOR)
A Good-quality patient-oriented evidence
B Inconsistent or limited-quality patient-oriented evidence
C Consensus, usual practice, opinion, disease-oriented evidence, case series

Even exercise by ‘weekend warriors’ can cut CV risk
Moderate to vigorous physical activity (MVPA) is a familiar and established approach to reducing cardiovascular (CV) risk, but it’s often believed that the exercise should be spread out across the week rather than concentrated within a couple of days.
A challenge to that view comes from an observational study of accelerometer-confirmed exercise in almost 90,000 people in their 60s. It suggests,
Researchers compared three patterns of MVPA in their subjects who wore accelerometers on their wrists for 1 week. Active WW subjects obtained at least 2.5 hours of exercise weekly, with at least half the amount completed over 1-2 days; “active regular” subjects achieved that exercise level but not mostly during 1 or 2 days; and those who were “inactive” fell short of 2.5 hours of exercise during the week. The group used a median exercise threshold of 3 hours, 50 minutes in a separate analysis.
The “active” groups, compared with inactive subjects, achieved similar and significant reductions in risk for incident atrial fibrillation (AF), myocardial infarction (MI), stroke, and heart failure (HF) over a median follow-up of 6.3 years at both weekly exercise thresholds, the group reported.
“The take-home [message] is that efforts to optimize activity, even if concentrated within just a day or 2 each week, should be expected to result in improved cardiovascular risk profiles,” lead author Shaan Khurshid, MD, MPH, Massachusetts General Hospital, Boston, said in an interview.
The study was published online in JAMA.
The research “provides novel data on patterns of physical activity accumulation and the risk of developing cardiovascular diseases,” observed Peter Katzmarzyk, PhD, Pennington Biomedical Research Center, Baton Rouge, La., in an interview. He was not involved with the research. Its “marked strengths,” he noted, include a large sample population and “use of accelerometers to measure physical activity levels and patterns.”
Moreover, Dr. Katzmarzyk said, its findings are “important” for showing that physical activity “can be accumulated throughout the week in different ways, which opens up more options for busy people to get their physical activity in.”
Current guidelines from the World Health Organization and the American Heart Association recommend at least 150 minutes of MVPA weekly to lower risk for cardiovascular disease and death, but do not specify an optimal exercise time frame. The U.K. National Health Service recommends MVPA daily or spread evenly over perhaps 4-5 days.
“The weekend warrior pattern has been studied previously, but typically relying on self-reported data, which may be biased, or [in studies] too small to look at specific cardiovascular outcomes,” Dr. Khurshid explained.
In the UK Biobank database, he said, “We saw the opportunity to leverage the largest sample of measured activity to date” to address the question of whether exercise time pattern “affects specific major cardiovascular diseases differently,” Dr. Khurshid said
The primary analysis assessed exercise amount in a week based on the guideline-recommended threshold of at least 2.5 hours; a 3-hour, 50-minutes threshold was used in a secondary analysis. The group assessed multiple thresholds because optimal MVPS levels derived from wrist-based accelerometers are “unclear,” he said.
The sample consisted of 89,573 participants with a mean age 62; slightly more than half (56%) were women. Based on the weekly MVPA threshold of 2.5 hours , the WW, active regular, and inactive groups made up 42.2%, 24%, and 33.7% of the population, respectively.
Compared with the inactive group, the two active groups both showed significant risk reductions for the four clinical outcomes, to similar degrees, in multivariate analysis. The results were similar at the 230-minute weekly exercise threshold for incident AF, MI, and HF but not for stroke.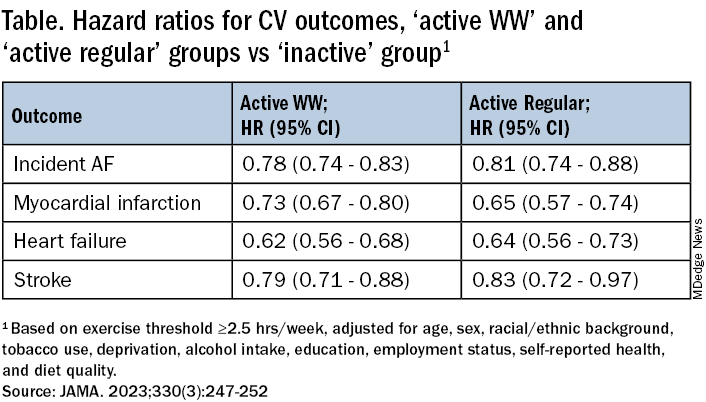
The findings were similarly consistent at the 3-hour, 50-minutes median threshold, although stroke differences were no longer significant.
Patients should be encouraged to exercise at recommended levels, “and should not be discouraged if, for whatever reasons, they are able to focus exercise within only 1 or a few days of the week,” said Dr. Khurshid. “Our findings suggest that it is the volume of activity, rather than the pattern, that matters most.”
The report notes several limitations of the study, including the exercise observation period limited to 1 week and that participants could have modified their behavior during the observation period. Also, the participants were almost all White, so the results may not be generalizable to other populations.
Clinicians should familiarize themselves with the “full range of recommendations” presented in the “Physical Activity Guidelines for Americans, 2nd Edition” “and personalize prescriptions by setting achievable physical activity goals” based on age, physical abilities, and activity levels, states an accompanying editorial from Dr. Katzmarzyk and John M. Jakicic, PhD, University of Kansas Medical Center, Kansas City.
Although MVPA at the recommended level of at least 2.5 hours per week will certainly be beneficial, they write, “the public health message should also clearly convey that every minute counts, especially among the three-quarters of U.S. adults who do not achieve that goal.”
Dr. Khurshid reported no relevant financial relationships; disclosures for the other authors are in the original article. Dr. Katzmarzyk reports no relevant financial relationships. Dr. Jakicic discloses receiving personal fees from Wondr Health, WW International (formerly Weight Watchers), and Educational Initiatives and grants from Epitomee Medical.
A version of this article appeared on Medscape.com.
FROM JAMA
EU agency issues positive opinion on ritlecitinib
, paving the way for possible marketing authorization of the drug in the European Union for individuals 12 years of age and older. A final decision is expected in the coming months.
The development, which was announced by the manufacturer, Pfizer, on July 21, 2023, follows approval of ritlecitinib (Litfulo) for the treatment of severe alopecia areata in adults and adolescents 12 years and older by the Food and Drug Administration and the Japanese Ministry of Health, Labour, and Welfare in June 2023. According to a press release from Pfizer, submissions to other regulatory agencies for the use of ritlecitinib in alopecia areata are ongoing.
The Marketing Authorization Application for ritlecitinib was based on results from a randomized, placebo-controlled, double-blind ALLEGRO Phase 2b/3 study.
What makes teens choose to use sunscreen?
a cornerstone of skin cancer prevention, according to results from a systematic review.
“We know that skin cancer is one of the most common malignancies in the world, and sun protection methods such as sunscreen make it highly preventable,” first author Carly R. Stevens, a student at Tulane University, New Orleans, said in an interview. “This study demonstrates the adolescent populations that are most vulnerable to sun damage and how we can help mitigate their risk of developing skin cancer through education methods, such as Sun Protection Outreach Teaching by Students.”

Ms. Stevens and coauthors presented the findings during a poster session at the annual meeting of the Society for Pediatric Dermatology.
To investigate predictors of sunscreen use among high school students, they searched PubMed, Embase, and Web of Science using the terms (“sunscreen” or “SPF” or “sun protection”) and (“high school” or “teen” or “teenager” or “adolescent”) and limited the analysis to English studies reporting data on sunscreen use in U.S. high school students up to November 2021.
A total of 20 studies were included in the final review. The study populations ranged in number from 208 to 24,645. Of 11 studies that examined gender, all showed increased sunscreen use in females compared with males. Of five studies that examined age, all showed increased sunscreen use in younger adolescents, compared with their older counterparts.
Of four studies that examined the role of ethnicity on sunscreen use, White students were more likely to use sunscreen, compared with their peers of other ethnicities. “This may be due to perceived sun sensitivity, as [these four studies] also showed increased sunscreen use in populations that believed were more susceptible to sun damage,” the researchers wrote in their abstract.
In other findings, two studies that examined perceived self-efficacy concluded that higher levels of sunscreen use correlated with higher self-efficacy, while four studies concluded that high school students were more likely to use sunscreen if their parents encouraged them the wear it or if the parent used it themselves.
“With 40%-50% of ultraviolet damage being done before the age of 20, it’s crucial that we find ways to educate adolescents on the importance of sunscreen use and target those populations who were found to rarely use sunscreen in our study,” Ms. Stevens said.
In one outreach program, Sun Protection Outreach Teaching by Students (SPOTS), medical students visit middle and high schools to educate them about the importance of practicing sun protection. The program began as a collaboration between Saint Louis University and Washington University in St. Louis, but has expanded nationwide. Ms. Stevens described SPOTS as “a great way for medical students to present the information to middle and high school students in a way that is engaging and interactive.”
The researchers reported having no disclosures.
a cornerstone of skin cancer prevention, according to results from a systematic review.
“We know that skin cancer is one of the most common malignancies in the world, and sun protection methods such as sunscreen make it highly preventable,” first author Carly R. Stevens, a student at Tulane University, New Orleans, said in an interview. “This study demonstrates the adolescent populations that are most vulnerable to sun damage and how we can help mitigate their risk of developing skin cancer through education methods, such as Sun Protection Outreach Teaching by Students.”
Ms. Stevens and coauthors presented the findings during a poster session at the annual meeting of the Society for Pediatric Dermatology.
To investigate predictors of sunscreen use among high school students, they searched PubMed, Embase, and Web of Science using the terms (“sunscreen” or “SPF” or “sun protection”) and (“high school” or “teen” or “teenager” or “adolescent”) and limited the analysis to English studies reporting data on sunscreen use in U.S. high school students up to November 2021.
A total of 20 studies were included in the final review. The study populations ranged in number from 208 to 24,645. Of 11 studies that examined gender, all showed increased sunscreen use in females compared with males. Of five studies that examined age, all showed increased sunscreen use in younger adolescents, compared with their older counterparts.
Of four studies that examined the role of ethnicity on sunscreen use, White students were more likely to use sunscreen, compared with their peers of other ethnicities. “This may be due to perceived sun sensitivity, as [these four studies] also showed increased sunscreen use in populations that believed were more susceptible to sun damage,” the researchers wrote in their abstract.
In other findings, two studies that examined perceived self-efficacy concluded that higher levels of sunscreen use correlated with higher self-efficacy, while four studies concluded that high school students were more likely to use sunscreen if their parents encouraged them the wear it or if the parent used it themselves.
“With 40%-50% of ultraviolet damage being done before the age of 20, it’s crucial that we find ways to educate adolescents on the importance of sunscreen use and target those populations who were found to rarely use sunscreen in our study,” Ms. Stevens said.
In one outreach program, Sun Protection Outreach Teaching by Students (SPOTS), medical students visit middle and high schools to educate them about the importance of practicing sun protection. The program began as a collaboration between Saint Louis University and Washington University in St. Louis, but has expanded nationwide. Ms. Stevens described SPOTS as “a great way for medical students to present the information to middle and high school students in a way that is engaging and interactive.”
The researchers reported having no disclosures.
FROM SPD 2023
When treating AD in children, experts consider adherence, other aspects of treatment
ASHEVILLE, N.C. – according to a three-member expert panel mulling over strategies at the annual meeting of the Society for Pediatric Dermatology.
In introductory remarks, the three panelists briefly addressed different aspects for controlling AD, including drugs in the pipeline, the potential value of alternative therapies, and whom to blame when compliance is poor.

But panel discussion following these presentations provided an opportunity for audience engagement on practical strategies for improving AD control.
In her formal remarks prior to the panel discussion, Amy S. Paller, MD, professor of dermatology and pediatrics and chair of dermatology, Northwestern University, Chicago, and a pediatric dermatologist at the Lurie Children’s Hospital of Chicago, described emerging AD treatments. This included an update on the status of the interleukin-13 (IL-13) inhibitors tralokinumab (Adbry), which was approved by the FDA for treating AD in adults in December 2021, and lebrikizumab, which is thought likely to be soon approved in the United States on the basis of two recently published phase 3 trials.
Along with dupilumab (Dupixent) for moderate-to-severe AD in children who do not respond to optimized use of topical therapies, these new biologics appear likely to further expand choices for AD control for adults (and for kids with AD too, if eventually licensed in children), according to the data from the phase 3 studies.
During a panel discussion that followed, Stephen Gellis, MD, pediatric dermatologist and former chief of pediatric dermatology at Boston Children’s Hospital and Harvard Medical School, raised the point of optimizing tried and true topical therapies before using systemic agents. He noted that parents sometimes pressure clinicians to use a biologic – and that moving too quickly to the latest and most expensive drugs may not be necessary.
Dr. Paller acknowledged that she, like many pediatric dermatologists, employed immunosuppressants as her drugs of choice for many years – commonly starting with a few months of cyclosporine before transitioning to methotrexate, which has a delayed onset of action. In fact, she still uses this regimen in some children.
However, she now prefers dupilumab, which is the first biologic available for children in the United States with an AD indication in children as young as 6 months. She said dupilumab has fewer potential risks than cyclosporine, and it offers clinically meaningful improvement in most children. She noted that current guidelines discourage the use of systemic corticosteroids for AD in children, given their potential toxicity.
She strongly agreed with Dr. Gellis that clinicians should resist pressure to use any systemic agent if children are responding well to topical medications. In her own practice, Dr. Paller moves to systemic medications only after ensuring that there has been adherence to appropriate therapy and that there is not another diagnosis that might explain the recalcitrance to topical agents.
When a systemic medication is considered the next step, Dr. Paller reminded the audience of the importance of presenting the benefits and risks of all the options for AD control, which could include dupilumab and immunosuppressants as initial systemic therapy.
“Many parents choose biologic treatment first, given its lack of requirement for blood monitoring and faster action than methotrexate,” Dr. Paller noted.
Nevertheless, “biologics are much more costly than immunosuppressants, require an injection – which is stressful for the child and the parents – and may not be accessible for our patients,” Dr. Paller said. Cyclosporine and methotrexate are effective and are often the best options for moderate to severe disease in areas of the world where dupilumab is not available, but Dr. Paller most commonly uses these therapies only when reimbursement for dupilumab cannot be secured, injection is not an option, or when dupilumab is not sufficiently effective and tolerated.
Providing different perspectives, the two other panelists discussing the treatment of pediatric AD also saw a role for ensuring that topical agents are not offering adequate AD control before turning to the latest and most sophisticated therapies for AD.
For meeting parent expectations when children are improving slowly on topical therapies, Peter A. Lio, MD, director of the Chicago Integrative Eczema Center and clinical assistant professor of dermatology and pediatrics at Northwestern University, suggested that integrative medicine might be helpful.
For parents not fully comfortable with standard pharmacologic agents, Dr. Lio said there is evidence to support some of the complementary approaches, and these can be reassuring to parents with an interest in alternative medicines.
In Western medicine, it is common to hear terms like “attack,” “kill,” and “suppress,” disease, but alternative therapies are generally coupled with terms like “restore,” “strengthen,” and “tonify,” he said. “Who doesn’t want to be tonified?” he asked, noting that there are many sources of data suggesting that the number of patients seeking alternative medicine is “huge.” The alternative medicines are not generally taught in medical school and remain widely ignored in typical practice, but “our patients are interested even if we are not.”
Yet, there are data to support benefit from some of these alternative therapies, providing a win-win situation for patients who derive satisfaction from nontraditional therapies alone or combined with established pharmaceutical treatments.
Of these, Dr. Lio said there is support for the use of hempseed oil as a moisturizing agent and a strategy for improving barrier function in the skin of patients with AD. In a controlled crossover study, 2 teaspoons per day of dietary hempseed oil, a product that can be purchased in some grocery stores, was associated with significant reductions in skin dryness, itchiness, and use of topical medications relative to the same amount of olive oil, he noted.
Other examples include a compress made with black tea that was associated with an anti-inflammatory effect when followed by a moisturizer, a published study asserts. Although this was a trial in adults with facial dermatitis, Dr. Lio suggested that the same anti-inflammatory effect would be anticipated for other skin conditions, including AD in children.
As a third example, Dr. Lio said topical indigo, a traditional Chinese medicine used for a variety of dermatologic conditions, including psoriasis, has also demonstrated efficacy in a randomized trial, compared with vehicle for mild to severe AD.
Complementary medicines are not for everyone, but they may have a role when managing the expectations of parents who are not fully satisfied or express concern about regimens limited to mainstream therapies alone, according to Dr. Lio. In diseases that are not curable, such as AD, he thinks this is a strategy with potential for benefit and is reassuring to patients.
Another way to avoid moving to riskier or more expensive drugs quickly is to assure patients use the drugs that were prescribed first, according to Steven R. Feldman, MD, PhD, professor of dermatology, Wake Forest University, Winston-Salem, N.C.

Dr. Feldman believes that failure to adhere to therapy is basically the fault of the medical care system, not the patient. He made an analogy to a successful piano teacher, who provides a child with sheet music and then sees the child once a week to track progress. He juxtaposed this piano teacher to one who gives the child sheet music and tells the child to come back in 10 weeks for the recital. It is not hard to guess which approach would be more effective.
“Typically, doctors are worse than that second teacher,” he said. “Doctors are like a piano teacher that does not give you the sheet music but says, ‘Here is a prescription for some sheet music. Take this prescription to the sheet music store. I have no idea how much it will cost or whether your insurance will pay for it. But once you fill this prescription for sheet music, I want you to practice this every day,’ ” he said, adding, “Practicing this sheet music may cause rashes, diarrhea, or serious infection. When the patient next comes in 10-12 weeks later and is not better, the doctor says, ‘I will give you a harder piece of sheet music and maybe two or three other instruments to practice at the same time,’ ” said Dr. Feldman, expressing why the way clinicians practice might explain much of the poor adherence problem.
This largely explains why patients with AD do not immediately respond to the therapies doctors prescribe, Dr. Feldman implied, reiterating the theme that emerged from the AD panel: Better and more options are needed for AD of the most severe types, but better management, not better drugs, is typically what is needed for most patients.
Dr. Feldman, Dr. Lio, and Dr. Paller have financial relationships with more than 30 pharmaceutical and cosmetic companies, some of which manufacture therapies for atopic dermatitis.
This article was updated July 28, 2023, to clarify the comments and viewpoints of Dr. Amy Paller.
A version of this article first appeared on Medscape.com.
ASHEVILLE, N.C. – according to a three-member expert panel mulling over strategies at the annual meeting of the Society for Pediatric Dermatology.
In introductory remarks, the three panelists briefly addressed different aspects for controlling AD, including drugs in the pipeline, the potential value of alternative therapies, and whom to blame when compliance is poor.
But panel discussion following these presentations provided an opportunity for audience engagement on practical strategies for improving AD control.
In her formal remarks prior to the panel discussion, Amy S. Paller, MD, professor of dermatology and pediatrics and chair of dermatology, Northwestern University, Chicago, and a pediatric dermatologist at the Lurie Children’s Hospital of Chicago, described emerging AD treatments. This included an update on the status of the interleukin-13 (IL-13) inhibitors tralokinumab (Adbry), which was approved by the FDA for treating AD in adults in December 2021, and lebrikizumab, which is thought likely to be soon approved in the United States on the basis of two recently published phase 3 trials.
Along with dupilumab (Dupixent) for moderate-to-severe AD in children who do not respond to optimized use of topical therapies, these new biologics appear likely to further expand choices for AD control for adults (and for kids with AD too, if eventually licensed in children), according to the data from the phase 3 studies.
During a panel discussion that followed, Stephen Gellis, MD, pediatric dermatologist and former chief of pediatric dermatology at Boston Children’s Hospital and Harvard Medical School, raised the point of optimizing tried and true topical therapies before using systemic agents. He noted that parents sometimes pressure clinicians to use a biologic – and that moving too quickly to the latest and most expensive drugs may not be necessary.
Dr. Paller acknowledged that she, like many pediatric dermatologists, employed immunosuppressants as her drugs of choice for many years – commonly starting with a few months of cyclosporine before transitioning to methotrexate, which has a delayed onset of action. In fact, she still uses this regimen in some children.
However, she now prefers dupilumab, which is the first biologic available for children in the United States with an AD indication in children as young as 6 months. She said dupilumab has fewer potential risks than cyclosporine, and it offers clinically meaningful improvement in most children. She noted that current guidelines discourage the use of systemic corticosteroids for AD in children, given their potential toxicity.
She strongly agreed with Dr. Gellis that clinicians should resist pressure to use any systemic agent if children are responding well to topical medications. In her own practice, Dr. Paller moves to systemic medications only after ensuring that there has been adherence to appropriate therapy and that there is not another diagnosis that might explain the recalcitrance to topical agents.
When a systemic medication is considered the next step, Dr. Paller reminded the audience of the importance of presenting the benefits and risks of all the options for AD control, which could include dupilumab and immunosuppressants as initial systemic therapy.
“Many parents choose biologic treatment first, given its lack of requirement for blood monitoring and faster action than methotrexate,” Dr. Paller noted.
Nevertheless, “biologics are much more costly than immunosuppressants, require an injection – which is stressful for the child and the parents – and may not be accessible for our patients,” Dr. Paller said. Cyclosporine and methotrexate are effective and are often the best options for moderate to severe disease in areas of the world where dupilumab is not available, but Dr. Paller most commonly uses these therapies only when reimbursement for dupilumab cannot be secured, injection is not an option, or when dupilumab is not sufficiently effective and tolerated.
Providing different perspectives, the two other panelists discussing the treatment of pediatric AD also saw a role for ensuring that topical agents are not offering adequate AD control before turning to the latest and most sophisticated therapies for AD.
For meeting parent expectations when children are improving slowly on topical therapies, Peter A. Lio, MD, director of the Chicago Integrative Eczema Center and clinical assistant professor of dermatology and pediatrics at Northwestern University, suggested that integrative medicine might be helpful.
For parents not fully comfortable with standard pharmacologic agents, Dr. Lio said there is evidence to support some of the complementary approaches, and these can be reassuring to parents with an interest in alternative medicines.
In Western medicine, it is common to hear terms like “attack,” “kill,” and “suppress,” disease, but alternative therapies are generally coupled with terms like “restore,” “strengthen,” and “tonify,” he said. “Who doesn’t want to be tonified?” he asked, noting that there are many sources of data suggesting that the number of patients seeking alternative medicine is “huge.” The alternative medicines are not generally taught in medical school and remain widely ignored in typical practice, but “our patients are interested even if we are not.”
Yet, there are data to support benefit from some of these alternative therapies, providing a win-win situation for patients who derive satisfaction from nontraditional therapies alone or combined with established pharmaceutical treatments.
Of these, Dr. Lio said there is support for the use of hempseed oil as a moisturizing agent and a strategy for improving barrier function in the skin of patients with AD. In a controlled crossover study, 2 teaspoons per day of dietary hempseed oil, a product that can be purchased in some grocery stores, was associated with significant reductions in skin dryness, itchiness, and use of topical medications relative to the same amount of olive oil, he noted.
Other examples include a compress made with black tea that was associated with an anti-inflammatory effect when followed by a moisturizer, a published study asserts. Although this was a trial in adults with facial dermatitis, Dr. Lio suggested that the same anti-inflammatory effect would be anticipated for other skin conditions, including AD in children.
As a third example, Dr. Lio said topical indigo, a traditional Chinese medicine used for a variety of dermatologic conditions, including psoriasis, has also demonstrated efficacy in a randomized trial, compared with vehicle for mild to severe AD.
Complementary medicines are not for everyone, but they may have a role when managing the expectations of parents who are not fully satisfied or express concern about regimens limited to mainstream therapies alone, according to Dr. Lio. In diseases that are not curable, such as AD, he thinks this is a strategy with potential for benefit and is reassuring to patients.
Another way to avoid moving to riskier or more expensive drugs quickly is to assure patients use the drugs that were prescribed first, according to Steven R. Feldman, MD, PhD, professor of dermatology, Wake Forest University, Winston-Salem, N.C.
Dr. Feldman believes that failure to adhere to therapy is basically the fault of the medical care system, not the patient. He made an analogy to a successful piano teacher, who provides a child with sheet music and then sees the child once a week to track progress. He juxtaposed this piano teacher to one who gives the child sheet music and tells the child to come back in 10 weeks for the recital. It is not hard to guess which approach would be more effective.
“Typically, doctors are worse than that second teacher,” he said. “Doctors are like a piano teacher that does not give you the sheet music but says, ‘Here is a prescription for some sheet music. Take this prescription to the sheet music store. I have no idea how much it will cost or whether your insurance will pay for it. But once you fill this prescription for sheet music, I want you to practice this every day,’ ” he said, adding, “Practicing this sheet music may cause rashes, diarrhea, or serious infection. When the patient next comes in 10-12 weeks later and is not better, the doctor says, ‘I will give you a harder piece of sheet music and maybe two or three other instruments to practice at the same time,’ ” said Dr. Feldman, expressing why the way clinicians practice might explain much of the poor adherence problem.
This largely explains why patients with AD do not immediately respond to the therapies doctors prescribe, Dr. Feldman implied, reiterating the theme that emerged from the AD panel: Better and more options are needed for AD of the most severe types, but better management, not better drugs, is typically what is needed for most patients.
Dr. Feldman, Dr. Lio, and Dr. Paller have financial relationships with more than 30 pharmaceutical and cosmetic companies, some of which manufacture therapies for atopic dermatitis.
This article was updated July 28, 2023, to clarify the comments and viewpoints of Dr. Amy Paller.
A version of this article first appeared on Medscape.com.
AT SPD 2023
Affording the cost of new obesity drugs? We can’t afford not to
SAN DIEGO – Although the glucagonlike peptide–1 (GLP-1) receptor agonists, such as liraglutide and semaglutide, have been revolutionary advances for the treatment of obesity, the cost-effectiveness of these agents for treating both obesity and type 2 diabetes remains uncertain based on published analyses.
But potential future changes in the cost-effectiveness dynamics of GLP-1 agonists could tip the balance in their favor. These include
Costs to people with obesity that are generally not part of cost-effectiveness calculations include pain, disability, depression, and bias that affect employment, Carol H. Wysham, MD, said at the recent scientific sessions of the American Diabetes Association.
Other costs to society left out of conventional calculations are items such as the incremental cost for fuel to transport a heavier population and the carbon-footprint costs for the production and transportation of the excess food produced to feed an over-fed population, added Dr. Wysham, an endocrinologist with MultiCare and the Rockwood Clinic in Spokane, Wash.
Analyses should include ‘things we don’t often think about’
“The impact of living with obesity is much greater than what we traditionally calculate in health economics,” commented Naveed Sattar, PhD, speaking from the floor during the session.
“Patient happiness and self-esteem are hard to measure and capture as cost impacts. We need to also add carbon dioxide effects and transportation costs, and governments are starting to get wise to this. How to run proper health economics analyses is the key question; we need to do better than what we currently do,” said Dr. Sattar, a professor of metabolic medicine at the University of Glasgow.
Dr. Sattar is lead author of a recent analysis that highlights the overwhelming importance of improved weight management in adults as they age to reduce their risk of developing a broad range of chronic disorders.
“Most chronic conditions are, to differing extents, caused or exacerbated by excess adiposity,” was a conclusion of his report.
“It’s important to include the costs to society, including things we don’t often think about. No one has ever done a cost analysis that includes all the factors” cited by Dr. Wysham, said Irl B. Hirsch, MD, another speaker at the session. “No one includes obstructive sleep apnea, degenerative arthritis, and the downstream effects of a high body mass index.”
The GLP-1 agonists “are great” for both weight loss and glycemic control, said Dr. Hirsch, an endocrinologist and professor at the University of Washington, Seattle. “We can’t afford not to use them. These agents have been transformational.”
U.S. has the highest drug costs
Another key factor driving cost-effectiveness is, of course, the relatively high cost of the agents in the class, especially in the United States. Dr. Hirsch cited a recently published report in Obesity that quoted monthly U.S. costs of $804 for weekly 2.4-mg injections of semaglutide (Wegovy) and $1418 for daily 3.0-mg injections of liraglutide (Saxenda). Highlighting the relatively high cost of medications in the United States, the report cited a monthly price tag of $95 for the same semaglutide regimen in Turkey and a monthly cost of $252 for the same liraglutide regimen in Norway.
U.S. prices for agents in this class may start to deflate as soon as 2024, when one or more generic versions of liraglutide are expected, following expiration of the U.S. patent later in 2023, Dr. Wysham said.
Another pending trigger for lower costs may be the possible decision by the World Health Organization to designate liraglutide an “essential medicine” later in 2023, she noted. The WHO received an application for this designation from four U.S. clinicians and is considering it as part of its planned 2023 update to the WHO’s Essential Medicines List. Dr. Wysham predicted this designation would “press international pharmaceutical companies to produce [liraglutide] at a much lower cost.”
“I’m not saying that drug companies should not profit, but they should not do it on the backs of patients,” Dr. Wysham declared. “What do we measure by ‘cost-effectiveness?’ There are so many complications of obesity. For patients with diabetes and obesity we need to look for a little different economic policy.”
Dr. Wysham has reported being an adviser to Abbott and CeQur and receiving research funding from Eli Lilly and Novo Nordisk. Dr. Hirsch has reported being a consultant for Abbott, Embecta, and Hagar, and receiving research funding from Dexcom and Insulet. Dr. Sattar has reported receiving consulting fees or speaker honoraria from Abbott Laboratories, Afimmune, Amgen, AstraZeneca, Boehringer Ingelheim, Eli Lilly, Hanmi Pharmaceuticals, Janssen, MSD, Novartis, Novo Nordisk, Pfizer, Roche Diagnostics, and Sanofi.
A version of this article appeared on Medscape.com.
AT ADA 2023
Fungal cultures in bronchiectasis don’t predict outcomes
The presence of a positive fungal culture in patients with bronchiectasis does not appear to correlate with disease severity or any increased risk of an adverse outcome, according to data pulled from the Bronchiectasis and NTM Registry and presented at the 6th World Bronchiectasis & NTM Conference.
“The question we were asking is whether there is some signal that suggests we need to take care of these patients differently, and the answer is no,” reported Pamela J. McShane, MD, a pulmonologist on the faculty at the University of Texas Health Science Center at Tyler.
or more complex course than did those without a positive fungal culture.
When fungal infections are detected in an initial microbiologic evaluation of patients with bronchiectasis or other lung diseases, first-line clinicians generally assume that coverage is needed. Dr. McShane noted that many of the patients referred to her with bronchiectasis and a positive fungal culture were already on an antifungal.
These data are not supportive of treatment in the absence of fungal-related complications. Dr. McShane suggested they even raise questions about the value of culturing beyond bacterial pathogens in the absence of suspicion that fungal organisms are playing a role in symptoms. She cautioned, however, that more studies specifically studying this possibility are needed.
Study details
The data were drawn in December 2022 from the U.S.-based Bronchiectasis and NTM Registry, which at that time had 22 participating sites. Of the more than 5,000 patients enrolled, the study looked at 2,230 after several exclusions, such as a diagnosis of allergic bronchopulmonary aspergillosis (ABPA).
Of these 2,230 patients, 949 had a fungal infection at the time of diagnosis and 1,281 did not. Those with a fungal infection were further subdivided into those with an aspergillosis (331 patients) and those with a nonaspergillosis fungal infection (751 patients). The total of these two numbers is greater than the total number of fungal infections because these were not mutually exclusive.
At enrollment into the registry, there were no statistical differences between groups for age. Some statistical differences were observed among groups stratified by race, but Dr. McShane doubted that these were clinically significant with the exception of a potential disparity among Asians that might deserve further analysis.
Infection results
Of clinical features evaluated for their association with fungal infection, there was no correlation with either body mass index or history of asthma. Eosinophilia was associated significantly with positive fungal cultures.
Baseline FEV1 was slightly lower among those with a positive fungal culture even if the difference was highly significant (P = .0006). Again, Dr. McShane questioned the clinical significance of values that varied by only a few percentage points, even though she was willing to acknowledge that higher is always preferable to a lower FEV1.
In the context of other pathogens, “generally speaking, those with a positive bacterial culture were more likely to have a fungal infection,” Dr. McShane reported, although there was some variation when looking at pathogenicity of the bacteria and other variables.
“Whether this [higher rate of fungal infection] just involves the environment or our antibiotics are driving the opportunity to permit the fungi to exist, we do not have the answer,” she added.
Nontuberculosis mycobacteria (NTM) infection was similarly represented in those with or without a fungal infection, according to Dr. McShane. Noting the high use of antibiotics in an NTM population, Dr. McShane conceded that this challenges the theory that antibiotic use is driving the risk of fungal infection, but these are what the data say.
Steroid use was associated with a statistically significant risk of fungal infection, but Dr. McShane said it is unclear whether steroid use drives the risk or is an epiphenomenon.
“We looked at this a lot of different ways: oral vs. inhaled and oral vs. inhaled and oral, and it did not make much difference. Generally speaking, the fungal cultures were more likely to be positive in patients on any kind of steroid,” she said.
Finally, with the exception of the slightly lower FEV1 in patients with fungal infections, Dr. McShane said that there was no discernible relationship between the presence of a fungal infection and severity of bronchiectasis.
Because of this evidence, Dr. McShane concluded that the presence of fungus in the culture of patients with bronchiectasis does not appear to correlate with outcome or severity. Since completing the study, she said she is now using these data to reassure patients who have a positive fungal culture.
While these data do not affect the need to diagnosis fungal infections in patients who are not responding typically to therapy or otherwise have an abnormal course of bronchiectasis, raising suspicion that fungal infection is participating in the disease course, the data provide a basis for questioning whether routine cultures are needed, according to the discussion that followed Dr. McShane’s presentation.
Expert opinion
Several of the experts at the presentation provided an opinion. Some reported that they would continue to order fungal cultures on a routine basis, while others said that they now, on the basis of these data, plan to order cultures only at the first visit or when fungal infection is suspected of exacerbating the disease.
Of this latter group, which seemed to be dominant, Juzar Ali, MD, professor of medicine, Louisiana State University, New Orleans, said that he has not been ordering fungal cultures on every visit. Rather, he has been doing so selectively. Examples include those who are on steroids or those with an unusual pattern of exacerbations.
“The value of these data is that they have now provided some data to support this approach,” Dr. Ali said in an interview. Noting that this is the first large study to address this question in a systematic way, he considers this to be a valuable contribution for approaching a common clinical issue.
Dr. McShane reports no relevant financial relationships. Dr. Ali reports a financial relationship with Insmed.
A version of this article first appeared on Medscape.com.