User login
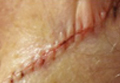
Absorbable Poliglecaprone 25 Sutures for Both Subcataneous and Transepidermal Closure: A Cosmetically and Economically Appealing Option
Botulinum Toxin Type A Reconstituted in Lidocaine With Epinephrine for Facial Rejuvenation: Results of a Participant Satisfaction Survey
Cosmeceuticals for Men

Who Is the Aesthetic Consumer?
A Brief Primer on Acne Therapy for Adolescents With Skin of Color
Test your knowledge on acne therapy with MD-IQ: the medical intelligence quiz. Click here to answer 5 questions.
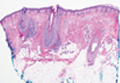
Lichen Planopilaris
Primary care-centric ACOs are working
Guess what? Physician-driven accountable care organizations with a strong primary care core are working – and, in a historic change, primary care physicians are the most highly compensated group.
The even better news? This trend is predictable and inevitable.
ACOs are working
As earlier posts to this column show, there are eight fairly straightforward elements required to create a successful and sustainable ACO:
• A change in financial incentives from those that reward volume, such as fee-for-service, to those that reward value, such as shared savings, if quality benchmarks are met.
• A primary care core.
• Physician cultural change.
• Patient engagement.
• Robust data collection.
• Clinical best practices.
• Administrative infrastructure.
• Enough scale.
A number of ACOs that do not have these elements will fail; but fortunately, more and more are being set up properly.
Recently, the Boston Consulting Group reported that ACO-like Medicare Advantage plans are reporting positive results. They are all distinguished by having "a selective network of providers, financial incentives that are aligned with clinical best practices, and active care management that emphasizes prevention in an effort to minimize expensive acute care."
Not only are emergency department and ambulatory surgery procedures down 20%-30% at these plans, but analysis of their data on 3 million Medicare patients showed that quality went up. These patients had lower single-year mortality rates, shorter average hospital stays, fewer readmissions, and better sustainability of health over time.1
Physician-led ACOs are better
If ACOs are good, physician-sponsored ones are better.
At a recent national meeting of health insurance companies, Paul Ginsburg, Ph.D., president of the Center for Studying Health System Change, told the insurers, "I think physician-led ACOs inherently make markets more competitive, because they have an opportunity to shift patients toward high-value hospitals."
Similarly, Charlie Baker, former secretary of health and human services for Massachusetts, told the group that nearly all of the Medicare Advantage risk contracts are with physician groups and not hospitals. Medicare Advantage participants are chosen by insurers, and he indicated that they know that contracting with physician ACOs is the best way to save money.2
As reported in an earlier column, this truth is becoming more evident, and there are now more physician-led ACOs than any other.
Primary care reaping rewards
Primary care is the only discipline mandated to be in ACOs participating in the Medicare Shared Savings Program. This is because ACO success stems from keeping people out of the hospital, avoiding expensive procedures, and reducing unnecessary tests and imaging. The "target-rich fields" for ACOs to accomplish this are primarily prevention and wellness, coordination of high-cost complex patients, reduced hospitalizations, and transition management across our fragmented system. These are all in primary care’s wheelhouse. It is no wonder that you are the darlings of the accountable care movement.
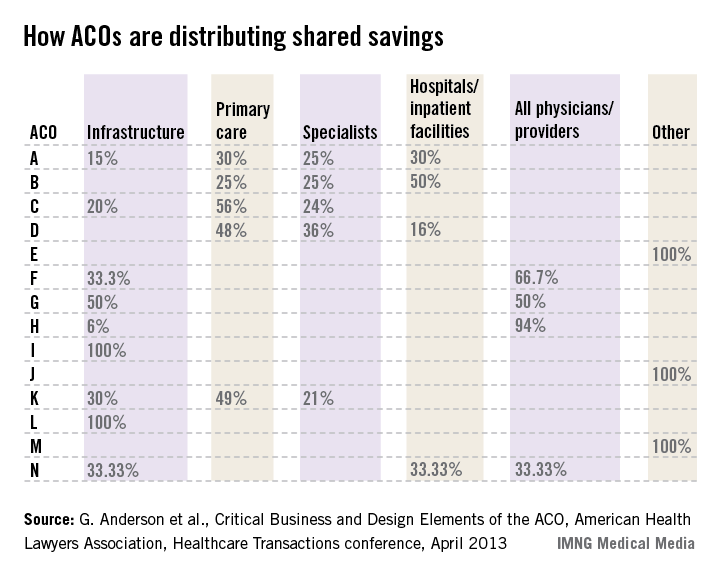
Successful and sustainable ACOs will tie shared savings distributions to relative contribution. A merit system thus likely will be primary care weighted.
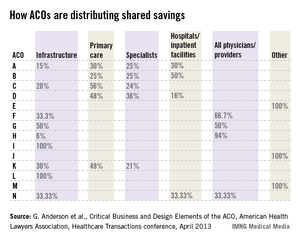
For example, one ACO posted this planned distribution of shared savings: 12% to infrastructure; of the remainder, 60% to primary care, 40% to specialists, and 0% to hospitals.
The following small sample survey shows widely varying models; but in all cases where distribution is broken out, primary care receives as much or more than specialists and, with one exception, hospitals.
There are some primary-care-only ACOs that are distributing 100% of savings to their primary care physicians under Medicare Advantage risk or Medicare Shared Savings Program contracts. One interviewed primary care physician ACO member stated that for his full-risk Medicare Advantage patient population, he was seeing half as many patients and making three times the income.
While income recognition for what you do is way overdue, keeping all the savings might be going too far. A fully evolved ACO should incentivize all providers and facilities along the entire continuum of care, but always in proportion to their value-adding contribution.
Primary care physicians tell me that while this economic reward is gratifying and validating, their surprise biggest reward has been empowerment to do health care right and regain control of the physician/patient relationship. They say that seeing happier, healthier patients, and being able to spend more time with them, has returned the fun to the practice of medicine.
References
1. Kaplan, J., et al., Alternative Payer Models Show Improved Health-Care Value, BCG Perspective, May 14, 2013.
2. Pittman, D., Doc-Led ACOs Better Model for Saving $$$, MedPage Today, May 15, 2013.
3. Anderson, G., et al., Critical Business and Design Elements of the ACO, American Health Lawyers Association, Healthcare Transactions conference (April 2013).
Mr. Bobbitt is a senior partner and head of the Health Law Group at the Smith Anderson law firm in Raleigh, North Carolina. He has many years’ experience assisting physicians form integrated delivery systems. He has spoken and written nationally to primary care physicians on the strategies and practicalities of forming or joining ACOs. This article is meant to be educational and does not constitute legal advice. For additional information, readers may contact the author at [email protected] or 919-821-6612.
Guess what? Physician-driven accountable care organizations with a strong primary care core are working – and, in a historic change, primary care physicians are the most highly compensated group.
The even better news? This trend is predictable and inevitable.
ACOs are working
As earlier posts to this column show, there are eight fairly straightforward elements required to create a successful and sustainable ACO:
• A change in financial incentives from those that reward volume, such as fee-for-service, to those that reward value, such as shared savings, if quality benchmarks are met.
• A primary care core.
• Physician cultural change.
• Patient engagement.
• Robust data collection.
• Clinical best practices.
• Administrative infrastructure.
• Enough scale.
A number of ACOs that do not have these elements will fail; but fortunately, more and more are being set up properly.
Recently, the Boston Consulting Group reported that ACO-like Medicare Advantage plans are reporting positive results. They are all distinguished by having "a selective network of providers, financial incentives that are aligned with clinical best practices, and active care management that emphasizes prevention in an effort to minimize expensive acute care."
Not only are emergency department and ambulatory surgery procedures down 20%-30% at these plans, but analysis of their data on 3 million Medicare patients showed that quality went up. These patients had lower single-year mortality rates, shorter average hospital stays, fewer readmissions, and better sustainability of health over time.1
Physician-led ACOs are better
If ACOs are good, physician-sponsored ones are better.
At a recent national meeting of health insurance companies, Paul Ginsburg, Ph.D., president of the Center for Studying Health System Change, told the insurers, "I think physician-led ACOs inherently make markets more competitive, because they have an opportunity to shift patients toward high-value hospitals."
Similarly, Charlie Baker, former secretary of health and human services for Massachusetts, told the group that nearly all of the Medicare Advantage risk contracts are with physician groups and not hospitals. Medicare Advantage participants are chosen by insurers, and he indicated that they know that contracting with physician ACOs is the best way to save money.2
As reported in an earlier column, this truth is becoming more evident, and there are now more physician-led ACOs than any other.
Primary care reaping rewards
Primary care is the only discipline mandated to be in ACOs participating in the Medicare Shared Savings Program. This is because ACO success stems from keeping people out of the hospital, avoiding expensive procedures, and reducing unnecessary tests and imaging. The "target-rich fields" for ACOs to accomplish this are primarily prevention and wellness, coordination of high-cost complex patients, reduced hospitalizations, and transition management across our fragmented system. These are all in primary care’s wheelhouse. It is no wonder that you are the darlings of the accountable care movement.
Successful and sustainable ACOs will tie shared savings distributions to relative contribution. A merit system thus likely will be primary care weighted.
For example, one ACO posted this planned distribution of shared savings: 12% to infrastructure; of the remainder, 60% to primary care, 40% to specialists, and 0% to hospitals.
The following small sample survey shows widely varying models; but in all cases where distribution is broken out, primary care receives as much or more than specialists and, with one exception, hospitals.
There are some primary-care-only ACOs that are distributing 100% of savings to their primary care physicians under Medicare Advantage risk or Medicare Shared Savings Program contracts. One interviewed primary care physician ACO member stated that for his full-risk Medicare Advantage patient population, he was seeing half as many patients and making three times the income.
While income recognition for what you do is way overdue, keeping all the savings might be going too far. A fully evolved ACO should incentivize all providers and facilities along the entire continuum of care, but always in proportion to their value-adding contribution.
Primary care physicians tell me that while this economic reward is gratifying and validating, their surprise biggest reward has been empowerment to do health care right and regain control of the physician/patient relationship. They say that seeing happier, healthier patients, and being able to spend more time with them, has returned the fun to the practice of medicine.
References
1. Kaplan, J., et al., Alternative Payer Models Show Improved Health-Care Value, BCG Perspective, May 14, 2013.
2. Pittman, D., Doc-Led ACOs Better Model for Saving $$$, MedPage Today, May 15, 2013.
3. Anderson, G., et al., Critical Business and Design Elements of the ACO, American Health Lawyers Association, Healthcare Transactions conference (April 2013).
Mr. Bobbitt is a senior partner and head of the Health Law Group at the Smith Anderson law firm in Raleigh, North Carolina. He has many years’ experience assisting physicians form integrated delivery systems. He has spoken and written nationally to primary care physicians on the strategies and practicalities of forming or joining ACOs. This article is meant to be educational and does not constitute legal advice. For additional information, readers may contact the author at [email protected] or 919-821-6612.
Does myo-inositol supplementation reduce the rate of gestational diabetes in pregnant women with a family history of type 2 diabetes?
Inositol has generated increasing attention as a treatment for conditions related to pregnancy, including polycystic ovary syndrome1 and neural tube defects.2,3 In this study, pregnant women with a family history of type 2 diabetes were randomly allocated to:
- folic acid alone (400 µg daily)—placebo group
- folic acid plus myo-inositol (400 µg and 4 g daily, respectively)—treatment group.
The goal was to determine whether the addition of myo-inositol could prevent GDM and macrosomia. Because the study was conducted in Italy, GDM was diagnosed using recommendations from the International Association of Diabetes and Pregnancy Study Groups (IADPSG).4
Of the 197 women who completed the study, those given myo-inositol had a lower incidence of GDM than those given placebo: 6 of 99 women in the treatment group developed GDM, compared with 15 of 98 in the placebo group (P = .04). None of the women in the treatment group gave birth to a macrosomic infant (>4,000 g), compared with seven women in the placebo group (P = .007). However, other adverse outcomes, such as cesarean delivery, gestational hypertension, shoulder dystocia, preterm delivery, and fetal respiratory distress syndrome occurred at similar frequencies in the two groups.
RELATED ARTICLE Weight changes between pregnancies tied to risk of gestational diabetes mellitus (Web NEWS, June 2011)
How to improve outcomes in gestational diabetes—for mother and baby
E. Albert Reece, MD, PhD, MBA (March 2011)
Strengths and limitations of the study
Investigators conducted a prospective, randomized, placebo-controlled trial, one of the first moderately sized trials to examine the therapeutic effects of myo-inositol in pregnant women who had a family history of type 2 diabetes (in one or both parents). This study builds upon a previous report from the same investigators of the positive effects of myo-inositol in reducing insulin resistance in a smaller group of women (n = 69) with GDM.5
Another strength is that the investigators focused on a compound, inositol, readily found in foods, which suggests that women could derive benefits from a diet fortified with this supplement.
However, there are several concerns, also touched upon in a previous commentary about this study,6 which include:
- Only white women were included in the study. (As an ethnic group, white women have a lower risk of GDM.)
- All of the women enrolled in this trial had a prepregnancy body mass index within the normal range. Women who have a family history of type 2 diabetes who are also obese are a significant population to study.
- More work is needed to understand the mechanism of action of myo-inositol to help determine the optimal concentration to administer and the route of administration (ie, in pill form or as part of a diet plan).
Another important point: Investigators used IADPSG criteria to diagnose GDM; these criteria tend to identify significantly more cases of diabetes than the Carpenter and Coustan criteria, which are currently used in the United States.7,8 Indeed, a National Institutes of Health expert panel recommended continuing use of the Carpenter and Coustan criteria to diagnose GDM in the United States until more data are collected to show correlation between changing the diagnostic threshold and improved fetal and maternal outcomes.9
WHAT THIS EVIDENCE MEANS FOR PRACTICE
Current standards for identifying GDM include appropriate screening. Methods for prevention of GDM including dietary counseling and advice on an exercise program to reduce fetal macrosomia, but no interventions, to date, have effectively controlled GDM.
The concept of using a dietary supplement to prevent GDM is intriguing, and the results of this trial, coupled with a second recent report on the beneficial effects of myo-inositol to prevent GDM,10 are promising. However, the many concerns raised here—especially the use of IADPSG criteria—make it difficult to apply these findings to traditional diagnostic criteria for US practitioners. Follow-up, large-scale trials are needed to determine how effective this supplement is in preventing GDM and whether its effects translate into benefits for women at increased risk of developing diabetes. The routine use of myo-inositol in patients with a family history of type 2 diabetes should await further studies, including the aforementioned trials.
E. Albert Reece, MD, PhD, MBA
- Morgante G, Orvieto R, Di Sabatino A, Musacchio MC, De Leo V. The role of inositol supplementation in patients with polycystic ovary syndrome, with insulin resistance, undergoing the low-dose gonadotropin ovulation induction regimen. Fertil Steril. 2011;95(8):2642–2644.
- Khandelwal M, Reece EA, Wu YK, Borenstein M. Dietary myo-inositol therapy in hyperglycemia-induced embryopathy. Teratology. 1998;57(2):79–84.
- Cavalli P, Tonni G, Grosso E, Poggiani C. Effects of inositol supplementation in a cohort of mothers at risk of producing an NTD pregnancy. Birth Defects Res A Clin Mol Teratol. 2011;91(11):962–965.
- International Association of Diabetes and Pregnancy Study Groups Consensus Panel. International Association of Diabetes and Pregnancy Study Groups recommendations on the diagnosis and classification of hyperglycemia in pregnancy. Diabetes Care. 2010;33(3):676–682.
- Corrado F, D’Anna R, Di Vieste G, et al. The effect of myoinositol supplementation on insulin resistance in patients with gestational diabetes. Diabet Med. 2011;28(8):972–975.
- Coustan DR. Can a dietary supplement prevent gestational diabetes mellitus? Diabetes Care. 2013;36(4):777–779.
- Reece EA, Moore T. The diagnostic criteria for gestational diabetes: To change or not to change? Am J Obstet Gynecol. 2013;208(4):255–259.
- Langer O, Umans JG, Miodovnik M. Perspectives on the proposed gestational diabetes mellitus diagnostic criteria. Obstet Gynecol. 2013;121(1):177–182.
- National Institutes of Health Draft Consensus Development Panel. Draft Statement: National Institutes of Health Consensus Development Conference Statement: Diagnosing Gestational Diabetes Mellius; March 4–6, 2013; Bethesda, Maryland. http://prevention.nih.gov/cdp/conferences/2013/gdm/files/DraftStatement.pdf. Published March 6, 2013. Accessed May 17, 2013.
- Matarrelli B, Vitacolonna E, D’Angelo M, et al. Effect of dietary myo-inositol supplementation in pregnancy on the incidence of maternal gestational diabetes mellitus and fetal outcomes: a randomized controlled trial [published online ahead of print March 1, 2013]. J Matern Fetal Neonatal Med. doi:10.3109/14767058.2013.766691.
Inositol has generated increasing attention as a treatment for conditions related to pregnancy, including polycystic ovary syndrome1 and neural tube defects.2,3 In this study, pregnant women with a family history of type 2 diabetes were randomly allocated to:
- folic acid alone (400 µg daily)—placebo group
- folic acid plus myo-inositol (400 µg and 4 g daily, respectively)—treatment group.
The goal was to determine whether the addition of myo-inositol could prevent GDM and macrosomia. Because the study was conducted in Italy, GDM was diagnosed using recommendations from the International Association of Diabetes and Pregnancy Study Groups (IADPSG).4
Of the 197 women who completed the study, those given myo-inositol had a lower incidence of GDM than those given placebo: 6 of 99 women in the treatment group developed GDM, compared with 15 of 98 in the placebo group (P = .04). None of the women in the treatment group gave birth to a macrosomic infant (>4,000 g), compared with seven women in the placebo group (P = .007). However, other adverse outcomes, such as cesarean delivery, gestational hypertension, shoulder dystocia, preterm delivery, and fetal respiratory distress syndrome occurred at similar frequencies in the two groups.
RELATED ARTICLE Weight changes between pregnancies tied to risk of gestational diabetes mellitus (Web NEWS, June 2011)
How to improve outcomes in gestational diabetes—for mother and baby
E. Albert Reece, MD, PhD, MBA (March 2011)
Strengths and limitations of the study
Investigators conducted a prospective, randomized, placebo-controlled trial, one of the first moderately sized trials to examine the therapeutic effects of myo-inositol in pregnant women who had a family history of type 2 diabetes (in one or both parents). This study builds upon a previous report from the same investigators of the positive effects of myo-inositol in reducing insulin resistance in a smaller group of women (n = 69) with GDM.5
Another strength is that the investigators focused on a compound, inositol, readily found in foods, which suggests that women could derive benefits from a diet fortified with this supplement.
However, there are several concerns, also touched upon in a previous commentary about this study,6 which include:
- Only white women were included in the study. (As an ethnic group, white women have a lower risk of GDM.)
- All of the women enrolled in this trial had a prepregnancy body mass index within the normal range. Women who have a family history of type 2 diabetes who are also obese are a significant population to study.
- More work is needed to understand the mechanism of action of myo-inositol to help determine the optimal concentration to administer and the route of administration (ie, in pill form or as part of a diet plan).
Another important point: Investigators used IADPSG criteria to diagnose GDM; these criteria tend to identify significantly more cases of diabetes than the Carpenter and Coustan criteria, which are currently used in the United States.7,8 Indeed, a National Institutes of Health expert panel recommended continuing use of the Carpenter and Coustan criteria to diagnose GDM in the United States until more data are collected to show correlation between changing the diagnostic threshold and improved fetal and maternal outcomes.9
WHAT THIS EVIDENCE MEANS FOR PRACTICE
Current standards for identifying GDM include appropriate screening. Methods for prevention of GDM including dietary counseling and advice on an exercise program to reduce fetal macrosomia, but no interventions, to date, have effectively controlled GDM.
The concept of using a dietary supplement to prevent GDM is intriguing, and the results of this trial, coupled with a second recent report on the beneficial effects of myo-inositol to prevent GDM,10 are promising. However, the many concerns raised here—especially the use of IADPSG criteria—make it difficult to apply these findings to traditional diagnostic criteria for US practitioners. Follow-up, large-scale trials are needed to determine how effective this supplement is in preventing GDM and whether its effects translate into benefits for women at increased risk of developing diabetes. The routine use of myo-inositol in patients with a family history of type 2 diabetes should await further studies, including the aforementioned trials.
E. Albert Reece, MD, PhD, MBA
- Morgante G, Orvieto R, Di Sabatino A, Musacchio MC, De Leo V. The role of inositol supplementation in patients with polycystic ovary syndrome, with insulin resistance, undergoing the low-dose gonadotropin ovulation induction regimen. Fertil Steril. 2011;95(8):2642–2644.
- Khandelwal M, Reece EA, Wu YK, Borenstein M. Dietary myo-inositol therapy in hyperglycemia-induced embryopathy. Teratology. 1998;57(2):79–84.
- Cavalli P, Tonni G, Grosso E, Poggiani C. Effects of inositol supplementation in a cohort of mothers at risk of producing an NTD pregnancy. Birth Defects Res A Clin Mol Teratol. 2011;91(11):962–965.
- International Association of Diabetes and Pregnancy Study Groups Consensus Panel. International Association of Diabetes and Pregnancy Study Groups recommendations on the diagnosis and classification of hyperglycemia in pregnancy. Diabetes Care. 2010;33(3):676–682.
- Corrado F, D’Anna R, Di Vieste G, et al. The effect of myoinositol supplementation on insulin resistance in patients with gestational diabetes. Diabet Med. 2011;28(8):972–975.
- Coustan DR. Can a dietary supplement prevent gestational diabetes mellitus? Diabetes Care. 2013;36(4):777–779.
- Reece EA, Moore T. The diagnostic criteria for gestational diabetes: To change or not to change? Am J Obstet Gynecol. 2013;208(4):255–259.
- Langer O, Umans JG, Miodovnik M. Perspectives on the proposed gestational diabetes mellitus diagnostic criteria. Obstet Gynecol. 2013;121(1):177–182.
- National Institutes of Health Draft Consensus Development Panel. Draft Statement: National Institutes of Health Consensus Development Conference Statement: Diagnosing Gestational Diabetes Mellius; March 4–6, 2013; Bethesda, Maryland. http://prevention.nih.gov/cdp/conferences/2013/gdm/files/DraftStatement.pdf. Published March 6, 2013. Accessed May 17, 2013.
- Matarrelli B, Vitacolonna E, D’Angelo M, et al. Effect of dietary myo-inositol supplementation in pregnancy on the incidence of maternal gestational diabetes mellitus and fetal outcomes: a randomized controlled trial [published online ahead of print March 1, 2013]. J Matern Fetal Neonatal Med. doi:10.3109/14767058.2013.766691.

Practical considerations in the delivery of genetic counseling and testing services for inherited cancer predisposition
Many professional entities endorse the need to deliver cancer genetics risk assessment (CGRA) services through a multidisciplinary team that includes trained genetics professionals. However, market forces, a lack of regulation of genetic testing, patent laws, cost barriers, and a limited workforce in genetics have resulted in an increasing number of community practitioners who order and interpret genetic testing. In addition, varying state-level laws and licensure requirements for genetic counselors may contribute to the nonuniform delivery of CGRA services across the United States. Those who perform genetic testing without having adequate training or expertise may incur liability risks. Moreover, the patient might not enjoy the maximum benefit of testing at the hands of an inadequately trained individual. In the setting of a limited number of professional who are trained in CGRA and a dearth of education and training resources, it is a challenge to integrate genetic testing services into clinical care. With advances in genomics and the implementation of personalized medicine, the problem will only be magnified, and it is critical that there are more opportunities for high quality education and training in clinical cancer genetics free of commercial bias. Successful strategies for delivering comprehensive CGRA services include academic-community partnerships that focus on collaboration with nongenetics providers or the inclusion of a genetics professional in the community setting as part of multidisciplinary patient care. These approaches can leverage the expertise of genetics professionals while allowing patients to remain in their community and enjoy better access to resources for long-term follow-up care.
*Click on the link to the left for a PDF of the full article.
Good survival rates with temozolomide CRT for high-risk, low-grade gliomas
CHICAGO – Patients with high-risk, low-grade gliomas had 3-year survival rates significantly higher than those of historical controls when they were treated with a temozolomide-based chemoradiotherapy regimen, investigators reported at the annual meeting of the American Society of Clinical Oncology.
Preliminary results from the phase II RTOG 0424 trial showed a 73% overall survival rate for patients treated with temozolomide chemoradiotherapy, compared with 54% overall survival for historical controls (P less than .001), and exceeding the study’s hypothesized 65% overall survival, reported Dr. Barbara Fisher, a radiation oncologist at the University of Western Ontario in London.
At a median follow-up of 4 years, with a minimum potential follow-up of 3 years, median survival of patients has not been reached, and the median follow-up time for surviving patients is 5 years, Dr. Fisher noted.
Median progression-free survival was 4.5 years, and 3-year PFS was 59%. In contrast to historical controls, patients with four or five risk factors appeared to have an overall survival rate similar to that of patients with three risk factors, Dr. Fisher reported.
Although the trial was originally proposed in 2000 as a randomized controlled study, "there wasn’t much information about temozolomide and radiation at that point," Dr. Fisher said.
The control population comes from a 2002 study by Francesco Pignatti and his colleagues (J. Clin. Oncol. 2002;20:2076-84), which identified prognostic factors for survival in adults with low-grade glioma, based on data from two European Organization for Research and Treatment of Cancer (EORTC) trials conducted in the 1990s.
The risk factors are age 40 years and older; astrocytoma subtype; tumor crossing the midline; largest tumor diameter more than 6 cm preoperatively; and preoperative neurological function status (neurocognitive function greater than 1: moderate impairment).
A total of 136 patients were accrued, and 129 patients were eligible for the protocol, which consisted of temozolomide 75 mg/m2 per day for 6 weeks with concurrent conformal radiotherapy, consisting of 54 Gy divided into 30 fractions delivered 5 days each week for 6 weeks, followed by temozolomide 150-200 mg/m2 per day for days 1-5 of each 28-day cycle for a total of 12 cycles.
The patients had previously untreated, histologically proven supratentorial World Health Organization grade II astrocytoma (71 patients); oligodendroglioma (29) or oligoastrocytoma (29) confirmed by central pathology; and at least three of the aforementioned risk factors. The majority of patients (80%) were aged 40 years or older, 79% had tumors greater than 6 cm in the largest diameter, 53% had tumors that crossed the midline, 66% had a dominant astrocytoma subtype, and 50% had preoperative neurological function status scores greater than 1. In all, 89 patients had three risk factors, 32 had four, and 8 had five factors.
The investigators hypothesized that they would see a 43% relative increase in median survival, from 40.5 months in controls to 57.9 months, and a 20% improvement in 3-year survival, from 54% to 65%. As noted before, the survival rates exceeded their expectations.

In an analysis of survival by risk factors 5 years after trial registration, the authors found that 35 of the 89 patients with three risk factors (39%) had died, compared with 17 of the 40 patients with four or five risk factors (43%).
In all, 55 patients had grade 3 adverse events as their worst overall events, 13 had grade 4 toxicities, and 1 patient died of herpes simplex encephalitis, possibly related to treatment.
Grade 3 adverse events were seen in 43% of patients, and grade 4 toxicities in 10%. The most common toxicities were hematologic, constitutional, or gastrointestinal, including nausea and anorexia.
In her commentary, Dr. Helen Shih, the invited discussant, said that a randomized trial would have been preferable, but she acknowledged the difficulties the investigators had in designing and implementing the trial. Dr. Shih, of the radiation oncology department at Massachusetts General Hospital in Boston, also noted that the study used for control purposes "itself was conducted in a prior decade, when the management of radiation as well as surgery were slightly different, and perhaps those advancements also have affected overall survival of patients who are treated today."
In addition, the incidences of grade 3 and 4 toxicities in the study by Dr. Fisher and her colleagues were "not trivial, and should be kept in mind," Dr. Shih said.
The study was supported by the National Cancer Institute. Dr. Fisher and Dr. Shih reported having no relevant financial disclosures.
CHICAGO – Patients with high-risk, low-grade gliomas had 3-year survival rates significantly higher than those of historical controls when they were treated with a temozolomide-based chemoradiotherapy regimen, investigators reported at the annual meeting of the American Society of Clinical Oncology.
Preliminary results from the phase II RTOG 0424 trial showed a 73% overall survival rate for patients treated with temozolomide chemoradiotherapy, compared with 54% overall survival for historical controls (P less than .001), and exceeding the study’s hypothesized 65% overall survival, reported Dr. Barbara Fisher, a radiation oncologist at the University of Western Ontario in London.
At a median follow-up of 4 years, with a minimum potential follow-up of 3 years, median survival of patients has not been reached, and the median follow-up time for surviving patients is 5 years, Dr. Fisher noted.
Median progression-free survival was 4.5 years, and 3-year PFS was 59%. In contrast to historical controls, patients with four or five risk factors appeared to have an overall survival rate similar to that of patients with three risk factors, Dr. Fisher reported.
Although the trial was originally proposed in 2000 as a randomized controlled study, "there wasn’t much information about temozolomide and radiation at that point," Dr. Fisher said.
The control population comes from a 2002 study by Francesco Pignatti and his colleagues (J. Clin. Oncol. 2002;20:2076-84), which identified prognostic factors for survival in adults with low-grade glioma, based on data from two European Organization for Research and Treatment of Cancer (EORTC) trials conducted in the 1990s.
The risk factors are age 40 years and older; astrocytoma subtype; tumor crossing the midline; largest tumor diameter more than 6 cm preoperatively; and preoperative neurological function status (neurocognitive function greater than 1: moderate impairment).
A total of 136 patients were accrued, and 129 patients were eligible for the protocol, which consisted of temozolomide 75 mg/m2 per day for 6 weeks with concurrent conformal radiotherapy, consisting of 54 Gy divided into 30 fractions delivered 5 days each week for 6 weeks, followed by temozolomide 150-200 mg/m2 per day for days 1-5 of each 28-day cycle for a total of 12 cycles.
The patients had previously untreated, histologically proven supratentorial World Health Organization grade II astrocytoma (71 patients); oligodendroglioma (29) or oligoastrocytoma (29) confirmed by central pathology; and at least three of the aforementioned risk factors. The majority of patients (80%) were aged 40 years or older, 79% had tumors greater than 6 cm in the largest diameter, 53% had tumors that crossed the midline, 66% had a dominant astrocytoma subtype, and 50% had preoperative neurological function status scores greater than 1. In all, 89 patients had three risk factors, 32 had four, and 8 had five factors.
The investigators hypothesized that they would see a 43% relative increase in median survival, from 40.5 months in controls to 57.9 months, and a 20% improvement in 3-year survival, from 54% to 65%. As noted before, the survival rates exceeded their expectations.
In an analysis of survival by risk factors 5 years after trial registration, the authors found that 35 of the 89 patients with three risk factors (39%) had died, compared with 17 of the 40 patients with four or five risk factors (43%).
In all, 55 patients had grade 3 adverse events as their worst overall events, 13 had grade 4 toxicities, and 1 patient died of herpes simplex encephalitis, possibly related to treatment.
Grade 3 adverse events were seen in 43% of patients, and grade 4 toxicities in 10%. The most common toxicities were hematologic, constitutional, or gastrointestinal, including nausea and anorexia.
In her commentary, Dr. Helen Shih, the invited discussant, said that a randomized trial would have been preferable, but she acknowledged the difficulties the investigators had in designing and implementing the trial. Dr. Shih, of the radiation oncology department at Massachusetts General Hospital in Boston, also noted that the study used for control purposes "itself was conducted in a prior decade, when the management of radiation as well as surgery were slightly different, and perhaps those advancements also have affected overall survival of patients who are treated today."
In addition, the incidences of grade 3 and 4 toxicities in the study by Dr. Fisher and her colleagues were "not trivial, and should be kept in mind," Dr. Shih said.
The study was supported by the National Cancer Institute. Dr. Fisher and Dr. Shih reported having no relevant financial disclosures.
AT THE ASCO ANNUAL MEETING 2013
Major finding: With temozolomide chemoradiotherapy, 3-year overall survival was 73% for patients with low-grade gliomas and three or more risk factors for worse prognosis, compared with 54% for historical controls (P less than .001).
Data source: Single-arm, prospective phase II study in 129 patients compared with historical controls.
Disclosures: The study was supported by the National Cancer Institute. Dr. Fisher and Dr. Shih reported having no relevant financial disclosures.