User login
New 'Meaningful Use' Exemption is Valuable Option for Growing Number of Hospitalists
Hospital-based eligible professionals do not qualify for the Medicare or Medicaid electronic health record (EHR) incentive program or the impending payment penalties for not being “meaningful users” of EHR technology.
A hospital-based “eligible professional” (EP) is defined by the Centers for Medicare & Medicaid Services (CMS) as an EP who furnishes 90% or more of their covered professional services in either the inpatient or emergency departments of a hospital. This exemption applies to most hospitalists and recognizes they have very little control over whether their respective institutions invest in this technology.
Although this 90% threshold should qualify most hospitalists for the exemption, it does not tell the entire story. A growing number of hospitalists are spending time rounding in skilled nursing or other post-acute facilities, and some are focusing the entirety of their practice in the post-acute setting. Under the current CMS definition, these hospitalists are not hospital-based and will, therefore, be subject to the upcoming penalties for not being meaningful users of EHR technology.
Contrary to the 90% threshold, the reality for post-acute hospitalists is that when it comes to EHRs, they are no different than their hospital-based colleagues. A hospitalist, irrespective of setting, has very little control over what kind of technology, if any, a facility invests in.
For hospitalists who are rounding or spending more of their practice time in post-acute facilities, this mechanical classification based on practice location alone is problematic. A physician-implemented EHR is not practical and does not make sense given the unique practice patterns of hospitalists. Although SHM remains strongly committed to the promise represented by health information technology (HIT), SHM consistently has noted to CMS that hospitalist practice does not always fit the confines of their rulemaking.
Hospitalists should not be penalized for failure to implement their own HIT, because they already use facility EHRs or lack control over the availability of EHR systems. It is for these reasons that SHM has been a strong advocate for an additional exemption that works for hospitalists—an exemption that recognizes lack of control of availability.
In August, CMS released the final rule for Stage 2 of Meaningful Use, and the voice of hospitalists was clearly heard. The rule includes an SHM advanced-hardship exemption acknowledging that EPs who practice in multiple locations, such as nursing homes, could face a significant hardship as they would have no way to control the use of Certified EHR Technology (CEHRT). In promulgating the exemption, CMS specifically states that a “physician merely sees patients at the center or home, and does not have any other interest in the facility; they would exert little to no influence over whether the nursing home, center, or other similar outpatient site adopts and implements CEHRT.” Hospitalists seeking this exemption would need to apply annually for up to five years.
This hardship exemption could apply to hospitalists who work in multiple facilities outside of hospitals, such as nursing homes. Although imperfect due to the time-limited nature, the exemption represents a victory in the effort to differentiate HM from traditional practice patterns. It is precisely this difference that makes HM uniquely positioned to lead changes in the healthcare system.
Josh Boswell is SHM’s interim senior manager of government relations.
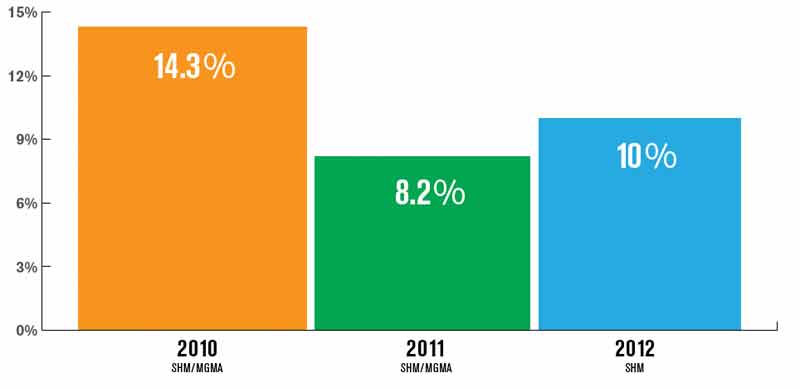
Turnover for Hospitalist Groups Steady at 10%
How many hospitalists left your group during the past year? If you're lucky, your group is one of the 36% of adult medicine groups that had no turnover at all. The proportion of groups with no turnover has ranged from a low of 32% (in the 2008-2009 SHM Focused Survey) to a high of 39% (2005-2006 and 2007-2008 SHM biannual surveys), so the 2012 results appear to be right in line with previous years.
But what about the groups that did encounter turnover? SHM's 2012 State of Hospital Medicine Report, which is based on 2011 data, reported a median turnover rate of 10% for nonacademic HM groups serving adults only. That's a little higher than last year's rate but lower than the rate reported in the 2010 SHM/MGMA survey. (It's worth keeping in mind that, in 2012, SHM conducted its own survey separate from MGMA, so the results might not be directly comparable to the previous two years' SHM/MGMA surveys.)
What part of the country you practice in and who employs you matters. In 2012, groups in the Western region of the U.S. reported only about 5% turnover, compared with 10% or 11% in other parts of the country. Turnover also varied by ownership/employment model: Groups employed by management companies and university/medical schools reported higher-than-median turnover; private hospitalist groups and those employed by multispecialty groups reported lower turnover. And medium-sized groups (five to 19 hospitalist FTEs) reported higher turnover than very small or larger groups.
The report also includes turnover rates for physician assistants (PAs) and nurse practitioners (NPs). Interestingly, turnover was much lower among NPs and PAs, with around 70% of the adult medicine groups who used NP/PAs reporting no NP/PA turnover at all.
Some folks have speculated that hospitalist turnover will decline as the supply of hospitalists begins to catch up with demand, which seems reasonable. Although we can't assess turnover data at this level of granularity, I'm guessing that turnover in highly-sought-after metropolitan markets, such as Washington, New York City, and Seattle, already is trending lower than in areas that are harder to recruit to.
But as far back as its 2005-2006 survey, SHM reported median turnover of 9%—not meaningfully different from this year's survey results. I suspect hospitalist turnover will continue to hover in the 10% to 15% range for the foreseeable future. Part of that figure can be attributed to the fact that significant numbers of hospitalists working in remote locations are international medical graduates on H-1B and J-1 visas. They typically make a three-year commitment, then move on to a more desirable location. But I think it's also because of the kinds of people who are attracted to hospital medicine.
As my colleague John Nelson, MD, MHM, likes to say, "hospitalists tend to want to date their practice, rather than marry it."
HM jobs have low barriers to entry and exit, at least compared with traditional primary care, which involves building an infrastructure and a panel of patients over many years. HM likely will continue to attract clinicians who enjoy looking around and changing jobs periodically. It will be interesting to see what the next few years bring to our specialty.
Leslie Flores is a partner in Nelson Flores Hospital Medicine Consultants and SHM Practice Analysis Committee member.
Off-Label Use of Antipsychotics for Dementia Patients Discouraged
Hospitalists can play a major role in reducing deaths that come as a result of off-label prescriptions for antipsychotic drugs being given to dementia patients, according to the Centers for Medicare & Medicaid Services (CMS) and SHM.
In a letter to hospitalist leaders, SHM encouraged hospitalists to “partner with others in your clinical work environment to reduce the use of antipsychotics for treating behavioral problems in patients with dementia. We believe that hospitalists have an important role to play in this initiative; hospital-based clinicians frequently care for patients with dementia and are responsible for medications prescribed during a patient’s hospitalization and at discharge.”
The joint education effort by CMS and SHM is based on an April 2011 report from the U.S. Department of Health and Human Services’ Office of Inspector General (OIG) that found that antipsychotic medications sometimes are used to treat patients with dementia for off-label reasons (e.g. “behaviors”) or against black-box warnings despite potential dangers to patients’ health.
An earlier warning from the FDA in 2008 outlined the potential dangers as:
- Increased risk (60% to 70%) of death in older adults with dementia;
- Prolongation of the QT interval on electrocardiogram, particularly with intravenous haloperidol use;
- Increased risk of stroke and TIAs; and
- Worsening cognitive function.
The letter to hospitalists noted the necessary changes and the need for collaboration between SHM, its members, and hospital leaders. “Increased prescriber training and system practice changes will help reduce unnecessary antipsychotic drug prescribing,” the letter stated. “SHM looks forward to an ongoing collaboration with members and hospital leaders on this important patient safety concern.”
Hospitalists On the Move

Hospitalist Lawrence Magras, MD, MBA, has been named medical director for the physician hospital organization at Catholic Health Services (CHS) in Rockville Centre, N.Y. Dr. Magras will serve as vice president and assistant medical director for clinical effectiveness, care coordination, and physician integration for the department of care management. Before transitioning to administration, he worked for several years as a hospitalist and held numerous positions focusing on quality improvement (QI) and efficient care management.
Randall Lorenz, MD, has been named chief hospitalist of the Sound Physicians hospitalist group at Dameron Hospital in Stockton, Calif. Dr. Lorenz completed his residency at the University of California at Irvine after receiving his medical degree from the Oregon Health and Sciences University School of Medicine in Portland. Sound Physicians has been providing hospitalist services at Dameron Hospital since April.

Bruce Mitchell, MD, is the new director of hospitalist services at Emory University Hospital Midtown in Atlanta. A Georgia native, Dr. Mitchell completed his residency at Emory’s School of Medicine. After working as a hospitalist at the Mayo Clinic in Jacksonville, Fla., for 14 years, he made his return to Emory in 2010 as assistant professor of hospital medicine.

Ryan O’Connell, MD, is now vice president of performance and risk management at Bridgeport Hospital in Bridgeport, Conn. Dr. O’Connell, who received his medical degree from New York University and completed his residency at Yale-New Haven Hospital, practiced as a hospitalist at Bridgeport Hospital before being appointed medical director for care coordination there in 2011.

Jason Krupp, MD, is the new chief medical officer at Banner Boswell Medical Center of the Banner Health System in Sun City, Ariz. Before serving as CMO at several institutions prior to Banner Boswell, Dr. Krupp worked as both a hospitalist and a privately practicing hypertension specialist.
Business Moves
Northumberland Hills Hospital (NHH) in Cobourg, Ontario, has announced plans to provide hospitalist services. The move came in response to the decline in primary-care physicians willing to provide their services to inpatients, according to a release from the hospital.

Sound Physicians, based in Tacoma, Wash., has announced plans to provide hospitalist services at Mercy Health System’s Mt. Airy Hospital in Cincinnati. Sound already employs hospitalists at three of Mercy Health’s other Cincinnati-area hospitals.

IPC: The Hospitalist Co., based in North Hollywood, Calif., announced its acquisition of three New England hospitalist practices. IPC will oversee operations at Nexis Healthcare Inc. in Taunton, Mass.; Fall River, Mass.-based Omni Medical Diagnostics PC; and Park Medical Associates LLC in North Smithfield, R.I. IPC estimates the three HM programs will increase patient encounters by 65,000 in the New England areas they serve.
Hospitalist Lawrence Magras, MD, MBA, has been named medical director for the physician hospital organization at Catholic Health Services (CHS) in Rockville Centre, N.Y. Dr. Magras will serve as vice president and assistant medical director for clinical effectiveness, care coordination, and physician integration for the department of care management. Before transitioning to administration, he worked for several years as a hospitalist and held numerous positions focusing on quality improvement (QI) and efficient care management.
Randall Lorenz, MD, has been named chief hospitalist of the Sound Physicians hospitalist group at Dameron Hospital in Stockton, Calif. Dr. Lorenz completed his residency at the University of California at Irvine after receiving his medical degree from the Oregon Health and Sciences University School of Medicine in Portland. Sound Physicians has been providing hospitalist services at Dameron Hospital since April.
Bruce Mitchell, MD, is the new director of hospitalist services at Emory University Hospital Midtown in Atlanta. A Georgia native, Dr. Mitchell completed his residency at Emory’s School of Medicine. After working as a hospitalist at the Mayo Clinic in Jacksonville, Fla., for 14 years, he made his return to Emory in 2010 as assistant professor of hospital medicine.
Ryan O’Connell, MD, is now vice president of performance and risk management at Bridgeport Hospital in Bridgeport, Conn. Dr. O’Connell, who received his medical degree from New York University and completed his residency at Yale-New Haven Hospital, practiced as a hospitalist at Bridgeport Hospital before being appointed medical director for care coordination there in 2011.
Jason Krupp, MD, is the new chief medical officer at Banner Boswell Medical Center of the Banner Health System in Sun City, Ariz. Before serving as CMO at several institutions prior to Banner Boswell, Dr. Krupp worked as both a hospitalist and a privately practicing hypertension specialist.
Business Moves
Northumberland Hills Hospital (NHH) in Cobourg, Ontario, has announced plans to provide hospitalist services. The move came in response to the decline in primary-care physicians willing to provide their services to inpatients, according to a release from the hospital.
Sound Physicians, based in Tacoma, Wash., has announced plans to provide hospitalist services at Mercy Health System’s Mt. Airy Hospital in Cincinnati. Sound already employs hospitalists at three of Mercy Health’s other Cincinnati-area hospitals.
IPC: The Hospitalist Co., based in North Hollywood, Calif., announced its acquisition of three New England hospitalist practices. IPC will oversee operations at Nexis Healthcare Inc. in Taunton, Mass.; Fall River, Mass.-based Omni Medical Diagnostics PC; and Park Medical Associates LLC in North Smithfield, R.I. IPC estimates the three HM programs will increase patient encounters by 65,000 in the New England areas they serve.
ITL: Physician Reviews of HM-Relevant Research
In This Edition
Literature At A Glance
A guide to this month’s studies
- Acute myocardial infarction risk after hip/knee surgery
- Preoperative alcohol cessation minimizes complications in elective surgery
- Early laparoscopic cholecystectomy for gallstone pancreatitis
- Low-dose steroids in shock patients
- Pharmacist intervention did not reduce post-discharge errors
- Hyperbaric oxygen therapy and necrotizing soft-tissue infections
- Worse stroke outcomes on weekends
- Hospital admissions from EDs increasing
- Avoiding intensive glucose control in acute stroke
- Peri-procedural bleeding with dabigatran versus warfarin
Increased Risk of Acute Myocardial Infarction after Hip/Knee Surgery
Clinical question: How long does the risk of acute myocardial infarction (AMI) last after hip or knee replacement surgery, and what factors affect the risk?
Background: AMI is a morbid, perioperative complication of hip/knee surgery. Previous studies have demonstrated an increased risk of AMI post-surgery; however, this is the first study to assess the timing and modifiers of the risk.
Study design: Retrospective cohort study.
Setting: Data from Danish national registries from 1998 to 2007.
Synopsis: All adult patients who received total hip replacement (THR, n=66,524) or total knee replacement (TKR, n=28,703) surgery, as identified by hospital discharge records during a 10-year period, were matched with three age/sex controls without a history of THR or TKR (n=286,165). Patients with prior AMI within six weeks of the index date were excluded (n=437). The patients were followed until death, THR or TKR revision, migration, or the end of the study period.
Thromboprophylaxis was received by 99.1% of THR and TKR patients. The risk of AMI was significantly elevated for two weeks in TKR patients, and for six weeks in THR patients. Age >60 significantly increased the risk of AMI for both study populations. The risk associated with a previous AMI before THR or TKR diminished with increasing time between the two events.
The study was limited by lack of controlling for some AMI risk factors, such as smoking history or BMI.
Bottom line: AMI risk is substantially elevated for six weeks after THR and for two weeks after TKR. Preoperative risk factors to consider include age >60 and AMI within a year.
Citation: Lalmohamed A, Vestergaard P, Klop C, et al. Timing of acute myocardial infarction in patients undergoing total hip or knee replacement. Arch Intern Med. 2012;172:1229-1235.
Preoperative Alcohol Cessation Minimizes Complications of Elective Surgery in Heavy Alcohol Users
Clinical question: Does preoperative alcohol cessation minimize complication rates, mortality, or length of stay (LOS) in heavy alcohol users?
Background: Alcohol abuse is prevalent worldwide and contributes to 1.8 million deaths per year. Heavy alcohol users have an increased risk of postoperative bleeding, cardiopulmonary complications, and infections. It is unknown if preoperative cessation can reduce the risk of postoperative complications.
Study design: Systematic review.
Setting: Two Danish randomized controlled trials.
Synopsis: A Cochrane review identified 671 potential studies, of which 655 were excluded after abstract review. Of the 16 studies remaining, 14 were not randomized controlled trials with preoperative intervention for alcohol cessation. In the two studies that remained (n=69), patients who received preoperative alcohol cessation had fewer postoperative complications (odds ratio=0.22, 95% CI 0.08-0.61, P=0.004). Interventions included disulfiram and medical supervision of alcohol cessation. Investigators found no significant reductions for in-hospital or 30-day mortality.
Limitations of this review include lack of blinding to the treatments, low numbers of included women, and both studies being conducted by the same author.
Bottom line: Heavy alcohol users might benefit from a preoperative alcohol cessation program, but further studies are needed.
Citation: Oppedal K, Moller AM, Pedersen B, Tonnesen H. Preoperative alcohol cessation prior to elective surgery. Cochrane Database Syst Rev. 2012;7:CD008343.
Early Laparoscopic Cholecystectomy Is Safe and Effective for Gallstone Pancreatitis
Clinical question: Does early laparoscopic cholecystectomy (<48 hours of admission) in mild gallstone pancreatitis decrease LOS without increasing morbidity and mortality?
Background: Time to laparoscopic cholecystectomy (LC) for mild gallstone pancreatitis is greatly debated. Historically, surgeons have waited for normalization of laboratory values and decreased symptoms before performing laparoscopic or open cholecystectomy. Two previous studies demonstrated LC can be performed safely within 48 hours of admission, regardless of symptoms or laboratory values.
Study design: Retrospective cohort.
Setting: Two academic medical centers in California.
Synopsis: This retrospective review of 303 patients who underwent LC for mild gallstone pancreatitis from 2006 to 2011 found 117 (38.6%) underwent early LC and 186 (61.4%) underwent delayed LC (>48 hours after presentation). No significant differences in patient demographics, laboratory values, or admission Ranson scores were found between the groups. The mean LOS was significantly shorter in the early LC group (3.4 days) compared with the delayed LC group (6.3 days), and the delayed LC group had a higher rate of preoperative endoscopic retrograde cholangiopancreatography (ERCP). No differences were found with regard to mortality, complication rates, 30-day readmissions, or conversion to open cholecystectomy.
This study is limited by its retrospective design and potential for uncontrolled confounders. In addition, it did not evaluate preoperative management, postoperative recovery time, or timing of surgical consultation, which could have affected outcomes between the groups. It also is difficult to predict mild gallstone pancreatitis on admission, as some of the Ranson criteria should be calculated at 48 hours, and 5% to 10% of mild gallstone pancreatitis will progress to severe pancreatitis.
Bottom line: Early laparoscopic cholecystectomy (<48 hours of presentation) in mild gallstone pancreatitis is associated with shorter LOS and decreased ERCP use, with no difference in morbidity or mortality.
Citation: Faylor AE, de Virgilio C, Stabile BE, et al. Early laparoscopic cholecystectomy for mild gallstone pancreatitis. Time for a paradigm shift. Arch Surg. 2012;16:1-5.
Low-Dose Steroids in Shock Patients
Clinical question: Do low-dose corticosteroids improve mortality or shock reversal in adults with septic shock?
Background: Several trials have been published to evaluate the efficacy of low-dose corticosteroids in septic shock.
Study design: Systemic review and meta-analysis of randomized controlled trials.
Setting: Not identified.
Synopsis: Seven randomized controlled trials that utilized low-dose corticosteroids and reported either mortality or time-to-shock reversal in adults with septic shock were included in this review. Shock reversal was not consistently defined across trials but included time to withdrawal of vasopressors, proportion of patients on vasopressors on Day 3, or stable systolic blood pressure of >90 mm Hg for at least 24 hours without vasopressor support.
Pooled results found a significant improvement in shock reversal after low-dose corticosteroid administration (300 mg hydrocortisone in 24 hours [relative risk=1.17, 95% CI, 1.07-1.28]). Pooled results from six studies (n=965) did not find a significant difference in
mortality among those receiving low-dose corticosteroids.
Of note, two of the seven studies represented a disproportionate number of included patients, and the search only included the MEDLINE database, so some randomized controlled trials might have been missed.
Bottom line: Low-dose corticosteroids might reverse shock faster, but they do not improve mortality.
Citation: Sherwin RL, Garcia AJ, Bilkovski R. Do low-dose corticosteroids improve mortality or shock reversal in patients with septic shock? A systemic review and position statement prepared for the American Academy of Emergency Medicine. J Emerg Med. 2012;43:7-12.
Pharmacist Intervention Did Not Reduce Medication Errors after Discharge
Clinical question: Does pharmacist intervention reduce clinically important medication errors after hospital discharge for patients with acute coronary syndrome (ACS) or decompensated congestive heart failure?
Background: Research has shown adverse drug events, including discrepancies in medication regimens and nonadherence, affect 11% to 17% of discharged patients. Pharmacist interventions reduce medication errors in hospitalized patients, but their impact on recently discharged patients is unknown.
Study design: Blinded randomized controlled trial.
Setting: Two U.S. tertiary-care academic hospitals.
Synopsis: Investigators randomized 851 patients admitted with ACS or decompensated heart failure to receive pharmacist intervention or usual care. The intervention involved pharmacist medication reconciliation (“med rec”), inpatient pharmacist counseling, low-literacy adherence aids, and post-discharge follow-up phone calls.
The primary outcome of clinically important medication errors within 30 days of discharge occurred in 50.8% of all patients. The intervention and usual-care groups had similar mean number of errors, 0.87 and 0.92 events per patient, respectively. Results by intention-to-treat analysis favored the intervention but did not meet statistical significance (adjusted RR 0.92, CI 0.77-1.09).
Both hospitals had sufficient resources to support med rec and electronic health records. The study population was well-educated, with only a 10% prevalence of inadequate health literacy, compared with 26% noted in prior literature. These factors could help explain the study’s negative findings.
Study limitations include whether the results are generalizable to other settings or noncardiac populations. Further study is needed to determine characteristics of patients and settings that could benefit from pharmacist involvement to decrease medication errors.
Bottom line: A pharmacist intervention did not reduce medication errors in cardiac patients after discharge.
Citation: Kripalani S, Roumie CL, Dalal AK, et al. Effect of a pharmacist intervention on clinically important medication errors after hospital discharge. Ann Int Med. 2012;157:1-10.
Hyperbaric Oxygen Therapy Saves Lives in Necrotizing Soft-Tissue Infections
Clinical question: Is the use of hyperbaric oxygen therapy in necrotizing soft-tissue infections (NSTIs) effective in improving patient outcomes?
Background: Studies evaluating the benefits of hyperbaric oxygen therapy (HBO2 therapy) in NSTIs are limited. The mainstay of management remains early surgical debridement and antibiotics. Given the significant risk of mortality and long-term disability from limb and tissue loss, alternative treatments need to be considered.
Study design: Retrospective analysis.
Setting: The Nationwide Inpatient Sample (NIS) database.
Synopsis: This study evaluated 45,913 patients in the NIS from 1988 to 2009, of which 405 patients received HBO2 therapy. Overall, those receiving HBO2 therapy had a lower mortality rate (4.5% vs. 9.4%). After adjusting for predictors and confounders, those receiving HBO2 therapy had a statistically significant lower risk of mortality, but they did have higher hospital costs and longer LOS.
The NIS database does not capture several predictors and confounders for NSTI patients. Additionally, the lack of data regarding the number of HBO2 therapy sessions received makes it impossible to estimate a dose response.
Bottom line: This retrospective analysis of NSTI patients found HBO2 therapy was associated with significantly lower mortality but higher hospitalization cost and longer LOS.
Citation: Soh CR, Pietrobon R, Freiberger JJ, et al. Hyperbaric oxygen therapy in necrotizing soft tissue infections: a study of patients in the United States Nationwide Inpatient Sample. Intensive Care Med. 2012;38:1143-1151.
Worse Stroke Outcomes on Weekends
Clinical question: Does the day of admission alter the quality and safety of care received by stroke patients?
Background: There is growing concern of disparities in care between weekday and weekend admissions in many health conditions. Recent studies have sought to determine if such a disparity exists for stroke patients.
Study design: Retrospective cohort study.
Setting: National Health Service public hospitals, England.
Synopsis: This study evaluated six quality-safety indicators among 93,621 stroke admits from April 1, 2009, to March 31, 2010. Investigators found performance on five of six indicators was significantly worse on weekends. Specifically, the percent of same-day brain scans was 43.1% on weekends, compared with 47.6% on weekdays, and seven-day in-hospital mortality for Sunday admissions was 11%, compared with an overall mean mortality of 8.9%.
It is possible that some of the observed effect could be due to unmeasured differences in patients admitted on weekends compared to weekdays.
Bottom line: This study suggests that, similar to other clinical conditions, significant disparities might exist between weekend and weekday care of stroke patients.
Citation: Palmer WL, Bottle A, Davie C, Vincent CA, Aylin P. Dying for the weekend: a retrospective cohort study on the association between day of hospital presentation and the quality and safety of stroke care. Arch Neurol. 2012;9:1-7.
Hospital Admissions from Emergency Departments Increasing
Clinical question: What proportion of current hospital admissions use the ED as an admission portal?
Background: Historically, outpatient providers’ offices admitted clinically stable patients with acute problems. From 1997 to 2007, ED visit rates increased by more than a third. Currently, a quarter of all acute-care outpatient visits occur in the ED.
Study design: Retrospective, observational cohort study.
Setting: The Nationwide Inpatient Sample (NIS) database, with approximately 8 million annual hospital stays, weighted to produce national averages.
Synopsis: NIS data from 1993 to 2006 showed the number of hospital admissions increased by 15%, while the proportion of admissions from the ED increased by 50%. The total proportion of inpatients entering from the ED increased to 43.8% from 33.5% (P<0.001). Twelve of the 13 most frequent inpatient clinical conditions also had a proportional increase in admissions from the ED (P<0.0001).
Possible explanations for the increases include difficulty arranging timely outpatient sick visits and overuse of the ED for issues that could be more appropriately addressed by primary-care offices. Furthermore, public education campaigns for heart attack or stroke emphasize early emergency care. Patients and providers expect rapid specialized care and early treatment that is readily available in ED.
More efficient use of inpatient resources is a focus of the Affordable Care Act. To inform health policy, research is needed to determine the drivers of admission trends, as well as the value and cost of emergency care.
Bottom line: The proportion of hospital admissions from the ED is increasing, but the implications for healthcare delivery are inadequately understood.
Citation: Schuur JD, Venkatesh AK. The growing role of emergency departments in hospital admissions. N Engl J Med. 2012;367(5):391-393.
Avoiding Intensive Glucose Control in Acute Stroke
Clinical question: Is intensive insulin treatment beneficial in patients with acute stroke?
Background: Although post-stroke hyperglycemia is associated with worse outcomes in acute stroke patients, it is unknown if intensive insulin treatment improves prognosis or infarct size.
Study design: Unblinded randomized controlled trial.
Setting: Single academic medical center in France.
Synopsis: Study authors randomized acute stroke patients (NIHSS from 5 to 25) to intensive insulin treatment or subcutaneous insulin therapy within 24 hours of admission. Initial median blood sugars were ~120 mg/dL in both groups. Mean blood sugars of <126 mg/dL were achieved at 24 hours in 95% of the intensive group and 67% of the subcutaneous group. The MRI infarct size at follow-up scanning was significantly larger in the intensive insulin group, but there were no differences in functional outcomes, serious adverse events, or mortality between the groups.
The study might have been underpowered to detect meaningful clinical differences between the groups.
Bottom line: Intensive blood sugar control cannot be recommended in acute stroke patients.
Citation: Rosso C, Corvol JC, Pires C, et al. Intensive versus subcutaneous insulin in patients with hyperacute stroke: results from the randomized INSULINFARCT trial. Stroke. 2012;43(9):2343-2349.
Peri-Procedural Bleeding with Dabigatran Versus Warfarin
Clinical question: Is dabigatran more likely to result in periprocedural bleeding when compared to warfarin?
Background: In a randomized clinical trial (RE-LY), dabigatran had a lower risk of major bleeding compared with warfarin. However, given that the anticoagulant effect of dabigatran is difficult to measure and there is not an effective antidote, it is unknown if dabigatran is associated with higher periprocedural rates of bleeding compared with warfarin.
Study design: Post-hoc analysis of the RE-LY trial.
Setting: Multicenter randomized controlled trial.
Synopsis: Patients enrolled in the RE-LY trial all had urgent or elective-invasive procedures recorded. The protocol recommended cessation of warfarin based on local practice, and cessation of dabigatran 24 hours before the procedure; the protocol was amended in 2008 to recommend cessation of dabigatran 24 hours before low-bleeding risk procedures, but two to five hours before high-bleeding-risk procedures (depending on renal function). Periprocedural bleeding was defined as seven days prior and 30 days after the procedure. Dabigatran was interrupted a mean of 49 hours before the procedures, and warfarin for 114 hours. There was no significant difference in major bleeding rates between dabigatran (150-mg dose) and warfarin, which occurred in 5.1% versus 4.6% patients, respectively.
Bottom line: Warfarin and dabigatran have about the same rate of periprocedural bleeding rates, but interruption duration is shorter for dabigatran.
Citation: Healey JS, Eikelboom J, Douketis J, et al. Peri-procedural bleeding and thromboembolic events with dabigatran compared with warfarin: results from the randomized evaluation of long-term anticoagulation therapy (RE-LY) randomized trial. Circulation. 2012;126(3):343-348.
Relationship Between Red Blood Cells and Protein Levels in Cerebrospinal Fluid in Young Infants Defined

Clinical question: What is the association between cerebrospinal fluid (CSF) red blood cell (RBC) counts and protein concentrations in infants younger than 57 days of age?
Background: Lumbar puncture (LP) is commonly performed in young infants to evaluate for meningitis in the clinical scenario of fever without source. Traumatic LP is common in children, and higher RBC counts are associated with increased CSF protein concentrations. The dynamic nature of CSF composition in young infants makes determination of the exact relationship between RBC counts and protein concentration challenging, which then complicates interpretation of CSF.
Study design: Retrospective, cross-sectional study.
Setting: Tertiary-care children's hospital.
Synopsis: Over a four-year period, 1,241 infants younger than 57 days of age that underwent LP were studied, excluding infants with conditions known to increase CSF protein concentrations: ventricular shunt, serious bacterial infection, congenital infection, herpes simplex virus or enterovirus positive PCR in CSF, seizure, or elevated serum bilirubin. Grossly bloody specimens with RBC counts >150,000 cells/mm3 were also excluded. Linear regression was used to determine relationship between CSF RBCs and protein, with protein increasing at a rate of 1.9 mg/dL per 1,000 CSF RBCs.
This ratio is different from a more traditional correction factor of approximately 1 mg/dL CSF protein increase per 1,000 CSF RBCs, which is derived from older populations of children.
However, this study is limited by the exclusion of grossly bloody specimens, which if included would have resulted in a ratio similar to the more traditional values. Additionally, application of this specific correction factor to prediction rules for bacterial meningitis has not been studied. Nonetheless, this study provides a baseline by which clinicians may interpret protein concentrations in traumatically bloody CSF specimens in young infants.
Bottom line: CSF protein concentrations increase at roughly 2 mg/dL per 1,000 CSF RBCs.
Citation: Hines BA, Nigrovic LE, Neuman MI, Shah SS. Adjustment of cerebrospinal fluid protein for red blood cells in neonates and young infants. J Hosp Med. 2012;7:325-328.
Reviewed by Pediatric Editor Mark Shen, MD, SFHM, medical director of hospital medicine at Dell Children's Medical Center, Austin, Texas.
How is Acute Pericarditis Diagnosed and Treated?
Case
A 32-year-old female with no significant past medical history is evaluated for sharp, left-sided chest pain for five days. Her pain is intermittent, worse with deep inspiration and in the supine position. She denies any shortness of breath. Her temperature is 100.8ºF, but otherwise her vital signs are normal. The physical exam and chest radiograph are unremarkable, but an electrocardiogram shows diffuse ST-segment elevations. The initial troponin is mildly elevated at 0.35 ng/ml.
Could this patient have acute pericarditis? If so, how should she be managed?
Background
Pericarditis is the most common pericardial disease encountered by hospitalists. As many as 5% of chest pain cases unattributable to myocardial infarction (MI) are diagnosed with pericarditis.1 In immunocompetent individuals, as many as 90% of acute pericarditis cases are viral or idiopathic in etiology.1,2 Human immunodeficiency virus (HIV) and tuberculosis are common culprits in developing countries and immunocompromised hosts.3 Other specific etiologies of acute pericarditis include autoimmune diseases, neoplasms, chest irradiation, trauma, and metabolic disturbances (e.g. uremia). An etiologic classification of acute pericarditis is shown in Table 2 (p. 16).
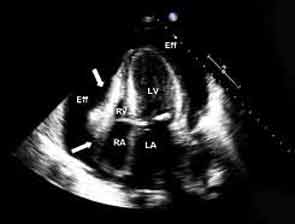
Pericarditis primarily is a clinical diagnosis. Most patients present with chest pain.4 A pericardial friction rub may or may not be heard (sensitivity 16% to 85%), but when present is nearly 100% specific for pericarditis.2,5 Diffuse ST-segment elevation on electrocardiogram (EKG) is present in 60% to 90% of cases, but it can be difficult to differentiate from ST-segment elevations in acute MI.4,6
Uncomplicated acute pericarditis often is treated successfully as an outpatient.4 However, patients with high-risk features (see Table 1, right) should be hospitalized for identification and treatment of specific underlying etiology and for monitoring of complications, such as tamponade.7
Our patient has features consistent with pericarditis. In the following sections, we will review the diagnosis and treatment of acute pericarditis.
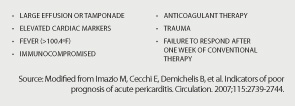
Review of the Data
How is acute pericarditis diagnosed?
Acute pericarditis is a clinical diagnosis supported by EKG and echocardiogram. At least two of the following four criteria must be present for the diagnosis: pleuritic chest pain, pericardial rub, diffuse ST-segment elevation on EKG, and pericardial effusion.8
History. Patients may report fever (46% in one small study of 69 patients) or a recent history of respiratory or gastrointestinal infection (40%).5 Most patients will report pleuritic chest pain. Typically, the pain is improved when sitting up and leaning forward, and gets worse when lying supine.4 Pain might radiate to the trapezius muscle ridge due to the common phrenic nerve innervation of pericardium and trapezius.9 However, pain might be minimal or absent in patients with uremic, neoplastic, tuberculous, or post-irradiation pericarditis.
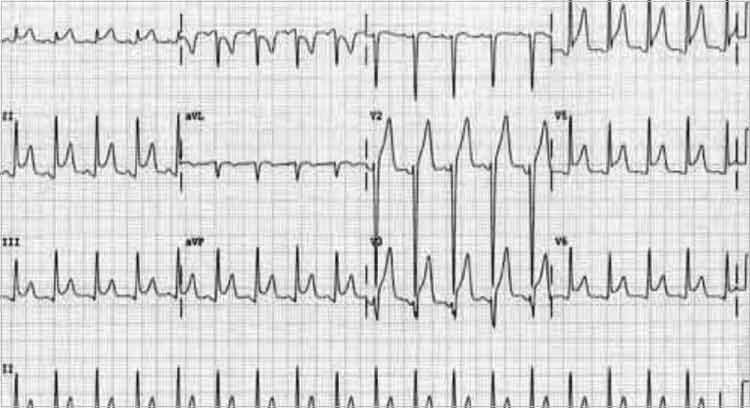
Physical exam. A pericardial friction rub is nearly 100% specific for a pericarditis diagnosis, but sensitivity can vary (16% to 85%) depending on the frequency of auscultation and underlying etiology.2,5 It is thought to be caused by friction between the parietal and visceral layers of inflamed pericardium. A pericardial rub classically is described as a superficial, high-pitched, scratchy, or squeaking sound best heard with the diaphragm of the stethoscope at the lower left sternal border with the patient leaning forward.
Laboratory data. A complete blood count, metabolic panel, and cardiac enzymes should be checked in all patients with suspected acute pericarditis. Troponin values are elevated in up to one-third of patients, indicating cardiac muscle injury or myopericarditis, but have not been shown to adversely impact hospital length of stay, readmission, or complication rates.5,10 Markers of inflammation (e.g. erythrocyte sedimentation rate or C-reactive protein) are frequently elevated but do not point to a specific underlying etiology. Routine viral cultures and antibody titers are not useful.11
Most cases of pericarditis are presumed idiopathic (viral); however, finding a specific etiology should be considered in patients who do not respond after one week of therapy. Anti-nuclear antibody, complement levels, and rheumatoid factor can serve as screening tests for autoimmune disease. Purified protein derivative or quantiferon testing and HIV testing might be indicated in patients with appropriate risk factors. In cases of suspected tuberculous or neoplastic pericarditis, pericardial fluid analysis and biopsy could be warranted.
Electrocardiography. The EKG is the most useful test in diagnosing acute pericarditis. EKG changes in acute pericarditis can progress over four stages:
- Stage 1: diffuse ST elevations with or without PR depressions, initially;
- Stage 2: normalization of ST and PR segments, typically after several days;
- Stage 3: diffuse T-wave inversions; and
- Stage 4: normalization of T-waves, typically after weeks or months.
While all four stages are unlikely to be present in a given case, 80% of patients with pericarditis will demonstrate diffuse ST-segment elevations and PR-segment depression (see Figure 2, above).12
Table 3 lists EKG features helpful in differentiating acute pericarditis from acute myocardial infarction.
Chest radiography. Because a pericardial effusion often accompanies pericarditis, a chest radiograph (CXR) should be performed in all suspected cases. The CXR might show enlargement of the cardiac silhouette if more than 250 ml of pericardial fluid is present.3 A CXR also is helpful to diagnose concomitant pulmonary infection, pleural effusion, or mediastinal mass—all findings that could point to an underlying specific etiology of pericarditis and/or pericardial effusion.
Echocardiography. An echocardiogram should be performed in all patients with suspected pericarditis to detect effusion, associated myocardial, or paracardial disease.13 The echocardiogram frequently is normal but could show an effusion in 60%, and tamponade (see Figure 1, p. 15) in 5%, of cases.4
Computed tomography (CT) and cardiac magnetic resonance imaging (CMR).CT or CMR are the imaging modalities of choice when an echocardiogram is inconclusive or in cases of pericarditis complicated by a hemorrhagic or localized effusion, pericardial thickening, or pericardial mass.14 They also help in precise imaging of neighboring structures, such as lungs or mediastinum.
Pericardial fluid analysis and pericardial biopsy. In cases of refractory pericarditis with effusion, pericardial fluid analysis might provide clues to the underlying etiology. Routine chemistry, cell count, gram and acid fast staining, culture, and cytology should be sent. In addition, acid-fast bacillus staining and culture, adenosine deaminase, and interferon-gamma testing should be ordered when tuberculous pericarditis is suspected. A pericardial biopsy may show granulomas or neoplastic cells. Overall, pericardial fluid analysis and biopsy reveal a diagnosis in roughly 20% of cases.11
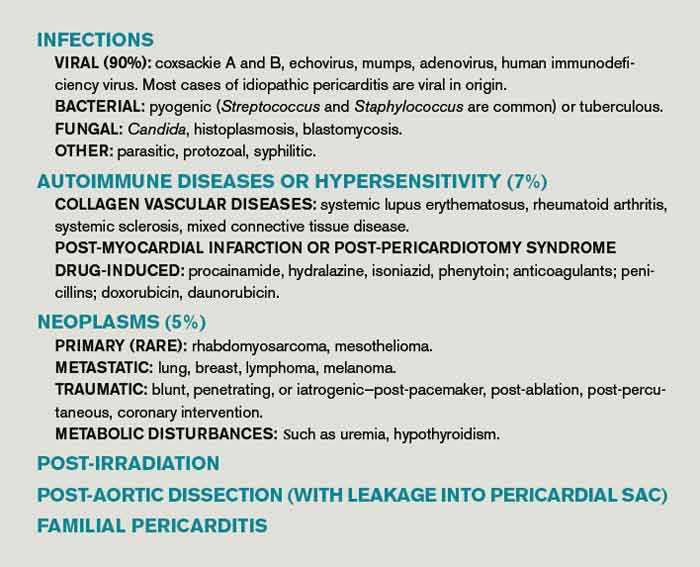
How is acute pericarditis treated?
Most cases of uncomplicated acute pericarditis are viral and respond well to NSAID plus colchicine therapy.2,4 Failure to respond to NSAIDs plus colchicine—evidenced by persistent fever, pericardial chest pain, new pericardial effusion, or worsening of general illness—within a week of treatment should prompt a search for an underlying systemic illness. If found, treatment should be aimed at the causative illness.
Bacterial pericarditis usually requires surgical drainage in addition to treatment with appropriate antibiotics.11 Tuberculous pericarditis is treated with multidrug therapy; when underlying HIV is present, patients should receive highly active anti-retroviral therapy as well. Steroids and immunosuppressants should be considered in addition to NSAIDs and colchicine in autoimmune pericarditis.10 Neoplastic pericarditis may resolve with chemotherapy but it has a high recurrence rate.13 Uremic pericarditis requires intensified dialysis.
Treatment options for uncomplicated idiopathic or viral pericarditis include:
NSAIDs. It is important to adequately dose NSAIDs when treating acute pericarditis. Initial treatment options include ibuprofen (1,600 to 3,200 mg daily), indomethacin (75 to 150 mg daily) or aspirin (2 to 4 gm daily) for one week.11,15 Aspirin is preferred in patients with ischemic heart disease. For patients with symptoms that persist longer than a week, NSAIDS may be continued, but investigation for an underlying etiology is indicated. Concomitant proton-pump-inhibitor therapy should be considered in patients at high risk for peptic ulcer disease to minimize gastric side effects.
Colchicine. Colchicine has a favorable risk-benefit profile as an adjunct treatment for acute and recurrent pericarditis. Patients experience better symptom relief when treated with both colchicine and an NSAID, compared with NSAIDs alone (88% versus 63%). Recurrence rates are lower with combined therapy (11% versus 32%).16 Colchicine treatment (0.6 mg twice daily after a loading dose of up to 2 mg) is recommended for several months to greater than one year.13,16,17
Glucocorticoids. Routine glucocorticoid use should be avoided in the treatment of acute pericarditis, as it has been associated with an increased risk for recurrence (OR 4.3).16,18 Glucocorticoid use should be considered in cases of pericarditis refractory to NSAIDs and colchicine, cases in which NSAIDs and or colchicine are contraindicated, and in autoimmune or connective-tissue-disease-related pericarditis. Prednisone should be dosed up to 1 mg/kg/day for at least one month, depending on symptom resolution, then tapered after either NSAIDs or colchicine have been started.13 Smaller prednisone doses of up to 0.5 mg/kg/day could be as effective, with the added benefit of reduced side effects and recurrences.19
Invasive treatment. Pericardiocentesis and/or pericardiectomy should be considered when pericarditis is complicated by a large effusion or tamponade, constrictive physiology, or recurrent effusion.11 Pericardiocentesis is the least invasive option and helps provide immediate relief in cases of tamponade or large symptomatic effusions. It is the preferred modality for obtaining pericardial fluid for diagnostic analysis. However, effusions can recur and in those cases pericardial window is preferred, as it provides continued outflow of pericardial fluid. Pericardiectomy is recommended in cases of symptomatic constrictive pericarditis unresponsive to medical therapy.15
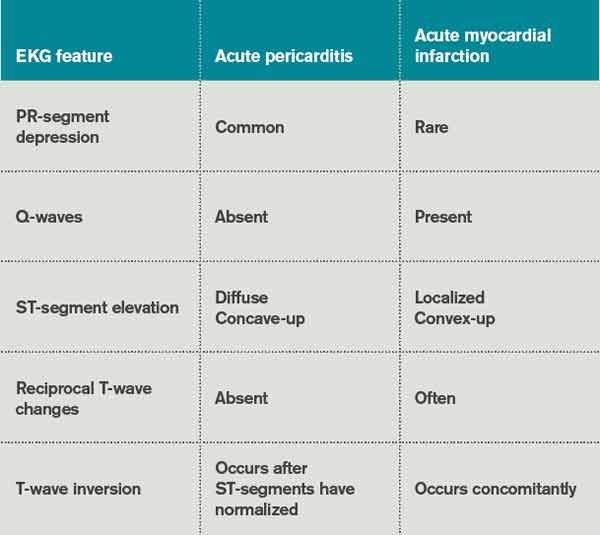
Back to the Case
The patient’s presentation—prodrome followed by fever and pleuritic chest pain—is characteristic of acute idiopathic pericarditis. No pericardial rub was heard, but EKG findings were typical. Troponin I elevation suggested underlying myopericarditis. An echocardiogram was unremarkable. Given the likely viral or idiopathic etiology, no further diagnostic tests were ordered to explore the possibility of an underlying systemic illness.
The patient was started on ibuprofen 600 mg every eight hours. She had significant relief of her symptoms within two days. A routine fever workup was negative. She was discharged the following day.
The patient was readmitted three months later with recurrent pleuritic chest pain, which did not improve with resumption of NSAID therapy. Initial troponin I was 0.22 ng/ml, electrocardiogram was unchanged, and an echocardiogram showed small effusion. She was started on ibuprofen 800 mg every eight hours, as well as colchicine 0.6 mg twice daily. Her symptoms resolved the next day and she was discharged with prescriptions for ibuprofen and colchicine. She was instructed to follow up with a primary-care doctor in one week.
At the clinic visit, ibuprofen was tapered but colchicine was continued for another six months. She remained asymptomatic at her six-month clinic follow-up.
Bottom Line
Acute pericarditis is a clinical diagnosis supported by EKG findings. Most cases are idiopathic or viral, and can be treated successfully with NSAIDs and colchicine. For cases that do not respond to initial therapy, or cases that present with high-risk features, a specific etiology should be sought.
Dr. Southern is chief of the division of hospital medicine at Montefiore Medical Center in Bronx, N.Y. Dr. Galhorta is an instructor and Drs. Martin, Korcak, and Stehlihova are assistant professors in the department of medicine at Albert Einstein.
References
- Lange RA, Hillis LD. Clinical practice. Acute pericarditis. N Engl J Med. 2004;351:2195-2202.
- Zayas R, Anguita M, Torres F, et al. Incidence of specific etiology and role of methods for specific etiologic diagnosis of primary acute pericarditis. Am J Cardiol. 1995;75:378-382.
- Troughton RW, Asher CR, Klein AL. Pericarditis. Lancet. 2004;363:717-727.
- Imazio M, Demichelis B, Parrini I, et al. Day-hospital treatment of acute pericarditis: a management program for outpatient therapy. J Am Coll Cardiol. 2004;43:1042-1046.
- Bonnefoy E, Godon P, Kirkorian G, et al. Serum cardiac troponin I and ST-segment elevation in patients with acute pericarditis. Eur Heart J. 2000;21:832-836.
- Salisbury AC, Olalla-Gomez C, Rihal CS, et al. Frequency and predictors of urgent coronary angiography in patients with acute pericarditis. Mayo Clin Proc. 2009;84(1):11-15.
- Imazio M, Cecchi E, Demichelis B, et al. Indicators of poor prognosis of acute pericarditis. Circulation. 2007;115:2739-2744.
- Imazio M, Spodick DH, Brucato A, et al. Diagnostic issues in the clinical management of pericarditis. Int J Clin Pract. 2010;64(10):1384-1392.
- Spodick DH. Acute pericarditis: current concepts and practice. JAMA. 2003;289:1150-1153.
- Imazio M, Demichelis B, Cecchi E. Cardiac troponin I in acute pericarditis. J Am Coll Cardiol. 2003;42(12):2144-2148.
- Sagristà Sauleda J, Permanyer Miralda G, Soler Soler J. Diagnosis and management of pericardial syndromes. Rev Esp Cardiol. 2005;58(7):830-841.
- Bruce MA, Spodick DH. Atypical electrocardiogram in acute pericarditis: characteristics and prevalence. J Electrocardiol. 1980;13:61-66.
- Maisch B, Seferovic PM, Ristic AD, et al. Guidelines on the diagnosis and management of pericardial diseases executive summary; the task force on the diagnosis and management of pericardial diseases of the European Society of Cardiology. Eur Heart J. 2004; 25(7):587-610.
- Verhaert D, Gabriel RS, Johnston D, et al. The role of multimodality imaging in the management of pericardial disease. Circ Cardiovasc Imaging. 2010;3:333-343.
- Imazio M, Spodick DH, Brucato A, et al. Controversial issues in the management of pericardial diseases. Circulation. 2010;121:916-928.
- Imazio M, Bobbio M, Cecchi E, et al. Colchicine in addition to conventional therapy for acute pericarditis: results of the colchicine for acute pericarditis (COPE) trial. Circulation. 2005;112(13):2012-2016.
- Adler Y, Finkelstein Y, Guindo J, et al. Colchicine treatment for recurrent pericarditis: a decade of experience. Circulation. 1998;97:2183-185.
- Imazio M, Bobbio M, Cecchi E, et al. Colchicine as first-choice therapy for recurrent pericarditis: results of the colchicine for recurrent pericarditis (CORE) trial. Arch Intern Med. 2005;165:1987-1991.
- Imazio M, Brucato A, Cumetti D, et al. Corticosteroids for recurrent pericarditis: high versus low doses: a nonrandomized observation. Circulation. 2008;118:667-771.
Case
A 32-year-old female with no significant past medical history is evaluated for sharp, left-sided chest pain for five days. Her pain is intermittent, worse with deep inspiration and in the supine position. She denies any shortness of breath. Her temperature is 100.8ºF, but otherwise her vital signs are normal. The physical exam and chest radiograph are unremarkable, but an electrocardiogram shows diffuse ST-segment elevations. The initial troponin is mildly elevated at 0.35 ng/ml.
Could this patient have acute pericarditis? If so, how should she be managed?
Background
Pericarditis is the most common pericardial disease encountered by hospitalists. As many as 5% of chest pain cases unattributable to myocardial infarction (MI) are diagnosed with pericarditis.1 In immunocompetent individuals, as many as 90% of acute pericarditis cases are viral or idiopathic in etiology.1,2 Human immunodeficiency virus (HIV) and tuberculosis are common culprits in developing countries and immunocompromised hosts.3 Other specific etiologies of acute pericarditis include autoimmune diseases, neoplasms, chest irradiation, trauma, and metabolic disturbances (e.g. uremia). An etiologic classification of acute pericarditis is shown in Table 2 (p. 16).
Pericarditis primarily is a clinical diagnosis. Most patients present with chest pain.4 A pericardial friction rub may or may not be heard (sensitivity 16% to 85%), but when present is nearly 100% specific for pericarditis.2,5 Diffuse ST-segment elevation on electrocardiogram (EKG) is present in 60% to 90% of cases, but it can be difficult to differentiate from ST-segment elevations in acute MI.4,6
Uncomplicated acute pericarditis often is treated successfully as an outpatient.4 However, patients with high-risk features (see Table 1, right) should be hospitalized for identification and treatment of specific underlying etiology and for monitoring of complications, such as tamponade.7
Our patient has features consistent with pericarditis. In the following sections, we will review the diagnosis and treatment of acute pericarditis.
Review of the Data
How is acute pericarditis diagnosed?
Acute pericarditis is a clinical diagnosis supported by EKG and echocardiogram. At least two of the following four criteria must be present for the diagnosis: pleuritic chest pain, pericardial rub, diffuse ST-segment elevation on EKG, and pericardial effusion.8
History. Patients may report fever (46% in one small study of 69 patients) or a recent history of respiratory or gastrointestinal infection (40%).5 Most patients will report pleuritic chest pain. Typically, the pain is improved when sitting up and leaning forward, and gets worse when lying supine.4 Pain might radiate to the trapezius muscle ridge due to the common phrenic nerve innervation of pericardium and trapezius.9 However, pain might be minimal or absent in patients with uremic, neoplastic, tuberculous, or post-irradiation pericarditis.
Physical exam. A pericardial friction rub is nearly 100% specific for a pericarditis diagnosis, but sensitivity can vary (16% to 85%) depending on the frequency of auscultation and underlying etiology.2,5 It is thought to be caused by friction between the parietal and visceral layers of inflamed pericardium. A pericardial rub classically is described as a superficial, high-pitched, scratchy, or squeaking sound best heard with the diaphragm of the stethoscope at the lower left sternal border with the patient leaning forward.
Laboratory data. A complete blood count, metabolic panel, and cardiac enzymes should be checked in all patients with suspected acute pericarditis. Troponin values are elevated in up to one-third of patients, indicating cardiac muscle injury or myopericarditis, but have not been shown to adversely impact hospital length of stay, readmission, or complication rates.5,10 Markers of inflammation (e.g. erythrocyte sedimentation rate or C-reactive protein) are frequently elevated but do not point to a specific underlying etiology. Routine viral cultures and antibody titers are not useful.11
Most cases of pericarditis are presumed idiopathic (viral); however, finding a specific etiology should be considered in patients who do not respond after one week of therapy. Anti-nuclear antibody, complement levels, and rheumatoid factor can serve as screening tests for autoimmune disease. Purified protein derivative or quantiferon testing and HIV testing might be indicated in patients with appropriate risk factors. In cases of suspected tuberculous or neoplastic pericarditis, pericardial fluid analysis and biopsy could be warranted.
Electrocardiography. The EKG is the most useful test in diagnosing acute pericarditis. EKG changes in acute pericarditis can progress over four stages:
- Stage 1: diffuse ST elevations with or without PR depressions, initially;
- Stage 2: normalization of ST and PR segments, typically after several days;
- Stage 3: diffuse T-wave inversions; and
- Stage 4: normalization of T-waves, typically after weeks or months.
While all four stages are unlikely to be present in a given case, 80% of patients with pericarditis will demonstrate diffuse ST-segment elevations and PR-segment depression (see Figure 2, above).12
Table 3 lists EKG features helpful in differentiating acute pericarditis from acute myocardial infarction.
Chest radiography. Because a pericardial effusion often accompanies pericarditis, a chest radiograph (CXR) should be performed in all suspected cases. The CXR might show enlargement of the cardiac silhouette if more than 250 ml of pericardial fluid is present.3 A CXR also is helpful to diagnose concomitant pulmonary infection, pleural effusion, or mediastinal mass—all findings that could point to an underlying specific etiology of pericarditis and/or pericardial effusion.
Echocardiography. An echocardiogram should be performed in all patients with suspected pericarditis to detect effusion, associated myocardial, or paracardial disease.13 The echocardiogram frequently is normal but could show an effusion in 60%, and tamponade (see Figure 1, p. 15) in 5%, of cases.4
Computed tomography (CT) and cardiac magnetic resonance imaging (CMR).CT or CMR are the imaging modalities of choice when an echocardiogram is inconclusive or in cases of pericarditis complicated by a hemorrhagic or localized effusion, pericardial thickening, or pericardial mass.14 They also help in precise imaging of neighboring structures, such as lungs or mediastinum.
Pericardial fluid analysis and pericardial biopsy. In cases of refractory pericarditis with effusion, pericardial fluid analysis might provide clues to the underlying etiology. Routine chemistry, cell count, gram and acid fast staining, culture, and cytology should be sent. In addition, acid-fast bacillus staining and culture, adenosine deaminase, and interferon-gamma testing should be ordered when tuberculous pericarditis is suspected. A pericardial biopsy may show granulomas or neoplastic cells. Overall, pericardial fluid analysis and biopsy reveal a diagnosis in roughly 20% of cases.11
How is acute pericarditis treated?
Most cases of uncomplicated acute pericarditis are viral and respond well to NSAID plus colchicine therapy.2,4 Failure to respond to NSAIDs plus colchicine—evidenced by persistent fever, pericardial chest pain, new pericardial effusion, or worsening of general illness—within a week of treatment should prompt a search for an underlying systemic illness. If found, treatment should be aimed at the causative illness.
Bacterial pericarditis usually requires surgical drainage in addition to treatment with appropriate antibiotics.11 Tuberculous pericarditis is treated with multidrug therapy; when underlying HIV is present, patients should receive highly active anti-retroviral therapy as well. Steroids and immunosuppressants should be considered in addition to NSAIDs and colchicine in autoimmune pericarditis.10 Neoplastic pericarditis may resolve with chemotherapy but it has a high recurrence rate.13 Uremic pericarditis requires intensified dialysis.
Treatment options for uncomplicated idiopathic or viral pericarditis include:
NSAIDs. It is important to adequately dose NSAIDs when treating acute pericarditis. Initial treatment options include ibuprofen (1,600 to 3,200 mg daily), indomethacin (75 to 150 mg daily) or aspirin (2 to 4 gm daily) for one week.11,15 Aspirin is preferred in patients with ischemic heart disease. For patients with symptoms that persist longer than a week, NSAIDS may be continued, but investigation for an underlying etiology is indicated. Concomitant proton-pump-inhibitor therapy should be considered in patients at high risk for peptic ulcer disease to minimize gastric side effects.
Colchicine. Colchicine has a favorable risk-benefit profile as an adjunct treatment for acute and recurrent pericarditis. Patients experience better symptom relief when treated with both colchicine and an NSAID, compared with NSAIDs alone (88% versus 63%). Recurrence rates are lower with combined therapy (11% versus 32%).16 Colchicine treatment (0.6 mg twice daily after a loading dose of up to 2 mg) is recommended for several months to greater than one year.13,16,17
Glucocorticoids. Routine glucocorticoid use should be avoided in the treatment of acute pericarditis, as it has been associated with an increased risk for recurrence (OR 4.3).16,18 Glucocorticoid use should be considered in cases of pericarditis refractory to NSAIDs and colchicine, cases in which NSAIDs and or colchicine are contraindicated, and in autoimmune or connective-tissue-disease-related pericarditis. Prednisone should be dosed up to 1 mg/kg/day for at least one month, depending on symptom resolution, then tapered after either NSAIDs or colchicine have been started.13 Smaller prednisone doses of up to 0.5 mg/kg/day could be as effective, with the added benefit of reduced side effects and recurrences.19
Invasive treatment. Pericardiocentesis and/or pericardiectomy should be considered when pericarditis is complicated by a large effusion or tamponade, constrictive physiology, or recurrent effusion.11 Pericardiocentesis is the least invasive option and helps provide immediate relief in cases of tamponade or large symptomatic effusions. It is the preferred modality for obtaining pericardial fluid for diagnostic analysis. However, effusions can recur and in those cases pericardial window is preferred, as it provides continued outflow of pericardial fluid. Pericardiectomy is recommended in cases of symptomatic constrictive pericarditis unresponsive to medical therapy.15
Back to the Case
The patient’s presentation—prodrome followed by fever and pleuritic chest pain—is characteristic of acute idiopathic pericarditis. No pericardial rub was heard, but EKG findings were typical. Troponin I elevation suggested underlying myopericarditis. An echocardiogram was unremarkable. Given the likely viral or idiopathic etiology, no further diagnostic tests were ordered to explore the possibility of an underlying systemic illness.
The patient was started on ibuprofen 600 mg every eight hours. She had significant relief of her symptoms within two days. A routine fever workup was negative. She was discharged the following day.
The patient was readmitted three months later with recurrent pleuritic chest pain, which did not improve with resumption of NSAID therapy. Initial troponin I was 0.22 ng/ml, electrocardiogram was unchanged, and an echocardiogram showed small effusion. She was started on ibuprofen 800 mg every eight hours, as well as colchicine 0.6 mg twice daily. Her symptoms resolved the next day and she was discharged with prescriptions for ibuprofen and colchicine. She was instructed to follow up with a primary-care doctor in one week.
At the clinic visit, ibuprofen was tapered but colchicine was continued for another six months. She remained asymptomatic at her six-month clinic follow-up.
Bottom Line
Acute pericarditis is a clinical diagnosis supported by EKG findings. Most cases are idiopathic or viral, and can be treated successfully with NSAIDs and colchicine. For cases that do not respond to initial therapy, or cases that present with high-risk features, a specific etiology should be sought.
Dr. Southern is chief of the division of hospital medicine at Montefiore Medical Center in Bronx, N.Y. Dr. Galhorta is an instructor and Drs. Martin, Korcak, and Stehlihova are assistant professors in the department of medicine at Albert Einstein.
References
- Lange RA, Hillis LD. Clinical practice. Acute pericarditis. N Engl J Med. 2004;351:2195-2202.
- Zayas R, Anguita M, Torres F, et al. Incidence of specific etiology and role of methods for specific etiologic diagnosis of primary acute pericarditis. Am J Cardiol. 1995;75:378-382.
- Troughton RW, Asher CR, Klein AL. Pericarditis. Lancet. 2004;363:717-727.
- Imazio M, Demichelis B, Parrini I, et al. Day-hospital treatment of acute pericarditis: a management program for outpatient therapy. J Am Coll Cardiol. 2004;43:1042-1046.
- Bonnefoy E, Godon P, Kirkorian G, et al. Serum cardiac troponin I and ST-segment elevation in patients with acute pericarditis. Eur Heart J. 2000;21:832-836.
- Salisbury AC, Olalla-Gomez C, Rihal CS, et al. Frequency and predictors of urgent coronary angiography in patients with acute pericarditis. Mayo Clin Proc. 2009;84(1):11-15.
- Imazio M, Cecchi E, Demichelis B, et al. Indicators of poor prognosis of acute pericarditis. Circulation. 2007;115:2739-2744.
- Imazio M, Spodick DH, Brucato A, et al. Diagnostic issues in the clinical management of pericarditis. Int J Clin Pract. 2010;64(10):1384-1392.
- Spodick DH. Acute pericarditis: current concepts and practice. JAMA. 2003;289:1150-1153.
- Imazio M, Demichelis B, Cecchi E. Cardiac troponin I in acute pericarditis. J Am Coll Cardiol. 2003;42(12):2144-2148.
- Sagristà Sauleda J, Permanyer Miralda G, Soler Soler J. Diagnosis and management of pericardial syndromes. Rev Esp Cardiol. 2005;58(7):830-841.
- Bruce MA, Spodick DH. Atypical electrocardiogram in acute pericarditis: characteristics and prevalence. J Electrocardiol. 1980;13:61-66.
- Maisch B, Seferovic PM, Ristic AD, et al. Guidelines on the diagnosis and management of pericardial diseases executive summary; the task force on the diagnosis and management of pericardial diseases of the European Society of Cardiology. Eur Heart J. 2004; 25(7):587-610.
- Verhaert D, Gabriel RS, Johnston D, et al. The role of multimodality imaging in the management of pericardial disease. Circ Cardiovasc Imaging. 2010;3:333-343.
- Imazio M, Spodick DH, Brucato A, et al. Controversial issues in the management of pericardial diseases. Circulation. 2010;121:916-928.
- Imazio M, Bobbio M, Cecchi E, et al. Colchicine in addition to conventional therapy for acute pericarditis: results of the colchicine for acute pericarditis (COPE) trial. Circulation. 2005;112(13):2012-2016.
- Adler Y, Finkelstein Y, Guindo J, et al. Colchicine treatment for recurrent pericarditis: a decade of experience. Circulation. 1998;97:2183-185.
- Imazio M, Bobbio M, Cecchi E, et al. Colchicine as first-choice therapy for recurrent pericarditis: results of the colchicine for recurrent pericarditis (CORE) trial. Arch Intern Med. 2005;165:1987-1991.
- Imazio M, Brucato A, Cumetti D, et al. Corticosteroids for recurrent pericarditis: high versus low doses: a nonrandomized observation. Circulation. 2008;118:667-771.
Surprise patients with the truth about pain and aging

Healthcare Quality Accounting Metrics Need Improvement

—Gregg Meyer, MD, MSc, chief clinical officer and executive vice president for population health for the Dartmouth-Hitchcock Health System in Lebanon, N.H.
As healthcare quality reporting continues to evolve in this era of value-based purchasing (VBP), players on both the giving and receiving ends of performance incentives agree on the need to improve the accountability metrics with which providers are measured, ranked, rewarded, and penalized. Many of the measures currently in use—e.g., Centers for Medicare & Medicaid Services’ (CMS) core process measures and patient satisfaction ratings, the gross outcome metrics of mortality, infection, and readmission rates—are blunt instruments in need of refinement.
Entities such as the National Quality Forum (NQF), the American Medical Association’s Physician Consortium for Performance Improvement (PCPI), and the National Quality Measures Clearinghouse (NQMC) recognize the need to develop and endorse more timely, credible, and patient-centered outcome metrics. Largely missing from the current crop of outcome measure sets is a meaningful account of the patient’s perspective.
Enter patient-reported outcomes (PROs), defined as “any report of the status of a patient’s health condition that comes directly from the patient, without interpretation of the patient’s response by a clinician or anyone else.”1 PRO tools “measure what patients are able to do and how they feel by asking questions” (see “Types of Patient-Reported Outcomes [PROs],” p. 19).
If successfully adapted for public reporting on a wide scale, PROs could become the next evolutionary step in healthcare quality reporting, integrating health status and patient experience data into outcome metrics that truly matter to patients. They could enable a richer understanding of their clinical experiences and responses to therapy, and help providers target necessary improvements with greater precision.
“As a provider, I care about my patients not developing infections, getting the right medications, and not being readmitted. Patients, however, have a different set of priorities around issues like ‘How quickly will I be able to return to work? When will I be able to chase my grandkids around the yard? How much is this care going to cost me out of pocket?’” says healthcare quality expert Gregg Meyer, MD, MSc, chief clinical officer and executive vice president for population health for the Dartmouth-Hitchcock Health System in Lebanon, N.H. “This next generation of accountability will allow us to move from being provider- and payor-centered to becoming truly patient-centered, and will serve as a key reminder that patients are no longer passive participants. They are key partners, in both the delivery of care and the measurement of that care.”
The idea of PROs is one whose “time has finally arrived,” according to medical outcomes researcher David Cella, PhD, professor and chair of the Department of Medical Social Sciences at Northwestern University Feinberg School of Medicine in Chicago.
“The case for inclusion of outcomes that matter most to patients, like the effect of treatment upon their symptoms, function, and overall well-being, has always been compelling as an ideal to strive toward,” Cella adds. “PROs can and should be considered as true treatment outcome measures, and their ability to capture quality information efficiently make them well-suited for this role.”
The FDA even permits PROs (i.e. pain, anxiety, depression, sleep, and physical and social functioning) to be used as experimental endpoints for clinical trials to support claims in medical product labeling.2
The Patient Voice
The Department Health and Human Services (HHS) is searching for ways to fill current gaps in outcome measures, and has funded a patient outcomes project by the NQF to help ramp up patient-focused measure development activities within the federal government. In a recent report stemming from that project, the NQF states: “The patient’s voice is not readily captured in traditional health records and data systems, yet the beneficiary of healthcare services is often in the best position to evaluate the effectiveness of those services.”3
The NQF also is conducting foundational work to evaluate the most promising and viable PROs for quality measurement use and methodological issues involved in collecting and aggregating PRO data for provider performance assessment, says Helen Burstin, MD, MPH, NQF’s senior vice president for performance measures.
“PROs provide the opportunity to hear about the outcome of a clinician’s intervention directly from the patient—for example, visual improvement after cataract surgery, relief from nausea after chemotherapy, and mobility enhancement and pain relief after a hip or knee replacement,” she says. “The goal is to develop reliable and valid PRO performance measures that are applicable across multiple settings of care and/or multiple conditions, which the NQF can endorse for accountability and quality-improvement purposes.”
Specific NQF recommendations regarding PROs and performance measurement are expected to be available for review and comment this month, with a 30-day public and member comment period.

A wide variety of patient-level instruments to measure PROs have been used for clinical research purposes, many of which have been evaluated and catalogued within a system of assessment tools known as the National Institutes of Health’s (NIH) Patient-Reported Outcome Measurement Information System (PROMIS), Dr. Burstin says. PROMIS questionnaires prompt patients to measure such outcomes as how much difficulty they experience when walking a block on flat ground, getting in and out of bed, or doing strenuous activities, such as bicycling or jogging. NIH-funded studies using PROMIS tools are taking place at 12 sites across the country (http://nihpromis.org/default).
“PROMIS provides two distinct advantages to the PRO performance metric landscape,” argues Cella, who is principal investigator of the Statistical Center for PROMIS. “It has a computerized adaptive testing option, so efficient and accurate assessment is now possible at the individual patient level, with just a few questions per area. It also standardizes its scoring and reporting, such that many other similar measures can be used and their scores reported on a common, PROMIS metric.”
HM Applications
“The voice of the clinician is also needed during this PRO development process,” Dr. Burstin says. “We welcome hospitalists to engage in our projects and weigh in about the most meaningful and actionable patient outcomes that are relevant to their practice.”
“Taking PROs and applying them to hospital medicine is really doable if you take into account the lessons learned from providers who have already used PROs successfully in clinical settings,” says Pat Courneya, MD, medical director for HealthPartners Health Plan in Minnesota.
HealthPartners recently began using PROs in a quality measurement and reward program, offering financial bonuses to physical therapists who achieve a high PRO score relative to resource use (number of PT sessions required). “Having objective PRO measurements allows clinicians to create benchmarks for their patients regarding how much functional improvement they expect to achieve, and how many PT sessions are required to achieve that degree of improvement,” Dr. Courneya says. Using an interactive, Web-based PRO assessment tool, the program has helped tailor care to the expectations of patients while also significantly reducing the overall number of PT visits, especially by medically complex, post-operative patients.
HealthPartners has successfully used PROs as part of an innovative care model for managing patients with depression. At the outset of treatment, patients are administered the PHQ-9, a nine-item patient health questionnaire designed to assess depression symptoms and functional impairment, and derive a severity score. Patients receive care by a team composed of a primary-care physician, a care manager, and a consulting psychiatrist, after which their degree of symptom improvement is again measured. With this program, HealthPartners has achieved significantly more patients with depression into remission by six months compared with typical primary-care treatment, Dr. Courneya says. This model of care has since garnered a CMS Innovation Grant, managed by the HealthPartners Institute for Education and Research and directed by Minnesota’s Institute for Clinical Systems Improvement, aimed at spreading the model to five other states.

“PROs are potentially as useful for hospital medicine as for any other type of medical practice,” says Shaun Frost, MD, SFHM, SHM president and associate medical director of care delivery systems for HealthPartners Health Plan. “There is a big opportunity for hospitalists to incorporate shared decision-making to learn patients’ preferences, such as expectations of when they will be discharged, and understanding of therapeutic options.”
Peri-surgical care is a particularly important opportunity for hospitalists to demonstrate their value by leveraging PROs, according to Dr. Frost. “Patients sometimes come to the table with unrealistic prior expectations that physicians can make pain go away completely. We need to clarify their expectations preoperatively, when we meet them for the very first time, so that they establish a realistic baseline,” he says. “We then need to have a diligent conversation with them immediately after their operation to discuss their pain-management goals, a realistic physical therapy schedule, and post-discharge expectations.”
By clearly understanding patient objectives, hospitalists can “adjust the therapy they’re getting to their expectations, maximizing its effectiveness while minimizing delays in care and transitions to other care settings,” Dr. Frost says.
Chris Guadagnino is a freelance medical writer in Philadelphia.
References
- National Quality Forum. Patient-reported outcomes. National Quality Forum website. Available at: http://www.qualityforum.org/Projects/n-r/Patient-Reported_Outcomes/Patient-Reported_Outcomes.aspx. Accessed Oct. 2, 2012.
- U.S. Food and Drug Administration. The Patient-Reported Outcomes Consortium. U.S. Food and Drug Administration website. Available at: http://www.fda.gov/AboutFDA/PartnershipsCollaborations/PublicPrivatePartnershipProgram/ucm231129.htm. Accessed Oct. 2, 2012.
- National Quality Forum. National voluntary consensus standards for patient outcomes 2009.National Quality Forum website. Available at: http://www.qualityforum.org/Publications/2011/07/National_Voluntary_Consensus_Standards_for_Patient_Outcomes_2009.aspx. Accessed Oct. 2, 2012.
—Gregg Meyer, MD, MSc, chief clinical officer and executive vice president for population health for the Dartmouth-Hitchcock Health System in Lebanon, N.H.
As healthcare quality reporting continues to evolve in this era of value-based purchasing (VBP), players on both the giving and receiving ends of performance incentives agree on the need to improve the accountability metrics with which providers are measured, ranked, rewarded, and penalized. Many of the measures currently in use—e.g., Centers for Medicare & Medicaid Services’ (CMS) core process measures and patient satisfaction ratings, the gross outcome metrics of mortality, infection, and readmission rates—are blunt instruments in need of refinement.
Entities such as the National Quality Forum (NQF), the American Medical Association’s Physician Consortium for Performance Improvement (PCPI), and the National Quality Measures Clearinghouse (NQMC) recognize the need to develop and endorse more timely, credible, and patient-centered outcome metrics. Largely missing from the current crop of outcome measure sets is a meaningful account of the patient’s perspective.
Enter patient-reported outcomes (PROs), defined as “any report of the status of a patient’s health condition that comes directly from the patient, without interpretation of the patient’s response by a clinician or anyone else.”1 PRO tools “measure what patients are able to do and how they feel by asking questions” (see “Types of Patient-Reported Outcomes [PROs],” p. 19).
If successfully adapted for public reporting on a wide scale, PROs could become the next evolutionary step in healthcare quality reporting, integrating health status and patient experience data into outcome metrics that truly matter to patients. They could enable a richer understanding of their clinical experiences and responses to therapy, and help providers target necessary improvements with greater precision.
“As a provider, I care about my patients not developing infections, getting the right medications, and not being readmitted. Patients, however, have a different set of priorities around issues like ‘How quickly will I be able to return to work? When will I be able to chase my grandkids around the yard? How much is this care going to cost me out of pocket?’” says healthcare quality expert Gregg Meyer, MD, MSc, chief clinical officer and executive vice president for population health for the Dartmouth-Hitchcock Health System in Lebanon, N.H. “This next generation of accountability will allow us to move from being provider- and payor-centered to becoming truly patient-centered, and will serve as a key reminder that patients are no longer passive participants. They are key partners, in both the delivery of care and the measurement of that care.”
The idea of PROs is one whose “time has finally arrived,” according to medical outcomes researcher David Cella, PhD, professor and chair of the Department of Medical Social Sciences at Northwestern University Feinberg School of Medicine in Chicago.
“The case for inclusion of outcomes that matter most to patients, like the effect of treatment upon their symptoms, function, and overall well-being, has always been compelling as an ideal to strive toward,” Cella adds. “PROs can and should be considered as true treatment outcome measures, and their ability to capture quality information efficiently make them well-suited for this role.”
The FDA even permits PROs (i.e. pain, anxiety, depression, sleep, and physical and social functioning) to be used as experimental endpoints for clinical trials to support claims in medical product labeling.2
The Patient Voice
The Department Health and Human Services (HHS) is searching for ways to fill current gaps in outcome measures, and has funded a patient outcomes project by the NQF to help ramp up patient-focused measure development activities within the federal government. In a recent report stemming from that project, the NQF states: “The patient’s voice is not readily captured in traditional health records and data systems, yet the beneficiary of healthcare services is often in the best position to evaluate the effectiveness of those services.”3
The NQF also is conducting foundational work to evaluate the most promising and viable PROs for quality measurement use and methodological issues involved in collecting and aggregating PRO data for provider performance assessment, says Helen Burstin, MD, MPH, NQF’s senior vice president for performance measures.
“PROs provide the opportunity to hear about the outcome of a clinician’s intervention directly from the patient—for example, visual improvement after cataract surgery, relief from nausea after chemotherapy, and mobility enhancement and pain relief after a hip or knee replacement,” she says. “The goal is to develop reliable and valid PRO performance measures that are applicable across multiple settings of care and/or multiple conditions, which the NQF can endorse for accountability and quality-improvement purposes.”
Specific NQF recommendations regarding PROs and performance measurement are expected to be available for review and comment this month, with a 30-day public and member comment period.
A wide variety of patient-level instruments to measure PROs have been used for clinical research purposes, many of which have been evaluated and catalogued within a system of assessment tools known as the National Institutes of Health’s (NIH) Patient-Reported Outcome Measurement Information System (PROMIS), Dr. Burstin says. PROMIS questionnaires prompt patients to measure such outcomes as how much difficulty they experience when walking a block on flat ground, getting in and out of bed, or doing strenuous activities, such as bicycling or jogging. NIH-funded studies using PROMIS tools are taking place at 12 sites across the country (http://nihpromis.org/default).
“PROMIS provides two distinct advantages to the PRO performance metric landscape,” argues Cella, who is principal investigator of the Statistical Center for PROMIS. “It has a computerized adaptive testing option, so efficient and accurate assessment is now possible at the individual patient level, with just a few questions per area. It also standardizes its scoring and reporting, such that many other similar measures can be used and their scores reported on a common, PROMIS metric.”
HM Applications
“The voice of the clinician is also needed during this PRO development process,” Dr. Burstin says. “We welcome hospitalists to engage in our projects and weigh in about the most meaningful and actionable patient outcomes that are relevant to their practice.”
“Taking PROs and applying them to hospital medicine is really doable if you take into account the lessons learned from providers who have already used PROs successfully in clinical settings,” says Pat Courneya, MD, medical director for HealthPartners Health Plan in Minnesota.
HealthPartners recently began using PROs in a quality measurement and reward program, offering financial bonuses to physical therapists who achieve a high PRO score relative to resource use (number of PT sessions required). “Having objective PRO measurements allows clinicians to create benchmarks for their patients regarding how much functional improvement they expect to achieve, and how many PT sessions are required to achieve that degree of improvement,” Dr. Courneya says. Using an interactive, Web-based PRO assessment tool, the program has helped tailor care to the expectations of patients while also significantly reducing the overall number of PT visits, especially by medically complex, post-operative patients.
HealthPartners has successfully used PROs as part of an innovative care model for managing patients with depression. At the outset of treatment, patients are administered the PHQ-9, a nine-item patient health questionnaire designed to assess depression symptoms and functional impairment, and derive a severity score. Patients receive care by a team composed of a primary-care physician, a care manager, and a consulting psychiatrist, after which their degree of symptom improvement is again measured. With this program, HealthPartners has achieved significantly more patients with depression into remission by six months compared with typical primary-care treatment, Dr. Courneya says. This model of care has since garnered a CMS Innovation Grant, managed by the HealthPartners Institute for Education and Research and directed by Minnesota’s Institute for Clinical Systems Improvement, aimed at spreading the model to five other states.
“PROs are potentially as useful for hospital medicine as for any other type of medical practice,” says Shaun Frost, MD, SFHM, SHM president and associate medical director of care delivery systems for HealthPartners Health Plan. “There is a big opportunity for hospitalists to incorporate shared decision-making to learn patients’ preferences, such as expectations of when they will be discharged, and understanding of therapeutic options.”
Peri-surgical care is a particularly important opportunity for hospitalists to demonstrate their value by leveraging PROs, according to Dr. Frost. “Patients sometimes come to the table with unrealistic prior expectations that physicians can make pain go away completely. We need to clarify their expectations preoperatively, when we meet them for the very first time, so that they establish a realistic baseline,” he says. “We then need to have a diligent conversation with them immediately after their operation to discuss their pain-management goals, a realistic physical therapy schedule, and post-discharge expectations.”
By clearly understanding patient objectives, hospitalists can “adjust the therapy they’re getting to their expectations, maximizing its effectiveness while minimizing delays in care and transitions to other care settings,” Dr. Frost says.
Chris Guadagnino is a freelance medical writer in Philadelphia.
References
- National Quality Forum. Patient-reported outcomes. National Quality Forum website. Available at: http://www.qualityforum.org/Projects/n-r/Patient-Reported_Outcomes/Patient-Reported_Outcomes.aspx. Accessed Oct. 2, 2012.
- U.S. Food and Drug Administration. The Patient-Reported Outcomes Consortium. U.S. Food and Drug Administration website. Available at: http://www.fda.gov/AboutFDA/PartnershipsCollaborations/PublicPrivatePartnershipProgram/ucm231129.htm. Accessed Oct. 2, 2012.
- National Quality Forum. National voluntary consensus standards for patient outcomes 2009.National Quality Forum website. Available at: http://www.qualityforum.org/Publications/2011/07/National_Voluntary_Consensus_Standards_for_Patient_Outcomes_2009.aspx. Accessed Oct. 2, 2012.
Medical Coding: Hospice Care vs. Palliative Care
Hospice care” and “palliative care” are not synonymous terms. Hospice care is defined as a comprehensive set of services (see “Hospice Coverage,” below) identified and coordinated by an interdisciplinary group to provide for the physical, psychosocial, spiritual, and emotional needs of a terminally ill patient and/or family members, as delineated in a specific patient plan of care.1 Palliative care is defined as patient- and family-centered care that optimizes quality of life by anticipating, preventing, and treating suffering. Palliative care throughout the continuum of illness involves addressing physical, intellectual, emotional, social, and spiritual needs, and facilitates patient autonomy, access to information, and choice.1
As an approach, hospice care of terminally ill individuals involves palliative care (relief of pain and uncomfortable symptoms), and emphasizes maintaining the patient at home with family and friends as long as possible. Hospice services can be provided in a home, center, skilled-nursing facility, or hospital setting. In contrast, palliative-care services can be provided during hospice care, or coincide with care that is focused on a cure.
Many hospitalists provide both hospice care and palliative-care services to their patients. Different factors affect how to report these services. These programs can be quite costly, as they involve several team members and a substantial amount of time delivering these services. Capturing services appropriately and obtaining reimbursement to help continue program initiatives are significant issues.
Hospice Care
When a patient enrolls in hospice, all rights to Medicare Part B payments are waived during the benefit period involving professional services related to the treatment and management of the terminal illness. Payment is made through the Part A benefit for the associated costs of daily care and the services provided by the hospice-employed physician. An exception occurs for professional services of an independent attending physician who is not an employee of the designated hospice and does not receive compensation from the hospice for those services. The “attending physician” for hospice services must be an individual who is a doctor of medicine or osteopathy, or a nurse practitioner identified by the individual, at the time they elect hospice coverage, as having the most significant role in the determination and delivery of their medical care.2
Patients often receive hospice in the hospital setting, where the hospitalist manages the patient’s daily care. If the hospitalist is designated as the “attending physician” for hospice services, the visits should be reported to Medicare Part B with modifier GV (e.g. 99232-GV).3 This will allow for separate payment to the hospitalist (the independent attending physician), while the hospice agency maintains its daily-care rate. Reporting services absent this modifier will result in denial.
In some cases, the hospitalist is not identified as the “attending physician” for hospice services but occasionally provides care related to the terminal illness. This situation proves most difficult. Although the hospitalist might be the most accessible physician to the staff and is putting the patient’s needs first, reimbursement is unlikely. Regulations stipulate that patients must not see independent physicians other than their “attending physician” for care related to their terminal illness unless the hospice arranges it. When the service is related to the hospice patient’s terminal illness but was furnished by someone other than the designated “attending physician,” this “other physician” must look to the hospice for payment.3
Nonhospice Palliative Care
Members of the palliative-care team often are called to provide management options to assist in reducing pain and suffering. When the palliative-care specialist is asked to provide opinions or advice, the initial service may qualify as a consultation for those payors that still recognize these codes. However, all of the requirements4 must be met in order to report the service as an inpatient consultation (99251-99255):3
- There must be a written request from a qualified healthcare provider who is involved in the patient’s care (e.g. physician, resident, nurse practitioner); this may be documented as a physician order or in the assessment/plan of the requesting provider’s progress note. Standing orders for consultation are not permitted.
- The requesting provider should clearly and accurately identify the reason for consult request to support the medical necessity of the service.
- The palliative-care physician renders and documents the service.
- The palliative-care physician reports his or her findings to the requesting physician via written communication; because the requesting physician and the consultant share a common inpatient medical record, the consultant’s inpatient progress note satisfies the “written report” requirement.
Consider the nature of the request when reporting a consultation. If the request demonstrates the need for opinions or advice from the palliative-care specialist, the service can be reported as a consultation. If the indication cites “medical management” or “palliative management,” payors are less likely to consider the service as a consultation because the physician is not seeking opinions or advice from the consultant to incorporate into his or her own plan of care for the patient and would rather the consultant just take over that portion of patient care. When consultations do not meet the requirements, subsequent hospital care services should be reported (99231-99233).3
The requesting physician can be in the same or a different provider group as the consultant. The consultant must possess expertise in an area that is beyond that of the requesting provider. Because most hospitalists carry a specialty designation of internal medicine (physician specialty code 11), hospitalists providing palliative-care services can distinguish themselves by their own code (physician specialty code 17, hospice and palliative care).5 Payor concerns arise when physicians of the same designated specialty submit a claim for the same patient on the same date. The payor is likely to pay the first claim received and deny the second claim received pending review of documentation. If this occurs, submit a copy of both progress notes for the date in question to distinguish the services provided. The payor may still require that both encounters be reported as one cumulative service under one physician.
Consultations are not an option for Medicare beneficiaries. Hospitalists providing palliative care can report initial hospital care codes (99221-99223) for their first encounter with the patient.3 This is only acceptable when no other hospitalist from the group has reported initial hospital care during the patient stay, unless the palliative-care hospitalist carries the corresponding designation (i.e. enrolled with Medicare as physician specialty code 17). Without this separate designation, the palliative-care hospitalist can only report subsequent hospital care codes (99231-99233) as the patient was seen previously by a hospitalist in the same group.3
Carol Pohlig is a billing and coding expert with the University of Pennsylvania Medical Center, Philadelphia. She is also on the faculty of SHM’s inpatient coding course.
References
- U.S. Government Printing Office. Electronic Code of Federal Regulations: Title 42: Public Health, Part 418: Hospice Care, §418.3. June 2012. U.S. Government Printing Office website. Available at: http://ecfr.gpoaccess.gov/cgi/t/text/text-idx?c=ecfr&sid=818258235647b14d2961ad30fa3e68e6&rgn=div5&view=text&node=42:3.0.1.1.5&idno=42#42:3.0.1.1.5.1.3.3. Accessed June 23, 2012.
- Centers for Medicare & Medicaid Services. Medicare Claims Processing Manual: Chapter 11: processing hospice claims. Centers for Medicare & Medicaid Services website. Available at: http://www.cms.gov/Regulations-and-Guidance/Guidance/Manuals/Downloads/clm104c11.pdf. Accessed June 23, 2012.
- Abraham M, Ahlman J, Anderson C, Boudreau A, Connelly J. Current Procedural Terminology 2012 Professional Edition. Chicago: American Medical Association Press; 2011.
- American Medical Association. Consultation services and transfer of care. American Medical Association website. Available at: http://www.ama-assn.org/resources/doc/cpt/cpt-consultation-services.pdf. Accessed June 23, 2012.
- Centers for Medicare & Medicaid Services. Medicare Claims Processing Manual: Chapter 26: completing and processing form CMS-1500 data set. Centers for Medicare & Medicaid Services website. Available at: http://www.cms.gov/Regulations-and-Guidance/Guidance/Manuals/downloads/clm104c26.pdf. Accessed June 23, 2012. Department of Health and Human Services.
- Hospice Payment System: payment system fact sheet series. Centers for Medicare & Medicaid Services website. Available at: http://www.cms.gov/Outreach-and-Education/Medicare-Learning-Network-MLN/MLNProducts/downloads/hospice_pay_sys_fs.pdf. Accessed June 23, 2012.