User login
Relational Diagnoses and the DSM
In our understanding of family systems, we have long known that dysfunctional relational patterns often lie at the root of our patients’ problems. But to what extent should family diagnoses be incorporated into the DSM?
I sat down with Dr. Marianne Z. Wamboldt to explore these issues. Dr. Wamboldt, a child psychiatrist, is chair of the board of the Family Process Institute. She also holds the Leslie and William Vollbracht Family Chair in Stress and Anxiety Disorders at the University of Colorado, Denver, and serves as professor and vice chair in the department of psychiatry in the medical school.

Marianne Wamboldt: So why exactly do you oppose the inclusion of family diagnoses in the DSM?
Alison Heru: I don’t like the labeling of families. I like helping families understand their strengths and helping them work out their problems. I don’t see family problems as psychiatric problems.
MW: I think it is important that we have a way of measuring and classifying what we see, so that we know what we are talking about and that we can measure whether or not we have success in what we are doing.
AH: I agree that these goals are important. However, I think we can use tools like the GARF (Global Assessment of Relational Functioning) or other measuring devices, to do this. I don’t think we need to go as far as including measurements of family functioning in the DSM.
MW: Did you know the GARF is included in DSM-IV-TR already? What is the difference between the GARF and the DSM?
AH: The GARF is good and useful, like the GAF (Global Assessment Scale) in that it gives you a way to describe functioning on a range from healthy to unhealthy, without defining a pathological state. When you put something in the DSM, you are saying it is a disease. You are saying something about etiology.
MW: Not necessarily. In the DSM-IV, ADHD is a description of behavior; there is no attempt to talk about causality. We had hoped that the DSM-5 could start talking about causality, but most of the research is not yet ready. In the meantime, having a clear definition of what we are treating is useful for researchers as well as clinicians. Having a universal description is helpful for everyone.
AH: I agree that a universal description is good, but I still think that more harm than good comes from including family diagnoses in the DSM. I just don’t see families needing to be labeled as pathological. I understand your point, but I think that the repercussions of having a family diagnosis in the DSM outweigh the benefits. The DSM is used in all kinds of ways. In the court system, it is described as "The Psychiatrist’s Bible." If a family diagnosis is in the DSM, then it becomes an "illness" with all the repercussions that come from that label.
MW: However, if it is not in the DSM, many insurance companies won’t pay for the treatment, and persons in the family get labeled with some other diagnosis in order to get therapy. Moreover, if you label something and talk about it, stigma is reduced. Think about cancer and how we used to think about it. It used to be feared, and people with cancer were isolated. That is not what we want for psychiatry and family problems.
AH: I understand that view, but I think that the analogy with cancer is not accurate. Cancer research is well funded, and cancer in many instances can be cured. Mental illnesses have not seen this kind of support, funding, or understanding. In fact, funding has been drastically cut, and the prisons are full of people with mental illness. People now think about mental illness and crime together.
MW: When cancer research started, it was first to try to find commonalities among the many illnesses people with cancer had. The first treatment efforts improved conditions only a very little, but it was by using each effort and tweaking treatment again and again that the field moved forward to where it is today.
AH: I also heard (from Dr. Carl C. Bell of the University of Illinois at Chicago) about a study that showed that stigma was actually increased after the community was educated that psychiatric illnesses are biological illnesses. Before the educational intervention, people with mental illness were seen in the community as odd or quirky and accepted as "different." After the study, these same people were shunned by the community as having an immutable biological disease.
MW: What about child mistreatment? Don’t you think that would be good to include in the DSM? What about domestic violence? And there is a big push to include parental alienation syndrome. What do you think about that?
AH: I don’t see these as psychiatric illnesses, [they are] more social or criminal problems. I don’t think couples with IPV [interpersonal violence] would come for treatment if they knew that they would be labeled by the insurance companies or doctors. I think the parental alienation syndrome is also not a good thing to put in the DSM, whatever the science (or not) behind it. It is a social problem that parents do bad things to their children. I do not see that as a psychiatric issue.
MW: But we treat these people. They come to us for help, and we try to help them. I think it is better to have clear definition that is well thought out and scientifically based, rather than just vague and impressionistic. Relational problems have been written about for years. There is a huge literature on this topic. I think that the evidence for many relational processes that lead to morbidity is at least as good, if not better, than many diagnoses in the DSM-IV.
AH: I agree. However, my conclusion is that we should take things OUT of the DSM that don’t belong there and prevent social or criminal diagnoses from going into the DSM.
MW: How are we going to measure and be scientific about our work?
AH: I think we can do that without using the DSM. Why is the DSM so important? I also don’t think we should let insurance companies dictate how we think about what we do.
MW: Insurance companies pay for treating persons with some diagnoses, but not other diagnoses. For example, in some states, they do not pay for treatment for ADHD, which is extensively researched to be a primarily heritable illness, responsive to medications more than even very intensive psychotherapeutic interventions, and quite disabling for some youth. The DSM has to be used for more than merely what insurance companies decide what to do with it. It originally began as a method of reliably describing patients that psychiatrists were treating, so as to share knowledge about the illnesses, what worked, and what did not work. The [people behind the] ICD-9, 10, and now 11, also think that relational disorders are important to include. We don’t want to be a country left behind!
AH: A good question is, "What is the DSM for?"
MW: To provide a framework for us to diagnose and treat mental illness.
AH: Should it not just focus on biological disease? That is my preference of a system that calls itself a disease manual.
MW: But that is not what the DSM is. It reflects the biopsychosocial model and includes behaviors and clusters of symptoms that are a focus of treatment.
AH: I am not a biological psychiatrist; (I’m) more of a social and family psychiatrist, but I see the DSM as being a biological manual. I think it is hard to categorize social and family behaviors that can be pathological in one situation or culture and not in another. Take expressed emotion (EE). Research in Japan has found that two components of high EE – high criticism and high overinvolvement – need to be parsed out and that families benefit from specific treatments, depending on which component of high EE is present. I don’t think that relational diagnoses are fixed enough. This is another argument.
MW: So how do you see us communicating and working on this problem without a good system of description?
AH: Well, I think we can continue as we have, using these constructs but not embedding them in the DSM. I don’t think that is necessary. I think it might be better to get diagnoses that are subjective or significantly influenced by the prevailing culture out of the DSM.
MW: I would argue that many illnesses, let alone psychiatric disorders in the DSM, are significantly influenced by the prevailing culture. Read "The Spirit Catches You and You Fall Down" (New York: Farrar, Straus and Giroux, 2012), which illustrates the different cultural beliefs of the Hmong (who think the spirit moves a child) from Western medicine (which diagnoses epilepsy). If relational diagnoses are not in the DSM, many therapists will not think about relationships and will not have them as a focus for change.
AH: I think that is an assumption that is not proven.
MW: If relational disorders are in the DSM, then practitioners are more likely to think of them, and faculty are more likely to teach them to new clinicians.
AH: Yes, but think of them as a pathological entity and then we are back where we were 50 years ago – pathologizing families.
MW: I disagree with that. With education and knowledge about effective family interventions, stigma can be reduced, and people can access the treatments they need!
AH: This is a good argument that our field needs to engage in. Better measurement and reduced stigma are the benefits that you see from including relational problems in the DSM.
MW: Yes, and you see this as unnecessary labeling that might be used against families.
AH: Yes. I also think that relational diagnoses are more fluid than biological diagnoses and that we are not ready, and may never be ready, to carve these out as definitive immutable constructs.
Dr. Heru is with the department of psychiatry at the University of Colorado at Denver. She has been a member of the Association of Family Psychiatrists since 2002 and currently serves as the organization’s treasurer. In addition, she is the coauthor of two books on working with families and is the author of numerous articles on this topic.
In our understanding of family systems, we have long known that dysfunctional relational patterns often lie at the root of our patients’ problems. But to what extent should family diagnoses be incorporated into the DSM?
I sat down with Dr. Marianne Z. Wamboldt to explore these issues. Dr. Wamboldt, a child psychiatrist, is chair of the board of the Family Process Institute. She also holds the Leslie and William Vollbracht Family Chair in Stress and Anxiety Disorders at the University of Colorado, Denver, and serves as professor and vice chair in the department of psychiatry in the medical school.
Marianne Wamboldt: So why exactly do you oppose the inclusion of family diagnoses in the DSM?
Alison Heru: I don’t like the labeling of families. I like helping families understand their strengths and helping them work out their problems. I don’t see family problems as psychiatric problems.
MW: I think it is important that we have a way of measuring and classifying what we see, so that we know what we are talking about and that we can measure whether or not we have success in what we are doing.
AH: I agree that these goals are important. However, I think we can use tools like the GARF (Global Assessment of Relational Functioning) or other measuring devices, to do this. I don’t think we need to go as far as including measurements of family functioning in the DSM.
MW: Did you know the GARF is included in DSM-IV-TR already? What is the difference between the GARF and the DSM?
AH: The GARF is good and useful, like the GAF (Global Assessment Scale) in that it gives you a way to describe functioning on a range from healthy to unhealthy, without defining a pathological state. When you put something in the DSM, you are saying it is a disease. You are saying something about etiology.
MW: Not necessarily. In the DSM-IV, ADHD is a description of behavior; there is no attempt to talk about causality. We had hoped that the DSM-5 could start talking about causality, but most of the research is not yet ready. In the meantime, having a clear definition of what we are treating is useful for researchers as well as clinicians. Having a universal description is helpful for everyone.
AH: I agree that a universal description is good, but I still think that more harm than good comes from including family diagnoses in the DSM. I just don’t see families needing to be labeled as pathological. I understand your point, but I think that the repercussions of having a family diagnosis in the DSM outweigh the benefits. The DSM is used in all kinds of ways. In the court system, it is described as "The Psychiatrist’s Bible." If a family diagnosis is in the DSM, then it becomes an "illness" with all the repercussions that come from that label.
MW: However, if it is not in the DSM, many insurance companies won’t pay for the treatment, and persons in the family get labeled with some other diagnosis in order to get therapy. Moreover, if you label something and talk about it, stigma is reduced. Think about cancer and how we used to think about it. It used to be feared, and people with cancer were isolated. That is not what we want for psychiatry and family problems.
AH: I understand that view, but I think that the analogy with cancer is not accurate. Cancer research is well funded, and cancer in many instances can be cured. Mental illnesses have not seen this kind of support, funding, or understanding. In fact, funding has been drastically cut, and the prisons are full of people with mental illness. People now think about mental illness and crime together.
MW: When cancer research started, it was first to try to find commonalities among the many illnesses people with cancer had. The first treatment efforts improved conditions only a very little, but it was by using each effort and tweaking treatment again and again that the field moved forward to where it is today.
AH: I also heard (from Dr. Carl C. Bell of the University of Illinois at Chicago) about a study that showed that stigma was actually increased after the community was educated that psychiatric illnesses are biological illnesses. Before the educational intervention, people with mental illness were seen in the community as odd or quirky and accepted as "different." After the study, these same people were shunned by the community as having an immutable biological disease.
MW: What about child mistreatment? Don’t you think that would be good to include in the DSM? What about domestic violence? And there is a big push to include parental alienation syndrome. What do you think about that?
AH: I don’t see these as psychiatric illnesses, [they are] more social or criminal problems. I don’t think couples with IPV [interpersonal violence] would come for treatment if they knew that they would be labeled by the insurance companies or doctors. I think the parental alienation syndrome is also not a good thing to put in the DSM, whatever the science (or not) behind it. It is a social problem that parents do bad things to their children. I do not see that as a psychiatric issue.
MW: But we treat these people. They come to us for help, and we try to help them. I think it is better to have clear definition that is well thought out and scientifically based, rather than just vague and impressionistic. Relational problems have been written about for years. There is a huge literature on this topic. I think that the evidence for many relational processes that lead to morbidity is at least as good, if not better, than many diagnoses in the DSM-IV.
AH: I agree. However, my conclusion is that we should take things OUT of the DSM that don’t belong there and prevent social or criminal diagnoses from going into the DSM.
MW: How are we going to measure and be scientific about our work?
AH: I think we can do that without using the DSM. Why is the DSM so important? I also don’t think we should let insurance companies dictate how we think about what we do.
MW: Insurance companies pay for treating persons with some diagnoses, but not other diagnoses. For example, in some states, they do not pay for treatment for ADHD, which is extensively researched to be a primarily heritable illness, responsive to medications more than even very intensive psychotherapeutic interventions, and quite disabling for some youth. The DSM has to be used for more than merely what insurance companies decide what to do with it. It originally began as a method of reliably describing patients that psychiatrists were treating, so as to share knowledge about the illnesses, what worked, and what did not work. The [people behind the] ICD-9, 10, and now 11, also think that relational disorders are important to include. We don’t want to be a country left behind!
AH: A good question is, "What is the DSM for?"
MW: To provide a framework for us to diagnose and treat mental illness.
AH: Should it not just focus on biological disease? That is my preference of a system that calls itself a disease manual.
MW: But that is not what the DSM is. It reflects the biopsychosocial model and includes behaviors and clusters of symptoms that are a focus of treatment.
AH: I am not a biological psychiatrist; (I’m) more of a social and family psychiatrist, but I see the DSM as being a biological manual. I think it is hard to categorize social and family behaviors that can be pathological in one situation or culture and not in another. Take expressed emotion (EE). Research in Japan has found that two components of high EE – high criticism and high overinvolvement – need to be parsed out and that families benefit from specific treatments, depending on which component of high EE is present. I don’t think that relational diagnoses are fixed enough. This is another argument.
MW: So how do you see us communicating and working on this problem without a good system of description?
AH: Well, I think we can continue as we have, using these constructs but not embedding them in the DSM. I don’t think that is necessary. I think it might be better to get diagnoses that are subjective or significantly influenced by the prevailing culture out of the DSM.
MW: I would argue that many illnesses, let alone psychiatric disorders in the DSM, are significantly influenced by the prevailing culture. Read "The Spirit Catches You and You Fall Down" (New York: Farrar, Straus and Giroux, 2012), which illustrates the different cultural beliefs of the Hmong (who think the spirit moves a child) from Western medicine (which diagnoses epilepsy). If relational diagnoses are not in the DSM, many therapists will not think about relationships and will not have them as a focus for change.
AH: I think that is an assumption that is not proven.
MW: If relational disorders are in the DSM, then practitioners are more likely to think of them, and faculty are more likely to teach them to new clinicians.
AH: Yes, but think of them as a pathological entity and then we are back where we were 50 years ago – pathologizing families.
MW: I disagree with that. With education and knowledge about effective family interventions, stigma can be reduced, and people can access the treatments they need!
AH: This is a good argument that our field needs to engage in. Better measurement and reduced stigma are the benefits that you see from including relational problems in the DSM.
MW: Yes, and you see this as unnecessary labeling that might be used against families.
AH: Yes. I also think that relational diagnoses are more fluid than biological diagnoses and that we are not ready, and may never be ready, to carve these out as definitive immutable constructs.
Dr. Heru is with the department of psychiatry at the University of Colorado at Denver. She has been a member of the Association of Family Psychiatrists since 2002 and currently serves as the organization’s treasurer. In addition, she is the coauthor of two books on working with families and is the author of numerous articles on this topic.

Procalcitonin and Findings
Pneumonia is a common reason for hospitalization and major rationale for administration of antibiotics in the United States.[1] Management guidelines for patients hospitalized with community‐acquired pneumonia recommend early antibiotic therapy. Quality measures adopted by the Centers for Medicare and Medicaid Services include antibiotic administration within 6 hours of presentation, based on a relationship between early administration and improved survival.[2, 3, 4, 5] However, this imperative has been associated with an increase in incorrect diagnoses of pneumonia.[6, 7] While pneumonia diagnosis would seem straightforward, clinical findings frequently do not differentiate pneumonia from other respiratory illnesses. Thus, an infiltrate on chest radiographs (CXR) is commonly used to assign an admitting diagnosis of pneumonia.[8, 9, 10] However, radiographic reports are often inconclusive and frequently fail to discriminate pneumonic infiltrates from atelectasis, edema, small pleural effusions, or chronic abnormalities. In cases of uncertainty, physicians invariably initiate antibiotics, even when the illness is more consistent with viral bronchitis or asthma, resulting in unnecessary antibiotic use.[6] Previously considered relatively harmless, antibiotic complications can be lethal, and excessive use promotes antimicrobial resistance.[11, 12]
Procalcitonin (ProCT), a calcitonin precursor normally produced in the thyroid and lungs, is secreted by cells throughout the body in response to bacterial infections.[13, 14] Elevated ProCT is used to screen patients with suspected bacterial infection and predict mortality in critically ill patients.[15, 16] Recently, European investigators have used ProCT to guide more selective antibiotic use in patients with symptoms of lower respiratory tract infection (LRTI), including pneumonia.[17, 18, 19] However, few reports describe the relationship of ProCT with radiographic features in hospitalized patients with LRTI, and none focus on patients with indeterminate radiographic readings.[18, 20, 21]
We sought to determine if elevated serum ProCT in adults hospitalized with LRTI symptoms correlates with the clinical diagnosis of pneumonia and definitive infiltrates on CXRs. We specifically assessed ProCT as a diagnostic marker of pneumonia to augment clinical judgment in patients when radiographic findings are indeterminate.
METHODS
Subjects
The study was performed in a 520‐bed, general medicalsurgical hospital, using subjects participating in a study of the relationship between biomarkers and microbiologic diagnoses (to be described in a separate publication). Adults 21 years of age admitted with a diagnosis compatible with respiratory tract infection (pneumonia, acute exacerbations of chronic obstructive pulmonary disease [AECOPD], acute bronchitis, asthma, upper respiratory infection, viral syndrome, respiratory failure, and congestive heart failure [CHF] with signs of infection) were recruited during winters of 20082009 and 20092010. Patients were screened within 24 hours of admission; immunosupression, lung abscess, witnessed aspiration, or previous antibiotic use were exclusion criteria. Blood for ProCT measurement was collected in the emergency room prior to antibiotics. Subjects or legal guardians provided written informed consent, and institutional review boards approved the study.
Illness Evaluation
At enrollment, demographic, clinical, and laboratory data were collected. To provide consistency of data, 1 investigator (a clinical pulmonary specialist), after interviewing, examining each subject, and considering the radiographic findings, assigned a primary and secondary clinical admitting diagnosis: pneumonia, AECOPD, asthma exacerbation, CHF, acute bronchitis, viral syndrome or influenza, other respiratory illness, or non‐respiratory illness. These diagnoses were used for the analysis but were not available to treating physicians. Discharge diagnoses, based on International Classification of Diseases, Ninth Revision (ICD‐9) codes, and official results of follow‐up chest radiographs were also recorded.
Radiographic Interpretations
All official admission chest radiographic reports were reviewed by one of the investigators. Radiographic descriptions were noted with attention to the following comments: clear or no acute change from prior radiographs, infiltrates without consolidation, consolidation, edema, atelectasis, and pleural effusion. For our analysis, chest radiographs were categorized into 4 groups: (1) No acute disease (NAD) (ie, clear or no change from prior radiographs); (2) Other definitive radiographic abnormality (atelectasis, edema, or pleural effusion); (3) Indeterminate (findings consistent with pneumonia, but also other processes including atelectasis, edema, scarring but with no favored interpretation [often including the phrase pneumonia cannot be excluded]); and (4) infiltrate (ie, an infiltrate or consolidation most consistent with pneumonia). The pulmonary specialist independently categorized CXRs and provided a definitive radiographic interpretation whenever possible.
Microbiology
Blood cultures, sputum Gram stain and culture were performed by the clinical laboratory. Pneumococcal‐specific urinary antigen and serology were performed as previously described.[22]
Procalcitonin Measurement
Serum ProCT was measured using resolved amplified cryptate emission technology (Kryptor PCT, Brahms, Henningsdorf, Germany). Functional sensitivity is 0.06 ng/mL (normal serum levels are 0.033 0.003 ng/mL).[23, 24, 25] ProCT results were not available to investigators at the time of clinical or radiographic assessments.
Statistical Analysis
Categorical and continuous distributions were compared using Fisher's exact and Wilcoxon tests, respectively, and summarized by proportions and medians, and means and standard deviations. Log‐axis boxplots were used to graphically display the skewed distributions of ProCT. Stacked bar charts were used to depict discrete distributions of diagnoses by ProCT group. Receiver operating characteristic (ROC) curves relating ProCT to chest radiographs were computed, and sensitivity, specificity, positive predictive value (PPV) and negative predictive value (NPV) were calculated for ProCT thresholds. Logistic regression was used to estimate odds ratios (OR), and associated P values and confidence intervals, to quantify associations between infiltrate/non‐infiltrate and dichotomized or log‐transformed ProCT. SAS 9.2 (SAS Institute, Inc, Cary, NC) was used for analyses, using 2‐sided 0.05 level tests.
RESULTS
Study Population and Clinical Diagnoses
During 2 winters, 532 subjects admitted for 556 respiratory illnesses were recruited. Two did not have chest radiographs, 16 illnesses were non‐pulmonary, and 10 did not have admission ProCT levels, leaving 528 illnesses for analysis (Table 1). Subjects averaged 65 years of age, predominately lived at home, and a high percentage had underlying diseases. The leading primary admission diagnoses assigned by the pulmonologist were pneumonia and AECOPD at 31% and 27%, respectively. Of the 163 illnesses assigned a primary or secondary admitting diagnosis of pneumonia, infiltrates were identified on the admission radiograph by the pulmonologist in 156 (96%).
| Illnesses N = 528 (%) | |
|---|---|
| |
| Age (mean SD) | 65 17 |
| Female | 278 (53) |
| Race | |
| White | 409 (77) |
| African American | 119 (23) |
| Hispanic | 53 (10) |
| Residence | |
| Community | 488 (92) |
| Assisted living | 27 (5) |
| Nursing home | 13 (2) |
| Medical conditions | |
| Diabetes | 188 (36) |
| CHF | 153 (29) |
| COPD | 216 (41) |
| Chronic renal failure | 21 (4) |
| Past or active smoker | 395 (75) |
| Current influenza vaccine | 371 (70) |
| Prior pneumococcal vaccine | 432 (82) |
| Oral steroids | 69 (13) |
| Inhaled steroids | 201 (38) |
| Home oxygen | 129 (24) |
| Symptoms, No. (%) | |
| Upper respiratory | 350 (66) |
| Cough | 489 (93) |
| Sputum production | 390 (74) |
| Dyspnea | 496 (94) |
| Wheezing | 345 (65) |
| Constitutional | 271 (51) |
| Feverish | 293 (55) |
| Rigors | 118 (22) |
| Physical exam | |
| Wheezing | 279 (53) |
| Rales | 211 (40) |
| Rhonchi | 144 (27) |
| Temperature (mean SD) | 37.2 1.0 |
| Respiratory rate (mean SD) | 25 7 |
| Laboratory data | |
| Oxygen saturation (mean SD) | 92.3 5.5 |
| WBC 103/ml (mean SD) | 9.4 4.8 |
| Clinical diagnosis | |
| Pneumonia | 163 (31) |
| Asthma | 76 (14) |
| CHF | 45 (9) |
| Bronchitis | 83 (16) |
| AECOPD | 142 (27) |
| Other pulmonary | 19 (4) |
| Therapy | |
| Antibacterials | 463 (88) |
| Antivirals | 38 (7) |
| Outcome | |
| Intensive care | 43 (8) |
| Respiratory failure | 29 (6) |
| Death | 6 (1) |
| Length of stay (mean SD) | 5.9 18.7 |
Radiographic Classifications
Based on radiology reports, 213 (40%) were classified as NAD, 76 (14%) as other definitive findings, 75 (14%) as infiltrates, and 164 (31%) as indeterminate. The pulmonologist concurred with the radiology report for most NAD (199/213) and infiltrate (67/75) classifications, but only 4 as indeterminate, assigning approximately half the radiologist's indeterminate CXRs to infiltrate and one‐quarter each to NAD and other categories.
Relationship of ProCT With Clinical and Radiographic Features
The relationship between clinical admitting diagnosis and ProCT is shown in Figure 1A. Subjects with pneumonia had a median ProCT of 0.27 ng/ml (interquartile range [IQR] 1.3), significantly greater than subjects with AECOPD, asthma, acute bronchitis, and viral/emnfluenza. Subjects assigned to the other diagnoses category (ie, skin or urinary infections, empyema) generally had higher ProCT values (median 0.70 ng/ml, IQR 4.6).
The relationship between the radiologist's classification and ProCT is shown in Figure 1B. Median ProCT levels were significantly lower in subjects with radiographs classified as NAD compared to those showing infiltrates (P < 0.0001). Those classified as indeterminate in radiology reports had a median ProCT value (0.13 ng/ml) midway between those with NAD (0.08 ng/ml) and infiltrates (0.21 ng/ml). Similarly, illnesses with radiographs classified by the pulmonologist as infiltrates also had significantly higher median ProCT levels (0.33 ng/ml, IQR 1.33) than those classified as NAD (0.08 ng/ml, IQR 0.06; P < 0.0001), and other definitive findings (0.11 ng/ml, IQR 0.17). Notably, duration of symptoms prior to evaluation did not affect the relationship between ProCT level and radiographic classification (data not shown). All subjects with infiltrates according to the radiologist's report received early antibiotics, as did 97% and 80% with indeterminate radiographs and NAD, respectively.
Predictive Value of ProCT for Interpreting Indeterminate Radiographs
We were specifically interested to learn if ProCT could help clinicians interpret the large number of indeterminate radiographs. As a first step, we evaluated the diagnostic accuracy of ProCT for radiographic infiltrates by calculating the ROC curve (Figure 2A), using cases in which radiologist and pulmonologist concurred on the classification as infiltrate (n = 67) or no infiltrate (ie, NAD or other definitive finding; n = 273). For these cases, the ROC had an area under curve (AUC) of 0.80 (P < 0.0001), indicating moderate predictive accuracy of ProCT for the presence of an infiltrate. The OR for an infiltrate increased steadily with higher ProCT thresholds, quadrupling from 3.9 to 15.6 as the threshold increased from 0.05 to 0.50 ng/ml (Table 2). Using the commonly defined 0.25 ng/ml ProCT threshold for which antibiotics have been recommended for respiratory infections, the PPV for an infiltrate was 61% and the NPV 89%.
| ProCT Threshold (ng/ml) | Sensitivity (%) | Specificity (%) | OR | P Value |
|---|---|---|---|---|
| ||||
| 0.05 | 94 | 20 | 3.9 | 0.012 |
| 0.07 | 90 | 42 | 6.1 | <0.0001 |
| 0.10 | 79 | 65 | 7.1 | <0.0001 |
| 0.12 | 73 | 72 | 7.1 | <0.0001 |
| 0.15* | 67 | 82 | 9.1 | <0.0001 |
| 0.20 | 58 | 88 | 10.5 | <0.0001 |
| 0.25 | 52 | 92 | 12.5 | <0.0001 |
| 0.50 | 42 | 96 | 15.6 | <0.0001 |
Next, we analyzed the 164 illnesses with indeterminate radiographs. Of these, the pulmonologist classified 79 as infiltrate (median ProCT 0.29 ng/ml), 40 as NAD (median ProCT 0.08 ng/ml), 41 as other definitive findings (median ProCT 0.10 ng/ml), and 4 as indeterminate. The admitting diagnosis and corresponding median ProCT for these subjects was pneumonia in 78 (0.28 ng/ml), AECOPD in 26 (0.09 ng/ml), acute bronchitis in 30 (0.09 ng/ml), asthma in 11 (0.08 ng/ml), and CHF in 14 (0.10 ng/ml). The ROC AUC for these cases (excluding 4 considered indeterminate by the pulmonologist) was slightly lower (0.72, P < 0.0001) than the prior analysis (Figure 2B), but ProCT retained moderate predictive value for the presence of infiltrates as diagnosed by the pulmonologist on indeterminate radiographs (Table 3).
| ProCT Threshold | Sensitivity (%) | Specificity (%) | PPV (%) | NPV (%) | OR | P Value | Predicted Probability (%) |
|---|---|---|---|---|---|---|---|
| |||||||
| 0.05 | 95 | 7 | 50 | 60 | 1.5 | 0.54 | 32 |
| 0.07 | 86 | 27 | 54 | 67 | 2.3 | 0.04 | 35 |
| 0.10 | 80 | 59 | 66 | 75 | 5.7 | <0.0001 | 40 |
| 0.12* | 76 | 67 | 69 | 74 | 6.3 | <0.0001 | 42 |
| 0.15 | 67 | 74 | 72 | 70 | 5.8 | <0.0001 | 45 |
| 0.20 | 63 | 78 | 74 | 69 | 6.0 | <0.0001 | 49 |
| 0.25 | 53 | 80 | 72 | 64 | 4.6 | <0.0001 | 52 |
| 0.50 | 37 | 88 | 74 | 59 | 4.1 | 0.0006 | 60 |
Since clinical determinations by a single pulmonologist may be subjective, we sought to objectively assess the accuracy of assigned admission diagnoses by analyzing additional data, including bacterial tests, follow‐up radiographs, and final discharge diagnoses. As a surrogate of invasive bacterial infection, we used identification of S. pneumoniae as the outcome, since multiple complementary diagnostic assays were used, thus minimizing the uncertainty of sputum cultures. Overall, we identified 58 pneumococcal infections (Table 4). The pulmonologist's admitting diagnosis of pneumonia captured a higher proportion (52% for any test positive) of S. pneumoniae cases than identification of a radiographic infiltrate by the radiologist (26%), and equivalent to the pulmonologist's radiographic reading (57%) or elevated ProCT alone (57%). There was an absolute 14% increase (27% relative increase) in the detection of S. pneumoniae infections by addition of ProCT to the pulmonologist's diagnosis. A similar analysis limited to the 164 subjects with indeterminate radiographs found that 13 of 19 (68%) of S. pneumoniae diagnoses had been assigned a clinical diagnosis of pneumonia by the pulmonologist.
| S. pneumonia Confirmed by Diagnostic Assay No. (%) | |||||
|---|---|---|---|---|---|
| Criteria | Blood Culture + (n = 7) | Urine Ag + (n = 27) | Serology + (n = 28) | Sputum + (n = 20) | Any Test + (n = 58) |
| |||||
| Radiologist CXR read as infiltrate | 3 (43) | 9 (33) | 10 (36) | 3 (15) | 15 (26) |
| Pulmonologist CXR read as infiltrate | 6 (86) | 17 (62) | 18 (64) | 10 (50) | 33 (57) |
| Pulmonologist clinical diagnosis of pneumonia | 6 (86) | 16 (60) | 16 (57) | 8 (40) | 30 (52) |
| Pulmonologist clinical diagnosis of AECOPD | 0 (0) | 4 (15) | 5 (18) | 5 (25) | 8 (14) |
| Procalcitonin 0.25 ng/ml | 6 (86) | 18 (67) | 17 (61) | 9 (45) | 33 (57) |
| Pulmonologist diagnosis of pneumonia and/or ProCT 0.25 ng/ml | 7 (100) | 19 (70) | 20 (71) | 10 (50) | 38 (66) |
We also determined how often subsequent radiographs showed evolution to a definitive infiltrate in indeterminate cases that the pulmonologist had classified as either NAD or other finding. Only 3/20 with repeat films showed a definitive infiltrate, none of whom had evidence of bacterial infection, and all 3 had ProCT <0.25 ng/ml. In contrast, 10 of 21 subjects with indeterminate CXRs, that the pulmonologist had classified as an infiltrate, developed definitive infiltrates on follow‐up studies (P = 0.04), and 8 remained indeterminate.
Finally, 93% of those assigned an admitting pneumonia diagnosis by the pulmonologist had primary (71%) or secondary (22%) discharge diagnosis of pneumonia. Of the additional 28 subjects with a discharge diagnosis of pneumonia, for whom the pulmonologist assigned non‐pneumonia admitting diagnoses, none had positive blood cultures or evidence of S. pneumoniae infection, and only one had a follow‐up radiograph showing a definitive infiltrate.
DISCUSSION
Pneumonia can be a serious illness and, if left untreated, result in death. Hence, infectious disease and pulmonary societies advocate timely administration of antibiotics. Unfortunately, clinical diagnosis of pneumonia is difficult, as clinical and radiographic features are often ambiguous. These factors result in liberal use of broad‐spectrum antibiotics, often in patients with viral infection, in whom antibiotic side effects outweigh benefit.[26] Although pneumonia guidelines recommend early antibiotic therapy for patients with infiltrates on CXR, we found that early administration of antibiotics for possible pneumonia is nearly universal.[2, 27] Thus, an objective laboratory test indicative of pneumonia would be a useful adjunct when making treatment decisions.
In an attempt to curb excessive antibiotic use, European investigators have used ProCT to guide therapy for respiratory tract infection, including pneumonia, without increased adverse outcomes.[17, 19, 28, 29] Antibiotics are recommended when ProCT levels are 0.25 ng/ml, rather than based on radiographic or microbiological results. However, ProCT‐guided antibiotic management has not been adopted in the United States, and radiographic findings are a major determinant for diagnosis of pneumonia and antibiotic administration.
Thus, we were interested in correlating ProCT levels with the presence of radiographic infiltrates, and especially how ProCT could assist in interpreting the vexing problem of indeterminate CXRs. We found a direct relationship between an increased ProCT level and definitive infiltrates on CXR, similar to results reported by others.[18, 20, 21] However, these studies did not address illnesses with indeterminate radiographs, which accounted for approximately one‐third of the radiologist's readings in our study. Our situation is likely not unique. In a post hoc analysis of CXRs from subjects with pneumonia in the PORT study, independent radiologists interpreted a similar proportion of CXRs as either no acute disease or possible infiltrates.[30] Since indeterminate readings include the possibility of an infiltrate, it is not surprising that 97% of our subjects received early antibiotic treatment.
Given current pneumonia treatment guidelines, ProCT testing for those with definitive infiltrates would not add to patient management, as all should receive early antibiotics. However, ProCT measurement could have significant impact on management in those with indeterminate films. We found ProCT was moderately predictive for infiltrates when utilizing the pulmonologist's interpretation of indeterminate CXRs. This is concordant with a recent study reporting a similar ROC (0.72) for ProCT for diagnosing pneumonia in patients with dyspnea, and more predictive of pneumonia than any clinical variable.[31]
The major limitation of our study is the lack of a gold standard for diagnosis of pneumonia. We chose to use a pulmonary specialist to provide admission diagnoses, and independently interpret radiographs in the context of clinical findings. Although imperfect, we feel this approach best reflects good medical practice by an experienced clinician evaluating the CXR in context of a patient's history and physical exam. Importantly, analysis of the concurrent microbiology data, follow‐up radiographs, and discharge diagnoses supports the accuracy of the admitting diagnoses of pneumonia and radiographic interpretations by the pulmonologist. Secondly, our findings may not be applicable to immunocompromised or previously treated patients.
How should a busy physician respond to a patient with dyspnea and fever when faced with an indeterminate radiographic report, since no method for the diagnosis of pneumonia is infallible?[8, 32] Clearly, a pulmonary consultation on all such patients is impractical. Our data confirms previous results that high ProCT values are correlated with an infiltrate on CXR and low values have a NPV of nearly 90%. Furthermore, low ProCT values predict low mortality across all levels of standard severity scoring indexes.[33] Thus, a low ProCT may help clinicians feel more confident to delay or stop antibiotics in a patient in whom clinical suspicion for bacterial pneumonia is low, yet the radiographic report states pneumonia cannot be ruled out.[34] Such strategies may assist in reducing unnecessary antibiotic use in the United States.[35]
Disclosures
Funding for this study was provided by NIAID‐1R01AI079446‐01. This work was presented in part at the Infectious Diseases Society of America, Boston, MA, October 2011. The authors report no conflicts of interest.
- , , , et al. The burden of community‐acquired pneumonia in seniors: results of a population‐based study. Clin Infect Dis. 2004;39:1642–1650.
- , , , et al. Infectious Diseases Society of America/American Thoracic Society consensus guidelines on the management of community‐acquired pneumonia in adults. Clin Infect Dis. 2007;44(suppl 2):S27–S72.
- Centers for Medicare and Medicaid Services. The Medicare national pneumonia quality improvement project. Available at: http://www.cms.gov/HospitalQualityInits/. Accessed September 8, 2011.
- , , , , . Timing of antibiotic administration and outcomes for Medicare patients hospitalized with community‐acquired pneumonia. Arch Intern Med. 2004;164:637–644.
- , , , et al. Quality of care, process, and outcomes in elderly patients with pneumonia. JAMA. 1997;278:2080–2084.
- , , , . Misdiagnosis of community‐acquired pneumonia and inappropriate utilization of antibiotics: side effects of the 4‐h antibiotic administration rule. Chest. 2007;131:1865–1869.
- , , . Antibiotic timing and errors in diagnosing pneumonia. Arch Intern Med. 2008;168:351–356.
- , , , . Patients admitted to hospital with suspected pneumonia and normal chest radiographs: epidemiology, microbiology, and outcomes. Am J Med. 2004;117:305–311.
- , , , , . Reliability of radiographic findings and the relation to etiologic agents in community‐acquired pneumonia. Respir Med. 2006;100:926–932.
- , , , . Admission chest radiograph lacks sensitivity in the diagnosis of community‐acquired pneumonia. Am J Med Sci. 2009;337:236–240.
- , . Strategies for reduction in duration of antibiotic use in hospitalized patients. Clin Infect Dis. 2011;52:1232–1240.
- , , , et al. The epidemic of antibiotic‐resistant infections: a call to action for the medical community from the Infectious Diseases Society of America. Clin Infect Dis. 2008;46:155–164.
- , , , , . Clinical review 167: procalcitonin and the calcitonin gene family of peptides in inflammation, infection, and sepsis: a journey from calcitonin back to its precursors. J Clin Endocrinol Metab. 2004;89:1512–1525.
- , , . Procalcitonin assay in systemic inflammation, infection, and sepsis: clinical utility and limitations. Crit Care Med. 2008;36:941–952.
- , , . Procalcitonin in sepsis and systemic inflammation: a harmful biomarker and a therapeutic target. Br J Pharmacol. 2010;159:253–264.
- , , , , . Pneumonitis‐associated hyperprocalcitoninemia. Am J Med Sci. 1996;312:12–18.
- , , , et al. Antibiotic treatment of exacerbations of COPD: a randomized, controlled trial comparing procalcitonin‐guidance with standard therapy. Chest. 2007;131:9–19.
- , , , et al. Procalcitonin versus C‐reactive protein for predicting pneumonia in adults with lower respiratory tract infection in primary care. Br J Gen Pract. 2007;57:555–560.
- , , , et al. Effect of procalcitonin‐based guidelines vs standard guidelines on antibiotic use in lower respiratory tract infections: the ProHOSP randomized controlled trial. JAMA. 2009;302:1059–1066.
- , , , et al. Procalcitonin and C‐reactive protein in hospitalized adult patients with community‐acquired pneumonia or exacerbation of asthma or COPD. Chest. 2011;139:1410–1418.
- , , , et al. Diagnostic and prognostic accuracy of clinical and laboratory parameters in community‐acquired pneumonia. BMC Infect Dis. 2008;7:10.
- , , , et al. Utility of serum procalcitonin values in patients with acute exacerbations of chronic obstructive pulmonary disease: a cautionary note. Int J Chron Obstruct Pulmon Dis. 2112;7:127–135.
- , , . Procalcitonin and its component peptides in systemic inflammation: immunochemical characterization. J Investig Med. 1997;45:552–560.
- , , , . The future diagnostic role of procalcitonin levels: the need for improved sensitivity. Clin Infect Dis. 2003;36:823–824.
- , , , et al. Calcitonin precursor levels in human medullary thyroid carcinoma. Thyroid 2003;13:819–822.
- , , , . Emergency department visits for antibiotic‐associated adverse events. Clin Infect Dis. 2008;47:735–743.
- , , , et al. Guideline tyranny: a response to the article by Baum and Kaltsas. Clin Infect Dis. 2008;47:1117–1118.
- , , , et al. Procalcitonin guidance of antibiotic therapy in community‐acquired pneumonia: a randomized trial. Am J Respir Crit Care Med. 2006;174:84–93.
- , , , et al. Effect of procalcitonin‐guided treatment on antibiotic use and outcome in lower respiratory tract infections: cluster‐randomised, single‐blinded intervention trial. Lancet. 2004;363:600–607.
- , , , et al. Interobserver reliability of the chest radiograph in community‐acquired pneumonia. PORT investigators. Chest. 1996;110:343–350.
- , , , et al. Use of procalcitonin for the diagnosis of pneumonia in patients presenting with a chief complaint of dyspnea: results from the BACH (Biomarkers in Acute Heart Failure) trial. Eur J Heart Fail. 2012;14:278–286.
- , , , , . A multicenter analysis of the ED diagnosis of pneumonia. Am J Emerg Med. 2010;28:862–865.
- , , , et al. Procalcitonin predicts patients at low risk of death from community‐acquired pneumonia across all CRB‐65 classes. Eur Respir J. 2008;31:349–355.
- , , , , , . Antibiotic timing and diagnostic uncertainty in Medicare patients with pneumonia: is it reasonable to expect all patients to receive antibiotics within 4 hours? Chest. 2006;130:16–21.
- . Procalcitonin for triage of patients with respiratory tract symptoms: a case study in the trial design process for approval of a new diagnostic test for lower respiratory tract infection. Clin Infect Dis. 2011;52(S4):S351–S356.
Pneumonia is a common reason for hospitalization and major rationale for administration of antibiotics in the United States.[1] Management guidelines for patients hospitalized with community‐acquired pneumonia recommend early antibiotic therapy. Quality measures adopted by the Centers for Medicare and Medicaid Services include antibiotic administration within 6 hours of presentation, based on a relationship between early administration and improved survival.[2, 3, 4, 5] However, this imperative has been associated with an increase in incorrect diagnoses of pneumonia.[6, 7] While pneumonia diagnosis would seem straightforward, clinical findings frequently do not differentiate pneumonia from other respiratory illnesses. Thus, an infiltrate on chest radiographs (CXR) is commonly used to assign an admitting diagnosis of pneumonia.[8, 9, 10] However, radiographic reports are often inconclusive and frequently fail to discriminate pneumonic infiltrates from atelectasis, edema, small pleural effusions, or chronic abnormalities. In cases of uncertainty, physicians invariably initiate antibiotics, even when the illness is more consistent with viral bronchitis or asthma, resulting in unnecessary antibiotic use.[6] Previously considered relatively harmless, antibiotic complications can be lethal, and excessive use promotes antimicrobial resistance.[11, 12]
Procalcitonin (ProCT), a calcitonin precursor normally produced in the thyroid and lungs, is secreted by cells throughout the body in response to bacterial infections.[13, 14] Elevated ProCT is used to screen patients with suspected bacterial infection and predict mortality in critically ill patients.[15, 16] Recently, European investigators have used ProCT to guide more selective antibiotic use in patients with symptoms of lower respiratory tract infection (LRTI), including pneumonia.[17, 18, 19] However, few reports describe the relationship of ProCT with radiographic features in hospitalized patients with LRTI, and none focus on patients with indeterminate radiographic readings.[18, 20, 21]
We sought to determine if elevated serum ProCT in adults hospitalized with LRTI symptoms correlates with the clinical diagnosis of pneumonia and definitive infiltrates on CXRs. We specifically assessed ProCT as a diagnostic marker of pneumonia to augment clinical judgment in patients when radiographic findings are indeterminate.
METHODS
Subjects
The study was performed in a 520‐bed, general medicalsurgical hospital, using subjects participating in a study of the relationship between biomarkers and microbiologic diagnoses (to be described in a separate publication). Adults 21 years of age admitted with a diagnosis compatible with respiratory tract infection (pneumonia, acute exacerbations of chronic obstructive pulmonary disease [AECOPD], acute bronchitis, asthma, upper respiratory infection, viral syndrome, respiratory failure, and congestive heart failure [CHF] with signs of infection) were recruited during winters of 20082009 and 20092010. Patients were screened within 24 hours of admission; immunosupression, lung abscess, witnessed aspiration, or previous antibiotic use were exclusion criteria. Blood for ProCT measurement was collected in the emergency room prior to antibiotics. Subjects or legal guardians provided written informed consent, and institutional review boards approved the study.
Illness Evaluation
At enrollment, demographic, clinical, and laboratory data were collected. To provide consistency of data, 1 investigator (a clinical pulmonary specialist), after interviewing, examining each subject, and considering the radiographic findings, assigned a primary and secondary clinical admitting diagnosis: pneumonia, AECOPD, asthma exacerbation, CHF, acute bronchitis, viral syndrome or influenza, other respiratory illness, or non‐respiratory illness. These diagnoses were used for the analysis but were not available to treating physicians. Discharge diagnoses, based on International Classification of Diseases, Ninth Revision (ICD‐9) codes, and official results of follow‐up chest radiographs were also recorded.
Radiographic Interpretations
All official admission chest radiographic reports were reviewed by one of the investigators. Radiographic descriptions were noted with attention to the following comments: clear or no acute change from prior radiographs, infiltrates without consolidation, consolidation, edema, atelectasis, and pleural effusion. For our analysis, chest radiographs were categorized into 4 groups: (1) No acute disease (NAD) (ie, clear or no change from prior radiographs); (2) Other definitive radiographic abnormality (atelectasis, edema, or pleural effusion); (3) Indeterminate (findings consistent with pneumonia, but also other processes including atelectasis, edema, scarring but with no favored interpretation [often including the phrase pneumonia cannot be excluded]); and (4) infiltrate (ie, an infiltrate or consolidation most consistent with pneumonia). The pulmonary specialist independently categorized CXRs and provided a definitive radiographic interpretation whenever possible.
Microbiology
Blood cultures, sputum Gram stain and culture were performed by the clinical laboratory. Pneumococcal‐specific urinary antigen and serology were performed as previously described.[22]
Procalcitonin Measurement
Serum ProCT was measured using resolved amplified cryptate emission technology (Kryptor PCT, Brahms, Henningsdorf, Germany). Functional sensitivity is 0.06 ng/mL (normal serum levels are 0.033 0.003 ng/mL).[23, 24, 25] ProCT results were not available to investigators at the time of clinical or radiographic assessments.
Statistical Analysis
Categorical and continuous distributions were compared using Fisher's exact and Wilcoxon tests, respectively, and summarized by proportions and medians, and means and standard deviations. Log‐axis boxplots were used to graphically display the skewed distributions of ProCT. Stacked bar charts were used to depict discrete distributions of diagnoses by ProCT group. Receiver operating characteristic (ROC) curves relating ProCT to chest radiographs were computed, and sensitivity, specificity, positive predictive value (PPV) and negative predictive value (NPV) were calculated for ProCT thresholds. Logistic regression was used to estimate odds ratios (OR), and associated P values and confidence intervals, to quantify associations between infiltrate/non‐infiltrate and dichotomized or log‐transformed ProCT. SAS 9.2 (SAS Institute, Inc, Cary, NC) was used for analyses, using 2‐sided 0.05 level tests.
RESULTS
Study Population and Clinical Diagnoses
During 2 winters, 532 subjects admitted for 556 respiratory illnesses were recruited. Two did not have chest radiographs, 16 illnesses were non‐pulmonary, and 10 did not have admission ProCT levels, leaving 528 illnesses for analysis (Table 1). Subjects averaged 65 years of age, predominately lived at home, and a high percentage had underlying diseases. The leading primary admission diagnoses assigned by the pulmonologist were pneumonia and AECOPD at 31% and 27%, respectively. Of the 163 illnesses assigned a primary or secondary admitting diagnosis of pneumonia, infiltrates were identified on the admission radiograph by the pulmonologist in 156 (96%).
| Illnesses N = 528 (%) | |
|---|---|
| |
| Age (mean SD) | 65 17 |
| Female | 278 (53) |
| Race | |
| White | 409 (77) |
| African American | 119 (23) |
| Hispanic | 53 (10) |
| Residence | |
| Community | 488 (92) |
| Assisted living | 27 (5) |
| Nursing home | 13 (2) |
| Medical conditions | |
| Diabetes | 188 (36) |
| CHF | 153 (29) |
| COPD | 216 (41) |
| Chronic renal failure | 21 (4) |
| Past or active smoker | 395 (75) |
| Current influenza vaccine | 371 (70) |
| Prior pneumococcal vaccine | 432 (82) |
| Oral steroids | 69 (13) |
| Inhaled steroids | 201 (38) |
| Home oxygen | 129 (24) |
| Symptoms, No. (%) | |
| Upper respiratory | 350 (66) |
| Cough | 489 (93) |
| Sputum production | 390 (74) |
| Dyspnea | 496 (94) |
| Wheezing | 345 (65) |
| Constitutional | 271 (51) |
| Feverish | 293 (55) |
| Rigors | 118 (22) |
| Physical exam | |
| Wheezing | 279 (53) |
| Rales | 211 (40) |
| Rhonchi | 144 (27) |
| Temperature (mean SD) | 37.2 1.0 |
| Respiratory rate (mean SD) | 25 7 |
| Laboratory data | |
| Oxygen saturation (mean SD) | 92.3 5.5 |
| WBC 103/ml (mean SD) | 9.4 4.8 |
| Clinical diagnosis | |
| Pneumonia | 163 (31) |
| Asthma | 76 (14) |
| CHF | 45 (9) |
| Bronchitis | 83 (16) |
| AECOPD | 142 (27) |
| Other pulmonary | 19 (4) |
| Therapy | |
| Antibacterials | 463 (88) |
| Antivirals | 38 (7) |
| Outcome | |
| Intensive care | 43 (8) |
| Respiratory failure | 29 (6) |
| Death | 6 (1) |
| Length of stay (mean SD) | 5.9 18.7 |
Radiographic Classifications
Based on radiology reports, 213 (40%) were classified as NAD, 76 (14%) as other definitive findings, 75 (14%) as infiltrates, and 164 (31%) as indeterminate. The pulmonologist concurred with the radiology report for most NAD (199/213) and infiltrate (67/75) classifications, but only 4 as indeterminate, assigning approximately half the radiologist's indeterminate CXRs to infiltrate and one‐quarter each to NAD and other categories.
Relationship of ProCT With Clinical and Radiographic Features
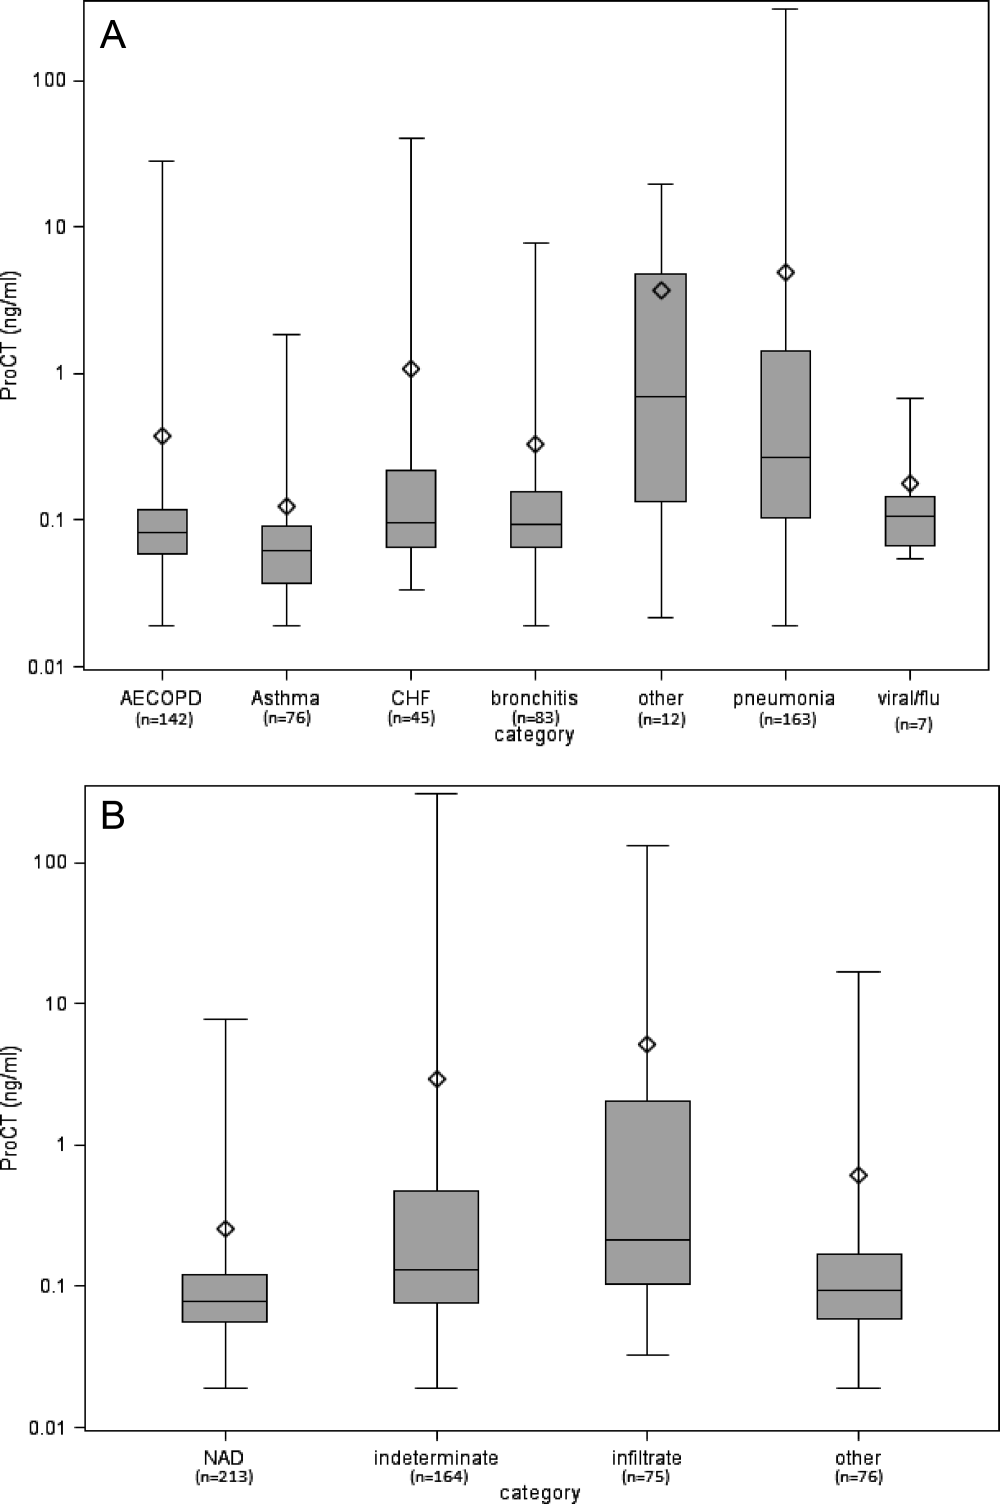
The relationship between clinical admitting diagnosis and ProCT is shown in Figure 1A. Subjects with pneumonia had a median ProCT of 0.27 ng/ml (interquartile range [IQR] 1.3), significantly greater than subjects with AECOPD, asthma, acute bronchitis, and viral/emnfluenza. Subjects assigned to the other diagnoses category (ie, skin or urinary infections, empyema) generally had higher ProCT values (median 0.70 ng/ml, IQR 4.6).
The relationship between the radiologist's classification and ProCT is shown in Figure 1B. Median ProCT levels were significantly lower in subjects with radiographs classified as NAD compared to those showing infiltrates (P < 0.0001). Those classified as indeterminate in radiology reports had a median ProCT value (0.13 ng/ml) midway between those with NAD (0.08 ng/ml) and infiltrates (0.21 ng/ml). Similarly, illnesses with radiographs classified by the pulmonologist as infiltrates also had significantly higher median ProCT levels (0.33 ng/ml, IQR 1.33) than those classified as NAD (0.08 ng/ml, IQR 0.06; P < 0.0001), and other definitive findings (0.11 ng/ml, IQR 0.17). Notably, duration of symptoms prior to evaluation did not affect the relationship between ProCT level and radiographic classification (data not shown). All subjects with infiltrates according to the radiologist's report received early antibiotics, as did 97% and 80% with indeterminate radiographs and NAD, respectively.
Predictive Value of ProCT for Interpreting Indeterminate Radiographs
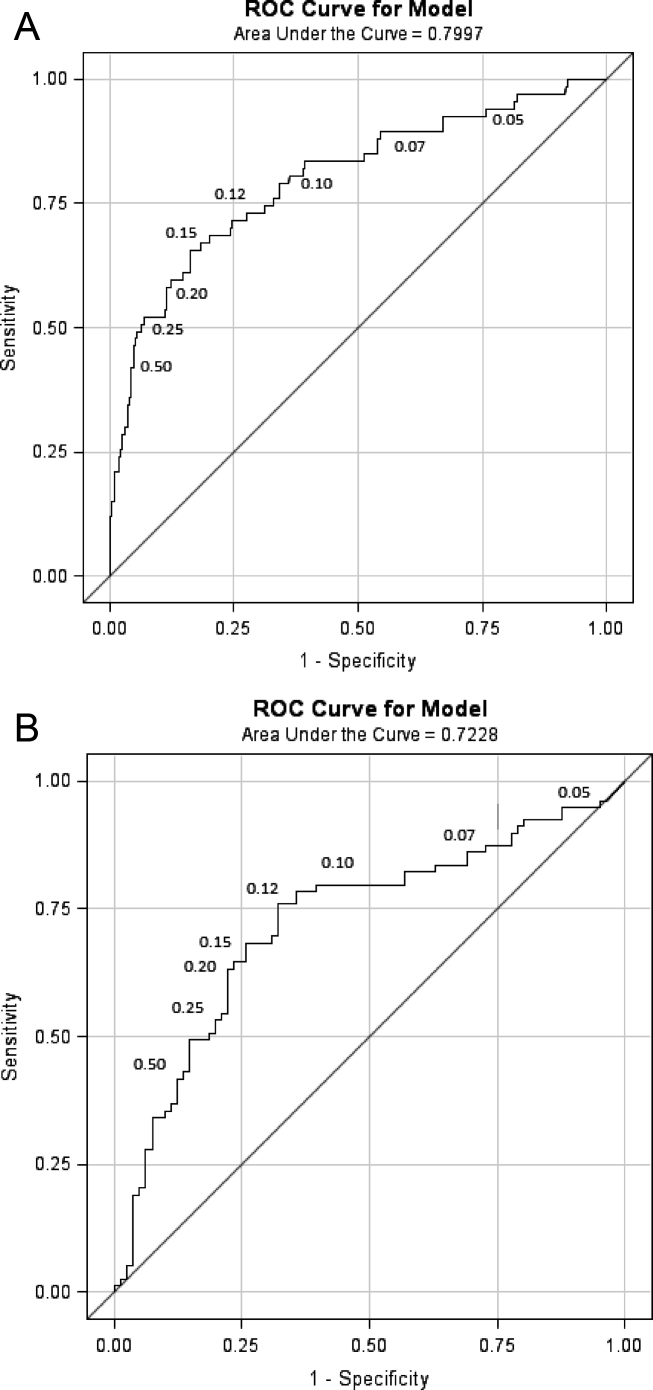
We were specifically interested to learn if ProCT could help clinicians interpret the large number of indeterminate radiographs. As a first step, we evaluated the diagnostic accuracy of ProCT for radiographic infiltrates by calculating the ROC curve (Figure 2A), using cases in which radiologist and pulmonologist concurred on the classification as infiltrate (n = 67) or no infiltrate (ie, NAD or other definitive finding; n = 273). For these cases, the ROC had an area under curve (AUC) of 0.80 (P < 0.0001), indicating moderate predictive accuracy of ProCT for the presence of an infiltrate. The OR for an infiltrate increased steadily with higher ProCT thresholds, quadrupling from 3.9 to 15.6 as the threshold increased from 0.05 to 0.50 ng/ml (Table 2). Using the commonly defined 0.25 ng/ml ProCT threshold for which antibiotics have been recommended for respiratory infections, the PPV for an infiltrate was 61% and the NPV 89%.
| ProCT Threshold (ng/ml) | Sensitivity (%) | Specificity (%) | OR | P Value |
|---|---|---|---|---|
| ||||
| 0.05 | 94 | 20 | 3.9 | 0.012 |
| 0.07 | 90 | 42 | 6.1 | <0.0001 |
| 0.10 | 79 | 65 | 7.1 | <0.0001 |
| 0.12 | 73 | 72 | 7.1 | <0.0001 |
| 0.15* | 67 | 82 | 9.1 | <0.0001 |
| 0.20 | 58 | 88 | 10.5 | <0.0001 |
| 0.25 | 52 | 92 | 12.5 | <0.0001 |
| 0.50 | 42 | 96 | 15.6 | <0.0001 |
Next, we analyzed the 164 illnesses with indeterminate radiographs. Of these, the pulmonologist classified 79 as infiltrate (median ProCT 0.29 ng/ml), 40 as NAD (median ProCT 0.08 ng/ml), 41 as other definitive findings (median ProCT 0.10 ng/ml), and 4 as indeterminate. The admitting diagnosis and corresponding median ProCT for these subjects was pneumonia in 78 (0.28 ng/ml), AECOPD in 26 (0.09 ng/ml), acute bronchitis in 30 (0.09 ng/ml), asthma in 11 (0.08 ng/ml), and CHF in 14 (0.10 ng/ml). The ROC AUC for these cases (excluding 4 considered indeterminate by the pulmonologist) was slightly lower (0.72, P < 0.0001) than the prior analysis (Figure 2B), but ProCT retained moderate predictive value for the presence of infiltrates as diagnosed by the pulmonologist on indeterminate radiographs (Table 3).
| ProCT Threshold | Sensitivity (%) | Specificity (%) | PPV (%) | NPV (%) | OR | P Value | Predicted Probability (%) |
|---|---|---|---|---|---|---|---|
| |||||||
| 0.05 | 95 | 7 | 50 | 60 | 1.5 | 0.54 | 32 |
| 0.07 | 86 | 27 | 54 | 67 | 2.3 | 0.04 | 35 |
| 0.10 | 80 | 59 | 66 | 75 | 5.7 | <0.0001 | 40 |
| 0.12* | 76 | 67 | 69 | 74 | 6.3 | <0.0001 | 42 |
| 0.15 | 67 | 74 | 72 | 70 | 5.8 | <0.0001 | 45 |
| 0.20 | 63 | 78 | 74 | 69 | 6.0 | <0.0001 | 49 |
| 0.25 | 53 | 80 | 72 | 64 | 4.6 | <0.0001 | 52 |
| 0.50 | 37 | 88 | 74 | 59 | 4.1 | 0.0006 | 60 |
Since clinical determinations by a single pulmonologist may be subjective, we sought to objectively assess the accuracy of assigned admission diagnoses by analyzing additional data, including bacterial tests, follow‐up radiographs, and final discharge diagnoses. As a surrogate of invasive bacterial infection, we used identification of S. pneumoniae as the outcome, since multiple complementary diagnostic assays were used, thus minimizing the uncertainty of sputum cultures. Overall, we identified 58 pneumococcal infections (Table 4). The pulmonologist's admitting diagnosis of pneumonia captured a higher proportion (52% for any test positive) of S. pneumoniae cases than identification of a radiographic infiltrate by the radiologist (26%), and equivalent to the pulmonologist's radiographic reading (57%) or elevated ProCT alone (57%). There was an absolute 14% increase (27% relative increase) in the detection of S. pneumoniae infections by addition of ProCT to the pulmonologist's diagnosis. A similar analysis limited to the 164 subjects with indeterminate radiographs found that 13 of 19 (68%) of S. pneumoniae diagnoses had been assigned a clinical diagnosis of pneumonia by the pulmonologist.
| S. pneumonia Confirmed by Diagnostic Assay No. (%) | |||||
|---|---|---|---|---|---|
| Criteria | Blood Culture + (n = 7) | Urine Ag + (n = 27) | Serology + (n = 28) | Sputum + (n = 20) | Any Test + (n = 58) |
| |||||
| Radiologist CXR read as infiltrate | 3 (43) | 9 (33) | 10 (36) | 3 (15) | 15 (26) |
| Pulmonologist CXR read as infiltrate | 6 (86) | 17 (62) | 18 (64) | 10 (50) | 33 (57) |
| Pulmonologist clinical diagnosis of pneumonia | 6 (86) | 16 (60) | 16 (57) | 8 (40) | 30 (52) |
| Pulmonologist clinical diagnosis of AECOPD | 0 (0) | 4 (15) | 5 (18) | 5 (25) | 8 (14) |
| Procalcitonin 0.25 ng/ml | 6 (86) | 18 (67) | 17 (61) | 9 (45) | 33 (57) |
| Pulmonologist diagnosis of pneumonia and/or ProCT 0.25 ng/ml | 7 (100) | 19 (70) | 20 (71) | 10 (50) | 38 (66) |
We also determined how often subsequent radiographs showed evolution to a definitive infiltrate in indeterminate cases that the pulmonologist had classified as either NAD or other finding. Only 3/20 with repeat films showed a definitive infiltrate, none of whom had evidence of bacterial infection, and all 3 had ProCT <0.25 ng/ml. In contrast, 10 of 21 subjects with indeterminate CXRs, that the pulmonologist had classified as an infiltrate, developed definitive infiltrates on follow‐up studies (P = 0.04), and 8 remained indeterminate.
Finally, 93% of those assigned an admitting pneumonia diagnosis by the pulmonologist had primary (71%) or secondary (22%) discharge diagnosis of pneumonia. Of the additional 28 subjects with a discharge diagnosis of pneumonia, for whom the pulmonologist assigned non‐pneumonia admitting diagnoses, none had positive blood cultures or evidence of S. pneumoniae infection, and only one had a follow‐up radiograph showing a definitive infiltrate.
DISCUSSION
Pneumonia can be a serious illness and, if left untreated, result in death. Hence, infectious disease and pulmonary societies advocate timely administration of antibiotics. Unfortunately, clinical diagnosis of pneumonia is difficult, as clinical and radiographic features are often ambiguous. These factors result in liberal use of broad‐spectrum antibiotics, often in patients with viral infection, in whom antibiotic side effects outweigh benefit.[26] Although pneumonia guidelines recommend early antibiotic therapy for patients with infiltrates on CXR, we found that early administration of antibiotics for possible pneumonia is nearly universal.[2, 27] Thus, an objective laboratory test indicative of pneumonia would be a useful adjunct when making treatment decisions.
In an attempt to curb excessive antibiotic use, European investigators have used ProCT to guide therapy for respiratory tract infection, including pneumonia, without increased adverse outcomes.[17, 19, 28, 29] Antibiotics are recommended when ProCT levels are 0.25 ng/ml, rather than based on radiographic or microbiological results. However, ProCT‐guided antibiotic management has not been adopted in the United States, and radiographic findings are a major determinant for diagnosis of pneumonia and antibiotic administration.
Thus, we were interested in correlating ProCT levels with the presence of radiographic infiltrates, and especially how ProCT could assist in interpreting the vexing problem of indeterminate CXRs. We found a direct relationship between an increased ProCT level and definitive infiltrates on CXR, similar to results reported by others.[18, 20, 21] However, these studies did not address illnesses with indeterminate radiographs, which accounted for approximately one‐third of the radiologist's readings in our study. Our situation is likely not unique. In a post hoc analysis of CXRs from subjects with pneumonia in the PORT study, independent radiologists interpreted a similar proportion of CXRs as either no acute disease or possible infiltrates.[30] Since indeterminate readings include the possibility of an infiltrate, it is not surprising that 97% of our subjects received early antibiotic treatment.
Given current pneumonia treatment guidelines, ProCT testing for those with definitive infiltrates would not add to patient management, as all should receive early antibiotics. However, ProCT measurement could have significant impact on management in those with indeterminate films. We found ProCT was moderately predictive for infiltrates when utilizing the pulmonologist's interpretation of indeterminate CXRs. This is concordant with a recent study reporting a similar ROC (0.72) for ProCT for diagnosing pneumonia in patients with dyspnea, and more predictive of pneumonia than any clinical variable.[31]
The major limitation of our study is the lack of a gold standard for diagnosis of pneumonia. We chose to use a pulmonary specialist to provide admission diagnoses, and independently interpret radiographs in the context of clinical findings. Although imperfect, we feel this approach best reflects good medical practice by an experienced clinician evaluating the CXR in context of a patient's history and physical exam. Importantly, analysis of the concurrent microbiology data, follow‐up radiographs, and discharge diagnoses supports the accuracy of the admitting diagnoses of pneumonia and radiographic interpretations by the pulmonologist. Secondly, our findings may not be applicable to immunocompromised or previously treated patients.
How should a busy physician respond to a patient with dyspnea and fever when faced with an indeterminate radiographic report, since no method for the diagnosis of pneumonia is infallible?[8, 32] Clearly, a pulmonary consultation on all such patients is impractical. Our data confirms previous results that high ProCT values are correlated with an infiltrate on CXR and low values have a NPV of nearly 90%. Furthermore, low ProCT values predict low mortality across all levels of standard severity scoring indexes.[33] Thus, a low ProCT may help clinicians feel more confident to delay or stop antibiotics in a patient in whom clinical suspicion for bacterial pneumonia is low, yet the radiographic report states pneumonia cannot be ruled out.[34] Such strategies may assist in reducing unnecessary antibiotic use in the United States.[35]
Disclosures
Funding for this study was provided by NIAID‐1R01AI079446‐01. This work was presented in part at the Infectious Diseases Society of America, Boston, MA, October 2011. The authors report no conflicts of interest.
Pneumonia is a common reason for hospitalization and major rationale for administration of antibiotics in the United States.[1] Management guidelines for patients hospitalized with community‐acquired pneumonia recommend early antibiotic therapy. Quality measures adopted by the Centers for Medicare and Medicaid Services include antibiotic administration within 6 hours of presentation, based on a relationship between early administration and improved survival.[2, 3, 4, 5] However, this imperative has been associated with an increase in incorrect diagnoses of pneumonia.[6, 7] While pneumonia diagnosis would seem straightforward, clinical findings frequently do not differentiate pneumonia from other respiratory illnesses. Thus, an infiltrate on chest radiographs (CXR) is commonly used to assign an admitting diagnosis of pneumonia.[8, 9, 10] However, radiographic reports are often inconclusive and frequently fail to discriminate pneumonic infiltrates from atelectasis, edema, small pleural effusions, or chronic abnormalities. In cases of uncertainty, physicians invariably initiate antibiotics, even when the illness is more consistent with viral bronchitis or asthma, resulting in unnecessary antibiotic use.[6] Previously considered relatively harmless, antibiotic complications can be lethal, and excessive use promotes antimicrobial resistance.[11, 12]
Procalcitonin (ProCT), a calcitonin precursor normally produced in the thyroid and lungs, is secreted by cells throughout the body in response to bacterial infections.[13, 14] Elevated ProCT is used to screen patients with suspected bacterial infection and predict mortality in critically ill patients.[15, 16] Recently, European investigators have used ProCT to guide more selective antibiotic use in patients with symptoms of lower respiratory tract infection (LRTI), including pneumonia.[17, 18, 19] However, few reports describe the relationship of ProCT with radiographic features in hospitalized patients with LRTI, and none focus on patients with indeterminate radiographic readings.[18, 20, 21]
We sought to determine if elevated serum ProCT in adults hospitalized with LRTI symptoms correlates with the clinical diagnosis of pneumonia and definitive infiltrates on CXRs. We specifically assessed ProCT as a diagnostic marker of pneumonia to augment clinical judgment in patients when radiographic findings are indeterminate.
METHODS
Subjects
The study was performed in a 520‐bed, general medicalsurgical hospital, using subjects participating in a study of the relationship between biomarkers and microbiologic diagnoses (to be described in a separate publication). Adults 21 years of age admitted with a diagnosis compatible with respiratory tract infection (pneumonia, acute exacerbations of chronic obstructive pulmonary disease [AECOPD], acute bronchitis, asthma, upper respiratory infection, viral syndrome, respiratory failure, and congestive heart failure [CHF] with signs of infection) were recruited during winters of 20082009 and 20092010. Patients were screened within 24 hours of admission; immunosupression, lung abscess, witnessed aspiration, or previous antibiotic use were exclusion criteria. Blood for ProCT measurement was collected in the emergency room prior to antibiotics. Subjects or legal guardians provided written informed consent, and institutional review boards approved the study.
Illness Evaluation
At enrollment, demographic, clinical, and laboratory data were collected. To provide consistency of data, 1 investigator (a clinical pulmonary specialist), after interviewing, examining each subject, and considering the radiographic findings, assigned a primary and secondary clinical admitting diagnosis: pneumonia, AECOPD, asthma exacerbation, CHF, acute bronchitis, viral syndrome or influenza, other respiratory illness, or non‐respiratory illness. These diagnoses were used for the analysis but were not available to treating physicians. Discharge diagnoses, based on International Classification of Diseases, Ninth Revision (ICD‐9) codes, and official results of follow‐up chest radiographs were also recorded.
Radiographic Interpretations
All official admission chest radiographic reports were reviewed by one of the investigators. Radiographic descriptions were noted with attention to the following comments: clear or no acute change from prior radiographs, infiltrates without consolidation, consolidation, edema, atelectasis, and pleural effusion. For our analysis, chest radiographs were categorized into 4 groups: (1) No acute disease (NAD) (ie, clear or no change from prior radiographs); (2) Other definitive radiographic abnormality (atelectasis, edema, or pleural effusion); (3) Indeterminate (findings consistent with pneumonia, but also other processes including atelectasis, edema, scarring but with no favored interpretation [often including the phrase pneumonia cannot be excluded]); and (4) infiltrate (ie, an infiltrate or consolidation most consistent with pneumonia). The pulmonary specialist independently categorized CXRs and provided a definitive radiographic interpretation whenever possible.
Microbiology
Blood cultures, sputum Gram stain and culture were performed by the clinical laboratory. Pneumococcal‐specific urinary antigen and serology were performed as previously described.[22]
Procalcitonin Measurement
Serum ProCT was measured using resolved amplified cryptate emission technology (Kryptor PCT, Brahms, Henningsdorf, Germany). Functional sensitivity is 0.06 ng/mL (normal serum levels are 0.033 0.003 ng/mL).[23, 24, 25] ProCT results were not available to investigators at the time of clinical or radiographic assessments.
Statistical Analysis
Categorical and continuous distributions were compared using Fisher's exact and Wilcoxon tests, respectively, and summarized by proportions and medians, and means and standard deviations. Log‐axis boxplots were used to graphically display the skewed distributions of ProCT. Stacked bar charts were used to depict discrete distributions of diagnoses by ProCT group. Receiver operating characteristic (ROC) curves relating ProCT to chest radiographs were computed, and sensitivity, specificity, positive predictive value (PPV) and negative predictive value (NPV) were calculated for ProCT thresholds. Logistic regression was used to estimate odds ratios (OR), and associated P values and confidence intervals, to quantify associations between infiltrate/non‐infiltrate and dichotomized or log‐transformed ProCT. SAS 9.2 (SAS Institute, Inc, Cary, NC) was used for analyses, using 2‐sided 0.05 level tests.
RESULTS
Study Population and Clinical Diagnoses
During 2 winters, 532 subjects admitted for 556 respiratory illnesses were recruited. Two did not have chest radiographs, 16 illnesses were non‐pulmonary, and 10 did not have admission ProCT levels, leaving 528 illnesses for analysis (Table 1). Subjects averaged 65 years of age, predominately lived at home, and a high percentage had underlying diseases. The leading primary admission diagnoses assigned by the pulmonologist were pneumonia and AECOPD at 31% and 27%, respectively. Of the 163 illnesses assigned a primary or secondary admitting diagnosis of pneumonia, infiltrates were identified on the admission radiograph by the pulmonologist in 156 (96%).
| Illnesses N = 528 (%) | |
|---|---|
| |
| Age (mean SD) | 65 17 |
| Female | 278 (53) |
| Race | |
| White | 409 (77) |
| African American | 119 (23) |
| Hispanic | 53 (10) |
| Residence | |
| Community | 488 (92) |
| Assisted living | 27 (5) |
| Nursing home | 13 (2) |
| Medical conditions | |
| Diabetes | 188 (36) |
| CHF | 153 (29) |
| COPD | 216 (41) |
| Chronic renal failure | 21 (4) |
| Past or active smoker | 395 (75) |
| Current influenza vaccine | 371 (70) |
| Prior pneumococcal vaccine | 432 (82) |
| Oral steroids | 69 (13) |
| Inhaled steroids | 201 (38) |
| Home oxygen | 129 (24) |
| Symptoms, No. (%) | |
| Upper respiratory | 350 (66) |
| Cough | 489 (93) |
| Sputum production | 390 (74) |
| Dyspnea | 496 (94) |
| Wheezing | 345 (65) |
| Constitutional | 271 (51) |
| Feverish | 293 (55) |
| Rigors | 118 (22) |
| Physical exam | |
| Wheezing | 279 (53) |
| Rales | 211 (40) |
| Rhonchi | 144 (27) |
| Temperature (mean SD) | 37.2 1.0 |
| Respiratory rate (mean SD) | 25 7 |
| Laboratory data | |
| Oxygen saturation (mean SD) | 92.3 5.5 |
| WBC 103/ml (mean SD) | 9.4 4.8 |
| Clinical diagnosis | |
| Pneumonia | 163 (31) |
| Asthma | 76 (14) |
| CHF | 45 (9) |
| Bronchitis | 83 (16) |
| AECOPD | 142 (27) |
| Other pulmonary | 19 (4) |
| Therapy | |
| Antibacterials | 463 (88) |
| Antivirals | 38 (7) |
| Outcome | |
| Intensive care | 43 (8) |
| Respiratory failure | 29 (6) |
| Death | 6 (1) |
| Length of stay (mean SD) | 5.9 18.7 |
Radiographic Classifications
Based on radiology reports, 213 (40%) were classified as NAD, 76 (14%) as other definitive findings, 75 (14%) as infiltrates, and 164 (31%) as indeterminate. The pulmonologist concurred with the radiology report for most NAD (199/213) and infiltrate (67/75) classifications, but only 4 as indeterminate, assigning approximately half the radiologist's indeterminate CXRs to infiltrate and one‐quarter each to NAD and other categories.
Relationship of ProCT With Clinical and Radiographic Features
The relationship between clinical admitting diagnosis and ProCT is shown in Figure 1A. Subjects with pneumonia had a median ProCT of 0.27 ng/ml (interquartile range [IQR] 1.3), significantly greater than subjects with AECOPD, asthma, acute bronchitis, and viral/emnfluenza. Subjects assigned to the other diagnoses category (ie, skin or urinary infections, empyema) generally had higher ProCT values (median 0.70 ng/ml, IQR 4.6).
The relationship between the radiologist's classification and ProCT is shown in Figure 1B. Median ProCT levels were significantly lower in subjects with radiographs classified as NAD compared to those showing infiltrates (P < 0.0001). Those classified as indeterminate in radiology reports had a median ProCT value (0.13 ng/ml) midway between those with NAD (0.08 ng/ml) and infiltrates (0.21 ng/ml). Similarly, illnesses with radiographs classified by the pulmonologist as infiltrates also had significantly higher median ProCT levels (0.33 ng/ml, IQR 1.33) than those classified as NAD (0.08 ng/ml, IQR 0.06; P < 0.0001), and other definitive findings (0.11 ng/ml, IQR 0.17). Notably, duration of symptoms prior to evaluation did not affect the relationship between ProCT level and radiographic classification (data not shown). All subjects with infiltrates according to the radiologist's report received early antibiotics, as did 97% and 80% with indeterminate radiographs and NAD, respectively.
Predictive Value of ProCT for Interpreting Indeterminate Radiographs
We were specifically interested to learn if ProCT could help clinicians interpret the large number of indeterminate radiographs. As a first step, we evaluated the diagnostic accuracy of ProCT for radiographic infiltrates by calculating the ROC curve (Figure 2A), using cases in which radiologist and pulmonologist concurred on the classification as infiltrate (n = 67) or no infiltrate (ie, NAD or other definitive finding; n = 273). For these cases, the ROC had an area under curve (AUC) of 0.80 (P < 0.0001), indicating moderate predictive accuracy of ProCT for the presence of an infiltrate. The OR for an infiltrate increased steadily with higher ProCT thresholds, quadrupling from 3.9 to 15.6 as the threshold increased from 0.05 to 0.50 ng/ml (Table 2). Using the commonly defined 0.25 ng/ml ProCT threshold for which antibiotics have been recommended for respiratory infections, the PPV for an infiltrate was 61% and the NPV 89%.
| ProCT Threshold (ng/ml) | Sensitivity (%) | Specificity (%) | OR | P Value |
|---|---|---|---|---|
| ||||
| 0.05 | 94 | 20 | 3.9 | 0.012 |
| 0.07 | 90 | 42 | 6.1 | <0.0001 |
| 0.10 | 79 | 65 | 7.1 | <0.0001 |
| 0.12 | 73 | 72 | 7.1 | <0.0001 |
| 0.15* | 67 | 82 | 9.1 | <0.0001 |
| 0.20 | 58 | 88 | 10.5 | <0.0001 |
| 0.25 | 52 | 92 | 12.5 | <0.0001 |
| 0.50 | 42 | 96 | 15.6 | <0.0001 |
Next, we analyzed the 164 illnesses with indeterminate radiographs. Of these, the pulmonologist classified 79 as infiltrate (median ProCT 0.29 ng/ml), 40 as NAD (median ProCT 0.08 ng/ml), 41 as other definitive findings (median ProCT 0.10 ng/ml), and 4 as indeterminate. The admitting diagnosis and corresponding median ProCT for these subjects was pneumonia in 78 (0.28 ng/ml), AECOPD in 26 (0.09 ng/ml), acute bronchitis in 30 (0.09 ng/ml), asthma in 11 (0.08 ng/ml), and CHF in 14 (0.10 ng/ml). The ROC AUC for these cases (excluding 4 considered indeterminate by the pulmonologist) was slightly lower (0.72, P < 0.0001) than the prior analysis (Figure 2B), but ProCT retained moderate predictive value for the presence of infiltrates as diagnosed by the pulmonologist on indeterminate radiographs (Table 3).
| ProCT Threshold | Sensitivity (%) | Specificity (%) | PPV (%) | NPV (%) | OR | P Value | Predicted Probability (%) |
|---|---|---|---|---|---|---|---|
| |||||||
| 0.05 | 95 | 7 | 50 | 60 | 1.5 | 0.54 | 32 |
| 0.07 | 86 | 27 | 54 | 67 | 2.3 | 0.04 | 35 |
| 0.10 | 80 | 59 | 66 | 75 | 5.7 | <0.0001 | 40 |
| 0.12* | 76 | 67 | 69 | 74 | 6.3 | <0.0001 | 42 |
| 0.15 | 67 | 74 | 72 | 70 | 5.8 | <0.0001 | 45 |
| 0.20 | 63 | 78 | 74 | 69 | 6.0 | <0.0001 | 49 |
| 0.25 | 53 | 80 | 72 | 64 | 4.6 | <0.0001 | 52 |
| 0.50 | 37 | 88 | 74 | 59 | 4.1 | 0.0006 | 60 |
Since clinical determinations by a single pulmonologist may be subjective, we sought to objectively assess the accuracy of assigned admission diagnoses by analyzing additional data, including bacterial tests, follow‐up radiographs, and final discharge diagnoses. As a surrogate of invasive bacterial infection, we used identification of S. pneumoniae as the outcome, since multiple complementary diagnostic assays were used, thus minimizing the uncertainty of sputum cultures. Overall, we identified 58 pneumococcal infections (Table 4). The pulmonologist's admitting diagnosis of pneumonia captured a higher proportion (52% for any test positive) of S. pneumoniae cases than identification of a radiographic infiltrate by the radiologist (26%), and equivalent to the pulmonologist's radiographic reading (57%) or elevated ProCT alone (57%). There was an absolute 14% increase (27% relative increase) in the detection of S. pneumoniae infections by addition of ProCT to the pulmonologist's diagnosis. A similar analysis limited to the 164 subjects with indeterminate radiographs found that 13 of 19 (68%) of S. pneumoniae diagnoses had been assigned a clinical diagnosis of pneumonia by the pulmonologist.
| S. pneumonia Confirmed by Diagnostic Assay No. (%) | |||||
|---|---|---|---|---|---|
| Criteria | Blood Culture + (n = 7) | Urine Ag + (n = 27) | Serology + (n = 28) | Sputum + (n = 20) | Any Test + (n = 58) |
| |||||
| Radiologist CXR read as infiltrate | 3 (43) | 9 (33) | 10 (36) | 3 (15) | 15 (26) |
| Pulmonologist CXR read as infiltrate | 6 (86) | 17 (62) | 18 (64) | 10 (50) | 33 (57) |
| Pulmonologist clinical diagnosis of pneumonia | 6 (86) | 16 (60) | 16 (57) | 8 (40) | 30 (52) |
| Pulmonologist clinical diagnosis of AECOPD | 0 (0) | 4 (15) | 5 (18) | 5 (25) | 8 (14) |
| Procalcitonin 0.25 ng/ml | 6 (86) | 18 (67) | 17 (61) | 9 (45) | 33 (57) |
| Pulmonologist diagnosis of pneumonia and/or ProCT 0.25 ng/ml | 7 (100) | 19 (70) | 20 (71) | 10 (50) | 38 (66) |
We also determined how often subsequent radiographs showed evolution to a definitive infiltrate in indeterminate cases that the pulmonologist had classified as either NAD or other finding. Only 3/20 with repeat films showed a definitive infiltrate, none of whom had evidence of bacterial infection, and all 3 had ProCT <0.25 ng/ml. In contrast, 10 of 21 subjects with indeterminate CXRs, that the pulmonologist had classified as an infiltrate, developed definitive infiltrates on follow‐up studies (P = 0.04), and 8 remained indeterminate.
Finally, 93% of those assigned an admitting pneumonia diagnosis by the pulmonologist had primary (71%) or secondary (22%) discharge diagnosis of pneumonia. Of the additional 28 subjects with a discharge diagnosis of pneumonia, for whom the pulmonologist assigned non‐pneumonia admitting diagnoses, none had positive blood cultures or evidence of S. pneumoniae infection, and only one had a follow‐up radiograph showing a definitive infiltrate.
DISCUSSION
Pneumonia can be a serious illness and, if left untreated, result in death. Hence, infectious disease and pulmonary societies advocate timely administration of antibiotics. Unfortunately, clinical diagnosis of pneumonia is difficult, as clinical and radiographic features are often ambiguous. These factors result in liberal use of broad‐spectrum antibiotics, often in patients with viral infection, in whom antibiotic side effects outweigh benefit.[26] Although pneumonia guidelines recommend early antibiotic therapy for patients with infiltrates on CXR, we found that early administration of antibiotics for possible pneumonia is nearly universal.[2, 27] Thus, an objective laboratory test indicative of pneumonia would be a useful adjunct when making treatment decisions.
In an attempt to curb excessive antibiotic use, European investigators have used ProCT to guide therapy for respiratory tract infection, including pneumonia, without increased adverse outcomes.[17, 19, 28, 29] Antibiotics are recommended when ProCT levels are 0.25 ng/ml, rather than based on radiographic or microbiological results. However, ProCT‐guided antibiotic management has not been adopted in the United States, and radiographic findings are a major determinant for diagnosis of pneumonia and antibiotic administration.
Thus, we were interested in correlating ProCT levels with the presence of radiographic infiltrates, and especially how ProCT could assist in interpreting the vexing problem of indeterminate CXRs. We found a direct relationship between an increased ProCT level and definitive infiltrates on CXR, similar to results reported by others.[18, 20, 21] However, these studies did not address illnesses with indeterminate radiographs, which accounted for approximately one‐third of the radiologist's readings in our study. Our situation is likely not unique. In a post hoc analysis of CXRs from subjects with pneumonia in the PORT study, independent radiologists interpreted a similar proportion of CXRs as either no acute disease or possible infiltrates.[30] Since indeterminate readings include the possibility of an infiltrate, it is not surprising that 97% of our subjects received early antibiotic treatment.
Given current pneumonia treatment guidelines, ProCT testing for those with definitive infiltrates would not add to patient management, as all should receive early antibiotics. However, ProCT measurement could have significant impact on management in those with indeterminate films. We found ProCT was moderately predictive for infiltrates when utilizing the pulmonologist's interpretation of indeterminate CXRs. This is concordant with a recent study reporting a similar ROC (0.72) for ProCT for diagnosing pneumonia in patients with dyspnea, and more predictive of pneumonia than any clinical variable.[31]
The major limitation of our study is the lack of a gold standard for diagnosis of pneumonia. We chose to use a pulmonary specialist to provide admission diagnoses, and independently interpret radiographs in the context of clinical findings. Although imperfect, we feel this approach best reflects good medical practice by an experienced clinician evaluating the CXR in context of a patient's history and physical exam. Importantly, analysis of the concurrent microbiology data, follow‐up radiographs, and discharge diagnoses supports the accuracy of the admitting diagnoses of pneumonia and radiographic interpretations by the pulmonologist. Secondly, our findings may not be applicable to immunocompromised or previously treated patients.
How should a busy physician respond to a patient with dyspnea and fever when faced with an indeterminate radiographic report, since no method for the diagnosis of pneumonia is infallible?[8, 32] Clearly, a pulmonary consultation on all such patients is impractical. Our data confirms previous results that high ProCT values are correlated with an infiltrate on CXR and low values have a NPV of nearly 90%. Furthermore, low ProCT values predict low mortality across all levels of standard severity scoring indexes.[33] Thus, a low ProCT may help clinicians feel more confident to delay or stop antibiotics in a patient in whom clinical suspicion for bacterial pneumonia is low, yet the radiographic report states pneumonia cannot be ruled out.[34] Such strategies may assist in reducing unnecessary antibiotic use in the United States.[35]
Disclosures
Funding for this study was provided by NIAID‐1R01AI079446‐01. This work was presented in part at the Infectious Diseases Society of America, Boston, MA, October 2011. The authors report no conflicts of interest.
- , , , et al. The burden of community‐acquired pneumonia in seniors: results of a population‐based study. Clin Infect Dis. 2004;39:1642–1650.
- , , , et al. Infectious Diseases Society of America/American Thoracic Society consensus guidelines on the management of community‐acquired pneumonia in adults. Clin Infect Dis. 2007;44(suppl 2):S27–S72.
- Centers for Medicare and Medicaid Services. The Medicare national pneumonia quality improvement project. Available at: http://www.cms.gov/HospitalQualityInits/. Accessed September 8, 2011.
- , , , , . Timing of antibiotic administration and outcomes for Medicare patients hospitalized with community‐acquired pneumonia. Arch Intern Med. 2004;164:637–644.
- , , , et al. Quality of care, process, and outcomes in elderly patients with pneumonia. JAMA. 1997;278:2080–2084.
- , , , . Misdiagnosis of community‐acquired pneumonia and inappropriate utilization of antibiotics: side effects of the 4‐h antibiotic administration rule. Chest. 2007;131:1865–1869.
- , , . Antibiotic timing and errors in diagnosing pneumonia. Arch Intern Med. 2008;168:351–356.
- , , , . Patients admitted to hospital with suspected pneumonia and normal chest radiographs: epidemiology, microbiology, and outcomes. Am J Med. 2004;117:305–311.
- , , , , . Reliability of radiographic findings and the relation to etiologic agents in community‐acquired pneumonia. Respir Med. 2006;100:926–932.
- , , , . Admission chest radiograph lacks sensitivity in the diagnosis of community‐acquired pneumonia. Am J Med Sci. 2009;337:236–240.
- , . Strategies for reduction in duration of antibiotic use in hospitalized patients. Clin Infect Dis. 2011;52:1232–1240.
- , , , et al. The epidemic of antibiotic‐resistant infections: a call to action for the medical community from the Infectious Diseases Society of America. Clin Infect Dis. 2008;46:155–164.
- , , , , . Clinical review 167: procalcitonin and the calcitonin gene family of peptides in inflammation, infection, and sepsis: a journey from calcitonin back to its precursors. J Clin Endocrinol Metab. 2004;89:1512–1525.
- , , . Procalcitonin assay in systemic inflammation, infection, and sepsis: clinical utility and limitations. Crit Care Med. 2008;36:941–952.
- , , . Procalcitonin in sepsis and systemic inflammation: a harmful biomarker and a therapeutic target. Br J Pharmacol. 2010;159:253–264.
- , , , , . Pneumonitis‐associated hyperprocalcitoninemia. Am J Med Sci. 1996;312:12–18.
- , , , et al. Antibiotic treatment of exacerbations of COPD: a randomized, controlled trial comparing procalcitonin‐guidance with standard therapy. Chest. 2007;131:9–19.
- , , , et al. Procalcitonin versus C‐reactive protein for predicting pneumonia in adults with lower respiratory tract infection in primary care. Br J Gen Pract. 2007;57:555–560.
- , , , et al. Effect of procalcitonin‐based guidelines vs standard guidelines on antibiotic use in lower respiratory tract infections: the ProHOSP randomized controlled trial. JAMA. 2009;302:1059–1066.
- , , , et al. Procalcitonin and C‐reactive protein in hospitalized adult patients with community‐acquired pneumonia or exacerbation of asthma or COPD. Chest. 2011;139:1410–1418.
- , , , et al. Diagnostic and prognostic accuracy of clinical and laboratory parameters in community‐acquired pneumonia. BMC Infect Dis. 2008;7:10.
- , , , et al. Utility of serum procalcitonin values in patients with acute exacerbations of chronic obstructive pulmonary disease: a cautionary note. Int J Chron Obstruct Pulmon Dis. 2112;7:127–135.
- , , . Procalcitonin and its component peptides in systemic inflammation: immunochemical characterization. J Investig Med. 1997;45:552–560.
- , , , . The future diagnostic role of procalcitonin levels: the need for improved sensitivity. Clin Infect Dis. 2003;36:823–824.
- , , , et al. Calcitonin precursor levels in human medullary thyroid carcinoma. Thyroid 2003;13:819–822.
- , , , . Emergency department visits for antibiotic‐associated adverse events. Clin Infect Dis. 2008;47:735–743.
- , , , et al. Guideline tyranny: a response to the article by Baum and Kaltsas. Clin Infect Dis. 2008;47:1117–1118.
- , , , et al. Procalcitonin guidance of antibiotic therapy in community‐acquired pneumonia: a randomized trial. Am J Respir Crit Care Med. 2006;174:84–93.
- , , , et al. Effect of procalcitonin‐guided treatment on antibiotic use and outcome in lower respiratory tract infections: cluster‐randomised, single‐blinded intervention trial. Lancet. 2004;363:600–607.
- , , , et al. Interobserver reliability of the chest radiograph in community‐acquired pneumonia. PORT investigators. Chest. 1996;110:343–350.
- , , , et al. Use of procalcitonin for the diagnosis of pneumonia in patients presenting with a chief complaint of dyspnea: results from the BACH (Biomarkers in Acute Heart Failure) trial. Eur J Heart Fail. 2012;14:278–286.
- , , , , . A multicenter analysis of the ED diagnosis of pneumonia. Am J Emerg Med. 2010;28:862–865.
- , , , et al. Procalcitonin predicts patients at low risk of death from community‐acquired pneumonia across all CRB‐65 classes. Eur Respir J. 2008;31:349–355.
- , , , , , . Antibiotic timing and diagnostic uncertainty in Medicare patients with pneumonia: is it reasonable to expect all patients to receive antibiotics within 4 hours? Chest. 2006;130:16–21.
- . Procalcitonin for triage of patients with respiratory tract symptoms: a case study in the trial design process for approval of a new diagnostic test for lower respiratory tract infection. Clin Infect Dis. 2011;52(S4):S351–S356.
Copyright © 2012 Society of Hospital Medicine

Can Lapatinib Prevent Brain Metastases from Breast Cancer? Data 'Inconclusive'
VIENNA – Mixed results in phase II and III clinical trials leave open the question of whether lapatinib can prevent brain metastases in women with HER2-positive breast cancer.
Lapatinib (Tykerb) did not decrease the development of brain metastases when compared with trastuzumab (Herceptin) – each added to capecitabine (Xeloda) – in the open-label phase III CEREBREL trial. The results were inconclusive, however, for the primary end point of the incidence of central nervous system events as a first sign of relapse.
Favorable findings were reported from the 45-patient phase II LANDSCAPE study. Two-thirds of patients had an objective CNS response to up-front lapatinib plus capecitabine in the single-arm study.
Investigators from both trials reported outcomes at the European Society for Medical Oncology Congress.
‘No Conclusion Can Be Made...’
In the CEREBREL trial, 251 women were treated with lapatinib in combination with capecitabine. Eight (3%) exhibited CNS progression as the first site of relapse. In comparison, 12 (5%) of 250 women given trastuzumab plus capecitabine exhibited CNS progression (P = .360).
The incidence of CNS progression at any time (7% vs. 6%, respectively) and the median time to first CNS progression (5.7 vs. 4.4 months) also did not differ significantly.

"No conclusion should be made from these results," said Dr. Xavier Pivot of the Université de Franche-Comté in Besançon, France.
Dr. Pivot noted that a very low rate of CNS events had occurred in the trial because of the stringent accrual process, undermining the conclusions that can be drawn.
Trial Excluded Asymptomatic Brain Metastases
"The CEREBREL study was a front-line study, but the problem was that asymptomatic brain metastases were being screened out of the population," Dr. Stephen Johnston, who was not involved the study, commented in an interview.
"The overall incidence of brain metastases that they found in the study was a lot lower than they were anticipating, so they were never going to meet their end point," added Dr. Johnston, a consultant medical oncologist and director of clinical research and development at the Royal Marsden and the Institute of Cancer Research in London.
CEREBREL enrolled 540 of a planned 650 women with HER2-positive metastatic breast cancer who had received prior treatment with an anthracycline or taxane but who had no CNS metastases. To ensure that no metastases were present, patients had a baseline MRI scan, with 20% of women excluded because they had asymptomatic lesions.
In total, 271 women received lapatinib (1,250 mg/day) plus capecitabine (2,000 mg/m2/day on days 1-14 every 21 days) and 269 trastuzumab (6 mg/kg every 21 days) plus capecitabine (2,500 mg/m2/day on days 1-14 every 21 days).
PFS Longer with Trastuzumab and Capecitabine
The trial results also showed that median progression-free survival (PFS) was longer in patients who received trastuzumab in combination with the chemotherapy than in those who received lapatinib (8 months vs. 6.6 months, hazard ratio 1.3, P = .021).
This effect dissipated, however, when prior treatment with trastuzumab was considered; it had been received by 62% of patients in the lapatinib-containing arm and 59% of patients in the trastuzumab-containing arm.
While there was no difference in PFS among patients who had previously been treated with trastuzumab, those who had never received the drug before the trial appeared to obtain a greater benefit.
Commenting on these data, Dr. Johnston noted that they do seem to suggest that the combination of lapatinib and capecitabine was not equivalent and was actually inferior to trastuzumab plus capecitabine.
Nevertheless, "I think the question about the effects of lapatinib on brain metastases is still relevant," he said.
"We’re doing a trial [LANTERN] of lapatinib-capecitabine versus continuing the trastuzumab and adding in capecitabine, to see if switching the HER2-targeting keeps the brain disease under control for longer," Dr. Johnston explained. "This is where lapatinib may still have a role."
LANDSCAPE Results Favorable
The primary hypothesis of the phase II LANDSCAPE study was that up-front treatment with lapatinib might help prevent brain metastasis in HER2-positive metastatic breast cancer and delay the need for whole-brain radiation and its associated neurotoxicity, said study investigator Dr. Thomas Bachelot, on behalf of the Unicancer Federation Française group.
Dr. Bachelot of INSERM in Lyon said the response and overall survival results compared favorably with published data for whole-brain radiotherapy (WBRT).
Two thirds (66%) of patients treated with lapatinib and capecitabine exhibited a CNS objective response: 46% achieved a reduction in brain metastases of 50%-80%, and 20% exhibited a reduction in brain metastases of 80% or more. The median time to progression was 5.5 months, and the median time to WBRT was 7.8 months. Median overall survival was 17 months.
"This strategy could help delay whole-brain radiotherapy and its associated [neurological] toxicity," Dr. Bachelot concluded, noting that the up-front use of lapatinib and capecitabine warrants further evaluation.
The first analysis of the LANDSCAPE trial was presented at the American Society of Clinical Oncology (ASCO) in 2011.
Both the CEREBREL and LANDSCAPE studies were supported by funding from GlaxoSmithKline. All authors have received research support or consultancy fees from GlaxoSmithKline and Roche. Dr. Bachelot and Dr. Johnston have also received consultancy fees from Novartis.
VIENNA – Mixed results in phase II and III clinical trials leave open the question of whether lapatinib can prevent brain metastases in women with HER2-positive breast cancer.
Lapatinib (Tykerb) did not decrease the development of brain metastases when compared with trastuzumab (Herceptin) – each added to capecitabine (Xeloda) – in the open-label phase III CEREBREL trial. The results were inconclusive, however, for the primary end point of the incidence of central nervous system events as a first sign of relapse.
Favorable findings were reported from the 45-patient phase II LANDSCAPE study. Two-thirds of patients had an objective CNS response to up-front lapatinib plus capecitabine in the single-arm study.
Investigators from both trials reported outcomes at the European Society for Medical Oncology Congress.
‘No Conclusion Can Be Made...’
In the CEREBREL trial, 251 women were treated with lapatinib in combination with capecitabine. Eight (3%) exhibited CNS progression as the first site of relapse. In comparison, 12 (5%) of 250 women given trastuzumab plus capecitabine exhibited CNS progression (P = .360).
The incidence of CNS progression at any time (7% vs. 6%, respectively) and the median time to first CNS progression (5.7 vs. 4.4 months) also did not differ significantly.
"No conclusion should be made from these results," said Dr. Xavier Pivot of the Université de Franche-Comté in Besançon, France.
Dr. Pivot noted that a very low rate of CNS events had occurred in the trial because of the stringent accrual process, undermining the conclusions that can be drawn.
Trial Excluded Asymptomatic Brain Metastases
"The CEREBREL study was a front-line study, but the problem was that asymptomatic brain metastases were being screened out of the population," Dr. Stephen Johnston, who was not involved the study, commented in an interview.
"The overall incidence of brain metastases that they found in the study was a lot lower than they were anticipating, so they were never going to meet their end point," added Dr. Johnston, a consultant medical oncologist and director of clinical research and development at the Royal Marsden and the Institute of Cancer Research in London.
CEREBREL enrolled 540 of a planned 650 women with HER2-positive metastatic breast cancer who had received prior treatment with an anthracycline or taxane but who had no CNS metastases. To ensure that no metastases were present, patients had a baseline MRI scan, with 20% of women excluded because they had asymptomatic lesions.
In total, 271 women received lapatinib (1,250 mg/day) plus capecitabine (2,000 mg/m2/day on days 1-14 every 21 days) and 269 trastuzumab (6 mg/kg every 21 days) plus capecitabine (2,500 mg/m2/day on days 1-14 every 21 days).
PFS Longer with Trastuzumab and Capecitabine
The trial results also showed that median progression-free survival (PFS) was longer in patients who received trastuzumab in combination with the chemotherapy than in those who received lapatinib (8 months vs. 6.6 months, hazard ratio 1.3, P = .021).
This effect dissipated, however, when prior treatment with trastuzumab was considered; it had been received by 62% of patients in the lapatinib-containing arm and 59% of patients in the trastuzumab-containing arm.
While there was no difference in PFS among patients who had previously been treated with trastuzumab, those who had never received the drug before the trial appeared to obtain a greater benefit.
Commenting on these data, Dr. Johnston noted that they do seem to suggest that the combination of lapatinib and capecitabine was not equivalent and was actually inferior to trastuzumab plus capecitabine.
Nevertheless, "I think the question about the effects of lapatinib on brain metastases is still relevant," he said.
"We’re doing a trial [LANTERN] of lapatinib-capecitabine versus continuing the trastuzumab and adding in capecitabine, to see if switching the HER2-targeting keeps the brain disease under control for longer," Dr. Johnston explained. "This is where lapatinib may still have a role."
LANDSCAPE Results Favorable
The primary hypothesis of the phase II LANDSCAPE study was that up-front treatment with lapatinib might help prevent brain metastasis in HER2-positive metastatic breast cancer and delay the need for whole-brain radiation and its associated neurotoxicity, said study investigator Dr. Thomas Bachelot, on behalf of the Unicancer Federation Française group.
Dr. Bachelot of INSERM in Lyon said the response and overall survival results compared favorably with published data for whole-brain radiotherapy (WBRT).
Two thirds (66%) of patients treated with lapatinib and capecitabine exhibited a CNS objective response: 46% achieved a reduction in brain metastases of 50%-80%, and 20% exhibited a reduction in brain metastases of 80% or more. The median time to progression was 5.5 months, and the median time to WBRT was 7.8 months. Median overall survival was 17 months.
"This strategy could help delay whole-brain radiotherapy and its associated [neurological] toxicity," Dr. Bachelot concluded, noting that the up-front use of lapatinib and capecitabine warrants further evaluation.
The first analysis of the LANDSCAPE trial was presented at the American Society of Clinical Oncology (ASCO) in 2011.
Both the CEREBREL and LANDSCAPE studies were supported by funding from GlaxoSmithKline. All authors have received research support or consultancy fees from GlaxoSmithKline and Roche. Dr. Bachelot and Dr. Johnston have also received consultancy fees from Novartis.
AT THE EUROPEAN SOCIETY FOR MEDICAL ONCOLOGY CONGRESS
Major Findings: The primary end point of CNS as first site of relapse was no different comparing lapatinib-capecitabine (3%) vs. trastuzumab-capecitabine (5%) in the CEREBREL trial. The LANDSCAPE study showed a CNS objective response in 66% of patients treated with up-front lapatinib plus capecitabine.
Data Source: CEREBREL was an open-label phase III study, and LANDSCAPE was a phase II study. Both enrolled women with metastatic breast cancer.
Disclosures: Both studies were supported by funding from GlaxoSmithKline. All authors have received research support or consultancy fees from GlaxoSmithKline and Roche. Dr. Bachelot and Dr. Johnston have also received consultancy fees from Novartis.

Society of Hospital Medicine Joins Fight to Delay Medicare Cuts that Reduce Pay for Hospitalists
SHM has joined scores of medical societies pushing Congress to stop pending cuts to Medicare that would directly impact hospitalists.
Scheduled to go into effect at the start of the New Year, the cuts include sequestration, which would reduce hospitalists' Medicare payments by 2%, and slash funding to the National Institutes of Health (NIH) and the Centers for Disease Control and Prevention (CDC). This is in addition to a 27% cut to Medicare physician payment rates resulting from Medicare's sustainable growth rate (SGR) formula.
In a letter last month to congressional leaders [PDF], and an accompanying note to society members, SHM said hospitalists need to lobby legislators "to find a reasonable and measured solution to deficit reduction that does not include arbitrary across-the-board cuts to Medicare providers."
"Congress needs to know we're not happy," says SHM board member Eric Siegal, MD, SFHM, board liaison SHM's Public Policy Committee. "The only way that we are going to get them to change their behavior is if enough of us mobilize, and make enough noise to make it clear that we are not going to stand for this anymore."
Dr. Siegal says that because Congress has repeatedly delayed draconian cuts, there is a general consensus that another delay is likely. But Dr. Siegal also notes lobbying is still necessary to ensure that will happen. SHM has previously supported a meaningful replacement to the SGR, which has yet to receive significant action in Congress.
"What the entire healthcare community needs to push for is a solution," Dr. Siegal adds. "It's very hard to develop any kind of a strategy for how you're going to deliver care if every X number of months you have to worry [whether] you're going to take a massive cut in your compensation."
In the Literature: Research You Need to Know
Clinical question: What is the impact, and sustainability, of chlorhexidine bathing on central-venous-catheter-associated bloodstream infections?
Background: Chlorhexidine bathing has been associated with reductions in healthcare-associated bloodstream infections, including vancomycin-resistant enterococci and methicillin-resistant Staphylococcus aureus. No prospective studies have evaluated the impact and sustainability of chlorhexidine bathing.
Study design: Prospective, three-phase study.
Setting: Medical-surgical ICUs and respiratory-care units at five New York hospitals.
Synopsis: In the pre-intervention phase (six to nine months, 1,808 admissions), patients were bathed with soap and water or nonmedicated bathing cloths. In the intervention phase (eight months, 1,832 admissions), patients were bathed with 2% chlorhexidine cloths. In the post-intervention phase (12 months, 2,834 admissions), chlorhexidine bathing was continued without oversight by researchers.
During the intervention phase, there were significantly fewer central-venous-catheter-associated bloodstream infections (2.6/1,000 catheter days vs. 6.4/1,000 pre-intervention). The reductions in bloodstream infections were sustained during the post-intervention period (2.9/1,000 catheter days). Compliance with chlorhexidine bathing was 82% and 88% during the intervention and post-intervention phases, and was well tolerated by the patients.
Limitations of this study include lack of patient-specific data and severity of illness data, as well as lack of randomization and blinding. Although not evaluated in this study, the savings associated with decreased bloodstream infections likely outweigh the cost of chlorhexidine bathing.
Bottom line: Chlorhexidine bathing is a well-tolerated, sustainable intervention that significantly reduces central-venous-catheter-associated bloodstream infections.
Citation: Montecalvo MA, McKenna D, Yarrish R, et al. Chlorhexidine bathing to reduce central venous catheter-associated bloodstream infection: impact and sustainability.Am J Med. 2012;125(5):505-511.
For more physician reviews of recent HM-relevant literature, visit our website.
Anti-TNF Resistant Crohn's Disease May Respond to Ustekinumab
Ustekinumab induced a clinical response in patients with moderate to severe Crohn’s disease that was resistant to tumor necrosis factor antagonists, in a phase IIb clinical trial published online Oct. 17 in the New England Journal of Medicine.
However, the agent did not improve remission rates, compared with placebo, said Dr. William J. Sandborn, professor of medicine and chief of the division of gastroenterology at the University of California San Diego, La Jolla, and his associates.

"A sizable proportion" of patients with moderate to severe Crohn’s disease do not respond to TNF antagonists, have an unsustained response, or must discontinue the medications because of adverse effects. After ustekinumab showed efficacy in such patients in a phase IIa clinical study, Dr. Sandborn and his colleagues performed a 36-week double-blind phase II2b trial in 526 adults at 153 medical centers in 12 countries.
Ustekinumab, a human IgG monoclonal antibody that inhibits the receptors for interleukin-12 and interleukin-23 on T cells, natural killer cells, and antigen-presenting cells, has Food and Drug Administration approval for use in plaque psoriasis. This clinical trial was sponsored by an affiliate of the manufacturer, Janssen Biotech.
During an 8-week induction phase, the study subjects were randomly assigned to receive intravenous placebo (132 patients) or ustekinumab in 1-mg/kg (131 patients), 3-mg/kg (132 patients), or 6-mg/kg (131 patients) doses. Then, during weeks 8-36, the study subjects who showed a response to induction therapy and those who did not show a response were separately randomized to receive either subcutaneous ustekinumab (90 mg) or placebo at week 8 and week 16, as maintenance therapy.
Treatment efficacy was assessed at week 22, and patients were followed through week 36 for a safety analysis. A total of 36.1% of the subjects discontinued the study before week 36.
The primary end point was a clinical response, defined as a decrease of 100 points or more on the Crohn’s Disease Activity Index (CDAI) score.
A total of 39.7% of patients receiving the 6-mg induction dose showed a clinical response, which was significantly greater than the 23.5% of patients receiving placebo, the investigators said (New Engl. J. Med. 2012 [doi:10.1056/NEJMoa1203572]).
A greater number of patients receiving the lower doses of ustekinumab than receiving placebo showed a clinical response, but the differences between these low-dose groups and the placebo group did not reach statistical significance.
The 6-mg/kg dose was effective across most demographic and disease characteristics, judging from the findings of a subgroup analysis. It was consistently effective in patients who had failed on their first attempt at therapy with TNF antagonists, patients who had failed on two or more TNF antagonists, and patients who had only had a transient response to TNF antagonists.
However, rates of clinical remission did not differ significantly between patients receiving ustekinumab and those receiving placebo, Dr. Sandborn and his associates said.
At all follow-up visits, the proportion of patients who had a 70-point clinical response was significantly higher, the reductions in mean CDAI scores were significantly greater, and the reductions in C-reactive protein levels were significantly greater in patients receiving 6 mg per kg of ustekinumab than in the placebo group.
As a maintenance therapy, 90 mg of subcutaneous ustekinumab appeared to be effective in patients who responded to the induction dose of the agent. The proportion of patients who showed a clinical response at week 22 was 69.4% in those receiving maintenance ustekinumab, significantly greater than the 42.5% response rate among those receiving maintenance placebo.
Among patients who responded to induction-phase ustekinumab, 41.7% of those who also received maintenance ustekinumab achieved clinical remission at week 22, compared with only 27.4% of those who received maintenance placebo.
Similarly, among patients who showed a response to induction ustekinumab, reductions in both CDAI scores and CRP levels were sustained if they continued on maintenance ustekinumab but were not sustained if they continued on placebo for the maintenance period.
However, patients who did not show a response to induction ustekinumab also did not benefit from additional ustekinumab in the maintenance phase of the study.
The results of the safety analysis were "somewhat limited" by the small sample size and the short duration of treatment. No deaths, serious opportunistic infections, or major adverse cardiovascular events were reported, "but large studies of longer duration are needed to assess uncommon adverse events," the investigators said.
Of note, one patient receiving ustekinumab as both induction and maintenance therapy developed a basal cell carcinoma. Among patients taking ustekinumab in the induction phase of the study, six developed serious infections: Clostridium difficile, viral gastroenteritis, UTI, anal abscess, vaginal abscess, and a staph infection of a central catheter.
This study was sponsored by Janssen Research and Development; Janssen Biotech makes ustekinumab. Dr. Sandborn and his associates reported numerous ties to industry sources.
Ustekinumab induced a clinical response in patients with moderate to severe Crohn’s disease that was resistant to tumor necrosis factor antagonists, in a phase IIb clinical trial published online Oct. 17 in the New England Journal of Medicine.
However, the agent did not improve remission rates, compared with placebo, said Dr. William J. Sandborn, professor of medicine and chief of the division of gastroenterology at the University of California San Diego, La Jolla, and his associates.
"A sizable proportion" of patients with moderate to severe Crohn’s disease do not respond to TNF antagonists, have an unsustained response, or must discontinue the medications because of adverse effects. After ustekinumab showed efficacy in such patients in a phase IIa clinical study, Dr. Sandborn and his colleagues performed a 36-week double-blind phase II2b trial in 526 adults at 153 medical centers in 12 countries.
Ustekinumab, a human IgG monoclonal antibody that inhibits the receptors for interleukin-12 and interleukin-23 on T cells, natural killer cells, and antigen-presenting cells, has Food and Drug Administration approval for use in plaque psoriasis. This clinical trial was sponsored by an affiliate of the manufacturer, Janssen Biotech.
During an 8-week induction phase, the study subjects were randomly assigned to receive intravenous placebo (132 patients) or ustekinumab in 1-mg/kg (131 patients), 3-mg/kg (132 patients), or 6-mg/kg (131 patients) doses. Then, during weeks 8-36, the study subjects who showed a response to induction therapy and those who did not show a response were separately randomized to receive either subcutaneous ustekinumab (90 mg) or placebo at week 8 and week 16, as maintenance therapy.
Treatment efficacy was assessed at week 22, and patients were followed through week 36 for a safety analysis. A total of 36.1% of the subjects discontinued the study before week 36.
The primary end point was a clinical response, defined as a decrease of 100 points or more on the Crohn’s Disease Activity Index (CDAI) score.
A total of 39.7% of patients receiving the 6-mg induction dose showed a clinical response, which was significantly greater than the 23.5% of patients receiving placebo, the investigators said (New Engl. J. Med. 2012 [doi:10.1056/NEJMoa1203572]).
A greater number of patients receiving the lower doses of ustekinumab than receiving placebo showed a clinical response, but the differences between these low-dose groups and the placebo group did not reach statistical significance.
The 6-mg/kg dose was effective across most demographic and disease characteristics, judging from the findings of a subgroup analysis. It was consistently effective in patients who had failed on their first attempt at therapy with TNF antagonists, patients who had failed on two or more TNF antagonists, and patients who had only had a transient response to TNF antagonists.
However, rates of clinical remission did not differ significantly between patients receiving ustekinumab and those receiving placebo, Dr. Sandborn and his associates said.
At all follow-up visits, the proportion of patients who had a 70-point clinical response was significantly higher, the reductions in mean CDAI scores were significantly greater, and the reductions in C-reactive protein levels were significantly greater in patients receiving 6 mg per kg of ustekinumab than in the placebo group.
As a maintenance therapy, 90 mg of subcutaneous ustekinumab appeared to be effective in patients who responded to the induction dose of the agent. The proportion of patients who showed a clinical response at week 22 was 69.4% in those receiving maintenance ustekinumab, significantly greater than the 42.5% response rate among those receiving maintenance placebo.
Among patients who responded to induction-phase ustekinumab, 41.7% of those who also received maintenance ustekinumab achieved clinical remission at week 22, compared with only 27.4% of those who received maintenance placebo.
Similarly, among patients who showed a response to induction ustekinumab, reductions in both CDAI scores and CRP levels were sustained if they continued on maintenance ustekinumab but were not sustained if they continued on placebo for the maintenance period.
However, patients who did not show a response to induction ustekinumab also did not benefit from additional ustekinumab in the maintenance phase of the study.
The results of the safety analysis were "somewhat limited" by the small sample size and the short duration of treatment. No deaths, serious opportunistic infections, or major adverse cardiovascular events were reported, "but large studies of longer duration are needed to assess uncommon adverse events," the investigators said.
Of note, one patient receiving ustekinumab as both induction and maintenance therapy developed a basal cell carcinoma. Among patients taking ustekinumab in the induction phase of the study, six developed serious infections: Clostridium difficile, viral gastroenteritis, UTI, anal abscess, vaginal abscess, and a staph infection of a central catheter.
This study was sponsored by Janssen Research and Development; Janssen Biotech makes ustekinumab. Dr. Sandborn and his associates reported numerous ties to industry sources.
FROM THE NEW ENGLAND JOURNAL OF MEDICINE
Major Finding: Of patients with moderate to severe Crohn's disease who received ustekinumab (6 mg/kg), 39.7% showed a decrease of 100 points or more in CDAI score, compared with 23.5% of those who received placebo.
Data Source: The data come from a 36-week,international phase IIb randomized clinical trial comparing 3 doses of ustekinumab with placebo in 526 adults who had refractory Crohn’ disease.
Disclosures: This study was sponsored by Janssen Research and Development; Janssen Biotech makes ustekinumab. Dr. Sandborn and his associates reported numerous ties to industry sources.

Get the Government to Fund Your ACO Start-Up Costs
There seems to be a cruel irony at work: It is generally recognized that a primary care physician–based accountable care organization stands the greatest chance of successfully squeezing the waste out of our health care system – yet that same system has historically deprived primary care of the means to finance an ACO.
Worse, most of the payments that are necessary to fund and sustain ACOs are deferred for more than a year, because they come from savings created during the prior year. It is the proverbial "you can’t get there from here" problem.
How do we avoid this "Catch-22," in which the primary care–driven ACO model is best suited to meet the goals of ACOs but often is least able to afford the costs of creating ACOs?
The answer may be the federal government. There are several viable options available to have the government effectively fund 100% of your ACO start-up costs.
Consider the following:
• Meaningful use incentives. Why not have the government pay for your ACO technology platform? If you think ahead, the health information exchange you will want for your ACO will likely qualify you for stage 2 and stage 3 meaningful use incentives. You can earn up to $44,000 over 5 years from Medicare, or up to $63,750 over 6 years from Medicaid. Instead of data being a burden under fee for service, access to and exchange capability of data will be a huge asset.
You will need to make these investments anyway. If you have your ACO game plan in place, much of what you and your colleagues do to meet the meaningful use criteria can be used to fund your ACO.
• Advance payment model program. The Centers for Medicare and Medicaid Services apparently recognized the "you can’t get there from here" dilemma by creating the advance payment model program. Physician-run ACOs in rural areas have been singled out to receive enough up-front funding to completely pay for the development and implementation of the Medicare Shared Savings Program (MSSP) ACO until shared savings payments kick in.
In addition to the MSSP application, ACOs that wish to receive advance funding from the CMS Innovation Center must also complete the advance payment model application. The advance payment model is open to only two types of ACOs: ACOs that do not include any inpatient facilities and have less than $50 million in total annual revenue; and ACOs in which the only inpatient facilities are critical access hospitals and/or Medicare low-volume rural hospitals, and that have less than $80 million in total annual revenue. ACOs that are co-owned with a health plan will be ineligible, regardless of whether they also fall into one of the above categories.
The advance payment model application consists of two primary sections: the ACO’s financial characteristics; and the ACO’s investment plan.
With respect to the financial characteristics, the ACO will need to list the total annual revenue and total Medicaid revenue for each ACO participant during the preceding 3 years. The information submitted by the ACO will need to be based on either federal tax returns or audited financial statements.
The second key section of the advance payment model application is the ACO investment plan. The ACO must explain how it intends to use the advance payment funds awarded from CMS.
Specifically, the investment plan must include:
• A description of the types of staffing and infrastructure that the ACO will acquire and/or expand using the funding available through the advance payment model.
• The timing of such acquisitions or expansions, and the estimated unit costs.
• A description of how such investments build on staff and infrastructure the ACO already has or plans to acquire through its own upcoming investments.
• An explanation of how each investment will support the ACO in achieving the three-part aim of better health, better health care, and lower per capita costs for Medicare beneficiaries.
The advance payment model money may not be renewed once the initial $1 billion budgeted amount is exhausted. But if the results and return on investment are as powerful as predicted for the targeted ACOs, this could be viewed as a sound investment by CMS.
At current levels, an ACO will receive an up-front fixed amount of $250,000, a variable $36/member, and then $8/member per month. This will be repaid if there are ACO shared savings later on.
Beyond the dollars and cents impact, the APM program is vivid evidence for primary care physicians of just how promising CMS believes physician-directed ACOs are.
Primary care physicians are starting to understand the professional and financial rewards behind ACOs. They should not be dismayed by lack of funding. The payers know that funding these ACOs is a smart "investment" in reforming our inefficient and wasteful current system.
Mr. Bobbitt is a senior partner and head of the Health Law Group at the Smith Anderson law firm in Raleigh, N.C. He has many years’ experience assisting physicians forming integrated delivery systems. He has spoken and written nationally to primary care physicians on the strategies and practicalities of forming or joining ACOs. This article is meant to be educational and does not constitute legal advice. For additional information, readers may contact the author at bbobbitt@smithlaw.com or 919-821-6612.

Topical Fluorocarbon Speeds Tattoo Removal Process
ATLANTA – Applying the topical fluorocarbon perfluorodecalin prior to Q-switched laser treatment for tattoo removal allows for immediate retreatment of the tattoo, thereby improving results while decreasing overall treatment time, according to Dr. Roy Geronemus.
The findings have important implications for improving outcomes and patient satisfaction, given that tattoo removal can require 10-20 sessions, depending on factors such as the age and colors of the tattoo, and that tattoos – and thus tattoo removal – continue to increase in popularity, he said. "For a busy practice or impatient patients like we have in New York, this has been a nice advance," Dr. Geronemus said at the annual meeting of the American Society for Dermatologic Surgery.

The approach builds on the "R20 technique" described earlier this year in a study published in the Journal of the American Academy of Dermatology. R20 involves the use of multiple treatment passes that are made at 20-minute intervals.
Typically, after an initial pass, tiny white bubbles form in the superficial papillary dermis, appearing as a whitening of the skin. Retreatment while these bubbles are present elicits a limited reaction.
The R20 technique was developed when investigators found that the bubbles disappear after 20 minutes, and, thus, tested the technique in a study of 12 adults. The patients were randomized to a single treatment pass with a Q-switched alexandrite laser (5.5 J/cm2, 755 nm, 100-nanosecond pulse duration, 3-mm spot size) or to four passes at 20 minute intervals.
The first treatment caused an immediate whitening reaction, but little or no whitening occurred after subsequent passes at 20-minute intervals. However, at 90-day follow-up, significant improvement was seen in the R20 group, compared with the single-treatment group, and light microscopy demonstrated greater dispersion of tattoo ink with the R20 approach. (J. Am. Acad. Dermatol. 2012;66:271-7).
Despite the increased efficacy using this approach, the time required to complete four passes at 20-minute intervals makes it impractical in the clinical setting, said Dr. Geronemus, a dermatologist in private practice in New York.
"So with this idea in mind, we began to look at a concept that would allow us to re-treat tattoos immediately without waiting 20 minutes," he said, explaining that topical perfluorodecalin helps dissolve the gas seen after the application of the Q-switched laser and speeds the resolution of the whitening.
"Rather than waiting 20 minutes, the gas dissolves almost immediately, allowing you to re-treat, and we’re now re-treating three or four times in a matter of minutes rather than waiting the 80 minutes that the R20 technique would take for a four-time treatment session," he said.
In his experience, results with perfluorodecalin are comparable to those seen with the R20 technique – but with greater convenience for the patient.
His observations were confirmed on optical coherence tomography scanning, which demonstrated that cavitation levels are indeed reduced by the use of perfluorodecalin.
Dr. Geronemus is an investigator for Cutera, Cynosure, Palomar, Solta Medical, and Syneron. He is also on the medical advisory board for Cynosure, Lumenis, Photomedex, Syneron, and Zeltiq. He reported that he is a Zeltiq shareholder.
ATLANTA – Applying the topical fluorocarbon perfluorodecalin prior to Q-switched laser treatment for tattoo removal allows for immediate retreatment of the tattoo, thereby improving results while decreasing overall treatment time, according to Dr. Roy Geronemus.
The findings have important implications for improving outcomes and patient satisfaction, given that tattoo removal can require 10-20 sessions, depending on factors such as the age and colors of the tattoo, and that tattoos – and thus tattoo removal – continue to increase in popularity, he said. "For a busy practice or impatient patients like we have in New York, this has been a nice advance," Dr. Geronemus said at the annual meeting of the American Society for Dermatologic Surgery.
The approach builds on the "R20 technique" described earlier this year in a study published in the Journal of the American Academy of Dermatology. R20 involves the use of multiple treatment passes that are made at 20-minute intervals.
Typically, after an initial pass, tiny white bubbles form in the superficial papillary dermis, appearing as a whitening of the skin. Retreatment while these bubbles are present elicits a limited reaction.
The R20 technique was developed when investigators found that the bubbles disappear after 20 minutes, and, thus, tested the technique in a study of 12 adults. The patients were randomized to a single treatment pass with a Q-switched alexandrite laser (5.5 J/cm2, 755 nm, 100-nanosecond pulse duration, 3-mm spot size) or to four passes at 20 minute intervals.
The first treatment caused an immediate whitening reaction, but little or no whitening occurred after subsequent passes at 20-minute intervals. However, at 90-day follow-up, significant improvement was seen in the R20 group, compared with the single-treatment group, and light microscopy demonstrated greater dispersion of tattoo ink with the R20 approach. (J. Am. Acad. Dermatol. 2012;66:271-7).
Despite the increased efficacy using this approach, the time required to complete four passes at 20-minute intervals makes it impractical in the clinical setting, said Dr. Geronemus, a dermatologist in private practice in New York.
"So with this idea in mind, we began to look at a concept that would allow us to re-treat tattoos immediately without waiting 20 minutes," he said, explaining that topical perfluorodecalin helps dissolve the gas seen after the application of the Q-switched laser and speeds the resolution of the whitening.
"Rather than waiting 20 minutes, the gas dissolves almost immediately, allowing you to re-treat, and we’re now re-treating three or four times in a matter of minutes rather than waiting the 80 minutes that the R20 technique would take for a four-time treatment session," he said.
In his experience, results with perfluorodecalin are comparable to those seen with the R20 technique – but with greater convenience for the patient.
His observations were confirmed on optical coherence tomography scanning, which demonstrated that cavitation levels are indeed reduced by the use of perfluorodecalin.
Dr. Geronemus is an investigator for Cutera, Cynosure, Palomar, Solta Medical, and Syneron. He is also on the medical advisory board for Cynosure, Lumenis, Photomedex, Syneron, and Zeltiq. He reported that he is a Zeltiq shareholder.
EXPERT ANALYSIS FROM THE ANNUAL MEETING OF THE AMERICAN SOCIETY FOR DERMATOLOGIC SURGERY

Bedside Tools to ID Severe C. difficile Fall Short
SAN FRANCISCO – A side-by-side comparison of three bedside tools used to identify severe cases of Clostridium difficile infection yielded no clear winner, a reminder that judgment at diagnosis is still the clinician’s best bet.
Criteria from the Infectious Diseases Society of America were more sensitive but the least specific than both the Hines Veterans Affairs (VA) and the ATLAS severity scoring systems, Thien-Ly Doan, Pharm.D. explained in an interview at the annual Interscience Conference on Antimicrobial Agents and Chemotherapy.

The Hines VA system for stratifying patients missed 19 of 44 severe/complicated cases of C. difficile infection. The ATLAS scoring system (which incorporates five parameters: age, temperature, leukocytosis, albumin, and systemic concomitant antibiotic use) missed 14 of the 44 cases in a retrospective chart review of 109 patients hospitalized for more than a day with confirmed C. difficile infection.
The IDSA guidelines missed only 5 of the 44 severe/complicated infections, but they cast such a wide net that anyone with a white count above 15,000 cells/mm3 or an elevated creatinine (1.5 times or greater than the premorbid level) is considered to have severe C. difficile infection, she said.
Use of the IDSA guidelines could increase unnecessary use of vancomycin instead of metronidazole, said Dr. Doan, a clinical coordinator at Long Island Jewish Medical Center, New Hyde Park, N.Y.
The IDSA criteria suggested that nearly 60% of the 109 patients had severe infection. However, the 44 severe/complicated C. difficile patients comprised just 40% of the study population. They were defined in the study as patients who were in critical care or whose infections were refractory to treatment and who had ileus, severe pancolitis/toxic megacolon, a WBC of 15,000 cells/mL with hypotension, surgery related to C. difficile infection, or who had died from infection.
Dr. Doan and her associates compared the three stratification systems in evaluating the charts of adults with C. difficile infection at the medical center, who had a mean age of 71 years. A total of 74% of patients were on the medicine service, 22% were in critical care, and 4% were on the surgical service; 34% were female.
The Centers for Disease Control and Prevention also offer severity criteria, but these require the observation of clinical end points and thus are ineffective for assessing patients at initial presentation, she said in a poster presentation at the meeting, sponsored by the American Society for Microbiology.
The Hines VA scoring system, in addition to missing the most severe cases, also gives a great deal of weight to diagnostic imaging, which "makes it impractical at our institution," she said. The Hines VA tool incorporates temperature, the presence of ileus, systolic blood pressure, leukocytosis, and abnormal CT findings to stratify patients by severity.
"We’re going to continue relying on the clinician’s assessment at the bedside at the time of diagnosis to evaluate whether cases are severe or not severe, and not use any of these tools that are available," Dr. Doan said.
A good bedside tool sure would be nice, though, to have a good, objective way of identifying severe C. difficile infection, she added. In a large health system, order sets could be developed based on the tool’s findings "so that everybody would be on the same page in terms of treatment," she said. None of the current tools are good enough for that.
Severe cases of C. difficile are on the rise because of increasing prevalence of the hypervirulent NAP1/BI/027 strain, she noted.
A number of clinicians at the meeting approached her with their own versions of bedside tools for identifying severe C. difficile infection, which Dr. Doan and her associates may evaluate next. They also may compare the tools on different subpopulations of patients with severe infection, such as only patients whose death or surgery was related to C. difficile infection.
Dr. Doan reported having no financial disclosures.
Reported mortality from Clostridium difficile infection (CDI) in the United States has increased dramatically in recent years (Emerg. Infect. Dis. 2007;13: 1417-9). Current guidelines call for the use of oral vancomy-cin as first-line therapy in severe CDI while metronidazole may be used in milder disease (Infect. Control Hosp. Epidemiol. 2010;31:431-55). Thus, it becomes important for therapy to identify those with potentially severe CDI early in their clinical course. However, a systematic review published in 2012 that specifically looked at clinical prediction rules (CPRs) for poor outcomes in CDI concluded that the available tools are inadequate for the task (PLoS One 2012;7:e30258).
The study by Dr. Doan and colleagues assessed the utility of bedside severity-of-illness tools in the treatment of patients with CDI. This was a retrospective chart review of 109 patients hospitalized for more than a day with confirmed CDI. Three CPRs were assessed: The Hines VA system , ; the ATLAS scoring system; and the Infectious Diseases Society of America (IDSA) guidelines. . Sensitivity in detecting severe outcomes of CDI were 57%, 68%, and 89%, respectively. However, the most sensitive CPR, the IDSA guideline, showed poor specificity because it categorized 60% of all subjects as severe. Thus, the IDSA guideline will encourage more widespread use of oral vancomycin in CDI.
Therefore, we lack a risk-scoring system for severe CDI that is easy to use, sensitive, specific, and validated. Such a prediction tool is essential to allow us to follow the current CDI treatment guidelines.
CIARAN P. KELLY, M.D., is director of gastroenterology training and is medical director of the Celiac Center at Beth Israel Deaconess Medical Center, Boston. SAURABH SETHI, M.D., is a fellow in gastroenterology and hepatology at Beth Israe Deaconess. Dr. Kelly reported serving as a consultant or scientific advisor for, being a member of an advisory board for, or receiving research support from many companies developing drugs for C. difficile. Dr. Sethi had no relevant financial disclosures.
SAN FRANCISCO – A side-by-side comparison of three bedside tools used to identify severe cases of Clostridium difficile infection yielded no clear winner, a reminder that judgment at diagnosis is still the clinician’s best bet.
Criteria from the Infectious Diseases Society of America were more sensitive but the least specific than both the Hines Veterans Affairs (VA) and the ATLAS severity scoring systems, Thien-Ly Doan, Pharm.D. explained in an interview at the annual Interscience Conference on Antimicrobial Agents and Chemotherapy.
The Hines VA system for stratifying patients missed 19 of 44 severe/complicated cases of C. difficile infection. The ATLAS scoring system (which incorporates five parameters: age, temperature, leukocytosis, albumin, and systemic concomitant antibiotic use) missed 14 of the 44 cases in a retrospective chart review of 109 patients hospitalized for more than a day with confirmed C. difficile infection.
The IDSA guidelines missed only 5 of the 44 severe/complicated infections, but they cast such a wide net that anyone with a white count above 15,000 cells/mm3 or an elevated creatinine (1.5 times or greater than the premorbid level) is considered to have severe C. difficile infection, she said.
Use of the IDSA guidelines could increase unnecessary use of vancomycin instead of metronidazole, said Dr. Doan, a clinical coordinator at Long Island Jewish Medical Center, New Hyde Park, N.Y.
The IDSA criteria suggested that nearly 60% of the 109 patients had severe infection. However, the 44 severe/complicated C. difficile patients comprised just 40% of the study population. They were defined in the study as patients who were in critical care or whose infections were refractory to treatment and who had ileus, severe pancolitis/toxic megacolon, a WBC of 15,000 cells/mL with hypotension, surgery related to C. difficile infection, or who had died from infection.
Dr. Doan and her associates compared the three stratification systems in evaluating the charts of adults with C. difficile infection at the medical center, who had a mean age of 71 years. A total of 74% of patients were on the medicine service, 22% were in critical care, and 4% were on the surgical service; 34% were female.
The Centers for Disease Control and Prevention also offer severity criteria, but these require the observation of clinical end points and thus are ineffective for assessing patients at initial presentation, she said in a poster presentation at the meeting, sponsored by the American Society for Microbiology.
The Hines VA scoring system, in addition to missing the most severe cases, also gives a great deal of weight to diagnostic imaging, which "makes it impractical at our institution," she said. The Hines VA tool incorporates temperature, the presence of ileus, systolic blood pressure, leukocytosis, and abnormal CT findings to stratify patients by severity.
"We’re going to continue relying on the clinician’s assessment at the bedside at the time of diagnosis to evaluate whether cases are severe or not severe, and not use any of these tools that are available," Dr. Doan said.
A good bedside tool sure would be nice, though, to have a good, objective way of identifying severe C. difficile infection, she added. In a large health system, order sets could be developed based on the tool’s findings "so that everybody would be on the same page in terms of treatment," she said. None of the current tools are good enough for that.
Severe cases of C. difficile are on the rise because of increasing prevalence of the hypervirulent NAP1/BI/027 strain, she noted.
A number of clinicians at the meeting approached her with their own versions of bedside tools for identifying severe C. difficile infection, which Dr. Doan and her associates may evaluate next. They also may compare the tools on different subpopulations of patients with severe infection, such as only patients whose death or surgery was related to C. difficile infection.
Dr. Doan reported having no financial disclosures.
AT THE ANNUAL INTERSCIENCE CONFERENCE ON ANTIMICROBIAL AGENTS AND CHEMOTHERAPY

What Keeps You Awake at Night?
"The greatest enemy of knowledge is the illusion of knowledge." – Stephen Hawking
In my fellowship, I had a challenging RA case. This woman was in her 50s, and usually she was quite dynamic, personable, and spunky. But the disease was wearing her down. She developed methotrexate pneumonitis. Leflunomide gave her severe diarrhea. She got frequent upper respiratory tract infections from etanercept. We could not get her prednisone dose lower than 15 mg/day. Whenever we saw her in clinic and she had encountered a new glitch in her treatment, my preceptor would say to her "you keep me up at night." Disturbed to hear this, I wondered how insecure I would be as a newly minted rheumatologist if my preceptor, with her decades of practice, still had uncertainties.
I feel like in these, the first 3 years of practice after training, I have an inordinate number of patients who keep me up at night. They come in all shapes and sizes. Even cases that I think are straightforward frequently end up being anything but.
I like treating patients with polymyalgia rheumatica, for example, because the relief they get from a little prednisone is so dramatic and immediate. Seems straightforward, no? But I get anxious about the diagnosis sometimes – what if I’m missing a paraneoplastic syndrome? Not infrequently there are patients who absolutely refuse to go on prednisone, and I worry about them, too. Or I get anxious about tapering, because I’ve had it happen often enough that their symptoms recur at 3 mg of prednisone and I need to put them on a DMARD, none of which have any conclusive evidence of efficacy.
Rheumatoid arthritis is not always easy, either. I have had my share of refractory cases, which, in this age of different varieties of biologics, is even more frustrating. (Although, for the life of me, I cannot imagine what it must have been like to practice before the age of biologics!) It’s even worse for refractory psoriatic arthritis, for which there are fewer drug options available.
And what about scleroderma? I watched a patient’s hands progress from being simply puffy at presentation to being contracted, with severe skin tightening and skin ulcerations over the PIP joints, in just 2 years. We are lucky to be close enough to Boston that I could send the patient to a medical center there to receive an investigational therapy, which seemed to lessen the patient’s symptoms somewhat. Unfortunately, she developed urinary bladder cancer and is now ineligible to receive the experimental anti-TGF-beta in an open label extension.
But perhaps my most insomnia-inducing patient is a lovely 70-year-old man with a new diagnosis of dermatomyositis. His antinuclear antibody was negative, and he had no myositis-specific antibodies. We knew we should be looking for a malignancy, but a CT of the chest, abdomen, and pelvis was negative. A colonoscopy was next, but if that did not turn anything up, what would be next? Do we keep searching? How do we know where to look?
Worse, the pulse of methylprednisolone did not work completely, and he ended up needing a percutaneous endoscopic gastrostomy tube because he failed his swallow evaluation miserably. I was really saddened by all this. It made me feel small and insignificant in the face of such a terrible disease.
In that process of placing a PEG tube, we serendipitously found, on biopsy, adenocarcinoma at the gastroesophageal junction. Though this was, indeed, terrible news, it was a source of comfort for me that we had found the malignancy and would at least have a target for treatment.
I know he will not be my last dermatomyositis patient, and there are no prescribed guidelines for searching for a malignancy. How can we possibly find something if we have no idea what it is or where it might be?
I can think of so many more lupus, spondyloarthritis, temporal arteritis, even mechanical back pain patients who worry me, to say nothing of the not-insignificant number of patients for whom the diagnosis is uncertain. True, my learning curve has been steep in these first 3 years, but the more patients I see, the more striking the large number of phenotypes of our diseases. It’s quite humbling and has kept me up more nights than I expected.
Dr. Chan practices rheumatology in Pawtucket, R.I. E-mail her at [email protected].