User login
A Cure for Rabies
In September 2004, animal-loving Wisconsin teenager Jeanna Giese picked up a bat trapped inside her church and took it outside. As she tried to set it free, the bat sank its teeth into her left index finger for an instant before she shook it loose.
Back at home, her mother rinsed the tiny wound with hydrogen peroxide and thought no more about it. A month later, the girl, a star student and athlete, developed fatigue, double vision from bilateral sixth nerve palsies, and paresthesias in her left arm. She deteriorated rapidly over the next few days, with high fever, ataxia, confusion, tremor, drooling, and spasm with swallowing, and was intubated for airway protection. Rabies antibody was found in her spinal fluid and serum.
The Fond du Lac girl’s doctors at Children’s Hospital of Wisconsin (Milwaukee) offered the family a dismal choice. She could receive hospice care for the gruesome and invariably fatal consequences of rabies in unvaccinated patients. Or, the doctors could embark on experimental treatment, with no guarantee she would have any meaningful neurological function or quality of life should she survive.
Parents Chose Treatment
On the basis of data indicating rabies patients are capable of clearing the virus, but die largely of secondary complications (e.g., autonomic dysfunction and excitatory neurotoxicity), the team administered massive doses of ketamine, midazolam, and phenobarbital, the antivirals ribavirin and amantadine, and supplementation with coenzyme Q to counter the possible mitochondrial toxicity of ribavirin. Ketamine blocks the neuroexcitatory NMDA receptor, possibly a receptor for rabies virus.
After a stormy, four-week intensive-care course characterized by autonomic instability and other complications, Giese was extubated and went home on New Year’s Day 2005. She made a remarkable recovery, eventually returning to school full time— although she was unable to participate in athletics. At 17, she has been accepted to college to study biology starting this fall.1-3
While the Wisconsin protocol has achieved the previously impossible, it is not yet a surefire cure for rabies. Two U.S. children treated last year with the Wisconsin protocol and meticulous supportive care died—one with cerebral edema, the other with cerebral and cerebellar herniation.4 Additional clinical experience and further tinkering with the protocol are likely required to optimize outcomes.
What To Know
While rabies is rare is the U.S., it retains a disproportionate importance because of its historic 100% fatality rate. Hospitalists should know this about rabies:
Suspect rabies in all patients with undiagnosed neurological disease. Making the diagnosis of rabies as early as possible is more critical than ever, now that a potential treatment exists. Unfortunately, in the United States rabies is rarely considered when patients first present for medical attention.
During the prodromal phase of rabies, which lasts about four days, patients have non-specific symptoms of fever, malaise, and nausea. This is quickly followed by paresthesias at the bite or wound site, personality change and hallucinations, and the classic manifestations of “furious rabies”: agitation, delirium, hydrophobia, aerophobia, aggression, and spasms affecting swallowing and respiration.
In up to 20% of patients, the disease may present in atypical form as “dumb rabies,” an ascending paralysis that may mimic Guillain-Barré syndrome. Tests for rabies include polymerase chain reaction of cerebrospinal fluid or saliva, antibody testing of serum and CSF, and direct fluorescent antibody of biopsy from the nape of the neck, where the virus congregates in hair follicles.
Ask all patients about bat and animal exposure when rabies is in the differential. Worldwide, there are 55,000 cases of human rabies a year. The vast majority of these occur in developing countries as a result of dog bites. In the United States, there is only a handful of human cases of rabies each year, almost always associated with bat exposure. It is not necessary to get a bat bite or scratch to be at risk for rabies. Some U.S. patients seem to have contracted rabies after exposure to bat saliva or vapors, sometimes having been bitten while asleep. Any patient who wakes up in a room or cabin and finds a bat should be considered at risk for rabies.
Other animals commonly infected with rabies in the U.S. include raccoons, skunks, and foxes. Unvaccinated dogs and cats also are at risk of rabies.
Consider prevention the best treatment. Wash bite wounds with 20% soap and irrigate with povidone-iodine to reduce the risk of rabies by up to 90%. If the biting animal is available for observation, the rabies vaccine may be deferred or not administered at all if the animal is well after 10 days. Many state laboratories will also perform rabies testing on euthanized animals. If the biting animal is unavailable for observation, promptly give the rabies vaccine and immune globulin. Current rabies vaccines are safe and highly effective in preventing infection after exposure, provided they are given in a timely fashion. Vaccine and immune globulin have no role in treatment once rabies symptoms have developed. TH
Dr. Ross is an associate physician and hospitalist at Brigham and Women’s Hospital, Boston, and a fellow of the Infectious Diseases Society of America. Contact him at [email protected].
References
- Willoughby RE Jr, Tieves KS, Hoffman GM, et al. Survival after treatment of rabies with induction of coma. N Engl J Med. 2005;352(24):2508-2514.
- Johnson M, Nelson K. Down to a prayer. Milwaukee Journal Sentinel. June 18, 2005.
- Nelson K. Potential cure for rabies fails in others. Milwaukee Journal Sentinel. April 22, 2007.
- Centers for Disease Control and Prevention. Human rabies Indiana and California, 2006. MMWR. 2007;56(15):361-365.
Dare to Compare
A new concept on Capitol Hill could reshape physicians’ treatment choices: comparative effectiveness research, or CER.
CER is a set of standards for examining the effectiveness of different therapies for a specific medical condition or set of patients to determine the best option. It may involve comparing competing medications or analyzing treatment approaches, such as surgery, devices, and drug therapies.
The healthcare community—and Capitol Hill—should keep an eye on CER.
“We need to look at evidence-based medicine and see what is the most effective treatment,” says Andrew Fishmann, MD, FCCP, FACP, co-founder of Cogent Healthcare and director of intensive care at Good Samaritan Hospital in Los Angeles. “The answer may also be the most expensive, but other factors such as decreased length of stay and fewer complications can help bring that cost down.”
One example that CER might address is back surgery—an issue many physicians cannot agree on. “There are billions of dollars spent on back surgery that may not be necessary,” Dr. Fishmann points out.
CER could ultimately provide guidelines that would standardize treatments for all types of conditions: “A big organization like Cogent would like to think that a patient with pneumonia receives the same treatment whether he’s in California or in Mississippi—but there are many reasons this is probably not true,” says Dr. Fishmann.
CER So Far
The Medicare Modernization Act of 2003 gave CER a jumpstart with $65 million in appropriations and authorized the Agency for Healthcare Research and Quality (AHRQ) to conduct research.
“Since 2004, [the AHRQ has] received $15 million a year for CER,” says Emily Rowe, director of government relations for the Coalition for Health Services Research in Washington, D.C., and a member of the Friends of AHRQ coalition. “They’re pretty limited in what they can produce on that budget, but to date they’ve done some interesting work.”
That work includes eight published reports on treatment options for breast cancer, gastroesophageal reflux disease (GERD), cancer-related anemia, low-bone density, depression, and more, with 20 additional reports “in the pipeline,” says Rowe.
All available reports can be downloaded from http://effectivehealthcare. ahrq.gov, where results have been published in separate versions for physicians and consumers.
“The most interesting example of [CER from AHRQ] is synthesized research that shows that drugs can be as effective as surgery for severe heart burn,” or GERD, says Rowe. “This shows the promise of CER.”
So AHRQ is at work on CER projects but, says Rowe, “It needs a more serious investment.” Some in Congress agree.
New Laws, More Money
The Enhanced Health Care Value for All Act of 2007 (HR 2184) was introduced by Reps. Tom Allen, D-Maine, and Jo Ann Emerson, R-Mo, in May. This bill would provide $3 billion over five years to fund CER.
Under the legislation, the AHRQ would remain the federal agency charged with supporting CER, but a new comparative effectiveness advisory board would be established, comprising employers, consumers, healthcare providers, researchers, and others. The board would offer advice on research priorities and methodologies.
Some, including the Blue Cross Blue Shield Association (BCBSA), have called for a new executive-branch agency or a new coalition to oversee CER. Dr. Fishmann, who is serving a second term on the National Advisory Council for AHRQ, strongly disagrees. “This is evidence-based medicine,” he stresses. “AHRQ is the perfect entity for this. What an organization like AHRQ will do is look at everything and address the issue impartially.”
Quality, Costs, Results
Congress views CER as a means of saving costs in healthcare, but CER would not provide immediate savings; rather, it’s a first step toward lowering healthcare costs. In fact, House Ways and Means Subcommittee Chairman Pete Stark, R-Calif., expressed concern about “moving” CER legislation this year, because it would require immediate investment without immediate savings.
“I don’t know where you come up with that money when everyone else in healthcare is fighting for more funds,” Dr. Fishmann says of the current legislation. “But Congress can come up with the funds if they want to.”
Rowe won’t speculate on whether the House bill will pass but does say: “The appropriators and budgeters are getting ready to fund this, so that if the legislation passes the money will be there. And interest in CER is gaining in both parties of Congress.”
While legislators focus on costs and savings, healthcare professionals are interested in improving quality.
“It is a quality issue, but a better term is value,” says Rowe. “The idea is, ‘Let’s get what we pay for.’ The U.S. needs better medical outcomes, and the idea of CER is not what treatments costs less but that it’s worth it if you have to spend more if the outcomes are improved.”
And Dr. Fishmann thinks CER will change how we provide care. “It’s going to standardize the delivery of healthcare,” he predicts. “If you don’t follow these standards, someone is going to ask why not—it might be the payer, your colleagues, your hospital.” Once CER reports are available and shared with the public, he points out, “as patients get educated, and payers too, they’ll stop paying for treatments that go against the standard.”
—Emily Rowe, director of government relations for the Coalition for Health Services Research, Washington, D.C.
Hospitalists and CER
How will comparative effectiveness affect hospital medicine?
“They’re looking at ischemic heart disease, pneumonia, diabetes, stroke—all hospitalized diseases,” says Dr. Fishmann of current CER projects. “Right now, everyone is practicing their trade, and everyone is doing things differently. I think in terms of hospitalists, it clearly will affect how you treat patients, and for how long.”
Regardless of the current House bill, it seems CER is on the horizon, for hospitalists and for all of healthcare.
“The good news is, I don’t think this is going away any time soon,” says Rowe of CER. “The train has left the station and it’s steaming away.” TH
Group Growth
This is the last article in a series on the four pillars of career satisfaction in hospital medicine.
What kind of support do you get from your hospital medicine group? From your hospital? How cohesive is your group? Do these things really matter?
The answers can be found in the SHM white paper “A Challenge for a New Specialty: A White Paper on Hospitalist Career Satisfaction” (available online at www.hospitalmedicine.org). SHM’s Career Satisfaction Task Force (CSTF) drafted the document to be used by hospitalists and hospital medicine practices as a toolkit for ensuring or improving job satisfaction. It outlines the four pillars of career satisfaction: autonomy/control (see the June edition of The Hospitalist, p. 14), workload/ schedule (July edition, p. 10), reward/ recognition (August edition, p. 10), and community/environment. This article looks at the last of these.
The Fourth Pillar
Hospitalists belong, in some sense, to four communities and must address the expectations of each group: administration, referring and nonreferring physicians, house staff and other healthcare staff, and medical students.
The hospitalist’s community includes his/her practice as well as hospitalists from other groups. The patient community is not just patients and their family members, but the broader public community served by the hospital medicine group and the hospital. The home community, consisting of the hospitalist’s family and friends, is also a vital part of the individual’s environment.
Each of these communities contributes to job satisfaction. A sense of shared values and connection with others, as well as social and work support, can ensure satisfaction; a sense of isolation, lack of support, and unresolved conflict can lead to unhappiness with a job.
Working within a strong community “makes everything else easier,” says CSTF member Noah Harris, MD, a hospitalist at Presbyterian Hospital, Albuquerque, N.M.
“Twenty years ago, there was a medical community in hospitals where physicians came together,” recalls Dr. Harris. “With managed care, physicians have become much less invested in the hospital and you see fewer [primary care] physicians there. Hospitalists have filled that gap. The question is how to restructure the hospital medical community.”
A hospitalist might struggle with the issue this way:
“I’m one of only three hospitalists at a hospital in a rural community. I feel it’s important to work as a team with primary care physicians, the emergency department, and other medical subspecialists.”
“How do hospitalists come in as the new kid on the block and reach out to other physicians?” asks Dr. Harris. “This is important, and if hospitalists feel like they’re more a part of the community, then that makes [their work] easier.”
According to Dr. Harris, the key to building a community in your workplace is communication. Strengthen it or establish it where there is none. When you communicate, focus on common goals with the other parties.
“Community has to do with shared expectations,” Dr. Harris points out. “Everyone—particularly the various types of physicians in the hospital—has to know what they expect from hospitalists.” It may be up to individual hospitalists to educate others as to what those expectations should be.
Of course, communication should start at the top. “On one level, there has to be formal communication with administrators and [physician leaders],” says Dr. Harris. “There has to be some sort of ongoing communication with the hospital administrators because they work with all the other groups as well.”
However, less formal communication is up to the hospitalist. The more you communicate with others, the more you’ll build your community.
Here are tips for how the hospitalist in the aforementioned example might work with each group of physicians:
ED doctors: “This hospitalist needs to get to know the other physicians and healthcare professionals,” Dr. Harris advises. “Make yourself available. When you have a minute, go down to the emergency department to update the ED physicians on admissions they’ve seen. Make a point to chat.”
Primary care physicians (PCPs): It may be more difficult to initiate informal communications with these docs if they’re not often in the hospital.
“One thing that helps is for the hospitalist to focus on communicating by phone, fax, or e-mail to PCPs when their patients are in the hospital,” says Dr. Harris. “In our office, we assigned a secretary to make sure PCPs get discharge summaries. That really helped with the community.”
If you want to strengthen ties to your community PCPs, issue an invitation to an event. “Our group would have an annual holiday party and invite all our referring physicians,” says Dr. Harris. “We’d have a speaker and get to know each other a little better.”
Surgeons: Dr. Harris suggests hospitalists can guide surgeons’ expectations for their working relationship with you and strengthen a sense of community.
“If there’s a particular issue, you can use that,” says Dr. Harris. “We were seeing a lot of elderly patients admitted with hip fractures. One thing we did to get a working relationship [with orthopedic surgeons] is we came up with a set of orders for these patients. The surgeons welcomed this because they wanted help with elderly patients who had multiple conditions. This was a way to work with them in a kind of formal way that helps patients. “It’s good to come up with order sets, but the big part of this is the negotiation with the other physicians that leads up to the order sets,” Dr. Harris says.
If you’re doing something like this to help in obstetrics, neurosurgery, or orthopedics, make it a two-way conversation.
“Above all else, it’s important to work with nonphysician healthcare workers,” says Dr. Harris, “especially nurses and physical therapists.”
The Rural Factor
The example above involves a small hospital medicine program in a rural area. Are there built-in problems with building community in this environment?
“I don’t think [it’s] necessarily more difficult” to build community in this setting, says Dr. Harris, “particularly if the hospital and physicians are on board with bringing in hospitalists. They might even be easier because you have fewer folks to deal with.”
But there may be an underlying problem with working at a smaller hospital. “If you’re the only hospitalist, or even the only hospitalist on a given shift, you’re practicing in a vacuum,” says Dr. Harris. If this is the case, you can broaden your hospitalist community by establishing a network with nearby hospitals and/or hospital medicine groups, and by becoming active in a regional or national group. TH
After the Discharge
Hospital discharge and transition, whether back into the community or to other levels of care, are burdened by a lack of standardization and can be executed poorly—making them treacherous periods for patients.
Indeed, 20% of discharges are complicated by adverse events within 30 days, often resulting in avoidable trips to the emergency department and rehospitalization. Nationwide, 25% of patients are readmitted within 90 days, often because the fragmented discharge process leaves them vulnerable to iatrogenic complications.
Yet few studies have examined the discharge process in depth. Until now, none have looked at it from the patient’s point of view, lead author Lee Strunin, PhD, and colleagues Meg Stone, MPH, and Brian Jack, MD, write in the September-October edition of the Journal of Hospital Medicine. They interviewed 21 low-income patients in an inner-city hospital in Boston to identify the factors most closely associated with the risk of readmission.
The patients had a mean age of 46, and all had been hospitalized at least once within the previous six months. Twenty of the 21 patients were in the hospital for the same primary problem they were admitted for on their previous stay. The interviews lasted 20 to 45 minutes with each patient and addressed the patient’s ability to obtain follow-up care, care after discharge, and social support.
In most cases, inability to understand discharge instructions was not a problem. All participants could describe those instructions as well as their medical condition, why they were admitted to the hospital, and the medications they were taking.
—Brian Jack, MD, associate professor of family medicine, Boston University Medical Center
“For the participants in this study, difficult life circumstances posed a greater barrier to recuperation than lack of medical knowledge,” the investigators write. Patients complained of little or no support in such areas as child care, transportation to medical appointments, or attempts to overcome alcoholism or drug abuse. Many patients could not follow instructions to rest because they had to work or care for young children.
Half the patients reported psychological conditions such as depression and stress, which interfered with their ability to follow their treatment plan. For example, an 18-year-old black woman with diabetes told of how she would do well for a while, following diet and medication recommendations and monitoring her blood sugar regularly, only to become depressed and lose motivation. She was not receiving treatment for her depression. Another woman with polycystic kidney disease described pain that was sometimes so intense she had to delegate the housekeeping chores to her 5-year-old son.
Even though the patients in this study appeared to understand their illnesses and what to do (under ideal circumstances) after they went home, poor health literacy could be one explanation for these findings, senior author Dr. Jack tells The Hospitalist.
“We have data now that patients with low health literacy are less ready for discharge,” says Dr. Jack, associate professor of family medicine, Boston University Medical Center, and the department’s founding vice chair for academic affairs. He and his colleagues are developing patient-centered interventions to mitigate the discrepancies between people who are more or less health-literate. “To the degree that the middle-class population has higher health literacy, [outcomes after discharge] might vary,” he says.
These findings demonstrate the critical effect life circumstances outside the hospital have on a patient’s recovery, the authors say in the paper, adding that the patients’ experiences “clearly demonstrate the ways in which stresses make it difficult or impossible to attain sufficient rest to heal, maintain behavior change necessary to improve health, and follow instructions given by clinicians at the time of discharge.”
They further point out that interventions aimed at low-income patients should include social support and assistance with daily responsibilities.
“A focus on each patient’s life circumstance is critical,” Dr. Jack explains. For example, it isn’t sufficient simply to tell the patient when to come back for a stress test. Hospitals or caseworkers should also determine if “it is a day the patient can go, do they have a ride, daycare, do they know where the test is, which doctor will follow up the results, will they be seeing that doctor, and so on. There are now recent data suggesting that most tests ordered after discharge are never done.”
From this and other studies on the subject, it seems intuitive that providing these supports for at-risk patients should reduce rehospitalization rates. Is there any evidence this is the case?
“Not yet,” Dr. Jack says. “But stay tuned.” TH
Norra MacReady is a medical writer based in California.
Steroid Stress Dosing
Adrenal response to stress can vary broadly from patient to patient. For hospitalists, the challenge is predicting patients’ cortisol needs.
The variability exists whether one is dealing with a healthy patient or a patient with adrenal insufficiency (AI).1 Glucocorticoid use is even more complicated in patients with chronic autoimmune or inflammatory disorders who have been treated with high doses of glucocorticoids, or with those who are hypothalamic-pituitary-adrenal (HPA) axis suppressed.
Additionally, glucocorticoid administration is the most common cause of AI. Guidelines for adrenal supplementation therapy published in JAMA in 2002 note the difficulty in determining exact patient needs. JAMA’s review of guidelines for adrenal supplementation therapy is based on expert opinion, extrapolation from research literature, and clinical experience rather than clinical trials and should be consulted for more specific patient recommendations.2
Around the same time, similar guidelines on the management of rheumatoid arthritis (RA) patients on chronic glucocorticoids were published in the Bulletin on the Rheumatic Diseases.3 The guidelines suggest lower doses and shorter therapy than many textbooks advocate to counter problems associated with excessive steroid dosing. Problems such as immunosuppression, hyperglycemia, hypertension, acute psychosis, and accelerated protein catabolism lead to poor wound healing.
Additionally, the guidelines recommend that all patients receiving chronic glucocorticoids with an illness or while undergoing any procedure continue their normal daily glucocorticoid therapy. The authors caution that in patients with rheumatic disease, discontinuation of even low glucocorticoid doses may lead to a significant disease flare. Patients who receive 5 mg or less of prednisone daily do not require additional supplementation—regardless of whether they are undergoing a procedure or have an intercurrent illness. Patients undergoing superficial surgical procedures while less than an hour under local anesthesia (e.g., routine dental work, skin biopsy, minor orthopedic surgery) require their normal daily glucocorticoid dose without additional supplementation.
Patients with primary AI should receive individualized supplemental homeostatic glucocorticoid replacement therapy—usually with 20 to 30 mg of hydrocortisone two to three times daily in divided doses. Adjust based on patient factors and use of concomitant medications. Also consider that mineralocorticoid replacement may be necessary in these patients.
When considering patients for potential use of corticosteroids in the hospital, identify those who may be HPA-axis suppressed versus those who are not. The time to achieve HPA-axis suppression varies among patients. Patients can be considered not suppressed if:
- They have received any glucocorticoid doses for less than weeks; and
- They have received alternate-day glucocorticoid therapy. 4-6
- On the contrary, patients should be assumed to have HPA-axis suppression if they:
- Have received less than 20 mg of prednisone or its equivalent daily for more than three weeks (e.g., 16 mg/day methylprednisolone, 2 mg/ day dexamethasone, 80 mg/ day hydrocortisone); and/or
- Have clinical Cushing’s syndrome (e.g., centripetal obesity, glucose intolerance, proximal myopathy, hypertension, psychological chan-ges, and easy bruisability).
Intermediate patient categories may require HPA axis function testing with cosyntropin to determine if AI is present. TH
Michele Kaufman is a clinical/managed care consultant and medical writer based in New York City.
References
- Lamberts SWJ, Bruining HA, de Jong FK. Corticosteroid therapy in severe illness. N Engl J Med. 1997 Oct 30;337(18):1285-1292.
- Coursin DB, Wood KE. Corticosteroid supplementation for adrenal insufficiency. JAMA. 2002 Jan 9;287(2):236-240.
- Kelley JT, Conn DL. Perioperative management of the rheumatic disease patient. Bull Rheum Dis. 2002;51(6).
- Nieman LK, Kovacs WJ. Pharmacologic use of glucocorticoids. UpToDate. Waltham, Mass. 2007. Available at: www.pharmacologic use of glucocorticoids
- Nieman LK. Clinical manifestations of Cushing’s syndrome. UpToDate. Waltham, Mass. 2007.
- Welsh GA, Manzullo EF, Nieman LK. The surgical patient taking glucocorticoids. UpToDate. Waltham, Mass. 2007. Available at: www.patients.uptodate.com/topic.asp?file=adrenal
NEW WARNINGS

Actos tablets (pioglitazone, Eli Lilly) and Avandia tablets (rosiglitazone, GlaxoSmithKline)
- These are oral thiazolidinediones (glitazones).
- They have an increased risk of heart failure. They cause fluid retention, which may lead to or exacerbate congestive heart failure. Their warnings have been updated to reflect this because these agents are sometimes prescribed to patients with heart failure. Monitor patients carefully for the development of adverse cardiac effects.
- Don’t start or continue glitazones in patients with heart failure.
Avandia tablets (rosiglitazone, GlaxoSmithKline)
- These are oral thiazolidinediones (glitazones).
- Rosiglitazone has been associated with different rates of ischemic cardiovascular events (fatal and non-fatal). However, diabetic patients have an increased risk of cardiovascular disease.
- Analysis of rosiglitazone safety is ongoing. The Endocrinologic and Metabolic Drugs and the Drug Safety and Risk Management Advisory Committees meet jointly to discuss the cardiovascular ischemic and thrombotic risks of thiazolidinediones, especially focusing on rosiglitazone.
Additional information
- ww.fda.gov/bbs/topics/NEWS/ 2007/NEW01636.html
- www.fda.gov/cder/foi/label/2007/021073s026lbl.pdf
- www.fda.gov/cder/foi/label/2007/021071s023lbl.pdf
- “Rosiglitazone Evaluated for Cardiovascular Outcomes: An Interim Analysis,” New England Journal of Medicine. Published June 5 at www.nejm.org
Injectable Magnetic Resonance Imaging Contrast Agents: Magnevist (gadopentetate dimeglumine), MultiHance (gadobenate dimeglumine), Omniscan (gadodiamide), OptiMARK (gadoversetamide), and ProHance (gadoteridol)
- These are gadolinium-based contrast agents (GBCA).
- Patients with severe kidney insufficiency (a glomerular filtration rate [GLR] <30 mL/min/1.73m2) who receive GBCA are at risk for developing nephrogenic systemic fibrosis (NSF), a debilitating and potentially fatal disease. NSF may result in fatal or debilitating systemic fibrosis.
- Patients who are pre- or post-liver transplantation or have chronic liver disease with renal insufficiency also risk developing NSF.
- Screen patients for kidney problems prior to prescribing one of these GBCA. Do not exceed the recommended dose. Ensure that the recommended time has lapsed between doses of GBCA if it is to be used again.
- Boxed warning includes avoiding use of GBCAs unless the diagnostic information is essential and unavailable with non-contrast enhanced magnetic resonance imaging. Screen all patients for renal dysfunction. For patients receiving hemodialysis (HD), consider prompt HD following use of a GBCA. Published data indicate that GBCA elimination may be enhanced with HD. It has been reported that from the first to third HD sessions that average GBCA clearance rates were 78%, 96%, and 99%, respectively. It is not known whether HD prevents NSF.
- Report possible cases of NSF to the FDA through the FDA’s MedWatch program at www.fda.gov/medwatch/report/hcp.htm.
New Indication
- Apidra (insulin glulisine), Sanofi-Aventis’ rapid-acting insulin, has been FDA approved for intravenous (IV) administration in a clinical setting under medical supervision for glycemic control in adults with Type 1 or Type 2 diabetes mellitus. This approval provides another hospital-based option for diabetic patients, who may benefit from IV therapy in a clinical setting. Apidra is already approved for use subcutaneously from the vial, via external insulin infusion pump, or via the OptiClick reusable insulin pen.
Adrenal response to stress can vary broadly from patient to patient. For hospitalists, the challenge is predicting patients’ cortisol needs.
The variability exists whether one is dealing with a healthy patient or a patient with adrenal insufficiency (AI).1 Glucocorticoid use is even more complicated in patients with chronic autoimmune or inflammatory disorders who have been treated with high doses of glucocorticoids, or with those who are hypothalamic-pituitary-adrenal (HPA) axis suppressed.
Additionally, glucocorticoid administration is the most common cause of AI. Guidelines for adrenal supplementation therapy published in JAMA in 2002 note the difficulty in determining exact patient needs. JAMA’s review of guidelines for adrenal supplementation therapy is based on expert opinion, extrapolation from research literature, and clinical experience rather than clinical trials and should be consulted for more specific patient recommendations.2
Around the same time, similar guidelines on the management of rheumatoid arthritis (RA) patients on chronic glucocorticoids were published in the Bulletin on the Rheumatic Diseases.3 The guidelines suggest lower doses and shorter therapy than many textbooks advocate to counter problems associated with excessive steroid dosing. Problems such as immunosuppression, hyperglycemia, hypertension, acute psychosis, and accelerated protein catabolism lead to poor wound healing.
Additionally, the guidelines recommend that all patients receiving chronic glucocorticoids with an illness or while undergoing any procedure continue their normal daily glucocorticoid therapy. The authors caution that in patients with rheumatic disease, discontinuation of even low glucocorticoid doses may lead to a significant disease flare. Patients who receive 5 mg or less of prednisone daily do not require additional supplementation—regardless of whether they are undergoing a procedure or have an intercurrent illness. Patients undergoing superficial surgical procedures while less than an hour under local anesthesia (e.g., routine dental work, skin biopsy, minor orthopedic surgery) require their normal daily glucocorticoid dose without additional supplementation.
Patients with primary AI should receive individualized supplemental homeostatic glucocorticoid replacement therapy—usually with 20 to 30 mg of hydrocortisone two to three times daily in divided doses. Adjust based on patient factors and use of concomitant medications. Also consider that mineralocorticoid replacement may be necessary in these patients.
When considering patients for potential use of corticosteroids in the hospital, identify those who may be HPA-axis suppressed versus those who are not. The time to achieve HPA-axis suppression varies among patients. Patients can be considered not suppressed if:
- They have received any glucocorticoid doses for less than weeks; and
- They have received alternate-day glucocorticoid therapy. 4-6
- On the contrary, patients should be assumed to have HPA-axis suppression if they:
- Have received less than 20 mg of prednisone or its equivalent daily for more than three weeks (e.g., 16 mg/day methylprednisolone, 2 mg/ day dexamethasone, 80 mg/ day hydrocortisone); and/or
- Have clinical Cushing’s syndrome (e.g., centripetal obesity, glucose intolerance, proximal myopathy, hypertension, psychological chan-ges, and easy bruisability).
Intermediate patient categories may require HPA axis function testing with cosyntropin to determine if AI is present. TH
Michele Kaufman is a clinical/managed care consultant and medical writer based in New York City.
References
- Lamberts SWJ, Bruining HA, de Jong FK. Corticosteroid therapy in severe illness. N Engl J Med. 1997 Oct 30;337(18):1285-1292.
- Coursin DB, Wood KE. Corticosteroid supplementation for adrenal insufficiency. JAMA. 2002 Jan 9;287(2):236-240.
- Kelley JT, Conn DL. Perioperative management of the rheumatic disease patient. Bull Rheum Dis. 2002;51(6).
- Nieman LK, Kovacs WJ. Pharmacologic use of glucocorticoids. UpToDate. Waltham, Mass. 2007. Available at: www.pharmacologic use of glucocorticoids
- Nieman LK. Clinical manifestations of Cushing’s syndrome. UpToDate. Waltham, Mass. 2007.
- Welsh GA, Manzullo EF, Nieman LK. The surgical patient taking glucocorticoids. UpToDate. Waltham, Mass. 2007. Available at: www.patients.uptodate.com/topic.asp?file=adrenal
NEW WARNINGS
Actos tablets (pioglitazone, Eli Lilly) and Avandia tablets (rosiglitazone, GlaxoSmithKline)
- These are oral thiazolidinediones (glitazones).
- They have an increased risk of heart failure. They cause fluid retention, which may lead to or exacerbate congestive heart failure. Their warnings have been updated to reflect this because these agents are sometimes prescribed to patients with heart failure. Monitor patients carefully for the development of adverse cardiac effects.
- Don’t start or continue glitazones in patients with heart failure.
Avandia tablets (rosiglitazone, GlaxoSmithKline)
- These are oral thiazolidinediones (glitazones).
- Rosiglitazone has been associated with different rates of ischemic cardiovascular events (fatal and non-fatal). However, diabetic patients have an increased risk of cardiovascular disease.
- Analysis of rosiglitazone safety is ongoing. The Endocrinologic and Metabolic Drugs and the Drug Safety and Risk Management Advisory Committees meet jointly to discuss the cardiovascular ischemic and thrombotic risks of thiazolidinediones, especially focusing on rosiglitazone.
Additional information
- ww.fda.gov/bbs/topics/NEWS/ 2007/NEW01636.html
- www.fda.gov/cder/foi/label/2007/021073s026lbl.pdf
- www.fda.gov/cder/foi/label/2007/021071s023lbl.pdf
- “Rosiglitazone Evaluated for Cardiovascular Outcomes: An Interim Analysis,” New England Journal of Medicine. Published June 5 at www.nejm.org
Injectable Magnetic Resonance Imaging Contrast Agents: Magnevist (gadopentetate dimeglumine), MultiHance (gadobenate dimeglumine), Omniscan (gadodiamide), OptiMARK (gadoversetamide), and ProHance (gadoteridol)
- These are gadolinium-based contrast agents (GBCA).
- Patients with severe kidney insufficiency (a glomerular filtration rate [GLR] <30 mL/min/1.73m2) who receive GBCA are at risk for developing nephrogenic systemic fibrosis (NSF), a debilitating and potentially fatal disease. NSF may result in fatal or debilitating systemic fibrosis.
- Patients who are pre- or post-liver transplantation or have chronic liver disease with renal insufficiency also risk developing NSF.
- Screen patients for kidney problems prior to prescribing one of these GBCA. Do not exceed the recommended dose. Ensure that the recommended time has lapsed between doses of GBCA if it is to be used again.
- Boxed warning includes avoiding use of GBCAs unless the diagnostic information is essential and unavailable with non-contrast enhanced magnetic resonance imaging. Screen all patients for renal dysfunction. For patients receiving hemodialysis (HD), consider prompt HD following use of a GBCA. Published data indicate that GBCA elimination may be enhanced with HD. It has been reported that from the first to third HD sessions that average GBCA clearance rates were 78%, 96%, and 99%, respectively. It is not known whether HD prevents NSF.
- Report possible cases of NSF to the FDA through the FDA’s MedWatch program at www.fda.gov/medwatch/report/hcp.htm.
New Indication
- Apidra (insulin glulisine), Sanofi-Aventis’ rapid-acting insulin, has been FDA approved for intravenous (IV) administration in a clinical setting under medical supervision for glycemic control in adults with Type 1 or Type 2 diabetes mellitus. This approval provides another hospital-based option for diabetic patients, who may benefit from IV therapy in a clinical setting. Apidra is already approved for use subcutaneously from the vial, via external insulin infusion pump, or via the OptiClick reusable insulin pen.
In the Literature
Hematocrit and Perioperative Mortality
Wu WC, Schifftner TL, Henderson WG, et al. Preoperative hematocrit levels and postoperative outcomes in older patients undergoing noncardiac surgery. JAMA. 2007 Jun 13;297(22):2481-2488.
Several studies have outlined the risk of preoperative anemia prior to noncardiac surgery in elderly patients. These studies have not linked anemia to risk of death unless cardiac disease is present.
Anemia management remains a challenge for many hospitals and is the most important predictor of the need for blood transfusion. Transfusion increases morbidity and mortality in the perioperative setting. At the same time, little is known about the risks of polycythemia in this setting.
This retrospective cohort study used the Veterans’ Affairs National Surgical Quality Improvement Program database of 310,311 veterans 65 or older from 132 VA hospitals. It explores the relationship between abnormal levels of hematocrit and adverse events among elderly surgical patients.
The data suggest an incremental relationship between positive and negative deviation of hematocrit levels with 30-day postoperative mortality in patients 65 and older. Specifically, the study found a 1.6% increase (95% confidence interval, 1.1%-2.2%) in 30-day mortality for every percentage point of increase or decrease in hematocrit from the normal range.
Because this is an observational study of anemia and adverse events, no causal relationship can be established from this data. Hospitalists involved in perioperative care should be careful about drawing conclusions from this study alone and should not necessarily plan interventions to treat abnormal levels of hematocrit without carefully considering the risks and benefits of intervention.
Prognostic Utility of Pre-operative BNP
Feringa HH, Schouten O, Dunkelgrun M, et al. Plasma N-terminal pro-B-type natriuretic peptide as long term prognostic marker after major vascular surgery. Heart. 2007 Feb;93(2):226-231.
Traditional stratification of patients at high risk for cardiac complications and undergoing noncardiac surgery has included clinical risk index scoring and pre-operative stress testing. It is unclear if cardiac biomarkers can be used in conjunction with these measures to improve the identification of patients at risk.
Feringa and colleagues addressed this question by looking prospectively at 335 patients undergoing major vascular surgery over a two-year period. The mean age of patients was 62.2 years; 46% of patients underwent abdominal aortic aneurysm repair, and the remaining 54% received lower-extremity revascularization.
Patients had cardiac risk scores calculated based on the Revised Cardiac Risk Index (RCRI), and all patients had dobutamine stress echocardiogram (DSE) to assess for stress-induced ischemia. N-terminal pro-B-type natriuretic peptide (BNP) was measured at a mean of 12 days before surgery. Patients were followed for all-cause mortality and post-op death for a mean follow-up time of 14 months.
The authors found that NT-pro BNP performed better than the RCRI and DSE for predicting six-month mortality and cardiac events. An NT-pro BNP cut-off level of 319 ng/l was identified as optimal for predicting six-month mortality and cardiac events with 69% sensitivity and 70% specificity for mortality. Patients with levels 319 mg/l had a lower survival during the follow up period (p<0.0001).
Based on this prospective study, it appears that a preoperative elevated NT-Pro BNP is associated with long-term mortality and morbidity and could be used as an additional risk-stratification tool along with clinical risk scoring and stress testing.
Utility of Combination Medications in COPD
Aaron SD, Vandemheen KL, Fergusson D, et al. Tiotropium in combination with placebo, salmeterol, or fluticasone-salmeterol for treatment of chronic obstructive pulmonary disease. Ann Intern Med. 2007 Feb 19;146:545-555
The appropriateness of multiple long-acting inhaled medications in treating chronic obstructive pulmonary disease (COPD) is poorly studied. This study evaluated whether combining tiotropium with fluticasone-salmeterol or with salmeterol alone improves clinical outcomes in adult patients with moderate to severe COPD, as compared with tiotropium plus placebo.
This randomized, double-blind, placebo-controlled trial was set in academic and community medical centers in Canada. Researchers monitored 449 patients in the three parallel treatment groups for COPD exacerbations for 52 weeks. Analysis was done on an intention-to-treat basis. The rate of COPD exacerbations within the follow-up period (the primary outcome) was not significantly different among the three treatment groups. However, secondary outcomes, such as rates for hospitalization for COPD exacerbations, all-cause hospitalizations, health-related quality of life and lung function were significantly improved in the group receiving tiotropium and fluticasone-salmeterol.
A notable limitation was that more subjects stopped taking the study medications in the tiotropium-placebo and the tiotropium-salmeterol group. Many crossed over to treatments with inhaled corticosteroids or beta-agonists.
The results are in contrast to current guidelines, which recommend adding inhaled steroids to reduce exacerbations in moderate to severe COPD. Whether these results are due to differing statistical analysis among studies remains unclear. The authors postulate that reduction in secondary outcomes may be related to fluticasone reducing the severity of exacerbations rather than the actual number.
COPD exacerbations are among the most common diagnoses encountered by hospitalists. Most patients are treated with multiple inhaled medications to optimize their pulmonary status. Polypharmacy and the added financial burdens on the patient (particularly the elderly) are important considerations when deciding discharge medications, and the evidence of efficacy for combination inhaled medications had not been assessed as a clinical outcome prior to this study.
Benefits of Rapid Response Teams
Winters BD, Pham JC, Hunt EA et al. Rapid response systems: a systematic review. Crit Care Med. 2007 May;35(5):1238-1243.
Although the Institute for Healthcare Improvement has endorsed rapid response teams, and many hospitalist groups are involved with such systems, quality research is lacking.
Following up on the 2006 “First Consensus Conference on Medical Emergency Teams,” this meta-analysis sought to evaluate current literature to identify the effect of rapid response systems (RRS) on rates of hospital mortality and cardiac arrest.
The authors included randomized trials and observational studies in their analysis. Only eight studies met their inclusion criteria (six observational studies, one multicenter randomized trial, and one single-center randomized trial).
The pooled results did not demonstrate a statistically significant benefit of rapid-response systems in rates of hospital mortality. When rates of in-hospital cardiac arrest were analyzed, there was a weak finding in support of RRS, with the relative risk of 0.70 (confidence interval 0.56-0.92) in favor of RRSs. But the confidence interval was wide, and there was substantial heterogeneity among the included studies.
The authors conclude that “it seems premature to declare RRS as the standard of care,” and that data are lacking to justify any particular implementation scheme or composition of RRS or to support the cost-effectiveness of RRS.
Finally, they recognized the need for larger, better-designed randomized trials. However, in an accompanying editorial, Michael DeVita, MD—a pioneer in the development of RRS—rejects the use of techniques of evidence-based medicine such as multicenter trials and meta-analysis in assessing the utility of RRS. Dr. DeVita essentially says that changing the systems and culture of care within the hospital to accommodate patients with unmet critical needs must be effective in improving outcomes.
This meta-analysis is hindered by the suboptimal quality and homogeneity of studies available for assessment. Hospitalists should be aware of the limitations of the data and literature, as well as the empirical arguments raised by Dr. DeVita, when considering involvement in or designing RRS. TH
CLASSIC LIT
Perioperative Statins
Kapoor AS, Kanji H, Buckingham J, et al. Strength of evidence for perioperative use of statins to reduce cardiovascular risk: systematic review of controlled studies. BMJ. 2006 Nov 6;333(7579):1149.
Recent literature and randomized trials have claimed statins decrease morbidity and mortality from cardiovascular events in patients with or at high risk of coronary artery disease. This meta-analysis sought to determine the strength of evidence leading to the recommendations that perioperative statins be used to reduce perioperative cardiovascular events.
The literature search and exclusion criteria identified 18 studies. Two were randomized controlled trials (n=177), 15 were cohort studies (n=799,632), and one was a case-control study (n=480). Of these, 12 studies enrolled patients undergoing noncardiac vascular surgery, four enrolled patients undergoing coronary bypass surgery, and two enrolled patients undergoing various surgical procedures. The 16 nonrandomized studies were rated good. The two randomized trials were rated five and two out of five using the Jadad quality scores.
The results showed that in the randomized trials the summary odds ratio (OR) for death or acute coronary syndrome during the perioperative period with statin use was 0.26 (95% confidence interval 0.07 to 0.99), but this was based on only 13 events in 177 patients and cannot be considered conclusive. In the cohort studies, the OR was 0.70 (95% confidence interval 0.57 to 0.87). Although the pooled cohort data provided a statistically significant result, these cannot be considered conclusive because the statins were not randomly allocated and the results from retrospective studies were more impressive (OR 0.65, 95% confidence interval 0.50 to 0.84) than those in the prospective cohorts (OR 0.91, 95% confidence interval 0.65 to 1.27) and dose, duration, and safety of statin use were not reported.
Limitations of this meta-analysis include that none of the studies reported patient compliance or doses of statins or cholesterol levels before and after surgery, and few reported the duration of therapy before surgery or the which statin was used. Thus, the authors were unable to demonstrate a dose-response association. They were also unable to ascertain if the benefits seen with statins in the observational studies were exaggerated owing to inclusion of patients in the nonstatin group who had their statins stopped prior to surgery, because acute statin withdrawal may be associated with cardiac events.
The authors concluded that although their meta-analysis—which included data from more than 800,000 patients—suggests considerable benefits from perioperative statin use, the evidence from the randomized trials is not definitive. They advocate only that statins be started preoperatively in eligible patients (e.g., patients with coronary artery disease, multiple cardiac risk factors, elevated LDL) who would warrant statin therapy for medical reasons independent of the proposed operation.
Electronic Alerts to Prevent Hospital-acquired VTE
Kucher N, Koo S, Quiroz R, et al. Electronic alerts to prevent venous thromboembolism among hospitalized patients. N Engl J Med. 2005 Mar 10;352(10):969-977
Surveys conducted in North America and Europe have shown that prophylaxis against deep venous thrombosis (DVT) has been consistently underused in hospitalized patients despite consensus guidelines. Studies involving continuing medical education and computerized electronic alerts have shown that physician use of prophylaxis improves when such processes are in place, but have not demonstrated that they can reduce the rate of DVT.
A computer program was developed to identify consecutive hospitalized patients at increased risk for DVT. The program used eight common risk factors to determine each patient’s risk profile for DVT and each risk factor was assigned a score. A cumulative score of four or higher was used to determine patients at high risk for DVT. The computer alert program was screened daily to identify patients whose score increased to four or higher after admission into the hospital. If the cumulative risk score was at least four, the computer program reviewed the current electronic orders and active medications for the use of DVT prophylaxis.
In the study, 2,506 consecutive adult patients were identified as high risk for DVT. Further,1,255 were randomized to the intervention group—in which the responsible physician received one electronic alert about the risk of DVT—and 1,251 patients were randomized to the control group in which no alert was issued. The 120 physicians involved took care of patients in the intervention and control groups. Physicians responsible for the control group were not aware that patients were being followed for clinical events. When physicians received alerts, they had to acknowledge them and could either withhold prophylaxis or order it on the same computer screen.
Patients were followed for 90 days after the index hospitalization. The primary end point was clinically apparent DVT or pulmonary embolism (PE). Safety end points included mortality at 30 days, and the rate of hemorrhagic events at 90 days.
The results showed that prophylactic measures were ordered for 421 of the 1,255 patients in the intervention group (33.5%) and 182 of the 1,251 patients in the control group (14.5%, p <0.001). There were higher rates of both mechanical (10% versus 1.5%, p<0.001) and pharmacological (23.6% versus 13.0%, p<0.001) prophylaxis in the intervention group. The primary end point of DVT or PE at 90 days occurred in 61 patients in the intervention group (4.9%) as compared with 103 patients in the control group (8.2%).
The computer alert reduced the risk of events at 90 days by 41% (HR 0.59; 95% CI 0.43 to 0.81; P=0.001). Of the patients who received prophylaxis 5.1% had DVT or PE compared with 7.0% of those who did not. In the intervention group, DVT or PE occurred in 20 of 421 (4.8%) patients who received prophylaxis compared with 41 of 834 (4.9%) who did not receive any. In the control group, the same numbers were 11 of 182 (6.0%) and 91 of 1,069 (8.5%).
Some of this benefit might be attributed to the additional preventive measures such as physiotherapy and early ambulation in patients assigned to the intervention group. Diagnostic bias also could have played into the results. Not all patients were screened for VTE, and it is likely that symptomatic patients without prophylaxis were screened more frequently than symptomatic patients with prophylaxis. Because physicians took care of both the control and intervention group, alerts received by physicians in the control group could have influenced their decision in the control group as well.
The authors concluded that instituting computer alerts markedly reduced the rates of DVT or PE in hospitalized patients.
Network of Knowledge
By now almost everyone has heard about the social network site MySpace. More than 50 million people—mostly between ages 14 and 24—post and view online profiles connected by links to friends in the system. It’s one of the most heavily trafficked sites on the Internet.
MySpace is remarkable not only for consistent, double-digit growth rate, but also because visitors average two hours on the site modifying their profiles, and checking out friends’ profiles and commenting on them. MySpace has become ubiquitous to a generation using this public space to create and modify their identity on a daily basis—with technology that only recently has become available.
While recognizing that it may be a long time before www.hospitalmedicine.org becomes a household destination, the SHM Research Committee aims to generate similar excitement among our peers for connecting with each other over hospital medicine research on the Web.
Chapter Summary
Las Vegas

The SHM Las Vegas Chapter held its quarterly administrative meeting June 26 at Roy’s in Las Vegas. Gary Skankey, MD, infectious disease specialist and associate clinical professor at the University of Nevada School of Medicine, presented “Treating Complicated Skin and Skin Infections in an Era of Increasing Resistance.” The chapter will host a CME Program on surviving sepsis Sept. 28-29. Visit the chapter page for further program details.
Nashville
The SHM Nashville Chapter meeting June 6 at Stoney River restaurant was sponsored by Ortho McNeil and HCA Physician Recruitment. Eric Siegal, MD, with the University of Wisconsin Hospital in Madison, was the featured presenter and led an interactive session during “Malpractice for the Hospitalists: Identifying and Mitigating Risks.” The next meeting is scheduled for this month. Details will be posted at a later date.
At the SHM Research Committee meeting in Dallas in May, the conversation covered many topics, including the need for research mentorship, training, and career development. Plans for short- and medium-term measures to support SHM members in these areas are in the works, with a focus on Internet-based resources.
Over the long term, the committee would like to see its efforts result in national, high-impact hospital medicine studies and well-trained researchers. Whether driven by a curiosity in a particular area and/or the desire to provide better care by incorporating the best research, the universal challenge is to free enough time to pursue the answers and for appropriate recognition systems to be in place—be they promotion, funding to support further work, or recognition that leads to new connections.
The 249 abstracts published in a supplement to the Journal of Hospital Medicine only hinted at the depth and enthusiasm behind SHM members’ work. Anyone who walked through the exhibit hall during the poster session at the SHM Annual Meeting and talked with the people behind the research was impressed with their dedication and relative youth. They are the future of hospital medicine and are looking for ways to collaborate and continue to learn. The SHM Research Committee is dedicated to finding ways to support their efforts.
It seems as if many SHM members either engage in research, think about a research project, or wish they could evaluate their everyday practice in a way that can help others. However, it is difficult to discern how best to support individual hospitalists working in diverse settings across the country.
Because clinical responsibilities will not slow down anytime soon, we will have to work within the current, hectic environment and use technology as an equalizer to enable communication. In the spectrum of professional medical societies, SHM could be considered similar to the age 14-24 demographic attracted to the fluidity, instant communication/information and innovation that fuels MySpace.
Our long-term research goals could be powerfully advanced by a peer-catalyzed hospitalist research network.
The term “research network” can refer to many types of collaboration. One type that has been successful is the collection, analysis, and reporting of data in a registry or repository. In this example, medical care can be measured through the collection, analysis, and reporting of data. The National Cardiovascular Data Registry (established in 1998 by the American College of Cardiology Foundation) is a well-known example, but there are many others that have been organized for the purposes of improving quality and providing educational and research activities.
A second type of research network is the developing partnership between the American Medical Association (AMA) and Sermo, an online community where physicians exchange medical opinions. The partnership attempts to use technology to harness innovation, support physicians, and improve the capability of a peer network to influence the care patients receive by letting them share information with each other regarding patient care, pertinent scientific research, and advocacy issues. This is a looser network—without the constraints of data dictionaries—that relies on technology to make the connection between physician peers. While its start-up costs may be lower, its impact will be more difficult to measure.
A third example is the Gotham Prize for Cancer Research, which requires investigators to qualify by logging onto a Web site (www.gothamprize.org), posting a short proposal, and answering questions. If accepted by the expert panel of cancer researchers into this active forum, the new member will not only be eligible to receive the annual prize for the best idea, these individuals and their ideas will be matched to funding agencies and other scientists who may be able to support, assist, and/or collaborate. This limited-access network requires more facilitation than the previous AMA example, and the incentives and outcomes are more clearly defined.
The SHM Research Committee sees potential in exploring a network for hospital medicine researchers, through which members can access resources, collaborate, and innovate. Internet technology has the potential to level the playing field and erase the barriers of time differences and geography. By organizing around areas of interest designed to attract a critical mass of interested hospitalists, the goal of this network is to position SHM to lead hospital medicine research and ensure long-term success and sustainability by enabling powerful, high-impact studies in hospital medicine and supporting well-trained hospitalist researchers. Although this discussion is in the early stages of development, the SHM Research Committee plans to consider the following questions:
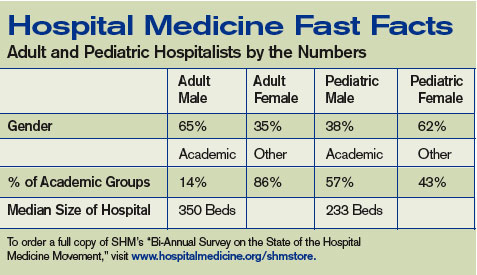
How would a network help hospital medicine and hospitalists? During the meeting in May in Dallas, the SHM Research Committee articulated the need for research mentorship, training, and career development. Any proposed network must further these aims. Hospital medicine investigators and SHM members would be involved in refining these goals at the earliest stages. Opportunities for training a new generation of hospital medicine investigators and strengthening the existing ones through such a network will be explored, including options for training in outcomes research and opportunities to link participants with mentors.
What questions should a network focus on? Hospitalists are well positioned to lead or collaborate on a range of key questions—questions that, in the short term, likely will focus on effectiveness and implementation research (related to quality improvement). Over the longer term, hospitalists should position themselves to be involved in all facets of clinical translational research, including T1 (bench-to-bedside research) and T2 (effectiveness research, such as larger randomized studies, and health services research). As hospital medicine grows, the potential areas where hospitalists might focus their scientific interests will expand. As hospitalists assume greater roles in caring for patients outside general medicine (e.g., surgical, cardiovascular, neurology, and oncology patients), the breadth of scientific inquiry will expand. In many of these cases, research networks exist; SHM will have to facilitate collaboration whenever possible.
How will the network engage a broad swath of hospitalists? By selecting research questions important to public health and anticipating a changing clinical environment, we hope to enhance the interest and relevance of an SHM research network. The SHM Research Committee will focus on how best to design a research network that is practical and useful for hospital medicine researchers and enable straightforward studies. A main goal will be promoting visibility for investigators and coordinators through opportunities for authorship and presentation of results at national meetings.
Healthcare reform has become a hot political issue again—more than a year before the presidential election. All three leading Democratic candidates (Hillary Clinton, Barack Obama, and John Edwards) have proposed some sort of a central institute to assess treatment options and disseminate research and information to providers. Hospitalists (as generalists and team leaders in an arena where approximately 30% of the healthcare dollar is spent) are a key part of any national solution.
Whether this research requires a catalyst such as a hospitalist network—and what that network would look like—remains to be seen. The SHM Research Committee is considering mechanisms to provide research mentorship, training, and career development, and weighing the best use of resources. We count on your input. Contact Carolyn Brennan, director of research program development for SHM, at [email protected] for more information or to get involved. TH
SHM Behind the Scenes
PRIS updates in Salt Lake City
By Todd Von Deak
Each year, one of the premier events in pediatric hospital medicine is a summer conference presented by the American Academy of Pediatrics (AAP), the Ambulatory Pediatric Association (APA), and SHM. This year’s conference, held last month in Salt Lake City under the lead sponsorship of the AAP, was no exception.
More than 300 pediatric hospitalists, medical directors, residents, nurse practitioners, and physician assistants came together for four days to network, get answers, and learn from colleagues at 30 sessions. Charlie Homer, CEO of the National Institute for Children’s HealthCare Quality in Cambridge, Mass., was the keynote speaker. Dr. Homer highlighted the roles hospitalists can and must play to improve children’s health, and challenged all present to create a dashboard that includes quality indicators for care that is efficient, equitable, evidence-based, safe, and family-centered.
Leaders from the AAP, APA, and SHM opened the morning sessions the next day with brief presentations that highlighted the role of pediatric hospitalists in each organization, and the potential to work together to continue to develop pediatric hospital medicine and advance the care of hospitalized children. Participants were then free to choose from more than 16 sessions ranging from clinical issues such as the management of apparent life-threatening events and appropriate maintenance IV fluids, to practice management (Coding 101 and 201), quality improvement, and resident teaching and research.
Capping the schedule of events was a luncheon presentation from Christopher P. Landrigan, MD, director of the Pediatric Research in Inpatient Settings network. He presented “PRIS Update: The Need for Collaborative Hospitalist Research in 2007.” PRIS is an independent collaborative entity established by the same organizations that sponsor the Salt Lake City conference and is designed to allow for collaborative study of key questions in inpatient pediatrics.
Linda Snelling, MD, inpatient director and chief of pediatric critical care at Hasbro Children’s Hospital in Providence, R.I., followed with a talk on how pediatric hospitalists can effectively negotiate for themselves and the field. Her key insights included, “ ‘No.’ is a complete sentence.”
According to Jack Percelay, MD, past chair of SHM’s Pediatric Committee and a practicing pediatric hospitalist in New York and New Jersey, the conference exceeded its goals. “The energy at the conference was tremendous,” he said. “Sessions were filled with attendees learning of and debating cutting-edge issues for pediatric hospitalists. The buzz in the hotel was so intoxicating we were worried that we were violating Salt Lake City liquor laws. The AAP put on a spectacular meeting. SHM is looking forward to following this tradition of excellence as we take the lead for putting on an even larger meeting in Denver July 24-27, 2008.”
Given that the 2008 meeting sold out six weeks in advance, pediatric hospitalists will do well to stay tuned to The Hospitalist and visit SHM’s Web site, www.hospitalmedicine.org, for more details as the 2008 conference approaches. TH
By now almost everyone has heard about the social network site MySpace. More than 50 million people—mostly between ages 14 and 24—post and view online profiles connected by links to friends in the system. It’s one of the most heavily trafficked sites on the Internet.
MySpace is remarkable not only for consistent, double-digit growth rate, but also because visitors average two hours on the site modifying their profiles, and checking out friends’ profiles and commenting on them. MySpace has become ubiquitous to a generation using this public space to create and modify their identity on a daily basis—with technology that only recently has become available.
While recognizing that it may be a long time before www.hospitalmedicine.org becomes a household destination, the SHM Research Committee aims to generate similar excitement among our peers for connecting with each other over hospital medicine research on the Web.
Chapter Summary
Las Vegas
The SHM Las Vegas Chapter held its quarterly administrative meeting June 26 at Roy’s in Las Vegas. Gary Skankey, MD, infectious disease specialist and associate clinical professor at the University of Nevada School of Medicine, presented “Treating Complicated Skin and Skin Infections in an Era of Increasing Resistance.” The chapter will host a CME Program on surviving sepsis Sept. 28-29. Visit the chapter page for further program details.
Nashville
The SHM Nashville Chapter meeting June 6 at Stoney River restaurant was sponsored by Ortho McNeil and HCA Physician Recruitment. Eric Siegal, MD, with the University of Wisconsin Hospital in Madison, was the featured presenter and led an interactive session during “Malpractice for the Hospitalists: Identifying and Mitigating Risks.” The next meeting is scheduled for this month. Details will be posted at a later date.
At the SHM Research Committee meeting in Dallas in May, the conversation covered many topics, including the need for research mentorship, training, and career development. Plans for short- and medium-term measures to support SHM members in these areas are in the works, with a focus on Internet-based resources.
Over the long term, the committee would like to see its efforts result in national, high-impact hospital medicine studies and well-trained researchers. Whether driven by a curiosity in a particular area and/or the desire to provide better care by incorporating the best research, the universal challenge is to free enough time to pursue the answers and for appropriate recognition systems to be in place—be they promotion, funding to support further work, or recognition that leads to new connections.
The 249 abstracts published in a supplement to the Journal of Hospital Medicine only hinted at the depth and enthusiasm behind SHM members’ work. Anyone who walked through the exhibit hall during the poster session at the SHM Annual Meeting and talked with the people behind the research was impressed with their dedication and relative youth. They are the future of hospital medicine and are looking for ways to collaborate and continue to learn. The SHM Research Committee is dedicated to finding ways to support their efforts.
It seems as if many SHM members either engage in research, think about a research project, or wish they could evaluate their everyday practice in a way that can help others. However, it is difficult to discern how best to support individual hospitalists working in diverse settings across the country.
Because clinical responsibilities will not slow down anytime soon, we will have to work within the current, hectic environment and use technology as an equalizer to enable communication. In the spectrum of professional medical societies, SHM could be considered similar to the age 14-24 demographic attracted to the fluidity, instant communication/information and innovation that fuels MySpace.
Our long-term research goals could be powerfully advanced by a peer-catalyzed hospitalist research network.
The term “research network” can refer to many types of collaboration. One type that has been successful is the collection, analysis, and reporting of data in a registry or repository. In this example, medical care can be measured through the collection, analysis, and reporting of data. The National Cardiovascular Data Registry (established in 1998 by the American College of Cardiology Foundation) is a well-known example, but there are many others that have been organized for the purposes of improving quality and providing educational and research activities.
A second type of research network is the developing partnership between the American Medical Association (AMA) and Sermo, an online community where physicians exchange medical opinions. The partnership attempts to use technology to harness innovation, support physicians, and improve the capability of a peer network to influence the care patients receive by letting them share information with each other regarding patient care, pertinent scientific research, and advocacy issues. This is a looser network—without the constraints of data dictionaries—that relies on technology to make the connection between physician peers. While its start-up costs may be lower, its impact will be more difficult to measure.
A third example is the Gotham Prize for Cancer Research, which requires investigators to qualify by logging onto a Web site (www.gothamprize.org), posting a short proposal, and answering questions. If accepted by the expert panel of cancer researchers into this active forum, the new member will not only be eligible to receive the annual prize for the best idea, these individuals and their ideas will be matched to funding agencies and other scientists who may be able to support, assist, and/or collaborate. This limited-access network requires more facilitation than the previous AMA example, and the incentives and outcomes are more clearly defined.
The SHM Research Committee sees potential in exploring a network for hospital medicine researchers, through which members can access resources, collaborate, and innovate. Internet technology has the potential to level the playing field and erase the barriers of time differences and geography. By organizing around areas of interest designed to attract a critical mass of interested hospitalists, the goal of this network is to position SHM to lead hospital medicine research and ensure long-term success and sustainability by enabling powerful, high-impact studies in hospital medicine and supporting well-trained hospitalist researchers. Although this discussion is in the early stages of development, the SHM Research Committee plans to consider the following questions:
How would a network help hospital medicine and hospitalists? During the meeting in May in Dallas, the SHM Research Committee articulated the need for research mentorship, training, and career development. Any proposed network must further these aims. Hospital medicine investigators and SHM members would be involved in refining these goals at the earliest stages. Opportunities for training a new generation of hospital medicine investigators and strengthening the existing ones through such a network will be explored, including options for training in outcomes research and opportunities to link participants with mentors.
What questions should a network focus on? Hospitalists are well positioned to lead or collaborate on a range of key questions—questions that, in the short term, likely will focus on effectiveness and implementation research (related to quality improvement). Over the longer term, hospitalists should position themselves to be involved in all facets of clinical translational research, including T1 (bench-to-bedside research) and T2 (effectiveness research, such as larger randomized studies, and health services research). As hospital medicine grows, the potential areas where hospitalists might focus their scientific interests will expand. As hospitalists assume greater roles in caring for patients outside general medicine (e.g., surgical, cardiovascular, neurology, and oncology patients), the breadth of scientific inquiry will expand. In many of these cases, research networks exist; SHM will have to facilitate collaboration whenever possible.
How will the network engage a broad swath of hospitalists? By selecting research questions important to public health and anticipating a changing clinical environment, we hope to enhance the interest and relevance of an SHM research network. The SHM Research Committee will focus on how best to design a research network that is practical and useful for hospital medicine researchers and enable straightforward studies. A main goal will be promoting visibility for investigators and coordinators through opportunities for authorship and presentation of results at national meetings.
Healthcare reform has become a hot political issue again—more than a year before the presidential election. All three leading Democratic candidates (Hillary Clinton, Barack Obama, and John Edwards) have proposed some sort of a central institute to assess treatment options and disseminate research and information to providers. Hospitalists (as generalists and team leaders in an arena where approximately 30% of the healthcare dollar is spent) are a key part of any national solution.
Whether this research requires a catalyst such as a hospitalist network—and what that network would look like—remains to be seen. The SHM Research Committee is considering mechanisms to provide research mentorship, training, and career development, and weighing the best use of resources. We count on your input. Contact Carolyn Brennan, director of research program development for SHM, at [email protected] for more information or to get involved. TH
SHM Behind the Scenes
PRIS updates in Salt Lake City
By Todd Von Deak
Each year, one of the premier events in pediatric hospital medicine is a summer conference presented by the American Academy of Pediatrics (AAP), the Ambulatory Pediatric Association (APA), and SHM. This year’s conference, held last month in Salt Lake City under the lead sponsorship of the AAP, was no exception.
More than 300 pediatric hospitalists, medical directors, residents, nurse practitioners, and physician assistants came together for four days to network, get answers, and learn from colleagues at 30 sessions. Charlie Homer, CEO of the National Institute for Children’s HealthCare Quality in Cambridge, Mass., was the keynote speaker. Dr. Homer highlighted the roles hospitalists can and must play to improve children’s health, and challenged all present to create a dashboard that includes quality indicators for care that is efficient, equitable, evidence-based, safe, and family-centered.
Leaders from the AAP, APA, and SHM opened the morning sessions the next day with brief presentations that highlighted the role of pediatric hospitalists in each organization, and the potential to work together to continue to develop pediatric hospital medicine and advance the care of hospitalized children. Participants were then free to choose from more than 16 sessions ranging from clinical issues such as the management of apparent life-threatening events and appropriate maintenance IV fluids, to practice management (Coding 101 and 201), quality improvement, and resident teaching and research.
Capping the schedule of events was a luncheon presentation from Christopher P. Landrigan, MD, director of the Pediatric Research in Inpatient Settings network. He presented “PRIS Update: The Need for Collaborative Hospitalist Research in 2007.” PRIS is an independent collaborative entity established by the same organizations that sponsor the Salt Lake City conference and is designed to allow for collaborative study of key questions in inpatient pediatrics.
Linda Snelling, MD, inpatient director and chief of pediatric critical care at Hasbro Children’s Hospital in Providence, R.I., followed with a talk on how pediatric hospitalists can effectively negotiate for themselves and the field. Her key insights included, “ ‘No.’ is a complete sentence.”
According to Jack Percelay, MD, past chair of SHM’s Pediatric Committee and a practicing pediatric hospitalist in New York and New Jersey, the conference exceeded its goals. “The energy at the conference was tremendous,” he said. “Sessions were filled with attendees learning of and debating cutting-edge issues for pediatric hospitalists. The buzz in the hotel was so intoxicating we were worried that we were violating Salt Lake City liquor laws. The AAP put on a spectacular meeting. SHM is looking forward to following this tradition of excellence as we take the lead for putting on an even larger meeting in Denver July 24-27, 2008.”
Given that the 2008 meeting sold out six weeks in advance, pediatric hospitalists will do well to stay tuned to The Hospitalist and visit SHM’s Web site, www.hospitalmedicine.org, for more details as the 2008 conference approaches. TH
Promote the Generalists
Isn’t it ironic that just as America is waking up to the importance of primary care medicine, our own representative organizations are selling us down the river?
The training of primary care physicians has for decades allowed us to branch out and follow our patients in multiple sites of care. We are the masters of managing care across this continuum.
Government and big business are finally recognizing that they need to bolster primary care to manage patients in the new chronic care medical home models. They are finally recognizing the need to better supply, equip, and finance primary care physicians.
The American College of Physicians (ACP), the American Academy of Family Practice (AAFP), and the American Medical Association all appear to support this concept. So where is the irony?
The American Board of Internal Medicine (ABIM), along with the aforementioned groups and others, continues to carve medicine into ever increasing sub areas, based on sites of care and interests. Hospitalists (who already have three branches—general hospitalists, proceduralists, and nocturnists) are seeking special certification recognition through ABIM. Palliative care is a new certification. These branches of medicine deserve recognition, but do we need all these fractured certifications?
Soon, no primary care physicians will be certified as capable of practicing in multiple sites of care without multiple certifications for each separate site and individual function. Soon there will be no “general” primary care physicians. Can hospitalists equally manage the whole continuum of care, or will they need to become generalists again to do the job?
Medicine teaches us to care for the whole person—body, mind, and spirit—not just individual parts. I urge the ABIM, the ACP, the AAFP, the AMA, SHM, and others to stop this fracturing of primary care. Now is the time to promote the generalists. Now is the time to lift all primary care-related areas of medicine together, leaving no one behind.
John M. Colombo, MD
HAN/Colombo
Crozer Keystone Health Network
A Blog of His Own

Anyone who has attended the closing session of an SHM Annual Meeting or read one of his editorial pieces in The Hospitalist or other publications knows that Bob Wachter, MD, sees the world in a unique and uniquely informed way.
This fall, Dr. Wachter—professor and associate chairman of the Department of Medicine at the University of California, San Francisco (UCSF), co-founder of SHM, and the man who coined the term “hospitalist” (along with Lee Goldman, MD)—will regularly share his one-of-a-kind perspective via a Weblog, or blog. Tentatively titled “Wachter’s World,” the hospital medicine blog will debut at www.the-hospitalist.org in time for the “Management of the Hospitalized Patient” session Oct. 4-6 at UCSF. The in-depth course serves as the West Coast regional meeting of SHM.
“Even an old guy like me realizes that blogs are incredibly hot,” says Dr. Wachter. “And as I read more of them and began relying on them more for information and insights, I started looking for one in our field that was lively, engaging and informative, one I’d like to read. I couldn’t find anything, so I thought I should start one.”
When Dr. Wachter approached SHM about hosting his blog, the organization’s leadership was quite interested—especially because SHM was already considering starting its own blog.
“SHM’s audience is perfect for the growing blog medium,” says Larry Wellikson, MD, the CEO of SHM. “We saw this with the enormous response to the SHM blogs at the May 2007 Annual Meeting.”
So “Wachter’s World” will be found on The Hospitalist’s Web site, where Dr. Wachter will post regular updates—he estimates typically three or four times a week.
“SHM’s partnership with Bob Wachter to launch an innovative blog, housed on the Web site for the most widely read publication in hospital medicine, SHM’s The Hospitalist, just makes sense as hospitalists need to hear new ideas and meet the challenge to be the change agents for the hospital of the future,” Dr. Wellikson says. “Wachter has proven himself a nationally sought-after thought leader who has something to say about hospital medicine, patient safety, improving quality, and the future of medicine.”
Dr. Wachter has a unique perspective on, well, everything. His years of experience working in hospital medicine as well as his high-level involvement in shaping the field—such as his position as chair of the American Board of Internal Medicine (ABIM) Committee on Hospital Medicine Focused Recognition—allows him ground-level and big-picture views of issues and trends that affect hospitalists’ work.
He often makes unique connections and forms original opinions on those issues—whether addressing road bumps a hospitalist runs into on the job or policy points that may change that job—and he plans to share those connections and opinions in his blog.
“I want to comment on the confluence of real stuff we all see day to day and the things that influence our field,” Dr. Wachter says. And he certainly has plenty of subjects to cover.
“There are so many issues that cross my retina every day that I think are of interest to hospitalists,” he says. “I see things in context—how they develop and how they all fit together, including trends as they develop. This blog will show my point of view—not on the differences in healthcare policy between Clinton’s camp and Obama’s camp—but closer to the ground. I’ll cover what relates to all of us.” TH
Pain at the Pump
Patient-controlled analgesia (PCA), well accepted and widely used to quickly ease post-operative and acute pain, is safe and effective—in skilled hands. But there are complications, caveats, and safety concerns hospitalists should consider to incorporate this tool into their pain management routines and hospital protocols.
Studies show patients prefer the PCA compared with other analgesic routes.1-2 Less clear is whether it is more effective or leads to lower opioid use.
Some hospitalists use the PCA for their patients with pain—others defer to anesthesiologists, pain services, or palliative care consultants to manage the PCA and its multifaceted dosing requirements.
“There are a lot of misconceptions about the PCA,” says Deb Gordon, RN, MS, FAAN, senior clinical nurse specialist and pain consultant at the University of Wisconsin (UW) Medical Center in Madison. “There is a misunderstanding that the PCA is a magic black box for pain relief,” which can lead to its overuse. As a general rule of pain management, patients prefer the oral route of analgesic administration, Gordon says, unless that is a problem or rapid titration is needed.
“I don’t think [the PCA is] rocket science—it’s just a tool to deliver analgesics conveniently,” Gordon says. “I think every hospitalist should learn how to use the PCA, but there are always nuances of how to titrate opioids by any route.” UW has implemented PCA protocols, which staff can use for ballpark dosing recommendations.
How Hospitalists Use the PCA
The PCA delivers pain medication intravenously via a computerized pump with a button the patient can press when needed—without waiting for busy nurses to answer a call button and then confirm, prepare, and administer an analgesic treatment.
Hospitalists at UW, including Rob Hoffman, MD, often order the PCA. “It’s very well-liked by patients, who are not dependent on a busy nurse to get their analgesics administered,” Dr. Hoffman says. “The biggest concern, involving overdosing patients who are opioid-naïve, may be somewhat overblown. I haven’t experienced problems with my patients being over narcotized, but I start with a low dose and monitor them frequently.”
PCA technology can tabulate how much analgesic the patient has received during the previous 24 hours, Dr. Hoffman notes. “You know that’s a safe dose for the patient, and you can use it to make the transition to oral medications,” he says.
“Most of the patients I have on PCAs are palliative care patients,” says Rachelle Bernacki, MD, MS, a hospitalist, palliative care physician, and geriatrician at the University of California-San Francisco Medical Center. “I use it somewhat differently for the patients in my hospitalist practice—for example, for those who are experiencing intermittent, unpredictable episodes of abdominal pain. It’s also useful for patients with a need to feel in control of their situation. For constant, predictable pain, it’s better to use an around-the-clock schedule. I also send certain patients home on PCAs, especially if they are going to hospice care.”
Dr. Bernacki notes that some of her patients kiss the PCA button as if it were a long-lost friend, including one she recalls who had a bowel obstruction and had not found relief prior to starting on the PCA. But she also recalls a patient for whom the PCA was not a solution. “He was Cantonese-speaking,” she says. “Despite the presence of an interpreter and several attempts at education, he was never able to understand the connection between the PCA button and relief for his pain. We just couldn’t cross the cultural and language barriers.”
Hospitalists probably underuse the PCA, says Mahmood Shahlapour, MD, hospitalist and palliative care consultant at Chandler Regional Hospital in Chandler, Ariz. “Some hospitalists may feel uncomfortable with it,” he says. “I think it’s important for hospitalists to try to get more experience and comfort to be able to use it for the right patient and the right setting.”
What Is the PCA?
PCA technology as we know it today was pioneered in the early 1970s. Now it’s routine for post-surgical pain management. It is used for patients who have trouble taking oral medications or who need rapid response to acute pain crises. Increasingly, it is also used for patients with moderate to severe chronic pain related to cancer or who are being followed by hospice or palliative care services.
PCA refers both to the process of patient self-administration of parenteral analgesics and to the computerized infusion pump that makes this control possible. Recent advances in pain management also include patient-controlled epidural and transdermal analgesia systems—and other new pain modalities continue to be developed.3 Patients unable to operate the equipment themselves—for example, neonates or infants—may receive nurse-controlled analgesia, but experts say this should only be done within carefully defined parameters.
With the more typical intravenous PCA, the computerized pump allows for a number of variables, including:
- An initial bolus or loading dose to bring the pain under immediate control—an important but sometimes overlooked consideration in the successful use of PCAs;
- The patient-initiated or demand dose, available to the patient at the press of a button;
- The delay interval or lockout, typically between six and 15 minutes, allowing the analgesic to achieve its peak effect before another dose can be administered. The number of unsuccessful demands by patients during lockout periods is important for the physician to know;
- A continuous infusion or basal rate to provide continuous pain relief, although this may be contraindicated for opioid-naïve patients starting on PCAs.4 For those receiving opioids for chronic pain, the basal rate could be their current analgesic dose converted to the intravenous equivalent. Alternatively, the patient could receive this dose in a long-acting oral analgesic, with the PCA used for incidental or breakthrough pain. A basal rate also helps patients sleep, their pain controlled without having to wake up to press for a dose;
- A maximum volume of drug to be administered within a defined period of one, four, eight, or 24 hours, calculated to prevent an opioid overdose—regardless of how many times the PCA button gets pushed; and
- Monitoring devices such as pulse oximeter or end-tidal carbon dioxide monitor may be part of the PCA system to help warn of emerging respiratory depression.
The fundamental challenge for physicians lies in balancing the loading, basal, and patient-initiated doses with an appropriate maximum to make sure the patient gets adequate pain relief but doesn’t overdose. This is a more complex, multifaceted mathematical formula than ordering opioids to be administered two, three, or four times a day.
A basic safeguard of the PCA for preventing overdose is that when the opioid analgesic starts to make the patient drowsy, he or she is likely to stop pressing the button for another dose. However, for this to work, the PCA must be patient-controlled. If a nurse or family member pushes the button on the patient’s behalf out of a well-meaning desire to keep pain in check, this raises the risk of overdose.
In the past few years, several national quality and safety organizations have issued alerts about the danger of such patient-controlled analgesia by proxy. The Institute for Safe Medication Practices (ISMP) in Huntington Valley, Pa., issued two safety alerts in July 2003 discussing how potentially life-threatening errors can occur with PCAs and offering ways to prevent such errors.
U.S. Pharmacopeia’s summer 2004 USP Quality Review also offered safety recommendations based on analysis of medical errors directly resulting from PCA by proxy. The Joint Commission issued a Sentinel Alert on Dec. 20, 2004, noting that “serious adverse effects can occur when family members, caregivers or clinicians who are not authorized become involved in administering the analgesic for the patient by proxy.”5 Earlier this year the American Society for Pain Management Nursing issued clinical practice recommendations for how nurses can deal with the problem of PCA by proxy.6
Well-designed hospital PCA protocols will address this problem by including clear instructions to family members not to push the button for the patient, with an explanation of why this can be dangerous. Printed brochures and signs in the patient’s room are also helpful.
The Need for Training
“Physicians, as a rule, don’t receive adequate training in the PCA,” says Jean Youngwerth, MD, hospitalist, palliative care consultant and fellowship associate director at the University of Colorado Health Sciences Center in Denver. “Then you’re expected to know how to use it. There clearly is a need for this kind of training in the basics of the PCA, but a brief in-service should be sufficient.”
Dan Johnson, MD, regional department chief for palliative care for Kaiser-Permanente in Colorado, says the level of experience with the PCA is highly variable among physicians he works with. “Some know how to use the PCA and actually do it quite well. Many others are not adequately trained,” he says. “When I test residents with a few questions, they customarily do very poorly. Some of the answers I see make me nervous.”
Dr. Johnson offers a refresher on the PCA for hospitalists in the Denver area who attend an annual palliative care retreat. Those who come regularly seem to retain the information he offers. “If I were in a hospital that had not rolled out PCA standing orders, I’d make sure that there were educational units provided for hospitalists,” he says. “I’d also investigate how to develop standing orders for the hospital.” TH
Larry Beresford is a frequent contributor to The Hospitalist.
References
- Hudcova J, McNicol E, Quah C, et al. Patient controlled opioid analgesia versus conventional opioid analgesia for postoperative pain. Cochrane Database Syst Rev. 2006;4.
- Ballantyne JC, Carr DB, Chalmers TC. Postoperative patient-controlled analgesia: Meta-analyses of initial randomized controlled trials. J Clin Anesth. 1993 May/June;5(3):182-193.
- D’Arcy Y. New pain management options: Delivery systems and techniques. Nursing. 2007 February; 37(2):26-27.
- Pasero C, McCaffery M. Safe use of a continuous infusion with IV PCA. J PeriAnesthesia Nursing. 2004 Feb;19(1):42-45.
- Joint Commission. Patient-controlled analgesia by proxy. Available at www.jointcommission.org/SentinelEvents/SentinelEventAlert/sea_33.htm. Last accessed July 12, 2007.
- Wuhrman E, Cooney MF, Dunwoody CJ, et al. Authorized and unauthorized (“PCA by Proxy”) dosing of analgesic infusion pumps: Position statement with clinical practice recommendations. Pain Manag Nurs. 2007 Mar;8(1):4-11.
- Prommer E. Fast Fact and Concept #92, Patient controlled analgesia in palliative care. End-of-Life/ Palliative Education Resource Center, Medical College of Wisconsin, Milwaukee:www.eperc.mcw.edu/ff_index.htm.
- Owen H, Plummer JL, Armstrong I, et al. Variables of patient-controlled analgesia. 1. Bolus size. Anaesthesia.1989 Jan.;44(1):7-10.
- Vicente KJ, Kada-Bekhaled K, Hillel G, et al. Programming errors contribute to death from patient-controlled analgesia. Can J Anesth. 2003;50:328-332.