User login
Endometriosis: Expert Answers to 7 Crucial Questions on Diagnosis
IN THIS ARTICLE
• The “why” of endometriosis
• Environmental factors, estrogen, and endometriosis
• Is imaging useful?
• When is diagnostic laparoscopy clearly indicated?
CASE M.L. is a 32-year-old nulliparous woman who is referred to your office by her primary care provider for chronic pelvic pain. She reports severe dysmenorrhea as her main symptom, but she also mentions dyspareunia. She says these symptoms have been present for several years but have increased in intensity gradually. She asks what you consider to be the most likely diagnosis.
What potential diagnoses do you mention to her? And how do you identify the cause of her pain?
Although endometriosis—the presence of endometrial tissue outside the uterus—affects at least 5 million women of reproductive age in the United States alone, it can be a challenging diagnosis for several reasons.
“Endometriosis is a great masquerader,” says Linda Giudice, MD, PhD. “It presents with a variety of pain patterns, intensities, and triggers. It can also involve symptoms that overlap those of other disorders, including disorders of the gastrointestinal and urinary tracts.”
Although endometriosis falls within the differential diagnosis of chronic pelvic pain, “it is usually not high on the list in the primary care setting (adult and adolescent),” adds Dr. Giudice.
John R. Lue, MD, MPH, an author of the most recent practice bulletin on endometriosis from the American College of Obstetricians and Gynecologists,1 sees the situation similarly.
“The main challenge in the diagnosis of endometriosis is that its presentation mimics other causes of chronic pelvic pain,” he says. “Pelvic pain due to endometriosis is usually chronic (lasting ≥ 6 months). It is associated with dysmenorrhea in 50% to 90% of cases, as well as with dyspareunia, deep pelvic pain, and lower abdominal pain with or without back and loin pain. The pain can occur unpredictably and intermittently throughout the menstrual cycle or it can be continuous. In addition, it can be dull, throbbing, or sharp and may be exacerbated by physical activity.2,3 Up to 20% of women with endometriosis have concurrent pain conditions.”4
Among other diseases of the female pelvis that have a relatively similar presentation, Dr. Lue adds, are pathologies of the
• Uterus (adenomyosis, fibroids)
• Fallopian tube (hydrosalpinx)
• Ovaries (ovarian cysts)
• Bladder (interstitial cystitis)
• Bowel (irritable bowel syndrome)
• Musculoskeletal system (piriformis syndrome).
Before pelvic pain is attributed to endometriosis, he says, the provider should rule out bowel, bladder, musculoskeletal, and psychiatric causes.
This article focuses on seven questions, the answers to which are critical to narrowing in on the diagnosis of endometriosis, including essential factors to consider in the patient history, imaging and other diagnostic tools, and considerations in surgical exploration.

1. WHY SUCH A LONG DELAY IN DIAGNOSIS?
Investigators exploring the length of time from a patient’s presentation with symptoms to diagnosis have found it to be particularly long for endometriosis, ranging from six to 11 years.
Because endometriosis is usually not high on the list of differential diagnoses for chronic pelvic pain in the primary care setting, a patient may not be referred to a gynecologist unless those symptoms include severe dysmenorrhea, dyspareunia, or similar findings. Once the referral is made, the gynecologist “will usually try contraceptive steroids, NSAIDs, or second-line progestins before a diagnosis is made,” says Dr. Giudice.5
The delay in diagnosis “is astounding,” she adds, “and has its roots in empiric medical therapies and a combination of patients fearing a diagnosis of cancer and reluctance of gynecologists to perform laparoscopy on adolescents.”6 Another possible cause of diagnostic delay: Some adolescent girls may not realize when their pain is severe. Because they may have always experienced a high degree of pain since menarche, they may assume it to be a normal aspect of womanhood and delay seeking help, says Pamela Stratton, MD.
Continue to learn any biomarkers proved to be useful diagnostic tools >>
2. HAVE ANY BIOMARKERS PROVED TO BE USEFUL DIAGNOSTIC TOOLS?
Any biomarker proven to reliably identify endometriosis would be a boon to medicine, as it would provide a noninvasive or minimally invasive alternative to diagnostic laparoscopy, the current gold standard. Regrettably, the search for such a biomarker has produced “disappointing results,” says Dr. Giudice.
“Recent systematic reviews of all proposed endometriosis-related biomarkers over the past 25 years in serum, plasma, urine, and endometrium could not identify an unequivocally clinically useful biomarker or panel of biomarkers,” she notes.7,8 “This is due mainly to low numbers of subjects, small populations for validations, cycle/hormonal- and disease stage–dependence, poorly defined controls, and low sensitivity and specificity.”
One hopeful development: “Whole genome transcriptomics of archived endometrial tissue and machine learning found several classifiers to diagnose and stage endometriosis with high accuracy that were validated on an independent sample set,” says Dr. Giudice.9 “However, these data now warrant a prospective, multisite study for further validation.”
Continue for key aspects of patient history >>
3. WHAT ASPECTS OF THE PATIENT HISTORY ARE KEY?
Dr. Stratton recommends that clinicians begin their evaluation of the patient with pain by asking her to describe that pain: how long she has had it, when it occurs, and which areas are affected.
“Most women with endometriosis-associated pain have chronic pelvic pain,” Dr. Stratton continues.5 “Up to 90% of those have dysmenorrhea or cyclic pain with menses.”10 In addition, women with endometriosis “commonly report having pain with any bleeding or spotting. About 30% of women diagnosed with endometriosis initially present to their gynecologist with dyspareunia.”11
“Episodic pain with menses may become more constant, lasting for many days of the month,” says Dr. Stratton. “Women with dyschezia or dysuria may have endometriosis lesions associated with the bowel or bladder, respectively.12 When women with these symptoms do not have lesions on the bowel or bladder, these pain symptoms may occur because of higher peritoneal hormone and inflammatory factor levels or because adjacent organs share the neural networks.”
Dr. Giudice views the history similarly: “I believe listening to the patient is essential in evaluating the possibility of her having endometriosis. This involves asking her to describe where her pain is, grading it on a scale of 1 to 10, identifying when in her cycle it occurs, and learning what makes it better or worse.”
“It also is important to assess the quality of the pain,” she adds. “Does it radiate, does it limit her daily activities, does it interfere with her relationships, intercourse, work, school? Is it associated with bowel movements, urination, other pain syndromes?”
“Having a pain questionnaire is a great help so that patients have a chance to reflect on these and other questions that help to frame the pain associated with endometriosis when they come for consultation,” she adds.
By determining if pain is associated with menstruation or spotting, the clinician is better informed about the value of menstrual suppression, says Dr. Stratton. “Determining what makes the pain better or worse can help define triggers which, if treated, can decrease the likelihood of episodes of pain.”
“A detailed history of any medical or surgical treatments and their outcome is helpful in guiding future treatment,” she adds. “While hormonal therapy has been a mainstay of treatment, in some women, some hormonal treatments may worsen pain or have unacceptable adverse effects, such as worsening depression or anxiety. In addition, some pain—especially that associated with deep lesions—may be relieved by surgical treatment;13,14 pain that worsened after surgery may suggest neural damage.”
“As there is an engagement of the central nervous system, endometriosis is considered a central sensitivity syndrome in which women may also have other sites of pain,” Dr. Stratton says. “Thus, obtaining a history about current symptoms or prior diagnosis of irritable bowel syndrome, interstitial cystitis/painful bladder, migraines, fibromyalgia, or chronic fatigue syndrome is beneficial.10,15-17 Facilitating treatment for these comorbidities is a key principle in helping women with endometriosis-associated pain, as any condition that triggers or perpetuates pain warrants treatment.”
Continue for what the physical exam entails >>
4. WHAT SHOULD THE PHYSICAL EXAM ENTAIL?
“An abdominal exam and a pelvic exam are essential in evaluating pain in a woman when endometriosis is suspected,” says Dr. Giudice. “Sometimes the latter is challenging in young teens and can be deferred.” Overall, however, “the pelvic exam can give insight into pain triggers, adnexal masses (possible endometriomas), and mobility of pelvic organs. A rectovaginal exam is important in evaluating deep infiltrating disease and to gauge the pelvic pain landscape overall. In addition, palpating the pelvic floor musculature is important to distinguish pelvic floor muscle spasm from endometriosis pain.”
“The challenge for clinicians is to think beyond the endometrial implants, taking into account multiple factors that influence pain perception,” says Dr. Stratton. During the examination, the clinician should begin by mapping the regions of pain in the abdomen and back, “distinguishing musculoskeletal pain from deep pain. Determining whether pains are focused or diffuse is also important.”
Dr. Stratton recommends that the routine pelvic exam be modified because a standard bimanual exam “confuses pain signals from the pelvic floor, abdominal wall, bladder, and other viscera. For this reason, a pain-oriented assessment is mandatory.”
Begin with a single digital examination to map tender areas, Dr. Stratton advises. Then consider the size, shape, and mobility of reproductive and pelvic organs. “A bimanual exam will help identify adnexal masses like endometriomas,” she says.
Endometriomas usually are not associated with pain, she adds, but “they are associated with deep infiltrating lesions. Nodularity along the uterosacral ligaments, limited reproductive organ mobility, and thickening of the rectovaginal septum also suggest deep infiltrating lesions. Importantly, deep infiltrating lesions are the lesion type most associated with pain.”18,19

Continue to learn if imaging is useful in the diagnosis of endometriosis >>
5. IS IMAGING USEFUL IN THE DIAGNOSIS OF ENDOMETRIOSIS?
Laparoscopy remains the gold standard for diagnosis of endometriosis, observes Steven R. Goldstein, MD. Visualization of endometriotic implants at the time of surgery—with histologic assessment—offers definitive confirmation of the diagnosis. The physical examination, too, can offer a strong suggestion of endometriosis, he says.
“In the past, the pelvic examination and history often were the sine qua non for patients with pain,” Dr. Goldstein says. “Extreme dysmenorrhea and pain between periods, especially with intercourse, defecation, and exercise, all increased the suspicion of endometriosis. People used to talk about feeling nodularity in the uterosacral ligaments and finding decreased mobility of pelvic structures—but I don’t have any question that the skill of today’s gynecologists in doing a bimanual pelvic exam is a fraction of what it was in years gone by, because they haven’t had the necessity of experience. The first thing they do if there’s any question is send the patient for an ultrasound.”
Of course, ultrasound can be especially helpful in identifying endometriomas—sometimes called chocolate cysts—in the ovary. Endometriomas can have a solid appearance on ultrasound, says Dr. Goldstein, because the fluid they contain (dried blood) is sonolucent or pure black on ultrasound, similar to amniotic fluid or the fluid seen in the bladder. “This ‘chocolate’ fluid contained in endometriomas is homogeneous, particulate, and very monotonous in its appearance, in contrast to the internal echoes observed in hemorrhagic corpus lutea, which are very cobweb-like and can sometimes mimic papillary projections,” he adds.
“What’s absolutely essential when imaging a suspected endometrioma by ultrasound is that there be no evidence of any blood flow contained within that structure. Because it’s dried blood, it shouldn’t have any vascularity. If you see blood flow inside what you would call an endometrioma, you need to rethink your diagnosis,” he says.
In some cases, a supposed endometrioma lacks a black, sonolucent appearance, but “the clinician often can tell that it’s a cystic structure by the very bright posterior wall—what we call posterior wall acoustic enhancement—even though the interior of the structure may appear sort of grayish or whitish rather than the pure black of a simple cyst. It’s still fluid-filled,” Dr. Goldstein says.
In some instances, even endometriotic nodules can be imaged by ultrasound, he adds. “There’s an increasing body of literature that suggests that, if you look carefully in people with deep infiltrating endometriosis, you can often see solid-appearing nodules in the rectovaginal septum or between the uterus and bladder. With the kind of resolution that we now have with the vaginal probe, some of these nodules can be seen. That’s somewhat new, and it’s a function of two things—people looking for endometriosis and the better resolution of more modern equipment.”
Dr. Goldstein believes that MRI is “almost never” indicated in the diagnosis of endometriosis. A more helpful approach would be a consultative ultrasound with someone with more experience. However, when that is not available, or “in areas where you have excellent backup in terms of pelvic MRI, that may be the way to go. I don’t think so,” he demurs, “and some of my colleagues would be very upset at the thought of needing to use MRI to diagnose endometriosis. But in the occasional confusing or difficult case, depending on the quality of the referral pattern you have, it might make sense."
Continue to learn when diagnostic laparoscopy is clearly indicated >>
6. WHEN IS DIAGNOSTIC LAPAROSCOPY CLEARLY INDICATED?
Dr. Giudice believes that laparoscopy—with the intention to treat endometriosis, if present—“is essential when firstline medical therapy fails or when pain is acute and severe.”5
Dr. Stratton concurs. “Any woman with chronic pain wants to know what is causing the pain,” she says. Therefore, “women report a benefit from knowing that their pain is associated with endometriosis.6 However, diagnostic laparoscopy alone, with the sole purpose of determining the presence of endometriosis but not treating the lesions, is no longer performed, as it poses little benefit to the patient other than peace of mind.”
“The general trend in the US has been to first use hormonal treatments when the diagnosis of endometriosis is suspected, prior to performing surgery,” Dr. Stratton says.1 In many cases, by using cyclic combined hormonal contraceptives to reduce menstrual flow or “suppressing menstruation with continuous combined hormonal contraceptives,” gonadotropin-releasing hormone analogues (combined with progestin to prevent bone loss) “or continuous progestin alone may be effective in decreasing pain. Not surprisingly, these hormonal approaches are effective for any chronic pelvic pain, even for women who do not have the surgical diagnosis of endometriosis.”20
“When the firstline approach to chronic pelvic pain is hormonal treatment, laparoscopy is considered when these medical treatments have failed to control the pain or are poorly tolerated, or when the diagnosis of endometriosis is in question,” Dr. Stratton says.
“Laparoscopy to treat endometriomas is indicated if an endometrioma is enlarging or measures more than 4 cm in diameter, or if the diagnosis of an ovarian mass is in question,” she explains. “While surgeons have previously been aggressive in removing endometriomas, this practice may have negative consequences on ovarian function. Because endometriomas are pseudocysts, removing them completely leads to the removal of viable ovarian tissue and may diminish ovarian reserve.”21,22
Continue for the surgical appearance of endometriosis >>
7. WHAT IS THE SURGICAL APPEARANCE OF ENDOMETRIOSIS?
Dr. Giudice returns to the enigmatic nature of endometriosis in addressing this question, mentioning its “many faces” at the time of surgery. “It is imperative that the surgeon recognize the disease in its many forms,” she says. “Also, it is especially helpful at the time of surgery if suspected lesions are biopsied and sent to pathology to have the diagnosis made unequivocally.”5
As for the surgical appearance of endometriosis, Dr. Stratton notes that there are three types of lesions—“superficial lesions, deep infiltrating lesions, and endometriomas. Endometriomas occur almost exclusively in the ovary and are pseudocysts without an identifiable cystic lining. They vary in dimension from a few millimeters to several centimeters.”
“Superficial peritoneal endometriosis lesions have a variable appearance, with some lesions being clear or red; some brown, blue or black; and some having a white appearance, like a scar,” says Dr. Stratton. “Endometriosis can be diagnosed on histologic examination of any of these lesion types."
“Overall, single-color lesions have similar frequencies of biopsy-confirmed endometriosis (59% to 62%),” she says.23 “These lesion appearances likely represent different stages of development of endometriosis, with red or clear lesions occurring first, soon after endometrial tissue implantation; black, blue, or brown lesions occurring later, in response to the hormones varying in the menstrual cycle; and white lesions occurring as the lesions age. Deep infiltrating lesions generally have blue/black or white features.”
“Wide, deep, multiple-color lesions in the cul-de-sac, ovarian fossa, or uterosacral ligaments are most likely endometriosis,” Dr. Stratton adds.23 Only lesions with multiple colors have a significantly higher percentage of positive biopsies (76%). Importantly, more than half of women with only subtle lesions (small red or white lesions) have endometriosis.
You tell the patient that endometriosis is one of the possible diagnoses for her chronic pelvic pain, and you take a focused history. During a pelvic examination, you observe that her right ovary lacks mobility, and you map a number of trigger points for her pain. Transvaginal ultrasound results suggest the presence of nodules in the rectovaginal septum. You begin empiric treatment with continuous combined hormonal contraceptives to suppress menstruation. On her next visit, M.L. reports reduced but still bothersome pain. Laparoscopy reveals a 2-cm endometrioma in the right ovary and deep infiltrating lesions in the cul-de-sac. The endometrioma is resected. Histology confirms the diagnosis of endometriosis.
REFERENCES
1. American College of Obstetricians and Gynecologists. Practice Bulletin #114: Management of endometriosis. Obstet Gynecol. 2010; 116(1):223-236.
2. Sanfilippo JS, Wakim NG, Schikler KN, Yussman MA. Endometriosis in association with uterine anomaly. Am J Obstet Gynecol. 1986; 154(1):39-43.
3. Taylor HS, Bagot C, Kardana A. HOX gene expression is altered in the endometrium of women with endometriosis. Hum Reprod. 1999; 14(5):1328-1331.
4. Berkley KJ, Stratton P. Mechanisms: lessons from translational studies of endometriosis. In: Giamberardino MA, ed. Visceral Pain: Clinical, Pathophysiological and Therapeutic Aspects. Oxford, UK: Oxford University Press; 2009:39-50.
5. Giudice LC. Clinical practice: endometriosis. N Engl J Med. 2010;362(25): 2389-2398.
6. Ballard K, Lowton K, Wright J. What’s the delay: a qualitative study of women’s experiences of reaching a diagnosis of endometriosis. Fertil Steril. 2006;86(5):1296-1301.
7. May KE, Conduit-Hulbert SA, Villar J, et al. Peripheral biomarkers of endometriosis: a systematic review. Hum Reprod Update. 2010; 16(6):651-674.
8. May KE, Villar J, Kirtley S, et al. Endometrial alterations in endometriosis: a systematic review of putative biomarkers. Hum Reprod Update. 2011; 17(5):637-653.
9. Tamaresis JS, Irwin JC, Goldfien GA, et al. Molecular classification of endometriosis and disease stage using high-dimensional genomic data. Endocrinology. 2014;155(12):4986-4999.
10. Sinaii N, Cleary SD, Ballweg ML, et al. High rates of autoimmune and endocrine disorders, fibromyalgia, chronic fatigue syndrome and atopic diseases among women with endometriosis: a survey analysis. Hum Reprod. 2002;17(10):2715-2724.
11. De Graaff AA, D’Hooghe TM, Dunselman GA, et al. The significant effect of endometriosis on physical, mental and social wellbeing: results from an international cross-sectional survey. Hum Reprod. 2013;28(10):2677-2685.
12. Lafay Pillet MC, Huchon C, Santulli P, et al. A clinical score can predict associated deep infiltrating endometriosis before surgery for an endometrioma. Hum Reprod. 2014;29(8):1666-1676.
13. Healey M, Cheng C, Kaur H. To excise or ablate endometriosis? A prospective randomized double-blinded trial after 5-year follow-up. J Minim Invasive Gynecol. 2014;21(6):999-1004.
14. Anaf V, El Nakadi I, De Moor V, et al. Increased nerve density in deep infiltrating endometriotic nodules. Gynecol Obstet Invest. 2011;71(2):112-117.
15. Stratton P, Berkley KJ. Chronic pelvic pain and endometriosis: translational evidence of the relationship and implications. Hum Reprod Update. 2011;17(3):327-346.
16. Karp BI, Sinaii N, Nieman LK, et al. Migraine in women with chronic pelvic pain with and without endometriosis. Fertil Steril. 2011;95(3):895-899.
17. Berkley KJ. A life of pelvic pain. Physiol Behav. 2005;86(3):272-280.
18. Fauconnier A, Chapron C. Endometriosis and pelvic pain: epidemiological evidence of the relationship and implications. Hum Reprod Update. 2005;11(6):595-606.
19. Vercellini P, Fedele L, Aimi G, et al. Association between endometriosis stage, lesion type, patient characteristics and severity of pelvic pain symptoms: a multivariate analysis of over 1000 patients. Hum Reprod. 2007;22(1):266-271.
20. Ling FW. Randomized controlled trial of depot leuprolide in patients with chronic pelvic pain and clinically suspected endometriosis. Pelvic Pain Study Group. Obstet Gynecol. 1999;93(1):51-58.
21. Muzii L, Di Tucci C, Di Feliciantonio M, et al. The effect of surgery for endometrioma on ovarian reserve evaluated by antral follicle count: a systematic review and meta-analysis. Hum Reprod. 2014;29(10):2190-2198.
22. Muzii L, Luciano AA, Zupi E, Panici PB. Effect of surgery for endometrioma on ovarian function: a different point of view. J Minim Invasive Gynecol. 2014;21(4):531-533.
23. Stegmann BJ, Sinaii N, Liu S, et al. Using location, color, size, and depth to characterize and identify endometriosis lesions in a cohort of 133 women. Fertil Steril. 2008;89(6):1632-1636.
IN THIS ARTICLE
• The “why” of endometriosis
• Environmental factors, estrogen, and endometriosis
• Is imaging useful?
• When is diagnostic laparoscopy clearly indicated?
CASE M.L. is a 32-year-old nulliparous woman who is referred to your office by her primary care provider for chronic pelvic pain. She reports severe dysmenorrhea as her main symptom, but she also mentions dyspareunia. She says these symptoms have been present for several years but have increased in intensity gradually. She asks what you consider to be the most likely diagnosis.
What potential diagnoses do you mention to her? And how do you identify the cause of her pain?
Although endometriosis—the presence of endometrial tissue outside the uterus—affects at least 5 million women of reproductive age in the United States alone, it can be a challenging diagnosis for several reasons.
“Endometriosis is a great masquerader,” says Linda Giudice, MD, PhD. “It presents with a variety of pain patterns, intensities, and triggers. It can also involve symptoms that overlap those of other disorders, including disorders of the gastrointestinal and urinary tracts.”
Although endometriosis falls within the differential diagnosis of chronic pelvic pain, “it is usually not high on the list in the primary care setting (adult and adolescent),” adds Dr. Giudice.
John R. Lue, MD, MPH, an author of the most recent practice bulletin on endometriosis from the American College of Obstetricians and Gynecologists,1 sees the situation similarly.
“The main challenge in the diagnosis of endometriosis is that its presentation mimics other causes of chronic pelvic pain,” he says. “Pelvic pain due to endometriosis is usually chronic (lasting ≥ 6 months). It is associated with dysmenorrhea in 50% to 90% of cases, as well as with dyspareunia, deep pelvic pain, and lower abdominal pain with or without back and loin pain. The pain can occur unpredictably and intermittently throughout the menstrual cycle or it can be continuous. In addition, it can be dull, throbbing, or sharp and may be exacerbated by physical activity.2,3 Up to 20% of women with endometriosis have concurrent pain conditions.”4
Among other diseases of the female pelvis that have a relatively similar presentation, Dr. Lue adds, are pathologies of the
• Uterus (adenomyosis, fibroids)
• Fallopian tube (hydrosalpinx)
• Ovaries (ovarian cysts)
• Bladder (interstitial cystitis)
• Bowel (irritable bowel syndrome)
• Musculoskeletal system (piriformis syndrome).
Before pelvic pain is attributed to endometriosis, he says, the provider should rule out bowel, bladder, musculoskeletal, and psychiatric causes.
This article focuses on seven questions, the answers to which are critical to narrowing in on the diagnosis of endometriosis, including essential factors to consider in the patient history, imaging and other diagnostic tools, and considerations in surgical exploration.
1. WHY SUCH A LONG DELAY IN DIAGNOSIS?
Investigators exploring the length of time from a patient’s presentation with symptoms to diagnosis have found it to be particularly long for endometriosis, ranging from six to 11 years.
Because endometriosis is usually not high on the list of differential diagnoses for chronic pelvic pain in the primary care setting, a patient may not be referred to a gynecologist unless those symptoms include severe dysmenorrhea, dyspareunia, or similar findings. Once the referral is made, the gynecologist “will usually try contraceptive steroids, NSAIDs, or second-line progestins before a diagnosis is made,” says Dr. Giudice.5
The delay in diagnosis “is astounding,” she adds, “and has its roots in empiric medical therapies and a combination of patients fearing a diagnosis of cancer and reluctance of gynecologists to perform laparoscopy on adolescents.”6 Another possible cause of diagnostic delay: Some adolescent girls may not realize when their pain is severe. Because they may have always experienced a high degree of pain since menarche, they may assume it to be a normal aspect of womanhood and delay seeking help, says Pamela Stratton, MD.
Continue to learn any biomarkers proved to be useful diagnostic tools >>
2. HAVE ANY BIOMARKERS PROVED TO BE USEFUL DIAGNOSTIC TOOLS?
Any biomarker proven to reliably identify endometriosis would be a boon to medicine, as it would provide a noninvasive or minimally invasive alternative to diagnostic laparoscopy, the current gold standard. Regrettably, the search for such a biomarker has produced “disappointing results,” says Dr. Giudice.
“Recent systematic reviews of all proposed endometriosis-related biomarkers over the past 25 years in serum, plasma, urine, and endometrium could not identify an unequivocally clinically useful biomarker or panel of biomarkers,” she notes.7,8 “This is due mainly to low numbers of subjects, small populations for validations, cycle/hormonal- and disease stage–dependence, poorly defined controls, and low sensitivity and specificity.”
One hopeful development: “Whole genome transcriptomics of archived endometrial tissue and machine learning found several classifiers to diagnose and stage endometriosis with high accuracy that were validated on an independent sample set,” says Dr. Giudice.9 “However, these data now warrant a prospective, multisite study for further validation.”
Continue for key aspects of patient history >>
3. WHAT ASPECTS OF THE PATIENT HISTORY ARE KEY?
Dr. Stratton recommends that clinicians begin their evaluation of the patient with pain by asking her to describe that pain: how long she has had it, when it occurs, and which areas are affected.
“Most women with endometriosis-associated pain have chronic pelvic pain,” Dr. Stratton continues.5 “Up to 90% of those have dysmenorrhea or cyclic pain with menses.”10 In addition, women with endometriosis “commonly report having pain with any bleeding or spotting. About 30% of women diagnosed with endometriosis initially present to their gynecologist with dyspareunia.”11
“Episodic pain with menses may become more constant, lasting for many days of the month,” says Dr. Stratton. “Women with dyschezia or dysuria may have endometriosis lesions associated with the bowel or bladder, respectively.12 When women with these symptoms do not have lesions on the bowel or bladder, these pain symptoms may occur because of higher peritoneal hormone and inflammatory factor levels or because adjacent organs share the neural networks.”
Dr. Giudice views the history similarly: “I believe listening to the patient is essential in evaluating the possibility of her having endometriosis. This involves asking her to describe where her pain is, grading it on a scale of 1 to 10, identifying when in her cycle it occurs, and learning what makes it better or worse.”
“It also is important to assess the quality of the pain,” she adds. “Does it radiate, does it limit her daily activities, does it interfere with her relationships, intercourse, work, school? Is it associated with bowel movements, urination, other pain syndromes?”
“Having a pain questionnaire is a great help so that patients have a chance to reflect on these and other questions that help to frame the pain associated with endometriosis when they come for consultation,” she adds.
By determining if pain is associated with menstruation or spotting, the clinician is better informed about the value of menstrual suppression, says Dr. Stratton. “Determining what makes the pain better or worse can help define triggers which, if treated, can decrease the likelihood of episodes of pain.”
“A detailed history of any medical or surgical treatments and their outcome is helpful in guiding future treatment,” she adds. “While hormonal therapy has been a mainstay of treatment, in some women, some hormonal treatments may worsen pain or have unacceptable adverse effects, such as worsening depression or anxiety. In addition, some pain—especially that associated with deep lesions—may be relieved by surgical treatment;13,14 pain that worsened after surgery may suggest neural damage.”
“As there is an engagement of the central nervous system, endometriosis is considered a central sensitivity syndrome in which women may also have other sites of pain,” Dr. Stratton says. “Thus, obtaining a history about current symptoms or prior diagnosis of irritable bowel syndrome, interstitial cystitis/painful bladder, migraines, fibromyalgia, or chronic fatigue syndrome is beneficial.10,15-17 Facilitating treatment for these comorbidities is a key principle in helping women with endometriosis-associated pain, as any condition that triggers or perpetuates pain warrants treatment.”
Continue for what the physical exam entails >>
4. WHAT SHOULD THE PHYSICAL EXAM ENTAIL?
“An abdominal exam and a pelvic exam are essential in evaluating pain in a woman when endometriosis is suspected,” says Dr. Giudice. “Sometimes the latter is challenging in young teens and can be deferred.” Overall, however, “the pelvic exam can give insight into pain triggers, adnexal masses (possible endometriomas), and mobility of pelvic organs. A rectovaginal exam is important in evaluating deep infiltrating disease and to gauge the pelvic pain landscape overall. In addition, palpating the pelvic floor musculature is important to distinguish pelvic floor muscle spasm from endometriosis pain.”
“The challenge for clinicians is to think beyond the endometrial implants, taking into account multiple factors that influence pain perception,” says Dr. Stratton. During the examination, the clinician should begin by mapping the regions of pain in the abdomen and back, “distinguishing musculoskeletal pain from deep pain. Determining whether pains are focused or diffuse is also important.”
Dr. Stratton recommends that the routine pelvic exam be modified because a standard bimanual exam “confuses pain signals from the pelvic floor, abdominal wall, bladder, and other viscera. For this reason, a pain-oriented assessment is mandatory.”
Begin with a single digital examination to map tender areas, Dr. Stratton advises. Then consider the size, shape, and mobility of reproductive and pelvic organs. “A bimanual exam will help identify adnexal masses like endometriomas,” she says.
Endometriomas usually are not associated with pain, she adds, but “they are associated with deep infiltrating lesions. Nodularity along the uterosacral ligaments, limited reproductive organ mobility, and thickening of the rectovaginal septum also suggest deep infiltrating lesions. Importantly, deep infiltrating lesions are the lesion type most associated with pain.”18,19
Continue to learn if imaging is useful in the diagnosis of endometriosis >>
5. IS IMAGING USEFUL IN THE DIAGNOSIS OF ENDOMETRIOSIS?
Laparoscopy remains the gold standard for diagnosis of endometriosis, observes Steven R. Goldstein, MD. Visualization of endometriotic implants at the time of surgery—with histologic assessment—offers definitive confirmation of the diagnosis. The physical examination, too, can offer a strong suggestion of endometriosis, he says.
“In the past, the pelvic examination and history often were the sine qua non for patients with pain,” Dr. Goldstein says. “Extreme dysmenorrhea and pain between periods, especially with intercourse, defecation, and exercise, all increased the suspicion of endometriosis. People used to talk about feeling nodularity in the uterosacral ligaments and finding decreased mobility of pelvic structures—but I don’t have any question that the skill of today’s gynecologists in doing a bimanual pelvic exam is a fraction of what it was in years gone by, because they haven’t had the necessity of experience. The first thing they do if there’s any question is send the patient for an ultrasound.”
Of course, ultrasound can be especially helpful in identifying endometriomas—sometimes called chocolate cysts—in the ovary. Endometriomas can have a solid appearance on ultrasound, says Dr. Goldstein, because the fluid they contain (dried blood) is sonolucent or pure black on ultrasound, similar to amniotic fluid or the fluid seen in the bladder. “This ‘chocolate’ fluid contained in endometriomas is homogeneous, particulate, and very monotonous in its appearance, in contrast to the internal echoes observed in hemorrhagic corpus lutea, which are very cobweb-like and can sometimes mimic papillary projections,” he adds.
“What’s absolutely essential when imaging a suspected endometrioma by ultrasound is that there be no evidence of any blood flow contained within that structure. Because it’s dried blood, it shouldn’t have any vascularity. If you see blood flow inside what you would call an endometrioma, you need to rethink your diagnosis,” he says.
In some cases, a supposed endometrioma lacks a black, sonolucent appearance, but “the clinician often can tell that it’s a cystic structure by the very bright posterior wall—what we call posterior wall acoustic enhancement—even though the interior of the structure may appear sort of grayish or whitish rather than the pure black of a simple cyst. It’s still fluid-filled,” Dr. Goldstein says.
In some instances, even endometriotic nodules can be imaged by ultrasound, he adds. “There’s an increasing body of literature that suggests that, if you look carefully in people with deep infiltrating endometriosis, you can often see solid-appearing nodules in the rectovaginal septum or between the uterus and bladder. With the kind of resolution that we now have with the vaginal probe, some of these nodules can be seen. That’s somewhat new, and it’s a function of two things—people looking for endometriosis and the better resolution of more modern equipment.”
Dr. Goldstein believes that MRI is “almost never” indicated in the diagnosis of endometriosis. A more helpful approach would be a consultative ultrasound with someone with more experience. However, when that is not available, or “in areas where you have excellent backup in terms of pelvic MRI, that may be the way to go. I don’t think so,” he demurs, “and some of my colleagues would be very upset at the thought of needing to use MRI to diagnose endometriosis. But in the occasional confusing or difficult case, depending on the quality of the referral pattern you have, it might make sense."
Continue to learn when diagnostic laparoscopy is clearly indicated >>
6. WHEN IS DIAGNOSTIC LAPAROSCOPY CLEARLY INDICATED?
Dr. Giudice believes that laparoscopy—with the intention to treat endometriosis, if present—“is essential when firstline medical therapy fails or when pain is acute and severe.”5
Dr. Stratton concurs. “Any woman with chronic pain wants to know what is causing the pain,” she says. Therefore, “women report a benefit from knowing that their pain is associated with endometriosis.6 However, diagnostic laparoscopy alone, with the sole purpose of determining the presence of endometriosis but not treating the lesions, is no longer performed, as it poses little benefit to the patient other than peace of mind.”
“The general trend in the US has been to first use hormonal treatments when the diagnosis of endometriosis is suspected, prior to performing surgery,” Dr. Stratton says.1 In many cases, by using cyclic combined hormonal contraceptives to reduce menstrual flow or “suppressing menstruation with continuous combined hormonal contraceptives,” gonadotropin-releasing hormone analogues (combined with progestin to prevent bone loss) “or continuous progestin alone may be effective in decreasing pain. Not surprisingly, these hormonal approaches are effective for any chronic pelvic pain, even for women who do not have the surgical diagnosis of endometriosis.”20
“When the firstline approach to chronic pelvic pain is hormonal treatment, laparoscopy is considered when these medical treatments have failed to control the pain or are poorly tolerated, or when the diagnosis of endometriosis is in question,” Dr. Stratton says.
“Laparoscopy to treat endometriomas is indicated if an endometrioma is enlarging or measures more than 4 cm in diameter, or if the diagnosis of an ovarian mass is in question,” she explains. “While surgeons have previously been aggressive in removing endometriomas, this practice may have negative consequences on ovarian function. Because endometriomas are pseudocysts, removing them completely leads to the removal of viable ovarian tissue and may diminish ovarian reserve.”21,22
Continue for the surgical appearance of endometriosis >>
7. WHAT IS THE SURGICAL APPEARANCE OF ENDOMETRIOSIS?
Dr. Giudice returns to the enigmatic nature of endometriosis in addressing this question, mentioning its “many faces” at the time of surgery. “It is imperative that the surgeon recognize the disease in its many forms,” she says. “Also, it is especially helpful at the time of surgery if suspected lesions are biopsied and sent to pathology to have the diagnosis made unequivocally.”5
As for the surgical appearance of endometriosis, Dr. Stratton notes that there are three types of lesions—“superficial lesions, deep infiltrating lesions, and endometriomas. Endometriomas occur almost exclusively in the ovary and are pseudocysts without an identifiable cystic lining. They vary in dimension from a few millimeters to several centimeters.”
“Superficial peritoneal endometriosis lesions have a variable appearance, with some lesions being clear or red; some brown, blue or black; and some having a white appearance, like a scar,” says Dr. Stratton. “Endometriosis can be diagnosed on histologic examination of any of these lesion types."
“Overall, single-color lesions have similar frequencies of biopsy-confirmed endometriosis (59% to 62%),” she says.23 “These lesion appearances likely represent different stages of development of endometriosis, with red or clear lesions occurring first, soon after endometrial tissue implantation; black, blue, or brown lesions occurring later, in response to the hormones varying in the menstrual cycle; and white lesions occurring as the lesions age. Deep infiltrating lesions generally have blue/black or white features.”
“Wide, deep, multiple-color lesions in the cul-de-sac, ovarian fossa, or uterosacral ligaments are most likely endometriosis,” Dr. Stratton adds.23 Only lesions with multiple colors have a significantly higher percentage of positive biopsies (76%). Importantly, more than half of women with only subtle lesions (small red or white lesions) have endometriosis.
You tell the patient that endometriosis is one of the possible diagnoses for her chronic pelvic pain, and you take a focused history. During a pelvic examination, you observe that her right ovary lacks mobility, and you map a number of trigger points for her pain. Transvaginal ultrasound results suggest the presence of nodules in the rectovaginal septum. You begin empiric treatment with continuous combined hormonal contraceptives to suppress menstruation. On her next visit, M.L. reports reduced but still bothersome pain. Laparoscopy reveals a 2-cm endometrioma in the right ovary and deep infiltrating lesions in the cul-de-sac. The endometrioma is resected. Histology confirms the diagnosis of endometriosis.
REFERENCES
1. American College of Obstetricians and Gynecologists. Practice Bulletin #114: Management of endometriosis. Obstet Gynecol. 2010; 116(1):223-236.
2. Sanfilippo JS, Wakim NG, Schikler KN, Yussman MA. Endometriosis in association with uterine anomaly. Am J Obstet Gynecol. 1986; 154(1):39-43.
3. Taylor HS, Bagot C, Kardana A. HOX gene expression is altered in the endometrium of women with endometriosis. Hum Reprod. 1999; 14(5):1328-1331.
4. Berkley KJ, Stratton P. Mechanisms: lessons from translational studies of endometriosis. In: Giamberardino MA, ed. Visceral Pain: Clinical, Pathophysiological and Therapeutic Aspects. Oxford, UK: Oxford University Press; 2009:39-50.
5. Giudice LC. Clinical practice: endometriosis. N Engl J Med. 2010;362(25): 2389-2398.
6. Ballard K, Lowton K, Wright J. What’s the delay: a qualitative study of women’s experiences of reaching a diagnosis of endometriosis. Fertil Steril. 2006;86(5):1296-1301.
7. May KE, Conduit-Hulbert SA, Villar J, et al. Peripheral biomarkers of endometriosis: a systematic review. Hum Reprod Update. 2010; 16(6):651-674.
8. May KE, Villar J, Kirtley S, et al. Endometrial alterations in endometriosis: a systematic review of putative biomarkers. Hum Reprod Update. 2011; 17(5):637-653.
9. Tamaresis JS, Irwin JC, Goldfien GA, et al. Molecular classification of endometriosis and disease stage using high-dimensional genomic data. Endocrinology. 2014;155(12):4986-4999.
10. Sinaii N, Cleary SD, Ballweg ML, et al. High rates of autoimmune and endocrine disorders, fibromyalgia, chronic fatigue syndrome and atopic diseases among women with endometriosis: a survey analysis. Hum Reprod. 2002;17(10):2715-2724.
11. De Graaff AA, D’Hooghe TM, Dunselman GA, et al. The significant effect of endometriosis on physical, mental and social wellbeing: results from an international cross-sectional survey. Hum Reprod. 2013;28(10):2677-2685.
12. Lafay Pillet MC, Huchon C, Santulli P, et al. A clinical score can predict associated deep infiltrating endometriosis before surgery for an endometrioma. Hum Reprod. 2014;29(8):1666-1676.
13. Healey M, Cheng C, Kaur H. To excise or ablate endometriosis? A prospective randomized double-blinded trial after 5-year follow-up. J Minim Invasive Gynecol. 2014;21(6):999-1004.
14. Anaf V, El Nakadi I, De Moor V, et al. Increased nerve density in deep infiltrating endometriotic nodules. Gynecol Obstet Invest. 2011;71(2):112-117.
15. Stratton P, Berkley KJ. Chronic pelvic pain and endometriosis: translational evidence of the relationship and implications. Hum Reprod Update. 2011;17(3):327-346.
16. Karp BI, Sinaii N, Nieman LK, et al. Migraine in women with chronic pelvic pain with and without endometriosis. Fertil Steril. 2011;95(3):895-899.
17. Berkley KJ. A life of pelvic pain. Physiol Behav. 2005;86(3):272-280.
18. Fauconnier A, Chapron C. Endometriosis and pelvic pain: epidemiological evidence of the relationship and implications. Hum Reprod Update. 2005;11(6):595-606.
19. Vercellini P, Fedele L, Aimi G, et al. Association between endometriosis stage, lesion type, patient characteristics and severity of pelvic pain symptoms: a multivariate analysis of over 1000 patients. Hum Reprod. 2007;22(1):266-271.
20. Ling FW. Randomized controlled trial of depot leuprolide in patients with chronic pelvic pain and clinically suspected endometriosis. Pelvic Pain Study Group. Obstet Gynecol. 1999;93(1):51-58.
21. Muzii L, Di Tucci C, Di Feliciantonio M, et al. The effect of surgery for endometrioma on ovarian reserve evaluated by antral follicle count: a systematic review and meta-analysis. Hum Reprod. 2014;29(10):2190-2198.
22. Muzii L, Luciano AA, Zupi E, Panici PB. Effect of surgery for endometrioma on ovarian function: a different point of view. J Minim Invasive Gynecol. 2014;21(4):531-533.
23. Stegmann BJ, Sinaii N, Liu S, et al. Using location, color, size, and depth to characterize and identify endometriosis lesions in a cohort of 133 women. Fertil Steril. 2008;89(6):1632-1636.
Adjuvant Systemic Therapy for Early-Stage Breast Cancer
Over the past 20 years, substantial progress has been achieved in our understanding of breast cancer and in breast cancer treatment, with mortality from breast cancer declining by more than 25% over this time. This progress has been characterized by a greater understanding of the molecular biology of breast cancer, rational drug design, development of agents with specific cellular targets and pathways, development of better prognostic and predictive multigene assays, and marked improvements in supportive care.
To read the full article in PDF:
Nausea and Vomiting in Cancer: It's Not Always the Chemotherapy
Nausea and vomiting is common in cancer patients and a frequent presentation in the ED. When evaluating nausea and vomiting, the clinician should be aware that the two are not always linked—nausea may present without vomiting and vice versa. Nausea is “an unpleasant sensation of the need to vomit and is associated with autonomic symptoms,” whereas vomiting is “the forceful propulsion of abdominal contents via the contraction of the abdominal musculature and diaphragm.”1 Whether these symptoms present together or independently of each other, both can result in serious metabolic disturbances, internal injury, malnutrition, and poor quality of life. In addition, nausea and vomiting can result in patient withdrawal from potentially beneficial treatment.2 Based on the current literature, this article reviews and provides recommendations on appropriate assessment and treatment of the cancer patient presenting to the ED with nausea and/or vomiting.
Epidemiology
In 2007, the US Nationwide Emergency Department Sample database noted 122 million ED visits, 1.6 million of which were due to nausea and vomiting.3 In contrast, a small study from the United Kingdom cited 18% of ED visits in one of its centers were due to nausea and/or vomiting, demonstrating that the percentage of patients presenting with these symptoms can vary greatly.4
The incidence of cancer-related nausea and vomiting in the ED is unknown. Although EDs affiliated with large cancer centers see many cases of cancer-associated nausea and vomiting, presentations to noncancer-center EDs are becoming more prevalent due to increases in community-based cancer care.5 While the number of cancer patients is rising and the general population is aging,6 there is now less incidence of breakthrough chemotherapy-induced nausea and vomiting (CINV), which is a common cause of cancer-related nausea and vomiting. Older studies quote a 40% to 60% rate of breakthrough CINV; however, with the advent of newer antiemetic prophylaxis, by 2013 the incidence had decreased to about 28%.7 As such, the net effect may be a stable or decreased number of ED visits. In one study of patients with breakthrough CINV, 64% were treated inpatient, 26% outpatient, and 10% in the ED. The study, however, does not note how many of these inpatient visits originated in the ED, highlighting that this is an area in need of further study.8
Current knowledge about the epidemiology and etiology of non-CINV comes from end-of-life (EOL) palliative-care literature treatment guidelines, which are organized by cause (etiology-based antiemetic treatment [EBAT]).9-11 Although one systematic review found that the EBAT approach “cannot be shown to be more effective than using a single antiemetic at effective doses,”12 the etiologic framework is useful and can be applied to non-EOL patients. According to a systematic review on the prevalence of symptoms, nausea in advanced cancer patients ranged from 6% to 68%.6 Another review on cancer-related nausea and vomiting that cited studies conducted in the 1990s showed patients had increased nausea and vomiting as they approach EOL—ranging from 36% upon entering palliative-care programs to 71% in the final week of life.13 However, another systematic review citing more recent studies contradicts these findings, stating that in the last 2 weeks of life, nausea was less common (17%) than in patients who were not at the last 2 weeks of life (31%);14 the same was true of vomiting (20% vs 13%). This data perhaps implies that treatment of nausea and vomiting has improved over time for EOL patients. The same review also found that women were more likely to experience nausea and vomiting than men,14 a finding also seen in a 2011 prospective study of antiemetics for breakthrough CINV vomiting.15
When evaluating patients with cancer-associated nausea and vomiting, it is important to remember that these symptoms rarely occur in isolation. Most patients present with between seven and 15 other complaints, such as pain, weakness, fatigue, anorexia, constipation, dry mouth, early satiety, and dyspnea.16
Pathophysiology
To understand nausea and vomiting, it is helpful to review the emetic pathway. There are four areas that stimulate the central vomiting center located in the medulla oblongata. These are the cerebral cortex, the vestibular nucleus, the intestinal tract, and the chemoreceptor trigger zone (located on the floor of the fourth ventricle). With sufficient input from any of these to the vomiting center, nausea occurs, followed by the vomiting reflex. It is known that each of the input zones, as well as the vomiting center itself, have receptors for various substances, including the following:1,13,17-20
· Cerebral cortex: gamma-aminobutyric acid, histamine type 1 (H1)
· Vestibular nucleus: muscarinic acetylcholine receptor (AChM), H1
· Intestinal tract: 5 hydroxytryptamine type 3 (5-HT3) or serotonin type 3 receptors, 5 hydroxytryptamine type 4 (5-HT4) or serotonin type 3 receptors, dopamine type 2 (D2)
· Chemoreceptor trigger zone: 5 hydroxytryptamine type 2 (5-HT2) or serotonin type 2; D2, neurokinin-1 (NK1), or substance P
· Vomiting center: AChM, H1, 5-HT2, D2, NK1, ([GK mµ] opioid receptors), and cannabinoid (CB) receptors
Each of the aforementioned substances in turn stimulate receptors in the intestinal tract and in the chemoreceptor trigger zone, triggering the vomiting center.1,13,17 Most antiemetic agents block the receptors for one or more of these mediators and are discussed later in more detail. Chemotherapeutic agents specifically cause the release 5-HT and NK1 in the gut, which contains over 90% of the body’s serotonin. This knowledge has led to the development of newer 5-HT3 and NK1 antagonists for CINV. Unlike the other mediators, cannabinoids cause an antiemetic effect when they bind to CB receptors.13,17,19 This finding has led to the development of specific pharmacologic treatment agents.
Etiology and Differential Diagnosis
Perhaps the best way for the emergency physician (EP) to assess the cancer patient with nausea or vomiting is to determine whether the cause is treatment- or nontreatment-related. Treatment-related causes are due to chemotherapy or radiotherapy, and any other causes would be considered nontreatment related. It is, however, wise for the EP to remember that a patient who has had recent chemotherapy can still be at risk for nontreatment etiologies.
Treatment-Related Nausea and Vomiting
Chemotherapy-Induced
Chemotherapy-induced nausea and vomiting has been well-studied in the literature. Chemotherapy is classified as highly, moderately, low, and minimally emetogenic.18,19 Nausea itself is classified as acute (onset within 24 hours), delayed (onset after 24 hours), and anticipatory (prior to the chemotherapy, usually due to anxiety over previous unpleasant experiences). Breakthrough vomiting occurs despite the use of antiemetics and may be acute or delayed up to 5 days.
When evaluating the patient with recent chemotherapy and vomiting, it is prudent to find out if the agent is expected to cause vomiting. For example, a patient on cladribine, which is classified as minimally emetogenic, who experiences significant nausea and vomiting should likely be worked up for another etiology. Even when vomiting is controlled, a significant number of patients still experience nausea without vomiting, which in turn has a negative impact on quality of life.
Even though prophylactic regimens of 5-HT3 and NK1 receptor antagonists have led to improved rates of CINV control,18,19,21 both persistent nausea without vomiting and breakthrough vomiting remain problematic,18 and little scientific work has been done on breakthrough treatment. A small prospective pilot study of the efficacy of prochlorperazine versus serotonin 5-HT3 receptor antagonists for breakthrough vomiting found both medications reduced nausea by 75% at 4 hours.15 In contrast, randomized controlled trials comparing olanzapine to metoclopramide and prochlorperazine for breakthrough vomiting found that at 3 days, olanzapine consistently achieved total relief of vomiting 66% to 70%, while the success rates of the other agents ranged from 20% to 37%.18
Radiotherapy-Induced
Radiotherapy has long been known to adversely affect the gastrointestinal (GI) tract. 5-HT3 (ie, serotonin) is released from the gut enterochromaffin cells, in a manner similar to chemotherapy. A 2015 review on the subject showed that radiotherapy to the upper abdomen is most likely to lead to nausea and vomiting, with 50% to 67% of patients reporting nausea and 21% to 38% reporting vomiting.20 Recommended prophylaxis and treatment regimens are based on consensus expert opinion, highlighting the lack of quality evidence that is seen with CINV. Prophylaxis regimens use 5-HT3 antagonists prior to every session, plus dexamethasone for the first 5 days. Rescue from breakthrough is also treated with 5-HT3 antagonists. The use of daily 5-HT3 antagonists for a long course of radiotherapy, however, can be very expensive and unnecessary.
In addition, there is a delayed nausea and vomiting phenomena that may be due to substances other than serotonin, since 5-HT3 depletes a few days after radiotherapy is begun, and may explain why 5-HT3 antagonists are less effective after the first few days of radiotherapy. Nonpharmacologic treatments such as acupuncture, acupressure, hydrogen therapy, and ginger have been used or proposed as treatments for nausea, with mild benefit and little toxicity, so they should be studied further.20
Nontreatment-Related Nausea or Vomiting

Again, much of what is known about nontreatment cancer-related nausea and/or vomiting comes from the palliative-care literature. It is estimated that 60% of advanced cancer patients experience nontreatment-related nausea, and 30% experience vomiting.1,11 One study of 61 hospice patients showed nausea or vomiting occurred due to the following (listed in order from most to least frequent):
· Impaired gastric emptying due to tumor or hepatomegaly, bowel obstruction, metabolic problems (eg, renal failure, liver failure, hypercalcemia, hyponatremia, ketoacidosis)
· infection
· drugs
· increased intracranial pressure (ICP)
· anxiety
The above causes of nausea and vomiting accounted for 85% of the cases in the study.9 Similar results were found in another study, showing that impaired gastric emptying and metabolic/drugs each caused about one third of the cases.10
Nontreatment-related causes of nausea and vomiting are traditionally divided into the following six broad etiological categories by palliative care practitioners9,10,13:
1. Biochemical: medications, tumor products, metabolic derangements, comorbidities, including systemic infections, noncancer abdominal illnesses; and silent cardiac ischemia
2. Gastric stasis: tumor, neuropathy, hepatomegaly, ascites
3. Bowel dysmotility/obstruction: tumor, metastases, adhesions, ileus, constipation
4. Intracranial pressure: tumor edema, bleeding, hydrocephalus, leptomeningeal disease
5. Vestibular: opioids, comorbid vestibular problems, brainstem metastases
6. Miscellaneous: anxiety, pain
These classification schemes are designed to help guide the treatment of palliative-care patients (EBAT),9-11 but very little evidence supports the recommendations.11-13,17 Expert opinion consensus guidelines favor haloperidol for biochemical etiology and metoclopramide for impaired gastric emptying. In intestinal obstruction, the H1-blocking antihistamine cyclizine and the anticholinergic hyoscine butylbromide (scopoloamine) are the preferred agents, but dexamethasone and haloperidol are also favored by some. It is believed that increased ICP nausea is best treated with cyclizine and dexamethasone. Vestibular etiologies are treated with cyclizine, and anxiety-mediated nausea should be treated with benzodiazepines.9,17 As there are often multiple etiologies in a given patient, selection of one agent can be problematic.13 Furthermore, no studies have applied these guidelines to ED cancer patients. This framework, however, can assist the EP in forming a differential diagnosis and appropriate workup. On history and physical examination, the EP should look for and consider the following:13,16
· Small-volume undigested emesis shortly after eating, suggesting gastric emptying impairment
· Bilious or feculent vomitus, large volumes, constipation, and obstipation, suggesting bowel obstruction (evaluate via X-ray or computed tomographic imaging)
· Early morning nausea and headache, suggesting increased ICP
· Nausea associated with head movement or motion, with or without vertigo, (suggesting vestibular disease)
· Current or recent use of opioids, antibiotics, antifungals, anticonvulsants, vitamins, ethanol, and selective serotonin reuptake inhibitors
· Infection, sepsis
· Metabolic abnormalities found on blood tests (for example, renal failure, liver failure, hypercalcemia, hyponatremia, ketoacidosis, osmolar gap, toxins/poisons, Addisonian crisis from steroid withdrawal or adrenal metastases); and/or
· Silent cardiac ischemia (evaluate via electrocardiography and cardiac enzymes)
· Careful consideration of each of the above possibilities will make one less likely to miss other serious causes of nausea and vomiting in the cancer patient with recent chemotherapy.
Opioid-Induced Nausea
Forty percent of cancer patients taking opioids experience nausea, which can adversely impact pain control.22 Opioid-induced nausea is due to constipation, gastroparesis, stimulation of the chemoreceptor trigger zone, and sensitization of the labyrinth, all of which can in turn stimulate the vomiting center.
Regarding the treatment of opioid-induced nausea and vomiting, there is no evidence to support the use of one antiemetic over another. Some weak evidence-based recommendations suggest either changing the medication to a different opioid, or changing the route of administration from oral to subcutaneous and adding coanalgesics such as gabapentin or ketamine to reduce opioid dosages. Though these strategies may be helpful in practice, none of the studies was large enough or thorough enough to support or warrant any formal recommendations in this systematic review.22
Initial Management and Treatment
As always, attention to the patient’s airway, breathing, and circulation is of utmost importance. Endotracheal intubation should be considered in patients at risk for aspiration—unless a living will or do-not-resuscitate order exists. Maneuvers such as raising the head of the bed or turning the patient on his or her side may help avoid aspiration.
Intravenous (IV) hydration is generally beneficial. The choice and amount of fluid should be based on clinical judgment. Electrolyte imbalances should be corrected. The mainstay of treatment for nausea and/or vomiting is pharmacologic, which is the focus of the next section.
Pharmacologic Management
Prokinetic Agents
Prokinetic agents increase peristalsis and exert an antiemetic effect. Metoclopramide is the best known and most widely available prokinetic agent. Since it is both inexpensive and very effective as an antiemetic, its use in the ED is widespread. Etiology-based antiemetic treatment guidelines list metoclopramide as the antiemetic of choice when gastroparesis or other gastric emptying problems are diagnosed9,10,13,17 as it exerts both D2 and 5-HT3 central nervous system (CNS) antiemetic effects, relaxes pyloric tone (D2), and increases peristalsis by stimulating 5-HT4 serotonin receptors in the gut.
The main limitation of metoclopramide is its extrapyramidal side effects (eg, akathisia, dystonia, psuedoparkinsonism, dyskinesia). Akathisias (ie, restlessness) is a particularly common phenomenon in patients taking metoclopramide. Patients experiencing extrapyramidal reactions are typically treated with diphenhydramine. In addition to the extrapyramidal side effects, metoclopramide is relatively contraindicated in patients with complete bowel obstruction.13,17
In addition to metoclopramide, erythromycin and mirtazapine are other prokinetic agents used in palliative care. Erythromycin has mainly been used for diabetic gastroparesis due to its stimulatory effect on motilin receptors in the GI tract.13,23 Mirtazapine is an antidepressant with both 5-HT3 and 5-HT4 receptor activity. In one case report it was used to treat gastroparesis refractory to all other therapies, including metoclopramide and erythromycin.23
Dopamine-Receptor Antagonists
This category includes many agents, most which are known for their antipsychotic effects. The primary mode of action of dopamine-receptor antagonists is to block D2 receptors in the vomiting center. Etiology-based antiemetic treatment guidelines list these drugs as the first choice in patients with a biochemical-based etiology for nausea, though there is little-to-no evidence to support this recommendation.9,10,12,13,17
While a review on haloperidol use in cancer found its effects better than placebo for CINV and postoperative nausea, studies in the review were small and the evidence weak.24 Due to its low cost, and comparatively favorable side-effect profile, haloperidol is a reasonable alternative to metoclopramide. Indeed, if palliative-care models are used, haloperidol would be preferred over metoclopramide since biochemical nausea is probably more prevalent in the general ED cancer patient than gastroparesis.
Regarding route of administration, olanzapine can be given orally or intramuscularly, making it potentially useful in the ED setting for those who cannot keep pills down and have poor venous access. When used in the supportive care setting, however, olanzapine is typically given at bedtime due to its sedative effects. As such, this agent may be best given to those who will be admitted or placed on observation status, since some patients may not be able to be discharged even if nausea resolves.
Antihistamine Agents
Cyclizine, diphenhydramine, hydroxyzine, meclozine, and promethazine, are all piperazine H1-receptor blockers that work in the vomiting center, vestibular nucleus, and chemoreceptor trigger zone. In addition to its properties as an H1-receptor antagonist, cyclizine also exhibits some anticholinergic activity that decreases bowel secretions, thus making it theoretically beneficial in patients with bowel obstruction. Each of these antihistamines are considered beneficial in treating nausea due to vestibular dysfunction and in motion sickness, and may be helpful in patients with increased ICP. Heavy sedation, anticholinergic, and extrapyramidal side effects may occur with these drugs, especially in elderly patients.1,13,17
Serotonin 5-HT3 Receptor Antagonists
Dolasetron, granisetron, ondansetron, palonosetron, and tropisetron are among the 5-HT3 (serotonin type 3) receptor antagonists used to treat nausea and vomiting. As previously stated, chemotherapy stimulates release of 5-HT from the gut, which in turn stimulates 5-HT3 receptors in the gut, vagus nerve, and the chemotherapy trigger zone—all of which in turn stimulate the vomiting center, leading to the vomiting reflex.1,13,17,19,21 The blocking action of these drugs on the 5-HT3 receptors is the basis of the antiemetic effect. Palonosetron, with its long 40-hour half-life, has become the preferred prophylactic agent for CINV. The most common adverse events with 5-HT3 antagonists include mild headache, transient elevation of hepatic aminotransferase levels, and constipation.19,21 The use of ondansetron for emesis in the ED is becoming more established both for CINV and non-CINV—mainly due to its high efficacy and favorable side-effect profile compared to metoclopramide and the dopamine antagonists.
Substance P Antagonists (NK1-Receptor Antagonists)
Oral aprepitant, injectable fosaprepitant, and netupitant are some of the Substance P (NK1) antagonists used to treat nausea and vomiting. In a manner similar to 5-HT release, chemotherapeutic agents stimulate the cellular release of NK1 in the gut. This reaction in turn activates receptors in the vagus nerve and the chemotherapy trigger zone, which stimulates the vomiting center. The NK1 receptors are blocked by these agents. The main use of these medications has been to complement the 5-HT3 antagonists for prophylaxis prior to administration of chemotherapy. Neurokinin-1receptor antagonists have not been studied in the setting of breakthrough nausea and vomiting but they are being used to treat delayed phase breakthrough CINV by the authors at their institution’s ED. The agents have been shown to be more effective than 5-HT3 agents in preventing delayed phase nausea and vomiting.25 As such, the possibility they may also be effective in treating delayed phase breakthrough CINV has led to this use. Recent studies have found these agents highly effective in the treatment of postoperative nausea and vomiting in high-risk patients.26
The standard in recent years for prophylaxis has been combining 5-HT3 antagonists, NK1 inhibitors, and dexamethasone. Netupitant/palonosetron (commonly referred to as NEPA) is a novel oral agent combining a long-acting 5-HT3 antagonist, and a long-acting NK1 inhibitor for CINV prophylaxis.27 Its use in treating delayed breakthrough vomiting remains to be seen.
Corticosteroids
Based on its antiemetic properties, the corticosteroid dexamethasone increases the effects of antiemetics (ie, metoclopramide and more recently 5-HT3 and NK1 receptor antagonists) in preventing CINV, perhaps by reducing the blood-brain barrier permeability to emetogenic substances. There are also some evidence-based benefits in using dexamethasone in patients with bowel obstruction. It is also used to reduce ICP from cerebral edema.1,11,13,17,19
Benzodiazepines
The benzodiazepines are best given to enhance the antiemetic effects of other drugs, especially in patients experiencing anxiety-related side effects. The benzodiazepines work well for anticipatory nausea. Lorazepam is the preferred drug of choice due to the lack of active metabolites. However, the clinician should always exercise caution when using benzodiazepines in elderly patients due to the increased risk of falls and cognitive impairment.13,17,19
Cannabinoids
The observation that the incidence of CINV decreased in marijuana smokers led to the exploration of cannabinoids for the treatment of nausea and vomiting. Tetrahydrocannabinol, the psychoactive substance in marijuana, is a phytocannabinoid. Its receptor, CB1, exists throughout the brain. Synthetic cannabinoids such as oral dronabinol, oral nabilone, and intramuscular levonantradol have been used with antiemetic success superior to chlorpromazine, haloperidol, metoclopramide, and prochlorperazine, but at the cost of unpleasant CNS effects and postural hypotension in elderly patients.1,13,17
As cited in a systematic review, cannabinoids appear to inhibit growth of glioblastoma multiforme, breast, prostate, and thyroid cancer, colon carcinoma, leukemia, and lymphomas. Cannabinoids can also benefit cancer patients by stimulating appetite, elevating mood, and inhibiting pain.28 Clearly, more oncologic research needs to be done on the topic. As such, this class of medication is years, if not decades, away from use in the ED.
Nonpharmacologic Treatments
Acupuncture and Acupressure
A 2006 Cochrane systematic review and meta-analysis showed that acupuncture helped with acute CINV but not with delayed CINV.29 Acupuncture was shown to work best with electro-acupuncture needles. Acupressure without needles helped nausea but not vomiting.29 A more recent review on the specific P6 acupuncture area on the wrist near the median nerve found that electroacupuncture, but not manual acupuncture, was beneficial for first-day vomiting, and acupressure was effective for first-day nausea but not vomiting. Neither acupuncture nor acupressure was shown to help delayed nausea or vomiting.30
Ginger
Ginger has been shown to help with CINV and anticipatory nausea, but not with other types of nausea.13 Supplementing routine antiemetics with 0.5 to 1.5 g of ginger per day for 6 days (beginning 3 days before chemotherapy) was shown to reduce the severity of nausea on the day of chemotherapy, but did not affect vomiting.21
Percutaneous Gastrostomy, Stenting, and Laser Therapy
Several strategies have been developed for palliation of intestinal obstruction when surgery is not warranted. Percutaneous gastrostomy tubes (PEG) are used to vent GI secretions that would otherwise build up. Esophageal, colorectal, and gastric outlet obstructions can be palliated by endoscopically placed stenting devices. Argon beam plasma coagulation laser therapy can be used for gastric outlet as well as colonic obstruction.13,31 One review evaluating the benefits of colonic obstruction stenting found an 89% success rate in symptom relief. This same review noted that venting the PEG tube placement had an 84% rate of symptom relief.31
Selecting an Agent in the ED: the Evidence (or Lack Thereof)
Nontreatment-Related Nausea and Vomiting
A 2011 systematic review of cancer nausea unrelated to chemotherapy or radiotherapy found level B evidence that metoclopramide is the most effective first-line empiric agent. In patients with bowel obstruction, dexamethasone, hyoscine butylbromide (scopolamine), and octreotide are effective. While dexamethasone is often thought to improve the effects of antiemetic drugs, this review showed it did not improve nausea when added to chlorpromazine or metoclopramide. Furthermore, neither metoclopramide nor ondansetron were shown to reduce opioid-induced emesis.13 The review further pointed out the lack of good evidence for expert opinion guideline recommendations in breakthrough vomiting—eg, dose titration of the same drug, switching to a different drug class, or using two or more drugs together at once.13
Another review had similar findings, while pointing out that an “absence of evidence is not evidence of absence,” and noting that many of these treatments have been used for years—ie, the problem is lack of evidence, but not negative evidence.17 Both studies are notable in that they were all done in palliative-care units in which time to relief from nausea and/or vomiting was typically measured in days, not hours, making their application to the emergency setting—where time is a factor—difficult.
Due to the potential for drug toxicity, using the same antiemetic drug repeatedly within a short amount of time in a patient refractory to therapy may not be the best strategy in the ED. It is most likely more beneficial and effective to switch drugs or use a combination of drugs right away—though this approach has theoretical concerns with drug-drug interactions. Again, this is an area in which further study is needed.
Treatment-Related Nausea and Vomiting
A recent review on breakthrough CINV again cited the paucity of clinical trials for this entity. Based on few studies, olanzapine and metoclopramide seem to be of value when prophylactic antiemetic regimens have failed. The review further noted that treatment of breakthrough CINV with an agent from same drug class as that used in the prophylactic regimen (usually 5-HT3 and NK1 antagonists) is unlikely to be successful.32 This review also mentioned an interesting phase 2 study using a transdermal gel consisting of diphenhydramine, haloperidol, and lorazepam to the wrist, in which 27 of 33 patients in the study reported a decrease in nausea within a 4-hour period.33 The same combination of drugs in IV form (lorazepam 0.5 mg, diphenhydramine 12.5 mg, and haloperidol 1 mg) is frequently used in the ED at the authors’ institution to treat breakthrough vomiting refractory to metoclopramide, antihistamines, or 5-HT3 antagonists. To the authors’ knowledge, this combination treatment has not been previously cited in the medical literature.
Recommendations and Summary
Cancer patients presenting to the ED with nausea and vomiting should be thoroughly evaluated regarding the possible etiology of their symptoms. A careful history must include recent chemotherapy, radiation, medications, as well as knowledge of the potential complications associated with the specific type of cancer. The EP also should keep in mind that delayed nausea and vomiting can be present several days after chemotherapy, and that CINV may not manifest until after the initial prophylactic medications have worn off. Moreover, he or she should be aware that some individuals have unique responses to chemotherapy and radiation and may experience more nausea and vomiting symptoms than is considered typical.
In addition to CINV, other etiologies, including GI issues such as delayed gastric emptying, partial bowel obstruction, and constipation should also be carefully considered. When evaluating the patient, the EP should also consider non-GI causes such as elevated ICP, kidney obstruction, infection, silent cardiac ischemia, steroid withdrawal, Addisonian crisis, and electrolyte abnormalities.
The lack of conclusive evidence for the treatment of cancer-related nausea and vomiting in any circumstance—except for prophylaxis prior to chemotherapy—precludes the recommendation of a specific treatment algorithm. However, the evidence is abundant that there are multiple effective agents with different, if not overlapping, mechanisms of action available. The EP, therefore, should be familiar with the most commonly used antiemetic drugs from several different categories and their side effects, and tailor the approach based on the assumed etiology of the symptoms. When treating CINV or cancer-related nausea and vomiting, it is not uncommon that patients may require multiple agents, either simultaneously or in sequence, to obtain symptom resolution.
Dr Sandoval is an assistant professor, department of emergency medicine, division of internal medicine at The University of Texas MD Anderson Cancer Center, Houston. Dr Rice is an assistant professor and clinical medical director in the department of emergency medicine, division of internal medicine at The University of Texas MD Anderson Cancer Center, Houston.
- Davis M, Walsh D. Treatment of nausea and vomiting in advanced cancer. Support Care Cancer. 2000;8(6):444-452.
- Abernethy AP, Wheeler JL, Zafar SY. Detailing of gastrointestinal symptoms in cancer patients with advanced disease: new methodologies, new insights, and a proposed approach. Curr Opin Support Palliat Care. 2009;3(1):41-49.
- Myer PA, Mannalithara A, Singh G, Singh G, Pasricha PJ, Ladabaum U. Clinical and economic burden of emergency department visits due to gastrointestinal diseases in the United States. Am J Gastroenterol. 2013;108(9):1496-1507.
- Body R, Kaide E, Kendal S, Foex B. Not all suffering is pain: sources of patients’ suffering in the emergency department call for improvements in communication from practitioners. Emerg Med J. 2015;32(1):15-20.
- National Chemotherapy Advisory Group. Chemotherapy Services in England: ensuring quality and safety. London, England: Department of Health; 2009. http://webarchive.nationalarchives.gov.uk/20130107105354/http:/www.dh.gov.uk/prod_consum_dh/groups/dh_digitalassets/documents/digitalasset/dh_104501.pdf. Accessed July 17, 2015.
- Solano JP, Gomes B, Higginson IJ. A comparison of symptom prevalence in far advanced cancer, AIDS, heart disease, chronic obstructive pulmonary disease and renal disease. J Pain Symptom Manage. 2006;31(1):58-69.
- Carlotto A, Hogsett VL, Maiorini EM, Razulis JG, Sonis ST. The economic burden of toxicities associated with cancer treatment: review of the literature and analysis of nausea and vomiting, diarrhoea, oral mucositis and fatigue. Pharmacoeconomics. 2013;31(9):753-766.
- Burke TA, Wisniewski T, Ernst FR. Resource utilization and costs associated with chemotherapy-induced nausea and vomiting (CINV) following highly or moderately emetogenic chemotherapy administered in the US outpatient hospital setting. Support Care Cancer. 2011;19(1):131-140.
- Stephenson J. Davies A. An assessment of aetiology-based guidelines for the management of nausea and vomiting in patients with advanced cancer. Support Care Cancer. 2006;14(4):348-353.
- Bentley A, Boyd K. Use of clinical pictures in the management of nausea and vomiting: a prospective audit. Palliat Med. 2001;15(3):247–253.
- Glare P, Pereira G, Kristjanson LJ, Stockler M, Tattersall M. Systematic review of the efficacy of antiemetics in the treatment of nausea in patients with far-advanced cancer. Support Care Cancer. 2004;12(6):432–440.
- Davis MP, Hallerberg G; Palliative Medicine Study Group of the Multinational Association of Supportive Care in Cancer. A systematic review of the treatment of nausea and/or vomiting in cancer unrelated to chemotherapy or radiation. J Pain Symptom Manage. 2010;39(4):756-767.
- Glare P, Miller J, Nikolova T, Tickoo R. Treating nausea and vomiting in palliative care: a review. Clin Interv Aging. 2011;6:243-259.
- Teunissen, S, Wesker W, Symptom prevalence in patients with incurable cancer: a systematic review. J Pain Symptom Manage. 2007;34(1):94-104.
- Jones JM, Qin R, Bardia A, Linquist B, Wolf S, Loprinzi CL. Antiemetics for chemotherapy-induced nausea and vomiting occurring despite prophylactic antiemetic therapy. J Palliat Med. 2011;14(7):810-814.
- Shoemaker LK, Estfan B, Induru R, Walsh TD. Symptom management: an important part of cancer care. Cleve Clin J Med. 2011;78(1):25-34.
- Harris DG. Nausea and vomiting in advanced cancer. Br Med Bull. 2010;96:175-185.
- Hocking CM, Kichenadasse G. Olanzapine for chemotherapy-induced nausea and vomiting: a systematic review. Support Care Cancer. 2014;22(4):1143-1151.
- Hesketh PJ. Chemotherapy-induced nausea and vomiting. N Engl J Med. 2008;358(23):2482-2494.
- Dennis K, Poon M, Chow E. Nausea and vomiting induced by gastrointestinal radiation therapy: current status and future directions. Curr Opin Support Palliat Care. 2015;9(2):182-188.
- Rangwala F, Zafar SY, Abernethy AP. Gastrointestinal symptoms in cancer patients with advanced disease: new methodologies, insights, and a proposed approach. Curr Opin Support Palliat Care. 2012;6(1):69-76.
- Laugsand EA, Kaasa S, Klepstad P. Management of opioid-induced nausea and vomiting in cancer patients: systematic review and evidence-based recommendations. Palliat Med. 2011;25(5):442-453.
- Kim SW, Shin IS, Kim JM, et al. Mirtazapine for severe gastroparesis unresponsive to conventional prokinetic treatment. Psychosomatics. 2006;47(5):440-442.
- McLean SL, Blenkinsopp A, Bennett MI. Using haloperidol as an antiemetic in palliative care: informing practice through evidence from cancer treatment and postoperative contexts. J Pain Palliat Care Pharmacother. 2013;27(2):132-135.
- Aapro M, Carides A, Rapoport BL, Schmoll HJ, Zhang L, Warr D. Aprepitant and fosaprepitant: a 10-year review of efficacy and safety. Oncologist. 2015;20(4)450-458.
- Soga T, Kume K, Kakuta N, et al. Fosaprepitant versus ondansetron for the prevention of postoperative nausea and vomiting in patients who undergo gynecologic abdominal surgery with patient-controlled epidural analgesia: a prospective, randomized, double-blind study. J Anesth. 2015;29(5):696-701.
- Abramovitz RB, Gaertner KM. The role of netupitant and palonosetron in chemotherapy-induced nausea and vomiting [published online ahead of print April 24, 2015]. J Oncol Pharm Pract. doi:10.1177/1078155215581525.
- Pisanti S, Malfitano AM, Grimaldi C, et al. Use of cannabinoid receptor agonists in cancer therapy as palliative and curative agents. Best Pract Res Clin Endocrinol Metab. 2009;23(1):117-131.
- Ezzo JM, Richardson MA, Vickers A, et al: Acupuncture-point stimulation for chemotherapy-induced nausea or vomiting. Cochrane Database Syst Rev. 2006;19(2):CD002285.
- Ezzo J, Streitberger K, Schneider A. Cochrane systematic reviews examine P6 acupuncture-point stimulation for nausea and vomiting. J Altern Complement Med. 2006;12(5):489-495.
- Laval G, Marcelin-Benazech B, Guirimand F, et al; French Society for Palliative Care; French Society for Digestive Surgery; French Society for Gastroenterology; French Association for Supportive Care in Oncology; French Society for Digestive Cancer. Recommendations for bowel obstruction with peritoneal carcinomatosis. J Pain Symptom Manage. 2014;48(1):75-91.
- Navari RM. Treatment of breakthrough and refractory chemotherapy-induced nausea and vomiting. Biomed Res Int. 2015;2015:595894.
- Bleicher J, Bhaskara A, Huyck T, Constantino S, Bardia A, Loprinzi CL, et al. Lorazepam, diphenhydramine, and haloperidol transdermal gel for rescue from chemotherapy-induced nausea/vomiting: results of two pilot trials. J Support Oncol. 2008;6(1):27-32.
Nausea and vomiting is common in cancer patients and a frequent presentation in the ED. When evaluating nausea and vomiting, the clinician should be aware that the two are not always linked—nausea may present without vomiting and vice versa. Nausea is “an unpleasant sensation of the need to vomit and is associated with autonomic symptoms,” whereas vomiting is “the forceful propulsion of abdominal contents via the contraction of the abdominal musculature and diaphragm.”1 Whether these symptoms present together or independently of each other, both can result in serious metabolic disturbances, internal injury, malnutrition, and poor quality of life. In addition, nausea and vomiting can result in patient withdrawal from potentially beneficial treatment.2 Based on the current literature, this article reviews and provides recommendations on appropriate assessment and treatment of the cancer patient presenting to the ED with nausea and/or vomiting.
Epidemiology
In 2007, the US Nationwide Emergency Department Sample database noted 122 million ED visits, 1.6 million of which were due to nausea and vomiting.3 In contrast, a small study from the United Kingdom cited 18% of ED visits in one of its centers were due to nausea and/or vomiting, demonstrating that the percentage of patients presenting with these symptoms can vary greatly.4
The incidence of cancer-related nausea and vomiting in the ED is unknown. Although EDs affiliated with large cancer centers see many cases of cancer-associated nausea and vomiting, presentations to noncancer-center EDs are becoming more prevalent due to increases in community-based cancer care.5 While the number of cancer patients is rising and the general population is aging,6 there is now less incidence of breakthrough chemotherapy-induced nausea and vomiting (CINV), which is a common cause of cancer-related nausea and vomiting. Older studies quote a 40% to 60% rate of breakthrough CINV; however, with the advent of newer antiemetic prophylaxis, by 2013 the incidence had decreased to about 28%.7 As such, the net effect may be a stable or decreased number of ED visits. In one study of patients with breakthrough CINV, 64% were treated inpatient, 26% outpatient, and 10% in the ED. The study, however, does not note how many of these inpatient visits originated in the ED, highlighting that this is an area in need of further study.8
Current knowledge about the epidemiology and etiology of non-CINV comes from end-of-life (EOL) palliative-care literature treatment guidelines, which are organized by cause (etiology-based antiemetic treatment [EBAT]).9-11 Although one systematic review found that the EBAT approach “cannot be shown to be more effective than using a single antiemetic at effective doses,”12 the etiologic framework is useful and can be applied to non-EOL patients. According to a systematic review on the prevalence of symptoms, nausea in advanced cancer patients ranged from 6% to 68%.6 Another review on cancer-related nausea and vomiting that cited studies conducted in the 1990s showed patients had increased nausea and vomiting as they approach EOL—ranging from 36% upon entering palliative-care programs to 71% in the final week of life.13 However, another systematic review citing more recent studies contradicts these findings, stating that in the last 2 weeks of life, nausea was less common (17%) than in patients who were not at the last 2 weeks of life (31%);14 the same was true of vomiting (20% vs 13%). This data perhaps implies that treatment of nausea and vomiting has improved over time for EOL patients. The same review also found that women were more likely to experience nausea and vomiting than men,14 a finding also seen in a 2011 prospective study of antiemetics for breakthrough CINV vomiting.15
When evaluating patients with cancer-associated nausea and vomiting, it is important to remember that these symptoms rarely occur in isolation. Most patients present with between seven and 15 other complaints, such as pain, weakness, fatigue, anorexia, constipation, dry mouth, early satiety, and dyspnea.16
Pathophysiology
To understand nausea and vomiting, it is helpful to review the emetic pathway. There are four areas that stimulate the central vomiting center located in the medulla oblongata. These are the cerebral cortex, the vestibular nucleus, the intestinal tract, and the chemoreceptor trigger zone (located on the floor of the fourth ventricle). With sufficient input from any of these to the vomiting center, nausea occurs, followed by the vomiting reflex. It is known that each of the input zones, as well as the vomiting center itself, have receptors for various substances, including the following:1,13,17-20
· Cerebral cortex: gamma-aminobutyric acid, histamine type 1 (H1)
· Vestibular nucleus: muscarinic acetylcholine receptor (AChM), H1
· Intestinal tract: 5 hydroxytryptamine type 3 (5-HT3) or serotonin type 3 receptors, 5 hydroxytryptamine type 4 (5-HT4) or serotonin type 3 receptors, dopamine type 2 (D2)
· Chemoreceptor trigger zone: 5 hydroxytryptamine type 2 (5-HT2) or serotonin type 2; D2, neurokinin-1 (NK1), or substance P
· Vomiting center: AChM, H1, 5-HT2, D2, NK1, ([GK mµ] opioid receptors), and cannabinoid (CB) receptors
Each of the aforementioned substances in turn stimulate receptors in the intestinal tract and in the chemoreceptor trigger zone, triggering the vomiting center.1,13,17 Most antiemetic agents block the receptors for one or more of these mediators and are discussed later in more detail. Chemotherapeutic agents specifically cause the release 5-HT and NK1 in the gut, which contains over 90% of the body’s serotonin. This knowledge has led to the development of newer 5-HT3 and NK1 antagonists for CINV. Unlike the other mediators, cannabinoids cause an antiemetic effect when they bind to CB receptors.13,17,19 This finding has led to the development of specific pharmacologic treatment agents.
Etiology and Differential Diagnosis
Perhaps the best way for the emergency physician (EP) to assess the cancer patient with nausea or vomiting is to determine whether the cause is treatment- or nontreatment-related. Treatment-related causes are due to chemotherapy or radiotherapy, and any other causes would be considered nontreatment related. It is, however, wise for the EP to remember that a patient who has had recent chemotherapy can still be at risk for nontreatment etiologies.
Treatment-Related Nausea and Vomiting
Chemotherapy-Induced
Chemotherapy-induced nausea and vomiting has been well-studied in the literature. Chemotherapy is classified as highly, moderately, low, and minimally emetogenic.18,19 Nausea itself is classified as acute (onset within 24 hours), delayed (onset after 24 hours), and anticipatory (prior to the chemotherapy, usually due to anxiety over previous unpleasant experiences). Breakthrough vomiting occurs despite the use of antiemetics and may be acute or delayed up to 5 days.
When evaluating the patient with recent chemotherapy and vomiting, it is prudent to find out if the agent is expected to cause vomiting. For example, a patient on cladribine, which is classified as minimally emetogenic, who experiences significant nausea and vomiting should likely be worked up for another etiology. Even when vomiting is controlled, a significant number of patients still experience nausea without vomiting, which in turn has a negative impact on quality of life.
Even though prophylactic regimens of 5-HT3 and NK1 receptor antagonists have led to improved rates of CINV control,18,19,21 both persistent nausea without vomiting and breakthrough vomiting remain problematic,18 and little scientific work has been done on breakthrough treatment. A small prospective pilot study of the efficacy of prochlorperazine versus serotonin 5-HT3 receptor antagonists for breakthrough vomiting found both medications reduced nausea by 75% at 4 hours.15 In contrast, randomized controlled trials comparing olanzapine to metoclopramide and prochlorperazine for breakthrough vomiting found that at 3 days, olanzapine consistently achieved total relief of vomiting 66% to 70%, while the success rates of the other agents ranged from 20% to 37%.18
Radiotherapy-Induced
Radiotherapy has long been known to adversely affect the gastrointestinal (GI) tract. 5-HT3 (ie, serotonin) is released from the gut enterochromaffin cells, in a manner similar to chemotherapy. A 2015 review on the subject showed that radiotherapy to the upper abdomen is most likely to lead to nausea and vomiting, with 50% to 67% of patients reporting nausea and 21% to 38% reporting vomiting.20 Recommended prophylaxis and treatment regimens are based on consensus expert opinion, highlighting the lack of quality evidence that is seen with CINV. Prophylaxis regimens use 5-HT3 antagonists prior to every session, plus dexamethasone for the first 5 days. Rescue from breakthrough is also treated with 5-HT3 antagonists. The use of daily 5-HT3 antagonists for a long course of radiotherapy, however, can be very expensive and unnecessary.
In addition, there is a delayed nausea and vomiting phenomena that may be due to substances other than serotonin, since 5-HT3 depletes a few days after radiotherapy is begun, and may explain why 5-HT3 antagonists are less effective after the first few days of radiotherapy. Nonpharmacologic treatments such as acupuncture, acupressure, hydrogen therapy, and ginger have been used or proposed as treatments for nausea, with mild benefit and little toxicity, so they should be studied further.20
Nontreatment-Related Nausea or Vomiting
Again, much of what is known about nontreatment cancer-related nausea and/or vomiting comes from the palliative-care literature. It is estimated that 60% of advanced cancer patients experience nontreatment-related nausea, and 30% experience vomiting.1,11 One study of 61 hospice patients showed nausea or vomiting occurred due to the following (listed in order from most to least frequent):
· Impaired gastric emptying due to tumor or hepatomegaly, bowel obstruction, metabolic problems (eg, renal failure, liver failure, hypercalcemia, hyponatremia, ketoacidosis)
· infection
· drugs
· increased intracranial pressure (ICP)
· anxiety
The above causes of nausea and vomiting accounted for 85% of the cases in the study.9 Similar results were found in another study, showing that impaired gastric emptying and metabolic/drugs each caused about one third of the cases.10
Nontreatment-related causes of nausea and vomiting are traditionally divided into the following six broad etiological categories by palliative care practitioners9,10,13:
1. Biochemical: medications, tumor products, metabolic derangements, comorbidities, including systemic infections, noncancer abdominal illnesses; and silent cardiac ischemia
2. Gastric stasis: tumor, neuropathy, hepatomegaly, ascites
3. Bowel dysmotility/obstruction: tumor, metastases, adhesions, ileus, constipation
4. Intracranial pressure: tumor edema, bleeding, hydrocephalus, leptomeningeal disease
5. Vestibular: opioids, comorbid vestibular problems, brainstem metastases
6. Miscellaneous: anxiety, pain
These classification schemes are designed to help guide the treatment of palliative-care patients (EBAT),9-11 but very little evidence supports the recommendations.11-13,17 Expert opinion consensus guidelines favor haloperidol for biochemical etiology and metoclopramide for impaired gastric emptying. In intestinal obstruction, the H1-blocking antihistamine cyclizine and the anticholinergic hyoscine butylbromide (scopoloamine) are the preferred agents, but dexamethasone and haloperidol are also favored by some. It is believed that increased ICP nausea is best treated with cyclizine and dexamethasone. Vestibular etiologies are treated with cyclizine, and anxiety-mediated nausea should be treated with benzodiazepines.9,17 As there are often multiple etiologies in a given patient, selection of one agent can be problematic.13 Furthermore, no studies have applied these guidelines to ED cancer patients. This framework, however, can assist the EP in forming a differential diagnosis and appropriate workup. On history and physical examination, the EP should look for and consider the following:13,16
· Small-volume undigested emesis shortly after eating, suggesting gastric emptying impairment
· Bilious or feculent vomitus, large volumes, constipation, and obstipation, suggesting bowel obstruction (evaluate via X-ray or computed tomographic imaging)
· Early morning nausea and headache, suggesting increased ICP
· Nausea associated with head movement or motion, with or without vertigo, (suggesting vestibular disease)
· Current or recent use of opioids, antibiotics, antifungals, anticonvulsants, vitamins, ethanol, and selective serotonin reuptake inhibitors
· Infection, sepsis
· Metabolic abnormalities found on blood tests (for example, renal failure, liver failure, hypercalcemia, hyponatremia, ketoacidosis, osmolar gap, toxins/poisons, Addisonian crisis from steroid withdrawal or adrenal metastases); and/or
· Silent cardiac ischemia (evaluate via electrocardiography and cardiac enzymes)
· Careful consideration of each of the above possibilities will make one less likely to miss other serious causes of nausea and vomiting in the cancer patient with recent chemotherapy.
Opioid-Induced Nausea
Forty percent of cancer patients taking opioids experience nausea, which can adversely impact pain control.22 Opioid-induced nausea is due to constipation, gastroparesis, stimulation of the chemoreceptor trigger zone, and sensitization of the labyrinth, all of which can in turn stimulate the vomiting center.
Regarding the treatment of opioid-induced nausea and vomiting, there is no evidence to support the use of one antiemetic over another. Some weak evidence-based recommendations suggest either changing the medication to a different opioid, or changing the route of administration from oral to subcutaneous and adding coanalgesics such as gabapentin or ketamine to reduce opioid dosages. Though these strategies may be helpful in practice, none of the studies was large enough or thorough enough to support or warrant any formal recommendations in this systematic review.22
Initial Management and Treatment
As always, attention to the patient’s airway, breathing, and circulation is of utmost importance. Endotracheal intubation should be considered in patients at risk for aspiration—unless a living will or do-not-resuscitate order exists. Maneuvers such as raising the head of the bed or turning the patient on his or her side may help avoid aspiration.
Intravenous (IV) hydration is generally beneficial. The choice and amount of fluid should be based on clinical judgment. Electrolyte imbalances should be corrected. The mainstay of treatment for nausea and/or vomiting is pharmacologic, which is the focus of the next section.
Pharmacologic Management
Prokinetic Agents
Prokinetic agents increase peristalsis and exert an antiemetic effect. Metoclopramide is the best known and most widely available prokinetic agent. Since it is both inexpensive and very effective as an antiemetic, its use in the ED is widespread. Etiology-based antiemetic treatment guidelines list metoclopramide as the antiemetic of choice when gastroparesis or other gastric emptying problems are diagnosed9,10,13,17 as it exerts both D2 and 5-HT3 central nervous system (CNS) antiemetic effects, relaxes pyloric tone (D2), and increases peristalsis by stimulating 5-HT4 serotonin receptors in the gut.
The main limitation of metoclopramide is its extrapyramidal side effects (eg, akathisia, dystonia, psuedoparkinsonism, dyskinesia). Akathisias (ie, restlessness) is a particularly common phenomenon in patients taking metoclopramide. Patients experiencing extrapyramidal reactions are typically treated with diphenhydramine. In addition to the extrapyramidal side effects, metoclopramide is relatively contraindicated in patients with complete bowel obstruction.13,17
In addition to metoclopramide, erythromycin and mirtazapine are other prokinetic agents used in palliative care. Erythromycin has mainly been used for diabetic gastroparesis due to its stimulatory effect on motilin receptors in the GI tract.13,23 Mirtazapine is an antidepressant with both 5-HT3 and 5-HT4 receptor activity. In one case report it was used to treat gastroparesis refractory to all other therapies, including metoclopramide and erythromycin.23
Dopamine-Receptor Antagonists
This category includes many agents, most which are known for their antipsychotic effects. The primary mode of action of dopamine-receptor antagonists is to block D2 receptors in the vomiting center. Etiology-based antiemetic treatment guidelines list these drugs as the first choice in patients with a biochemical-based etiology for nausea, though there is little-to-no evidence to support this recommendation.9,10,12,13,17
While a review on haloperidol use in cancer found its effects better than placebo for CINV and postoperative nausea, studies in the review were small and the evidence weak.24 Due to its low cost, and comparatively favorable side-effect profile, haloperidol is a reasonable alternative to metoclopramide. Indeed, if palliative-care models are used, haloperidol would be preferred over metoclopramide since biochemical nausea is probably more prevalent in the general ED cancer patient than gastroparesis.
Regarding route of administration, olanzapine can be given orally or intramuscularly, making it potentially useful in the ED setting for those who cannot keep pills down and have poor venous access. When used in the supportive care setting, however, olanzapine is typically given at bedtime due to its sedative effects. As such, this agent may be best given to those who will be admitted or placed on observation status, since some patients may not be able to be discharged even if nausea resolves.
Antihistamine Agents
Cyclizine, diphenhydramine, hydroxyzine, meclozine, and promethazine, are all piperazine H1-receptor blockers that work in the vomiting center, vestibular nucleus, and chemoreceptor trigger zone. In addition to its properties as an H1-receptor antagonist, cyclizine also exhibits some anticholinergic activity that decreases bowel secretions, thus making it theoretically beneficial in patients with bowel obstruction. Each of these antihistamines are considered beneficial in treating nausea due to vestibular dysfunction and in motion sickness, and may be helpful in patients with increased ICP. Heavy sedation, anticholinergic, and extrapyramidal side effects may occur with these drugs, especially in elderly patients.1,13,17
Serotonin 5-HT3 Receptor Antagonists
Dolasetron, granisetron, ondansetron, palonosetron, and tropisetron are among the 5-HT3 (serotonin type 3) receptor antagonists used to treat nausea and vomiting. As previously stated, chemotherapy stimulates release of 5-HT from the gut, which in turn stimulates 5-HT3 receptors in the gut, vagus nerve, and the chemotherapy trigger zone—all of which in turn stimulate the vomiting center, leading to the vomiting reflex.1,13,17,19,21 The blocking action of these drugs on the 5-HT3 receptors is the basis of the antiemetic effect. Palonosetron, with its long 40-hour half-life, has become the preferred prophylactic agent for CINV. The most common adverse events with 5-HT3 antagonists include mild headache, transient elevation of hepatic aminotransferase levels, and constipation.19,21 The use of ondansetron for emesis in the ED is becoming more established both for CINV and non-CINV—mainly due to its high efficacy and favorable side-effect profile compared to metoclopramide and the dopamine antagonists.
Substance P Antagonists (NK1-Receptor Antagonists)
Oral aprepitant, injectable fosaprepitant, and netupitant are some of the Substance P (NK1) antagonists used to treat nausea and vomiting. In a manner similar to 5-HT release, chemotherapeutic agents stimulate the cellular release of NK1 in the gut. This reaction in turn activates receptors in the vagus nerve and the chemotherapy trigger zone, which stimulates the vomiting center. The NK1 receptors are blocked by these agents. The main use of these medications has been to complement the 5-HT3 antagonists for prophylaxis prior to administration of chemotherapy. Neurokinin-1receptor antagonists have not been studied in the setting of breakthrough nausea and vomiting but they are being used to treat delayed phase breakthrough CINV by the authors at their institution’s ED. The agents have been shown to be more effective than 5-HT3 agents in preventing delayed phase nausea and vomiting.25 As such, the possibility they may also be effective in treating delayed phase breakthrough CINV has led to this use. Recent studies have found these agents highly effective in the treatment of postoperative nausea and vomiting in high-risk patients.26
The standard in recent years for prophylaxis has been combining 5-HT3 antagonists, NK1 inhibitors, and dexamethasone. Netupitant/palonosetron (commonly referred to as NEPA) is a novel oral agent combining a long-acting 5-HT3 antagonist, and a long-acting NK1 inhibitor for CINV prophylaxis.27 Its use in treating delayed breakthrough vomiting remains to be seen.
Corticosteroids
Based on its antiemetic properties, the corticosteroid dexamethasone increases the effects of antiemetics (ie, metoclopramide and more recently 5-HT3 and NK1 receptor antagonists) in preventing CINV, perhaps by reducing the blood-brain barrier permeability to emetogenic substances. There are also some evidence-based benefits in using dexamethasone in patients with bowel obstruction. It is also used to reduce ICP from cerebral edema.1,11,13,17,19
Benzodiazepines
The benzodiazepines are best given to enhance the antiemetic effects of other drugs, especially in patients experiencing anxiety-related side effects. The benzodiazepines work well for anticipatory nausea. Lorazepam is the preferred drug of choice due to the lack of active metabolites. However, the clinician should always exercise caution when using benzodiazepines in elderly patients due to the increased risk of falls and cognitive impairment.13,17,19
Cannabinoids
The observation that the incidence of CINV decreased in marijuana smokers led to the exploration of cannabinoids for the treatment of nausea and vomiting. Tetrahydrocannabinol, the psychoactive substance in marijuana, is a phytocannabinoid. Its receptor, CB1, exists throughout the brain. Synthetic cannabinoids such as oral dronabinol, oral nabilone, and intramuscular levonantradol have been used with antiemetic success superior to chlorpromazine, haloperidol, metoclopramide, and prochlorperazine, but at the cost of unpleasant CNS effects and postural hypotension in elderly patients.1,13,17
As cited in a systematic review, cannabinoids appear to inhibit growth of glioblastoma multiforme, breast, prostate, and thyroid cancer, colon carcinoma, leukemia, and lymphomas. Cannabinoids can also benefit cancer patients by stimulating appetite, elevating mood, and inhibiting pain.28 Clearly, more oncologic research needs to be done on the topic. As such, this class of medication is years, if not decades, away from use in the ED.
Nonpharmacologic Treatments
Acupuncture and Acupressure
A 2006 Cochrane systematic review and meta-analysis showed that acupuncture helped with acute CINV but not with delayed CINV.29 Acupuncture was shown to work best with electro-acupuncture needles. Acupressure without needles helped nausea but not vomiting.29 A more recent review on the specific P6 acupuncture area on the wrist near the median nerve found that electroacupuncture, but not manual acupuncture, was beneficial for first-day vomiting, and acupressure was effective for first-day nausea but not vomiting. Neither acupuncture nor acupressure was shown to help delayed nausea or vomiting.30
Ginger
Ginger has been shown to help with CINV and anticipatory nausea, but not with other types of nausea.13 Supplementing routine antiemetics with 0.5 to 1.5 g of ginger per day for 6 days (beginning 3 days before chemotherapy) was shown to reduce the severity of nausea on the day of chemotherapy, but did not affect vomiting.21
Percutaneous Gastrostomy, Stenting, and Laser Therapy
Several strategies have been developed for palliation of intestinal obstruction when surgery is not warranted. Percutaneous gastrostomy tubes (PEG) are used to vent GI secretions that would otherwise build up. Esophageal, colorectal, and gastric outlet obstructions can be palliated by endoscopically placed stenting devices. Argon beam plasma coagulation laser therapy can be used for gastric outlet as well as colonic obstruction.13,31 One review evaluating the benefits of colonic obstruction stenting found an 89% success rate in symptom relief. This same review noted that venting the PEG tube placement had an 84% rate of symptom relief.31
Selecting an Agent in the ED: the Evidence (or Lack Thereof)
Nontreatment-Related Nausea and Vomiting
A 2011 systematic review of cancer nausea unrelated to chemotherapy or radiotherapy found level B evidence that metoclopramide is the most effective first-line empiric agent. In patients with bowel obstruction, dexamethasone, hyoscine butylbromide (scopolamine), and octreotide are effective. While dexamethasone is often thought to improve the effects of antiemetic drugs, this review showed it did not improve nausea when added to chlorpromazine or metoclopramide. Furthermore, neither metoclopramide nor ondansetron were shown to reduce opioid-induced emesis.13 The review further pointed out the lack of good evidence for expert opinion guideline recommendations in breakthrough vomiting—eg, dose titration of the same drug, switching to a different drug class, or using two or more drugs together at once.13
Another review had similar findings, while pointing out that an “absence of evidence is not evidence of absence,” and noting that many of these treatments have been used for years—ie, the problem is lack of evidence, but not negative evidence.17 Both studies are notable in that they were all done in palliative-care units in which time to relief from nausea and/or vomiting was typically measured in days, not hours, making their application to the emergency setting—where time is a factor—difficult.
Due to the potential for drug toxicity, using the same antiemetic drug repeatedly within a short amount of time in a patient refractory to therapy may not be the best strategy in the ED. It is most likely more beneficial and effective to switch drugs or use a combination of drugs right away—though this approach has theoretical concerns with drug-drug interactions. Again, this is an area in which further study is needed.
Treatment-Related Nausea and Vomiting
A recent review on breakthrough CINV again cited the paucity of clinical trials for this entity. Based on few studies, olanzapine and metoclopramide seem to be of value when prophylactic antiemetic regimens have failed. The review further noted that treatment of breakthrough CINV with an agent from same drug class as that used in the prophylactic regimen (usually 5-HT3 and NK1 antagonists) is unlikely to be successful.32 This review also mentioned an interesting phase 2 study using a transdermal gel consisting of diphenhydramine, haloperidol, and lorazepam to the wrist, in which 27 of 33 patients in the study reported a decrease in nausea within a 4-hour period.33 The same combination of drugs in IV form (lorazepam 0.5 mg, diphenhydramine 12.5 mg, and haloperidol 1 mg) is frequently used in the ED at the authors’ institution to treat breakthrough vomiting refractory to metoclopramide, antihistamines, or 5-HT3 antagonists. To the authors’ knowledge, this combination treatment has not been previously cited in the medical literature.
Recommendations and Summary
Cancer patients presenting to the ED with nausea and vomiting should be thoroughly evaluated regarding the possible etiology of their symptoms. A careful history must include recent chemotherapy, radiation, medications, as well as knowledge of the potential complications associated with the specific type of cancer. The EP also should keep in mind that delayed nausea and vomiting can be present several days after chemotherapy, and that CINV may not manifest until after the initial prophylactic medications have worn off. Moreover, he or she should be aware that some individuals have unique responses to chemotherapy and radiation and may experience more nausea and vomiting symptoms than is considered typical.
In addition to CINV, other etiologies, including GI issues such as delayed gastric emptying, partial bowel obstruction, and constipation should also be carefully considered. When evaluating the patient, the EP should also consider non-GI causes such as elevated ICP, kidney obstruction, infection, silent cardiac ischemia, steroid withdrawal, Addisonian crisis, and electrolyte abnormalities.
The lack of conclusive evidence for the treatment of cancer-related nausea and vomiting in any circumstance—except for prophylaxis prior to chemotherapy—precludes the recommendation of a specific treatment algorithm. However, the evidence is abundant that there are multiple effective agents with different, if not overlapping, mechanisms of action available. The EP, therefore, should be familiar with the most commonly used antiemetic drugs from several different categories and their side effects, and tailor the approach based on the assumed etiology of the symptoms. When treating CINV or cancer-related nausea and vomiting, it is not uncommon that patients may require multiple agents, either simultaneously or in sequence, to obtain symptom resolution.
Dr Sandoval is an assistant professor, department of emergency medicine, division of internal medicine at The University of Texas MD Anderson Cancer Center, Houston. Dr Rice is an assistant professor and clinical medical director in the department of emergency medicine, division of internal medicine at The University of Texas MD Anderson Cancer Center, Houston.
- Davis M, Walsh D. Treatment of nausea and vomiting in advanced cancer. Support Care Cancer. 2000;8(6):444-452.
- Abernethy AP, Wheeler JL, Zafar SY. Detailing of gastrointestinal symptoms in cancer patients with advanced disease: new methodologies, new insights, and a proposed approach. Curr Opin Support Palliat Care. 2009;3(1):41-49.
- Myer PA, Mannalithara A, Singh G, Singh G, Pasricha PJ, Ladabaum U. Clinical and economic burden of emergency department visits due to gastrointestinal diseases in the United States. Am J Gastroenterol. 2013;108(9):1496-1507.
- Body R, Kaide E, Kendal S, Foex B. Not all suffering is pain: sources of patients’ suffering in the emergency department call for improvements in communication from practitioners. Emerg Med J. 2015;32(1):15-20.
- National Chemotherapy Advisory Group. Chemotherapy Services in England: ensuring quality and safety. London, England: Department of Health; 2009. http://webarchive.nationalarchives.gov.uk/20130107105354/http:/www.dh.gov.uk/prod_consum_dh/groups/dh_digitalassets/documents/digitalasset/dh_104501.pdf. Accessed July 17, 2015.
- Solano JP, Gomes B, Higginson IJ. A comparison of symptom prevalence in far advanced cancer, AIDS, heart disease, chronic obstructive pulmonary disease and renal disease. J Pain Symptom Manage. 2006;31(1):58-69.
- Carlotto A, Hogsett VL, Maiorini EM, Razulis JG, Sonis ST. The economic burden of toxicities associated with cancer treatment: review of the literature and analysis of nausea and vomiting, diarrhoea, oral mucositis and fatigue. Pharmacoeconomics. 2013;31(9):753-766.
- Burke TA, Wisniewski T, Ernst FR. Resource utilization and costs associated with chemotherapy-induced nausea and vomiting (CINV) following highly or moderately emetogenic chemotherapy administered in the US outpatient hospital setting. Support Care Cancer. 2011;19(1):131-140.
- Stephenson J. Davies A. An assessment of aetiology-based guidelines for the management of nausea and vomiting in patients with advanced cancer. Support Care Cancer. 2006;14(4):348-353.
- Bentley A, Boyd K. Use of clinical pictures in the management of nausea and vomiting: a prospective audit. Palliat Med. 2001;15(3):247–253.
- Glare P, Pereira G, Kristjanson LJ, Stockler M, Tattersall M. Systematic review of the efficacy of antiemetics in the treatment of nausea in patients with far-advanced cancer. Support Care Cancer. 2004;12(6):432–440.
- Davis MP, Hallerberg G; Palliative Medicine Study Group of the Multinational Association of Supportive Care in Cancer. A systematic review of the treatment of nausea and/or vomiting in cancer unrelated to chemotherapy or radiation. J Pain Symptom Manage. 2010;39(4):756-767.
- Glare P, Miller J, Nikolova T, Tickoo R. Treating nausea and vomiting in palliative care: a review. Clin Interv Aging. 2011;6:243-259.
- Teunissen, S, Wesker W, Symptom prevalence in patients with incurable cancer: a systematic review. J Pain Symptom Manage. 2007;34(1):94-104.
- Jones JM, Qin R, Bardia A, Linquist B, Wolf S, Loprinzi CL. Antiemetics for chemotherapy-induced nausea and vomiting occurring despite prophylactic antiemetic therapy. J Palliat Med. 2011;14(7):810-814.
- Shoemaker LK, Estfan B, Induru R, Walsh TD. Symptom management: an important part of cancer care. Cleve Clin J Med. 2011;78(1):25-34.
- Harris DG. Nausea and vomiting in advanced cancer. Br Med Bull. 2010;96:175-185.
- Hocking CM, Kichenadasse G. Olanzapine for chemotherapy-induced nausea and vomiting: a systematic review. Support Care Cancer. 2014;22(4):1143-1151.
- Hesketh PJ. Chemotherapy-induced nausea and vomiting. N Engl J Med. 2008;358(23):2482-2494.
- Dennis K, Poon M, Chow E. Nausea and vomiting induced by gastrointestinal radiation therapy: current status and future directions. Curr Opin Support Palliat Care. 2015;9(2):182-188.
- Rangwala F, Zafar SY, Abernethy AP. Gastrointestinal symptoms in cancer patients with advanced disease: new methodologies, insights, and a proposed approach. Curr Opin Support Palliat Care. 2012;6(1):69-76.
- Laugsand EA, Kaasa S, Klepstad P. Management of opioid-induced nausea and vomiting in cancer patients: systematic review and evidence-based recommendations. Palliat Med. 2011;25(5):442-453.
- Kim SW, Shin IS, Kim JM, et al. Mirtazapine for severe gastroparesis unresponsive to conventional prokinetic treatment. Psychosomatics. 2006;47(5):440-442.
- McLean SL, Blenkinsopp A, Bennett MI. Using haloperidol as an antiemetic in palliative care: informing practice through evidence from cancer treatment and postoperative contexts. J Pain Palliat Care Pharmacother. 2013;27(2):132-135.
- Aapro M, Carides A, Rapoport BL, Schmoll HJ, Zhang L, Warr D. Aprepitant and fosaprepitant: a 10-year review of efficacy and safety. Oncologist. 2015;20(4)450-458.
- Soga T, Kume K, Kakuta N, et al. Fosaprepitant versus ondansetron for the prevention of postoperative nausea and vomiting in patients who undergo gynecologic abdominal surgery with patient-controlled epidural analgesia: a prospective, randomized, double-blind study. J Anesth. 2015;29(5):696-701.
- Abramovitz RB, Gaertner KM. The role of netupitant and palonosetron in chemotherapy-induced nausea and vomiting [published online ahead of print April 24, 2015]. J Oncol Pharm Pract. doi:10.1177/1078155215581525.
- Pisanti S, Malfitano AM, Grimaldi C, et al. Use of cannabinoid receptor agonists in cancer therapy as palliative and curative agents. Best Pract Res Clin Endocrinol Metab. 2009;23(1):117-131.
- Ezzo JM, Richardson MA, Vickers A, et al: Acupuncture-point stimulation for chemotherapy-induced nausea or vomiting. Cochrane Database Syst Rev. 2006;19(2):CD002285.
- Ezzo J, Streitberger K, Schneider A. Cochrane systematic reviews examine P6 acupuncture-point stimulation for nausea and vomiting. J Altern Complement Med. 2006;12(5):489-495.
- Laval G, Marcelin-Benazech B, Guirimand F, et al; French Society for Palliative Care; French Society for Digestive Surgery; French Society for Gastroenterology; French Association for Supportive Care in Oncology; French Society for Digestive Cancer. Recommendations for bowel obstruction with peritoneal carcinomatosis. J Pain Symptom Manage. 2014;48(1):75-91.
- Navari RM. Treatment of breakthrough and refractory chemotherapy-induced nausea and vomiting. Biomed Res Int. 2015;2015:595894.
- Bleicher J, Bhaskara A, Huyck T, Constantino S, Bardia A, Loprinzi CL, et al. Lorazepam, diphenhydramine, and haloperidol transdermal gel for rescue from chemotherapy-induced nausea/vomiting: results of two pilot trials. J Support Oncol. 2008;6(1):27-32.

Case Report: Not Just Another Kidney Stone
Case
A 36-year-old woman with a 2-week history of left flank pain presented to the ED via emergency medical services. The patient, who had a history of nephrolithiasis, assumed her pain was due to another kidney stone. She stated that while waiting for the presumed stone to pass, the pain in her left flank worsened and she felt lightheaded and weak.
The patient’s vital signs at presentation were: heart rate, 96 beats/minute; blood pressure, 133/76 mm Hg; respiratory rate, 20 breaths/minute; and temperature, 98.9˚F. Oxygen saturation was 98% on room air. On physical examination, the patient had left lower quadrant pain and left costovertebral angle tenderness. Laboratory studies were remarkable for a negative urine pregnancy test, a hemoglobin level of 6.8 g/dL, and a hematocrit of 21.1%. Based on the patient’s history and symptoms, axial and coronal computed tomography (CT) scans were ordered, revealing a ruptured left renal calyx with hemorrhage from ureterolithiasis (Figures 1a and 1b).
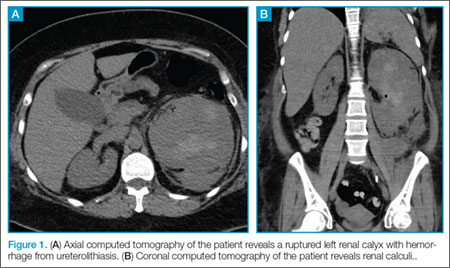
Rupture of renal calyx and extravasation of blood or urine is a potential complication of nephrolithiasis. Stone size, degree of obstruction, and length of symptomatic presentation presumably contribute to complications from nephrolithiasis. Stones that are symptomatic for more than 4 weeks are estimated to have an increased complication rate of up to 20%.1
Calyx or fornix rupture results from increased intraluminal pressure. Rupture of these structures is thought to be a type of “safety-valve” function to relieve obstructive uropathy.2
Obstructions from small leaks to large urinomas can cause extravasation of urine. In most cases, urinary extravasation is confined to the subcapsular space or perirenal space within the Gerota’s fascia;3 however, as seen in this patient, mixed hematoma/urinomas can form.
Causes
In cases of nontraumatic calyx rupture, the cause of the obstruction is most often a distal obstructing ureteral stone.4 Other causes of rupture include extrinsic compression from malignant and benign masses, ureteric junction obstructions, or iatrogenic causes.4 Interestingly, in one small study, the median size of the obstructing stone was only 4 mm. The same study also noted that proximal ureteral obstruction occurred when larger stones where present.4
Conservative Versus Nonconservative Management
Potential complications of urinomas include abscess formation, sepsis, hydronephrosis, and paralytic ileus.3 Despite possible adverse sequelae, uncomplicated urinomas may be managed conservatively with supportive care. According to a study by Chapman et al,5 about 40% of patients managed conservatively recover without complications. In addition, in a retrospective study by Doehn et al6 involving 160 cases of fornix rupture treated with endoscopic therapy or nephrostomy tube supplemented with antibiotics, no instances of perinephric abscess or other complications requiring a second procedure were noted.
Management of suspected ureterolithiasis in the ED is focused on analgesia and supportive care. Acute analgesia is often provided parenterally with opioids alone or with an opioid/nonsteroidal anti-inflammatory drug (NSAID) combination.7 Frequent reassessment of the patient is required to ensure adequate pain control and to prevent sedation. Other symptoms, such as nausea, vomiting, and dehydration, may be treated with intravenous (IV) fluids and antiemetic medications. Further radiographic evaluation is needed once analgesia is achieved.7,8
Imaging Studies
Radiological evaluation of patients with suspected ureterolithiasis may involve several imaging modalities. Noncontrast helical CT scan is the standard for rapid and efficient identification of ureteral stones while allowing visualization of other potential pathology (eg, urinoma).7-9 Other modalities, such as ultrasonography; radiography of the kidneys, ureters, and bladder; and an IV pyelogram with contrasted CT, may be ordered if noncontrast helical CT scan is not available on-site or if there are comorbidities. In addition to imaging studies, basic laboratory studies (eg, serum creatinine and blood urea nitrogen testing) are indicated to assess overall renal function and direct the choice of radiological study.7
Disposition
Clinical decision-making is key when recommending inpatient versus outpatient treatment in patients with ureterolithiasis. Patients with uncontrolled pain or vomiting may require inpatient admission for supportive care, while those demonstrating acute renal failure, pyuria with bacteriuria, complete bilateral ureteral obstruction, urinoma, or signs of sepsis demand emergent urology consultation. Specifically, patients with urinoma require ureteroscopy versus nephrostomy6,10 to allow drainage while carefully monitoring for development of subsequent bleeding and infection.
When discharging patients from the ED, expulsive therapy using tamsulosin9 and analgesia with combination of oral opioids and NSAIDs are most commonly effective.11 Outpatient urology referrals are recommended for ureteral stones greater than 5 mm in size or if the stones have been present in the ureter for greater than 4 weeks.1 Proper evaluation and management of ureterolithiasis in the ED is crucial for positive outcomes and to reduce long-term complications.
Case Conclusion
Computed tomography revealed a ruptured renal calyx on the left side with free fluid in the abdomen. Urology services were consulted and the patient was taken to the operating room for cystoscopy, ureteral stent placement, and laser lithotripsy. Following surgery, she subsequently developed urosepsis for which she was successfully treated with IV antibiotics and discharged on hospital day 15.
Mr Eisenstat is a fourth-year medical student at the University of South Carolina School of Medicine, Greenville. Dr Fabiano is an emergency physician, department of emergency medicine, Greenville Health Systems, Greenville, South Carolina. Dr Collins is family medicine physician, department of emergency medicine, Greenville Health Systems, Greenville, South Carolina.
- Hübner WA, Irby P, Stoller M. Natural history and current concepts for the treatment of small ureteral calculi. Eur Urol. 1993;24(2):172-176.
- Lin DY, Fang YC, Huang DY, Lin SP. Spontaneous rupture of the ureter secondary to urolithiasis and extravasation of calyceal fornix due to acute urinary bladder distension: four case reports. Chin J Radiology. 2004;29:269-275.
- Behzad-Noori M, Blandon JA, Negrin Exposito JE, Sarmiento JL, Dias AL, Hernandez GT. Urinoma: a rare complication from being between a rock and soft organ. El Paso Physician. 2010;33(6):5-6.
- Gershman B, Kulkarni N, Sahani DV, Eisner BH. Causes of renal forniceal rupture. BJU Int. 2011;108(11):1909-1911.
- Chapman JP, Gonzalez J, Diokno AC. Significance of urinary extravasation during renal colic. Urology. 1987;30(6):541-545.
- Doehn C, Fiola L, Peter M, Jocham D. Outcome analysis of fornix ruptures in 162 consecutive patients. J Endourol. 2010;24(11):1869-1873
- Portis AJ, Sundaram CP. Diagnosis and initial management of kidney stones. Am Fam Physician. 2001;63(7):1329-1338
- Smith RC, Verga M, Dalrymple N, McCarthy S, Rosenfield AT. Acute ureteral obstruction: value of secondary signs of helical unenhanced CT. AJR Am J Roentgenol. 1996;167(5):1109-1113.Burke TA, Wisniewski T, Ernst FR. Resource utilization and costs associated with chemotherapy-induced nausea and vomiting (CINV) following highly or moderately emetogenic chemotherapy administered in the US outpatient hospital setting. Support Care Cancer. 2011;19(1):131-140.
- Ha M, MacDonald RD. Impact of CT scan in patients with first episode of suspected nephrolithiasis. J Emerg Med. 2004;27(3):225-231.
- Tawfiek ER, Bagley DH. Management of upper urinary tract calculi with ureteroscopic techniques. Urology. 1999;53(1):25-31.
- Larkin GL, Peacock WF 4th, Pearl SM, Blair GA, D'Amico F. Efficacy of ketorolac tromethamine versus meperidine in the ED treatment of acute renal colic. Am J Emerg Med. 1999;17(1):6-10.
Case
A 36-year-old woman with a 2-week history of left flank pain presented to the ED via emergency medical services. The patient, who had a history of nephrolithiasis, assumed her pain was due to another kidney stone. She stated that while waiting for the presumed stone to pass, the pain in her left flank worsened and she felt lightheaded and weak.
The patient’s vital signs at presentation were: heart rate, 96 beats/minute; blood pressure, 133/76 mm Hg; respiratory rate, 20 breaths/minute; and temperature, 98.9˚F. Oxygen saturation was 98% on room air. On physical examination, the patient had left lower quadrant pain and left costovertebral angle tenderness. Laboratory studies were remarkable for a negative urine pregnancy test, a hemoglobin level of 6.8 g/dL, and a hematocrit of 21.1%. Based on the patient’s history and symptoms, axial and coronal computed tomography (CT) scans were ordered, revealing a ruptured left renal calyx with hemorrhage from ureterolithiasis (Figures 1a and 1b).
Rupture of renal calyx and extravasation of blood or urine is a potential complication of nephrolithiasis. Stone size, degree of obstruction, and length of symptomatic presentation presumably contribute to complications from nephrolithiasis. Stones that are symptomatic for more than 4 weeks are estimated to have an increased complication rate of up to 20%.1
Calyx or fornix rupture results from increased intraluminal pressure. Rupture of these structures is thought to be a type of “safety-valve” function to relieve obstructive uropathy.2
Obstructions from small leaks to large urinomas can cause extravasation of urine. In most cases, urinary extravasation is confined to the subcapsular space or perirenal space within the Gerota’s fascia;3 however, as seen in this patient, mixed hematoma/urinomas can form.
Causes
In cases of nontraumatic calyx rupture, the cause of the obstruction is most often a distal obstructing ureteral stone.4 Other causes of rupture include extrinsic compression from malignant and benign masses, ureteric junction obstructions, or iatrogenic causes.4 Interestingly, in one small study, the median size of the obstructing stone was only 4 mm. The same study also noted that proximal ureteral obstruction occurred when larger stones where present.4
Conservative Versus Nonconservative Management
Potential complications of urinomas include abscess formation, sepsis, hydronephrosis, and paralytic ileus.3 Despite possible adverse sequelae, uncomplicated urinomas may be managed conservatively with supportive care. According to a study by Chapman et al,5 about 40% of patients managed conservatively recover without complications. In addition, in a retrospective study by Doehn et al6 involving 160 cases of fornix rupture treated with endoscopic therapy or nephrostomy tube supplemented with antibiotics, no instances of perinephric abscess or other complications requiring a second procedure were noted.
Management of suspected ureterolithiasis in the ED is focused on analgesia and supportive care. Acute analgesia is often provided parenterally with opioids alone or with an opioid/nonsteroidal anti-inflammatory drug (NSAID) combination.7 Frequent reassessment of the patient is required to ensure adequate pain control and to prevent sedation. Other symptoms, such as nausea, vomiting, and dehydration, may be treated with intravenous (IV) fluids and antiemetic medications. Further radiographic evaluation is needed once analgesia is achieved.7,8
Imaging Studies
Radiological evaluation of patients with suspected ureterolithiasis may involve several imaging modalities. Noncontrast helical CT scan is the standard for rapid and efficient identification of ureteral stones while allowing visualization of other potential pathology (eg, urinoma).7-9 Other modalities, such as ultrasonography; radiography of the kidneys, ureters, and bladder; and an IV pyelogram with contrasted CT, may be ordered if noncontrast helical CT scan is not available on-site or if there are comorbidities. In addition to imaging studies, basic laboratory studies (eg, serum creatinine and blood urea nitrogen testing) are indicated to assess overall renal function and direct the choice of radiological study.7
Disposition
Clinical decision-making is key when recommending inpatient versus outpatient treatment in patients with ureterolithiasis. Patients with uncontrolled pain or vomiting may require inpatient admission for supportive care, while those demonstrating acute renal failure, pyuria with bacteriuria, complete bilateral ureteral obstruction, urinoma, or signs of sepsis demand emergent urology consultation. Specifically, patients with urinoma require ureteroscopy versus nephrostomy6,10 to allow drainage while carefully monitoring for development of subsequent bleeding and infection.
When discharging patients from the ED, expulsive therapy using tamsulosin9 and analgesia with combination of oral opioids and NSAIDs are most commonly effective.11 Outpatient urology referrals are recommended for ureteral stones greater than 5 mm in size or if the stones have been present in the ureter for greater than 4 weeks.1 Proper evaluation and management of ureterolithiasis in the ED is crucial for positive outcomes and to reduce long-term complications.
Case Conclusion
Computed tomography revealed a ruptured renal calyx on the left side with free fluid in the abdomen. Urology services were consulted and the patient was taken to the operating room for cystoscopy, ureteral stent placement, and laser lithotripsy. Following surgery, she subsequently developed urosepsis for which she was successfully treated with IV antibiotics and discharged on hospital day 15.
Mr Eisenstat is a fourth-year medical student at the University of South Carolina School of Medicine, Greenville. Dr Fabiano is an emergency physician, department of emergency medicine, Greenville Health Systems, Greenville, South Carolina. Dr Collins is family medicine physician, department of emergency medicine, Greenville Health Systems, Greenville, South Carolina.
- Hübner WA, Irby P, Stoller M. Natural history and current concepts for the treatment of small ureteral calculi. Eur Urol. 1993;24(2):172-176.
- Lin DY, Fang YC, Huang DY, Lin SP. Spontaneous rupture of the ureter secondary to urolithiasis and extravasation of calyceal fornix due to acute urinary bladder distension: four case reports. Chin J Radiology. 2004;29:269-275.
- Behzad-Noori M, Blandon JA, Negrin Exposito JE, Sarmiento JL, Dias AL, Hernandez GT. Urinoma: a rare complication from being between a rock and soft organ. El Paso Physician. 2010;33(6):5-6.
- Gershman B, Kulkarni N, Sahani DV, Eisner BH. Causes of renal forniceal rupture. BJU Int. 2011;108(11):1909-1911.
- Chapman JP, Gonzalez J, Diokno AC. Significance of urinary extravasation during renal colic. Urology. 1987;30(6):541-545.
- Doehn C, Fiola L, Peter M, Jocham D. Outcome analysis of fornix ruptures in 162 consecutive patients. J Endourol. 2010;24(11):1869-1873
- Portis AJ, Sundaram CP. Diagnosis and initial management of kidney stones. Am Fam Physician. 2001;63(7):1329-1338
- Smith RC, Verga M, Dalrymple N, McCarthy S, Rosenfield AT. Acute ureteral obstruction: value of secondary signs of helical unenhanced CT. AJR Am J Roentgenol. 1996;167(5):1109-1113.Burke TA, Wisniewski T, Ernst FR. Resource utilization and costs associated with chemotherapy-induced nausea and vomiting (CINV) following highly or moderately emetogenic chemotherapy administered in the US outpatient hospital setting. Support Care Cancer. 2011;19(1):131-140.
- Ha M, MacDonald RD. Impact of CT scan in patients with first episode of suspected nephrolithiasis. J Emerg Med. 2004;27(3):225-231.
- Tawfiek ER, Bagley DH. Management of upper urinary tract calculi with ureteroscopic techniques. Urology. 1999;53(1):25-31.
- Larkin GL, Peacock WF 4th, Pearl SM, Blair GA, D'Amico F. Efficacy of ketorolac tromethamine versus meperidine in the ED treatment of acute renal colic. Am J Emerg Med. 1999;17(1):6-10.

2015 Update on pelvic floor dysfunction: Bladder pain syndrome
Interstitial cystitis (IC) is a debilitating disease that presents with a constellation of symptoms, including pain, urinary urgency, frequency, nocturia, and small voided volumes in the absence of other identifiable etiologies.1 The overall prevalence of IC among US women is between 2.7% and 6.5%—affecting approximately 3.3 to 7.9 million women2—and it results in substantial costs1,3 and impairments in health-related quality of life.4 Unfortunately, there is a lack of consensus on the pathophysiology and etiology of this prevalent and costly disorder. Thus, therapies are often empiric, with limited evidence and variable levels of improvement.5
There has been no clear evidence that bladder inflammation (cystitis) is involved in the etiology or pathophysiology of the condition. As a result, there has been a movement to rename it “bladder pain syndrome.” Current literature refers to the spectrum of symptoms as interstitial cystitis/bladder pain syndrome (IC/BPS).
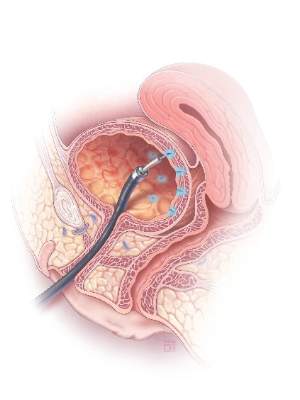
Currently, the American Urological Association (AUA) defines IC/BPS as an unpleasant sensation (pain, pressure, discomfort) perceived to be related to the urinary bladder, associated with lower urinary tract symptoms of more than 6 weeks’ duration, in the absence of infection or other identifiable causes.6 This is still a broad, clinical diagnosis that has significant overlap with other pain syndromes but allows for treatment to begin after a relatively short symptomatic period.7 Because gynecologists are frequently the main care providers for women, understanding the diagnosis and treatment options for IC/BPS is important to avoid delayed treatment in a difficult to diagnose population.
Recently, the AUA published an amendment to their 2011 management guidelines to provide direction to clinicians and patients regarding how to recognize IC/BPS, conduct valid diagnostic testing, and approach treatment with the goals of maximizing symptom control and patient quality of life.7
In this article, we review the AUA diagnostic and treatment algorithms and the results of recently published randomized trials comparing the efficacy of various treatment modalities for IC/BPS, including pentosoan polysulfate sodium (PPS; Elmiron, Janssen Pharmaceuticals, Titusville, New Jersey) and botulinum toxin (Botox, Allergan, Irvine, California) with hydrodistension.
Hanno PM, Erickson D, Moldwin R, Faraday MM; American Urological Association. Diagnosis and treatment of interstitial cystitis/bladder pain syndrome: AUA guideline amendment. J Urol. 2015;193(5):1545−1553.
The diagnosis of IC/BPS can be challenging due to a wide spectrum of symptoms, physical examination findings, and clinical test responses. The AUA developed its diagnostic and treatment guidelines mostly based on expert opinion, but they do provide a framework to help clinicians determine whether or not treatment for IC/BPS is warranted. The primary principles for evaluation are presented in FIGURE 1.
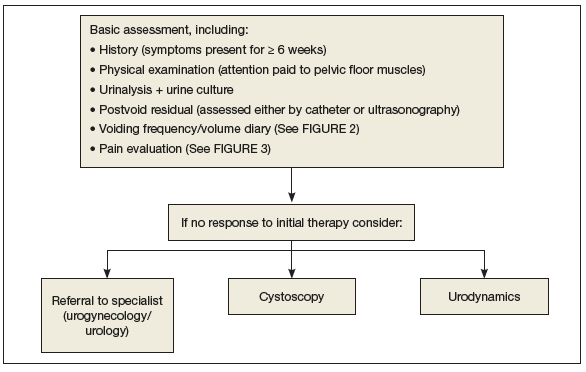
It is important to establish baseline voiding symptoms and pain levels with objective, validated instruments, including a voiding diary (FIGURE 2)9 and such patient questionnaires as the O’Leary Sant Interstitial Cystitis Index (ICSI; FIGURE 3).10 Characteristic IC/BPS voiding frequency is 10 or more times per day (to relieve pain, not to relieve a fear of wetting, which would be expected in a patient with overactive bladder).8 The ICSI questionnaire should be used primarily to establish baseline symptoms, not as a diagnostic tool. A score higher than 8 has been used as inclusion criteria for therapeutic trials, however.11
FIGURE 2 Voiding diary9
|
FIGURE 3 O’Leary Sant Interstitial Cystitis Index10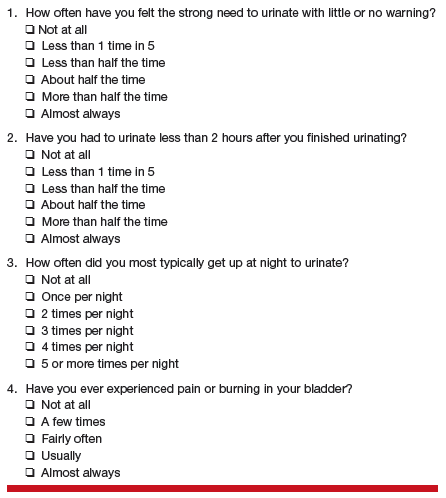
|
It is unnecessary to primarily perform cystoscopy or urodynamics, as there are no agreed-upon diagnostic criteria for these modalities for IC/BPS. They may be considered, however, if the patient does not respond to first- and second-line therapies. Additionally, potassium sensitivity testing is painful and, in view of the paucity of benefits, the risk/benefit ratio is too high to recommend for clinical care.
Treatment: Conservative first
The treatment for IC/BPS should start with more conservative therapy (including behavioral management and physical therapy). If symptom control is inadequate, other modalities should be employed. Behavioral modifications should include:
- local heat/cold over the bladder and perineum
- avoidance of foods and fluids that are known to be common irritants (such as coffee and citrus)
- trial of elimination diet
- bladder training with urge suppression techniques.
As noted in FIGURE 1, first make sure that patients do not have a urinary tract infection. If culture results are negative and other criteria fit, consider the diagnosis of IC/BPS and offer therapies as outlined in the treat‑ ment algorithm (FIGURE 4).7 Repeated treatment for negative results of urine cultures in patients with frequency, urgency, and bladder pain can lead to unnecessary antibiotics and delayed treatment of IC/BPS.
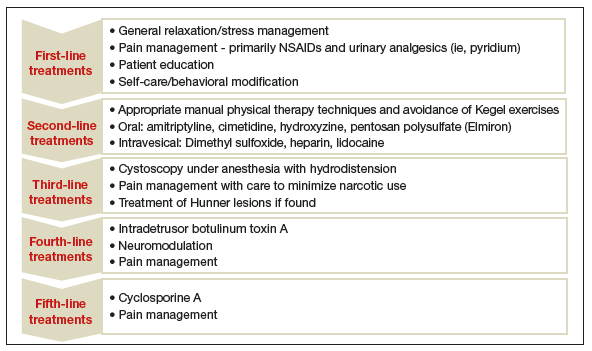
Treatments in FIGURE 4 are ordered from most to least conservative, and initial treatment depends on symptom severity, clinician judgment, and patient preference. If at any point in the patient’s care the diagnosis is questioned or treatments have been ineffective, referral to a specialist, including urogynecology or urology, may be appropriate.
Managing pain
Pain management is an important component at all levels of therapy, and pharmacologic pain management principles for
IC/BPS should be similar to those for management of other chronic pain states. Options primarily include nonsteroidal anti-
inflammatory drugs (NSAIDs) and urinary analgesics (pyridium). The use of narcotics presents the risks of tolerance and dependence. If their use is necessary, all narcotic prescriptions must come from a single source and should be used as a component of multimodality therapy to minimize narcotic use.
- Anger JT, Zabihi N, Clemens JQ, Payne CK, Saigal CS, Rodriguez LV. Treatment choice, duration, and cost in patients with interstitial cystitis and painful bladder syndrome. Int Urogynecol J. 2011;22(4):395–400.
- Berry SH, Elliott MN, Suttorp M, et al. Prevalence of symptoms of bladder pain syndrome/interstitial cystitis among adult females in the United States. J Urol. 2011;186(2):540–544.
- Payne CK, Joyce GF, Wise M, Clemens JQ; Urologic Diseases in America Project. Interstitial cystitis and painful bladder syndrome. J Urol. 2007;177(6):2042–2049.
- Nickel JC, Payne CK, Forrest J, Parsons CL, Wan GJ, Xiao X. The relationship among symptoms, sleep disturbances and quality of life in patients with interstitial cystitis. J Urol. 2009;181(6):2555–2561.
- Giannantoni A, Bini V, Dmochowski R, et al. Contemporary management of the painful bladder: a systematic review. Eur Urol. 2012;61(1):29–53.
- Hanno P, Dmochowski R. Status of international consensus on interstitial cystitis/bladder pain syndrome/painful bladder syndrome: 2008 snapshot. Neurourol Urodyn. 2009;28(4):274–286.
- Hanno PM, Erickson D, Moldwin R, Faraday MM; American Urological Association. Diagnosis and treatment of interstitial cystitis/bladder pain syndrome: AUA guideline amendment. J Urol. 2015;193(5):1545–1553.
- Hanno PM, Burks DA, Clemens JQ, et al; Interstitial Cystitis Guidelines Panel of the American Urological Association Education and Research, Inc. AUA guideline for the diagnosis and treatment of interstitial cystitis/bladder pain syndrome. J Urol. 2011;185(6):2162–2170.
- Boudry G, Labat JJ, Riant T, et al. Validation of voiding diary for stratification of bladder pain syndrome according to the presence/absence of cystoscopic abnormalities: a two-centre prospective study. BJU Int. 2013;112(2):E164−168.
- O’Leary MP, Sant GR, Fowler FJ Jr, Whitmore KE, Spolarish-Kroll J. The interstitial cystitis symptom index and problem index. Urology. 1997;49(5A suppl):58–63.
- Nickel JC, Herschom S, Whitmore KE, et al. Pentosan polysulfate sodium for treatment of interstitial cystitis/bladder pain syndrome: insights from a randomized, double-blind, placebo-controlled study. J Urol. 2015;193(3):857–862.
- Nickel JC, Barkin J, Forrest J, et al; Elmiron Study Group. Randomized, double-blind, dose-ranging study of pentosan polysulfate sodium for interstitial cystitis. Urology. 2005;65(4):654–658.
- Visco AG, Brubaker L, Richter HE, et al; Pelvic Floor Disorders Network. Anticholinergic versus botulinum toxin A comparison trial for the treatment of bothersome urge urinary incontinence: ABC trial. Contemp Clin Trials, 2012;33(1):184–196.
Cindy L. Amundsen, MD, and Megan Bradley, MD

Dr. Amundsen is Roy T. Parker Professor of Obstetrics and Gynecology, Division of Urogynecology and Reconstructive Pelvic Surgery, and Associate Professor of Surgery, Division of Urology, at Duke University Medical Center, Durham, North Carolina.

Dr. Bradley is Fellow, Obstetrics and Gynecology, Division of Urogynecology and Reconstructive Pelvic Surgery, at Duke University Medical Center.
The authors report no financial relationships relevant to this article.
Cindy L. Amundsen, MD, and Megan Bradley, MD
Dr. Amundsen is Roy T. Parker Professor of Obstetrics and Gynecology, Division of Urogynecology and Reconstructive Pelvic Surgery, and Associate Professor of Surgery, Division of Urology, at Duke University Medical Center, Durham, North Carolina.
Dr. Bradley is Fellow, Obstetrics and Gynecology, Division of Urogynecology and Reconstructive Pelvic Surgery, at Duke University Medical Center.
The authors report no financial relationships relevant to this article.
Interstitial cystitis (IC) is a debilitating disease that presents with a constellation of symptoms, including pain, urinary urgency, frequency, nocturia, and small voided volumes in the absence of other identifiable etiologies.1 The overall prevalence of IC among US women is between 2.7% and 6.5%—affecting approximately 3.3 to 7.9 million women2—and it results in substantial costs1,3 and impairments in health-related quality of life.4 Unfortunately, there is a lack of consensus on the pathophysiology and etiology of this prevalent and costly disorder. Thus, therapies are often empiric, with limited evidence and variable levels of improvement.5
There has been no clear evidence that bladder inflammation (cystitis) is involved in the etiology or pathophysiology of the condition. As a result, there has been a movement to rename it “bladder pain syndrome.” Current literature refers to the spectrum of symptoms as interstitial cystitis/bladder pain syndrome (IC/BPS).
Currently, the American Urological Association (AUA) defines IC/BPS as an unpleasant sensation (pain, pressure, discomfort) perceived to be related to the urinary bladder, associated with lower urinary tract symptoms of more than 6 weeks’ duration, in the absence of infection or other identifiable causes.6 This is still a broad, clinical diagnosis that has significant overlap with other pain syndromes but allows for treatment to begin after a relatively short symptomatic period.7 Because gynecologists are frequently the main care providers for women, understanding the diagnosis and treatment options for IC/BPS is important to avoid delayed treatment in a difficult to diagnose population.
Recently, the AUA published an amendment to their 2011 management guidelines to provide direction to clinicians and patients regarding how to recognize IC/BPS, conduct valid diagnostic testing, and approach treatment with the goals of maximizing symptom control and patient quality of life.7
In this article, we review the AUA diagnostic and treatment algorithms and the results of recently published randomized trials comparing the efficacy of various treatment modalities for IC/BPS, including pentosoan polysulfate sodium (PPS; Elmiron, Janssen Pharmaceuticals, Titusville, New Jersey) and botulinum toxin (Botox, Allergan, Irvine, California) with hydrodistension.
Hanno PM, Erickson D, Moldwin R, Faraday MM; American Urological Association. Diagnosis and treatment of interstitial cystitis/bladder pain syndrome: AUA guideline amendment. J Urol. 2015;193(5):1545−1553.
The diagnosis of IC/BPS can be challenging due to a wide spectrum of symptoms, physical examination findings, and clinical test responses. The AUA developed its diagnostic and treatment guidelines mostly based on expert opinion, but they do provide a framework to help clinicians determine whether or not treatment for IC/BPS is warranted. The primary principles for evaluation are presented in FIGURE 1.
It is important to establish baseline voiding symptoms and pain levels with objective, validated instruments, including a voiding diary (FIGURE 2)9 and such patient questionnaires as the O’Leary Sant Interstitial Cystitis Index (ICSI; FIGURE 3).10 Characteristic IC/BPS voiding frequency is 10 or more times per day (to relieve pain, not to relieve a fear of wetting, which would be expected in a patient with overactive bladder).8 The ICSI questionnaire should be used primarily to establish baseline symptoms, not as a diagnostic tool. A score higher than 8 has been used as inclusion criteria for therapeutic trials, however.11
| FIGURE 2 Voiding diary9
|
| FIGURE 3 O’Leary Sant Interstitial Cystitis Index10
|
It is unnecessary to primarily perform cystoscopy or urodynamics, as there are no agreed-upon diagnostic criteria for these modalities for IC/BPS. They may be considered, however, if the patient does not respond to first- and second-line therapies. Additionally, potassium sensitivity testing is painful and, in view of the paucity of benefits, the risk/benefit ratio is too high to recommend for clinical care.
Treatment: Conservative first
The treatment for IC/BPS should start with more conservative therapy (including behavioral management and physical therapy). If symptom control is inadequate, other modalities should be employed. Behavioral modifications should include:
- local heat/cold over the bladder and perineum
- avoidance of foods and fluids that are known to be common irritants (such as coffee and citrus)
- trial of elimination diet
- bladder training with urge suppression techniques.
As noted in FIGURE 1, first make sure that patients do not have a urinary tract infection. If culture results are negative and other criteria fit, consider the diagnosis of IC/BPS and offer therapies as outlined in the treat‑ ment algorithm (FIGURE 4).7 Repeated treatment for negative results of urine cultures in patients with frequency, urgency, and bladder pain can lead to unnecessary antibiotics and delayed treatment of IC/BPS.
Treatments in FIGURE 4 are ordered from most to least conservative, and initial treatment depends on symptom severity, clinician judgment, and patient preference. If at any point in the patient’s care the diagnosis is questioned or treatments have been ineffective, referral to a specialist, including urogynecology or urology, may be appropriate.
Managing pain
Pain management is an important component at all levels of therapy, and pharmacologic pain management principles for
IC/BPS should be similar to those for management of other chronic pain states. Options primarily include nonsteroidal anti-
inflammatory drugs (NSAIDs) and urinary analgesics (pyridium). The use of narcotics presents the risks of tolerance and dependence. If their use is necessary, all narcotic prescriptions must come from a single source and should be used as a component of multimodality therapy to minimize narcotic use.
- Anger JT, Zabihi N, Clemens JQ, Payne CK, Saigal CS, Rodriguez LV. Treatment choice, duration, and cost in patients with interstitial cystitis and painful bladder syndrome. Int Urogynecol J. 2011;22(4):395–400.
- Berry SH, Elliott MN, Suttorp M, et al. Prevalence of symptoms of bladder pain syndrome/interstitial cystitis among adult females in the United States. J Urol. 2011;186(2):540–544.
- Payne CK, Joyce GF, Wise M, Clemens JQ; Urologic Diseases in America Project. Interstitial cystitis and painful bladder syndrome. J Urol. 2007;177(6):2042–2049.
- Nickel JC, Payne CK, Forrest J, Parsons CL, Wan GJ, Xiao X. The relationship among symptoms, sleep disturbances and quality of life in patients with interstitial cystitis. J Urol. 2009;181(6):2555–2561.
- Giannantoni A, Bini V, Dmochowski R, et al. Contemporary management of the painful bladder: a systematic review. Eur Urol. 2012;61(1):29–53.
- Hanno P, Dmochowski R. Status of international consensus on interstitial cystitis/bladder pain syndrome/painful bladder syndrome: 2008 snapshot. Neurourol Urodyn. 2009;28(4):274–286.
- Hanno PM, Erickson D, Moldwin R, Faraday MM; American Urological Association. Diagnosis and treatment of interstitial cystitis/bladder pain syndrome: AUA guideline amendment. J Urol. 2015;193(5):1545–1553.
- Hanno PM, Burks DA, Clemens JQ, et al; Interstitial Cystitis Guidelines Panel of the American Urological Association Education and Research, Inc. AUA guideline for the diagnosis and treatment of interstitial cystitis/bladder pain syndrome. J Urol. 2011;185(6):2162–2170.
- Boudry G, Labat JJ, Riant T, et al. Validation of voiding diary for stratification of bladder pain syndrome according to the presence/absence of cystoscopic abnormalities: a two-centre prospective study. BJU Int. 2013;112(2):E164−168.
- O’Leary MP, Sant GR, Fowler FJ Jr, Whitmore KE, Spolarish-Kroll J. The interstitial cystitis symptom index and problem index. Urology. 1997;49(5A suppl):58–63.
- Nickel JC, Herschom S, Whitmore KE, et al. Pentosan polysulfate sodium for treatment of interstitial cystitis/bladder pain syndrome: insights from a randomized, double-blind, placebo-controlled study. J Urol. 2015;193(3):857–862.
- Nickel JC, Barkin J, Forrest J, et al; Elmiron Study Group. Randomized, double-blind, dose-ranging study of pentosan polysulfate sodium for interstitial cystitis. Urology. 2005;65(4):654–658.
- Visco AG, Brubaker L, Richter HE, et al; Pelvic Floor Disorders Network. Anticholinergic versus botulinum toxin A comparison trial for the treatment of bothersome urge urinary incontinence: ABC trial. Contemp Clin Trials, 2012;33(1):184–196.
In this Article
- AUA diagnosis guidelines
- Treatment algorithm
- A new FDA-approved oral treatment option
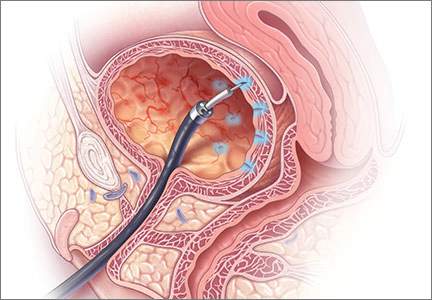
Manual vacuum aspiration: A safe and effective treatment for early miscarriage
Case Miscarriage in a 29-year-old woman
A woman (G0P0) presents to her gynecologist with amenorrhea for 3 months and a positive home urine pregnancy test. She is 29 years of age. She denies any bleeding or pain and intends to continue the pregnancy, though it was unplanned. Results of office ultrasonography to assess fetal viability reveal an intrauterine gestation with an 8-mm fetal pole but no heartbeat. The diagnosis is miscarriage.
This case illustrates a typical miscarriage diagnosis; most women with miscarriage are asymptomatic and without serious bleeding requiring emergency intervention. The management options include surgical, medical, and expectant. Women should be offered all 3 of these, and clinicians should explain the risks and benefits of each approach. But while each strategy can be safe, effective, and acceptable, many women, as well as their health care providers, will benefit from office-based uterine aspiration. In this article, we present the data available on office-based manual vacuum aspiration (MVA) as well as procedure pointers and urge you to consider MVA in your practice for your patients.
Surgical management
Surgical management of miscarriage offers several clear advantages over medical and expectant management. Perhaps the most important advantage to patients is that surgery offers rapid resolution of miscarriage with the shortest duration of bleeding.1,2 When skilled providers perform electric vacuum aspiration (EVA) or MVA in outpatient or emergency department settings, successful uterine evacuation is completed in a single medical encounter 99% of the time.1 By comparison, several follow-up visits and additional ultrasounds may be required during medical or expectant management. Uterine aspiration rarely requires an operating room (OR). Such a setting should be limited to cases in which the clinical picture reflects:
- hemodynamic instability with active uterine bleeding
- serious uterine infection
- the presence of medical comorbidities in patients who may benefit from additional blood bank and anesthesia resources.
Office-based MVA
Office-based MVA is well tolerated when performed using a combination of verbal distraction and reassurance, oral nonsteroidal anti-inflammatory drugs (NSAIDs), and a paracervical block with or without intravenous sedation.
Evidence on managing pain at MVA. Multiple studies have assessed preprocedure and postprocedure pain using NSAIDs, oral anxiolytics, and local anesthesia at the time of EVA or MVA.3,4 Renner and colleagues found that women who received a paracervical block prior to MVA or EVA reported moderate levels of pain, according to a 100-point visual analogue scale (VAS), at the time of cervical dilation (mean, 42) and uterine aspiration (mean, 63).4 In this same study, patients’ willingness to treat a future pregnancy with EVA or MVA using local anesthesia and their overall satisfaction with the procedure was high (mean, 90 on 100-point VAS).
In-office advantages over the OR. Women and clinicians can avoid the extensive scheduling delays associated with ORs, as well as the complications associated with medical and expectant management, if office-based EVA and MVA services are readily available. Compared with surgical management of miscarriage in an OR, office-based EVA and MVA are faster to complete. For example, Dalton and colleagues compared patients undergoing first-trimester procedures in an office setting with those undergoing a procedure in an OR. The mean procedure time for women treated in an office was 10 minutes, compared with 19 minutes for women treated in the OR. In addition, women treated in an office setting spent a mean total of 97 minutes at the office; women treated in an OR spent a mean total of 290 minutes at the hospital.5
Patients’ satisfaction with care provided in the OR was comparable to patients’ satisfaction with care provided in a medical office. In fact, the median total satisfaction score was high among women who had a procedure in either setting (office score, 19 of 20; OR score, 20 of 20).
Cost and equipment for in-office MVA
Office-based surgical management of miscarriage is more cost-effective than OR-based management. In 2006, Dalton and colleagues conducted a cost analysis and found that average charges for office-based MVA were less than half the cost of charges for a dilation and curettage (D&C) in the OR ($968 vs $1,965, respectively).5
More recently, these researchers found that usual care (expectant or OR management) was more costly than a model that also included medical and office-based surgical options. They found that the expanded care model—with use of the OR only when needed—cost $1,033.29 per case. This was compared with $1,247.58 per case when management options did not include medical and office-based surgical treatments.6
The cost of supplies needed to initiate MVA services within an established outpatient gynecologist’s office is modest. Equipment includes manual vacuum aspirators; disposable cannulae of various sizes; reusable plastic or metal dilators; supplies for disinfection, allowing reuse of MVA aspirators; and supplies for examination of products of conception (POC; FIGURE 1).

According to WomanCare Global, manufacturer of the IPAS MVA Plus, equipment should be sterilized after each use with soap and water, medical cleaning solution (such as Cidex, SPOROX II, etc.), or autoclaving.7 If 2 reusable aspirators are purchased along with dilators, disposable cannulae, and tools for tissue assessment, the price of supplies is estimated at US $500.8 WomanCare Global also offers prepackaged, single-use aspirator kits, which may be ideal for the emergency department setting.9
The procedure
To view a video on the MVA device and procedure, including step-by-step technique (FIGURE 2), local anesthesia administration, choosing cannula size, and cervical dilation, visit the Managing Early Pregnancy Loss Web site (http://www.earlypregnancylossresources.org) and access “Videos.” The video “Uterine aspiration for EPL” is available under password protection and broken into chapters for viewing ease.
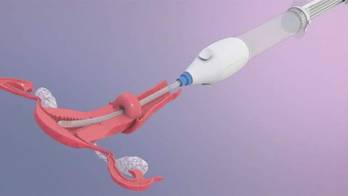
The risk of endometritis after surgical management of miscarriage is low. Antibiotic prophylaxis prior to MVA or EVA should be considered. Experts recommend giving a single dose of doxycycline 200 mg orally at least 1 hour prior to uterine aspiration.2,10
Use of EVA or MVA for outpatient management of miscarriage yields the opportunity to conduct immediate gross examination of the evacuated tissue and to verify the presence of complete POC. The process is simple: rinse the specimen through a sieve with water or saline, placed in a clear glass container under a small water bath and backlit on a light box. This allows clinicians to separate uterine decidua and pregnancy tissues. “Floating” tissue in this manner is especially useful in patients with pregnancy of unknown location, as immediate confirmation of a gestational sac rules out ectopic pregnancy.
Examine evacuated tissue for macroscopic evidence of pregnancy. Chorionic villi, which arise from syncytiotrophoblasts, can be seen with the naked eye. Immediate evaluation of POC is also useful for patients who desire diagnostic testing to ascertain a cause of their miscarriage because evacuated tissue stored in saline may be sent to a laboratory for cytogenetic analysis.
Medical management
Management of miscarriage with misoprostol is also safe and acceptable to women, though it has a lower success rate than surgical management.
Comparing efficacy: Medical vs surgical management. The Management of Early Pregnancy Failure Trial (MEPF) is the largest randomized controlled trial comparing medical management of miscarriage to surgical management. This multicenter study compared treatment with office-based EVA or MVA to vaginal misoprostol 800 µg. A repeat dose of vaginal misoprostol was offered 48 hours after the initial dose if a gestational sac was present on ultrasound.
Findings from the MEPF trial revealed a 71% complete uterine evacuation rate after 1 dose of misoprostol and an 84% rate after 2 doses.1 The average (SD) reported pain score documented within 48 hours of treatment with misoprostol or MVA/EVA was moderate (5.7 cm [2.4] on 10-cm VAS). The rate of infection or hospitalization was less than 1% in both treatment groups.
These data should provide patients who are clinically stable and who wish to avoid an invasive procedure reassurance that using medication for the management of miscarriage is a reasonable option.
Misoprostol. Use of misoprostol is associated with a longer median duration of bleeding compared with suction aspiration. After misoprostol, bleeding usually begins after several hours and may continue for weeks.11 Based on 2-week prospective bleeding diary entries from the MEPF trial, women who used misoprostol for management of miscarriage were more likely to have any bleeding during the 2 weeks after initiation of treatment, compared with women who had suction aspiration.12
Clinically significant changes in hemoglobin levels are more common in women treated with misoprostol than in those who choose EVA or MVA; however, these differences rarely require hospitalization or transfusion.1 Women who are considering use of misoprostol should be aware of common adverse effects, including nausea, vomiting, diarrhea, and low-grade temperature.
Medical management of miscarriage requires multiple office visits with repeat ultrasounds or serum beta–human chorionic gonadotropin (β-hCG) levels to confirm treatment success. In cases of medication failure (persistent gestational sac with or without bleeding) or suspected retained POC (endometrial stripe greater than 30 mm measured on ultrasound or persistent vaginal bleeding remote from treatment), women should be prepared for surgical resolution of pregnancy and clinicians should be able to perform an office-based procedure.
Expectant management
Women who choose the “watch and wait” approach should be advised that the process is unpredictable and occasionally requires urgent surgical intervention. Successful resolution of pregnancies that are expectantly managed depends on the type of miscarriage diagnosed at initial presentation. Luise and colleagues conducted a prospective study of 451 women with miscarriage who declined medical and surgical management. They found that the watch-and-wait approach was successful in 91% of women with an incomplete abortion, 76% of women with missed abortion, and 66% of women with anembryonic pregnancies.13 Success was defined by the absence of vaginal bleeding and an anterior-posterior endometrial stripe measuring less than 15 mm 4 weeks after initial diagnosis of miscarriage.
Like medical management for miscarriage, expectant management requires multiple office visits plus repeat ultrasounds or β-hCG measurement trends to confirm treatment success. Women who fail expectant management will require medical or surgical intervention to resolve the pregnancy. For those who are seeking pregnancy right away, the unpredictability and longer time to resolution of miscarriage may render expectant management anxiety provoking and unacceptable.
Etiology: Do true and perceived causes match?
Miscarriage during the first 13 weeks of gestation occurs in at least 10% of all clinically diagnosed pregnancies.10 A recent survey administered by Bardos and colleagues
assessed perceived prevalence and causes of miscarriage in more than 1,000 US men and women.14 The majority of respondents believed miscarriage is uncommon, occurring in less than 5% of pregnancies. Respondents also believed stressful events, lifting heavy objects, and prior use of intrauterine or hormonal contraception are often to blame for pregnancy loss.
Despite more than 3 decades of data confirming that more than 60% of early losses are associated with chromosomal abnormalities and that an additional 18% may be associated with fetal anomalies, women often blame themselves.15 Bardos and colleagues found that 47% of women felt guilty about the experience of miscarriage.
Diagnosis: Updated ultrasonography criteria issued
When miscarriage is suspected based on symptoms of pain and bleeding in preg-
nancy, obtain a thorough history and conduct a limited physical examination. If an intrauterine pregnancy (IUP) was previously identified, a repeat ultrasound can confirm the presence or absence of the gestational sac. If an IUP has not been documented, then additional studies, including serial serum β-hCG examinations and ultrasonography, are essential to rule out ectopic pregnancy. Rh status should be determined and a 50-µg dose of Rh(D)-immune globulin administered to Rh(D)-unsensitized women within 72 hours of documented bleeding.
Ultrasonography is often used to diagnose miscarriage. Many gynecologists use ultrasound criteria based on studies conducted in the early 1990s that define nonviability by an empty gestational sac with mean gestational sac diameter greater than 16 mm or a crown-rump length (CRL) without evidence of fetal cardiac activity greater than 5 mm.10 In 2012, members of the Society of Radiologists in Ultrasound Multispecialty Panel on Early First Trimester Diagnosis of Miscarriage and Exclusion of a Viable Intrauterine Pregnancy developed more conservative criteria for the diagnosis of miscarriage.16
Doubilet and colleagues suggested new cutoffs, based on their reanalysis of 2 large prospective studies conducted in the United Kingdom.17 Calculations for these new cut-offs are based on mathematical adjustments for interobserver variability. Strict adherence to these more conservative criteria is sensible when a pregnancy is desired. For women who do not want to continue the pregnancy there is no medical justification for using this diagnostic process. Indeed, delays can lead to stress and poor outcomes including emergent surgical management for spontaneous and heavy bleeding.
Culture change is needed
Patients’ beliefs and scientific evidence about miscarriage are incongruous. By making simple changes in practice and providing straightforward patient education, ObGyns
can demystify the causes of miscarriage and improve its management. In particular, providing office-based MVA when requested can streamline treatment for many women. For too long, patients have blamed themselves for miscarriage and physicians have relied on D&C in the OR. Changes in culture surrounding miscarriage are
long overdue.
Share your thoughts! Send your Letter to the Editor to [email protected]. Please include your name and the city and state in which you practice.
1. Zhang J, Gilles JM, Barnhart K, Creinin MD, Westhoff C, Frederick MM. A comparison of medical management with misoprostol and surgical management for early pregnancy failure. N Eng J Med. 2005;353(8):761−769.
2. Paul M, Lichtenberg ES, Borgatta L, Grimes DA, Stubblefield PG, Creinin MD, eds. Management of Unintended and Abnormal Pregnancy: Comprehensive Abortion Care. Oxford, United Kingdom: Wiley-Blackwell; 2009.
3. Edelman A, Nichols MD, Jensen J. Comparison of pain and time of procedures with two first-trimester abortion techniques performed by residents and faculty. Am J Obstet Gynecol. 2001;184(7):1564−1567.
4. Renner RM, Nichols MD, Jensen JT, Li H, Edelman AB. Paracervical block for pain control in first-trimester surgical abortion: a randomized controlled trial. Obstet Gynecol. 2012;119(5):1030−1037.
5. Dalton VK, Harris L, Weisman CS, Guire K, Castleman L, Lebovic D. Patient p, satisfaction, and resource use in office evacuation of early pregnancy failure. Obstet Gynecol. 2006;108(1):103−110.
6. Dalton VK, Liang A, Hutton DW, Zochowski MK, Fendrick AM. Beyond usual care: the economic consequences of expanding treatment options in early pregnancy loss. Am J Obstet Gynecol. 2015;212(2):177.e171−177.e176.
7. Ipas. Ipas start-up kit for integrating manual vacuum aspiration (MVA) for early pregnancy loss into women’s reproductive healthcare services. Chapel Hill, NC: Ipas; 2009.
8. MVA Products page. HPSRx Web site. http://www.hpsrx.com/mva-products.html. Accessed October 13, 2015.
9. Kinariwala M, Quinley KE, Datner EM, Schreiber CA. Manual vacuum aspiration in the emergency department for management of early pregnancy failure. Am J Emerg Med. 2013;31(1):244−247.
10. The American College of Obstetricians and Gynecologists. Practice Bulletin No. 150: early pregnancy loss. Obstet Gynecol. 2015;125(5):1258−1267.
11. Meckstroth KR, Whitaker AK, Bertisch S, Goldberg AB, Darney PD. Misoprostol administered by epithelial routes: drug absorption and uterine response. Obstet Gynecol. 2006;108(3 Part 1):582−590.
12. Davis AR, Hendlish SK, Westhoff C, et al. Bleeding patterns after misoprostol vs surgical treatment of early pregnancy failure: results from a randomized trial. Am J Obstet Gynecol. 2007;196(1):31.e31−31.e37.
13. Luise C, Jermy K, May C, Costello G, Collins WP, Bourne TH. Outcome of expectant management of spontaneous first trimester miscarriage: observational study. BMJ. 2002;324(7342):873−875.
14. Bardos J, Hercz D, Friedenthal J, Missmer SA, Williams Z. A national survey on public perceptions of miscarriage. Obstet Gynecol. 2015;125(6):1313−1320.
15. The Practice Committee of the American Society for Reproductive Medicine. Evaluation and treatment of recurrent pregnancy loss: a committee opinion. Fertil Steril. 2012;98(5):1103−1111.
16. Doubilet PM, Benson CB, Bourne T, Blaivas M. Diagnostic criteria for nonviable pregnancy early in the first trimester. N Eng JMed. 2013;369(15):1443−1451.
17. Abdallah Y, Daemen A, Kirk E, et al. Limitations of current definitions of miscarriage using mean gestational sac diameter and crown–rump length measurements: a multicenter observational study. Ultrasound Obstet Gynecol. 2011;38(5):497−502.
Case Miscarriage in a 29-year-old woman
A woman (G0P0) presents to her gynecologist with amenorrhea for 3 months and a positive home urine pregnancy test. She is 29 years of age. She denies any bleeding or pain and intends to continue the pregnancy, though it was unplanned. Results of office ultrasonography to assess fetal viability reveal an intrauterine gestation with an 8-mm fetal pole but no heartbeat. The diagnosis is miscarriage.
This case illustrates a typical miscarriage diagnosis; most women with miscarriage are asymptomatic and without serious bleeding requiring emergency intervention. The management options include surgical, medical, and expectant. Women should be offered all 3 of these, and clinicians should explain the risks and benefits of each approach. But while each strategy can be safe, effective, and acceptable, many women, as well as their health care providers, will benefit from office-based uterine aspiration. In this article, we present the data available on office-based manual vacuum aspiration (MVA) as well as procedure pointers and urge you to consider MVA in your practice for your patients.
Surgical management
Surgical management of miscarriage offers several clear advantages over medical and expectant management. Perhaps the most important advantage to patients is that surgery offers rapid resolution of miscarriage with the shortest duration of bleeding.1,2 When skilled providers perform electric vacuum aspiration (EVA) or MVA in outpatient or emergency department settings, successful uterine evacuation is completed in a single medical encounter 99% of the time.1 By comparison, several follow-up visits and additional ultrasounds may be required during medical or expectant management. Uterine aspiration rarely requires an operating room (OR). Such a setting should be limited to cases in which the clinical picture reflects:
- hemodynamic instability with active uterine bleeding
- serious uterine infection
- the presence of medical comorbidities in patients who may benefit from additional blood bank and anesthesia resources.
Office-based MVA
Office-based MVA is well tolerated when performed using a combination of verbal distraction and reassurance, oral nonsteroidal anti-inflammatory drugs (NSAIDs), and a paracervical block with or without intravenous sedation.
Evidence on managing pain at MVA. Multiple studies have assessed preprocedure and postprocedure pain using NSAIDs, oral anxiolytics, and local anesthesia at the time of EVA or MVA.3,4 Renner and colleagues found that women who received a paracervical block prior to MVA or EVA reported moderate levels of pain, according to a 100-point visual analogue scale (VAS), at the time of cervical dilation (mean, 42) and uterine aspiration (mean, 63).4 In this same study, patients’ willingness to treat a future pregnancy with EVA or MVA using local anesthesia and their overall satisfaction with the procedure was high (mean, 90 on 100-point VAS).
In-office advantages over the OR. Women and clinicians can avoid the extensive scheduling delays associated with ORs, as well as the complications associated with medical and expectant management, if office-based EVA and MVA services are readily available. Compared with surgical management of miscarriage in an OR, office-based EVA and MVA are faster to complete. For example, Dalton and colleagues compared patients undergoing first-trimester procedures in an office setting with those undergoing a procedure in an OR. The mean procedure time for women treated in an office was 10 minutes, compared with 19 minutes for women treated in the OR. In addition, women treated in an office setting spent a mean total of 97 minutes at the office; women treated in an OR spent a mean total of 290 minutes at the hospital.5
Patients’ satisfaction with care provided in the OR was comparable to patients’ satisfaction with care provided in a medical office. In fact, the median total satisfaction score was high among women who had a procedure in either setting (office score, 19 of 20; OR score, 20 of 20).
Cost and equipment for in-office MVA
Office-based surgical management of miscarriage is more cost-effective than OR-based management. In 2006, Dalton and colleagues conducted a cost analysis and found that average charges for office-based MVA were less than half the cost of charges for a dilation and curettage (D&C) in the OR ($968 vs $1,965, respectively).5
More recently, these researchers found that usual care (expectant or OR management) was more costly than a model that also included medical and office-based surgical options. They found that the expanded care model—with use of the OR only when needed—cost $1,033.29 per case. This was compared with $1,247.58 per case when management options did not include medical and office-based surgical treatments.6
The cost of supplies needed to initiate MVA services within an established outpatient gynecologist’s office is modest. Equipment includes manual vacuum aspirators; disposable cannulae of various sizes; reusable plastic or metal dilators; supplies for disinfection, allowing reuse of MVA aspirators; and supplies for examination of products of conception (POC; FIGURE 1).
According to WomanCare Global, manufacturer of the IPAS MVA Plus, equipment should be sterilized after each use with soap and water, medical cleaning solution (such as Cidex, SPOROX II, etc.), or autoclaving.7 If 2 reusable aspirators are purchased along with dilators, disposable cannulae, and tools for tissue assessment, the price of supplies is estimated at US $500.8 WomanCare Global also offers prepackaged, single-use aspirator kits, which may be ideal for the emergency department setting.9
The procedure
To view a video on the MVA device and procedure, including step-by-step technique (FIGURE 2), local anesthesia administration, choosing cannula size, and cervical dilation, visit the Managing Early Pregnancy Loss Web site (http://www.earlypregnancylossresources.org) and access “Videos.” The video “Uterine aspiration for EPL” is available under password protection and broken into chapters for viewing ease.
The risk of endometritis after surgical management of miscarriage is low. Antibiotic prophylaxis prior to MVA or EVA should be considered. Experts recommend giving a single dose of doxycycline 200 mg orally at least 1 hour prior to uterine aspiration.2,10
Use of EVA or MVA for outpatient management of miscarriage yields the opportunity to conduct immediate gross examination of the evacuated tissue and to verify the presence of complete POC. The process is simple: rinse the specimen through a sieve with water or saline, placed in a clear glass container under a small water bath and backlit on a light box. This allows clinicians to separate uterine decidua and pregnancy tissues. “Floating” tissue in this manner is especially useful in patients with pregnancy of unknown location, as immediate confirmation of a gestational sac rules out ectopic pregnancy.
Examine evacuated tissue for macroscopic evidence of pregnancy. Chorionic villi, which arise from syncytiotrophoblasts, can be seen with the naked eye. Immediate evaluation of POC is also useful for patients who desire diagnostic testing to ascertain a cause of their miscarriage because evacuated tissue stored in saline may be sent to a laboratory for cytogenetic analysis.
Medical management
Management of miscarriage with misoprostol is also safe and acceptable to women, though it has a lower success rate than surgical management.
Comparing efficacy: Medical vs surgical management. The Management of Early Pregnancy Failure Trial (MEPF) is the largest randomized controlled trial comparing medical management of miscarriage to surgical management. This multicenter study compared treatment with office-based EVA or MVA to vaginal misoprostol 800 µg. A repeat dose of vaginal misoprostol was offered 48 hours after the initial dose if a gestational sac was present on ultrasound.
Findings from the MEPF trial revealed a 71% complete uterine evacuation rate after 1 dose of misoprostol and an 84% rate after 2 doses.1 The average (SD) reported pain score documented within 48 hours of treatment with misoprostol or MVA/EVA was moderate (5.7 cm [2.4] on 10-cm VAS). The rate of infection or hospitalization was less than 1% in both treatment groups.
These data should provide patients who are clinically stable and who wish to avoid an invasive procedure reassurance that using medication for the management of miscarriage is a reasonable option.
Misoprostol. Use of misoprostol is associated with a longer median duration of bleeding compared with suction aspiration. After misoprostol, bleeding usually begins after several hours and may continue for weeks.11 Based on 2-week prospective bleeding diary entries from the MEPF trial, women who used misoprostol for management of miscarriage were more likely to have any bleeding during the 2 weeks after initiation of treatment, compared with women who had suction aspiration.12
Clinically significant changes in hemoglobin levels are more common in women treated with misoprostol than in those who choose EVA or MVA; however, these differences rarely require hospitalization or transfusion.1 Women who are considering use of misoprostol should be aware of common adverse effects, including nausea, vomiting, diarrhea, and low-grade temperature.
Medical management of miscarriage requires multiple office visits with repeat ultrasounds or serum beta–human chorionic gonadotropin (β-hCG) levels to confirm treatment success. In cases of medication failure (persistent gestational sac with or without bleeding) or suspected retained POC (endometrial stripe greater than 30 mm measured on ultrasound or persistent vaginal bleeding remote from treatment), women should be prepared for surgical resolution of pregnancy and clinicians should be able to perform an office-based procedure.
Expectant management
Women who choose the “watch and wait” approach should be advised that the process is unpredictable and occasionally requires urgent surgical intervention. Successful resolution of pregnancies that are expectantly managed depends on the type of miscarriage diagnosed at initial presentation. Luise and colleagues conducted a prospective study of 451 women with miscarriage who declined medical and surgical management. They found that the watch-and-wait approach was successful in 91% of women with an incomplete abortion, 76% of women with missed abortion, and 66% of women with anembryonic pregnancies.13 Success was defined by the absence of vaginal bleeding and an anterior-posterior endometrial stripe measuring less than 15 mm 4 weeks after initial diagnosis of miscarriage.
Like medical management for miscarriage, expectant management requires multiple office visits plus repeat ultrasounds or β-hCG measurement trends to confirm treatment success. Women who fail expectant management will require medical or surgical intervention to resolve the pregnancy. For those who are seeking pregnancy right away, the unpredictability and longer time to resolution of miscarriage may render expectant management anxiety provoking and unacceptable.
Etiology: Do true and perceived causes match?
Miscarriage during the first 13 weeks of gestation occurs in at least 10% of all clinically diagnosed pregnancies.10 A recent survey administered by Bardos and colleagues
assessed perceived prevalence and causes of miscarriage in more than 1,000 US men and women.14 The majority of respondents believed miscarriage is uncommon, occurring in less than 5% of pregnancies. Respondents also believed stressful events, lifting heavy objects, and prior use of intrauterine or hormonal contraception are often to blame for pregnancy loss.
Despite more than 3 decades of data confirming that more than 60% of early losses are associated with chromosomal abnormalities and that an additional 18% may be associated with fetal anomalies, women often blame themselves.15 Bardos and colleagues found that 47% of women felt guilty about the experience of miscarriage.
Diagnosis: Updated ultrasonography criteria issued
When miscarriage is suspected based on symptoms of pain and bleeding in preg-
nancy, obtain a thorough history and conduct a limited physical examination. If an intrauterine pregnancy (IUP) was previously identified, a repeat ultrasound can confirm the presence or absence of the gestational sac. If an IUP has not been documented, then additional studies, including serial serum β-hCG examinations and ultrasonography, are essential to rule out ectopic pregnancy. Rh status should be determined and a 50-µg dose of Rh(D)-immune globulin administered to Rh(D)-unsensitized women within 72 hours of documented bleeding.
Ultrasonography is often used to diagnose miscarriage. Many gynecologists use ultrasound criteria based on studies conducted in the early 1990s that define nonviability by an empty gestational sac with mean gestational sac diameter greater than 16 mm or a crown-rump length (CRL) without evidence of fetal cardiac activity greater than 5 mm.10 In 2012, members of the Society of Radiologists in Ultrasound Multispecialty Panel on Early First Trimester Diagnosis of Miscarriage and Exclusion of a Viable Intrauterine Pregnancy developed more conservative criteria for the diagnosis of miscarriage.16
Doubilet and colleagues suggested new cutoffs, based on their reanalysis of 2 large prospective studies conducted in the United Kingdom.17 Calculations for these new cut-offs are based on mathematical adjustments for interobserver variability. Strict adherence to these more conservative criteria is sensible when a pregnancy is desired. For women who do not want to continue the pregnancy there is no medical justification for using this diagnostic process. Indeed, delays can lead to stress and poor outcomes including emergent surgical management for spontaneous and heavy bleeding.
Culture change is needed
Patients’ beliefs and scientific evidence about miscarriage are incongruous. By making simple changes in practice and providing straightforward patient education, ObGyns
can demystify the causes of miscarriage and improve its management. In particular, providing office-based MVA when requested can streamline treatment for many women. For too long, patients have blamed themselves for miscarriage and physicians have relied on D&C in the OR. Changes in culture surrounding miscarriage are
long overdue.
Share your thoughts! Send your Letter to the Editor to [email protected]. Please include your name and the city and state in which you practice.
1. Zhang J, Gilles JM, Barnhart K, Creinin MD, Westhoff C, Frederick MM. A comparison of medical management with misoprostol and surgical management for early pregnancy failure. N Eng J Med. 2005;353(8):761−769.
2. Paul M, Lichtenberg ES, Borgatta L, Grimes DA, Stubblefield PG, Creinin MD, eds. Management of Unintended and Abnormal Pregnancy: Comprehensive Abortion Care. Oxford, United Kingdom: Wiley-Blackwell; 2009.
3. Edelman A, Nichols MD, Jensen J. Comparison of pain and time of procedures with two first-trimester abortion techniques performed by residents and faculty. Am J Obstet Gynecol. 2001;184(7):1564−1567.
4. Renner RM, Nichols MD, Jensen JT, Li H, Edelman AB. Paracervical block for pain control in first-trimester surgical abortion: a randomized controlled trial. Obstet Gynecol. 2012;119(5):1030−1037.
5. Dalton VK, Harris L, Weisman CS, Guire K, Castleman L, Lebovic D. Patient p, satisfaction, and resource use in office evacuation of early pregnancy failure. Obstet Gynecol. 2006;108(1):103−110.
6. Dalton VK, Liang A, Hutton DW, Zochowski MK, Fendrick AM. Beyond usual care: the economic consequences of expanding treatment options in early pregnancy loss. Am J Obstet Gynecol. 2015;212(2):177.e171−177.e176.
7. Ipas. Ipas start-up kit for integrating manual vacuum aspiration (MVA) for early pregnancy loss into women’s reproductive healthcare services. Chapel Hill, NC: Ipas; 2009.
8. MVA Products page. HPSRx Web site. http://www.hpsrx.com/mva-products.html. Accessed October 13, 2015.
9. Kinariwala M, Quinley KE, Datner EM, Schreiber CA. Manual vacuum aspiration in the emergency department for management of early pregnancy failure. Am J Emerg Med. 2013;31(1):244−247.
10. The American College of Obstetricians and Gynecologists. Practice Bulletin No. 150: early pregnancy loss. Obstet Gynecol. 2015;125(5):1258−1267.
11. Meckstroth KR, Whitaker AK, Bertisch S, Goldberg AB, Darney PD. Misoprostol administered by epithelial routes: drug absorption and uterine response. Obstet Gynecol. 2006;108(3 Part 1):582−590.
12. Davis AR, Hendlish SK, Westhoff C, et al. Bleeding patterns after misoprostol vs surgical treatment of early pregnancy failure: results from a randomized trial. Am J Obstet Gynecol. 2007;196(1):31.e31−31.e37.
13. Luise C, Jermy K, May C, Costello G, Collins WP, Bourne TH. Outcome of expectant management of spontaneous first trimester miscarriage: observational study. BMJ. 2002;324(7342):873−875.
14. Bardos J, Hercz D, Friedenthal J, Missmer SA, Williams Z. A national survey on public perceptions of miscarriage. Obstet Gynecol. 2015;125(6):1313−1320.
15. The Practice Committee of the American Society for Reproductive Medicine. Evaluation and treatment of recurrent pregnancy loss: a committee opinion. Fertil Steril. 2012;98(5):1103−1111.
16. Doubilet PM, Benson CB, Bourne T, Blaivas M. Diagnostic criteria for nonviable pregnancy early in the first trimester. N Eng JMed. 2013;369(15):1443−1451.
17. Abdallah Y, Daemen A, Kirk E, et al. Limitations of current definitions of miscarriage using mean gestational sac diameter and crown–rump length measurements: a multicenter observational study. Ultrasound Obstet Gynecol. 2011;38(5):497−502.
In this Article
- Advantages of office-based manual vacuum aspiration
- Medical management
- Current diagnostic criteria
Medial Patellar Subluxation: Diagnosis and Treatment
Medial patellar subluxation (MPS) is a disabling condition caused by an imbalance in the medial and lateral forces in the normal knee, allowing the patella to displace medially. Normally, the patella glides appropriately in the femoral trochlea, but alteration in this medial–lateral equilibrium can lead to pain and instability.1 MPS was first described in 1987 by Betz and colleagues2 as a complication of lateral retinacular release. Since then, multiple cases of iatrogenic, traumatic, and isolated medial subluxation have been reported.3–15 However, MPS after lateral release is the most common cause, accounting for the majority of published cases, whereas only 8 cases of isolated MPS have been reported to date.
Optimal treatment for MPS is not well understood. To better comprehend and manage MPS, we must fully appreciate the pathoanatomy, biomechanics, and current research. In this review, we focus on the anatomy of the lateral retinaculum, diagnosis and treatment of MPS, and outcomes of current treatment techniques.
Anatomy
In 1980, Fulkerson and Gossling16 delineated the anatomy of the knee joint lateral retinaculum. They described a 2-layered system with separate distinct anatomical structures. The lateral retinaculum is oriented longitudinally with the knee extended but exerts a posterolateral force on the lateral aspect of the patella as the knee is flexed. The superficial layer is composed of oblique fibers of the lateral retinaculum originating from the iliotibial band and the vastus lateralis fascia and inserting into the lateral margin of the patella and the patella tendon. The deep layer of the retinaculum consists of several structures, including the deep transverse retinaculum, lateral patellofemoral ligament (LPFL), and the patellotibial band.
Over the years, several studies have described the importance of the lateral retinaculum and, in particular, the LPFL. Examining the functional anatomy of the knee in 1962, Kaplan17 first described the lateral epicondylopatellar ligament as a palpable thickening of the joint capsule. Reider and colleagues18 later named this structure the lateral patellofemoral ligament in their anatomical study of 21 fresh cadaver knees. They described its width as ranging from 3 to 10 mm. In a comprehensive cadaveric study of the LPFL, Navarro and colleagues19,20 found it to be a distinct structure present in all 20 of their dissected specimens. They found its femoral insertion at the lateral epicondyle with a fanlike expansion of the fibers predominantly in the posterior region proximal to the lateral epicondyle. The patellar insertion was found in the posterior half and upper lateral aspect, also with expanded fibers. Mean length of the LPFL is 42.1 mm, and mean width is 16.1 mm.
Medial and lateral forces are balanced in a normal knee, and the patella glides appropriately in the femoral trochlea. Alteration in this medial–lateral equilibrium can lead to pain and instability.1 Normally, the patella lies laterally with the knee extended, but in early flexion the patella moves medially as it engages in the trochlea. As the knee continues to flex, the patella flexes and translates distally.21 By 45°, the patella is fully engaged in the trochlear groove throughout the remainder of the knee’s range of motion (ROM).
Lateral release procedures, as described in the literature, result in sectioning of both layers of the lateral retinaculum. In a biomechanical study, Merican and colleagues22 found that staged release of the lateral retinaculum reduced the medial stability of the patellofemoral joint progressively, making it easier to push the patella medially. At 30° of flexion, the transverse fibers of the midsection of the lateral retinaculum were found to be the main contributor to the lateral restraint of the patella. When the release extends too far proximally, the transverse fibers that anchor the lateral patella and the vastus lateralis oblique tendon to the iliotibial band are disrupted. Subsequent loss of a dynamic muscular pull in the orientation of the lateral stabilizing structures results in medial subluxation in a range from full knee extension to about 30° of flexion.
Furthermore, the attachments of the LPFL and the orientation of its fibers suggest that the LPFL may have a significant role in limiting medial excursion of the patella. Vieira and colleagues23 resected the LPFL in 10 fresh cadaver knees. They noticed that, after resection, the patella spontaneously traveled medially, demonstrating the importance of this ligament in patellar stability. In cases of isolated MPS, there have been no reports of associated pathology, such as muscular imbalance or coronal/rotational malalignment of the lower extremity. With an intact lateral retinaculum, medial subluxation is likely caused by pathology in the normal histologic structure of the LPFL and lateral retinaculum. However, the histologic structure of the LPFL and its contribution to the understanding of the pathoetiology of MPS have not been documented.
Diagnosis
MPS diagnosis can be challenging. Often, clinical examination findings are subtle, and radiographs may not show significant pathology. The most accurate diagnosis is obtained by combining patient history, physical examination findings, imaging studies, and diagnostic arthroscopy.
Patient History
Patients with MPS report chronic pain localized to the inferior medial patella and anterior-medial joint line. Occasionally, they complain of crepitus and intermittent swelling. Other symptoms include pain with knee flexion activity, such as squatting and climbing or descending stairs. Some patients describe episodes of giving way and feelings of instability. Often, they are aware the direction of instability is medial. The pain typically is not relieved by medication, physical therapy, or bracing.
Physical Examination
MPS must be identified by clinical examination. Peripatellar tenderness is typically noted. There is often no effusion or crepitus, but the patella is unstable in early flexion. Active and passive ROM is painful through the first 30° of knee flexion. The patient may have a positive medial apprehension test7 in which he or she experiences apprehension of the patella being subluxated with a medially directed force on the lateral border of the patella.
The gravity subluxation test described by Nonweiler and DeLee6 is useful in detecting MPS after lateral release and indicates that the vastus lateralis muscle has been detached from the patella and that the lateral retinaculum is lax. In this test, the patient is positioned in the lateral decubitus position with the involved knee farthest from the table. In this position, gravity causes the patella to subluxate out of the trochlea. The test is positive for MPS when a voluntary contraction of the quadriceps does not center the patella into the trochlear groove. Patients with MPS without previous lateral release can have the patella subluxate medially in the lateral decubitus position, but it is pulled back into the trochlea with active quadriceps contraction (Figure 1).
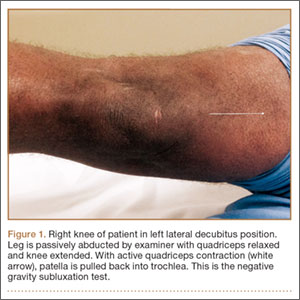
Patients with MPS often have lateral patellar laxity (LPL), which allows the patella to rotate upward on the lateral side and skid across the medial facet of the femoral trochlea. A physical examination sign combining lateral patellar glide and tilt was described by Shneider24 to identify LPL. This “lateral patellar float” sign is present when the patella translates laterally and rotates or tilts upward with medial pressure on the patella (Figure 2). Another maneuver to test for subtle MPS involves manually centering the patella in the trochlea during active knee flexion and extension. The involved knee is examined in the seated position. The examiner attempts to center the patella in the trochlea with a laterally directed force from the examiner’s thumb on the medial border of the patella. This will usually provide immediate relief as the patient actively ranges the knee.
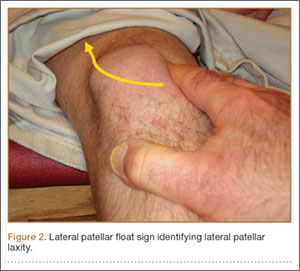
Imaging Studies
Diagnostic imaging is a crucial component of the evaluation and treatment decision process. Plain radiographs often are not helpful in diagnosing MPS but may provide additional information.5 A variety of radiographic measurements have been described as indicators of structural disease, but there is a lack of comprehensive information recommending radiographic evaluation and interpretation of patients with patellofemoral dysfunction. It is crucial that orthopedic surgeons have common and consistent radiographic views for plain radiographic assessment that can serve as a basis for accurate diagnosis and surgical decision-making.
Standard knee radiographs should include a standing anteroposterior view of bilateral knees, a standing lateral view of the symptomatic knee in 30° of flexion, a patellar axial view, and a tunnel view. These views, occasionally combined with magnetic resonance imaging (MRI), can yield information vital to surgical decision-making. Image quality is highly technique-dependent, and variability in patient positioning can substantially affect the ability to properly diagnose structural abnormalities. For improved diagnostic accuracy and disease classification, radiographs must be obtained with use of the same standardized imaging protocol.
Kinetic MRI was shown by Shellock and colleagues25 to provide diagnostic information related to patellar malalignment. As kinetic MRI can image the patellofemoral joint within the initial 20° to 30° of flexion, it is useful in detecting some of the more subtle patellar tracking problems. In their study of 43 knees (40 patients) with symptoms after lateral release, Shellock and colleagues25 found that 27 knees (63%) had medial subluxation of the patella as the knee moved from extension to flexion. Furthermore, MPS was noted on the contralateral, unoperated knee in 17 (43%) of the 40 patients.
Diagnostic Arthroscopy
Once MPS is suspected after a thorough history and physical examination, examination under anesthesia accompanied by diagnostic arthroscopy confirms the diagnosis. Lateral forces are applied to the patella in full knee extension and 30° of flexion (Figure 3). During arthroscopy, the patellofemoral compartment is viewed from the anterolateral portal. With the knee at full extension, the lateral laxity and medial tilt of the patella can be identified (Figure 4). As the knee is flexed to 30°, the patella moves medially and can subluxate over the edge of the medial facet of the trochlea (Figure 5).
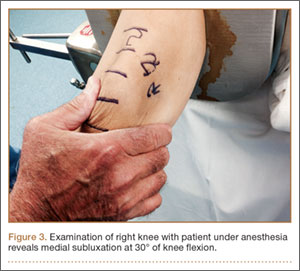
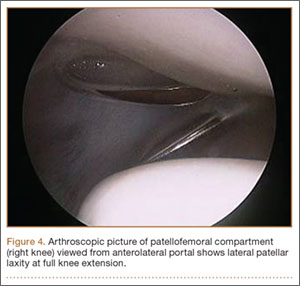
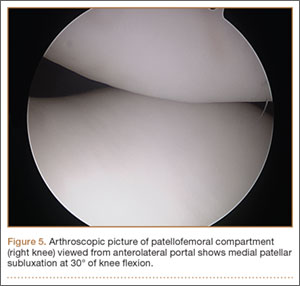
Treatment
Nonsurgical Management
Treatment of MPS depends entirely on making an accurate diagnosis and determining the degree of impairment. Patients with symptomatic MPS should initially undergo supervised rehabilitation focusing on balancing the medial and lateral forces that influence patellar tracking. Patients should be evaluated for specific muscle tightness, weakness, and biomechanical abnormalities. Each problem should be addressed with an individualized rehabilitation prescription. Emphasis is placed on balance, proprioception, and strengthening of the quadriceps, hip abductors/external rotators, and abdominal core muscle groups.
In some patients, symptomatic MPS may be reduced with a patella-stabilizing brace with a medial buttress.3,5,26 Although bracing should be regarded as an adjuvant to a structured physical therapy program, it can also be helpful in confirming the diagnosis of MPS. Shannon and Keene3 reported that all patients in their study experienced significant pain relief and decreased medial patellar subluxations when they wore a medial patella–stabilizing brace. Shellock and colleagues25 used kinematic MRI to investigate the effect of a patella-realignment brace and found that bracing counteracted patellar subluxation in the majority of knees studied.
Surgical Management
When conservative management fails and patients continue to experience pain and instability, surgical intervention is often required. Although various surgical techniques have been used (Table),3–6,8–10,14,15,27,28 the optimal surgical treatment for MPS has not been identified.
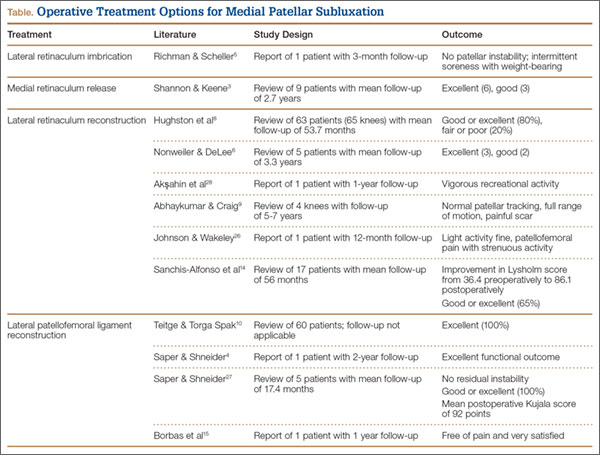
Lateral Retinaculum Imbrication. Lateral retinaculum imbrication has been used to centralize patella tracking and stabilize the patella. Richman and Scheller5 reported on a 17-year-old patient who had isolated medial subluxation of the patella without having undergone a previous lateral release. At 3-month follow-up, there was no recurrent instability; there was only intermittent medial knee soreness with weight-bearing activity.
Lateral Retinaculum Repair/Reconstruction. Hughston and colleagues8 treated 65 knees for MPS. Most had undergone lateral release. Of the 65 knees, 39 were treated with direct repair of the lateral retinaculum, and 26 with reconstruction of the lateral patellotibial ligament using locally available tissue, such as strips of iliotibial band or patellar tendon. Results were good to excellent in 80% of patients at a mean follow-up of 53.7 months. Nonweiler and DeLee6 reconstructed the lateral retinaculum in 5 patients with MPS that developed after isolated lateral retinacular release. Four (80%) of the 5 patients had no symptoms or physical signs of instability at a mean follow-up of 3.3 years. Results were excellent (3 knees) and good (2 knees) according to the Merchant and Mercer rating scale. Akşahin and colleagues28 reported on a single case of spontaneous medial patellar instability. At surgery, imbrication of the lateral structures failed to prevent the medial subluxation. Lateral patellotibial ligament augmentation was performed using an iliotibial band flap that effectively corrected the instability. At 1 year, the patient was characterized as engaging in vigorous recreational activity, according to the clinical score defined by Hughston and colleagues.8 He had mild pain with competitive sports but no pain with daily activity. Abhaykumar and Craig9 reported on 4 surgically treated knees with medial instability. They reconstructed the lateral retinaculum using a strip of fascia lata. By follow-up (5-7 years), each knee had its instability resolved and full ROM restored. Johnson and Wakeley26 reported on a case of iatrogenic MPS after lateral release. Treatment consisted of mobilization and direct repair of the lateral retinaculum. At 12-month follow-up, there was no instability. Although symptom-free with light activity, the patient had patellofemoral pain with strenuous activity. Sanchis-Alfonso and colleagues14 reported the results of isolated lateral retinacular reconstruction for iatrogenic MPS in 17 patients. At mean follow-up of 56 months, results were good or excellent in 65% of patients, and the Lysholm score improved from 36.4 preoperatively to 86.1 postoperatively.
Medial Retinaculum Release. Medial retinaculum release has been used as an alternative to open reconstruction. Shannon and Keene3 reported the results of medial retinacular release procedures on 9 knees. Four (44%) of the 9 patients had either spontaneous or traumatic onset of instability. All cases were treated with arthroscopic medial retinacular release, extending 2 cm medial to the superior pole of the patella down to the anteromedial portal. This avoided releasing the attachment of the vastus medialis oblique muscle to the patella and removing its dynamic medial stabilizing force. At a mean follow-up of 2.7 years, both medial subluxation and knee pain were relieved in all 9 knees without complications or further realignment surgery. Results were excellent in 6 knees (66.7%) and good in 3 knees (33.3%). Shannon and Keene3 emphasized that the procedure should not be used in patients with hypermobile patellae or in cases of failed lateral retinacular releases in which MPS is not clearly and carefully documented.
LPFL Reconstruction. Before coming to our practice, most patients have tried several months of formal physical rehabilitation, medications, and bracing. Many have already had surgical procedures, including arthroscopy, lateral release, and tibial tubercle transfer. When the diagnosis of MPS is suspected after a thorough history and physical examination, LPFL reconstruction is offered. Management of MPS with LPFL reconstruction has yielded excellent and reliable clinical results. Teitge and Torga Spak10 described an LPFL reconstruction technique that is used as a salvage procedure in managing medial iatrogenic patellar instability (the patient’s own quadriceps tendon is used). In their experience, direct repair or imbrication of the lateral retinaculum failed to provide long-term stability because medial excursion usually appeared after 1 year. The 60 patients’ outcomes were excellent with respect to patellar stability, and there were no cases of recurrent subluxation. Borbas and colleagues15 reported a case of LPFL reconstruction in a symptomatic medial subluxated patella resulting from TKA and extended lateral release. Using a free gracilis autograft through patellar bone tunnels to reconstruct the LPFL, the patient was free of pain and very satisfied with the result at 1 year postoperatively. Our current strategy is anatomical reconstruction of the LPFL using a quadriceps tendon graft and no bone tunnels, screws, or anchors in the patella.27 We previously reported a single case of isolated medial instability.4 At 2-year follow-up, there was no recurrent instability, and the functional outcome was excellent. This LPFL reconstruction method has been used in 10 patients with isolated MPS. There has been no residual medial subluxation on follow-up ranging from 3 months to 2 years. Outcome studies are in progress.
Rehabilitation. The initial goal of rehabilitation after surgical reconstruction of the lateral retinaculum or LPFL is to protect the healing soft tissues, restore normal knee ROM, and normalize gait. The knee is immobilized in a brace for weight-bearing activity for 4 to 6 weeks, until limb control is sufficient to prevent rotational stress on the knee. Gradual increase to full weight-bearing without bracing is permitted as quadriceps strength is restored. As motion is regained, strength, balance, and proprioception are emphasized for the entire lower extremity and core.
Functional limb training, including rotational activity, begins at 12 weeks. As strength and neuromuscular control progress, single-leg activity may be started with particular attention to proper alignment of the pelvis and the entire lower extremity. For competitive or recreational athletes, the final stages of rehabilitation focus on dynamic lower extremity control during sport-specific movements. Patients return to unrestricted activity by 6 months to 1 year after surgery.
Summary
MPS is a disabling condition that can limit daily functional activity because of apprehension and pain. Initially described as a complication of lateral retinacular release, isolated MPS can occur in the absence of a previous lateral release. Thorough physical examination and identification during arthroscopy are crucial for proper MPS diagnosis and management. When nonsurgical measures fail, LPFL reconstruction can provide patellofemoral stability and excellent functional outcomes.
1. Marumoto JM, Jordan C, Akins R. A biomechanical comparison of lateral retinacular releases. Am J Sports Med. 1995;23(2):151-155.
2. Betz RR, Magill JT, Lonergan RP. The percutaneous lateral retinacular release. Am J Sports Med. 1987;15(5):477-482.
3. Shannon BD, Keene JS. Results of arthroscopic medial retinacular release for treatment of medial subluxation of the patella. Am J Sports Med. 2007;35(7):1180-1187.
4. Saper MG, Shneider DA. Medial patellar subluxation without previous lateral release: a case report. J Pediatr Orthop B. 2014;23(4):350-353.
5. Richman NM, Scheller AD Jr. Medial subluxation of the patella without previous lateral retinacular release. Orthopedics. 1998;21(7):810-813.
6. Nonweiler DE, DeLee JC. The diagnosis and treatment of medial subluxation of the patella after lateral retinacular release. Am J Sports Med. 1994;22(5):680-686.
7. Hughston JC, Deese M. Medial subluxation of the patella as a complication of lateral retinacular release. Am J Sports Med. 1988;16(4):383-388.
8. Hughston JC, Flandry F, Brinker MR, Terry GC, Mills JC 3rd. Surgical correction of medial subluxation of the patella. Am J Sports Med. 1996;24(4):486-491.
9. Abhaykumar S, Craig DM. Fascia lata sling reconstruction for recurrent medial dislocation of the patella. The Knee. 1999;6(1):55-57.
10. Teitge RA, Torga Spak R. Lateral patellofemoral ligament reconstruction. Arthroscopy. 2004;20(9):998-1002.
11. Kusano M, Horibe S, Tanaka Y, et al. Simultaneous MPFL and LPFL reconstruction for recurrent lateral patellar dislocation with medial patellofemoral instability. Asia-Pac J Sports Med Arthrosc Rehabil Technol. 2014;1:42-46.
12. Saper MG, Shneider DA. Simultaneous medial and lateral patellofemoral ligament reconstruction for combined medial and lateral patellar subluxation. Arthrosc Tech. 2014,3(2):e227-e231.
13. Udagawa K, Niki Y, Matsumoto H, et al. Lateral patellar retinaculum reconstruction for medial patellar instability following lateral retinacular release: a case report. Knee. 2014;21(1):336-339.
14. Sanchis-Alfonso V, Montesinos-Berry E, Monllau JC, Merchant AC. Results of isolated lateral retinacular reconstruction for iatrogenic medial patellar instability. Arthroscopy. 2015;31(3):422-427.
15. Borbas P, Koch PP, Fucentese SF. Lateral patellofemoral ligament reconstruction using a free gracilis autograft. Orthopedics. 2014;37(7):e665-e668.
16. Fulkerson JP, Gossling H. Anatomy of the knee joint lateral retinaculum. Clin Orthop Relat Res. 1980;153:183-188.
17. Kaplan E. Some aspects of functional anatomy of the human knee joint. Clin Orthop Relat Res. 1962;23:18-29.
18. Reider B, Marshall J, Koslin B, Ring B, Girgis F. The anterior aspect of the knee joint. J Bone Joint Surg Am. 1981;63(3):351-356.
19. Navarro MS, Navarro RD, Akita Junior J, Cohen M. Anatomical study of the lateral patellofemoral ligament in cadaver knees. Rev Bras Ortop. 2008;43(7):300-307.
20. Navarro MS, Beltrani Filho CA, Akita Junior J, Navarro RD, Cohen M. Relationship between the lateral patellofemoral ligament and the width of the lateral patellar facet. Acta Ortop Bras. 2010;18(1):19-22.
21. Salsich GB, Ward SR, Terk MR, Powers CM. In vivo assessment of patellofemoral joint contact area in individuals who are pain free. Clin Orthop Relat Res. 2003;417:277-284.
22. Merican AM, Kondo E, Amis AA. The effect on patellofemoral joint stability of selective cutting of lateral retinacular and capsular structures. J Biomech. 2009;42(3):291-296.
23. Vieira EL, Vieira EÁ, da Silva RT, Berlfein PA, Abdalla RJ, Cohen M. An anatomic study of the iliotibial tract. Arthroscopy. 2007;23(3):269-274.
24. Shneider DA. Lateral patellar laxity—identification, significance, treatment. Poster session presented at: Annual Meeting of the American Academy of Orthopaedic Surgeons; February 25-28, 2009; Las Vegas, NV.
25. Shellock FG, Mink JH, Deutsch A, Fox JM, Ferkel RD. Evaluation of patients with persistent symptoms after lateral retinacular release by kinematic magnetic resonance imaging of the patellofemoral joint. Arthroscopy. 1990;6(3):226-234.
26. Johnson DP, Wakeley C. Reconstruction of the lateral patellar retinaculum following lateral release: a case report. Knee Surg Sports Traumatol Arthrosc. 2002;10(6):361-363.
27. Saper MG, Shneider DA. Lateral patellofemoral ligament reconstruction using a quadriceps tendon graft. Arthrosc Tech. 2014;3(4):e445-e448.
28. Akşahin E, Yumrukçal F, Yüksel HY, Doğruyol D, Celebi L. Role of pathophysiology of patellofemoral instability in the treatment of spontaneous medial patellofemoral subluxation: a case report. J Med Case Rep. 2010;4:148.
Medial patellar subluxation (MPS) is a disabling condition caused by an imbalance in the medial and lateral forces in the normal knee, allowing the patella to displace medially. Normally, the patella glides appropriately in the femoral trochlea, but alteration in this medial–lateral equilibrium can lead to pain and instability.1 MPS was first described in 1987 by Betz and colleagues2 as a complication of lateral retinacular release. Since then, multiple cases of iatrogenic, traumatic, and isolated medial subluxation have been reported.3–15 However, MPS after lateral release is the most common cause, accounting for the majority of published cases, whereas only 8 cases of isolated MPS have been reported to date.
Optimal treatment for MPS is not well understood. To better comprehend and manage MPS, we must fully appreciate the pathoanatomy, biomechanics, and current research. In this review, we focus on the anatomy of the lateral retinaculum, diagnosis and treatment of MPS, and outcomes of current treatment techniques.
Anatomy
In 1980, Fulkerson and Gossling16 delineated the anatomy of the knee joint lateral retinaculum. They described a 2-layered system with separate distinct anatomical structures. The lateral retinaculum is oriented longitudinally with the knee extended but exerts a posterolateral force on the lateral aspect of the patella as the knee is flexed. The superficial layer is composed of oblique fibers of the lateral retinaculum originating from the iliotibial band and the vastus lateralis fascia and inserting into the lateral margin of the patella and the patella tendon. The deep layer of the retinaculum consists of several structures, including the deep transverse retinaculum, lateral patellofemoral ligament (LPFL), and the patellotibial band.
Over the years, several studies have described the importance of the lateral retinaculum and, in particular, the LPFL. Examining the functional anatomy of the knee in 1962, Kaplan17 first described the lateral epicondylopatellar ligament as a palpable thickening of the joint capsule. Reider and colleagues18 later named this structure the lateral patellofemoral ligament in their anatomical study of 21 fresh cadaver knees. They described its width as ranging from 3 to 10 mm. In a comprehensive cadaveric study of the LPFL, Navarro and colleagues19,20 found it to be a distinct structure present in all 20 of their dissected specimens. They found its femoral insertion at the lateral epicondyle with a fanlike expansion of the fibers predominantly in the posterior region proximal to the lateral epicondyle. The patellar insertion was found in the posterior half and upper lateral aspect, also with expanded fibers. Mean length of the LPFL is 42.1 mm, and mean width is 16.1 mm.
Medial and lateral forces are balanced in a normal knee, and the patella glides appropriately in the femoral trochlea. Alteration in this medial–lateral equilibrium can lead to pain and instability.1 Normally, the patella lies laterally with the knee extended, but in early flexion the patella moves medially as it engages in the trochlea. As the knee continues to flex, the patella flexes and translates distally.21 By 45°, the patella is fully engaged in the trochlear groove throughout the remainder of the knee’s range of motion (ROM).
Lateral release procedures, as described in the literature, result in sectioning of both layers of the lateral retinaculum. In a biomechanical study, Merican and colleagues22 found that staged release of the lateral retinaculum reduced the medial stability of the patellofemoral joint progressively, making it easier to push the patella medially. At 30° of flexion, the transverse fibers of the midsection of the lateral retinaculum were found to be the main contributor to the lateral restraint of the patella. When the release extends too far proximally, the transverse fibers that anchor the lateral patella and the vastus lateralis oblique tendon to the iliotibial band are disrupted. Subsequent loss of a dynamic muscular pull in the orientation of the lateral stabilizing structures results in medial subluxation in a range from full knee extension to about 30° of flexion.
Furthermore, the attachments of the LPFL and the orientation of its fibers suggest that the LPFL may have a significant role in limiting medial excursion of the patella. Vieira and colleagues23 resected the LPFL in 10 fresh cadaver knees. They noticed that, after resection, the patella spontaneously traveled medially, demonstrating the importance of this ligament in patellar stability. In cases of isolated MPS, there have been no reports of associated pathology, such as muscular imbalance or coronal/rotational malalignment of the lower extremity. With an intact lateral retinaculum, medial subluxation is likely caused by pathology in the normal histologic structure of the LPFL and lateral retinaculum. However, the histologic structure of the LPFL and its contribution to the understanding of the pathoetiology of MPS have not been documented.
Diagnosis
MPS diagnosis can be challenging. Often, clinical examination findings are subtle, and radiographs may not show significant pathology. The most accurate diagnosis is obtained by combining patient history, physical examination findings, imaging studies, and diagnostic arthroscopy.
Patient History
Patients with MPS report chronic pain localized to the inferior medial patella and anterior-medial joint line. Occasionally, they complain of crepitus and intermittent swelling. Other symptoms include pain with knee flexion activity, such as squatting and climbing or descending stairs. Some patients describe episodes of giving way and feelings of instability. Often, they are aware the direction of instability is medial. The pain typically is not relieved by medication, physical therapy, or bracing.
Physical Examination
MPS must be identified by clinical examination. Peripatellar tenderness is typically noted. There is often no effusion or crepitus, but the patella is unstable in early flexion. Active and passive ROM is painful through the first 30° of knee flexion. The patient may have a positive medial apprehension test7 in which he or she experiences apprehension of the patella being subluxated with a medially directed force on the lateral border of the patella.
The gravity subluxation test described by Nonweiler and DeLee6 is useful in detecting MPS after lateral release and indicates that the vastus lateralis muscle has been detached from the patella and that the lateral retinaculum is lax. In this test, the patient is positioned in the lateral decubitus position with the involved knee farthest from the table. In this position, gravity causes the patella to subluxate out of the trochlea. The test is positive for MPS when a voluntary contraction of the quadriceps does not center the patella into the trochlear groove. Patients with MPS without previous lateral release can have the patella subluxate medially in the lateral decubitus position, but it is pulled back into the trochlea with active quadriceps contraction (Figure 1).
Patients with MPS often have lateral patellar laxity (LPL), which allows the patella to rotate upward on the lateral side and skid across the medial facet of the femoral trochlea. A physical examination sign combining lateral patellar glide and tilt was described by Shneider24 to identify LPL. This “lateral patellar float” sign is present when the patella translates laterally and rotates or tilts upward with medial pressure on the patella (Figure 2). Another maneuver to test for subtle MPS involves manually centering the patella in the trochlea during active knee flexion and extension. The involved knee is examined in the seated position. The examiner attempts to center the patella in the trochlea with a laterally directed force from the examiner’s thumb on the medial border of the patella. This will usually provide immediate relief as the patient actively ranges the knee.
Imaging Studies
Diagnostic imaging is a crucial component of the evaluation and treatment decision process. Plain radiographs often are not helpful in diagnosing MPS but may provide additional information.5 A variety of radiographic measurements have been described as indicators of structural disease, but there is a lack of comprehensive information recommending radiographic evaluation and interpretation of patients with patellofemoral dysfunction. It is crucial that orthopedic surgeons have common and consistent radiographic views for plain radiographic assessment that can serve as a basis for accurate diagnosis and surgical decision-making.
Standard knee radiographs should include a standing anteroposterior view of bilateral knees, a standing lateral view of the symptomatic knee in 30° of flexion, a patellar axial view, and a tunnel view. These views, occasionally combined with magnetic resonance imaging (MRI), can yield information vital to surgical decision-making. Image quality is highly technique-dependent, and variability in patient positioning can substantially affect the ability to properly diagnose structural abnormalities. For improved diagnostic accuracy and disease classification, radiographs must be obtained with use of the same standardized imaging protocol.
Kinetic MRI was shown by Shellock and colleagues25 to provide diagnostic information related to patellar malalignment. As kinetic MRI can image the patellofemoral joint within the initial 20° to 30° of flexion, it is useful in detecting some of the more subtle patellar tracking problems. In their study of 43 knees (40 patients) with symptoms after lateral release, Shellock and colleagues25 found that 27 knees (63%) had medial subluxation of the patella as the knee moved from extension to flexion. Furthermore, MPS was noted on the contralateral, unoperated knee in 17 (43%) of the 40 patients.
Diagnostic Arthroscopy
Once MPS is suspected after a thorough history and physical examination, examination under anesthesia accompanied by diagnostic arthroscopy confirms the diagnosis. Lateral forces are applied to the patella in full knee extension and 30° of flexion (Figure 3). During arthroscopy, the patellofemoral compartment is viewed from the anterolateral portal. With the knee at full extension, the lateral laxity and medial tilt of the patella can be identified (Figure 4). As the knee is flexed to 30°, the patella moves medially and can subluxate over the edge of the medial facet of the trochlea (Figure 5).
Treatment
Nonsurgical Management
Treatment of MPS depends entirely on making an accurate diagnosis and determining the degree of impairment. Patients with symptomatic MPS should initially undergo supervised rehabilitation focusing on balancing the medial and lateral forces that influence patellar tracking. Patients should be evaluated for specific muscle tightness, weakness, and biomechanical abnormalities. Each problem should be addressed with an individualized rehabilitation prescription. Emphasis is placed on balance, proprioception, and strengthening of the quadriceps, hip abductors/external rotators, and abdominal core muscle groups.
In some patients, symptomatic MPS may be reduced with a patella-stabilizing brace with a medial buttress.3,5,26 Although bracing should be regarded as an adjuvant to a structured physical therapy program, it can also be helpful in confirming the diagnosis of MPS. Shannon and Keene3 reported that all patients in their study experienced significant pain relief and decreased medial patellar subluxations when they wore a medial patella–stabilizing brace. Shellock and colleagues25 used kinematic MRI to investigate the effect of a patella-realignment brace and found that bracing counteracted patellar subluxation in the majority of knees studied.
Surgical Management
When conservative management fails and patients continue to experience pain and instability, surgical intervention is often required. Although various surgical techniques have been used (Table),3–6,8–10,14,15,27,28 the optimal surgical treatment for MPS has not been identified.
Lateral Retinaculum Imbrication. Lateral retinaculum imbrication has been used to centralize patella tracking and stabilize the patella. Richman and Scheller5 reported on a 17-year-old patient who had isolated medial subluxation of the patella without having undergone a previous lateral release. At 3-month follow-up, there was no recurrent instability; there was only intermittent medial knee soreness with weight-bearing activity.
Lateral Retinaculum Repair/Reconstruction. Hughston and colleagues8 treated 65 knees for MPS. Most had undergone lateral release. Of the 65 knees, 39 were treated with direct repair of the lateral retinaculum, and 26 with reconstruction of the lateral patellotibial ligament using locally available tissue, such as strips of iliotibial band or patellar tendon. Results were good to excellent in 80% of patients at a mean follow-up of 53.7 months. Nonweiler and DeLee6 reconstructed the lateral retinaculum in 5 patients with MPS that developed after isolated lateral retinacular release. Four (80%) of the 5 patients had no symptoms or physical signs of instability at a mean follow-up of 3.3 years. Results were excellent (3 knees) and good (2 knees) according to the Merchant and Mercer rating scale. Akşahin and colleagues28 reported on a single case of spontaneous medial patellar instability. At surgery, imbrication of the lateral structures failed to prevent the medial subluxation. Lateral patellotibial ligament augmentation was performed using an iliotibial band flap that effectively corrected the instability. At 1 year, the patient was characterized as engaging in vigorous recreational activity, according to the clinical score defined by Hughston and colleagues.8 He had mild pain with competitive sports but no pain with daily activity. Abhaykumar and Craig9 reported on 4 surgically treated knees with medial instability. They reconstructed the lateral retinaculum using a strip of fascia lata. By follow-up (5-7 years), each knee had its instability resolved and full ROM restored. Johnson and Wakeley26 reported on a case of iatrogenic MPS after lateral release. Treatment consisted of mobilization and direct repair of the lateral retinaculum. At 12-month follow-up, there was no instability. Although symptom-free with light activity, the patient had patellofemoral pain with strenuous activity. Sanchis-Alfonso and colleagues14 reported the results of isolated lateral retinacular reconstruction for iatrogenic MPS in 17 patients. At mean follow-up of 56 months, results were good or excellent in 65% of patients, and the Lysholm score improved from 36.4 preoperatively to 86.1 postoperatively.
Medial Retinaculum Release. Medial retinaculum release has been used as an alternative to open reconstruction. Shannon and Keene3 reported the results of medial retinacular release procedures on 9 knees. Four (44%) of the 9 patients had either spontaneous or traumatic onset of instability. All cases were treated with arthroscopic medial retinacular release, extending 2 cm medial to the superior pole of the patella down to the anteromedial portal. This avoided releasing the attachment of the vastus medialis oblique muscle to the patella and removing its dynamic medial stabilizing force. At a mean follow-up of 2.7 years, both medial subluxation and knee pain were relieved in all 9 knees without complications or further realignment surgery. Results were excellent in 6 knees (66.7%) and good in 3 knees (33.3%). Shannon and Keene3 emphasized that the procedure should not be used in patients with hypermobile patellae or in cases of failed lateral retinacular releases in which MPS is not clearly and carefully documented.
LPFL Reconstruction. Before coming to our practice, most patients have tried several months of formal physical rehabilitation, medications, and bracing. Many have already had surgical procedures, including arthroscopy, lateral release, and tibial tubercle transfer. When the diagnosis of MPS is suspected after a thorough history and physical examination, LPFL reconstruction is offered. Management of MPS with LPFL reconstruction has yielded excellent and reliable clinical results. Teitge and Torga Spak10 described an LPFL reconstruction technique that is used as a salvage procedure in managing medial iatrogenic patellar instability (the patient’s own quadriceps tendon is used). In their experience, direct repair or imbrication of the lateral retinaculum failed to provide long-term stability because medial excursion usually appeared after 1 year. The 60 patients’ outcomes were excellent with respect to patellar stability, and there were no cases of recurrent subluxation. Borbas and colleagues15 reported a case of LPFL reconstruction in a symptomatic medial subluxated patella resulting from TKA and extended lateral release. Using a free gracilis autograft through patellar bone tunnels to reconstruct the LPFL, the patient was free of pain and very satisfied with the result at 1 year postoperatively. Our current strategy is anatomical reconstruction of the LPFL using a quadriceps tendon graft and no bone tunnels, screws, or anchors in the patella.27 We previously reported a single case of isolated medial instability.4 At 2-year follow-up, there was no recurrent instability, and the functional outcome was excellent. This LPFL reconstruction method has been used in 10 patients with isolated MPS. There has been no residual medial subluxation on follow-up ranging from 3 months to 2 years. Outcome studies are in progress.
Rehabilitation. The initial goal of rehabilitation after surgical reconstruction of the lateral retinaculum or LPFL is to protect the healing soft tissues, restore normal knee ROM, and normalize gait. The knee is immobilized in a brace for weight-bearing activity for 4 to 6 weeks, until limb control is sufficient to prevent rotational stress on the knee. Gradual increase to full weight-bearing without bracing is permitted as quadriceps strength is restored. As motion is regained, strength, balance, and proprioception are emphasized for the entire lower extremity and core.
Functional limb training, including rotational activity, begins at 12 weeks. As strength and neuromuscular control progress, single-leg activity may be started with particular attention to proper alignment of the pelvis and the entire lower extremity. For competitive or recreational athletes, the final stages of rehabilitation focus on dynamic lower extremity control during sport-specific movements. Patients return to unrestricted activity by 6 months to 1 year after surgery.
Summary
MPS is a disabling condition that can limit daily functional activity because of apprehension and pain. Initially described as a complication of lateral retinacular release, isolated MPS can occur in the absence of a previous lateral release. Thorough physical examination and identification during arthroscopy are crucial for proper MPS diagnosis and management. When nonsurgical measures fail, LPFL reconstruction can provide patellofemoral stability and excellent functional outcomes.
1. Marumoto JM, Jordan C, Akins R. A biomechanical comparison of lateral retinacular releases. Am J Sports Med. 1995;23(2):151-155.
2. Betz RR, Magill JT, Lonergan RP. The percutaneous lateral retinacular release. Am J Sports Med. 1987;15(5):477-482.
3. Shannon BD, Keene JS. Results of arthroscopic medial retinacular release for treatment of medial subluxation of the patella. Am J Sports Med. 2007;35(7):1180-1187.
4. Saper MG, Shneider DA. Medial patellar subluxation without previous lateral release: a case report. J Pediatr Orthop B. 2014;23(4):350-353.
5. Richman NM, Scheller AD Jr. Medial subluxation of the patella without previous lateral retinacular release. Orthopedics. 1998;21(7):810-813.
6. Nonweiler DE, DeLee JC. The diagnosis and treatment of medial subluxation of the patella after lateral retinacular release. Am J Sports Med. 1994;22(5):680-686.
7. Hughston JC, Deese M. Medial subluxation of the patella as a complication of lateral retinacular release. Am J Sports Med. 1988;16(4):383-388.
8. Hughston JC, Flandry F, Brinker MR, Terry GC, Mills JC 3rd. Surgical correction of medial subluxation of the patella. Am J Sports Med. 1996;24(4):486-491.
9. Abhaykumar S, Craig DM. Fascia lata sling reconstruction for recurrent medial dislocation of the patella. The Knee. 1999;6(1):55-57.
10. Teitge RA, Torga Spak R. Lateral patellofemoral ligament reconstruction. Arthroscopy. 2004;20(9):998-1002.
11. Kusano M, Horibe S, Tanaka Y, et al. Simultaneous MPFL and LPFL reconstruction for recurrent lateral patellar dislocation with medial patellofemoral instability. Asia-Pac J Sports Med Arthrosc Rehabil Technol. 2014;1:42-46.
12. Saper MG, Shneider DA. Simultaneous medial and lateral patellofemoral ligament reconstruction for combined medial and lateral patellar subluxation. Arthrosc Tech. 2014,3(2):e227-e231.
13. Udagawa K, Niki Y, Matsumoto H, et al. Lateral patellar retinaculum reconstruction for medial patellar instability following lateral retinacular release: a case report. Knee. 2014;21(1):336-339.
14. Sanchis-Alfonso V, Montesinos-Berry E, Monllau JC, Merchant AC. Results of isolated lateral retinacular reconstruction for iatrogenic medial patellar instability. Arthroscopy. 2015;31(3):422-427.
15. Borbas P, Koch PP, Fucentese SF. Lateral patellofemoral ligament reconstruction using a free gracilis autograft. Orthopedics. 2014;37(7):e665-e668.
16. Fulkerson JP, Gossling H. Anatomy of the knee joint lateral retinaculum. Clin Orthop Relat Res. 1980;153:183-188.
17. Kaplan E. Some aspects of functional anatomy of the human knee joint. Clin Orthop Relat Res. 1962;23:18-29.
18. Reider B, Marshall J, Koslin B, Ring B, Girgis F. The anterior aspect of the knee joint. J Bone Joint Surg Am. 1981;63(3):351-356.
19. Navarro MS, Navarro RD, Akita Junior J, Cohen M. Anatomical study of the lateral patellofemoral ligament in cadaver knees. Rev Bras Ortop. 2008;43(7):300-307.
20. Navarro MS, Beltrani Filho CA, Akita Junior J, Navarro RD, Cohen M. Relationship between the lateral patellofemoral ligament and the width of the lateral patellar facet. Acta Ortop Bras. 2010;18(1):19-22.
21. Salsich GB, Ward SR, Terk MR, Powers CM. In vivo assessment of patellofemoral joint contact area in individuals who are pain free. Clin Orthop Relat Res. 2003;417:277-284.
22. Merican AM, Kondo E, Amis AA. The effect on patellofemoral joint stability of selective cutting of lateral retinacular and capsular structures. J Biomech. 2009;42(3):291-296.
23. Vieira EL, Vieira EÁ, da Silva RT, Berlfein PA, Abdalla RJ, Cohen M. An anatomic study of the iliotibial tract. Arthroscopy. 2007;23(3):269-274.
24. Shneider DA. Lateral patellar laxity—identification, significance, treatment. Poster session presented at: Annual Meeting of the American Academy of Orthopaedic Surgeons; February 25-28, 2009; Las Vegas, NV.
25. Shellock FG, Mink JH, Deutsch A, Fox JM, Ferkel RD. Evaluation of patients with persistent symptoms after lateral retinacular release by kinematic magnetic resonance imaging of the patellofemoral joint. Arthroscopy. 1990;6(3):226-234.
26. Johnson DP, Wakeley C. Reconstruction of the lateral patellar retinaculum following lateral release: a case report. Knee Surg Sports Traumatol Arthrosc. 2002;10(6):361-363.
27. Saper MG, Shneider DA. Lateral patellofemoral ligament reconstruction using a quadriceps tendon graft. Arthrosc Tech. 2014;3(4):e445-e448.
28. Akşahin E, Yumrukçal F, Yüksel HY, Doğruyol D, Celebi L. Role of pathophysiology of patellofemoral instability in the treatment of spontaneous medial patellofemoral subluxation: a case report. J Med Case Rep. 2010;4:148.

Biceps Tenodesis and Superior Labrum Anterior to Posterior (SLAP) Tears
Injuries of the superior labrum–biceps complex (SLBC) have been recognized as a cause of shoulder pain since they were first described by Andrews and colleagues1 in 1985. Superior labrum anterior to posterior (SLAP) tears are relatively uncommon injuries of the shoulder, and their true incidence is difficult to establish. However, recently there has been a significant increase in the reported incidence and operative treatment of SLAP tears.2 SLAP tears can occur in isolation, but they are commonly seen in association with other shoulder lesions, including rotator cuff tear, Bankart lesion, glenohumeral arthritis, acromioclavicular joint pathology, and subacromial impingement.
Although SLAP tears are well described and classified,3-6 our understanding of symptomatic SLAP tears and of their contribution to glenohumeral instability is limited. Diagnosing a SLAP tear on the basis of history and physical examination is a clinical challenge. Pain is the most common presentation of SLAP tears, though localization and characterization of pain are variable and nonspecific.7 The mechanism of injury is helpful in acute presentation (traction injury; fall on outstretched, abducted arm), but an overhead athlete may present with no distinct mechanism other than chronic, repetitive use of the shoulder.8-11 Numerous provocative physical examination tests have been used to assist in the diagnosis of SLAP tear, yet there is no consensus regarding the ideal physical examination test, with high sensitivity, specificity, and accuracy.12-14 Magnetic resonance arthrography, the gold standard imaging modality, is highly sensitive and specific (>95%) for diagnosing SLAP tears.
SLAP tear management is based on lesion type and severity, age, functional demands, and presence of coexisting intra-articular lesions. Management options include nonoperative treatment, débridement or repair of SLBC, biceps tenotomy, and biceps tenodesis.15-19
In this 5-point review, we present an evidence-based analysis of the role of the SLBC in glenohumeral stability and the role of biceps tenodesis in the management of SLAP tears.
1. Role of SLBC in stability of glenohumeral joint
The anatomy of the SLBC has been well described,20,21 and there is consensus that SLBC pathology can be a source of shoulder pain. The superior labrum is relatively more mobile than the rest of the glenoid labrum, and it provides attachment to the long head of the biceps tendon (LHBT) and the superior glenohumeral and middle glenohumeral ligaments.
The functional role of the SLBC in glenohumeral stability and its contribution to the pathogenesis of shoulder instability are not clearly defined. Our understanding of SLBC function is largely derived from simulated cadaveric experiments of SLAP tears. Controlled laboratory studies with simulated type II SLAP tears in cadavers have shown significantly increased glenohumeral translation in the anterior-posterior and superior-inferior directions, suggesting a role of the superior labrum in maintaining glenohumeral stability.22-26 Interestingly, there is conflicting evidence regarding restoration of normal glenohumeral translation in cadaveric shoulders after repair of simulated SLAP lesions in the presence or absence of simulated anterior capsular laxity.22,25-27 However, it is important to understand the limitations of cadaveric experiments in order to appreciate and truly comprehend the results of these experiments. There are inconsistencies in the size of simulated type II SLAP lesions in different studies, which can affect the degree of glenohumeral translation and the results of repair.23-25,28 The amount of glenohumeral translation noticed after simulated SLAP tears in cadavers, though statistically significant, is small in amplitude, and its relevance may not translate to a clinically significant level. The impact of dynamic components of stability (eg, rotator cuff muscles), capsular stretch, and other in vivo variables that affect glenohumeral stability are unaccounted for during cadaveric experiments.
LHBT is a recognized cause of shoulder pain, but its contribution to shoulder stability is a point of continued debate. According to one school of thought, LHBT is a vestigial structure that can be sacrificed without any loss of stability. Another school of thought holds that LHBT is an important active stabilizer of the glenohumeral joint. Cadaveric studies have demonstrated that loading the LHBT decreases glenohumeral translation and rotational range of motion, especially in lower and mid ranges of abduction.23,29,30 Furthermore, LHBT contributes to anterior glenohumeral stability by resisting torsional forces in the abducted and externally rotated shoulder and reducing stress on the inferior glenohumeral ligaments.31-33 Strauss and colleagues22 recently found that simulated anterior and posterior type II SLAP lesions in cadaveric shoulders increased glenohumeral translation in all planes, and biceps tenodesis did not further worsen this abnormal glenohumeral translation. Furthermore, repair of posterior SLAP lesions along with biceps tenodesis restored abnormal glenohumeral translation with no significant difference from the baseline in any plane of motion. Again, the limitations of cadaveric studies should be considered when interpreting these results and applying them clinically.
2. Biceps tenodesis as primary treatment for SLAP tears
A growing body of evidence suggests that primary tenodesis of LHBT may be an effective alternative treatment to SLAP repairs in select patients.34-36 However, the evidence is weak, and high-quality studies comparing SLAP repair and primary biceps tenodesis are required in order to make a strong recommendation for one technique over another. Gupta and colleagues35 retrospectively analyzed 28 cases of concomitant SLAP tear and biceps tendonitis treated with primary open subpectoral biceps tenodesis. There was significant improvement in patients’ functional outcome scores postoperatively [SANE (Single Assessment Numeric Evaluation), ASES (American Shoulder and Elbow Surgeons shoulder index), SST (Simple Shoulder Test), VAS (visual analog scale), and SF-12 (Short Form-12)]. In addition, 80% of patients were satisfied with their outcome. Mean age was 43.7 years. Forty-two percent of patients had a worker’s compensation claim. Interestingly, 15 patients in this cohort had a type I SLAP tear. Boileau and colleagues34 prospectively followed 25 cases of type II SLAP tear treated with either SLAP repair (10 patients; mean age, 37 years) or primary arthroscopic biceps tenodesis (15 patients; mean age, 52 years). Compared with the SLAP repair group, the biceps tenodesis group had significantly higher rates of satisfaction and return to previous level of sports participation. However, group assignments were nonrandomized, and the decision to treat a patient with SLAP repair versus biceps tenodesis was made by the senior surgeon purely on the basis of age (SLAP repair for patients under 30 years). Ek and colleagues36 retrospectively compared the cases of 10 patients who underwent SLAP repair (mean age, 32 years) and 15 who underwent biceps tenodesis (mean age, 47 years) for type II SLAP tear. There was no significant difference between the groups with respect to outcome scores, return to play or preinjury activity level, or complications.
There continues to be significant debate as to which patient will benefit from primary SLAP repair versus biceps tenodesis. Multiple factors are involved: age, presence of associated shoulder pathology, occupation, preinjury activity level, and worker’s compensation status. Age has convincingly been shown to affect the outcomes of treatment of type II SLAP tears.34,35,37-40 There is consensus that patients over age 40 years will benefit from primary biceps tenodesis for SLAP tears. However, the evidence for this recommendation is weak.
3. Biceps tenodesis and failed SLAP repair
The definition of a failed SLAP repair is not well documented in the literature, but dissatisfaction after SLAP repair can result from continued shoulder pain, poor shoulder function, or inability to return to preinjury functional level.15,41 The etiologic determination and treatment of a failed SLAP repair are challenging, and outcomes of revision SLAP repair are not very promising.42,43 Biceps tenodesis has been proposed as an alternative treatment to revision SLAP repair for failed SLAP repair. McCormick and colleagues41 prospectively evaluated 42 patients (mean age, 39.2 years; minimum follow-up, 2 years) with failed type II SLAP repairs that were treated with open subpectoral biceps tenodesis. There was significant improvement in ASES, SANE, and Western Ontario Shoulder Instability Index (WOSI) outcome scores and in postoperative shoulder range of motion at a mean follow-up of 3.6 years. One patient had transient musculocutaneous neurapraxia after surgery. In a retrospective cohort study, Gupta and colleagues44 found significant improvement in ASES, SANE, SST, SF-12, and VAS outcome scores in 11 patients who underwent open subpectoral biceps tenodesis for failed arthroscopic SLAP repair (mean age at surgery, 40 years; mean follow-up, 26 months). Three of the 11 patients had worker’s compensation claims, and there were no complications and no revision surgeries required after biceps tenodesis. Werner and colleagues16 retrospectively evaluated 17 patients who underwent biceps tenodesis for failed SLAP repair (mean age, 39 years; minimum follow-up, 2 years). Twenty-nine percent of patients had worker’s compensation claims. Compared with the contralateral shoulder, the treated shoulder had better postoperative ASES, SANE, SST, and Veteran RAND 36-item health survey outcome scores; range of motion was near normal.
There are no high-quality studies comparing revision SLAP repair and biceps tenodesis in the management of failed SLAP repair.16,41-44 Case series studies have found improved outcomes and pain relief after biceps tenodesis for failed SLAP repair, but the quality of evidence has been poor (level IV evidence).16,41-44 The senior author recommends treating failed SLAP repairs with biceps tenodesis.
4. Biceps tenodesis as treatment option for SLAP tear in overhead throwing athletes
Biceps tenodesis is a potential alternative treatment to SLAP repair in overhead throwing athletes. Although outcome scores and satisfaction rates after SLAP repair are high in overhead athletes, the rates of return to sport are relatively low, especially in baseball players.38,45-47 In a level III cohort study, Boileau and colleagues34 found that 13 (87%) of 15 patients with type II SLAP tears, including 8 overhead athletes, had returned to their previous level of activity by a mean of 30 months after biceps tenodesis. In contrast, only 2 of 10 patients returned to their previous level of activity after SLAP repair. Interestingly, 3 patients who underwent biceps tenodesis for failed SLAP repair returned to overhead sports. Schöffl and colleagues48 reported on the outcomes of biceps tenodesis for SLAP lesions in 6 high-level rock climbers. By a mean follow-up of 6 months, all 6 patients had returned to their previous level of climbing. Their satisfaction rate was 96.8%. Gupta and colleagues35 reported on a cohort of 28 patients who underwent biceps tenodesis for SLAP tears and concomitant biceps tendonitis. Of the 8 athletes in the group, 5 were able to return to their previous level of play, and 1 was able to return to a lower level of sporting activity. There was significant improvement from preoperative to postoperative scores on ASES, SST, SANE, VAS, SF-12 overall, and SF-12 components.
Chalmers and colleagues49 recently described motion analyses with simultaneous surface electromyographic measurements in 18 baseball pitchers. Of these 18 players, 7 were uninjured (controls), 6 were pitching after SLAP repair, and 5 were pitching after subpectoral biceps tenodesis. There were no significant differences between controls and postoperative patients with respect to pitching kinematics. Interestingly, compared with the controls and the patients who underwent open biceps tenodesis, the patients who underwent SLAP repair had altered patterns of thoracic rotation during pitching. However, the clinical significance of this finding and the impact of this finding on pitching efficacy are not currently known.
Biceps tenodesis as a primary procedure for type II SLAP lesion in an overhead athlete is a concept in evolution. Increasing evidence suggests a role for primary biceps tenodesis in an overhead athlete with type II SLAP lesion and concomitant biceps pathology. However, this evidence is of poor quality, and the strength of the recommendation is weak. Still to be determined is whether return to preinjury performance level is better with primary biceps tenodesis or with SLAP repair in overhead athletes with type II SLAP lesion. As per the senior author’s treatment algorithm, we prefer SLAP repair for overhead athletes with type II SLAP tears and reserve biceps tenodesis for cases involving significant biceps pathology and/or clinical symptoms involving the bicipital groove consistent with extra-articular biceps pain.
5. Biceps tenodesis for type II SLAP tear in contact athletes and occupations demanding heavy labor (blue-collar jobs)
SLAP tears are less common in contact athletes, and there is general agreement that SLAP repair outcomes are better in contact athletes than in overhead athletes. In a retrospective review of 18 rugby players with SLAP tears, Funk and Snow50 reported excellent results and quicker return to sport after SLAP repair. Patients with isolated SLAP tears had the earliest return to play. Enad and colleagues51 reported SLAP repair outcomes in an active military population. SLAP tears are more common in the military versus the general population because of the unique physical demands placed on military personnel. The authors retrospectively reviewed 27 cases of type II SLAP tears treated with SLAP repair and suture anchors. Outcomes were measured at a mean of 30.5 months after surgery. Twenty-four (89%) of the 27 patients had good to excellent results, and 94% had returned to active duty by a mean of 4.4 months after SLAP repair.
Given the poor-quality evidence in the literature, we believe that biceps tenodesis should be reserved for revision surgery in contact athletes. There is insufficient evidence to recommend biceps tenodesis as primary treatment for type II SLAP tears in contact athletes. SLAP repair should be performed for primary SLAP lesions in contact athletes and for patients in physically demanding professions (eg, military, laborer, weightlifter).
Conclusion
SLAP tears can result in persistent shoulder pain and dysfunction. SLAP tear management depends on lesion type and severity, age, and functional demands. SLAP repair is the treatment of choice for type II SLAP lesions in young, active patients. Biceps tenodesis is a preferred alternative to SLAP repair in failed SLAP repair and in type II SLAP patients who are older than 40 years and who are less active and have a worker’s compensation claim. These recommendations are based on poor-quality evidence. There is an unmet need for randomized clinical studies comparing SLAP repair with biceps tenodesis for type II SLAP tears in different patient populations so as to optimize the current decision-making algorithm for SLAP tears.
1. Andrews JR, Carson WG Jr, McLeod WD. Glenoid labrum tears related to the long head of the biceps. Am J Sports Med. 1985;13(5):337-341.
2. Weber SC, Martin DF, Seiler JG 3rd, Harrast JJ. Superior labrum anterior and posterior lesions of the shoulder: incidence rates, complications, and outcomes as reported by American Board of Orthopaedic Surgery. Part II candidates. Am J Sports Med. 2012;40(7):1538-1543.
3. Snyder SJ, Karzel RP, Del Pizzo W, Ferkel RD, Friedman MJ. SLAP lesions of the shoulder. Arthroscopy. 1990;6(4):274-279.
4. Morgan CD, Burkhart SS, Palmeri M, Gillespie M. Type II SLAP lesions: three subtypes and their relationships to superior instability and rotator cuff tears. Arthroscopy. 1998;14(6):553-565.
5. Powell SE, Nord KD, Ryu RKN. The diagnosis, classification, and treatment of SLAP lesions. Oper Tech Sports Med. 2012;20(1):46-56.
6. Maffet MW, Gartsman GM, Moseley B. Superior labrum-biceps tendon complex lesions of the shoulder. Am J Sports Med. 1995;23(1):93-98.
7. Kim TK, Queale WS, Cosgarea AJ, McFarland EG. Clinical features of the different types of SLAP lesions: an analysis of one hundred and thirty-nine cases. J Bone Joint Surg Am. 2003;85(1):66-71.
8. Abrams GD, Safran MR. Diagnosis and management of superior labrum anterior posterior lesions in overhead athletes. Br J Sports Med. 2010;44(5):311-318.
9. Keener JD, Brophy RH. Superior labral tears of the shoulder: pathogenesis, evaluation, and treatment. J Am Acad Orthop Surg. 2009;17(10):627-637.
10. Abrams GD, Hussey KE, Harris JD, Cole BJ. Clinical results of combined meniscus and femoral osteochondral allograft transplantation: minimum 2-year follow-up. Arthroscopy. 2014;30(8):964-970.e1.
11. Burkhart SS, Morgan CD, Kibler WB. The disabled throwing shoulder: spectrum of pathology part I: pathoanatomy and biomechanics. Arthroscopy. 2003;19(4):404-420.
12. Virk MS, Arciero RA. Superior labrum anterior to posterior tears and glenohumeral instability. Instr Course Lect. 2013;62:501-514.
13. Calvert E, Chambers GK, Regan W, Hawkins RH, Leith JM. Special physical examination tests for superior labrum anterior posterior shoulder tears are clinically limited and invalid: a diagnostic systematic review. J Clin Epidemiol. 2009;62(5):558-563.
14. Jones GL, Galluch DB. Clinical assessment of superior glenoid labral lesions: a systematic review. Clin Orthop Relat Res. 2007;455:45-51.
15. Werner BC, Brockmeier SF, Miller MD. Etiology, diagnosis, and management of failed SLAP repair. J Am Acad Orthop Surg. 2014;22(9):554-565.
16. Werner BC, Pehlivan HC, Hart JM, et al. Biceps tenodesis is a viable option for salvage of failed SLAP repair. J Shoulder Elbow Surg. 2014;23(8):e179-e184.
17. Erickson J, Lavery K, Monica J, Gatt C, Dhawan A. Surgical treatment of symptomatic superior labrum anterior-posterior tears in patients older than 40 years: a systematic review. Am J Sports Med. 2015;43(5):1274-1282.
18. Huri G, Hyun YS, Garbis NG, McFarland EG. Treatment of superior labrum anterior posterior lesions: a literature review. Acta Orthop Traumatol Turc. 2014;48(3):290-297.
19. Li X, Lin TJ, Jager M, et al. Management of type II superior labrum anterior posterior lesions: a review of the literature. Orthop Rev. 2010;2(1):e6.
20. Cooper DE, Arnoczky SP, O’Brien SJ, Warren RF, DiCarlo E, Allen AA. Anatomy, histology, and vascularity of the glenoid labrum. An anatomical study. J Bone Joint Surg Am. 1992;74(1):46-52.
21. Vangsness CT, Jorgenson SS, Watson T, Johnson DL. The origin of the long head of the biceps from the scapula and glenoid labrum. An anatomical study of 100 shoulders. J Bone Joint Surg Br. 1994;76(6):951-954.
22. Strauss EJ, Salata MJ, Sershon RA, et al. Role of the superior labrum after biceps tenodesis in glenohumeral stability. J Shoulder Elbow Surg. 2014;23(4):485-491.
23. Pagnani MJ, Deng XH, Warren RF, Torzilli PA, Altchek DW. Effect of lesions of the superior portion of the glenoid labrum on glenohumeral translation. J Bone Joint Surg Am. 1995;77(7):1003-1010.
24. McMahon PJ, Burkart A, Musahl V, Debski RE. Glenohumeral translations are increased after a type II superior labrum anterior-posterior lesion: a cadaveric study of severity of passive stabilizer injury. J Shoulder Elbow Surg. 2004;13(1):39-44.
25. Burkart A, Debski R, Musahl V, McMahon P, Woo SL. Biomechanical tests for type II SLAP lesions of the shoulder joint before and after arthroscopic repair [in German]. Orthopade. 2003;32(7):600-607.
26. Panossian VR, Mihata T, Tibone JE, Fitzpatrick MJ, McGarry MH, Lee TQ. Biomechanical analysis of isolated type II SLAP lesions and repair. J Shoulder Elbow Surg. 2005;14(5):529-534.
27. Mihata T, McGarry MH, Tibone JE, Fitzpatrick MJ, Kinoshita M, Lee TQ. Biomechanical assessment of type II superior labral anterior-posterior (SLAP) lesions associated with anterior shoulder capsular laxity as seen in throwers: a cadaveric study. Am J Sports Med. 2008;36(8):1604-1610.
28. Youm T, Tibone JE, ElAttrache NS, McGarry MH, Lee TQ. Simulated type II superior labral anterior posterior lesions do not alter the path of glenohumeral articulation: a cadaveric biomechanical study. Am J Sports Med. 2008;36(4):767-774.
29. Youm T, ElAttrache NS, Tibone JE, McGarry MH, Lee TQ. The effect of the long head of the biceps on glenohumeral kinematics. J Shoulder Elbow Surg. 2009;18(1):122-129.
30. McGarry MH, Nguyen ML, Quigley RJ, Hanypsiak B, Gupta R, Lee TQ. The effect of long and short head biceps loading on glenohumeral joint rotational range of motion and humeral head position [published online ahead of print September 26, 2014]. Knee Surg Sports Traumatol Arthrosc.
31. Glousman R, Jobe F, Tibone J, Moynes D, Antonelli D, Perry J. Dynamic electromyographic analysis of the throwing shoulder with glenohumeral instability. J Bone Joint Surg Am. 1988;70(2):220-226.
32. Gowan ID, Jobe FW, Tibone JE, Perry J, Moynes DR. A comparative electromyographic analysis of the shoulder during pitching. Professional versus amateur pitchers. Am J Sports Med. 1987;15(6):586-590.
33. Rodosky MW, Harner CD, Fu FH. The role of the long head of the biceps muscle and superior glenoid labrum in anterior stability of the shoulder. Am J Sports Med. 1994;22(1):121-130.
34. Boileau P, Parratte S, Chuinard C, Roussanne Y, Shia D, Bicknell R. Arthroscopic treatment of isolated type II SLAP lesions: biceps tenodesis as an alternative to reinsertion. Am J Sports Med. 2009;37(5):929-936.
35. Gupta AK, Chalmers PN, Klosterman EL, et al. Subpectoral biceps tenodesis for bicipital tendonitis with SLAP tear. Orthopedics. 2015;38(1):e48-e53.
36. Ek ET, Shi LL, Tompson JD, Freehill MT, Warner JJ. Surgical treatment of isolated type II superior labrum anterior-posterior (SLAP) lesions: repair versus biceps tenodesis. J Shoulder Elbow Surg. 2014;23(7):1059-1065.
37. Alpert JM, Wuerz TH, O’Donnell TF, Carroll KM, Brucker NN, Gill TJ. The effect of age on the outcomes of arthroscopic repair of type II superior labral anterior and posterior lesions. Am J Sports Med. 2010;38(11):2299-2303.
38. Provencher MT, McCormick F, Dewing C, McIntire S, Solomon D. A prospective analysis of 179 type 2 superior labrum anterior and posterior repairs: outcomes and factors associated with success and failure. Am J Sports Med. 2013;41(4):880-886.
39. Denard PJ, Lädermann A, Burkhart SS. Long-term outcome after arthroscopic repair of type II SLAP lesions: results according to age and workers’ compensation status. Arthroscopy. 2012;28(4):451-457.
40. Burns JP, Bahk M, Snyder SJ. Superior labral tears: repair versus biceps tenodesis. J Shoulder Elbow Surg. 2011;20(2 suppl):S2-S8.
41. McCormick F, Nwachukwu BU, Solomon D, et al. The efficacy of biceps tenodesis in the treatment of failed superior labral anterior posterior repairs. Am J Sports Med. 2014;42(4):820-825.
42. Katz LM, Hsu S, Miller SL, et al. Poor outcomes after SLAP repair: descriptive analysis and prognosis. Arthroscopy. 2009;25(8):849-855.
43. Park S, Glousman RE. Outcomes of revision arthroscopic type II superior labral anterior posterior repairs. Am J Sports Med. 2011;39(6):1290-1294.
44. Gupta AK, Bruce B, Klosterman EL, McCormick F, Harris J, Romeo AA. Subpectoral biceps tenodesis for failed type II SLAP repair. Orthopedics. 2013;36(6):e723-e728.
45. Neuman BJ, Boisvert CB, Reiter B, Lawson K, Ciccotti MG, Cohen SB. Results of arthroscopic repair of type II superior labral anterior posterior lesions in overhead athletes: assessment of return to preinjury playing level and satisfaction. Am J Sports Med. 2011;39(9):1883-1888.
46. Fedoriw WW, Ramkumar P, McCulloch PC, Lintner DM. Return to play after treatment of superior labral tears in professional baseball players. Am J Sports Med. 2014;42(5):1155-1160.
47. Park JY, Chung SW, Jeon SH, Lee JG, Oh KS. Clinical and radiological outcomes of type 2 superior labral anterior posterior repairs in elite overhead athletes. Am J Sports Med. 2013;41(6):1372-1379.
48. Schöffl V, Popp D, Dickschass J, Küpper T. Superior labral anterior-posterior lesions in rock climbers—primary double tenodesis? Clin J Sport Med. 2011;21(3):261-263.
49. Chalmers PN, Trombley R, Cip J, et al. Postoperative restoration of upper extremity motion and neuromuscular control during the overhand pitch: evaluation of tenodesis and repair for superior labral anterior-posterior tears. Am J Sports Med. 2014;42(12):2825-2836.
50. Funk L, Snow M. SLAP tears of the glenoid labrum in contact athletes. Clin J Sport Med. 2007;17(1):1-4.
51. Enad JG, Gaines RJ, White SM, Kurtz CA. Arthroscopic superior labrum anterior-posterior repair in military patients. J Shoulder Elbow Surg. 2007;16(3):300-305.
Injuries of the superior labrum–biceps complex (SLBC) have been recognized as a cause of shoulder pain since they were first described by Andrews and colleagues1 in 1985. Superior labrum anterior to posterior (SLAP) tears are relatively uncommon injuries of the shoulder, and their true incidence is difficult to establish. However, recently there has been a significant increase in the reported incidence and operative treatment of SLAP tears.2 SLAP tears can occur in isolation, but they are commonly seen in association with other shoulder lesions, including rotator cuff tear, Bankart lesion, glenohumeral arthritis, acromioclavicular joint pathology, and subacromial impingement.
Although SLAP tears are well described and classified,3-6 our understanding of symptomatic SLAP tears and of their contribution to glenohumeral instability is limited. Diagnosing a SLAP tear on the basis of history and physical examination is a clinical challenge. Pain is the most common presentation of SLAP tears, though localization and characterization of pain are variable and nonspecific.7 The mechanism of injury is helpful in acute presentation (traction injury; fall on outstretched, abducted arm), but an overhead athlete may present with no distinct mechanism other than chronic, repetitive use of the shoulder.8-11 Numerous provocative physical examination tests have been used to assist in the diagnosis of SLAP tear, yet there is no consensus regarding the ideal physical examination test, with high sensitivity, specificity, and accuracy.12-14 Magnetic resonance arthrography, the gold standard imaging modality, is highly sensitive and specific (>95%) for diagnosing SLAP tears.
SLAP tear management is based on lesion type and severity, age, functional demands, and presence of coexisting intra-articular lesions. Management options include nonoperative treatment, débridement or repair of SLBC, biceps tenotomy, and biceps tenodesis.15-19
In this 5-point review, we present an evidence-based analysis of the role of the SLBC in glenohumeral stability and the role of biceps tenodesis in the management of SLAP tears.
1. Role of SLBC in stability of glenohumeral joint
The anatomy of the SLBC has been well described,20,21 and there is consensus that SLBC pathology can be a source of shoulder pain. The superior labrum is relatively more mobile than the rest of the glenoid labrum, and it provides attachment to the long head of the biceps tendon (LHBT) and the superior glenohumeral and middle glenohumeral ligaments.
The functional role of the SLBC in glenohumeral stability and its contribution to the pathogenesis of shoulder instability are not clearly defined. Our understanding of SLBC function is largely derived from simulated cadaveric experiments of SLAP tears. Controlled laboratory studies with simulated type II SLAP tears in cadavers have shown significantly increased glenohumeral translation in the anterior-posterior and superior-inferior directions, suggesting a role of the superior labrum in maintaining glenohumeral stability.22-26 Interestingly, there is conflicting evidence regarding restoration of normal glenohumeral translation in cadaveric shoulders after repair of simulated SLAP lesions in the presence or absence of simulated anterior capsular laxity.22,25-27 However, it is important to understand the limitations of cadaveric experiments in order to appreciate and truly comprehend the results of these experiments. There are inconsistencies in the size of simulated type II SLAP lesions in different studies, which can affect the degree of glenohumeral translation and the results of repair.23-25,28 The amount of glenohumeral translation noticed after simulated SLAP tears in cadavers, though statistically significant, is small in amplitude, and its relevance may not translate to a clinically significant level. The impact of dynamic components of stability (eg, rotator cuff muscles), capsular stretch, and other in vivo variables that affect glenohumeral stability are unaccounted for during cadaveric experiments.
LHBT is a recognized cause of shoulder pain, but its contribution to shoulder stability is a point of continued debate. According to one school of thought, LHBT is a vestigial structure that can be sacrificed without any loss of stability. Another school of thought holds that LHBT is an important active stabilizer of the glenohumeral joint. Cadaveric studies have demonstrated that loading the LHBT decreases glenohumeral translation and rotational range of motion, especially in lower and mid ranges of abduction.23,29,30 Furthermore, LHBT contributes to anterior glenohumeral stability by resisting torsional forces in the abducted and externally rotated shoulder and reducing stress on the inferior glenohumeral ligaments.31-33 Strauss and colleagues22 recently found that simulated anterior and posterior type II SLAP lesions in cadaveric shoulders increased glenohumeral translation in all planes, and biceps tenodesis did not further worsen this abnormal glenohumeral translation. Furthermore, repair of posterior SLAP lesions along with biceps tenodesis restored abnormal glenohumeral translation with no significant difference from the baseline in any plane of motion. Again, the limitations of cadaveric studies should be considered when interpreting these results and applying them clinically.
2. Biceps tenodesis as primary treatment for SLAP tears
A growing body of evidence suggests that primary tenodesis of LHBT may be an effective alternative treatment to SLAP repairs in select patients.34-36 However, the evidence is weak, and high-quality studies comparing SLAP repair and primary biceps tenodesis are required in order to make a strong recommendation for one technique over another. Gupta and colleagues35 retrospectively analyzed 28 cases of concomitant SLAP tear and biceps tendonitis treated with primary open subpectoral biceps tenodesis. There was significant improvement in patients’ functional outcome scores postoperatively [SANE (Single Assessment Numeric Evaluation), ASES (American Shoulder and Elbow Surgeons shoulder index), SST (Simple Shoulder Test), VAS (visual analog scale), and SF-12 (Short Form-12)]. In addition, 80% of patients were satisfied with their outcome. Mean age was 43.7 years. Forty-two percent of patients had a worker’s compensation claim. Interestingly, 15 patients in this cohort had a type I SLAP tear. Boileau and colleagues34 prospectively followed 25 cases of type II SLAP tear treated with either SLAP repair (10 patients; mean age, 37 years) or primary arthroscopic biceps tenodesis (15 patients; mean age, 52 years). Compared with the SLAP repair group, the biceps tenodesis group had significantly higher rates of satisfaction and return to previous level of sports participation. However, group assignments were nonrandomized, and the decision to treat a patient with SLAP repair versus biceps tenodesis was made by the senior surgeon purely on the basis of age (SLAP repair for patients under 30 years). Ek and colleagues36 retrospectively compared the cases of 10 patients who underwent SLAP repair (mean age, 32 years) and 15 who underwent biceps tenodesis (mean age, 47 years) for type II SLAP tear. There was no significant difference between the groups with respect to outcome scores, return to play or preinjury activity level, or complications.
There continues to be significant debate as to which patient will benefit from primary SLAP repair versus biceps tenodesis. Multiple factors are involved: age, presence of associated shoulder pathology, occupation, preinjury activity level, and worker’s compensation status. Age has convincingly been shown to affect the outcomes of treatment of type II SLAP tears.34,35,37-40 There is consensus that patients over age 40 years will benefit from primary biceps tenodesis for SLAP tears. However, the evidence for this recommendation is weak.
3. Biceps tenodesis and failed SLAP repair
The definition of a failed SLAP repair is not well documented in the literature, but dissatisfaction after SLAP repair can result from continued shoulder pain, poor shoulder function, or inability to return to preinjury functional level.15,41 The etiologic determination and treatment of a failed SLAP repair are challenging, and outcomes of revision SLAP repair are not very promising.42,43 Biceps tenodesis has been proposed as an alternative treatment to revision SLAP repair for failed SLAP repair. McCormick and colleagues41 prospectively evaluated 42 patients (mean age, 39.2 years; minimum follow-up, 2 years) with failed type II SLAP repairs that were treated with open subpectoral biceps tenodesis. There was significant improvement in ASES, SANE, and Western Ontario Shoulder Instability Index (WOSI) outcome scores and in postoperative shoulder range of motion at a mean follow-up of 3.6 years. One patient had transient musculocutaneous neurapraxia after surgery. In a retrospective cohort study, Gupta and colleagues44 found significant improvement in ASES, SANE, SST, SF-12, and VAS outcome scores in 11 patients who underwent open subpectoral biceps tenodesis for failed arthroscopic SLAP repair (mean age at surgery, 40 years; mean follow-up, 26 months). Three of the 11 patients had worker’s compensation claims, and there were no complications and no revision surgeries required after biceps tenodesis. Werner and colleagues16 retrospectively evaluated 17 patients who underwent biceps tenodesis for failed SLAP repair (mean age, 39 years; minimum follow-up, 2 years). Twenty-nine percent of patients had worker’s compensation claims. Compared with the contralateral shoulder, the treated shoulder had better postoperative ASES, SANE, SST, and Veteran RAND 36-item health survey outcome scores; range of motion was near normal.
There are no high-quality studies comparing revision SLAP repair and biceps tenodesis in the management of failed SLAP repair.16,41-44 Case series studies have found improved outcomes and pain relief after biceps tenodesis for failed SLAP repair, but the quality of evidence has been poor (level IV evidence).16,41-44 The senior author recommends treating failed SLAP repairs with biceps tenodesis.
4. Biceps tenodesis as treatment option for SLAP tear in overhead throwing athletes
Biceps tenodesis is a potential alternative treatment to SLAP repair in overhead throwing athletes. Although outcome scores and satisfaction rates after SLAP repair are high in overhead athletes, the rates of return to sport are relatively low, especially in baseball players.38,45-47 In a level III cohort study, Boileau and colleagues34 found that 13 (87%) of 15 patients with type II SLAP tears, including 8 overhead athletes, had returned to their previous level of activity by a mean of 30 months after biceps tenodesis. In contrast, only 2 of 10 patients returned to their previous level of activity after SLAP repair. Interestingly, 3 patients who underwent biceps tenodesis for failed SLAP repair returned to overhead sports. Schöffl and colleagues48 reported on the outcomes of biceps tenodesis for SLAP lesions in 6 high-level rock climbers. By a mean follow-up of 6 months, all 6 patients had returned to their previous level of climbing. Their satisfaction rate was 96.8%. Gupta and colleagues35 reported on a cohort of 28 patients who underwent biceps tenodesis for SLAP tears and concomitant biceps tendonitis. Of the 8 athletes in the group, 5 were able to return to their previous level of play, and 1 was able to return to a lower level of sporting activity. There was significant improvement from preoperative to postoperative scores on ASES, SST, SANE, VAS, SF-12 overall, and SF-12 components.
Chalmers and colleagues49 recently described motion analyses with simultaneous surface electromyographic measurements in 18 baseball pitchers. Of these 18 players, 7 were uninjured (controls), 6 were pitching after SLAP repair, and 5 were pitching after subpectoral biceps tenodesis. There were no significant differences between controls and postoperative patients with respect to pitching kinematics. Interestingly, compared with the controls and the patients who underwent open biceps tenodesis, the patients who underwent SLAP repair had altered patterns of thoracic rotation during pitching. However, the clinical significance of this finding and the impact of this finding on pitching efficacy are not currently known.
Biceps tenodesis as a primary procedure for type II SLAP lesion in an overhead athlete is a concept in evolution. Increasing evidence suggests a role for primary biceps tenodesis in an overhead athlete with type II SLAP lesion and concomitant biceps pathology. However, this evidence is of poor quality, and the strength of the recommendation is weak. Still to be determined is whether return to preinjury performance level is better with primary biceps tenodesis or with SLAP repair in overhead athletes with type II SLAP lesion. As per the senior author’s treatment algorithm, we prefer SLAP repair for overhead athletes with type II SLAP tears and reserve biceps tenodesis for cases involving significant biceps pathology and/or clinical symptoms involving the bicipital groove consistent with extra-articular biceps pain.
5. Biceps tenodesis for type II SLAP tear in contact athletes and occupations demanding heavy labor (blue-collar jobs)
SLAP tears are less common in contact athletes, and there is general agreement that SLAP repair outcomes are better in contact athletes than in overhead athletes. In a retrospective review of 18 rugby players with SLAP tears, Funk and Snow50 reported excellent results and quicker return to sport after SLAP repair. Patients with isolated SLAP tears had the earliest return to play. Enad and colleagues51 reported SLAP repair outcomes in an active military population. SLAP tears are more common in the military versus the general population because of the unique physical demands placed on military personnel. The authors retrospectively reviewed 27 cases of type II SLAP tears treated with SLAP repair and suture anchors. Outcomes were measured at a mean of 30.5 months after surgery. Twenty-four (89%) of the 27 patients had good to excellent results, and 94% had returned to active duty by a mean of 4.4 months after SLAP repair.
Given the poor-quality evidence in the literature, we believe that biceps tenodesis should be reserved for revision surgery in contact athletes. There is insufficient evidence to recommend biceps tenodesis as primary treatment for type II SLAP tears in contact athletes. SLAP repair should be performed for primary SLAP lesions in contact athletes and for patients in physically demanding professions (eg, military, laborer, weightlifter).
Conclusion
SLAP tears can result in persistent shoulder pain and dysfunction. SLAP tear management depends on lesion type and severity, age, and functional demands. SLAP repair is the treatment of choice for type II SLAP lesions in young, active patients. Biceps tenodesis is a preferred alternative to SLAP repair in failed SLAP repair and in type II SLAP patients who are older than 40 years and who are less active and have a worker’s compensation claim. These recommendations are based on poor-quality evidence. There is an unmet need for randomized clinical studies comparing SLAP repair with biceps tenodesis for type II SLAP tears in different patient populations so as to optimize the current decision-making algorithm for SLAP tears.
1. Andrews JR, Carson WG Jr, McLeod WD. Glenoid labrum tears related to the long head of the biceps. Am J Sports Med. 1985;13(5):337-341.
2. Weber SC, Martin DF, Seiler JG 3rd, Harrast JJ. Superior labrum anterior and posterior lesions of the shoulder: incidence rates, complications, and outcomes as reported by American Board of Orthopaedic Surgery. Part II candidates. Am J Sports Med. 2012;40(7):1538-1543.
3. Snyder SJ, Karzel RP, Del Pizzo W, Ferkel RD, Friedman MJ. SLAP lesions of the shoulder. Arthroscopy. 1990;6(4):274-279.
4. Morgan CD, Burkhart SS, Palmeri M, Gillespie M. Type II SLAP lesions: three subtypes and their relationships to superior instability and rotator cuff tears. Arthroscopy. 1998;14(6):553-565.
5. Powell SE, Nord KD, Ryu RKN. The diagnosis, classification, and treatment of SLAP lesions. Oper Tech Sports Med. 2012;20(1):46-56.
6. Maffet MW, Gartsman GM, Moseley B. Superior labrum-biceps tendon complex lesions of the shoulder. Am J Sports Med. 1995;23(1):93-98.
7. Kim TK, Queale WS, Cosgarea AJ, McFarland EG. Clinical features of the different types of SLAP lesions: an analysis of one hundred and thirty-nine cases. J Bone Joint Surg Am. 2003;85(1):66-71.
8. Abrams GD, Safran MR. Diagnosis and management of superior labrum anterior posterior lesions in overhead athletes. Br J Sports Med. 2010;44(5):311-318.
9. Keener JD, Brophy RH. Superior labral tears of the shoulder: pathogenesis, evaluation, and treatment. J Am Acad Orthop Surg. 2009;17(10):627-637.
10. Abrams GD, Hussey KE, Harris JD, Cole BJ. Clinical results of combined meniscus and femoral osteochondral allograft transplantation: minimum 2-year follow-up. Arthroscopy. 2014;30(8):964-970.e1.
11. Burkhart SS, Morgan CD, Kibler WB. The disabled throwing shoulder: spectrum of pathology part I: pathoanatomy and biomechanics. Arthroscopy. 2003;19(4):404-420.
12. Virk MS, Arciero RA. Superior labrum anterior to posterior tears and glenohumeral instability. Instr Course Lect. 2013;62:501-514.
13. Calvert E, Chambers GK, Regan W, Hawkins RH, Leith JM. Special physical examination tests for superior labrum anterior posterior shoulder tears are clinically limited and invalid: a diagnostic systematic review. J Clin Epidemiol. 2009;62(5):558-563.
14. Jones GL, Galluch DB. Clinical assessment of superior glenoid labral lesions: a systematic review. Clin Orthop Relat Res. 2007;455:45-51.
15. Werner BC, Brockmeier SF, Miller MD. Etiology, diagnosis, and management of failed SLAP repair. J Am Acad Orthop Surg. 2014;22(9):554-565.
16. Werner BC, Pehlivan HC, Hart JM, et al. Biceps tenodesis is a viable option for salvage of failed SLAP repair. J Shoulder Elbow Surg. 2014;23(8):e179-e184.
17. Erickson J, Lavery K, Monica J, Gatt C, Dhawan A. Surgical treatment of symptomatic superior labrum anterior-posterior tears in patients older than 40 years: a systematic review. Am J Sports Med. 2015;43(5):1274-1282.
18. Huri G, Hyun YS, Garbis NG, McFarland EG. Treatment of superior labrum anterior posterior lesions: a literature review. Acta Orthop Traumatol Turc. 2014;48(3):290-297.
19. Li X, Lin TJ, Jager M, et al. Management of type II superior labrum anterior posterior lesions: a review of the literature. Orthop Rev. 2010;2(1):e6.
20. Cooper DE, Arnoczky SP, O’Brien SJ, Warren RF, DiCarlo E, Allen AA. Anatomy, histology, and vascularity of the glenoid labrum. An anatomical study. J Bone Joint Surg Am. 1992;74(1):46-52.
21. Vangsness CT, Jorgenson SS, Watson T, Johnson DL. The origin of the long head of the biceps from the scapula and glenoid labrum. An anatomical study of 100 shoulders. J Bone Joint Surg Br. 1994;76(6):951-954.
22. Strauss EJ, Salata MJ, Sershon RA, et al. Role of the superior labrum after biceps tenodesis in glenohumeral stability. J Shoulder Elbow Surg. 2014;23(4):485-491.
23. Pagnani MJ, Deng XH, Warren RF, Torzilli PA, Altchek DW. Effect of lesions of the superior portion of the glenoid labrum on glenohumeral translation. J Bone Joint Surg Am. 1995;77(7):1003-1010.
24. McMahon PJ, Burkart A, Musahl V, Debski RE. Glenohumeral translations are increased after a type II superior labrum anterior-posterior lesion: a cadaveric study of severity of passive stabilizer injury. J Shoulder Elbow Surg. 2004;13(1):39-44.
25. Burkart A, Debski R, Musahl V, McMahon P, Woo SL. Biomechanical tests for type II SLAP lesions of the shoulder joint before and after arthroscopic repair [in German]. Orthopade. 2003;32(7):600-607.
26. Panossian VR, Mihata T, Tibone JE, Fitzpatrick MJ, McGarry MH, Lee TQ. Biomechanical analysis of isolated type II SLAP lesions and repair. J Shoulder Elbow Surg. 2005;14(5):529-534.
27. Mihata T, McGarry MH, Tibone JE, Fitzpatrick MJ, Kinoshita M, Lee TQ. Biomechanical assessment of type II superior labral anterior-posterior (SLAP) lesions associated with anterior shoulder capsular laxity as seen in throwers: a cadaveric study. Am J Sports Med. 2008;36(8):1604-1610.
28. Youm T, Tibone JE, ElAttrache NS, McGarry MH, Lee TQ. Simulated type II superior labral anterior posterior lesions do not alter the path of glenohumeral articulation: a cadaveric biomechanical study. Am J Sports Med. 2008;36(4):767-774.
29. Youm T, ElAttrache NS, Tibone JE, McGarry MH, Lee TQ. The effect of the long head of the biceps on glenohumeral kinematics. J Shoulder Elbow Surg. 2009;18(1):122-129.
30. McGarry MH, Nguyen ML, Quigley RJ, Hanypsiak B, Gupta R, Lee TQ. The effect of long and short head biceps loading on glenohumeral joint rotational range of motion and humeral head position [published online ahead of print September 26, 2014]. Knee Surg Sports Traumatol Arthrosc.
31. Glousman R, Jobe F, Tibone J, Moynes D, Antonelli D, Perry J. Dynamic electromyographic analysis of the throwing shoulder with glenohumeral instability. J Bone Joint Surg Am. 1988;70(2):220-226.
32. Gowan ID, Jobe FW, Tibone JE, Perry J, Moynes DR. A comparative electromyographic analysis of the shoulder during pitching. Professional versus amateur pitchers. Am J Sports Med. 1987;15(6):586-590.
33. Rodosky MW, Harner CD, Fu FH. The role of the long head of the biceps muscle and superior glenoid labrum in anterior stability of the shoulder. Am J Sports Med. 1994;22(1):121-130.
34. Boileau P, Parratte S, Chuinard C, Roussanne Y, Shia D, Bicknell R. Arthroscopic treatment of isolated type II SLAP lesions: biceps tenodesis as an alternative to reinsertion. Am J Sports Med. 2009;37(5):929-936.
35. Gupta AK, Chalmers PN, Klosterman EL, et al. Subpectoral biceps tenodesis for bicipital tendonitis with SLAP tear. Orthopedics. 2015;38(1):e48-e53.
36. Ek ET, Shi LL, Tompson JD, Freehill MT, Warner JJ. Surgical treatment of isolated type II superior labrum anterior-posterior (SLAP) lesions: repair versus biceps tenodesis. J Shoulder Elbow Surg. 2014;23(7):1059-1065.
37. Alpert JM, Wuerz TH, O’Donnell TF, Carroll KM, Brucker NN, Gill TJ. The effect of age on the outcomes of arthroscopic repair of type II superior labral anterior and posterior lesions. Am J Sports Med. 2010;38(11):2299-2303.
38. Provencher MT, McCormick F, Dewing C, McIntire S, Solomon D. A prospective analysis of 179 type 2 superior labrum anterior and posterior repairs: outcomes and factors associated with success and failure. Am J Sports Med. 2013;41(4):880-886.
39. Denard PJ, Lädermann A, Burkhart SS. Long-term outcome after arthroscopic repair of type II SLAP lesions: results according to age and workers’ compensation status. Arthroscopy. 2012;28(4):451-457.
40. Burns JP, Bahk M, Snyder SJ. Superior labral tears: repair versus biceps tenodesis. J Shoulder Elbow Surg. 2011;20(2 suppl):S2-S8.
41. McCormick F, Nwachukwu BU, Solomon D, et al. The efficacy of biceps tenodesis in the treatment of failed superior labral anterior posterior repairs. Am J Sports Med. 2014;42(4):820-825.
42. Katz LM, Hsu S, Miller SL, et al. Poor outcomes after SLAP repair: descriptive analysis and prognosis. Arthroscopy. 2009;25(8):849-855.
43. Park S, Glousman RE. Outcomes of revision arthroscopic type II superior labral anterior posterior repairs. Am J Sports Med. 2011;39(6):1290-1294.
44. Gupta AK, Bruce B, Klosterman EL, McCormick F, Harris J, Romeo AA. Subpectoral biceps tenodesis for failed type II SLAP repair. Orthopedics. 2013;36(6):e723-e728.
45. Neuman BJ, Boisvert CB, Reiter B, Lawson K, Ciccotti MG, Cohen SB. Results of arthroscopic repair of type II superior labral anterior posterior lesions in overhead athletes: assessment of return to preinjury playing level and satisfaction. Am J Sports Med. 2011;39(9):1883-1888.
46. Fedoriw WW, Ramkumar P, McCulloch PC, Lintner DM. Return to play after treatment of superior labral tears in professional baseball players. Am J Sports Med. 2014;42(5):1155-1160.
47. Park JY, Chung SW, Jeon SH, Lee JG, Oh KS. Clinical and radiological outcomes of type 2 superior labral anterior posterior repairs in elite overhead athletes. Am J Sports Med. 2013;41(6):1372-1379.
48. Schöffl V, Popp D, Dickschass J, Küpper T. Superior labral anterior-posterior lesions in rock climbers—primary double tenodesis? Clin J Sport Med. 2011;21(3):261-263.
49. Chalmers PN, Trombley R, Cip J, et al. Postoperative restoration of upper extremity motion and neuromuscular control during the overhand pitch: evaluation of tenodesis and repair for superior labral anterior-posterior tears. Am J Sports Med. 2014;42(12):2825-2836.
50. Funk L, Snow M. SLAP tears of the glenoid labrum in contact athletes. Clin J Sport Med. 2007;17(1):1-4.
51. Enad JG, Gaines RJ, White SM, Kurtz CA. Arthroscopic superior labrum anterior-posterior repair in military patients. J Shoulder Elbow Surg. 2007;16(3):300-305.
Implications of the GOLD COPD Classification and Guidelines
After a busy day in the primary care clinic, having finished the day’s dictations and called a patient to discuss the results of his lipid panel, Dr. B reviews tomorrow’s schedule, and notices 2 patients with a primary diagnosis of chronic obstructive pulmonary disease (COPD). Dr. B recalls a recent publication on changes in the classification of COPD by the Global Initiative for Chronic Obstructive Lung Disease (GOLD).1 She remembers the main message being the degree of airway obstruction as measured by the forced expiratory volume in the first second (FEV1) is now considered insufficient to classify COPD severity and to make a therapeutic decision. This paradigm shift contradicts the familiar concept that FEV1 is the cornerstone piece of information in COPD, resulting in some degree of uncertainty about how to apply this in the practice. Dr. B. considers a multitude of practical questions, including: Is there a good reason to change the classification of COPD? How easy is it to use?
Will it make any therapeutic differences to my patients? In this article, the authors attempt to answer these and other questions prompted by the recent changes in the GOLD classification, with emphasis on its clinical use.
A Heterogeneous Condition
Spirometry is central to the diagnosis of obstructive lung diseases, including COPD and asthma. The diagnosis of COPD requires demonstration of an obstructive ventilatory defect in the spirometry, usually defined as a ratio of FEV1 to forced vital capacity (FVC) below 70% (FEV1/FVC < 0.7). FEV1 is still important, not only to confirm the diagnosis of airflow obstruction, but because it predicts mortality when severely reduced. However, during the last decade severity of airflow limitation has been challenged as a descriptor of both symptom burden and consequences of COPD by data from large studies.2 For example, it has been demonstrated that 2 patients with the same degree of obstruction, measured by the FEV1 percentage predicted, can provide the physician with very different experiences about the impact of their disease in daily life.3 These differences extend to the severity of their dyspnea; their exercise capacity, as seen in the sixminute walking distance test (6MWD); or their perceived quality of life (QOL), measured by the score on the Saint George’s Respiratory Questionnaire (SGRQ). These measures of disease impact show an extremely low correlation with FEV1: a correlation of 0.36 with the severity of dyspnea, 0.34 with 6MWD, and 0.38 with the SGRQ total score.2 These newer studies imply that while spirometry is important, it captures only a small portion of the symptomatic and functional impact of COPD.
Increasing interest in understanding the differences between COPD subjects has been the main motivation in identifying distinct COPD phenotypes, subgroups of patients with similar disease experience, probable similar underlying pathogenic mechanisms, similar outcomes, and perhaps specific treatment alternatives.4,5 The severity of airflow limitation, as measured by FEV1 percent predicted, is not always related with some of the emerging COPD phenotypes (eg, chronic bronchitis predominant phenotype, frequent exacerbation phenotype).6-8 Chronic bronchitis can be present across the whole spectrum of spirometry severity, and is always associated with poorer QOL and worse clinical outcomes. Similarly, there are patients with frequent exacerbation phenotype (defined as ≥ 2 exacerbations/year) at every level of airflow obstruction, and the phenotype tends to be stable, meaning that previous frequent exacerbations are a good predictor of future exacerbations.8
With all this information, participants in the development of the GOLD guidelines determined that although FEV1 is still a good descriptor of COPD severity and potential for poor outcomes (exacerbation frequency, mortality), a more comprehensive description of COPD needed the addition of data on the impact of symptoms (particularly dyspnea), and the future risk of poor COPD related events (exacerbations, death, disease progression).5 Hence, in response to Dr. B.’s question, it seems that a new approach to the way that we classify COPD was overdue, making it important to gather additional patient information, beyond FEV1.
GOLD Category Classification
An important difference from previous classifications is that the new GOLD categories use lettered groups, from A to D, not just grades of severity; however, the severity of the ventilatory defect measured by FEV1 is still graded from 1 to 4 and is still part of the classification.9
Placing a patient in the new groups is based on 2 questions: (1) How severe are the symptoms, particularly dyspnea; and (2) Is the patient at high or low risk of poor COPD-related outcomes? The first question (symptoms severity) can be systematically approached using 1 of 2 different instruments to grade COPD symptoms: the modified Medical Research Council dyspnea score (mMRC) or the COPD Assessment Test (CAT), a more recently developed instrument to quantify COPD impact.10,11
Use of CAT score, a more comprehensive descriptor of COPD impact, is the preferred method by guideline developers. If the practitioner is more familiar with the mMRC and wishes to use it instead, the result can be simplified as low (0-1 points) or high symptoms burden (≥ 2 points). The mMRC is based on the answer to the level of effort triggering dyspnea: a score of 1 means that the patient “get[s] shorter of breath when hurrying on a level surface or walking up a slight hill”; a score of 2 means that the patient “walk[s] slower than people of the same age while walking on a level surface because of breathlessness, or I have to stop for breath when walking on my own pace on the level.” Hence, the first step to classify a patient can be as simple as asking about dyspnea, surely part of the history taking process.
The second question (risk of poor COPD-related outcomes) can be answered by using the grade of obstruction by FEV1 or asking about the frequency of exacerbations in the previous year. If FEV1 is used, those with FEV1 percentage predicted ≥ 50% are considered as “low risk”; if the airflow obstruction is more severe (previously grades 3-4), the patient is at “high risk” of future events. If the exacerbation frequency is used, ≤ 1 outpatient-treated exacerbation in the previous year qualify as “low,” and ≥ 2 as “high risk.” There is an additional alternative way to identify high risk: all patients with any (≥ 1 per year) exacerbation requiring hospital admission are considered at high risk.
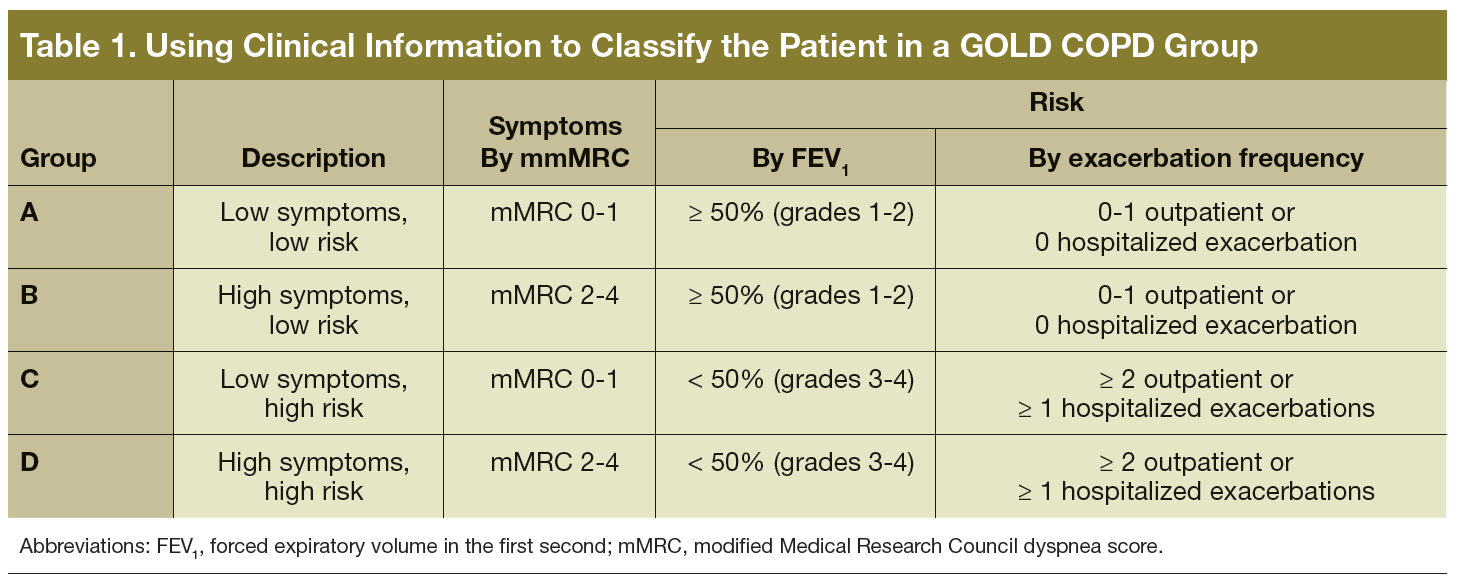
The next step is combining both symptoms and risk to create 4 mutually exclusive groups, which will be relevant to select the appropriate treatment (Table 1). The groups can also be represented graphically using a 2x2 figure, with the horizontal axis being symptoms severity, and the vertical (risk) either FEV1 or exacerbation history (Figure 1). If there is a discrepancy between the risk judged by lung function and history of exacerbations, it is recommended to use the answer corresponding to the worse category.12
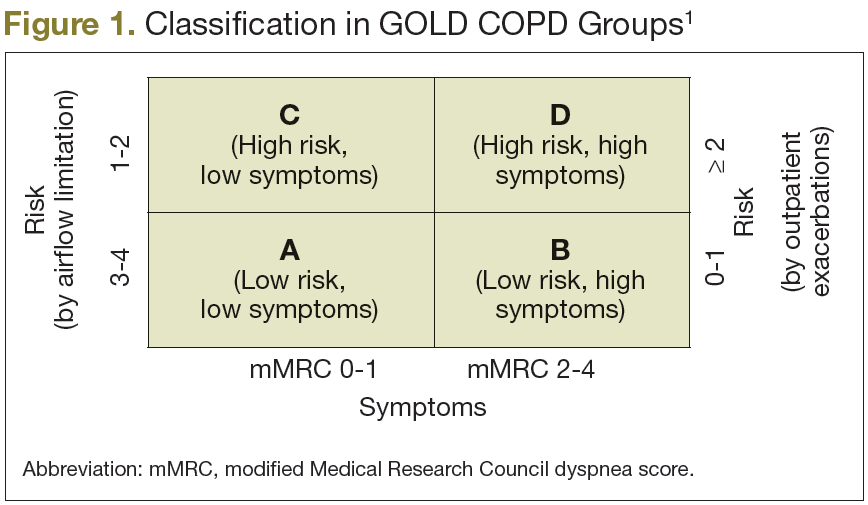
GOLD Guideline-Based Treatment
The new classification should also help to identify the patient’s main needs: controlling symptoms, reducing future risks, or both. Based on the results of available randomized clinical trials, GOLD guideline developers suggest grouptailored strategies of management (Table 2, Figure 2).
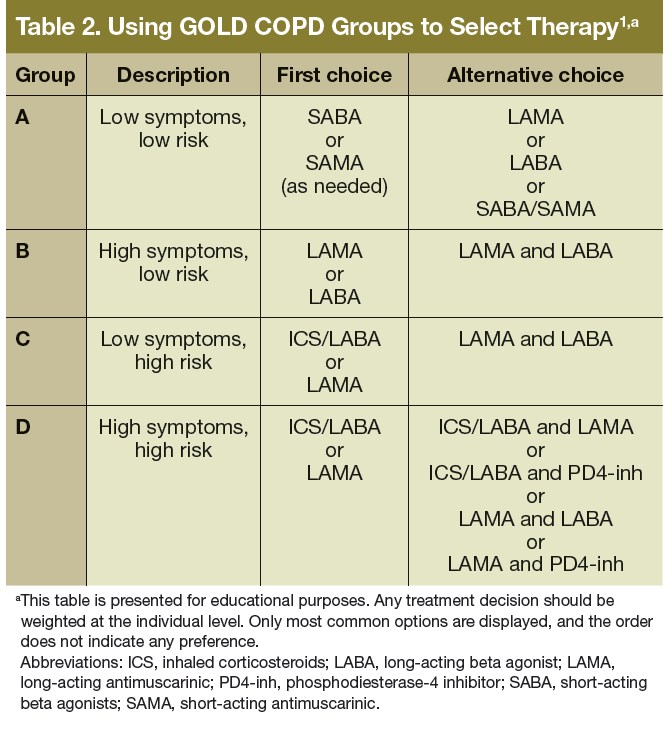
Group A: Low Risk and Low Symptoms
The goal is to treat only as needed, using shortacting medications. No preference was given to the type of short-acting medication and the practitioner could select between short-acting beta agonists (SABAs) or short-acting anticholinergic (also known as short-acting antimuscarinic [SAMA]) medication as first-line therapy. Second-line therapy includes either the combination of both families of short-acting medications in 1 inhaler, or the use of 1 long-acting inhaler. As a rule of thumb, no patient in this group should be on more than 1 inhaler, and the combination of short and long-acting medications is not part of the recommendations. Patients in group A, and indeed everyone with COPD, benefit from respiratory immunizations and tobacco cessation.
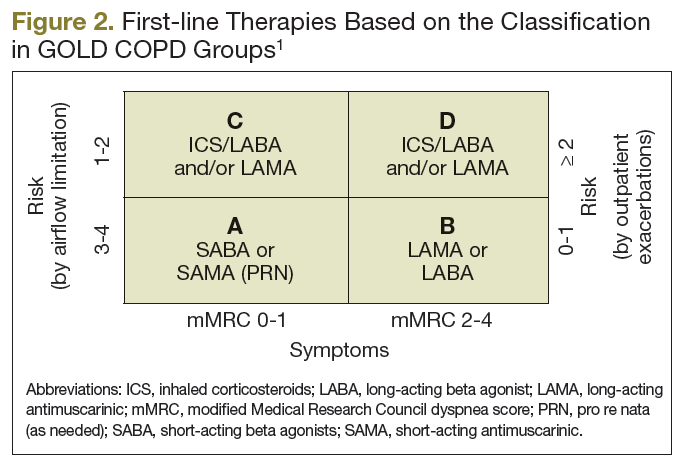
Group B: Low Risk, High Symptoms
Again, the goal of treatment is symptom control. Based on the available evidence, this can be achieved using long-acting bronchodilators, without the need of inhaled corticosteroids (ICS). The first line of treatment should be just 1 bronchodilator, either a long-acting antimuscarinic (LAMA) or long-actingbeta agonist (LABA). These could be used together as second-line treatment (LAMA plus LABA), still without indication for ICS. It is important to remember that dyspnea, or other symptoms, could also be a manifestation of comorbid conditions, such as cardiovascular disease, obesity, deconditioning, and musculoskeletal diseases.13 When spirometry is not used to confirm the diagnosis of COPD, patients may receive incremental types of inhalers instead of being evaluated for other causes of dyspnea, which might have led to more appropriate specific therapy.14 As a result, judicious evaluation of the patient’s symptomsis recommended. The guidelines also recommend programs that increase physical activity for this group of patients, as well to those in groups C and D, as this can improve symptoms and decrease risk of exacerbations.15
Group C: High Risk, Low Symptoms
The combination of ICS/LABA is the first-line therapy for this group, based on data showing the superiority of the ICS/LABA combination over monotherapy to reduce exacerbations and symptoms, as well as to improve QOL.16,17 Monotherapy LABA is also a first-line GOLD recommendation. Selecting between ICS/LABA vs LABA should be individualized based on the reason that the patient was judged as high risk. In the authors’ practice, if
the risk is based only in spirometry values, using LABA as monotherapy is a good choice, while if the definition of high risk was based on the frequency of exacerbations, ICS/LABA is the first choice. The GOLD guidelines list the combination of LABA/LAMA as second-line therapy.
Group D: High Risk and High Symptoms
First-line therapy for this group is essentially the same that for group C, with similar considerations. The combination of LABA/LAMA is also recommended as second-line therapy, as well as the use of ICS/LABA and LAMA (all 3 major classes of controller medications together). It is worth noting that phosphodiesterase-4 inhibitors (PDE4-inh, roflumilast being the best known) can be considered as a third-line of therapy (in group C) or as part of secondline combinations (in group D).
Benefits and Limitations of GOLD
There is no doubt that the new classification system and treatment guidelines are a significant step forward, intended to foster the development of more personalized decisions for COPD patients. The guidelines are the first attempt to incorporate the concepts of phenotypes (frequent exacerbation phenotype), disease heterogeneity (the variation in outcomes for the same degree of airflow obstruction), and the differences between the burden of symptoms and the risk of outcomes. The guidelines incorporate the need to weigh the benefits and risks of medications at the individual level (eg, ICS without an accompanying long-acting agent are not recommended in any group, and ICS use is reserved for those with high risk, especially if the designation is based on exacerbation frequency). The guidelines also stress the importance of examining comorbidities, emphysizing that their management should in no way be altered just because the patient also has COPD. Relative to the previous staging based only on FEV1 values, this new classification system has been shown to have appropriate predictive ability and association with the risk of exacerbations, and better correlation with measures of quality of life and costs of care.18,19 The guidelines, initially released in 2011 and slightly updated recently, are in continuous development and have been subject to intense evaluation.
Some limitations have been found (eg, the classification is still not the best predictor of mortality, but has the same ability to predict hospital admission as the previous spirometry-based system).18,20,21 Hence, it should be no surprise that modifications will likely be released in the near future.
The treatment recommendations associated with the current classification are based on the best evidence available and expert opinion, as no published clinical trials have compared the group-based therapy system to standard therapies. Evaluations of their effectiveness in real-life practice are still to be released. Previous, less complex guidelines, based on spirometry stages, were followed < 60% of the time in actual practice, thus it will be surprising to find high adherence to the current recommendations, but evaluations are still in progress.22
Conclusion
The best way for primary care providers to incorporate the GOLD guidelines into daily practice is to remember that COPD is very heterogeneous. Although spirometry is important, it is also essential to inquire about exacerbation frequency and symptoms severity. It is encouraging that for each of the relevant questions needed to classify the patient, there is a clear, easy to remember cut point. First, look at symptoms (low or high burden, based on the presence of dyspnea), then to judge risk look at FEV1 percentage predicted (using 50% as a cutpoint) and at exacerbation frequency (using 2 per year as the cut point). With those simple questions, build the groups, based on the combination of answers, and select the appropriate therapy. The general assumptions are that short-acting medications are appropriate for infrequent symptoms, long-acting medications are used to control symptoms and prevent exacerbations in more severe disease, and that ICS (always in combination with LABA) are reserved for those in the high-risk groups, especially if high risk is defined by frequent exacerbations. This summary should be supplemented with the judicious use of the tables and figures provided in this review, and available with detailed description and discussion in the original sources.1
Author disclosures
The author reports no actual or potential conflicts of interest with regard to this article.
Disclaimer
The opinions expressed herein are those of the author and do not necessarily reflect those of Federal Practitioner; Frontline Medical Communications Inc.; the Department of Defense, or its Components; and the U.S. Government, or any of its agencies. This article may discuss unlabeled or investigational use of certain drugs. Please review complete prescribing information for specific drugs or drug combinations—including indications, contraindications, warnings, and adverse effects—before administering pharmacologic therapy to patients.
Click here to read the digital edition.
1. Vestbo J, Hurd SS, Agustí AG, et al. Global strategy for the diagnosis, management, and prevention of chronic obstructive pulmonary disease: GOLD executive summary. Am J Respir Crit Care Med. 2013;187(4):347-365.
2. Agusti A, Calverley PM, Celli B, et al; Evaluation of COPD Longitudinally to Identify Predictive Surrogate Endpoints (ECLIPSE) investigators. Characterisation of COPD heterogeneity in the ECLIPSE cohort. Respir Res. 2010;11:122.
3. Jones PW. Health status and the spiral of decline. COPD. 2009;6(1):59-63.
4. Han MK, Agusti A, Calverley PM, et al. Chronic obstructive pulmonary disease phenotypes: the future of COPD. Am J Respir Crit Care Med. 2010;182(5):598-604.
5. Han MK, Kazerooni EA, Lynch DA, et al; COPDGene Investigators. Chronic obstructive pulmonary disease exacerbations in the COPDGene study: associated radiologic phenotypes. Radiology. 2011;261(1):274-282.
6. Kim V, Han MK, Vance GB, et al; COPDGene Investigators. The chronic bronchitic phenotype of COPD: an analysis of the COPDGene Study. Chest. 2011;140(3):626-633.
7. Wedzicha JA, Brill SE, Allinson JP, Donaldson GC. Mechanisms and impact of the frequent exacerbator phenotype in chronic obstructive pulmonary disease. BMC Med. 2013;11:181.
8. Hurst JR, Vestbo J, Anzueto A, et al; Evaluation of COPD Longitudinally to Identify Predictive Surrogate Endpoints (ECLIPSE) Investigators. Susceptibility to exacerbation in chronic obstructive pulmonary disease. N Engl J Med. 2010;363(12):1128-1138.
9. Qaseem A, Wilt TJ, Weinberger SE, et al; American College of Physicians; American College of Chest Physicians; American Thoracic Society; European Respiratory Society. Diagnosis and management of stable chronic obstructive pulmonary disease: a clinical practice guideline update from the American College of Physicians, American College of Chest Physicians, American Thoracic Society, and European Respiratory Society. Ann Intern Med. 2011;155(3):179-191.
10. Nishimura K, Izumi T, Tsukino M, Oga T. Dyspnea is a better predictor of 5-year survival than airway obstruction in patients with COPD. Chest. 2002;121(5):1434-1440.
11. Lee SD, Huang MS, Kang J, et al; Investigators of the Predictive Ability of CAT in Acute Exacerbations of COPD (PACE) Study. The COPD assessment test (CAT) assists prediction of COPD exacerbations in high-risk patients. Respir Med. 2014;108(4):600-608.
12. Haughney J, Gruffydd-Jones K, Roberts J, Lee AJ, Hardwell A, McGarvey L. The distribution of COPD in UK general practice using the new GOLD classification. Eur Respir J. 2014;43(4):993-1002.
13. Martinez CH, Han MK. Contribution of the environment and comorbidities to chronic obstructive pulmonary disease phenotypes. Med Clin North Am. 2012;96(4):713-727.
14. Collins BF, Feemster LC, Rinne ST, Au DH. Factors predictive of airflow obstruction among veterans with presumed empiric diagnosis and treatment of COPD. Chest. 2015;147(2):369-376.
15. Puhan MA, Gimeno-Santos E, Scharplatz M, Troosters T, Walters EH, Steurer J. Pulmonary rehabilitation following exacerbations of chronic obstructive pulmonary disease. Cochrane Database Syst Rev. 2011;(10):CD005305.
16. Nannini LJ, Poole P, Milan SJ, Kesterton A. Combined corticosteroid and long-acting beta(2)-agonist in one inhaler versus inhaled corticosteroids alone for chronic obstructive pulmonary disease. Cochrane Database Syst Rev. 2013;8:CD006826.
17. Nannini LJ, Lasserson TJ, Poole P. Combined corticosteroid and long-acting beta(2)-agonist in one inhaler versus long-acting beta(2)-agonists for chronic obstructive pulmonary disease. Cochrane Database Syst Rev. 2012;9:CD006829.
18. Goossens LM, Leimer I, Metzdorf N, Becker K, Rutten-van Mölken MP. Does the 2013 GOLD classification improve the ability to predict lung function decline, exacerbations and mortality: a post-hoc analysis of the 4-year UPLIFT trial. BMC Pulm Med. 2014;14:163.
19. Boland MR, Tsiachristas A, Kruis AL, Chavannes NH, Rutten-van Mölken MP. Are GOLD ABCD groups better associated with health status and costs than GOLD 1234 grades? A cross-sectional study. Prim Care Respir J. 2014;23(1):30-37.
20. Han MK, Muellerova H, Curran-Everett D, et al. GOLD 2011 disease severity classification in COPDGene: a prospective cohort study. Lancet Respir Med. 2013;(1):43-50.
21. Johannessen A, Nilsen RM, Storebø M, Gulsvik A, Eagan T, Bakke P. Comparison of 2011 and 2007 Global Initiative for Chronic Obstructive Lung Disease guidelines for predicting mortality and hospitalization. Am J Respir Crit Care Med. 2013;188(1):51-59.
22. Sharif R, Cuevas CR, Wang Y, Arora M, Sharma G. Guideline adherence in management of stable chronic obstructive pulmonary disease. Respir Med. 2013;107(7):1046-1052.
After a busy day in the primary care clinic, having finished the day’s dictations and called a patient to discuss the results of his lipid panel, Dr. B reviews tomorrow’s schedule, and notices 2 patients with a primary diagnosis of chronic obstructive pulmonary disease (COPD). Dr. B recalls a recent publication on changes in the classification of COPD by the Global Initiative for Chronic Obstructive Lung Disease (GOLD).1 She remembers the main message being the degree of airway obstruction as measured by the forced expiratory volume in the first second (FEV1) is now considered insufficient to classify COPD severity and to make a therapeutic decision. This paradigm shift contradicts the familiar concept that FEV1 is the cornerstone piece of information in COPD, resulting in some degree of uncertainty about how to apply this in the practice. Dr. B. considers a multitude of practical questions, including: Is there a good reason to change the classification of COPD? How easy is it to use?
Will it make any therapeutic differences to my patients? In this article, the authors attempt to answer these and other questions prompted by the recent changes in the GOLD classification, with emphasis on its clinical use.
A Heterogeneous Condition
Spirometry is central to the diagnosis of obstructive lung diseases, including COPD and asthma. The diagnosis of COPD requires demonstration of an obstructive ventilatory defect in the spirometry, usually defined as a ratio of FEV1 to forced vital capacity (FVC) below 70% (FEV1/FVC < 0.7). FEV1 is still important, not only to confirm the diagnosis of airflow obstruction, but because it predicts mortality when severely reduced. However, during the last decade severity of airflow limitation has been challenged as a descriptor of both symptom burden and consequences of COPD by data from large studies.2 For example, it has been demonstrated that 2 patients with the same degree of obstruction, measured by the FEV1 percentage predicted, can provide the physician with very different experiences about the impact of their disease in daily life.3 These differences extend to the severity of their dyspnea; their exercise capacity, as seen in the sixminute walking distance test (6MWD); or their perceived quality of life (QOL), measured by the score on the Saint George’s Respiratory Questionnaire (SGRQ). These measures of disease impact show an extremely low correlation with FEV1: a correlation of 0.36 with the severity of dyspnea, 0.34 with 6MWD, and 0.38 with the SGRQ total score.2 These newer studies imply that while spirometry is important, it captures only a small portion of the symptomatic and functional impact of COPD.
Increasing interest in understanding the differences between COPD subjects has been the main motivation in identifying distinct COPD phenotypes, subgroups of patients with similar disease experience, probable similar underlying pathogenic mechanisms, similar outcomes, and perhaps specific treatment alternatives.4,5 The severity of airflow limitation, as measured by FEV1 percent predicted, is not always related with some of the emerging COPD phenotypes (eg, chronic bronchitis predominant phenotype, frequent exacerbation phenotype).6-8 Chronic bronchitis can be present across the whole spectrum of spirometry severity, and is always associated with poorer QOL and worse clinical outcomes. Similarly, there are patients with frequent exacerbation phenotype (defined as ≥ 2 exacerbations/year) at every level of airflow obstruction, and the phenotype tends to be stable, meaning that previous frequent exacerbations are a good predictor of future exacerbations.8
With all this information, participants in the development of the GOLD guidelines determined that although FEV1 is still a good descriptor of COPD severity and potential for poor outcomes (exacerbation frequency, mortality), a more comprehensive description of COPD needed the addition of data on the impact of symptoms (particularly dyspnea), and the future risk of poor COPD related events (exacerbations, death, disease progression).5 Hence, in response to Dr. B.’s question, it seems that a new approach to the way that we classify COPD was overdue, making it important to gather additional patient information, beyond FEV1.
GOLD Category Classification
An important difference from previous classifications is that the new GOLD categories use lettered groups, from A to D, not just grades of severity; however, the severity of the ventilatory defect measured by FEV1 is still graded from 1 to 4 and is still part of the classification.9
Placing a patient in the new groups is based on 2 questions: (1) How severe are the symptoms, particularly dyspnea; and (2) Is the patient at high or low risk of poor COPD-related outcomes? The first question (symptoms severity) can be systematically approached using 1 of 2 different instruments to grade COPD symptoms: the modified Medical Research Council dyspnea score (mMRC) or the COPD Assessment Test (CAT), a more recently developed instrument to quantify COPD impact.10,11
Use of CAT score, a more comprehensive descriptor of COPD impact, is the preferred method by guideline developers. If the practitioner is more familiar with the mMRC and wishes to use it instead, the result can be simplified as low (0-1 points) or high symptoms burden (≥ 2 points). The mMRC is based on the answer to the level of effort triggering dyspnea: a score of 1 means that the patient “get[s] shorter of breath when hurrying on a level surface or walking up a slight hill”; a score of 2 means that the patient “walk[s] slower than people of the same age while walking on a level surface because of breathlessness, or I have to stop for breath when walking on my own pace on the level.” Hence, the first step to classify a patient can be as simple as asking about dyspnea, surely part of the history taking process.
The second question (risk of poor COPD-related outcomes) can be answered by using the grade of obstruction by FEV1 or asking about the frequency of exacerbations in the previous year. If FEV1 is used, those with FEV1 percentage predicted ≥ 50% are considered as “low risk”; if the airflow obstruction is more severe (previously grades 3-4), the patient is at “high risk” of future events. If the exacerbation frequency is used, ≤ 1 outpatient-treated exacerbation in the previous year qualify as “low,” and ≥ 2 as “high risk.” There is an additional alternative way to identify high risk: all patients with any (≥ 1 per year) exacerbation requiring hospital admission are considered at high risk.
The next step is combining both symptoms and risk to create 4 mutually exclusive groups, which will be relevant to select the appropriate treatment (Table 1). The groups can also be represented graphically using a 2x2 figure, with the horizontal axis being symptoms severity, and the vertical (risk) either FEV1 or exacerbation history (Figure 1). If there is a discrepancy between the risk judged by lung function and history of exacerbations, it is recommended to use the answer corresponding to the worse category.12
GOLD Guideline-Based Treatment
The new classification should also help to identify the patient’s main needs: controlling symptoms, reducing future risks, or both. Based on the results of available randomized clinical trials, GOLD guideline developers suggest grouptailored strategies of management (Table 2, Figure 2).
Group A: Low Risk and Low Symptoms
The goal is to treat only as needed, using shortacting medications. No preference was given to the type of short-acting medication and the practitioner could select between short-acting beta agonists (SABAs) or short-acting anticholinergic (also known as short-acting antimuscarinic [SAMA]) medication as first-line therapy. Second-line therapy includes either the combination of both families of short-acting medications in 1 inhaler, or the use of 1 long-acting inhaler. As a rule of thumb, no patient in this group should be on more than 1 inhaler, and the combination of short and long-acting medications is not part of the recommendations. Patients in group A, and indeed everyone with COPD, benefit from respiratory immunizations and tobacco cessation.
Group B: Low Risk, High Symptoms
Again, the goal of treatment is symptom control. Based on the available evidence, this can be achieved using long-acting bronchodilators, without the need of inhaled corticosteroids (ICS). The first line of treatment should be just 1 bronchodilator, either a long-acting antimuscarinic (LAMA) or long-actingbeta agonist (LABA). These could be used together as second-line treatment (LAMA plus LABA), still without indication for ICS. It is important to remember that dyspnea, or other symptoms, could also be a manifestation of comorbid conditions, such as cardiovascular disease, obesity, deconditioning, and musculoskeletal diseases.13 When spirometry is not used to confirm the diagnosis of COPD, patients may receive incremental types of inhalers instead of being evaluated for other causes of dyspnea, which might have led to more appropriate specific therapy.14 As a result, judicious evaluation of the patient’s symptomsis recommended. The guidelines also recommend programs that increase physical activity for this group of patients, as well to those in groups C and D, as this can improve symptoms and decrease risk of exacerbations.15
Group C: High Risk, Low Symptoms
The combination of ICS/LABA is the first-line therapy for this group, based on data showing the superiority of the ICS/LABA combination over monotherapy to reduce exacerbations and symptoms, as well as to improve QOL.16,17 Monotherapy LABA is also a first-line GOLD recommendation. Selecting between ICS/LABA vs LABA should be individualized based on the reason that the patient was judged as high risk. In the authors’ practice, if
the risk is based only in spirometry values, using LABA as monotherapy is a good choice, while if the definition of high risk was based on the frequency of exacerbations, ICS/LABA is the first choice. The GOLD guidelines list the combination of LABA/LAMA as second-line therapy.
Group D: High Risk and High Symptoms
First-line therapy for this group is essentially the same that for group C, with similar considerations. The combination of LABA/LAMA is also recommended as second-line therapy, as well as the use of ICS/LABA and LAMA (all 3 major classes of controller medications together). It is worth noting that phosphodiesterase-4 inhibitors (PDE4-inh, roflumilast being the best known) can be considered as a third-line of therapy (in group C) or as part of secondline combinations (in group D).
Benefits and Limitations of GOLD
There is no doubt that the new classification system and treatment guidelines are a significant step forward, intended to foster the development of more personalized decisions for COPD patients. The guidelines are the first attempt to incorporate the concepts of phenotypes (frequent exacerbation phenotype), disease heterogeneity (the variation in outcomes for the same degree of airflow obstruction), and the differences between the burden of symptoms and the risk of outcomes. The guidelines incorporate the need to weigh the benefits and risks of medications at the individual level (eg, ICS without an accompanying long-acting agent are not recommended in any group, and ICS use is reserved for those with high risk, especially if the designation is based on exacerbation frequency). The guidelines also stress the importance of examining comorbidities, emphysizing that their management should in no way be altered just because the patient also has COPD. Relative to the previous staging based only on FEV1 values, this new classification system has been shown to have appropriate predictive ability and association with the risk of exacerbations, and better correlation with measures of quality of life and costs of care.18,19 The guidelines, initially released in 2011 and slightly updated recently, are in continuous development and have been subject to intense evaluation.
Some limitations have been found (eg, the classification is still not the best predictor of mortality, but has the same ability to predict hospital admission as the previous spirometry-based system).18,20,21 Hence, it should be no surprise that modifications will likely be released in the near future.
The treatment recommendations associated with the current classification are based on the best evidence available and expert opinion, as no published clinical trials have compared the group-based therapy system to standard therapies. Evaluations of their effectiveness in real-life practice are still to be released. Previous, less complex guidelines, based on spirometry stages, were followed < 60% of the time in actual practice, thus it will be surprising to find high adherence to the current recommendations, but evaluations are still in progress.22
Conclusion
The best way for primary care providers to incorporate the GOLD guidelines into daily practice is to remember that COPD is very heterogeneous. Although spirometry is important, it is also essential to inquire about exacerbation frequency and symptoms severity. It is encouraging that for each of the relevant questions needed to classify the patient, there is a clear, easy to remember cut point. First, look at symptoms (low or high burden, based on the presence of dyspnea), then to judge risk look at FEV1 percentage predicted (using 50% as a cutpoint) and at exacerbation frequency (using 2 per year as the cut point). With those simple questions, build the groups, based on the combination of answers, and select the appropriate therapy. The general assumptions are that short-acting medications are appropriate for infrequent symptoms, long-acting medications are used to control symptoms and prevent exacerbations in more severe disease, and that ICS (always in combination with LABA) are reserved for those in the high-risk groups, especially if high risk is defined by frequent exacerbations. This summary should be supplemented with the judicious use of the tables and figures provided in this review, and available with detailed description and discussion in the original sources.1
Author disclosures
The author reports no actual or potential conflicts of interest with regard to this article.
Disclaimer
The opinions expressed herein are those of the author and do not necessarily reflect those of Federal Practitioner; Frontline Medical Communications Inc.; the Department of Defense, or its Components; and the U.S. Government, or any of its agencies. This article may discuss unlabeled or investigational use of certain drugs. Please review complete prescribing information for specific drugs or drug combinations—including indications, contraindications, warnings, and adverse effects—before administering pharmacologic therapy to patients.
Click here to read the digital edition.
1. Vestbo J, Hurd SS, Agustí AG, et al. Global strategy for the diagnosis, management, and prevention of chronic obstructive pulmonary disease: GOLD executive summary. Am J Respir Crit Care Med. 2013;187(4):347-365.
2. Agusti A, Calverley PM, Celli B, et al; Evaluation of COPD Longitudinally to Identify Predictive Surrogate Endpoints (ECLIPSE) investigators. Characterisation of COPD heterogeneity in the ECLIPSE cohort. Respir Res. 2010;11:122.
3. Jones PW. Health status and the spiral of decline. COPD. 2009;6(1):59-63.
4. Han MK, Agusti A, Calverley PM, et al. Chronic obstructive pulmonary disease phenotypes: the future of COPD. Am J Respir Crit Care Med. 2010;182(5):598-604.
5. Han MK, Kazerooni EA, Lynch DA, et al; COPDGene Investigators. Chronic obstructive pulmonary disease exacerbations in the COPDGene study: associated radiologic phenotypes. Radiology. 2011;261(1):274-282.
6. Kim V, Han MK, Vance GB, et al; COPDGene Investigators. The chronic bronchitic phenotype of COPD: an analysis of the COPDGene Study. Chest. 2011;140(3):626-633.
7. Wedzicha JA, Brill SE, Allinson JP, Donaldson GC. Mechanisms and impact of the frequent exacerbator phenotype in chronic obstructive pulmonary disease. BMC Med. 2013;11:181.
8. Hurst JR, Vestbo J, Anzueto A, et al; Evaluation of COPD Longitudinally to Identify Predictive Surrogate Endpoints (ECLIPSE) Investigators. Susceptibility to exacerbation in chronic obstructive pulmonary disease. N Engl J Med. 2010;363(12):1128-1138.
9. Qaseem A, Wilt TJ, Weinberger SE, et al; American College of Physicians; American College of Chest Physicians; American Thoracic Society; European Respiratory Society. Diagnosis and management of stable chronic obstructive pulmonary disease: a clinical practice guideline update from the American College of Physicians, American College of Chest Physicians, American Thoracic Society, and European Respiratory Society. Ann Intern Med. 2011;155(3):179-191.
10. Nishimura K, Izumi T, Tsukino M, Oga T. Dyspnea is a better predictor of 5-year survival than airway obstruction in patients with COPD. Chest. 2002;121(5):1434-1440.
11. Lee SD, Huang MS, Kang J, et al; Investigators of the Predictive Ability of CAT in Acute Exacerbations of COPD (PACE) Study. The COPD assessment test (CAT) assists prediction of COPD exacerbations in high-risk patients. Respir Med. 2014;108(4):600-608.
12. Haughney J, Gruffydd-Jones K, Roberts J, Lee AJ, Hardwell A, McGarvey L. The distribution of COPD in UK general practice using the new GOLD classification. Eur Respir J. 2014;43(4):993-1002.
13. Martinez CH, Han MK. Contribution of the environment and comorbidities to chronic obstructive pulmonary disease phenotypes. Med Clin North Am. 2012;96(4):713-727.
14. Collins BF, Feemster LC, Rinne ST, Au DH. Factors predictive of airflow obstruction among veterans with presumed empiric diagnosis and treatment of COPD. Chest. 2015;147(2):369-376.
15. Puhan MA, Gimeno-Santos E, Scharplatz M, Troosters T, Walters EH, Steurer J. Pulmonary rehabilitation following exacerbations of chronic obstructive pulmonary disease. Cochrane Database Syst Rev. 2011;(10):CD005305.
16. Nannini LJ, Poole P, Milan SJ, Kesterton A. Combined corticosteroid and long-acting beta(2)-agonist in one inhaler versus inhaled corticosteroids alone for chronic obstructive pulmonary disease. Cochrane Database Syst Rev. 2013;8:CD006826.
17. Nannini LJ, Lasserson TJ, Poole P. Combined corticosteroid and long-acting beta(2)-agonist in one inhaler versus long-acting beta(2)-agonists for chronic obstructive pulmonary disease. Cochrane Database Syst Rev. 2012;9:CD006829.
18. Goossens LM, Leimer I, Metzdorf N, Becker K, Rutten-van Mölken MP. Does the 2013 GOLD classification improve the ability to predict lung function decline, exacerbations and mortality: a post-hoc analysis of the 4-year UPLIFT trial. BMC Pulm Med. 2014;14:163.
19. Boland MR, Tsiachristas A, Kruis AL, Chavannes NH, Rutten-van Mölken MP. Are GOLD ABCD groups better associated with health status and costs than GOLD 1234 grades? A cross-sectional study. Prim Care Respir J. 2014;23(1):30-37.
20. Han MK, Muellerova H, Curran-Everett D, et al. GOLD 2011 disease severity classification in COPDGene: a prospective cohort study. Lancet Respir Med. 2013;(1):43-50.
21. Johannessen A, Nilsen RM, Storebø M, Gulsvik A, Eagan T, Bakke P. Comparison of 2011 and 2007 Global Initiative for Chronic Obstructive Lung Disease guidelines for predicting mortality and hospitalization. Am J Respir Crit Care Med. 2013;188(1):51-59.
22. Sharif R, Cuevas CR, Wang Y, Arora M, Sharma G. Guideline adherence in management of stable chronic obstructive pulmonary disease. Respir Med. 2013;107(7):1046-1052.
The Asthma-COPD Overlap Syndrome
Asthma and chronic obstructive pulmonary disease (COPD) are common obstructive airway diseases frequently seen by clinicians in practice. Approximately 25 million Americans are reported to have asthma, and 15 million Americans have been diagnosed with COPD.1,2 An additional 24 million American adults have evidence of impaired lung function, suggestive of an under diagnosis of COPD.3 According to the National Heart, Lung and Blood Institute, the costs of COPD and asthma totaled $68.0 billion in 2008, of which $53.7 billion were direct costs.4 A subset of patients with asthma and COPD have characteristics of both disorders and are described clinically as having asthma-COPD overlap syndrome (ACOS).5 Patients with ACOS have a higher burden of disease and health care utilization and increasing recognition of this condition is critical. This article will review the identification, epidemiology, diagnostic evaluation, and basic treatment strategy for ACOS. This information should assist the primary care physician (PCP) in his or her approach to this condition.
The distinction between asthma and COPD is usually most evident to the clinician at the extremes of age. Asthma typically develops in childhood, manifests with classic symptoms of recurrent chest tightness, cough, wheeze, and dyspnea, and tends to be associated with atopic disorders. Chronic obstructive pulmonary disease typically manifests later in life, is insidious with productive cough and dyspnea being prominent symptoms, and tends to be associated with tobacco smoking. In addition, asthma is characterized by intermittent, reversible airflow obstruction, whereas COPD has persistent and irreversible airflow obstruction. As such, a nonsmoking atopic younger patient with a history of recurrent childhood wheezing with reversible airflow obstruction would favor a diagnosis of asthma. In contrast, an older patient with a history of tobacco smoking with chronic cough and dyspnea with evidence of fixed obstruction would favor a diagnosis of COPD.
Although asthma and COPD can present “classically,” many clinicians recognize that these disorders may present with overlapping features that make distinguishing between the two diagnostically challenging. Soriano and colleagues succinctly outlined the difficulties in distinguishing between asthma and COPD8:
- The conditions are viewed as part of a disease continuum;
- They have strong overlapping features
- There is no incentive to differentiate whether their treatment and prognosis are the same
- There are a lack of clear guidelines as to how the distinction can be made in clinical practice
- Uncertain criteria are used by physicians to classify patients as having asthma or COPD
The term ACOS is a clinical descriptive one and has not been clearly defined as evidenced by the multitude of descriptions in the literature. Soler-Cataluña and colleagues defined the clinical phenotype as “overlap phenotype COPD-asthma” based on the presence of major and minor criteria.9 Major criteria consisted of a postbronchodilator increase of forced expiratory volume in 1 second (FEV1) ≥ 12% and ≥ 400 mL, and eosinophilia in sputum in addition to a personal history of asthma. Minor criteria included high total immunoglobulinE (IgE), personal history of atopy, and a postbronchodilator increase of FEV1 ≥ 12% and ≥ 200 mL on ≥ 2 occasions.
Zeki and colleagues defined ACOS as: (1) asthma with partially reversible airflow obstruction, with or without emphysema or reduced carbon monoxide diffusion capacity (DLCO) to < 80% predicted; and (2) COPD with emphysema accompanied by reversible or partially reversible airflow obstruction, with or without environmental allergies or reduced DLCO.10 Louie and colleagues proposed the following major criteria for ACOS: a physician diagnosis of asthma and COPD in the same patient, history of evidence of atopy, elevated total IgE, aged ≥ 40 years, smoking > 10 pack-years, postbronchodilator FEV1< 80% predicted and FEV1/forced vital capacity (FVC) < 70%.11 Minor criteria consisted of a postbronchodilator increase of FEV1 by ≥ 15% or ≥ 12% and ≥ 200 mL following albuterol.
The Global Initiative for Asthma/Global Initiative for Chronic Obstructive Lung Disease published a joint consensus document on ACOS, which described a stepwise approach to diagnosis based on defining characteristics.5 To distinguish between the diagnosis of asthma, COPD, and ACOS in an adult patient, the guideline focuses on the features that are felt to be most helpful in distinguishing the syndromes in stepwise fashion. The physician should first assemble the features that favor a diagnosis of asthma or COPD, then compare the number of features in favor of a diagnosis of asthma or COPD, and finally consider the level of certainty around the diagnosis of asthma or COPD or whether there are features of both, suggesting ACOS.
Frequency
In 1995, the American Thoracic Society guidelines defined 11 distinct obstructive lung disease syndromes and identified overlap syndromes in 6 of them.12 Soriano and colleagues quantified the subpopulations of these patients by analyzing the U.S. National Health and Nutrition Examination III survey and the U.K. General Practice Research Database and reported an increased frequency of overlapping diagnosis of asthma and COPD with advancing age, with an estimated prevalence for < 10% in patients aged < 50 years and > 50% in patients aged ≥ 80 years.8 A study of patients aged > 50 years by Marsh and colleagues reported a combined syndrome of asthma and COPD to be the most common phenotype as confirmed by spirometry.13 In this study, 62% of subjects with the combined asthma and COPD phenotype were current or former smokers. In a study of 44 adults aged > 55 years with stable asthma or COPD, Gibson and colleague reported that 16% and 21%, respectively, could be categorized as having overlap syndrome.14 As in previous studies, those with overlap syndrome and COPD were predominantly ex-smokers.
Braman and colleagues characterized asthma in subjects aged > 70 years.15 Compared with those who developed asthma at an advanced age, those with early onset asthma had a significantly greater degree of airflow obstruction on pre- and postbronchodilator testing. This study suggested that long-standing asthma may lead to chronic persistent airflow obstruction and mimic COPD.
A longitudinal study by Vonk and colleagues reported that 16% of patients with asthma had developed incomplete airflow reversibility after 21 to 33 years of followup.16 De Marco and colleagues found the prevalence of asthma-COPD overlap to be 1.6%, 2.1%, and 4.5% in the 20 to 44, 45 to 64, and 65 to 84 years age groups, respectively, through a screening questionnaire of the general Italian population in concurrence with previous studies, noting an increased prevalence of ACOS in the elderly.17 Lee and colleagues described those with ACOS as older, male asthmatics, who have a higher lifetime smoking history and generally worse lung function.18
Quality of Life, Morbidity, and Moratality
In addition to being more prevalent in the elderly, ACOS is associated with more severe symptoms, impairment in quality of life (QOL), more frequent exacerbations, and high health care utilization. The ACOS phenotype is also at risk for accelerated decline in lung function secondary to its association with advancing age, tobacco smoking, presence of bronchial hyper-reactivity, and exacerbations.14
Burrows and colleagues described the characteristics and course of asthma in subjects aged > 65 years and concluded that asthma in this group may be associated with severe symptoms, higher death rates, and chronic airway obstruction.19 In this study, the subjects with suspected ACOS smoked at least 20 pack-years and had a significantly lower mean FEV1 (48.1% predicted ± 23.7) than any other group. Kauppi and colleagues reported on health-related QOL (HRQOL) and found that when compared to subjects with asthma or COPD only, the overlap group had the poorest HRQOL score.20 Chung and colleagues reported a similar reduction on self-rated health in the overlap group as well.21 Miravitles and colleagues reported that 17.4% of subjects previously diagnosed with COPD belonged to the COPD-asthma overlap phenotype.22 The overlap phenotype in this study had more dyspnea, wheezing, exacerbations, worse respiratory-specific QOL, and reduced levels of physical activity. Soriano and colleagues identified higher relative risks for pneumonia and respiratory infections in individuals aged > 65 years with asthma and COPD.23 In a study of hospital discharge registry data covering the Finnish population, Andersén and colleagues reported that the average numbers of treatment periods during 2000 to 2009 were 2.1 in asthma, 3.4 in COPD, and 6.0 in ACOS.24 Panizza and colleagues reported that long-standing asthma was associated with chronic airflow obstruction and increased risk of mortality.25
Although patients with both asthma and COPD are at risk for exacerbations, those with ACOS are at risk for more frequent and severe exacerbations.26 In the PLATINO study population, subjects with ACOS had higher risk for exacerbations, hospitalization, and worse general health status when compared with those with COPD.27 Frequent exacerbations of COPD leads to a greater loss of lung function compared with those who have infrequent exacerbations.14 A lower FEV1 is associated with increased disease severity in both asthma and COPD, and this is of particular concern to those with ACOS.
Of significance is the association of the ACOS phenotype with tobacco smoking. Although asthma is a risk factor for accelerated lung function decline, smoking status significantly accelerates the decline, and the loss may be even greater in those with asthma who smoke.28,29 This can ultimately predispose patients to the ACOS phenotype. Fortunately, quitting smoking can slow the decline in lung function as reported in the Lung Health Study.30 The annual decline in FEV1 in subjects who quit smoking at the beginning of the 11-year study was 30.2 mL /year for men and 21.5 mL /year for women. For those who continued smoking, the decline in FEV1 was 66.1 mL /year in men and 54.2 mL /year in women. For those with ACOS, treating tobacco use and dependence should be regarded as a primary and specific intervention.
Diagnosis
Spirometry is required for the appropriate diagnosis of obstructive lung disease and should be performed at least annually for assessment of control and disease progression.5,31,32 Postbronchodilator spirometry is necessary to determine whether obstruction (ie, FEV1/FVC < 0.7), if present, is reversible.32 In asthma, airway obstruction following bronchodilator administration is typically fully reversible.5 In COPD, patients will remain obstructed following postbronchodilator administration regardless of the FEV1 response.32 In ACOS, the postbronchodilator FEV1/FVC typically remains obstructed.5 A normal postbronchodilator FEV1/FVC is not compatible with the diagnosis of ACOS unless there is other evidence of chronic airflow limitation.5 Although spirometry confirms the presence of chronic airflow obstruction, it is of limited value in distinguishing between asthma with fixed airflow obstruction, COPD, and ACOS.5 At times, specialized investigations, such as carbon monoxide diffusion capacity on pulmonary function testing and chest imaging, may also be used to help distinguish between asthma and COPD.5,31,32
Treatment
Although much has been published on the recognition and identification of ACOS, there is a paucity of information on the effectiveness of therapeutics for this population. Patients with ACOS are frequently excluded from clinical studies involving asthma and COPD, which limits the generalization of findings from these trials to these patients. Although a comprehensive review of the available treatments for obstructive airway disease is beyond the scope of this article, some management tenets will be discussed.
In general, inhaled corticosteroids (ICS) are the cornerstone of the pharmacologic management of patients with persistent asthma, whereas inhaled bronchodilators (beta 2-agonists and anticholinergics) are the therapeutic mainstay for patients with COPD.31,32 In those with ACOS, the default position should be to start treatment with low or moderate dose ICS in recognition of the role of ICS in preventing morbidity and mortality in those with asthma.5 Depending on severity, a long-acting beta 2-agonist (LABA) could be added or continued if already prescribed for those with ACOS.5 Patients should not be treated with a LABA without ICS if there are features of asthma.5
Treatment of ACOS should also include advice about other therapeutic strategies such as smoking cessation, pulmonary rehabilitation, influenza and pneumococcal vaccinations, and treatment of other comorbid conditions.5 The treatment goals of ACOS are similar to those of asthma and COPD in that they are driven by controlling symptoms, optimizing health status and QOL, and preventing exacerbations. Although there are currently no disease-modifying medications that can alter the progression of airway obstruction in either asthma or COPD, smoking cessation is an essential component of the successful management of all obstructive airway disorders, because it is a modifiable risk factor.
The initial management of asthma and COPD can be carried out at the primary care level. All current guidelines for asthma, COPD, and ACOS provide
recommendations for specialty referral for further diagnostic and therapeutic consideations.5,31,32 As ACOS is associated with more severe disease and greater health care utilization, specialty referral for this subgroup should be considered.
Conclusion
Although there is no generally agreed term or defining features for ACOS, it is commonly recognized that a proportion of older patients who present with symptoms of chronic airway obstruction have features of both asthma and COPD. It is broadly recognized that distinguishing asthma from COPD can be problematic, particularly in smokers and the elderly. In addition, as these patients have frequent exacerbations, a poor QOL, a more rapid decline in lung function, and high mortality, identification of this subgroup is important. The lack of clinical trials to help guide therapeutic interventions in this syndrome is problematic as the extrapolation of data from asthma and/or COPD trials may not be applicable. Further studies in therapeutics for those with ACOS are warranted.
Author disclosures
The author reports no actual or potential conflicts of interest with regard to this article.
Disclaimer
The opinions expressed herein are those of the author and do not necessarily reflect those of Federal Practitioner; Frontline Medical Communications Inc.; the Department of Defense, or its Components; and the U.S. Government, or any of its agencies. This article may discuss unlabeled or investigational use of certain drugs. Please review complete prescribing information for specific drugs or drug combinations—including indications, contraindications, warnings, and adverse effects—before administering pharmacologic therapy to patients.
Click here to read the digital edition.
1. Centers for Disease Control and Prevention. Asthma in the US: CDC Vital Signs. CDC Website. http://www.cdc.gov/vitalsigns/asthma/. Updated May 3, 2011. Accessed October 27, 2014.
2. Centers for Disease Control and Prevention. What is COPD? CDC Website. http://www.cdc.gov/copd/. Updated November 13, 2013. Accessed October 27, 2014.
3. American Lung Association. Chronic Obstructive Pulmonary Disease (COPD) Fact Sheet. American Lung Association Website. http://www.lung.org/lung-disease/copd/resources/facts-figures/COPD-Fact-Sheet.html. Published May 2014. Accessed October 27, 2014.
4. National Heart, Lung, and Blood Institute. Morbidity and Mortality: 2012 Chart Book on Cardiovascular, Lung and Blood Diseases. National Heart, Lung, and Blood Institute Website. https://www.nhlbi.nih.gov/files/docs/research/2012_ChartBook_508.pdf. Accessed January 6, 2015.
5. Global Initiative for Asthma/Global Initiative for Chronic Obstructive Lung Disease. Diagnosis of Diseases of Chronic Airflow Limitation: Asthma COPD and Asthma-COPD Overlap Syndrome (ACOS). Global Initiative for Asthma Website. http://www.ginasthma.org/documents/14. Accessed August 10, 2015.
6. Tam A, Sin DD. Pathobiologic mechanisms of chronic obstructive pulmonary disease. Med Clin North Am. 2012;96(4):681-698.
7. Silva GE, Sherrill DL, Guerra S, Barbee RA. Asthma as a risk factor for COPD in a longitudinal study. Chest. 2004;126(1):59-65.
8. Soriano JB, Davis KJ, Coleman B, Visick G, Mannino D, Pride NB. The proportional Venn diagram of obstructive lung disease: two approximations from the United States and the United Kingdom. Chest. 2003;124(2):474-481.
9. Soler-Cataluña JJ, Cosío B, Izquierdo JL, et al. Consensus document on the overlap phenotype COPD-asthma in COPD. Arch Bronconeumol. 2012;48(9):331-337.
10. Zeki AA, Schivo M, Chan A, Albertson TE, Louie S. The asthma-COPD overlap syndrome: a common clinical problem in the elderly. J Allergy (Cairo). 2011;2011:861926.
11. Louie S, Zeki AA, Schivo M, et al. The asthma-chronic obstructive pulmonary disease overlap syndrome: pharmacotherapeutic considerations. Expert Rev Clin Pharmacol. 2013;6(2):197-219.
12. American Thoracic Society. Standards for the diagnosis and care of patients with chronic obstructive pulmonary disease. Am J Respir Crit Care Med. 1995;152 (5 pt 2):S77-S121.
13. Marsh SE, Travers J, Weatherall M, et al. Proportional classifications of COPD phenotypes [published correction appears in Thorax. 2014;69(7):672]. Thorax. 2008;63(9):761-767.
14. Gibson PG, Simpson JL. The overlap syndrome of asthma and COPD: what are its features and how important is it? Thorax. 2009;64(8):728-735.
15. Braman SS, Kaemmerlen JT, Davis SM. Asthma in the elderly: a comparison between patients with recently acquired and long-standing disease. Am Rev Respir Dis. 1991;143(2):336-340.
16. Vonk JM, Jongepier H, Panhuysen Cl, Schouten JP, Bleecker ER, Postma DS. Risk factors associated with the presence of irreversible airflow limitation and reduced transfer coefficient in patients with asthma after 26 years of follow up. Thorax. 2003;58(4):322-327.
17. de Marco R, Pesce G, Marcon A, et al. The coexistence of asthma and chronic obstructive pulmonary disease (COPD): prevalence and risk factors in young, middle-aged and elderly people from the general population. PLoS One. 2013;8(5):e62985.
18. Lee HY, Kang JY, Yoon HK, et al. Clinical characteristics of asthma combined with COPD feature. Yonsei Med J. 2014;55(4):980-986.
19. Burrows B, Barbee RA, Cline MG, Knudson RJ, Lebowitz MD. Characteristics of asthma among elderly adults in a sample of the general population. Chest. 1991;100(4):935-942.
20. Kauppi P, Kupiainen H, Lindqvust A, et al. Overlap syndrome of asthma and COPD predicts low quality of life. J Asthma. 2011;48(3):279-285.
21. Chung JW, Kong KA, Lee JH, Lee SJ, Ryu YJ, Chang JH. Characteristics and self-rated health of overlap syndrome. Int J Chron Obstruct Pulmon Dis. 2014;9:795-804.
22. Miravitles M, Soriano JB, Ancochea J, et al. Characterisation of the overlap COPDasthma phenotype. Focus on physical activity and health status. Respir Med. 2013;107(7):1053-1060.
23. Soriano JB, Visick GT, Mullerova H, Payvandi N, Hansell AL. Patterns of comorbidities in newly diagnosed COPD and asthma in primary care. Chest. 2005;128(4):2099-2107.
24. Andersén H, Lampela P, Nevanlinna A, SäynäJakangas O, Keistinen T. High hospital burden in overlap syndrome of asthma and COPD. Clin Respir J. 2013;7(4):342-346.
25. Panizza JA, James AL, Ryan G, de Klerk N, Finucane KE. Mortality and airflow obstruction in asthma: a 17-year follow-up study. Intern Med J. 2006;36(12):773-780.
26. Hardin M, Silverman EK, Barr RG, et al; COPDGene Investigators. The clinical features of the overlap between COPD and asthma. Respir Res. 2011;12:127.
27. Menezes AM, Montes de Oca M, Pérez-Padilla R, et al; PLATINO Team. Increased risk of exacerbation and hospitalization in subjects with an overlap phenotype: COPD-asthma. Chest. 2014;145(2):297-304.
28. Lange P, Parner J, Vestbo J, Schnohr P, Jensen G. A 15-year follow-up study of ventilatory function in adults with asthma. N Engl J Med. 1998;339(17):1194-1200.
29. James AL, Palmer LJ, Kicic E, et al. Decline in lung function in the Busselton Health Study: the effects of asthma and cigarette smoking. Am J Respir Crit Care Med. 2005;171(2):109-114.
30. Anthonisen NR, Connett JE, Murray RP. Smoking and lung function of Lung Health Study participants after 11 years. Am J Respir Crit Care Med. 2002;166(5):675-679.
31. Global Initiative for Asthma. Global Strategy for Asthma Management and Prevention. Global Initiative for Asthma Website. http://www.ginasthma.org/documents/4. Revised 2014. Accessed October 27, 2014.
32. Global Initiative for Chronic Lung Disease. Global Strategy for the Diagnosis, Management, and Prevention of Chronic Obstructive Pulmonary Disease. Global Initiative for Chronic Lung Disease Website. http://www.goldcopd.org/guidelines-global-strategy-for-diagnosis management.html. Published January 2014. Accessed 27 October 2014.
Asthma and chronic obstructive pulmonary disease (COPD) are common obstructive airway diseases frequently seen by clinicians in practice. Approximately 25 million Americans are reported to have asthma, and 15 million Americans have been diagnosed with COPD.1,2 An additional 24 million American adults have evidence of impaired lung function, suggestive of an under diagnosis of COPD.3 According to the National Heart, Lung and Blood Institute, the costs of COPD and asthma totaled $68.0 billion in 2008, of which $53.7 billion were direct costs.4 A subset of patients with asthma and COPD have characteristics of both disorders and are described clinically as having asthma-COPD overlap syndrome (ACOS).5 Patients with ACOS have a higher burden of disease and health care utilization and increasing recognition of this condition is critical. This article will review the identification, epidemiology, diagnostic evaluation, and basic treatment strategy for ACOS. This information should assist the primary care physician (PCP) in his or her approach to this condition.
The distinction between asthma and COPD is usually most evident to the clinician at the extremes of age. Asthma typically develops in childhood, manifests with classic symptoms of recurrent chest tightness, cough, wheeze, and dyspnea, and tends to be associated with atopic disorders. Chronic obstructive pulmonary disease typically manifests later in life, is insidious with productive cough and dyspnea being prominent symptoms, and tends to be associated with tobacco smoking. In addition, asthma is characterized by intermittent, reversible airflow obstruction, whereas COPD has persistent and irreversible airflow obstruction. As such, a nonsmoking atopic younger patient with a history of recurrent childhood wheezing with reversible airflow obstruction would favor a diagnosis of asthma. In contrast, an older patient with a history of tobacco smoking with chronic cough and dyspnea with evidence of fixed obstruction would favor a diagnosis of COPD.
Although asthma and COPD can present “classically,” many clinicians recognize that these disorders may present with overlapping features that make distinguishing between the two diagnostically challenging. Soriano and colleagues succinctly outlined the difficulties in distinguishing between asthma and COPD8:
- The conditions are viewed as part of a disease continuum;
- They have strong overlapping features
- There is no incentive to differentiate whether their treatment and prognosis are the same
- There are a lack of clear guidelines as to how the distinction can be made in clinical practice
- Uncertain criteria are used by physicians to classify patients as having asthma or COPD
The term ACOS is a clinical descriptive one and has not been clearly defined as evidenced by the multitude of descriptions in the literature. Soler-Cataluña and colleagues defined the clinical phenotype as “overlap phenotype COPD-asthma” based on the presence of major and minor criteria.9 Major criteria consisted of a postbronchodilator increase of forced expiratory volume in 1 second (FEV1) ≥ 12% and ≥ 400 mL, and eosinophilia in sputum in addition to a personal history of asthma. Minor criteria included high total immunoglobulinE (IgE), personal history of atopy, and a postbronchodilator increase of FEV1 ≥ 12% and ≥ 200 mL on ≥ 2 occasions.
Zeki and colleagues defined ACOS as: (1) asthma with partially reversible airflow obstruction, with or without emphysema or reduced carbon monoxide diffusion capacity (DLCO) to < 80% predicted; and (2) COPD with emphysema accompanied by reversible or partially reversible airflow obstruction, with or without environmental allergies or reduced DLCO.10 Louie and colleagues proposed the following major criteria for ACOS: a physician diagnosis of asthma and COPD in the same patient, history of evidence of atopy, elevated total IgE, aged ≥ 40 years, smoking > 10 pack-years, postbronchodilator FEV1< 80% predicted and FEV1/forced vital capacity (FVC) < 70%.11 Minor criteria consisted of a postbronchodilator increase of FEV1 by ≥ 15% or ≥ 12% and ≥ 200 mL following albuterol.
The Global Initiative for Asthma/Global Initiative for Chronic Obstructive Lung Disease published a joint consensus document on ACOS, which described a stepwise approach to diagnosis based on defining characteristics.5 To distinguish between the diagnosis of asthma, COPD, and ACOS in an adult patient, the guideline focuses on the features that are felt to be most helpful in distinguishing the syndromes in stepwise fashion. The physician should first assemble the features that favor a diagnosis of asthma or COPD, then compare the number of features in favor of a diagnosis of asthma or COPD, and finally consider the level of certainty around the diagnosis of asthma or COPD or whether there are features of both, suggesting ACOS.
Frequency
In 1995, the American Thoracic Society guidelines defined 11 distinct obstructive lung disease syndromes and identified overlap syndromes in 6 of them.12 Soriano and colleagues quantified the subpopulations of these patients by analyzing the U.S. National Health and Nutrition Examination III survey and the U.K. General Practice Research Database and reported an increased frequency of overlapping diagnosis of asthma and COPD with advancing age, with an estimated prevalence for < 10% in patients aged < 50 years and > 50% in patients aged ≥ 80 years.8 A study of patients aged > 50 years by Marsh and colleagues reported a combined syndrome of asthma and COPD to be the most common phenotype as confirmed by spirometry.13 In this study, 62% of subjects with the combined asthma and COPD phenotype were current or former smokers. In a study of 44 adults aged > 55 years with stable asthma or COPD, Gibson and colleague reported that 16% and 21%, respectively, could be categorized as having overlap syndrome.14 As in previous studies, those with overlap syndrome and COPD were predominantly ex-smokers.
Braman and colleagues characterized asthma in subjects aged > 70 years.15 Compared with those who developed asthma at an advanced age, those with early onset asthma had a significantly greater degree of airflow obstruction on pre- and postbronchodilator testing. This study suggested that long-standing asthma may lead to chronic persistent airflow obstruction and mimic COPD.
A longitudinal study by Vonk and colleagues reported that 16% of patients with asthma had developed incomplete airflow reversibility after 21 to 33 years of followup.16 De Marco and colleagues found the prevalence of asthma-COPD overlap to be 1.6%, 2.1%, and 4.5% in the 20 to 44, 45 to 64, and 65 to 84 years age groups, respectively, through a screening questionnaire of the general Italian population in concurrence with previous studies, noting an increased prevalence of ACOS in the elderly.17 Lee and colleagues described those with ACOS as older, male asthmatics, who have a higher lifetime smoking history and generally worse lung function.18
Quality of Life, Morbidity, and Moratality
In addition to being more prevalent in the elderly, ACOS is associated with more severe symptoms, impairment in quality of life (QOL), more frequent exacerbations, and high health care utilization. The ACOS phenotype is also at risk for accelerated decline in lung function secondary to its association with advancing age, tobacco smoking, presence of bronchial hyper-reactivity, and exacerbations.14
Burrows and colleagues described the characteristics and course of asthma in subjects aged > 65 years and concluded that asthma in this group may be associated with severe symptoms, higher death rates, and chronic airway obstruction.19 In this study, the subjects with suspected ACOS smoked at least 20 pack-years and had a significantly lower mean FEV1 (48.1% predicted ± 23.7) than any other group. Kauppi and colleagues reported on health-related QOL (HRQOL) and found that when compared to subjects with asthma or COPD only, the overlap group had the poorest HRQOL score.20 Chung and colleagues reported a similar reduction on self-rated health in the overlap group as well.21 Miravitles and colleagues reported that 17.4% of subjects previously diagnosed with COPD belonged to the COPD-asthma overlap phenotype.22 The overlap phenotype in this study had more dyspnea, wheezing, exacerbations, worse respiratory-specific QOL, and reduced levels of physical activity. Soriano and colleagues identified higher relative risks for pneumonia and respiratory infections in individuals aged > 65 years with asthma and COPD.23 In a study of hospital discharge registry data covering the Finnish population, Andersén and colleagues reported that the average numbers of treatment periods during 2000 to 2009 were 2.1 in asthma, 3.4 in COPD, and 6.0 in ACOS.24 Panizza and colleagues reported that long-standing asthma was associated with chronic airflow obstruction and increased risk of mortality.25
Although patients with both asthma and COPD are at risk for exacerbations, those with ACOS are at risk for more frequent and severe exacerbations.26 In the PLATINO study population, subjects with ACOS had higher risk for exacerbations, hospitalization, and worse general health status when compared with those with COPD.27 Frequent exacerbations of COPD leads to a greater loss of lung function compared with those who have infrequent exacerbations.14 A lower FEV1 is associated with increased disease severity in both asthma and COPD, and this is of particular concern to those with ACOS.
Of significance is the association of the ACOS phenotype with tobacco smoking. Although asthma is a risk factor for accelerated lung function decline, smoking status significantly accelerates the decline, and the loss may be even greater in those with asthma who smoke.28,29 This can ultimately predispose patients to the ACOS phenotype. Fortunately, quitting smoking can slow the decline in lung function as reported in the Lung Health Study.30 The annual decline in FEV1 in subjects who quit smoking at the beginning of the 11-year study was 30.2 mL /year for men and 21.5 mL /year for women. For those who continued smoking, the decline in FEV1 was 66.1 mL /year in men and 54.2 mL /year in women. For those with ACOS, treating tobacco use and dependence should be regarded as a primary and specific intervention.
Diagnosis
Spirometry is required for the appropriate diagnosis of obstructive lung disease and should be performed at least annually for assessment of control and disease progression.5,31,32 Postbronchodilator spirometry is necessary to determine whether obstruction (ie, FEV1/FVC < 0.7), if present, is reversible.32 In asthma, airway obstruction following bronchodilator administration is typically fully reversible.5 In COPD, patients will remain obstructed following postbronchodilator administration regardless of the FEV1 response.32 In ACOS, the postbronchodilator FEV1/FVC typically remains obstructed.5 A normal postbronchodilator FEV1/FVC is not compatible with the diagnosis of ACOS unless there is other evidence of chronic airflow limitation.5 Although spirometry confirms the presence of chronic airflow obstruction, it is of limited value in distinguishing between asthma with fixed airflow obstruction, COPD, and ACOS.5 At times, specialized investigations, such as carbon monoxide diffusion capacity on pulmonary function testing and chest imaging, may also be used to help distinguish between asthma and COPD.5,31,32
Treatment
Although much has been published on the recognition and identification of ACOS, there is a paucity of information on the effectiveness of therapeutics for this population. Patients with ACOS are frequently excluded from clinical studies involving asthma and COPD, which limits the generalization of findings from these trials to these patients. Although a comprehensive review of the available treatments for obstructive airway disease is beyond the scope of this article, some management tenets will be discussed.
In general, inhaled corticosteroids (ICS) are the cornerstone of the pharmacologic management of patients with persistent asthma, whereas inhaled bronchodilators (beta 2-agonists and anticholinergics) are the therapeutic mainstay for patients with COPD.31,32 In those with ACOS, the default position should be to start treatment with low or moderate dose ICS in recognition of the role of ICS in preventing morbidity and mortality in those with asthma.5 Depending on severity, a long-acting beta 2-agonist (LABA) could be added or continued if already prescribed for those with ACOS.5 Patients should not be treated with a LABA without ICS if there are features of asthma.5
Treatment of ACOS should also include advice about other therapeutic strategies such as smoking cessation, pulmonary rehabilitation, influenza and pneumococcal vaccinations, and treatment of other comorbid conditions.5 The treatment goals of ACOS are similar to those of asthma and COPD in that they are driven by controlling symptoms, optimizing health status and QOL, and preventing exacerbations. Although there are currently no disease-modifying medications that can alter the progression of airway obstruction in either asthma or COPD, smoking cessation is an essential component of the successful management of all obstructive airway disorders, because it is a modifiable risk factor.
The initial management of asthma and COPD can be carried out at the primary care level. All current guidelines for asthma, COPD, and ACOS provide
recommendations for specialty referral for further diagnostic and therapeutic consideations.5,31,32 As ACOS is associated with more severe disease and greater health care utilization, specialty referral for this subgroup should be considered.
Conclusion
Although there is no generally agreed term or defining features for ACOS, it is commonly recognized that a proportion of older patients who present with symptoms of chronic airway obstruction have features of both asthma and COPD. It is broadly recognized that distinguishing asthma from COPD can be problematic, particularly in smokers and the elderly. In addition, as these patients have frequent exacerbations, a poor QOL, a more rapid decline in lung function, and high mortality, identification of this subgroup is important. The lack of clinical trials to help guide therapeutic interventions in this syndrome is problematic as the extrapolation of data from asthma and/or COPD trials may not be applicable. Further studies in therapeutics for those with ACOS are warranted.
Author disclosures
The author reports no actual or potential conflicts of interest with regard to this article.
Disclaimer
The opinions expressed herein are those of the author and do not necessarily reflect those of Federal Practitioner; Frontline Medical Communications Inc.; the Department of Defense, or its Components; and the U.S. Government, or any of its agencies. This article may discuss unlabeled or investigational use of certain drugs. Please review complete prescribing information for specific drugs or drug combinations—including indications, contraindications, warnings, and adverse effects—before administering pharmacologic therapy to patients.
Click here to read the digital edition.
1. Centers for Disease Control and Prevention. Asthma in the US: CDC Vital Signs. CDC Website. http://www.cdc.gov/vitalsigns/asthma/. Updated May 3, 2011. Accessed October 27, 2014.
2. Centers for Disease Control and Prevention. What is COPD? CDC Website. http://www.cdc.gov/copd/. Updated November 13, 2013. Accessed October 27, 2014.
3. American Lung Association. Chronic Obstructive Pulmonary Disease (COPD) Fact Sheet. American Lung Association Website. http://www.lung.org/lung-disease/copd/resources/facts-figures/COPD-Fact-Sheet.html. Published May 2014. Accessed October 27, 2014.
4. National Heart, Lung, and Blood Institute. Morbidity and Mortality: 2012 Chart Book on Cardiovascular, Lung and Blood Diseases. National Heart, Lung, and Blood Institute Website. https://www.nhlbi.nih.gov/files/docs/research/2012_ChartBook_508.pdf. Accessed January 6, 2015.
5. Global Initiative for Asthma/Global Initiative for Chronic Obstructive Lung Disease. Diagnosis of Diseases of Chronic Airflow Limitation: Asthma COPD and Asthma-COPD Overlap Syndrome (ACOS). Global Initiative for Asthma Website. http://www.ginasthma.org/documents/14. Accessed August 10, 2015.
6. Tam A, Sin DD. Pathobiologic mechanisms of chronic obstructive pulmonary disease. Med Clin North Am. 2012;96(4):681-698.
7. Silva GE, Sherrill DL, Guerra S, Barbee RA. Asthma as a risk factor for COPD in a longitudinal study. Chest. 2004;126(1):59-65.
8. Soriano JB, Davis KJ, Coleman B, Visick G, Mannino D, Pride NB. The proportional Venn diagram of obstructive lung disease: two approximations from the United States and the United Kingdom. Chest. 2003;124(2):474-481.
9. Soler-Cataluña JJ, Cosío B, Izquierdo JL, et al. Consensus document on the overlap phenotype COPD-asthma in COPD. Arch Bronconeumol. 2012;48(9):331-337.
10. Zeki AA, Schivo M, Chan A, Albertson TE, Louie S. The asthma-COPD overlap syndrome: a common clinical problem in the elderly. J Allergy (Cairo). 2011;2011:861926.
11. Louie S, Zeki AA, Schivo M, et al. The asthma-chronic obstructive pulmonary disease overlap syndrome: pharmacotherapeutic considerations. Expert Rev Clin Pharmacol. 2013;6(2):197-219.
12. American Thoracic Society. Standards for the diagnosis and care of patients with chronic obstructive pulmonary disease. Am J Respir Crit Care Med. 1995;152 (5 pt 2):S77-S121.
13. Marsh SE, Travers J, Weatherall M, et al. Proportional classifications of COPD phenotypes [published correction appears in Thorax. 2014;69(7):672]. Thorax. 2008;63(9):761-767.
14. Gibson PG, Simpson JL. The overlap syndrome of asthma and COPD: what are its features and how important is it? Thorax. 2009;64(8):728-735.
15. Braman SS, Kaemmerlen JT, Davis SM. Asthma in the elderly: a comparison between patients with recently acquired and long-standing disease. Am Rev Respir Dis. 1991;143(2):336-340.
16. Vonk JM, Jongepier H, Panhuysen Cl, Schouten JP, Bleecker ER, Postma DS. Risk factors associated with the presence of irreversible airflow limitation and reduced transfer coefficient in patients with asthma after 26 years of follow up. Thorax. 2003;58(4):322-327.
17. de Marco R, Pesce G, Marcon A, et al. The coexistence of asthma and chronic obstructive pulmonary disease (COPD): prevalence and risk factors in young, middle-aged and elderly people from the general population. PLoS One. 2013;8(5):e62985.
18. Lee HY, Kang JY, Yoon HK, et al. Clinical characteristics of asthma combined with COPD feature. Yonsei Med J. 2014;55(4):980-986.
19. Burrows B, Barbee RA, Cline MG, Knudson RJ, Lebowitz MD. Characteristics of asthma among elderly adults in a sample of the general population. Chest. 1991;100(4):935-942.
20. Kauppi P, Kupiainen H, Lindqvust A, et al. Overlap syndrome of asthma and COPD predicts low quality of life. J Asthma. 2011;48(3):279-285.
21. Chung JW, Kong KA, Lee JH, Lee SJ, Ryu YJ, Chang JH. Characteristics and self-rated health of overlap syndrome. Int J Chron Obstruct Pulmon Dis. 2014;9:795-804.
22. Miravitles M, Soriano JB, Ancochea J, et al. Characterisation of the overlap COPDasthma phenotype. Focus on physical activity and health status. Respir Med. 2013;107(7):1053-1060.
23. Soriano JB, Visick GT, Mullerova H, Payvandi N, Hansell AL. Patterns of comorbidities in newly diagnosed COPD and asthma in primary care. Chest. 2005;128(4):2099-2107.
24. Andersén H, Lampela P, Nevanlinna A, SäynäJakangas O, Keistinen T. High hospital burden in overlap syndrome of asthma and COPD. Clin Respir J. 2013;7(4):342-346.
25. Panizza JA, James AL, Ryan G, de Klerk N, Finucane KE. Mortality and airflow obstruction in asthma: a 17-year follow-up study. Intern Med J. 2006;36(12):773-780.
26. Hardin M, Silverman EK, Barr RG, et al; COPDGene Investigators. The clinical features of the overlap between COPD and asthma. Respir Res. 2011;12:127.
27. Menezes AM, Montes de Oca M, Pérez-Padilla R, et al; PLATINO Team. Increased risk of exacerbation and hospitalization in subjects with an overlap phenotype: COPD-asthma. Chest. 2014;145(2):297-304.
28. Lange P, Parner J, Vestbo J, Schnohr P, Jensen G. A 15-year follow-up study of ventilatory function in adults with asthma. N Engl J Med. 1998;339(17):1194-1200.
29. James AL, Palmer LJ, Kicic E, et al. Decline in lung function in the Busselton Health Study: the effects of asthma and cigarette smoking. Am J Respir Crit Care Med. 2005;171(2):109-114.
30. Anthonisen NR, Connett JE, Murray RP. Smoking and lung function of Lung Health Study participants after 11 years. Am J Respir Crit Care Med. 2002;166(5):675-679.
31. Global Initiative for Asthma. Global Strategy for Asthma Management and Prevention. Global Initiative for Asthma Website. http://www.ginasthma.org/documents/4. Revised 2014. Accessed October 27, 2014.
32. Global Initiative for Chronic Lung Disease. Global Strategy for the Diagnosis, Management, and Prevention of Chronic Obstructive Pulmonary Disease. Global Initiative for Chronic Lung Disease Website. http://www.goldcopd.org/guidelines-global-strategy-for-diagnosis management.html. Published January 2014. Accessed 27 October 2014.