User login
Role of Radiosurgery in the Treatment of Brain Metastasis
Since the 1980s, patients with a single intracranial metastatic lesion traditionally have been treated with surgery followed by whole brain radiation therapy (WBRT). However, there is growing concern about the debilitating cognitive effects associated with WBRT in long-term survivors.
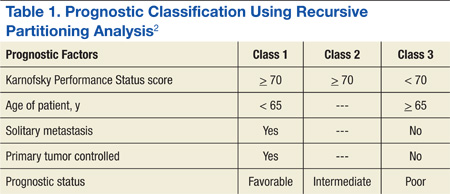
Limbrick and colleagues studied the outcomes of surgery followed by stereotactic radiosurgery (SRS) instead of WBRT and found that the less invasive surgical resection (SR) followed by SRS was an equally effective therapeutic option for the treatment of patients with limited metastatic disease to the brain.1 Median overall survival (OS) was 20 months and was 22 and 13 months for Classes 1 and 2 recursive partitioning analysis (RPA) patients, respectively. Recursive partitioning analysis refers to 3 prognostic classes based on a database of 3 trial studies and 1,200 patients (Table 1).2 According to RPA, the best survival was observed in Class 1 patients, and the worst survival was seen in Class 3 patients. Limbrick and colleagues found that survival outcome was equivalent to or greater than that reported by other studies using surgery plus WBRT or SRS plus WBRT.1 The WBRT was not used and was reserved as salvage therapy in cases of initial failure such as disease progression of brain metastasis.
Radiation Therapies
Stereotactic radiosurgery is not a surgical procedure but a newly developed radiotherapy technique. It is a highly precise, intensive form of radiation therapy, focused on the tumor, with the goal of protecting the surrounding normal brain tissue as much as possible. Radiosurgery was initially introduced with the Gamma Knife by Lars Leksell several decades ago in order to deliver an intense radiation dose to a small, well-defined, single focal point using extreme precision. Stereotactic radiosurgery delivers efficient and focused radiation treatment to the tumor lesion.
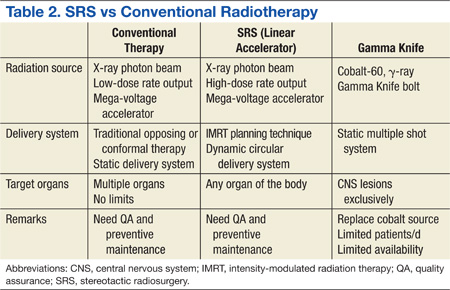
There are 2 practical and commercially available radiation delivery systems for SRS: linear accelerator (LINAC)-based radiosurgery and Gamma Knife systems. Use of the Gamma Knife is limited largely to treatment of central nervous system (CNS) malignancies and certain head and neck cancers. Linear accelerator-based SRS is applicable to neoplasms in any organ system of the body (Table 2).
Proton therapy is yet another evolving and completely different mode of radiation therapy. There are currently 14 proton therapy centers in operation in the U.S., and 11 more centers are now under construction. Proton therapy uses charged heavy-particle therapy using proton beams, whereas conventional LINAC-based radiotherapy is X-ray radiotherapy, which uses high energy photon beams. Because of their relatively large mass, protons have little scatter of radiation to surrounding normal structures and can remain sharply focused on the tumor lesion. Accordingly, proton therapy delivers negligible radiation doses beyond tumor lesions, and much of the surrounding normal tissues can be saved from excessive and unnecessary radiation doses.
Related: Bone Metastasis: A Concise Overview
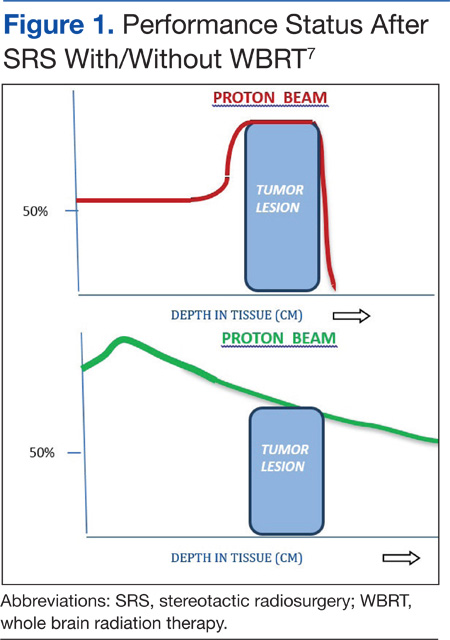
A single proton beam produces a narrow Bragg peak dose distribution at depth, and multiple consecutive stepwise series of different energies of proton beams are needed to administer complete coverage of the target tumor volume. The accumulation of these beam energies produces a uniform radiation dose distribution covering the entire tumor volume (Figure 1). In spite of the theoretical beneficial effects of proton beam therapy, more clinical experience is needed for it to be validated. Even then, the significantly higher costs of proton therapy represent another barrier to its wider implementation. Proton beam radiosurgery is still, in large part, an evolving technology, not widely and uniformly available.
Role of Radiosurgery
Photon (X-ray)-based radiosurgery can be an alternative to craniotomy. Patients can return to their activities immediately after treatment. The ideal candidate for radiosurgery should have a small tumor (1-3 cm is best) with a well-defined margin. Retrospective studies reported no significant difference in therapy outcomes between the 2 therapies.3,4 Additional benefits of radiosurgery include low morbidity and mortality. Furthermore, radiosurgery can be applied to tumors near critical structures, such as the thalamus, basal ganglia, and brainstem, that are otherwise surgically inaccessible.
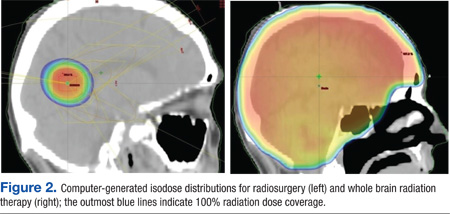
Most brain metastases are well defined and spherical, so they are ideally treated using SRS (Figure 1). Additionally, the brain is encased in the bony skull, which prevents significant intrafraction motion and provides a reproducible fidulial for accurate setup. Radiosurgery can tailor the radiation dose in order to precisely concentrate radiation distribution to the tumor lesion with a rapid dose falloff beyond the margin of the tumor bed, so surrounding normal brain tissues are spared from high-dose radiation. In sharp contrast, WBRT indiscriminately irradiates the entire brain without sparing the adjacent normal brain tissue (Figure 2). However, because of its limited dose distribution, radiosurgery offers no protection elsewhere in the brain from future metastasis, which is a benefit of whole brain radiation.
Future Use of SBRT
Based on successful experience with intracranial lesions, stereotactic techniques have been expanded to additional anatomical body sites other than the brain. Stereotactic body radiation therapy (SBRT), also called stereotactic body ablative radiotherapy, is progressively gaining acceptance and is being applied to various extracranial tumors, especially lung cancers and hepatic malignancies. Dosimetric studies and early phase clinical trials have clearly established the feasibility, safety, and efficacy of SBRT for certain tumor sites, such as lung, liver, kidney, spine, and paraspinal tumors. Additionally, SBRT may reduce treatment time and therapy costs and thus provide increased convenience to patients.
Effectiveness of SRS
Stafinski and colleagues conducted a meta-analysis of randomized trials to study the effectiveness of SRS in improving the survival as well as the quality of life (QOL) and functional status following SRS of patients with brain metastasis.5 This study found that SRS plus WBRT increased OS for patients with single brain metastasis compared with WBRT alone. Although no significant difference in OS was found in patients with multiple brain metastases, the addition of SRS to WBRT improved the local control and functional independence of this group of patients.
Related: Palliative Radiotherapy for the Management of Metastatic Cancer
Kondziolka and colleagues reported a local failure rate at 1 year of merely 8% following SRS boost therapy after WBRT compared with 100% without SRS.6 There was also a remarkable difference in median time to local failure—36 months vs 6 months, respectively. A randomized study designed to assess the possible benefit of SRS for the treatment of brain metastasis found a survival gain for patients with a single brain metastasis with a median survival time of 6.5 months (SRS) vs 4.9 months (no SRS).7
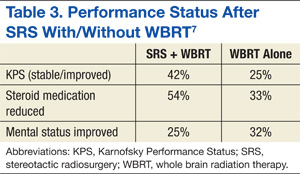
There are sparse data and reporting related to QOL measurements after SRS for brain metastasis. Andrews and colleagues reported improved functional and independent abilities at 6 months after completion of SRS therapy.7 The criteria used in that study for performance assessments included the Karnofsky Performance Status (KPS) scale, the need for steroid use, and mental status. They found that KPS improvement was statistically significant, and patients were able to decrease the dosage of steroid medication at 6 months after therapy with SRS (Table 3). Despite these reports suggesting superior outcomes with SRS, more rigorous investigations that adequately control for other factors influencing QOL in patients with cancer are needed.
Two major limitations of SRS include large tumor size and multiple numbers of metastatic brain lesions. As the radiation dose to adjacent normal brain tissue quickly increases with larger tumor lesions (> 3-4 cm), the complication risks consequently rise proportionally, necessitating a decrease in the prescribed dose. Patients with poor performance status (< 70 KPS) and presence of active/progressive extracranial disease are also not ideal candidates for SRS.
Other unfavorable conditions for SRS include life expectancy of < 6 months, metastatic lesions in the posterior fossa, and severe acute CNS symptoms due to increased intracranial pressure, brain edema, or massive tumor effects. These factors do not necessarily contraindicate SRS but can increase the risks of such treatment. The authors recommend an experienced multispecialty approach to patients presenting with these findings.
Managing Brain Metastastis
To prevent symptoms related to brain edema (due to brain tumor itself and/or radiation-induced edema), steroid medication is generally administered to most patients, 1 to 3 days prior to initiation of radiation therapy. Corticosteroid use typically results in rapid improvement of existing CNS symptoms, such as headaches, and helps prevent the development of additional CNS symptoms due to radiation therapy-induced cerebral edema. A dexamethasone dose as low as 4 mg per day may be effective for prophylaxis if no symptoms or signs of increased intracranial pressure or altered consciousness exist. If the patient experiences symptomatic elevations in intracranial pressure, however, a 16-mg dose of dexamethasone per day orally, following a loading dose of 10-mg IV dexamethasone, should be considered. The latter scenario is not common.
Related: Pulmonary Vein Thrombosis Associated With Metastatic Carcinoma
The benefits of steroids, however, need to be carefully balanced against the possible adverse effects (AEs) associated with steroid use, including peripheral edema, gastrointestinal bleeding, risk of infections, hyperglycemia, insomnia, as well as mental status changes, such as anxiety, depression, and confusion. In long-term users, the additional AEs of oral candidiasis and osteoporosis should also be taken into account.
Craniotomy vs SRS
A retrospective study by Schöggl and colleagues compared single brain metastasis cases treated using either Gamma Knife or brain surgery followed by WBRT (30 Gy/10 fractions).3 Local control was significantly better after radiosurgery (95% vs 83%), and median survival was 12 months and 9 months after radiosurgery and brain surgery, respectively. There was no significant difference in OS.
Another comparative study of SR and SRS for solitary brain metastasis revealed no statistically significant difference in survival between the 2 therapeutic modalities (SR or SRS); the 1-year survival rate was 62% (SR) and 56% (SRS).4 A significant prognostic factor for survival was a good performance status of the patients. There was, however, a significant difference in local tumor control: None of the patients in the SRS group experienced local recurrence in contrast to 19 (58%) patients in the SR group.
Whereas selection criteria and treatment choice depend to a large extent on tumor location, tumor size, and availability of SRS, most studies demonstrated that both surgery and SRS result in comparable OS rates for patients with a single brain metastasis.
Multiple Brain Metastases
Jawahar and colleagues studied the role of SRS for multiple brain metastases.8 In their retrospective review of 50 patients with ≥ 3 brain metastases, they found an overall response rate (RR) of 82% and a median survival of 12 months after SRS. As a result of similar studies and their own data, Hasegawa and colleagues recommended radiosurgery alone as initial therapy for patients with a limited number of brain metastases.9
SRS vs SRS Plus WBRT
Studies on the role of SRS plus WBRT are somewhat conflicting. A Radiation Therapy Oncology Group study revealed statistically significant improvement in median survival when SRS boost therapy was added to WBRT in patients with a single brain metastasis compared with SRS alone.5 According to another study, the addition of SRS to WBRT provided better intracranial and local control of metastatic tumors.10
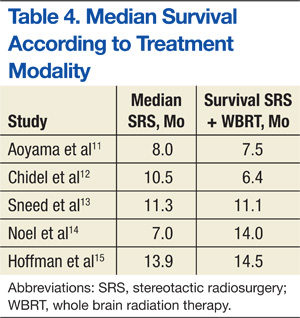
A randomized controlled study by Aoyama and colleagues reported no survival improvement using SRS and WBRT in patients with 1 to 4 brain metastases compared with SRS alone.11 In addition, a retrospective review found no difference in median survival outcomes between SRS alone and SRS plus WBRT (Table 4). In the absence of a clear survival benefit with the use of both modalities and in light of the added toxicity of WBRT, most clinicians have ceased offering both modalities upfront and instead reserve WBRT as a salvage option in cases of subsequent intracranial progression of disease.
SRS vs WBRT
In general, both SR (crainotomy) and SRS for the treatment of brain metastases seem to be effective therapeutic modalities. Comparisons of both treatments did not reveal significant differences and showed similar outcomes after treatment of smaller lesions. For example, Rades and colleagues reported that SRS alone is as effective as surgery and WBRT for limited metastatic lesions (< 2) in the brain.16 Either SRS or surgery can be used, depending on performance status and metastatic burden (size, location, number of lesions, etc).
There are some inconsistencies in the final results of various studies, such as survival, local tumor control, mortality rate, and pattern of failures. For large, symptomatic brain metastasis, initial surgical debulking remains the preferred approach as a way of achieving immediate decompression and relief of swelling/symptoms. Additionally, for patients who have > 10 brain lesions and/or a histology that corroborates diffuse subclinical involvement of the brain parenchyma (eg, small-cell lung cancer), WBRT is also typically preferred to upfront SRS. Alternatively, radiosurgery is the preferred method for fewer and smaller lesions as a way of minimizing the toxicity from whole brain irradiation. The optimal treatment of multiple small brain metastases remains controversial with some investigators recommending SRS for > 4 metastases only in the setting of controlled extracranial disease based on the more favorable expected survival of such patients.
Multidisciplinary Approach for Lung and Breast Cancers
Prognostic outcomes of patients with brain metastases can vary by primary cancer type. Therefore, clinicians should consider cancer-specific management and tailor their recommendation for specific types of radiation depending on the individual cancer diagnosis. Various investigators have attempted to develop disease-specific prognostic tools to aid clinicians in their decision making. For example, Sperduto and colleagues analyzed significant indexes and diagnosis-specific prognostic factors and published the diagnostic-specific graded prognostic assessment factors.17 They were able to identify several significant prognostic factors, specific to different primary cancer types.
Bimodality Therapies
For certain cancers such as lung and breast primary cancers, bimodality therapy using chemotherapy and radiation treatment should be considered based on promising responses reported in the literature.
Recent studies on the efficacy of chemotherapy for brain metastases from small-cell lung cancer (43%-82%) have also been reported.18-20 Postmus and colleagues reported superior RR of 57% with combination chemotherapy and radiation vs a 22% RR for chemotherapy alone.21 They also found favorable long-term survival trends in patients treated with combined radiochemotherapy.
The efficacy of chemotherapy in non-small cell carcinoma of the lung has been reported in multiple phase 2 studies using various chemotherapeutic agents. The reported RR ranged from 35% to 50%.22-24 Comparative studies of combined chemoradiotherapy demonstrated a 33% RR in contrast to a 27% RR for combined therapy or chemotherapy alone, respectively. However, no difference was noted in median survival rates.25
Care must be taken when interpreting these studies due to heterogeneity of the patient population studied and a lack of data on potential synergistic toxicities between radiation to the CNS and systemic therapy. The authors generally avoid concurrent chemotherapy during CNS irradiation in patients who may have significant survival times > 1 year.
The prognosis of breast cancer patients with brain metastasis largely depends on the number and size of metastatic brain lesions, performance status, extracranial or systemic involvement, and systemic treatment following brain irradiation. The median survival of patients with brain metastasis and radiation therapy is generally about 18 months. The median survival for patients with breast cancer who develop brain metastasis was 3 years from diagnosis of the primary breast cancer.26
Recent advances in systemic agents/options for patients with breast cancer can significantly affect the decision-making process in regard to the treatment of brain lesions in these patients. For example, a few retrospective studies have clearly demonstrated the beneficial effect of trastuzumab in patients with breast cancer with brain metastasis. The median OS in HER2-positive patients with brain metastasis was significantly extended to 41 months when treated with HER2-targeted trastuzumab vs only 13 months for patients who received no treatment.27,28 As a result of the expected prolonged survival, SRS for small and isolated brain lesions has recently become a much more attractive option as a way of mitigating the deleterious long-term effect of whole brain irradiation (memory decline, somnolence, etc).
Summary
Stereotactic radiosurgery is a newly developed radiation therapy technique of highly conformal and focused radiation. For the treatment of patients with favorable prognostic factors and limited brain metastases, especially single brain metastasis, crainiotomy and SRS seems similarly effective and appropriate choices of therapy. Some studies question the possible benefits of additional WBRT to local therapy, such as crainiotomy or radiosurgery.
Some authors recommend deferral of WBRT after local brain therapy and reserving it for salvage therapy in cases of recurrence or progression of brain disease because of possible long-term AEs of whole brain irradiation as well as deterioration of QOL in long-term survivors. Thus, the role of additional WBRT to other local therapy has not been fully settled; further randomized studies may be necessary. Due to the controversies and complexities surrounding the treatment choices for patients with brain disease, all treatment decisions should be individualized and should involve close multidisciplinary collaboration between neurosurgeons, medical oncologists, and radiation oncologists.
Author disclosures
The authors report no actual or potential conflicts of interest with regard to this article.
Disclaimer
The opinions expressed herein are those of the authors and do not necessarily reflect those of Federal Practitioner, Frontline Medical Communications Inc., the U.S. Government, or any of its agencies. This article may discuss unlabeled or investigational use of certain drugs. Please review the complete prescribing information for specific drugs or drug combinations—including indications, contraindications, warnings, and adverse effects—before administering pharmacologic therapy to patients.
1. Limbrick DD Jr, Lusis EA, Chicoine MR, et al. Combined surgical resection and stereotactic radiosurgery for treatment of cerebral metastases. Surg Neurol. 2009;71(3):280-288.
2. Gaspar L, Scott C, Rotman M, et al. Recursive partitioning analysis (RPA) of prognostic factors in three Radiation Therapy Oncology Group (RTOG) brain metastases trials. Int J Radiat Oncol Biol Phys. 1997;37(4):745-751.
3. Schöggl A, Kitz K, Reddy M, et al. Defining the role of stereotactic radiosurgery versus microsurgery in the treatment of single brain metastases. Acta Neurochir (Wien). 2000;142(6):621-626.
4. O’Neill BP, Iturria NJ, Link MJ, Pollock BE, Ballman KV, O’Fallon JR. A comparison of surgical resection and stereotactic radiosurgery in the treatment of solitary brain metastases. Int J Radiat Oncol Biol Phys. 2003;55(5):1169-1176.
5. Stafinski T, Jhangri GS, Yan E, Manon D. Effectiveness of stereotactic radiosurgery alone or in combination with whole brain radiotherapy compared to conventional surgery and/or whole brain radiotherapy for the treatment of one or more brain metastases: a systematic review and meta-analysis. Cancer Treat Rev. 2006;32(3):203-213.
6. Kondziolka D, Patel A, Lunsford LD, Kassam A, Flickinger JC. Stereotactic radiosurgery plus whole brain radiotherapy versus radiotherapy alone for patients with multiple brain metastases. Int J Radiat Oncol Biol Phys. 1999;45(2):427-434.
7. Andrews DW, Scott CB, Sperduto PW, et al. Whole brain radiation therapy with or without stereotactic radiosurgery boost for patients with one to three brain metastases: phase III results of the RTOG 9508 randomised trial. Lancet. 2004;363(9422):1665-1672.
8. Jawahar A, Shaya M, Campbell P, et al. Role of stereotactic radiosurgery as a primary treatment option in the management of newly diagnosed multiple (3-6) intracranial metastases. Surg Neurol. 2005;64(3):207-212.
9. Hasegawa T, Kondziolka D, Flickinger JC, Germanwala A, Lunsford LD. Brain metastases treated with radiosurgery alone: an alternative to whole brain radiotherapy? Neurosurgery. 2003;52(6):1318-1326.
10. Rades D, Kueter JD, Hornung D, et al. Comparison of stereotactic radiosurgery (SRS) alone and whole brain radiotherapy (WBRT) plus a stereotactic boost (WBRT+SRS) for one to three brain metastases. Strahlenther Onkol. 2008;184(12):655-662.
11. Aoyama H, Shirato H, Tago M, et al. Stereotactic radiosurgery plus whole-brain radiation therapy vs stereotactic radiosurgery alone for treatment of brain metastases: a randomized controlled trial. JAMA. 2006;295(21):2483-2491.
12. Chidel MA, Suh JH, Reddy CA, Chao ST, Lundbeck MF, Barnett GH. Application of recursive partitioning analysis and evaluation of the use of whole brain radiation among patients treated with stereotactic radiosurgery for newly diagnosed brain metastases. Int J Radiat Oncol Biol Phys. 2000;47(4):993-999.
13. Sneed PK, Lamborn KR, Forstner JM, et al. Radiosurgery for brain metastases: is whole brain radiotherapy necessary? Int J Radiat Oncol Biol Phys. 1999;43(3):549-558.
14. Noel G, Medioni J, Valery CA, et al. Three irradiation treatment options including radiosurgery for brain metastases from primary lung cancer. Lung Cancer. 2003;41(3):333-343.
15. Hoffman R, Sneed PK, McDermott MW, et al. Radiosurgery for brain metastases from primary lung carcinoma. Cancer J. 2001;7(2):121-131.
16. Rades D, Bohlen G, Pluemer A, et al. Stereotactic radiosurgery alone versus resection plus whole brain radiotherapy for 1 or 2 brain metastases in recursive partitioning analysis class 1 and 2 patients. Cancer. 2007;109(12):2515-2521.
17. Sperduto PW, Chao ST, Sneed PK, et al. Diagnosis-specific prognostic factors, indexes, and treatment outcomes for patients with newly diagnosed brain metastases: a multi-institutional analysis of 4,259 patients. Int J Radiat Oncol Biol Phys. 2010;77(3):655-661.
18. Twelves CJ, Souhami RL, Harper PG, et al. The response of cerebral metastases in small cell lung cancer to systemic chemotherapy. Br J Cancer. 1990;61(1):147-150.
19. Tanaka H, Takifuj N, Masuda N, et al. [Systemic chemotherapy for brain metastases from small-cell lung cancer]. Nihon Kyobu Shikkan Gakkai Zasshi. 1993;31(4):492-497. Japanese.
20. Lee JS, Murphy WK, Glisson BS, Dhingra HM, Holoye PY, Hong WK. Primary chemotherapy of brain metastasis in small-cell lung cancer. J Clin Oncol. 1989;7(7):216-222.
21. Postmus PE, Haaxma-Reiche H, Smit EF, et al. Treatment of brain metastases of small-cell lung cancer: comparing teniposide and teniposide with whole-brain radiotherapy—a phase III study of the European Organisation for the Research and Treatment of Cancer Lung Cancer Cooperative Group. J Clin Oncol. 2000;18(19):3400-3408.
22. Cortes J, Rodriguez J, Aramendia JM, et al. Frontline paclitaxel/cisplatin-based chemotherapy in brain metastases from non-small-cell lung cancer. Oncology. 2003;64(1):28-35.
23. Minotti V, Crinò L, Meacci ML, et al. Chemotherapy with cisplatin and teniposide for cerebral metastases in non-small cell lung cancer. Lung Cancer. 1998;20(2):23-28.
24. Fujita A, Fukuoka S, Takabatake H, Tagaki S, Sekine K. Combination chemotherapy of cisplatin, ifosfamide, and irinotecan with rhG-CSF support in patient with brain metastases from non-small cell lung cancer. Oncology. 2000;59(4):291-295.
25. Robinet G, Thomas R, Breton JL, et al. Results of a phase III study of early versus delayed whole brain radiotherapy with concurrent cisplatin and vinorelbine combination in inoperable brain metastasis of non-small-cell lung cancer: Groupe Français de Pneumo-Cancérologie (GFPC) Protocol 95-1. Ann Oncol. 2001;12(1):29-67.
26. Kiricuta IC, Kölbl O, Willner J, Bohndorf W. Central nervous system metastases in breast cancer. J Cancer Res Clin Oncol. 1992;118(7):542-546.
27. Berghoff AS, Bago-Horvath Z, Dubsky P, et al. Impact of HER-2-targeted therapy on overall survival in patients with HER-2 positive metastatic breast cancer. Breast J. 2013;19(2):149-155.
28. Park IH, Ro J, Lee KS, Nam BH, Kwon Y, Shin KH. Truastzumab treatment beyond brain progression in HER2-positive metastatic breast cancer. Ann Oncol. 2009;20(1):56-62.
Since the 1980s, patients with a single intracranial metastatic lesion traditionally have been treated with surgery followed by whole brain radiation therapy (WBRT). However, there is growing concern about the debilitating cognitive effects associated with WBRT in long-term survivors.
Limbrick and colleagues studied the outcomes of surgery followed by stereotactic radiosurgery (SRS) instead of WBRT and found that the less invasive surgical resection (SR) followed by SRS was an equally effective therapeutic option for the treatment of patients with limited metastatic disease to the brain.1 Median overall survival (OS) was 20 months and was 22 and 13 months for Classes 1 and 2 recursive partitioning analysis (RPA) patients, respectively. Recursive partitioning analysis refers to 3 prognostic classes based on a database of 3 trial studies and 1,200 patients (Table 1).2 According to RPA, the best survival was observed in Class 1 patients, and the worst survival was seen in Class 3 patients. Limbrick and colleagues found that survival outcome was equivalent to or greater than that reported by other studies using surgery plus WBRT or SRS plus WBRT.1 The WBRT was not used and was reserved as salvage therapy in cases of initial failure such as disease progression of brain metastasis.
Radiation Therapies
Stereotactic radiosurgery is not a surgical procedure but a newly developed radiotherapy technique. It is a highly precise, intensive form of radiation therapy, focused on the tumor, with the goal of protecting the surrounding normal brain tissue as much as possible. Radiosurgery was initially introduced with the Gamma Knife by Lars Leksell several decades ago in order to deliver an intense radiation dose to a small, well-defined, single focal point using extreme precision. Stereotactic radiosurgery delivers efficient and focused radiation treatment to the tumor lesion.
There are 2 practical and commercially available radiation delivery systems for SRS: linear accelerator (LINAC)-based radiosurgery and Gamma Knife systems. Use of the Gamma Knife is limited largely to treatment of central nervous system (CNS) malignancies and certain head and neck cancers. Linear accelerator-based SRS is applicable to neoplasms in any organ system of the body (Table 2).
Proton therapy is yet another evolving and completely different mode of radiation therapy. There are currently 14 proton therapy centers in operation in the U.S., and 11 more centers are now under construction. Proton therapy uses charged heavy-particle therapy using proton beams, whereas conventional LINAC-based radiotherapy is X-ray radiotherapy, which uses high energy photon beams. Because of their relatively large mass, protons have little scatter of radiation to surrounding normal structures and can remain sharply focused on the tumor lesion. Accordingly, proton therapy delivers negligible radiation doses beyond tumor lesions, and much of the surrounding normal tissues can be saved from excessive and unnecessary radiation doses.
Related: Bone Metastasis: A Concise Overview
A single proton beam produces a narrow Bragg peak dose distribution at depth, and multiple consecutive stepwise series of different energies of proton beams are needed to administer complete coverage of the target tumor volume. The accumulation of these beam energies produces a uniform radiation dose distribution covering the entire tumor volume (Figure 1). In spite of the theoretical beneficial effects of proton beam therapy, more clinical experience is needed for it to be validated. Even then, the significantly higher costs of proton therapy represent another barrier to its wider implementation. Proton beam radiosurgery is still, in large part, an evolving technology, not widely and uniformly available.
Role of Radiosurgery
Photon (X-ray)-based radiosurgery can be an alternative to craniotomy. Patients can return to their activities immediately after treatment. The ideal candidate for radiosurgery should have a small tumor (1-3 cm is best) with a well-defined margin. Retrospective studies reported no significant difference in therapy outcomes between the 2 therapies.3,4 Additional benefits of radiosurgery include low morbidity and mortality. Furthermore, radiosurgery can be applied to tumors near critical structures, such as the thalamus, basal ganglia, and brainstem, that are otherwise surgically inaccessible.
Most brain metastases are well defined and spherical, so they are ideally treated using SRS (Figure 1). Additionally, the brain is encased in the bony skull, which prevents significant intrafraction motion and provides a reproducible fidulial for accurate setup. Radiosurgery can tailor the radiation dose in order to precisely concentrate radiation distribution to the tumor lesion with a rapid dose falloff beyond the margin of the tumor bed, so surrounding normal brain tissues are spared from high-dose radiation. In sharp contrast, WBRT indiscriminately irradiates the entire brain without sparing the adjacent normal brain tissue (Figure 2). However, because of its limited dose distribution, radiosurgery offers no protection elsewhere in the brain from future metastasis, which is a benefit of whole brain radiation.
Future Use of SBRT
Based on successful experience with intracranial lesions, stereotactic techniques have been expanded to additional anatomical body sites other than the brain. Stereotactic body radiation therapy (SBRT), also called stereotactic body ablative radiotherapy, is progressively gaining acceptance and is being applied to various extracranial tumors, especially lung cancers and hepatic malignancies. Dosimetric studies and early phase clinical trials have clearly established the feasibility, safety, and efficacy of SBRT for certain tumor sites, such as lung, liver, kidney, spine, and paraspinal tumors. Additionally, SBRT may reduce treatment time and therapy costs and thus provide increased convenience to patients.
Effectiveness of SRS
Stafinski and colleagues conducted a meta-analysis of randomized trials to study the effectiveness of SRS in improving the survival as well as the quality of life (QOL) and functional status following SRS of patients with brain metastasis.5 This study found that SRS plus WBRT increased OS for patients with single brain metastasis compared with WBRT alone. Although no significant difference in OS was found in patients with multiple brain metastases, the addition of SRS to WBRT improved the local control and functional independence of this group of patients.
Related: Palliative Radiotherapy for the Management of Metastatic Cancer
Kondziolka and colleagues reported a local failure rate at 1 year of merely 8% following SRS boost therapy after WBRT compared with 100% without SRS.6 There was also a remarkable difference in median time to local failure—36 months vs 6 months, respectively. A randomized study designed to assess the possible benefit of SRS for the treatment of brain metastasis found a survival gain for patients with a single brain metastasis with a median survival time of 6.5 months (SRS) vs 4.9 months (no SRS).7
There are sparse data and reporting related to QOL measurements after SRS for brain metastasis. Andrews and colleagues reported improved functional and independent abilities at 6 months after completion of SRS therapy.7 The criteria used in that study for performance assessments included the Karnofsky Performance Status (KPS) scale, the need for steroid use, and mental status. They found that KPS improvement was statistically significant, and patients were able to decrease the dosage of steroid medication at 6 months after therapy with SRS (Table 3). Despite these reports suggesting superior outcomes with SRS, more rigorous investigations that adequately control for other factors influencing QOL in patients with cancer are needed.
Two major limitations of SRS include large tumor size and multiple numbers of metastatic brain lesions. As the radiation dose to adjacent normal brain tissue quickly increases with larger tumor lesions (> 3-4 cm), the complication risks consequently rise proportionally, necessitating a decrease in the prescribed dose. Patients with poor performance status (< 70 KPS) and presence of active/progressive extracranial disease are also not ideal candidates for SRS.
Other unfavorable conditions for SRS include life expectancy of < 6 months, metastatic lesions in the posterior fossa, and severe acute CNS symptoms due to increased intracranial pressure, brain edema, or massive tumor effects. These factors do not necessarily contraindicate SRS but can increase the risks of such treatment. The authors recommend an experienced multispecialty approach to patients presenting with these findings.
Managing Brain Metastastis
To prevent symptoms related to brain edema (due to brain tumor itself and/or radiation-induced edema), steroid medication is generally administered to most patients, 1 to 3 days prior to initiation of radiation therapy. Corticosteroid use typically results in rapid improvement of existing CNS symptoms, such as headaches, and helps prevent the development of additional CNS symptoms due to radiation therapy-induced cerebral edema. A dexamethasone dose as low as 4 mg per day may be effective for prophylaxis if no symptoms or signs of increased intracranial pressure or altered consciousness exist. If the patient experiences symptomatic elevations in intracranial pressure, however, a 16-mg dose of dexamethasone per day orally, following a loading dose of 10-mg IV dexamethasone, should be considered. The latter scenario is not common.
Related: Pulmonary Vein Thrombosis Associated With Metastatic Carcinoma
The benefits of steroids, however, need to be carefully balanced against the possible adverse effects (AEs) associated with steroid use, including peripheral edema, gastrointestinal bleeding, risk of infections, hyperglycemia, insomnia, as well as mental status changes, such as anxiety, depression, and confusion. In long-term users, the additional AEs of oral candidiasis and osteoporosis should also be taken into account.
Craniotomy vs SRS
A retrospective study by Schöggl and colleagues compared single brain metastasis cases treated using either Gamma Knife or brain surgery followed by WBRT (30 Gy/10 fractions).3 Local control was significantly better after radiosurgery (95% vs 83%), and median survival was 12 months and 9 months after radiosurgery and brain surgery, respectively. There was no significant difference in OS.
Another comparative study of SR and SRS for solitary brain metastasis revealed no statistically significant difference in survival between the 2 therapeutic modalities (SR or SRS); the 1-year survival rate was 62% (SR) and 56% (SRS).4 A significant prognostic factor for survival was a good performance status of the patients. There was, however, a significant difference in local tumor control: None of the patients in the SRS group experienced local recurrence in contrast to 19 (58%) patients in the SR group.
Whereas selection criteria and treatment choice depend to a large extent on tumor location, tumor size, and availability of SRS, most studies demonstrated that both surgery and SRS result in comparable OS rates for patients with a single brain metastasis.
Multiple Brain Metastases
Jawahar and colleagues studied the role of SRS for multiple brain metastases.8 In their retrospective review of 50 patients with ≥ 3 brain metastases, they found an overall response rate (RR) of 82% and a median survival of 12 months after SRS. As a result of similar studies and their own data, Hasegawa and colleagues recommended radiosurgery alone as initial therapy for patients with a limited number of brain metastases.9
SRS vs SRS Plus WBRT
Studies on the role of SRS plus WBRT are somewhat conflicting. A Radiation Therapy Oncology Group study revealed statistically significant improvement in median survival when SRS boost therapy was added to WBRT in patients with a single brain metastasis compared with SRS alone.5 According to another study, the addition of SRS to WBRT provided better intracranial and local control of metastatic tumors.10
A randomized controlled study by Aoyama and colleagues reported no survival improvement using SRS and WBRT in patients with 1 to 4 brain metastases compared with SRS alone.11 In addition, a retrospective review found no difference in median survival outcomes between SRS alone and SRS plus WBRT (Table 4). In the absence of a clear survival benefit with the use of both modalities and in light of the added toxicity of WBRT, most clinicians have ceased offering both modalities upfront and instead reserve WBRT as a salvage option in cases of subsequent intracranial progression of disease.
SRS vs WBRT
In general, both SR (crainotomy) and SRS for the treatment of brain metastases seem to be effective therapeutic modalities. Comparisons of both treatments did not reveal significant differences and showed similar outcomes after treatment of smaller lesions. For example, Rades and colleagues reported that SRS alone is as effective as surgery and WBRT for limited metastatic lesions (< 2) in the brain.16 Either SRS or surgery can be used, depending on performance status and metastatic burden (size, location, number of lesions, etc).
There are some inconsistencies in the final results of various studies, such as survival, local tumor control, mortality rate, and pattern of failures. For large, symptomatic brain metastasis, initial surgical debulking remains the preferred approach as a way of achieving immediate decompression and relief of swelling/symptoms. Additionally, for patients who have > 10 brain lesions and/or a histology that corroborates diffuse subclinical involvement of the brain parenchyma (eg, small-cell lung cancer), WBRT is also typically preferred to upfront SRS. Alternatively, radiosurgery is the preferred method for fewer and smaller lesions as a way of minimizing the toxicity from whole brain irradiation. The optimal treatment of multiple small brain metastases remains controversial with some investigators recommending SRS for > 4 metastases only in the setting of controlled extracranial disease based on the more favorable expected survival of such patients.
Multidisciplinary Approach for Lung and Breast Cancers
Prognostic outcomes of patients with brain metastases can vary by primary cancer type. Therefore, clinicians should consider cancer-specific management and tailor their recommendation for specific types of radiation depending on the individual cancer diagnosis. Various investigators have attempted to develop disease-specific prognostic tools to aid clinicians in their decision making. For example, Sperduto and colleagues analyzed significant indexes and diagnosis-specific prognostic factors and published the diagnostic-specific graded prognostic assessment factors.17 They were able to identify several significant prognostic factors, specific to different primary cancer types.
Bimodality Therapies
For certain cancers such as lung and breast primary cancers, bimodality therapy using chemotherapy and radiation treatment should be considered based on promising responses reported in the literature.
Recent studies on the efficacy of chemotherapy for brain metastases from small-cell lung cancer (43%-82%) have also been reported.18-20 Postmus and colleagues reported superior RR of 57% with combination chemotherapy and radiation vs a 22% RR for chemotherapy alone.21 They also found favorable long-term survival trends in patients treated with combined radiochemotherapy.
The efficacy of chemotherapy in non-small cell carcinoma of the lung has been reported in multiple phase 2 studies using various chemotherapeutic agents. The reported RR ranged from 35% to 50%.22-24 Comparative studies of combined chemoradiotherapy demonstrated a 33% RR in contrast to a 27% RR for combined therapy or chemotherapy alone, respectively. However, no difference was noted in median survival rates.25
Care must be taken when interpreting these studies due to heterogeneity of the patient population studied and a lack of data on potential synergistic toxicities between radiation to the CNS and systemic therapy. The authors generally avoid concurrent chemotherapy during CNS irradiation in patients who may have significant survival times > 1 year.
The prognosis of breast cancer patients with brain metastasis largely depends on the number and size of metastatic brain lesions, performance status, extracranial or systemic involvement, and systemic treatment following brain irradiation. The median survival of patients with brain metastasis and radiation therapy is generally about 18 months. The median survival for patients with breast cancer who develop brain metastasis was 3 years from diagnosis of the primary breast cancer.26
Recent advances in systemic agents/options for patients with breast cancer can significantly affect the decision-making process in regard to the treatment of brain lesions in these patients. For example, a few retrospective studies have clearly demonstrated the beneficial effect of trastuzumab in patients with breast cancer with brain metastasis. The median OS in HER2-positive patients with brain metastasis was significantly extended to 41 months when treated with HER2-targeted trastuzumab vs only 13 months for patients who received no treatment.27,28 As a result of the expected prolonged survival, SRS for small and isolated brain lesions has recently become a much more attractive option as a way of mitigating the deleterious long-term effect of whole brain irradiation (memory decline, somnolence, etc).
Summary
Stereotactic radiosurgery is a newly developed radiation therapy technique of highly conformal and focused radiation. For the treatment of patients with favorable prognostic factors and limited brain metastases, especially single brain metastasis, crainiotomy and SRS seems similarly effective and appropriate choices of therapy. Some studies question the possible benefits of additional WBRT to local therapy, such as crainiotomy or radiosurgery.
Some authors recommend deferral of WBRT after local brain therapy and reserving it for salvage therapy in cases of recurrence or progression of brain disease because of possible long-term AEs of whole brain irradiation as well as deterioration of QOL in long-term survivors. Thus, the role of additional WBRT to other local therapy has not been fully settled; further randomized studies may be necessary. Due to the controversies and complexities surrounding the treatment choices for patients with brain disease, all treatment decisions should be individualized and should involve close multidisciplinary collaboration between neurosurgeons, medical oncologists, and radiation oncologists.
Author disclosures
The authors report no actual or potential conflicts of interest with regard to this article.
Disclaimer
The opinions expressed herein are those of the authors and do not necessarily reflect those of Federal Practitioner, Frontline Medical Communications Inc., the U.S. Government, or any of its agencies. This article may discuss unlabeled or investigational use of certain drugs. Please review the complete prescribing information for specific drugs or drug combinations—including indications, contraindications, warnings, and adverse effects—before administering pharmacologic therapy to patients.
1. Limbrick DD Jr, Lusis EA, Chicoine MR, et al. Combined surgical resection and stereotactic radiosurgery for treatment of cerebral metastases. Surg Neurol. 2009;71(3):280-288.
2. Gaspar L, Scott C, Rotman M, et al. Recursive partitioning analysis (RPA) of prognostic factors in three Radiation Therapy Oncology Group (RTOG) brain metastases trials. Int J Radiat Oncol Biol Phys. 1997;37(4):745-751.
3. Schöggl A, Kitz K, Reddy M, et al. Defining the role of stereotactic radiosurgery versus microsurgery in the treatment of single brain metastases. Acta Neurochir (Wien). 2000;142(6):621-626.
4. O’Neill BP, Iturria NJ, Link MJ, Pollock BE, Ballman KV, O’Fallon JR. A comparison of surgical resection and stereotactic radiosurgery in the treatment of solitary brain metastases. Int J Radiat Oncol Biol Phys. 2003;55(5):1169-1176.
5. Stafinski T, Jhangri GS, Yan E, Manon D. Effectiveness of stereotactic radiosurgery alone or in combination with whole brain radiotherapy compared to conventional surgery and/or whole brain radiotherapy for the treatment of one or more brain metastases: a systematic review and meta-analysis. Cancer Treat Rev. 2006;32(3):203-213.
6. Kondziolka D, Patel A, Lunsford LD, Kassam A, Flickinger JC. Stereotactic radiosurgery plus whole brain radiotherapy versus radiotherapy alone for patients with multiple brain metastases. Int J Radiat Oncol Biol Phys. 1999;45(2):427-434.
7. Andrews DW, Scott CB, Sperduto PW, et al. Whole brain radiation therapy with or without stereotactic radiosurgery boost for patients with one to three brain metastases: phase III results of the RTOG 9508 randomised trial. Lancet. 2004;363(9422):1665-1672.
8. Jawahar A, Shaya M, Campbell P, et al. Role of stereotactic radiosurgery as a primary treatment option in the management of newly diagnosed multiple (3-6) intracranial metastases. Surg Neurol. 2005;64(3):207-212.
9. Hasegawa T, Kondziolka D, Flickinger JC, Germanwala A, Lunsford LD. Brain metastases treated with radiosurgery alone: an alternative to whole brain radiotherapy? Neurosurgery. 2003;52(6):1318-1326.
10. Rades D, Kueter JD, Hornung D, et al. Comparison of stereotactic radiosurgery (SRS) alone and whole brain radiotherapy (WBRT) plus a stereotactic boost (WBRT+SRS) for one to three brain metastases. Strahlenther Onkol. 2008;184(12):655-662.
11. Aoyama H, Shirato H, Tago M, et al. Stereotactic radiosurgery plus whole-brain radiation therapy vs stereotactic radiosurgery alone for treatment of brain metastases: a randomized controlled trial. JAMA. 2006;295(21):2483-2491.
12. Chidel MA, Suh JH, Reddy CA, Chao ST, Lundbeck MF, Barnett GH. Application of recursive partitioning analysis and evaluation of the use of whole brain radiation among patients treated with stereotactic radiosurgery for newly diagnosed brain metastases. Int J Radiat Oncol Biol Phys. 2000;47(4):993-999.
13. Sneed PK, Lamborn KR, Forstner JM, et al. Radiosurgery for brain metastases: is whole brain radiotherapy necessary? Int J Radiat Oncol Biol Phys. 1999;43(3):549-558.
14. Noel G, Medioni J, Valery CA, et al. Three irradiation treatment options including radiosurgery for brain metastases from primary lung cancer. Lung Cancer. 2003;41(3):333-343.
15. Hoffman R, Sneed PK, McDermott MW, et al. Radiosurgery for brain metastases from primary lung carcinoma. Cancer J. 2001;7(2):121-131.
16. Rades D, Bohlen G, Pluemer A, et al. Stereotactic radiosurgery alone versus resection plus whole brain radiotherapy for 1 or 2 brain metastases in recursive partitioning analysis class 1 and 2 patients. Cancer. 2007;109(12):2515-2521.
17. Sperduto PW, Chao ST, Sneed PK, et al. Diagnosis-specific prognostic factors, indexes, and treatment outcomes for patients with newly diagnosed brain metastases: a multi-institutional analysis of 4,259 patients. Int J Radiat Oncol Biol Phys. 2010;77(3):655-661.
18. Twelves CJ, Souhami RL, Harper PG, et al. The response of cerebral metastases in small cell lung cancer to systemic chemotherapy. Br J Cancer. 1990;61(1):147-150.
19. Tanaka H, Takifuj N, Masuda N, et al. [Systemic chemotherapy for brain metastases from small-cell lung cancer]. Nihon Kyobu Shikkan Gakkai Zasshi. 1993;31(4):492-497. Japanese.
20. Lee JS, Murphy WK, Glisson BS, Dhingra HM, Holoye PY, Hong WK. Primary chemotherapy of brain metastasis in small-cell lung cancer. J Clin Oncol. 1989;7(7):216-222.
21. Postmus PE, Haaxma-Reiche H, Smit EF, et al. Treatment of brain metastases of small-cell lung cancer: comparing teniposide and teniposide with whole-brain radiotherapy—a phase III study of the European Organisation for the Research and Treatment of Cancer Lung Cancer Cooperative Group. J Clin Oncol. 2000;18(19):3400-3408.
22. Cortes J, Rodriguez J, Aramendia JM, et al. Frontline paclitaxel/cisplatin-based chemotherapy in brain metastases from non-small-cell lung cancer. Oncology. 2003;64(1):28-35.
23. Minotti V, Crinò L, Meacci ML, et al. Chemotherapy with cisplatin and teniposide for cerebral metastases in non-small cell lung cancer. Lung Cancer. 1998;20(2):23-28.
24. Fujita A, Fukuoka S, Takabatake H, Tagaki S, Sekine K. Combination chemotherapy of cisplatin, ifosfamide, and irinotecan with rhG-CSF support in patient with brain metastases from non-small cell lung cancer. Oncology. 2000;59(4):291-295.
25. Robinet G, Thomas R, Breton JL, et al. Results of a phase III study of early versus delayed whole brain radiotherapy with concurrent cisplatin and vinorelbine combination in inoperable brain metastasis of non-small-cell lung cancer: Groupe Français de Pneumo-Cancérologie (GFPC) Protocol 95-1. Ann Oncol. 2001;12(1):29-67.
26. Kiricuta IC, Kölbl O, Willner J, Bohndorf W. Central nervous system metastases in breast cancer. J Cancer Res Clin Oncol. 1992;118(7):542-546.
27. Berghoff AS, Bago-Horvath Z, Dubsky P, et al. Impact of HER-2-targeted therapy on overall survival in patients with HER-2 positive metastatic breast cancer. Breast J. 2013;19(2):149-155.
28. Park IH, Ro J, Lee KS, Nam BH, Kwon Y, Shin KH. Truastzumab treatment beyond brain progression in HER2-positive metastatic breast cancer. Ann Oncol. 2009;20(1):56-62.
Type 1 Neurofibromatosis (von Recklinghausen Disease)
Type 1 neurofibromatosis (NF1), or von Recklinghausen disease, is a multisystem disorder affecting approximately 1 in 3500 people in South East Wales.1 Type 1 neurofibromatosis has been described in the literature since the 13th century but was not recognized as a distinct disorder until 1882 in Friedrich Daniel von Recklinghausen’s landmark publication “On Multiple Fibromas of the Skin and Their Relationship to Multiple Neuromas.”2
Genetics
Type 1 neurofibromatosis is an autosomal-dominant disorder with a nearly even split between spontaneous and inherited mutations. It is characterized by neurofibromas, which are complex tumors composed of axonal processes, Schwann cells, fibroblasts, perineural cells, and mast cells. The NF1 gene (neurofibromin 1), discovered in 1990,3 is located on chromosome 17q11.2 and encodes for the protein neurofibromin. This large gene (60 exons and >300 kilobases of genomic DNA) has one of the highest rates of spontaneous mutations in the entire human genome.4,5 Mutations exhibited by the gene are complete deletions, insertions, and nonsense and splicing mutations. Ultimately, these mutations may result in a loss of heterozygosity of the NF1 gene (a somatic loss of the second NF1 allele). Segmental, generalized, or gonadal forms of NF1 demonstrate mosaicism.6
Pathogenesis
Neurofibromin, the NF1 gene product, is a tumor suppressor expressed in many cells, primarily in neurons, glial cells, and Schwann cells, and is seen early in melanocyte development.7 The MAPK/ERK signaling pathway is a complex series of signals and interactions involved in cell growth and proliferation.5 Under normal conditions, neurofibromin, an RAS GTPase–activating protein promotes the conversion of the active RAS-GTP bound form to an inactive RAS-GDP bound form, thereby suppressing cell growth8,9; however, other possible effects are being investigated.10 Mast cells have been implicated in contributing to inflammation in the plexiform neurofibroma microenvironment of NF1.11,12 In addition, haploinsufficiency of NF1 (NF1+/−) and c-kit signaling in the hematopoietic system have been implicated in tumor progression. Accumulation of additional mutations of multiple genes, including INK4A/ARF and the protein p53, may be responsible for malignant transformation. These revelations of molecular and cellular mechanisms involved with NF1 tumorigenesis have led to trials of targeted therapies including the mammalian target of rapamycin and tyrosine kinase inhibitor imatinib mesylate, which is demonstrating promising preclinical results for treatment of peripheral nerve sheath tumors.13,14
Diagnosis
Seven cardinal diagnostic criteria have been delineated for NF1, at least 2 of which must be met to diagnose an individual with the condition.15 These criteria include (1) six or more café au lait macules (5 mm in diameter in prepubertal patients, 15 mm in postpubertal patients); (2) axillary or inguinal freckles (>2 freckles); (3) two or more typical neurofibromas or 1 plexiform neurofibroma, (4) optic nerve glioma, (5) two or more iris hamartomas (Lisch nodules), often only identified through slit-lamp examination by an ophthalmologist; (6) sphenoid dysplasia or typical long bone abnormalities such as pseudoarthritis; and (7) first-degree relative with NF1. Diagnosis may be difficult in patients who exhibit some dermatologic features of interest but who do not fully meet the diagnostic criteria.
Skin manifestations of NF1 may present in restricted segments of the body. It has been reported that half of those with NF1 are the first in their family to have the disease.16 Children with 6 or more café au lait macules alone and no family history of neurofibromatosis should be followed up, as their chances of developing NF1 are high.17 Occasionally, Lisch nodules may be the only clinical feature. Type 1 neurofibromatosis mutation analysis may be used to confirm the diagnosis in uncertain cases as well as prenatal diagnosis. However, genetic testing is not routinely advocated, and expert consultation is advised before it is undertaken. Furthermore, biopsy of asymptomatic cutaneous neurofibromas should not be undertaken for diagnostic purposes in individuals with confirmed NF1.18
Hyperintense lesions on T2-weighted magnetic resonance imaging (MRI) of the brain (formerly known as unidentified bright objects) probably are caused by aberrant myelination or gliosis and are pathognomonic of NF1.19The presence of these lesions can assist in the diagnosis of NF1, but MRI under anesthesia is not warranted for this purpose in children, who may not be able to stay still during the test.20
Physicians should not only be able to identify the cardinal skin features of NF1 but also the less common cutaneous and extracutaneous findings, which may indicate the need for referral to a dermatologist and/or neurologist.1 Café au lait macules (CALMs) are among the salient features of NF1. Classically, these lesions are well demarcated with smooth, regular, “coast of California” borders (unlike irregular “coast of Maine” borders) and a homogeneous appearance. Although the resemblance to the color of coffee in milk has earned these lesions their name, their color can range from tan to dark brown. The presence of multiple CALMs is highly suggestive of NF1.21 The prevalence of CALMs in the general population has varied from 3% to 36% depending on the study groups selected, but the presence of multiple CALMs in the general population typically is less than 1%.22 Frequently, CALMs are the first sign of NF1, occurring in 99% of NF1 patients within the first year of life. Patients continue to develop lesions throughout childhood, but they often fade in adulthood.23
Freckling of the skin folds is the most common of the cardinal criteria for NF1. Other sites include under the neck and breasts, around the lips, and trunk. Their size ranges from 1 to 3 mm, distinguishing them from CALMs. Considered nearly pathognomonic, NF1 generally occurs in children aged 3 to 5 years in the axillae or groin.15,24
Cutaneous neurofibromas generally are cutaneous/dermal tumors that are dome shaped, soft, fleshy, and flesh colored to slightly hyperpigmented. Subcutaneous tumors are firm and nodular. Neurofibromas usually do not become apparent until puberty and may continue to increase in size and number throughout adulthood. Pregnancy also is associated with increased tumor growth.25 The tumors are comprised of Schwann cells, fibroblasts, mast cells, and perineural cells. There also is an admixture of collagen and extracellular matrix.26 The cutaneous and extracutaneous manifestations of NF1 are outlined in Table 1 and Table 2.27-31
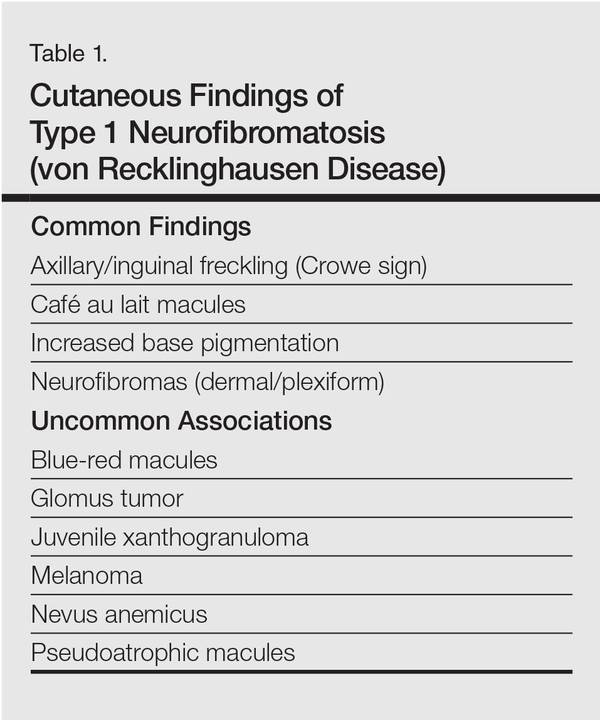
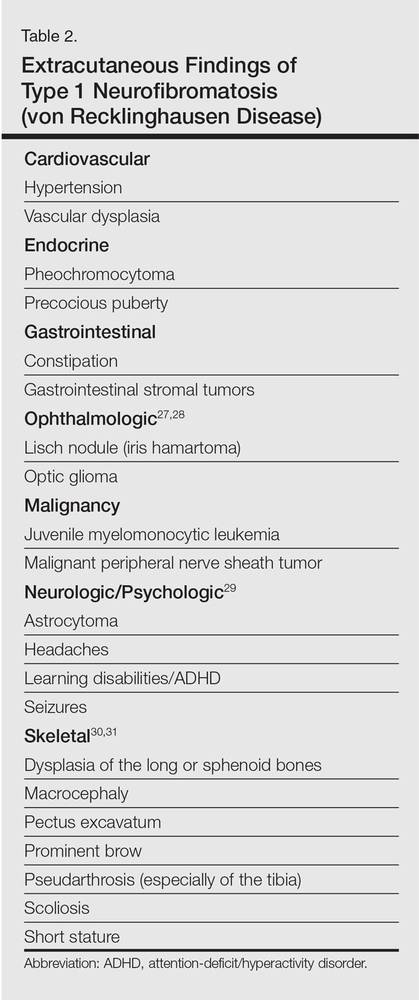
Management
Type 1 neurofibromatosis needs to be differentiated from other conditions based on careful clinical examination. Additionally, histopathologic examination of the lesions, imaging studies (eg, MRI), echocardiography, regular skeletal roentgenogram, and detailed ophthalmologic examination are important to look for any visceral involvement. Painful and bleeding tumors and cosmetic enhancement warrant surgical intervention, including various surgical techniques and lasers.32,33 Application of sunscreen may make pigmentary alterations less noticeable over time. Although not often located on the face, CALMs also may be amenable to various makeup products. Various studies have demonstrated improvement of freckling and CALMs with topical vitamin D3 analogues and lovastatin (β-hydroxy-β-methylglutaryl-CoA reductase inhibitors)34-36; however, this needs further exploration. Rapamycin has demonstrated efficacy in reducing tumor volume in animal studies by inhibiting the mammalian target of rapamycin cellular pathway.37 Imatinib mesylate has demonstrated efficacy both in vivo and in vitro in mouse models by targeting the platelet-derived growth-factor receptors α and β.38
1. Boyd KP, Korf BR, Theos A. Neurofibromatosis type 1. J Am Acad Dermatol. 2009;61:1-14.
2. von Recklinghausen FV. Ueber die multiplen Fibrome der Haut und ihre Beziehung zu den Multiplen Neuromen. Berlin, Germany: August Hirschwald; 1882.
3. Viskochil D, Buchberg AM, Xu G, et al. Deletions and a translocation interrupt a cloned gene at the neurofibromatosis type 1 locus. Cell. 1990;62:187-192.
4. Theos A, Korf BR; American College of Physicians; American Physiological Society. Pathophysiology of neurofibromatosis type 1. Ann lntern Med. 2006;144:842-849.
5. Messiaen LM, Callens T, Mortier G, et al. Exhaustive mutation analysis of the NF1 gene allows identification of 95% of mutations and reveals a high frequency of unusual splicing defects. Hum Mutat. 2000;15:541-555.
6. Ruggieri M, Huson SM. The clinical and diagnostic implications of mosaicism in the neurofibromatoses. Neurology. 2001;56:1433-1443.
7. Stocker KM, Baizer L, Coston T, et al. Regulated expression of neurofibromin in migrating neural crest cells of avian embryos. J Neurobiol. 1995;27:535-552.
8. Maertens O, De Schepper S, Vandesompele J, et al. Molecular dissection of isolated disease features in mosaic neurofibromatosis type 1. Am J Hum Genet. 2007;81:243-251.
9. De Schepper S, Maertens O, Callens T, et al. Somatic mutation analysis in NF1 café au lait spots reveals two NF1 hits in the melanocytes. J Invest Dermatol. 2008;128:1050-1053.
10. Patrakitkomjorn S, Kobayahi D, Morikawa T, et al. Neurofibromatosis type 1 (NF1) tumor suppressor, neurofibromin, regulates the neuronal differentiation of PC12 cells via its associating protein, CRMP-2 [published online ahead of print. J Biol Chem. 2008;283:9399-9413.
11. Yang FC, Ingram DA, Chen S, et al. Nf1-dependent tumors require a microenvironment containing Nf1+/− and c-kit-dependent bone marrow. Cell. 2008;135:437-448.
12. Yang FC, Chen S, Clegg T, et al. Nf1+/- mast cells induce neurofibroma like phenotypes through secreted TGF-β signaling. Hum Mol Genet. 2006;15:2421-2437.
13. Gottfried ON, Viskochil DH, Couldwell WT. Neurofibromatosis type 1 and tumorigenesis: molecular mechanisms and therapeutic implications. Neurosurg Focus. 2010;28:E8.
14. Le LQ, Parada LF. Tumor microenvironment and neurofibromatosis type I: connecting the GAPs. Oncogene. 2007;26:4609-4616.
15. Gutmann DH, Aylsworth A, Carey JC, et al. The diagnostic evaluation and multidisciplinary management of neurofibromatosis 1 and neurofibromatosis 2. JAMA. 1997;278:51-57.
16. Huson SM, Harper PS, Compston DA. Von Recklinghausen neurofibromatosis. a clinical and population study in south-east Wales. Brain. 1988;111(pt 6):1355-1381.
17. Korf BR. Diagnostic outcome in children with multiple café au lait spots. Pediatrics. 1992;90:924-927.
18. Ferner RE, Huson SM, Thomas N, et al. Guidelines for the diagnosis and management of individuals with neurofibromatosis 1. J Med Genet. 2007;44:81-88.
19. DiPaolo DP, Zimmerman RA, Rorke LB, et al. Neurofibromatosis type 1: pathologic substrate of high-signal-intensity foci in the brain. Radiology. 1995;195:721-724.
20. DeBella K, Poskitt K, Szudek J, et al. Use of “unidentified bright objects” on MRI for diagnosis of neurofibromatosis 1 in children. Neurology. 2000;54:1646-1651.
21. Whitehouse D. Diagnostic value of the café-au-lait spot in children. Arch Dis Child. 1966;41:316-319.
22. Landau M, Krafchik BR. The diagnostic value of café-au-lait macules. J Am Acad Dermatol. 1999;40(6, pt 1):877-890.
23. DeBella K, Szudek J, Friedman JM. Use of the National Institutes of Health criteria for diagnosis of neurofibromatosis 1 in children. Pediatrics. 2000;105(3, pt 1):608-614.
24. Obringer AC, Meadows AT, Zackai EH. The diagnosis of neurofibromatosis-l in the child under the age of 6 years. Am J Dis Child. 1989;143:717-719.
25. Page PZ, Page GP, Ecosse E, et al. Impact of neurofibromatosis 1 on quality of life: a cross-sectional study of 176 American cases. Am J Med Genet A. 2006;140:1893-1898.
26. Maertens O, Brems H. Vandesompele J, et al. Comprehensive NF1 screening on cultured Schwann cells from neurofibromas. Hum Mutat. 2006;27:1030-1040.
27. Huson S, Jones D, Beck L. Ophthalmic manifestations of neurofibromatosis. Br J Ophthalmol. 1987;71:235-238.
28. Listernick R, Ferner RE, Liu GT, et al. Optic pathway gliomas in neurofibromatosis-1: controversies and recommendations. Ann Neurol. 2007;61:189-198.
29. Levine TM, Materek A, Abel J, et al. Cognitive profile of neurofibromatosis type 1. Semin Pediatr Neurol. 2006;13:8-20.
30. Lammert M, Kappler M, Mautner VF, et al. Decreased bone mineral density in patients with neurofibromatosis 1. Osteoporos Int. 2005;16:1161-1166.
31. Schindeler A, Little DG. Recent insights into bone development, homeostasis, and repair in type 1 neurofibromatosis (NFl). Bone. 2008;42:616-622.
32. Yoo KH, Kim BJ, Rho YK, et al. A case of diffuse neurofibroma of the scalp. Ann Dermatol. 2009;21:46-48.
33. Onesti MG, Carella S, Spinelli G, et al. A study of 17 patients affected with plexiform neurofibromas in upper and lower extremities: comparison between different surgical techniques. Acta Chir Plast. 2009;51:35-40.
34. Yoshida Y, Sato N, Furumura M, et al. Treatment of pigmented lesions of neurofibromatosis 1 with intense pulsed-radio frequency in combination with topical application of vitamin D3 ointment. J Dermatol. 2007;34:227-230.
35. Nakayama J, Kiryu H, Urabe K, et al. Vitamin D3 analogues improve café au lait spots in patients with von Recklinghausen’s disease: experimental and clinical studies. Eur J Dermatol. 1999;9:202-206.
36. Lammert M, Friedman JM, Roth HJ, et al. Vitamin D deficiency associated with number of neurofibromas in neurofibromatosis 1. J Med Genet. 2006;43:810-813.
37. Hegedus B, Banerjee D, Yeh TH, et al. Preclinical cancer therapy in a mouse model of neurofibromatosis-1 optic glioma. Cancer Res. 2008;68:1520-1528.
38. Demestre M, Herzberg J, Holtkamp N, et al. Imatinib mesylate (Glivec) inhibits Schwann cell viability and reduces the size of human plexiform neurofibroma in a xenograft model. J Neurooncol. 2010;98:11-19.
Type 1 neurofibromatosis (NF1), or von Recklinghausen disease, is a multisystem disorder affecting approximately 1 in 3500 people in South East Wales.1 Type 1 neurofibromatosis has been described in the literature since the 13th century but was not recognized as a distinct disorder until 1882 in Friedrich Daniel von Recklinghausen’s landmark publication “On Multiple Fibromas of the Skin and Their Relationship to Multiple Neuromas.”2
Genetics
Type 1 neurofibromatosis is an autosomal-dominant disorder with a nearly even split between spontaneous and inherited mutations. It is characterized by neurofibromas, which are complex tumors composed of axonal processes, Schwann cells, fibroblasts, perineural cells, and mast cells. The NF1 gene (neurofibromin 1), discovered in 1990,3 is located on chromosome 17q11.2 and encodes for the protein neurofibromin. This large gene (60 exons and >300 kilobases of genomic DNA) has one of the highest rates of spontaneous mutations in the entire human genome.4,5 Mutations exhibited by the gene are complete deletions, insertions, and nonsense and splicing mutations. Ultimately, these mutations may result in a loss of heterozygosity of the NF1 gene (a somatic loss of the second NF1 allele). Segmental, generalized, or gonadal forms of NF1 demonstrate mosaicism.6
Pathogenesis
Neurofibromin, the NF1 gene product, is a tumor suppressor expressed in many cells, primarily in neurons, glial cells, and Schwann cells, and is seen early in melanocyte development.7 The MAPK/ERK signaling pathway is a complex series of signals and interactions involved in cell growth and proliferation.5 Under normal conditions, neurofibromin, an RAS GTPase–activating protein promotes the conversion of the active RAS-GTP bound form to an inactive RAS-GDP bound form, thereby suppressing cell growth8,9; however, other possible effects are being investigated.10 Mast cells have been implicated in contributing to inflammation in the plexiform neurofibroma microenvironment of NF1.11,12 In addition, haploinsufficiency of NF1 (NF1+/−) and c-kit signaling in the hematopoietic system have been implicated in tumor progression. Accumulation of additional mutations of multiple genes, including INK4A/ARF and the protein p53, may be responsible for malignant transformation. These revelations of molecular and cellular mechanisms involved with NF1 tumorigenesis have led to trials of targeted therapies including the mammalian target of rapamycin and tyrosine kinase inhibitor imatinib mesylate, which is demonstrating promising preclinical results for treatment of peripheral nerve sheath tumors.13,14
Diagnosis
Seven cardinal diagnostic criteria have been delineated for NF1, at least 2 of which must be met to diagnose an individual with the condition.15 These criteria include (1) six or more café au lait macules (5 mm in diameter in prepubertal patients, 15 mm in postpubertal patients); (2) axillary or inguinal freckles (>2 freckles); (3) two or more typical neurofibromas or 1 plexiform neurofibroma, (4) optic nerve glioma, (5) two or more iris hamartomas (Lisch nodules), often only identified through slit-lamp examination by an ophthalmologist; (6) sphenoid dysplasia or typical long bone abnormalities such as pseudoarthritis; and (7) first-degree relative with NF1. Diagnosis may be difficult in patients who exhibit some dermatologic features of interest but who do not fully meet the diagnostic criteria.
Skin manifestations of NF1 may present in restricted segments of the body. It has been reported that half of those with NF1 are the first in their family to have the disease.16 Children with 6 or more café au lait macules alone and no family history of neurofibromatosis should be followed up, as their chances of developing NF1 are high.17 Occasionally, Lisch nodules may be the only clinical feature. Type 1 neurofibromatosis mutation analysis may be used to confirm the diagnosis in uncertain cases as well as prenatal diagnosis. However, genetic testing is not routinely advocated, and expert consultation is advised before it is undertaken. Furthermore, biopsy of asymptomatic cutaneous neurofibromas should not be undertaken for diagnostic purposes in individuals with confirmed NF1.18
Hyperintense lesions on T2-weighted magnetic resonance imaging (MRI) of the brain (formerly known as unidentified bright objects) probably are caused by aberrant myelination or gliosis and are pathognomonic of NF1.19The presence of these lesions can assist in the diagnosis of NF1, but MRI under anesthesia is not warranted for this purpose in children, who may not be able to stay still during the test.20
Physicians should not only be able to identify the cardinal skin features of NF1 but also the less common cutaneous and extracutaneous findings, which may indicate the need for referral to a dermatologist and/or neurologist.1 Café au lait macules (CALMs) are among the salient features of NF1. Classically, these lesions are well demarcated with smooth, regular, “coast of California” borders (unlike irregular “coast of Maine” borders) and a homogeneous appearance. Although the resemblance to the color of coffee in milk has earned these lesions their name, their color can range from tan to dark brown. The presence of multiple CALMs is highly suggestive of NF1.21 The prevalence of CALMs in the general population has varied from 3% to 36% depending on the study groups selected, but the presence of multiple CALMs in the general population typically is less than 1%.22 Frequently, CALMs are the first sign of NF1, occurring in 99% of NF1 patients within the first year of life. Patients continue to develop lesions throughout childhood, but they often fade in adulthood.23
Freckling of the skin folds is the most common of the cardinal criteria for NF1. Other sites include under the neck and breasts, around the lips, and trunk. Their size ranges from 1 to 3 mm, distinguishing them from CALMs. Considered nearly pathognomonic, NF1 generally occurs in children aged 3 to 5 years in the axillae or groin.15,24
Cutaneous neurofibromas generally are cutaneous/dermal tumors that are dome shaped, soft, fleshy, and flesh colored to slightly hyperpigmented. Subcutaneous tumors are firm and nodular. Neurofibromas usually do not become apparent until puberty and may continue to increase in size and number throughout adulthood. Pregnancy also is associated with increased tumor growth.25 The tumors are comprised of Schwann cells, fibroblasts, mast cells, and perineural cells. There also is an admixture of collagen and extracellular matrix.26 The cutaneous and extracutaneous manifestations of NF1 are outlined in Table 1 and Table 2.27-31
Management
Type 1 neurofibromatosis needs to be differentiated from other conditions based on careful clinical examination. Additionally, histopathologic examination of the lesions, imaging studies (eg, MRI), echocardiography, regular skeletal roentgenogram, and detailed ophthalmologic examination are important to look for any visceral involvement. Painful and bleeding tumors and cosmetic enhancement warrant surgical intervention, including various surgical techniques and lasers.32,33 Application of sunscreen may make pigmentary alterations less noticeable over time. Although not often located on the face, CALMs also may be amenable to various makeup products. Various studies have demonstrated improvement of freckling and CALMs with topical vitamin D3 analogues and lovastatin (β-hydroxy-β-methylglutaryl-CoA reductase inhibitors)34-36; however, this needs further exploration. Rapamycin has demonstrated efficacy in reducing tumor volume in animal studies by inhibiting the mammalian target of rapamycin cellular pathway.37 Imatinib mesylate has demonstrated efficacy both in vivo and in vitro in mouse models by targeting the platelet-derived growth-factor receptors α and β.38
1. Boyd KP, Korf BR, Theos A. Neurofibromatosis type 1. J Am Acad Dermatol. 2009;61:1-14.
2. von Recklinghausen FV. Ueber die multiplen Fibrome der Haut und ihre Beziehung zu den Multiplen Neuromen. Berlin, Germany: August Hirschwald; 1882.
3. Viskochil D, Buchberg AM, Xu G, et al. Deletions and a translocation interrupt a cloned gene at the neurofibromatosis type 1 locus. Cell. 1990;62:187-192.
4. Theos A, Korf BR; American College of Physicians; American Physiological Society. Pathophysiology of neurofibromatosis type 1. Ann lntern Med. 2006;144:842-849.
5. Messiaen LM, Callens T, Mortier G, et al. Exhaustive mutation analysis of the NF1 gene allows identification of 95% of mutations and reveals a high frequency of unusual splicing defects. Hum Mutat. 2000;15:541-555.
6. Ruggieri M, Huson SM. The clinical and diagnostic implications of mosaicism in the neurofibromatoses. Neurology. 2001;56:1433-1443.
7. Stocker KM, Baizer L, Coston T, et al. Regulated expression of neurofibromin in migrating neural crest cells of avian embryos. J Neurobiol. 1995;27:535-552.
8. Maertens O, De Schepper S, Vandesompele J, et al. Molecular dissection of isolated disease features in mosaic neurofibromatosis type 1. Am J Hum Genet. 2007;81:243-251.
9. De Schepper S, Maertens O, Callens T, et al. Somatic mutation analysis in NF1 café au lait spots reveals two NF1 hits in the melanocytes. J Invest Dermatol. 2008;128:1050-1053.
10. Patrakitkomjorn S, Kobayahi D, Morikawa T, et al. Neurofibromatosis type 1 (NF1) tumor suppressor, neurofibromin, regulates the neuronal differentiation of PC12 cells via its associating protein, CRMP-2 [published online ahead of print. J Biol Chem. 2008;283:9399-9413.
11. Yang FC, Ingram DA, Chen S, et al. Nf1-dependent tumors require a microenvironment containing Nf1+/− and c-kit-dependent bone marrow. Cell. 2008;135:437-448.
12. Yang FC, Chen S, Clegg T, et al. Nf1+/- mast cells induce neurofibroma like phenotypes through secreted TGF-β signaling. Hum Mol Genet. 2006;15:2421-2437.
13. Gottfried ON, Viskochil DH, Couldwell WT. Neurofibromatosis type 1 and tumorigenesis: molecular mechanisms and therapeutic implications. Neurosurg Focus. 2010;28:E8.
14. Le LQ, Parada LF. Tumor microenvironment and neurofibromatosis type I: connecting the GAPs. Oncogene. 2007;26:4609-4616.
15. Gutmann DH, Aylsworth A, Carey JC, et al. The diagnostic evaluation and multidisciplinary management of neurofibromatosis 1 and neurofibromatosis 2. JAMA. 1997;278:51-57.
16. Huson SM, Harper PS, Compston DA. Von Recklinghausen neurofibromatosis. a clinical and population study in south-east Wales. Brain. 1988;111(pt 6):1355-1381.
17. Korf BR. Diagnostic outcome in children with multiple café au lait spots. Pediatrics. 1992;90:924-927.
18. Ferner RE, Huson SM, Thomas N, et al. Guidelines for the diagnosis and management of individuals with neurofibromatosis 1. J Med Genet. 2007;44:81-88.
19. DiPaolo DP, Zimmerman RA, Rorke LB, et al. Neurofibromatosis type 1: pathologic substrate of high-signal-intensity foci in the brain. Radiology. 1995;195:721-724.
20. DeBella K, Poskitt K, Szudek J, et al. Use of “unidentified bright objects” on MRI for diagnosis of neurofibromatosis 1 in children. Neurology. 2000;54:1646-1651.
21. Whitehouse D. Diagnostic value of the café-au-lait spot in children. Arch Dis Child. 1966;41:316-319.
22. Landau M, Krafchik BR. The diagnostic value of café-au-lait macules. J Am Acad Dermatol. 1999;40(6, pt 1):877-890.
23. DeBella K, Szudek J, Friedman JM. Use of the National Institutes of Health criteria for diagnosis of neurofibromatosis 1 in children. Pediatrics. 2000;105(3, pt 1):608-614.
24. Obringer AC, Meadows AT, Zackai EH. The diagnosis of neurofibromatosis-l in the child under the age of 6 years. Am J Dis Child. 1989;143:717-719.
25. Page PZ, Page GP, Ecosse E, et al. Impact of neurofibromatosis 1 on quality of life: a cross-sectional study of 176 American cases. Am J Med Genet A. 2006;140:1893-1898.
26. Maertens O, Brems H. Vandesompele J, et al. Comprehensive NF1 screening on cultured Schwann cells from neurofibromas. Hum Mutat. 2006;27:1030-1040.
27. Huson S, Jones D, Beck L. Ophthalmic manifestations of neurofibromatosis. Br J Ophthalmol. 1987;71:235-238.
28. Listernick R, Ferner RE, Liu GT, et al. Optic pathway gliomas in neurofibromatosis-1: controversies and recommendations. Ann Neurol. 2007;61:189-198.
29. Levine TM, Materek A, Abel J, et al. Cognitive profile of neurofibromatosis type 1. Semin Pediatr Neurol. 2006;13:8-20.
30. Lammert M, Kappler M, Mautner VF, et al. Decreased bone mineral density in patients with neurofibromatosis 1. Osteoporos Int. 2005;16:1161-1166.
31. Schindeler A, Little DG. Recent insights into bone development, homeostasis, and repair in type 1 neurofibromatosis (NFl). Bone. 2008;42:616-622.
32. Yoo KH, Kim BJ, Rho YK, et al. A case of diffuse neurofibroma of the scalp. Ann Dermatol. 2009;21:46-48.
33. Onesti MG, Carella S, Spinelli G, et al. A study of 17 patients affected with plexiform neurofibromas in upper and lower extremities: comparison between different surgical techniques. Acta Chir Plast. 2009;51:35-40.
34. Yoshida Y, Sato N, Furumura M, et al. Treatment of pigmented lesions of neurofibromatosis 1 with intense pulsed-radio frequency in combination with topical application of vitamin D3 ointment. J Dermatol. 2007;34:227-230.
35. Nakayama J, Kiryu H, Urabe K, et al. Vitamin D3 analogues improve café au lait spots in patients with von Recklinghausen’s disease: experimental and clinical studies. Eur J Dermatol. 1999;9:202-206.
36. Lammert M, Friedman JM, Roth HJ, et al. Vitamin D deficiency associated with number of neurofibromas in neurofibromatosis 1. J Med Genet. 2006;43:810-813.
37. Hegedus B, Banerjee D, Yeh TH, et al. Preclinical cancer therapy in a mouse model of neurofibromatosis-1 optic glioma. Cancer Res. 2008;68:1520-1528.
38. Demestre M, Herzberg J, Holtkamp N, et al. Imatinib mesylate (Glivec) inhibits Schwann cell viability and reduces the size of human plexiform neurofibroma in a xenograft model. J Neurooncol. 2010;98:11-19.
Practice Points
- Histopathology and magnetic resonance imaging are useful in diagnosing type 1 neurofibromatosis (NF1).
- Newer treatments like statins and tyrosine kinase inhibitors are worth exploring in NF1.
Get smart about dense breasts
It’s a movement that shows no signs of abating. Women in 24 states, encompassing 67% of American women, now receive some level of notification after their mammogram about breast density. Individual patient advocates continue to push for notification, and states are likely to continue to draft bills. On the national level, a federal standard is being pursued through both federal legislation and federal regulation. Clinicians practicing in states with an “inform” law, either already in effect or imminent, will be tasked with engaging in new patient conversations arising from density notification. Are you ready to answer your patients’ questions?
Navigating inconsistent data and expert comments about density and discerning which patients may benefit from additional screening can create challenges in addressing a patient’s questions about the implications of her dense tissue. If you feel less than equipped to address these issues, you are not alone. A recent survey of clinicians, con- ducted after California’s breast density notification law went into effect, showed that only 6% were comfortable answering patients’ questions relating to breast density. Seventy-five percent of respondents indicated they wanted more education on the topic.1
For women having mammography, dense breast tissue is most important because it can mask detection of cancers, and women may want to have additional screening beyond mammography. Women with dense breasts are also at increased risk for developing breast cancer. For clinicians who are on the front lines of care for women undergoing screening, the most important action items are:
- identifying who needs more screening
- weighing the risks and benefits of such additional screening.
To assist you in informing patient discussions, in this article we answer some of the most frequently asked questions of ObGyns.
Which breasts are considered dense?
The American College of Radiology recommends that density be reported in 1 of 4 categories depending on the relative amounts of fat and fibroglandular tissue2:
- almost entirely fatty—on mammography most of the tissue appears dark gray while small amounts of dense (or fibroglandular) tissue display as light gray or white.
- scattered fibroglandular density—scattered areas of dense tissue mixed with fat. Even in breasts with scattered areas of breast tissue, cancers sometimes can be missed when they resemble areas of normal tissue or are within an area of denser tissue.
- heterogeneously dense—there are large portions of the breast where dense tissue could hide masses.
- extremely dense—most of the breast appears to consist of dense tissue, creating a “white out” situation and making it extremely difficult to see through.
Breasts that are either heterogeneously dense or extremely dense are considered “dense.” About 40% of women older than age 40 have dense breasts.3
Case study: Imaging of a cancerous breast mass in a 48-year-old woman with dense breasts
This patient has heterogeneously dense breast tissue. Standard 2D mediolateral oblique (MLO) digital mammogram (A) and MLO tomosynthesis 1-mm slice (B) reveal subtle possible distortion (arrow) in the upper right breast. On tomosynthesis, the distortion is better seen, as is the underlying irregular mass (red circle).
Ultrasound (US) directed to the mass (C) shows an irregular hypoechoic (dark gray) mass (marked by calipers), compatible with cancer. US-guided core needle biopsy revealed grade 2 invasive ductal cancer with associated ductal carcinoma in situ.
Axial magnetic resonance imaging of the right breast obtained after contrast injection, and after computer subtraction of nonenhanced image (D), shows irregular spiculated enhancing (white) mass (arrow) due to the known carcinoma.
Images: Courtesy Wendie Berg, MD, PhD
Who needs more screening?
The FIGURE is a screening decision support tool representing the consensus opinion of several medical experts based on the best available scientific evidence to optimize breast cancer detection.
Do dense breasts affect the risk of developing breast cancer?
Yes. Dense breasts are a risk factor for breast cancer. According to the American Cancer Society’s Breast Cancer Facts & Figures 2013−2014, “The risk of breast cancer in-creases with increasing breast density; women with very high breast density have a 4- to 6-fold increased risk of breast cancer compared to women with the least dense breasts.”4,5
There are several reasons that dense tissue increases risk. First, the glands tend to be made up of relatively actively dividing cells that can mutate and become cancerous (the more glandular tissue present, the greater the risk). Second, the local environment around the glands may produce certain growth hormones that stimulate cells to divide, and this seems to occur more in fibrous tissue than in fatty tissue.
Most women have breast density somewhere in the middle range, with their risk for breast cancer falling in between those with extremely dense breasts and those with fatty breasts.6 The risk for developing breast cancer is influenced by a combination of many different factors, including age, family history of cancer (particularly breast or ovarian cancer), and prior atypical breast biopsies. There currently is no reliable way to fully account for the interplay of breast density, family history, prior biopsy results, and other factors in determining overall risk. Importantly, more than half of all women who develop breast cancer have no known risk factors other than being female and aging.
Is your medical support staff “density ready?”
We’re all familiar with the adage that a picture is worth a thousand words. While the medical support personnel in your office are likely quite familiar with imaging reports and the terminology used in describing dense breasts, they may be quite unfamiliar with what a fatty versus dense breast actually looks like on a mammogram, and how cancer may display in each. Illustrated examples, as seen here, are useful for reference.
In the fatty breast (A), a small cancer (arrow) is seen easily. In a breast categorized as scattered fibroglandular density (B), a large cancer is easily seen (arrow) in the relatively fatty portion of the breast, though a small cancer could have been hidden in areas with normal glandular tissue.
In a breast categorized as heterogeneously dense (C), a 4-cm (about 1.5-inch) cancer (arrows) is hidden by the dense breast tissue. This cancer also has spread to a lymph node under the arm (curved arrow).
In an extremely dense breast (D), a cancer is seen because part of it is located in the back of the breast where there is a small amount of dark fat making it easier to see (arrow and triangle marker indicating lump). If this cancer had been located near the nipple and completely surrounded by white (dense) tissue, it probably would not have been seen on mammography.
Image: Courtesy of Dr. Regina Hooley and DenseBreast-info.org
Are screening mammography outcomes different for women with dense versus fatty breasts?
Yes. Cancer is more likely to be clinically detected in the interval between mammography screens (defined as interval cancer) in women with dense breasts. Such interval cancers tend to be more aggressive and have worse outcomes. Compared with those in fatty breasts, cancers found in dense breasts more often7:
- are locally advanced (stage IIb and III)
- are multifocal or multicentric
- require a mastectomy (rather than a lumpectomy).
Does supplemental screening beyond mammography save lives?
Mammography is the only imaging screening modality that has been studied by multiple randomized controlled trials with mortality as an endpoint. Across those trials, mammography has been shown to reduce deaths due to breast cancer. The randomized trials that show a benefit from mammography are those in which mammography increased detection of invasive breast cancers before they spread to lymph nodes.8
No randomized controlled trial has yet been reported on any other imaging screening modality, but it is expected that other screening tests that increase detection of node-negative invasive breast cancers beyond mammography should further reduce breast cancer mortality.
Proving the mortality benefit of any supplemental screening modality would require a very large, very expensive randomized controlled trial with 15 to 20 years of follow-up. Given the speed of technologic developments, any results likely would be obsolete by the trial’s conclusion. What we do know is that women at high risk for breast cancer who undergo annual magnetic resonance imaging (MRI) screening are less likely to have advanced breast cancer than their counterparts who were not screened with MRI.9
We also know that average-risk women who are screened with ultrasonography in addition to mammography are unlikely to have palpable cancer in the interval between screens,10,11 with the rates of such interval cancers similar to women with fatty breasts screened only with mammography. The cancers found only on MRI or ultrasound are mostly small invasive cancers (average size, approximately 1 cm) that are mostly node negative.12,13 MRI also finds some ductal carcinoma in situ (DCIS).
These results suggest that there is a benefit to finding additional cancers with supplemental screening, though it is certainly possible that, as with mammography, some of the cancers found with supplemental screening are slow growing and may never have caused a woman harm even if left untreated.
Dense breasts: Medically sourced resources
Educational Web site
DenseBreast-info.org. This site is a collaborative, multidisciplinary educational resource. It features content for both patients and health care providers with separate data streams for each and includes:
a comprehensive list of FAQs; screening flow charts; a Patient Risk Checklist; an explanation of risks, risk assessment, and links to risk assessment tools; an illustrated round-up of technologies commonly used in screening; and state-by-state legislative analysis of density inform laws across the country.
State-specific Web sites
BreastDensity.info. This site was created by the California Breast Density Information Group (CBDIG), a working group of breast radiologists and breast cancer risk specialists. The content is primarily for health care providers and features screening scenarios as well as FAQs about breast density, breast cancer risk, and the breast density notification law in California.
MIdensebreasts.org. This is a Web-based education resource created for primary care providers by the University of Michigan Health System and the Michigan Department of Health and Human Services. It includes continuing medical education credit.
Medical society materials
American Cancer Society offers Breast Density and Your Mammogram Report for patients: http://www.cancer.org/acs/groups/content/@editorial/documents/document/acspc-039989.pdf
American College of Obstetricians and Gynecologists’ 2015 Density Policy statement is available online: http://www.acog.org/Resources-And-Publications/Committee-Opinions/Committee-on-Gynecologic-Practice/Management-of-Women-With-Dense-Breasts-Diagnosed-by-Mammography
American College of Radiology patient brochure details basic information about breast density and can be customized with your center’s information: http://www.acr.org/News-Publications/~/media/180321AF51AF4EA38FEC091461F5B695.pdf
What additional screening tests are available after a 2D mammogram for a woman with dense breasts?
Depending on the patient’s age, risk level, and breast density, additional screening tools—such as tomosynthesis (also known as 3D mammography), ultrasonography, or MRI—may be recommended in addition to mammography. Indeed, in some centers, tomosynthesis is performed alone and the radiologist also reviews computer-generated 2D mammograms.
The addition of another imaging tool after a mammogram will find more cancers than mammography alone (TABLE).14−17 Women at high risk for breast cancer, such as those with pathogenic BRCA mutations, and those who were treated with radiation therapy to their chest (typically for Hodgkin disease) before age 30 and at least 8 years earlier, should be referred for annual MRI in addition to mammography (see Screening Decision Support Tool FIGURE above). If tomosynthesis is performed, the added benefit of ultrasound will be lower; further study on the actual benefit of supplemental ultrasound screening after 3D mammography is needed.
Will insurance cover supplemental screening beyond mammography?
The answer depends on the type of screening, the patient’s insurance and risk factors, the state in which you practice, and whether or not a law is in effect requiring insurance coverage for additional screening. In Illinois, for example, a woman with dense breasts can receive a screening ultrasound without a copay or deductible if it is ordered by a physician. In Connecticut, an ultrasound copay for screening dense breasts cannot exceed $20. Generally, in other states, an ultrasound will be covered if ordered by a physician, but it is subject to the copay and deductible of an individual health plan. In New Jersey, insurance coverage is provided for additional testing if a woman has extremely dense breasts.
Regardless of state, an MRI generally will be covered by insurance (subject to copay and deductible) if the patient meets high-risk criteria. In Michigan, at least one insurance company will cover a screening MRI for normal-risk women with dense breasts at a cost that matches the copay and deductible of a screening mammogram. It is important for patients to check with their insurance carrier prior to having an MRI.
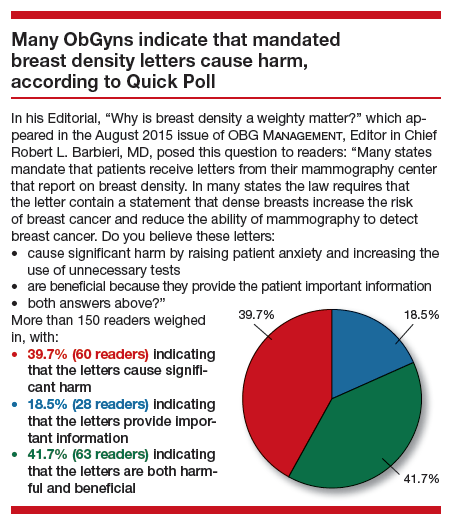
Should women with dense breasts still have mammography screening?
Yes. Mammography is the first step in screening for most women (except for those who are pregnant or breastfeeding, in which case ultrasound can be performed but is usually deferred until several months after the patient is no longer pregnant or breastfeeding). While additional screening may be recommended for women with dense breasts, and for women at high risk for developing breast cancer, there are still some cancers and precancerous changes that will show on a mammogram better than on ultrasound or MRI. Wherever possible, women with dense breasts should have digital mammography rather than film mammography, due to slightly improved cancer detection using digital mammography.18
Does tomosynthesis solve the problem of screening dense breasts?
Tomosynthesis (3D mammography) slightly improves detection of cancers compared with standard digital mammography, but some cancers will remain hidden by overlapping dense tissue. We do not yet know the benefit of annual screening tomosynthesis. Without question, women at high risk for breast cancer still should have MRI if they are able to tolerate it, even if they have had tomosynthesis.
If a patient with dense breasts undergoes screening tomosynthesis, will she also need a screening ultrasound?
Preliminary studies not yet published suggest that, for women with dense breasts, ultrasound does find another 2 to 3 invasive cancers per 1,000 women screened that are not found on tomosynthesis, but further study of this issue is needed.
If recommended for additional screening with ultrasound or MRI, will a patient need that screening every year?
Usually, yes, though age and other medical conditions will change a patient’s personal risk and benefit considerations. Therefore, screening recommendations may change from one year to the next. With technology advancements and evolving guidelines, additional screening recommendations will change in the future.
Prepare yourself and your patients will benefit
The foundation of a successful screening program involves buy-in from both patient and clinician. Patients confused as to what their density notification means may have little understanding as to what next steps should be considered. To allay confusion, your patient will be best served by being provided understandable and actionable information. Advanced preparation for these conversations about the implications of dense tissue will make for more effective patient engagement.
Acknowledgment
Much of the material within this article has been sourced from the educational Web site DenseBreast-info.org. For comprehensive lists of both patient and health care provider frequently asked questions, visit http://www.DenseBreast-info.org.
Share your thoughts! Send your Letter to the Editor to [email protected]. Please include your name and the city and state in which you practice.
- Khong KA, Hargreaves J, Aminololama-Shakeri S, Lindfors KK. Impact of the California breast density law on primary care physicians. J Am Coll Radiol. 2015;12(3):256–260.
- Sickles EA, D’Orsi CJ, Bassett LW, et al. ACR BI-RADS Mammography. In: ACR BI-RADS Atlas, Breast Imaging Reporting and Data System. Reston, VA: American College of Radiology; 2013.
- Sprague BL, Gangnon RE, Burt V, et al. Prevalence of mammographically dense breasts in the United States. J Natl Cancer Inst. 2014;106(10).
- American Cancer Society. Breast Cancer Facts & Figures 2013–2014. http://www.cancer.org/acs/groups/content/@research/documents/document/acspc-042725.pdf. Published 2013. Accessed September 15, 2015.
- Harvey JA, Bovbjerg VE. Quantitative assessment of mammographic breast density: relationship with breast cancer risk. Radiology. 2004;230(1):29–41.
- Kerlikowske K, Cook AJ, Buist DS, et al. Breast cancer risk by breast density, menopause, and postmenopausal hormone therapy use. J Clin Oncol. 2010;28(24):3830–3837.
- Arora N, King TA, Jacks LM, et al. Impact of breast density on the presenting features of malignancy. Ann Surg Oncol. 2010;17(suppl 3):211–218.
- Smith RA, Duffy SW, Gabe R, Tabar L, Yen AM, Chen TH. The randomized trials of breast cancer screening: what have we learned? Radiol Clin North Am. 2004;42(5):793–806, v.
- Warner E, Hill K, Causer P, et al. Prospective study of breast cancer incidence in women with a BRCA1 or BRCA2 mutation under surveillance with and without magnetic resonance imaging. J Clin Oncol. 2011;29(13):1664–1669.
- Corsetti V, Houssami N, Ghirardi M, et al. Evidence of the effect of adjunct ultrasound screening in women with mammography-negative dense breasts: interval breast cancers at 1 year follow-up. Eur J Cancer. 2011;47(7): 1021–1026.
- Berg WA, Zhang Z, Lehrer D, et al. Detection of breast cancer with addition of annual screening ultrasound or a single screening MRI to mammography in women with elevated breast cancer risk. JAMA. 2012;307(13):1394–1404.
- Berg WA. Tailored supplemental screening for breast cancer: what now and what next? AJR Am J Roentgenol. 2009;192(2):390–399.
- Brem RF, Lenihan MJ, Lieberman J, Torrente J. Screening breast ultrasound: past, present, and future. AJR Am J Roentgenol. 2015;204(2):234–240.
- Hooley R. Tomosynthesis. In: Berg WA, Yang WT, eds. Diagnostic Imaging: Breast. 2nd ed. Salt Lake City, UT: Amirsys; 2014:2–19.
- Friedewald SM, Rafferty EA, Rose SL, et al. Breast cancer screening using tomosynthesis in combination with digital mammography. JAMA. 2014;311(24):2499–2507.
- Berg WA. Screening Ultrasound. In: Berg WA, Yang WT, eds. Diagnostic Imaging: Breast. 2nd ed. Salt Lake City, UT: Amirsys; 2014:9–43.
- Berg WA. Screening MRI. In: Berg WA, Yang WT, eds. Diagnostic Imaging: Breast. 2nd ed. Salt Lake City, UT: Amirsys; 2014:9–49.
- Hooley R. Tomosynthesis. In: Berg WA, Yang WT, eds.Berg WA. Screening Ultrasound. In: Berg WA, Yang WT, eds.Berg WA. Screening MRI. In: Berg WA, Yang WT, eds.Pisano ED, Gatsonis C, Hendrick E, et al. Diagnostic performance of digital versus film mammography for breast-cancer screening. N Engl J Med. 2005;353(17):1773–1783.
Wendie A. Berg, MD, PhD; JoAnn Pushkin; and Cindy Henke-Sarmento

Dr. Berg is Professor of Radiology, University of Pittsburgh School of Medicine, Magee-Womens Hospital of UPMC, Pittsburgh, Pennsylvania, and Chief Scientific Advisor, DenseBreast-info.org.

Ms. Pushkin is Executive Director, DenseBreast-info, Inc.

Ms. Henke-Sarmento is Technology Director, DenseBreast-info, Inc.
Ms. Pushkin and Ms. Henke-Sarmento report that the 501(c)(3) nonprofit, DenseBreast-info, Inc., which supports the Web site DenseBreast-info.org, has received unrestricted educational grants from GE Healthcare and Volpara Solutions Ltd. Dr. Berg reports no financial relationships relevant to this article.
Wendie A. Berg, MD, PhD; JoAnn Pushkin; and Cindy Henke-Sarmento
Dr. Berg is Professor of Radiology, University of Pittsburgh School of Medicine, Magee-Womens Hospital of UPMC, Pittsburgh, Pennsylvania, and Chief Scientific Advisor, DenseBreast-info.org.
Ms. Pushkin is Executive Director, DenseBreast-info, Inc.
Ms. Henke-Sarmento is Technology Director, DenseBreast-info, Inc.
Ms. Pushkin and Ms. Henke-Sarmento report that the 501(c)(3) nonprofit, DenseBreast-info, Inc., which supports the Web site DenseBreast-info.org, has received unrestricted educational grants from GE Healthcare and Volpara Solutions Ltd. Dr. Berg reports no financial relationships relevant to this article.
It’s a movement that shows no signs of abating. Women in 24 states, encompassing 67% of American women, now receive some level of notification after their mammogram about breast density. Individual patient advocates continue to push for notification, and states are likely to continue to draft bills. On the national level, a federal standard is being pursued through both federal legislation and federal regulation. Clinicians practicing in states with an “inform” law, either already in effect or imminent, will be tasked with engaging in new patient conversations arising from density notification. Are you ready to answer your patients’ questions?
Navigating inconsistent data and expert comments about density and discerning which patients may benefit from additional screening can create challenges in addressing a patient’s questions about the implications of her dense tissue. If you feel less than equipped to address these issues, you are not alone. A recent survey of clinicians, con- ducted after California’s breast density notification law went into effect, showed that only 6% were comfortable answering patients’ questions relating to breast density. Seventy-five percent of respondents indicated they wanted more education on the topic.1
For women having mammography, dense breast tissue is most important because it can mask detection of cancers, and women may want to have additional screening beyond mammography. Women with dense breasts are also at increased risk for developing breast cancer. For clinicians who are on the front lines of care for women undergoing screening, the most important action items are:
- identifying who needs more screening
- weighing the risks and benefits of such additional screening.
To assist you in informing patient discussions, in this article we answer some of the most frequently asked questions of ObGyns.
Which breasts are considered dense?
The American College of Radiology recommends that density be reported in 1 of 4 categories depending on the relative amounts of fat and fibroglandular tissue2:
- almost entirely fatty—on mammography most of the tissue appears dark gray while small amounts of dense (or fibroglandular) tissue display as light gray or white.
- scattered fibroglandular density—scattered areas of dense tissue mixed with fat. Even in breasts with scattered areas of breast tissue, cancers sometimes can be missed when they resemble areas of normal tissue or are within an area of denser tissue.
- heterogeneously dense—there are large portions of the breast where dense tissue could hide masses.
- extremely dense—most of the breast appears to consist of dense tissue, creating a “white out” situation and making it extremely difficult to see through.
Breasts that are either heterogeneously dense or extremely dense are considered “dense.” About 40% of women older than age 40 have dense breasts.3
Case study: Imaging of a cancerous breast mass in a 48-year-old woman with dense breasts
This patient has heterogeneously dense breast tissue. Standard 2D mediolateral oblique (MLO) digital mammogram (A) and MLO tomosynthesis 1-mm slice (B) reveal subtle possible distortion (arrow) in the upper right breast. On tomosynthesis, the distortion is better seen, as is the underlying irregular mass (red circle).
Ultrasound (US) directed to the mass (C) shows an irregular hypoechoic (dark gray) mass (marked by calipers), compatible with cancer. US-guided core needle biopsy revealed grade 2 invasive ductal cancer with associated ductal carcinoma in situ.
Axial magnetic resonance imaging of the right breast obtained after contrast injection, and after computer subtraction of nonenhanced image (D), shows irregular spiculated enhancing (white) mass (arrow) due to the known carcinoma.
Images: Courtesy Wendie Berg, MD, PhD
Who needs more screening?
The FIGURE is a screening decision support tool representing the consensus opinion of several medical experts based on the best available scientific evidence to optimize breast cancer detection.
Do dense breasts affect the risk of developing breast cancer?
Yes. Dense breasts are a risk factor for breast cancer. According to the American Cancer Society’s Breast Cancer Facts & Figures 2013−2014, “The risk of breast cancer in-creases with increasing breast density; women with very high breast density have a 4- to 6-fold increased risk of breast cancer compared to women with the least dense breasts.”4,5
There are several reasons that dense tissue increases risk. First, the glands tend to be made up of relatively actively dividing cells that can mutate and become cancerous (the more glandular tissue present, the greater the risk). Second, the local environment around the glands may produce certain growth hormones that stimulate cells to divide, and this seems to occur more in fibrous tissue than in fatty tissue.
Most women have breast density somewhere in the middle range, with their risk for breast cancer falling in between those with extremely dense breasts and those with fatty breasts.6 The risk for developing breast cancer is influenced by a combination of many different factors, including age, family history of cancer (particularly breast or ovarian cancer), and prior atypical breast biopsies. There currently is no reliable way to fully account for the interplay of breast density, family history, prior biopsy results, and other factors in determining overall risk. Importantly, more than half of all women who develop breast cancer have no known risk factors other than being female and aging.
Is your medical support staff “density ready?”
We’re all familiar with the adage that a picture is worth a thousand words. While the medical support personnel in your office are likely quite familiar with imaging reports and the terminology used in describing dense breasts, they may be quite unfamiliar with what a fatty versus dense breast actually looks like on a mammogram, and how cancer may display in each. Illustrated examples, as seen here, are useful for reference.
In the fatty breast (A), a small cancer (arrow) is seen easily. In a breast categorized as scattered fibroglandular density (B), a large cancer is easily seen (arrow) in the relatively fatty portion of the breast, though a small cancer could have been hidden in areas with normal glandular tissue.
In a breast categorized as heterogeneously dense (C), a 4-cm (about 1.5-inch) cancer (arrows) is hidden by the dense breast tissue. This cancer also has spread to a lymph node under the arm (curved arrow).
In an extremely dense breast (D), a cancer is seen because part of it is located in the back of the breast where there is a small amount of dark fat making it easier to see (arrow and triangle marker indicating lump). If this cancer had been located near the nipple and completely surrounded by white (dense) tissue, it probably would not have been seen on mammography.
Image: Courtesy of Dr. Regina Hooley and DenseBreast-info.org
Are screening mammography outcomes different for women with dense versus fatty breasts?
Yes. Cancer is more likely to be clinically detected in the interval between mammography screens (defined as interval cancer) in women with dense breasts. Such interval cancers tend to be more aggressive and have worse outcomes. Compared with those in fatty breasts, cancers found in dense breasts more often7:
- are locally advanced (stage IIb and III)
- are multifocal or multicentric
- require a mastectomy (rather than a lumpectomy).
Does supplemental screening beyond mammography save lives?
Mammography is the only imaging screening modality that has been studied by multiple randomized controlled trials with mortality as an endpoint. Across those trials, mammography has been shown to reduce deaths due to breast cancer. The randomized trials that show a benefit from mammography are those in which mammography increased detection of invasive breast cancers before they spread to lymph nodes.8
No randomized controlled trial has yet been reported on any other imaging screening modality, but it is expected that other screening tests that increase detection of node-negative invasive breast cancers beyond mammography should further reduce breast cancer mortality.
Proving the mortality benefit of any supplemental screening modality would require a very large, very expensive randomized controlled trial with 15 to 20 years of follow-up. Given the speed of technologic developments, any results likely would be obsolete by the trial’s conclusion. What we do know is that women at high risk for breast cancer who undergo annual magnetic resonance imaging (MRI) screening are less likely to have advanced breast cancer than their counterparts who were not screened with MRI.9
We also know that average-risk women who are screened with ultrasonography in addition to mammography are unlikely to have palpable cancer in the interval between screens,10,11 with the rates of such interval cancers similar to women with fatty breasts screened only with mammography. The cancers found only on MRI or ultrasound are mostly small invasive cancers (average size, approximately 1 cm) that are mostly node negative.12,13 MRI also finds some ductal carcinoma in situ (DCIS).
These results suggest that there is a benefit to finding additional cancers with supplemental screening, though it is certainly possible that, as with mammography, some of the cancers found with supplemental screening are slow growing and may never have caused a woman harm even if left untreated.
Dense breasts: Medically sourced resources
Educational Web site
DenseBreast-info.org. This site is a collaborative, multidisciplinary educational resource. It features content for both patients and health care providers with separate data streams for each and includes:
a comprehensive list of FAQs; screening flow charts; a Patient Risk Checklist; an explanation of risks, risk assessment, and links to risk assessment tools; an illustrated round-up of technologies commonly used in screening; and state-by-state legislative analysis of density inform laws across the country.
State-specific Web sites
BreastDensity.info. This site was created by the California Breast Density Information Group (CBDIG), a working group of breast radiologists and breast cancer risk specialists. The content is primarily for health care providers and features screening scenarios as well as FAQs about breast density, breast cancer risk, and the breast density notification law in California.
MIdensebreasts.org. This is a Web-based education resource created for primary care providers by the University of Michigan Health System and the Michigan Department of Health and Human Services. It includes continuing medical education credit.
Medical society materials
American Cancer Society offers Breast Density and Your Mammogram Report for patients: http://www.cancer.org/acs/groups/content/@editorial/documents/document/acspc-039989.pdf
American College of Obstetricians and Gynecologists’ 2015 Density Policy statement is available online: http://www.acog.org/Resources-And-Publications/Committee-Opinions/Committee-on-Gynecologic-Practice/Management-of-Women-With-Dense-Breasts-Diagnosed-by-Mammography
American College of Radiology patient brochure details basic information about breast density and can be customized with your center’s information: http://www.acr.org/News-Publications/~/media/180321AF51AF4EA38FEC091461F5B695.pdf
What additional screening tests are available after a 2D mammogram for a woman with dense breasts?
Depending on the patient’s age, risk level, and breast density, additional screening tools—such as tomosynthesis (also known as 3D mammography), ultrasonography, or MRI—may be recommended in addition to mammography. Indeed, in some centers, tomosynthesis is performed alone and the radiologist also reviews computer-generated 2D mammograms.
The addition of another imaging tool after a mammogram will find more cancers than mammography alone (TABLE).14−17 Women at high risk for breast cancer, such as those with pathogenic BRCA mutations, and those who were treated with radiation therapy to their chest (typically for Hodgkin disease) before age 30 and at least 8 years earlier, should be referred for annual MRI in addition to mammography (see Screening Decision Support Tool FIGURE above). If tomosynthesis is performed, the added benefit of ultrasound will be lower; further study on the actual benefit of supplemental ultrasound screening after 3D mammography is needed.
Will insurance cover supplemental screening beyond mammography?
The answer depends on the type of screening, the patient’s insurance and risk factors, the state in which you practice, and whether or not a law is in effect requiring insurance coverage for additional screening. In Illinois, for example, a woman with dense breasts can receive a screening ultrasound without a copay or deductible if it is ordered by a physician. In Connecticut, an ultrasound copay for screening dense breasts cannot exceed $20. Generally, in other states, an ultrasound will be covered if ordered by a physician, but it is subject to the copay and deductible of an individual health plan. In New Jersey, insurance coverage is provided for additional testing if a woman has extremely dense breasts.
Regardless of state, an MRI generally will be covered by insurance (subject to copay and deductible) if the patient meets high-risk criteria. In Michigan, at least one insurance company will cover a screening MRI for normal-risk women with dense breasts at a cost that matches the copay and deductible of a screening mammogram. It is important for patients to check with their insurance carrier prior to having an MRI.
Should women with dense breasts still have mammography screening?
Yes. Mammography is the first step in screening for most women (except for those who are pregnant or breastfeeding, in which case ultrasound can be performed but is usually deferred until several months after the patient is no longer pregnant or breastfeeding). While additional screening may be recommended for women with dense breasts, and for women at high risk for developing breast cancer, there are still some cancers and precancerous changes that will show on a mammogram better than on ultrasound or MRI. Wherever possible, women with dense breasts should have digital mammography rather than film mammography, due to slightly improved cancer detection using digital mammography.18
Does tomosynthesis solve the problem of screening dense breasts?
Tomosynthesis (3D mammography) slightly improves detection of cancers compared with standard digital mammography, but some cancers will remain hidden by overlapping dense tissue. We do not yet know the benefit of annual screening tomosynthesis. Without question, women at high risk for breast cancer still should have MRI if they are able to tolerate it, even if they have had tomosynthesis.
If a patient with dense breasts undergoes screening tomosynthesis, will she also need a screening ultrasound?
Preliminary studies not yet published suggest that, for women with dense breasts, ultrasound does find another 2 to 3 invasive cancers per 1,000 women screened that are not found on tomosynthesis, but further study of this issue is needed.
If recommended for additional screening with ultrasound or MRI, will a patient need that screening every year?
Usually, yes, though age and other medical conditions will change a patient’s personal risk and benefit considerations. Therefore, screening recommendations may change from one year to the next. With technology advancements and evolving guidelines, additional screening recommendations will change in the future.
Prepare yourself and your patients will benefit
The foundation of a successful screening program involves buy-in from both patient and clinician. Patients confused as to what their density notification means may have little understanding as to what next steps should be considered. To allay confusion, your patient will be best served by being provided understandable and actionable information. Advanced preparation for these conversations about the implications of dense tissue will make for more effective patient engagement.
Acknowledgment
Much of the material within this article has been sourced from the educational Web site DenseBreast-info.org. For comprehensive lists of both patient and health care provider frequently asked questions, visit http://www.DenseBreast-info.org.
Share your thoughts! Send your Letter to the Editor to [email protected]. Please include your name and the city and state in which you practice.
- Khong KA, Hargreaves J, Aminololama-Shakeri S, Lindfors KK. Impact of the California breast density law on primary care physicians. J Am Coll Radiol. 2015;12(3):256–260.
- Sickles EA, D’Orsi CJ, Bassett LW, et al. ACR BI-RADS Mammography. In: ACR BI-RADS Atlas, Breast Imaging Reporting and Data System. Reston, VA: American College of Radiology; 2013.
- Sprague BL, Gangnon RE, Burt V, et al. Prevalence of mammographically dense breasts in the United States. J Natl Cancer Inst. 2014;106(10).
- American Cancer Society. Breast Cancer Facts & Figures 2013–2014. http://www.cancer.org/acs/groups/content/@research/documents/document/acspc-042725.pdf. Published 2013. Accessed September 15, 2015.
- Harvey JA, Bovbjerg VE. Quantitative assessment of mammographic breast density: relationship with breast cancer risk. Radiology. 2004;230(1):29–41.
- Kerlikowske K, Cook AJ, Buist DS, et al. Breast cancer risk by breast density, menopause, and postmenopausal hormone therapy use. J Clin Oncol. 2010;28(24):3830–3837.
- Arora N, King TA, Jacks LM, et al. Impact of breast density on the presenting features of malignancy. Ann Surg Oncol. 2010;17(suppl 3):211–218.
- Smith RA, Duffy SW, Gabe R, Tabar L, Yen AM, Chen TH. The randomized trials of breast cancer screening: what have we learned? Radiol Clin North Am. 2004;42(5):793–806, v.
- Warner E, Hill K, Causer P, et al. Prospective study of breast cancer incidence in women with a BRCA1 or BRCA2 mutation under surveillance with and without magnetic resonance imaging. J Clin Oncol. 2011;29(13):1664–1669.
- Corsetti V, Houssami N, Ghirardi M, et al. Evidence of the effect of adjunct ultrasound screening in women with mammography-negative dense breasts: interval breast cancers at 1 year follow-up. Eur J Cancer. 2011;47(7): 1021–1026.
- Berg WA, Zhang Z, Lehrer D, et al. Detection of breast cancer with addition of annual screening ultrasound or a single screening MRI to mammography in women with elevated breast cancer risk. JAMA. 2012;307(13):1394–1404.
- Berg WA. Tailored supplemental screening for breast cancer: what now and what next? AJR Am J Roentgenol. 2009;192(2):390–399.
- Brem RF, Lenihan MJ, Lieberman J, Torrente J. Screening breast ultrasound: past, present, and future. AJR Am J Roentgenol. 2015;204(2):234–240.
- Hooley R. Tomosynthesis. In: Berg WA, Yang WT, eds. Diagnostic Imaging: Breast. 2nd ed. Salt Lake City, UT: Amirsys; 2014:2–19.
- Friedewald SM, Rafferty EA, Rose SL, et al. Breast cancer screening using tomosynthesis in combination with digital mammography. JAMA. 2014;311(24):2499–2507.
- Berg WA. Screening Ultrasound. In: Berg WA, Yang WT, eds. Diagnostic Imaging: Breast. 2nd ed. Salt Lake City, UT: Amirsys; 2014:9–43.
- Berg WA. Screening MRI. In: Berg WA, Yang WT, eds. Diagnostic Imaging: Breast. 2nd ed. Salt Lake City, UT: Amirsys; 2014:9–49.
- Hooley R. Tomosynthesis. In: Berg WA, Yang WT, eds.Berg WA. Screening Ultrasound. In: Berg WA, Yang WT, eds.Berg WA. Screening MRI. In: Berg WA, Yang WT, eds.Pisano ED, Gatsonis C, Hendrick E, et al. Diagnostic performance of digital versus film mammography for breast-cancer screening. N Engl J Med. 2005;353(17):1773–1783.
In this Article
- Breast mass imaging case study
- Screening decision support tool
- Is your support staff “density” ready?
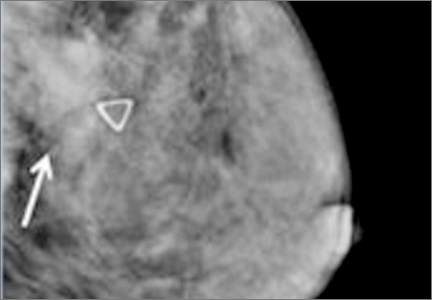
2015 Update on cancer
As the proportion of the elderly in the US population continues to increase, with life expectancy trending upward, we can expect to see more gynecologic cancers in our patients.1,2 At present, the most effective approach to these cancers commonly includes aggressive surgical resection with chemotherapy and, in some cases, radiation. It remains unclear whether elderly patients should be managed the same as younger patients, with minimal data to guide physicians. Some evidence suggests an increased risk of surgical complications in older adults.3
To optimize surgical care in our elderly patients, we need to understand the risks of perioperative mortality and morbidity in this population. For example, the current standard of care for advanced epithelial ovarian cancer is aggressive cytoreductive surgery followed by adjuvant chemotherapy,4 although neoadjuvant chemotherapy is gaining utility and popularity in certain circumstances. During pretreatment counseling, it is imperative that we communicate patient-specific outcomes so that patients and their families can make educated decisions in line with their goals. What should we know about age-dependent outcomes when counseling our patients?
To optimize surgical care in this population, we also need to develop and use new methods of surgical decision making. Although some data suggest that age is an independent risk factor for postoperative complications, not all elderly patients are the same in terms of comorbidities and functional status. In order to truly assess risks, we need to identify additional preoperative risk factors. Are there accurate scoring tools or predictors of outcomes available to help us assess the risks of postoperative mortality and morbidity?
In this article, we highlight recent developments in surgical treatment of the elderly, focusing on:
- postoperative mortality and morbidity in patients older than 80 years
- adjuncts to preoperative assessment for oncogeriatric surgical patients.
Risks rise sharply in older patients undergoing treatment for ovarian Ca
Moore KN, Reid MS, Fong DN, et al. Ovarian cancer in the octogenarian: does the paradigm of aggressive cytoreductive surgery and chemotherapy still apply? Gynecol Oncol. 2008;110(2):133–139.
Mahdi H, Wiechert A, Lockhart D, Rose PG. Impact of age on 30-day mortality and morbidity in patients undergoing surgery for ovarian cancer. Int J Gynecol Cancer. 2015;25(7):1216–1223.
The cornerstone of optimal survival from certain gynecologic cancers, such as advanced ovarian cancer, is aggressive debulking surgery. However, older adults are classically under-represented in clinical trials that guide this standard of care.
To determine whether patients aged 80 years or older respond differently from younger patients to conventional ovarian cancer management, Moore and colleagues retrospectively reviewed their institutional experience. They found that postoperative mortality increased from 5.4% in patients aged 80 to 84 years to 9.1% in those aged 85 to 89 and 14.4% in those older than 90. The rates for younger patients were 0.6% for patients younger than 60 years, 2.8% for those aged 60 to 69 years, and 2.5% for those aged 70 to 79 years (P<.001).
Notably, 13% of patients aged 80 years or older who underwent primary surgery died during their primary hospitalization. Of those who survived, 50% were discharged to skilled nursing facilities. Of patients who underwent cytoreductive surgery, 13% were unable to undergo any intended adjuvant therapy, and only 57% completed more than 3 cycles of chemotherapy, either due to demise or toxicities. Two-month survival for patients 80 years or older was comparable between patients who underwent primary surgery and those who had primary chemotherapy (20% and 26%, respectively).
With a similar objective, Mahdi and colleagues identified 2,087 patients with ovarian cancer who underwent surgery. After adjusting for confounders with multivariable analyses, they found that octogenarians whose initial management was surgery were 9 times more likely than younger patients to die and 70% more likely to develop complications within 30 days. Among patients who underwent neoadjuvant chemotherapy, there were no significant differences between older and younger patients in 30-day postoperative mortality or morbidity.
When evaluating elderly patients for surgery, the use of multiple risk-assessment strategies may improve accuracy
Huisman MG, Audisio RA, Ugolini G, et al. Screening for predictors of adverse outcome in onco-geriatric surgical patients: a multicenter prospective cohort study. Eur J Surg Oncol. 2015;41(7):844–851.
Uppal S, Igwe E, Rice L, Spencer R, Rose SL. Frailty index predicts severe complications in gynecologic oncology patients. Gynecol Oncol. 2015;137(1):98–101.
The National Comprehensive Cancer Network recommends that clinicians determine baseline life expectancy for older adults with cancer to aid in management decision making. The use of tools such as www.eprognosis.com, developed to determine anticipated life expectancy independent of cancer, can prove useful in determining a patient’s risk of dying or suffering from their cancer before dying of another cause.5
When it comes to the determination of risk related to a patient’s cancer diagnosis and selection of potential management options, many argue that the subgroup of elderly patients is not homogenous and that the use of age alone to guide management decisions may be unfair. Preoperative evaluation ideally should incorporate a global assessment of predictive risk factors.
Three assessment tools are especially useful
Huisman and colleagues set out to identify accurate preoperative assessment methods in elderly patients undergoing oncologic surgery. They prospectively recruited 328 patients aged 70 years or older and evaluated patients preoperatively using 11 well-known geriatric screening tools. They compared these evaluations with outcomes to determine which tools best predict the occurrence of major postoperative complications. They found the strongest correlation with outcomes when combining gender and type of surgery with the following 3 assessment tools:
- Timed Up and Go (TUG)—a walking test to measure functional status
- American Society of Anesthesiologists scale—a scoring system that quantifies preoperative physical status and estimates anesthetic risk
- Nutritional Risk Screening—an assessment of nutritional risk based on recent weight loss, overall condition, and reduction of food intake.
All 3 are simple and short screening tools. When used together, they can provide clinicians with accurate risk estimations.
The findings of Huisman and colleagues reinforce the importance of a global assessment of the patient’s comorbidities, functional status, and nutritional status when determining candidacy for oncologic surgery.
Functional index predicts need for postoperative ICU care and risk of death
Uppal and colleagues set out to quantify the predictive value of the modified Functional Index (mFI) in assessing the need for postoperative critical care support and/or the risk of death within 30 days after gynecologic cancer surgery. The mFI can be calculated by adding 1 point for each variable listed in the TABLE, with a score of 4 or higher representing a high-frailty cohort.
Of 6,551 patients who underwent gynecologic surgery, 188 were admitted to the intensive care unit (ICU) or died within 30 days after surgery. The mFI was calculated, with multivariate analyses of additional variables. An mFI score of 3 or higher was predictive of the need for critical care support and the risk of 30-day mortality and was associated with a significantly higher number of complications (P<.001).
Predictors significant for postoperative critical care support or death were:
- preoperative albumin level less than 3 g/dL (odds ratio [OR] = 6.5)
- operative time (OR = 1.003 per minute of increase)
- nonlaparoscopic surgery (OR = 3.3)
- mFI score, with a score of 0 serving as the reference (OR for a score of 1 = 1.26; score of 2 = 1.9; score of 3 = 2.33; and score of 4 or higher = 12.5).
When they combined the mFI and albumin scores—both readily available in the preoperative setting—Uppal and colleagues were able to develop an algorithm to determine patients who were at “low risk” versus “high risk” for ICU admission and/or death postoperatively (FIGURE).
[[{"fid":"79834","view_mode":"medstat_image_full_text","fields":{"format":"medstat_image_full_text","field_file_image_alt_text[und][0][value]":"","field_file_image_title_text[und][0][value]":"","field_file_image_caption[und][0][value]":"Postoperative risk stratification based on preoperative albumin level
and modified Functional Index","field_file_image_credit[und][0][value]":"6"},"type":"media","attributes":{"height":"316","width":"665","class":"media-element file-medstat-image-full-text"}}]]
Bottom line
Older patients are more commonly affected by multiple medical comorbidities, as well as functional, cognitive, and nutritional deficiencies, which contribute to their increased risk of morbidity and mortality after surgery. The elderly experience greater morbidity with noncardiac surgery in general.
Clearly, the decision to operate on an elderly patient should be approached with caution, and a critical assessment of the patient’s risk factors should be performed to inform counseling about the patient’s management options. Future randomized prospective data will help us better understand the relationship between age and surgical outcomes.
Share your thoughts on this article! Send your Letter to the Editor to [email protected]. Please include your name and the city and state in which you practice.
- US Census Bureau. Population Projections: Projections of the Population by Sex and Selected Age Groups for the United States: 2015 to 2060. https://www.census.gov/population/projections/data/national/2014/summarytables.html. Published December 2014. Accessed August 31, 2015.
- US Census Bureau. Population Projections: Percent Distribution of the Projected Population by Sex and Selected Age Groups for the United States: 2015 to 2060. https://www.census.gov/population/projections/data/national/2014/summarytables.html. Published December 2014. Accessed August 31, 2015.
- Polanczyk CA, Marcantonio E, Goldman L, et al. Impact of age on perioperative complications and length of stay in patients undergoing noncardiac surgery. Ann Intern Med. 2001;134(8):637–643.
- Aletti G, Dowdy SC, Gostout BS, et al. Aggressive surgical effort and improved survival in advanced stage ovarian cancer. Obstet Gynecol. 2006;107(1):77–85.
- National Comprehensive Cancer Network. NCCN Guidelines for Age-Related Recommendations: Older Adult Oncology. . Published 2015. Accessed August 31, 2015.
- Uppal S, Igwe E, Rice L, Spencer R, Rose SL. Frailty index predicts severe complications in gynecologic oncology patients. Gynecol Oncol. 2015;137(1):98–101.

Dr. Palisoul is Fellow in the Department of Obstetrics and Gynecology, Division of Gynecologic Oncology, at Washington University School of Medicine in St. Louis, Missouri.

Dr. Mutch is Ira C. and Judith Gall Professor of Obstetrics and Gynecology and Vice Chair of Gynecology, Division of Gynecologic Oncology, at Washington University School of Medicine in St. Louis, Missouri. He serves on the OBG Management Board of Editors
The authors report no financial relationships relevant to this article.
Dr. Palisoul is Fellow in the Department of Obstetrics and Gynecology, Division of Gynecologic Oncology, at Washington University School of Medicine in St. Louis, Missouri.
Dr. Mutch is Ira C. and Judith Gall Professor of Obstetrics and Gynecology and Vice Chair of Gynecology, Division of Gynecologic Oncology, at Washington University School of Medicine in St. Louis, Missouri. He serves on the OBG Management Board of Editors
The authors report no financial relationships relevant to this article.
As the proportion of the elderly in the US population continues to increase, with life expectancy trending upward, we can expect to see more gynecologic cancers in our patients.1,2 At present, the most effective approach to these cancers commonly includes aggressive surgical resection with chemotherapy and, in some cases, radiation. It remains unclear whether elderly patients should be managed the same as younger patients, with minimal data to guide physicians. Some evidence suggests an increased risk of surgical complications in older adults.3
To optimize surgical care in our elderly patients, we need to understand the risks of perioperative mortality and morbidity in this population. For example, the current standard of care for advanced epithelial ovarian cancer is aggressive cytoreductive surgery followed by adjuvant chemotherapy,4 although neoadjuvant chemotherapy is gaining utility and popularity in certain circumstances. During pretreatment counseling, it is imperative that we communicate patient-specific outcomes so that patients and their families can make educated decisions in line with their goals. What should we know about age-dependent outcomes when counseling our patients?
To optimize surgical care in this population, we also need to develop and use new methods of surgical decision making. Although some data suggest that age is an independent risk factor for postoperative complications, not all elderly patients are the same in terms of comorbidities and functional status. In order to truly assess risks, we need to identify additional preoperative risk factors. Are there accurate scoring tools or predictors of outcomes available to help us assess the risks of postoperative mortality and morbidity?
In this article, we highlight recent developments in surgical treatment of the elderly, focusing on:
- postoperative mortality and morbidity in patients older than 80 years
- adjuncts to preoperative assessment for oncogeriatric surgical patients.
Risks rise sharply in older patients undergoing treatment for ovarian Ca
Moore KN, Reid MS, Fong DN, et al. Ovarian cancer in the octogenarian: does the paradigm of aggressive cytoreductive surgery and chemotherapy still apply? Gynecol Oncol. 2008;110(2):133–139.
Mahdi H, Wiechert A, Lockhart D, Rose PG. Impact of age on 30-day mortality and morbidity in patients undergoing surgery for ovarian cancer. Int J Gynecol Cancer. 2015;25(7):1216–1223.
The cornerstone of optimal survival from certain gynecologic cancers, such as advanced ovarian cancer, is aggressive debulking surgery. However, older adults are classically under-represented in clinical trials that guide this standard of care.
To determine whether patients aged 80 years or older respond differently from younger patients to conventional ovarian cancer management, Moore and colleagues retrospectively reviewed their institutional experience. They found that postoperative mortality increased from 5.4% in patients aged 80 to 84 years to 9.1% in those aged 85 to 89 and 14.4% in those older than 90. The rates for younger patients were 0.6% for patients younger than 60 years, 2.8% for those aged 60 to 69 years, and 2.5% for those aged 70 to 79 years (P<.001).
Notably, 13% of patients aged 80 years or older who underwent primary surgery died during their primary hospitalization. Of those who survived, 50% were discharged to skilled nursing facilities. Of patients who underwent cytoreductive surgery, 13% were unable to undergo any intended adjuvant therapy, and only 57% completed more than 3 cycles of chemotherapy, either due to demise or toxicities. Two-month survival for patients 80 years or older was comparable between patients who underwent primary surgery and those who had primary chemotherapy (20% and 26%, respectively).
With a similar objective, Mahdi and colleagues identified 2,087 patients with ovarian cancer who underwent surgery. After adjusting for confounders with multivariable analyses, they found that octogenarians whose initial management was surgery were 9 times more likely than younger patients to die and 70% more likely to develop complications within 30 days. Among patients who underwent neoadjuvant chemotherapy, there were no significant differences between older and younger patients in 30-day postoperative mortality or morbidity.
When evaluating elderly patients for surgery, the use of multiple risk-assessment strategies may improve accuracy
Huisman MG, Audisio RA, Ugolini G, et al. Screening for predictors of adverse outcome in onco-geriatric surgical patients: a multicenter prospective cohort study. Eur J Surg Oncol. 2015;41(7):844–851.
Uppal S, Igwe E, Rice L, Spencer R, Rose SL. Frailty index predicts severe complications in gynecologic oncology patients. Gynecol Oncol. 2015;137(1):98–101.
The National Comprehensive Cancer Network recommends that clinicians determine baseline life expectancy for older adults with cancer to aid in management decision making. The use of tools such as www.eprognosis.com, developed to determine anticipated life expectancy independent of cancer, can prove useful in determining a patient’s risk of dying or suffering from their cancer before dying of another cause.5
When it comes to the determination of risk related to a patient’s cancer diagnosis and selection of potential management options, many argue that the subgroup of elderly patients is not homogenous and that the use of age alone to guide management decisions may be unfair. Preoperative evaluation ideally should incorporate a global assessment of predictive risk factors.
Three assessment tools are especially useful
Huisman and colleagues set out to identify accurate preoperative assessment methods in elderly patients undergoing oncologic surgery. They prospectively recruited 328 patients aged 70 years or older and evaluated patients preoperatively using 11 well-known geriatric screening tools. They compared these evaluations with outcomes to determine which tools best predict the occurrence of major postoperative complications. They found the strongest correlation with outcomes when combining gender and type of surgery with the following 3 assessment tools:
- Timed Up and Go (TUG)—a walking test to measure functional status
- American Society of Anesthesiologists scale—a scoring system that quantifies preoperative physical status and estimates anesthetic risk
- Nutritional Risk Screening—an assessment of nutritional risk based on recent weight loss, overall condition, and reduction of food intake.
All 3 are simple and short screening tools. When used together, they can provide clinicians with accurate risk estimations.
The findings of Huisman and colleagues reinforce the importance of a global assessment of the patient’s comorbidities, functional status, and nutritional status when determining candidacy for oncologic surgery.
Functional index predicts need for postoperative ICU care and risk of death
Uppal and colleagues set out to quantify the predictive value of the modified Functional Index (mFI) in assessing the need for postoperative critical care support and/or the risk of death within 30 days after gynecologic cancer surgery. The mFI can be calculated by adding 1 point for each variable listed in the TABLE, with a score of 4 or higher representing a high-frailty cohort.
Of 6,551 patients who underwent gynecologic surgery, 188 were admitted to the intensive care unit (ICU) or died within 30 days after surgery. The mFI was calculated, with multivariate analyses of additional variables. An mFI score of 3 or higher was predictive of the need for critical care support and the risk of 30-day mortality and was associated with a significantly higher number of complications (P<.001).
Predictors significant for postoperative critical care support or death were:
- preoperative albumin level less than 3 g/dL (odds ratio [OR] = 6.5)
- operative time (OR = 1.003 per minute of increase)
- nonlaparoscopic surgery (OR = 3.3)
- mFI score, with a score of 0 serving as the reference (OR for a score of 1 = 1.26; score of 2 = 1.9; score of 3 = 2.33; and score of 4 or higher = 12.5).
When they combined the mFI and albumin scores—both readily available in the preoperative setting—Uppal and colleagues were able to develop an algorithm to determine patients who were at “low risk” versus “high risk” for ICU admission and/or death postoperatively (FIGURE).
[[{"fid":"79834","view_mode":"medstat_image_full_text","fields":{"format":"medstat_image_full_text","field_file_image_alt_text[und][0][value]":"","field_file_image_title_text[und][0][value]":"","field_file_image_caption[und][0][value]":"Postoperative risk stratification based on preoperative albumin level
and modified Functional Index","field_file_image_credit[und][0][value]":"6"},"type":"media","attributes":{"height":"316","width":"665","class":"media-element file-medstat-image-full-text"}}]]
Bottom line
Older patients are more commonly affected by multiple medical comorbidities, as well as functional, cognitive, and nutritional deficiencies, which contribute to their increased risk of morbidity and mortality after surgery. The elderly experience greater morbidity with noncardiac surgery in general.
Clearly, the decision to operate on an elderly patient should be approached with caution, and a critical assessment of the patient’s risk factors should be performed to inform counseling about the patient’s management options. Future randomized prospective data will help us better understand the relationship between age and surgical outcomes.
Share your thoughts on this article! Send your Letter to the Editor to [email protected]. Please include your name and the city and state in which you practice.
- US Census Bureau. Population Projections: Projections of the Population by Sex and Selected Age Groups for the United States: 2015 to 2060. https://www.census.gov/population/projections/data/national/2014/summarytables.html. Published December 2014. Accessed August 31, 2015.
- US Census Bureau. Population Projections: Percent Distribution of the Projected Population by Sex and Selected Age Groups for the United States: 2015 to 2060. https://www.census.gov/population/projections/data/national/2014/summarytables.html. Published December 2014. Accessed August 31, 2015.
- Polanczyk CA, Marcantonio E, Goldman L, et al. Impact of age on perioperative complications and length of stay in patients undergoing noncardiac surgery. Ann Intern Med. 2001;134(8):637–643.
- Aletti G, Dowdy SC, Gostout BS, et al. Aggressive surgical effort and improved survival in advanced stage ovarian cancer. Obstet Gynecol. 2006;107(1):77–85.
- National Comprehensive Cancer Network. NCCN Guidelines for Age-Related Recommendations: Older Adult Oncology. . Published 2015. Accessed August 31, 2015.
- Uppal S, Igwe E, Rice L, Spencer R, Rose SL. Frailty index predicts severe complications in gynecologic oncology patients. Gynecol Oncol. 2015;137(1):98–101.
IN THIS ARTICLE
- Preoperative risk-assessment strategies
- The 11-item modified Functional Index
- Using the Functional Index in practice

Updates on Antidepressant Use
MINDFULNESS-BASED COGNITIVE THERAPY AND ANTIDEPRESSANTS
Kuyken W, Hayes R, Barrett B, et al. Effectiveness and cost-effectiveness of mindfulness-based cognitive therapy compared with maintenance antidepressant treatment in the prevention of depressive relapse or recurrence (PREVENT): a randomised controlled trial. Lancet. 2015;386(9988):63-73. doi:10.1016/S0140-6736(14)62222-4.
Mindfulness-based cognitive therapy—a group-based psychosocial intervention designed to enhance self-management of prodromal symptoms associated with depressive relapse—with support to taper or discontinue antidepressant treatment (MBCT-TS) is neither superior nor inferior to maintenance antidepressant treatment for preventing a depressive relapse, according to the PREVENT trial.
Researchers randomly assigned 424 patients to MBCT-TS or maintenance therapy and found no difference in time to relapse or recurrence of depression between the two groups. Rates of adverse effects were similar in both groups.
The study authors note that both treatments were associated with positive outcomes regarding relapse or recurrence, residual depressive symptoms, and quality of life.
COMMENTARY
Patients with recurrent depression have a 50% to 80% lifetime rate of relapse, making a prevention strategy an important part of their care. Current recommendations suggest long-term continuation of antidepressant treatment decreases recurrence by 50% to 60%.1 However, antidepressant medication only works for as long as you take it, and many people do not want to be on antidepressants long term. A previous study compared MBCT-TS, continuation of antidepressant medication, and placebo; the respective relapse rates of 28%, 27%, and 71% indicate that both MBCT-TS and antidepressant medication substantially decrease the rate of depression relapse.2 This study provides further evidence that MBCT-TS is an excellent alternative to antidepressant medication for decreasing depression relapse.
1. Geddes JR, Carney SM, Davies C, et al. Relapse prevention with antidepressant drug treatment in depressive disorders: a systematic review. Lancet. 2003;361:653-661.
2. Segal ZV, Bieling P, Young T, et al. Antidepressant monotherapy vs sequential pharmacotherapy and mindfulness-based cognitive therapy, or placebo, for relapse prophylaxis in recurrent depression. Arch Gen Psych. 2010;67:1256-1264. doi:10.1001/archgenpsychiatry.2010.168.
Continue for treating preconception depression: To stop SSRIs or not >>
TREATING PRECONCEPTION DEPRESSION: TO STOP SSRIs OR NOT
Andersen JT, Andersen NL, Horwitz H, et al. Exposure to selective serotonin reuptake inhibitors in early pregnancy and the risk of miscarriage. Obstet Gynecol. 2014;124(4):655-661. doi: 10.1097/AOG.0000000000000447.
Miscarriage rates in women taking selective serotonin reuptake inhibitors (SSRIs) in early pregnancy were higher than in those not taking SSRIs but similar to those who discontinued SSRI treatment prior to pregnancy, a Danish cohort study revealed.
Out of 1.3 million pregnancies between 1997 and 2010, researchers identified 22,884 women who were exposed to an SSRI during the first 35 days of pregnancy and found miscarriage rates of 13% in those exposed to the antidepressants, compared to 11% for those not exposed. Investigators also identified 14,016 women who discontinued SSRI treatment three to 12 months prior to conception and found a miscarriage rate of 14%.
The adjusted hazard ratio for miscarriage while taking SSRIs in early pregnancy was 1.27, and for miscarriage after discontinuing SSRIs prior to pregnancy, 1.24. When the data were stratified according to specific SSRIs, rates were lowest among those taking fluoxetine during pregnancy (1.10) and highest among those taking sertraline (1.45). Miscarriage rates among women who stopped SSRIs prior to pregnancy were lowest for fluoxetine (1.2) and highest for escitalopram (1.33).
“Because the risk for miscarriage is elevated in both groups compared with an unexposed population, there is likely no benefit in discontinuing SSRI use before pregnancy to decrease one’s chances of miscarriage,” the study authors conclude.
COMMENTARY
The effects of depression on a woman’s experience during pregnancy are large, as are the effects of depression on pregnancy outcomes. Depression during pregnancy is associated with increased rates of prematurity, low birth weight, and preeclampsia.1 Depression during pregnancy is also an important risk factor for postpartum depression, which affects babies as well as mothers and is associated with maternal suicide.
At the same time, use of SSRIs in pregnancy has been inconsistently associated with miscarriage, cardiac defects, premature birth, and primary pulmonary hypertension in the newborn.2 This study is reassuring in that SSRIs are unlikely to be a significant contributor to miscarriage. But it is important to realize that this article only addresses miscarriage rates, not other potential effects of SSRIs on the fetus. The decision about the use of SSRIs in pregnancy remains a difficult one, balancing risk and benefit. When determining that balance, bear in mind that cognitive behavioral therapy (CBT) has been shown in other studies to be equally effective to medication in treating depression and may also be considered in our range of options for treatment of depression in pregnancy.3,4
The decision about whether to use or continue an SSRI and whether to use or supplement with CBT instead is an important one and always requires detailed discussion with the mother-to-be.
1. Grigoriadis S, VonderPorten EH, Mamisashvili L, et al. The impact of maternal depression during pregnancy on perinatal outcomes: a systematic review and meta-analysis. J Clin Psych. 2013;74:e321-341.
2. Meltzer-Brody S. Treating perinatal depression: risks and stigma. Obstet Gynecol. 2014;124(4):653-654. doi: 10.1097/AOG.0000000000000498.
3. Keller MB, McCullough JP, Klein DN, et al. A comparison of nefazodone, the cognitive behavioral-analysis system of psychotherapy, and their combination for the treatment of chronic depression [published correction appears in N Engl J Med. 2001;345(3):232]. N Engl J Med. 2000;342(20): 1462-1470.
4. Cuijpers P, Hollon SD, van Straten A, et al. Does cognitive behaviour therapy have an enduring effect that is superior to keeping patients on continuation pharmacotherapy? A meta-analysis. BMJ Open. 2013;3(4). pii: e002542. doi: 10.1136/bmjopen-2012-002542.
Continue for suicide, self-harm rates, and antidepressants >>
SUICIDE, SELF-HARM RATES, AND ANTIDEPRESSANTS
Coupland C, Hill T, Morriss R, et al. Antidepressant use and risk of suicide and attempted suicide or self harm in people aged 20 to 64: cohort study using a primary care database. BMJ. 2015;350:h517. doi: 10.1136/bmj.h517.
In patients with clinical depression, rates of suicide and self-harm are similar among those treated with selective serotonin reuptake inhibitors (SSRIs) and tricyclic antidepressants but significantly higher among those treated with other antidepressants, according to a review of 238,963 patients who were diagnosed with depression.
During an average five years’ follow-up, researchers noted 198 cases of suicide and 5,243 cases of attempted suicide or self-harm. The following hazard ratios (HR) were associated with antidepressant use:
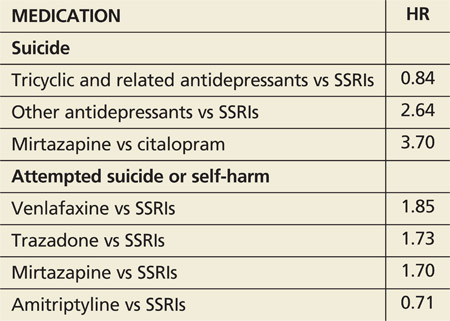
Absolute risk for suicide over one year ranged from 0.02% for amitriptyline to 0.19% for mirtazapine.
COMMENTARY
This large study suggests suicide rates may be greater with non-SSRI antidepressants than with SSRIs. The data are far from solid, though, because of the small number of events and the potential for systematic differences in how these antidepressants are prescribed. For instance, if dual norepinephrine and serotonin agents are prescribed more often to individuals with more severe depression, then the increased suicide risk with use of combined norepinephrine/serotonin agents (eg, venlafaxine) could relate to the severity of the depression treated, not to an effect of the medication. Of importance is that the rate of suicide was increased in the first 28 days after starting an antidepressant and in the 28 days after stopping the antidepressant, times when we should have increased vigilance for suicidal ideation.
MINDFULNESS-BASED COGNITIVE THERAPY AND ANTIDEPRESSANTS
Kuyken W, Hayes R, Barrett B, et al. Effectiveness and cost-effectiveness of mindfulness-based cognitive therapy compared with maintenance antidepressant treatment in the prevention of depressive relapse or recurrence (PREVENT): a randomised controlled trial. Lancet. 2015;386(9988):63-73. doi:10.1016/S0140-6736(14)62222-4.
Mindfulness-based cognitive therapy—a group-based psychosocial intervention designed to enhance self-management of prodromal symptoms associated with depressive relapse—with support to taper or discontinue antidepressant treatment (MBCT-TS) is neither superior nor inferior to maintenance antidepressant treatment for preventing a depressive relapse, according to the PREVENT trial.
Researchers randomly assigned 424 patients to MBCT-TS or maintenance therapy and found no difference in time to relapse or recurrence of depression between the two groups. Rates of adverse effects were similar in both groups.
The study authors note that both treatments were associated with positive outcomes regarding relapse or recurrence, residual depressive symptoms, and quality of life.
COMMENTARY
Patients with recurrent depression have a 50% to 80% lifetime rate of relapse, making a prevention strategy an important part of their care. Current recommendations suggest long-term continuation of antidepressant treatment decreases recurrence by 50% to 60%.1 However, antidepressant medication only works for as long as you take it, and many people do not want to be on antidepressants long term. A previous study compared MBCT-TS, continuation of antidepressant medication, and placebo; the respective relapse rates of 28%, 27%, and 71% indicate that both MBCT-TS and antidepressant medication substantially decrease the rate of depression relapse.2 This study provides further evidence that MBCT-TS is an excellent alternative to antidepressant medication for decreasing depression relapse.
1. Geddes JR, Carney SM, Davies C, et al. Relapse prevention with antidepressant drug treatment in depressive disorders: a systematic review. Lancet. 2003;361:653-661.
2. Segal ZV, Bieling P, Young T, et al. Antidepressant monotherapy vs sequential pharmacotherapy and mindfulness-based cognitive therapy, or placebo, for relapse prophylaxis in recurrent depression. Arch Gen Psych. 2010;67:1256-1264. doi:10.1001/archgenpsychiatry.2010.168.
Continue for treating preconception depression: To stop SSRIs or not >>
TREATING PRECONCEPTION DEPRESSION: TO STOP SSRIs OR NOT
Andersen JT, Andersen NL, Horwitz H, et al. Exposure to selective serotonin reuptake inhibitors in early pregnancy and the risk of miscarriage. Obstet Gynecol. 2014;124(4):655-661. doi: 10.1097/AOG.0000000000000447.
Miscarriage rates in women taking selective serotonin reuptake inhibitors (SSRIs) in early pregnancy were higher than in those not taking SSRIs but similar to those who discontinued SSRI treatment prior to pregnancy, a Danish cohort study revealed.
Out of 1.3 million pregnancies between 1997 and 2010, researchers identified 22,884 women who were exposed to an SSRI during the first 35 days of pregnancy and found miscarriage rates of 13% in those exposed to the antidepressants, compared to 11% for those not exposed. Investigators also identified 14,016 women who discontinued SSRI treatment three to 12 months prior to conception and found a miscarriage rate of 14%.
The adjusted hazard ratio for miscarriage while taking SSRIs in early pregnancy was 1.27, and for miscarriage after discontinuing SSRIs prior to pregnancy, 1.24. When the data were stratified according to specific SSRIs, rates were lowest among those taking fluoxetine during pregnancy (1.10) and highest among those taking sertraline (1.45). Miscarriage rates among women who stopped SSRIs prior to pregnancy were lowest for fluoxetine (1.2) and highest for escitalopram (1.33).
“Because the risk for miscarriage is elevated in both groups compared with an unexposed population, there is likely no benefit in discontinuing SSRI use before pregnancy to decrease one’s chances of miscarriage,” the study authors conclude.
COMMENTARY
The effects of depression on a woman’s experience during pregnancy are large, as are the effects of depression on pregnancy outcomes. Depression during pregnancy is associated with increased rates of prematurity, low birth weight, and preeclampsia.1 Depression during pregnancy is also an important risk factor for postpartum depression, which affects babies as well as mothers and is associated with maternal suicide.
At the same time, use of SSRIs in pregnancy has been inconsistently associated with miscarriage, cardiac defects, premature birth, and primary pulmonary hypertension in the newborn.2 This study is reassuring in that SSRIs are unlikely to be a significant contributor to miscarriage. But it is important to realize that this article only addresses miscarriage rates, not other potential effects of SSRIs on the fetus. The decision about the use of SSRIs in pregnancy remains a difficult one, balancing risk and benefit. When determining that balance, bear in mind that cognitive behavioral therapy (CBT) has been shown in other studies to be equally effective to medication in treating depression and may also be considered in our range of options for treatment of depression in pregnancy.3,4
The decision about whether to use or continue an SSRI and whether to use or supplement with CBT instead is an important one and always requires detailed discussion with the mother-to-be.
1. Grigoriadis S, VonderPorten EH, Mamisashvili L, et al. The impact of maternal depression during pregnancy on perinatal outcomes: a systematic review and meta-analysis. J Clin Psych. 2013;74:e321-341.
2. Meltzer-Brody S. Treating perinatal depression: risks and stigma. Obstet Gynecol. 2014;124(4):653-654. doi: 10.1097/AOG.0000000000000498.
3. Keller MB, McCullough JP, Klein DN, et al. A comparison of nefazodone, the cognitive behavioral-analysis system of psychotherapy, and their combination for the treatment of chronic depression [published correction appears in N Engl J Med. 2001;345(3):232]. N Engl J Med. 2000;342(20): 1462-1470.
4. Cuijpers P, Hollon SD, van Straten A, et al. Does cognitive behaviour therapy have an enduring effect that is superior to keeping patients on continuation pharmacotherapy? A meta-analysis. BMJ Open. 2013;3(4). pii: e002542. doi: 10.1136/bmjopen-2012-002542.
Continue for suicide, self-harm rates, and antidepressants >>
SUICIDE, SELF-HARM RATES, AND ANTIDEPRESSANTS
Coupland C, Hill T, Morriss R, et al. Antidepressant use and risk of suicide and attempted suicide or self harm in people aged 20 to 64: cohort study using a primary care database. BMJ. 2015;350:h517. doi: 10.1136/bmj.h517.
In patients with clinical depression, rates of suicide and self-harm are similar among those treated with selective serotonin reuptake inhibitors (SSRIs) and tricyclic antidepressants but significantly higher among those treated with other antidepressants, according to a review of 238,963 patients who were diagnosed with depression.
During an average five years’ follow-up, researchers noted 198 cases of suicide and 5,243 cases of attempted suicide or self-harm. The following hazard ratios (HR) were associated with antidepressant use:
Absolute risk for suicide over one year ranged from 0.02% for amitriptyline to 0.19% for mirtazapine.
COMMENTARY
This large study suggests suicide rates may be greater with non-SSRI antidepressants than with SSRIs. The data are far from solid, though, because of the small number of events and the potential for systematic differences in how these antidepressants are prescribed. For instance, if dual norepinephrine and serotonin agents are prescribed more often to individuals with more severe depression, then the increased suicide risk with use of combined norepinephrine/serotonin agents (eg, venlafaxine) could relate to the severity of the depression treated, not to an effect of the medication. Of importance is that the rate of suicide was increased in the first 28 days after starting an antidepressant and in the 28 days after stopping the antidepressant, times when we should have increased vigilance for suicidal ideation.
Should the 30-minute rule for emergent cesarean delivery be applied universally?

CASE 1: Term delivery: 45 minutes from decision to incision
P. G. is a 27-year-old woman (G2P1) at 38.2 weeks’ gestation who presents to the labor and delivery unit reporting painful contractions after uncomplicated prenatal care. She has a body mass index (BMI) of 40 kg/m2. Upon admission, her fetal heart-rate (FHR) tracing falls into Category 1. An examination reveals a cervix dilated to 4 cm and 70% effaced. Epidural analgesia is administered for pain control.
After 4 hours, the FHR tracing reveals minimal variability with occasional variable decelerations. The obstetrician is informed but issues no specific instructions. After 2 more hours, the FHR tracing lacks variability, with late decelerations and no spontaneous accelerations—a Category 3 tracing, which is predictive of abnormal acid-base status. Contractions occur every 3 to 4 minutes.
When fetal scalp stimulation by the nurse fails to elicit any accelerations, intrauterine resuscitation is attempted with an intravenous fluid bolus, left lateral positioning, and oxygen administration. Despite these measures, the FHR pattern fails to improve.
Although she is apprised of the need for prompt delivery, the patient hopes to avoid cesarean delivery, if possible, and insists on more time before a decision is made to proceed to cesarean. After another 2 hours, the FHR pattern has not improved and cervical dilation remains at 4 cm. The patient gives her consent for cesarean delivery.
Approximately 35 minutes are needed to take the patient to the operating room (OR). About 45 minutes after informed consent, the incision is made. Forty-seven minutes later, a male infant is delivered with Apgar scores of 1, 3, and 4 at 1, 5, and 10 minutes, respectively. Umbilical arterial analysis reveals a pH level of 6.9, with a base excess of –21. The infant has a neonatal seizure within 3 hours and is eventually diagnosed with cerebral palsy.
A claim against the clinicians alleges that deviation from the “standard of care 30-minute rule more than likely caused” hypoxic ische- mic injury and cerebral palsy.
Does the literature support this claim?
Approximately 3% of all births involve cesarean delivery for a nonreassuring FHR tracing.1 Much has been written about the “30-minute rule” for decision to incision time. In this article, we highlight current limitations of this standard in the context of 4 distinct clinical scenarios.
Case 1 highlights several limitations and ambiguities in the obstetric literature. Although a timely delivery is always desirable, it may not always be possible to achieve safely due to intrinsic patient characteristics or situational constraints. Conditions prevailing before the decision to proceed to cesarean delivery also affect overall pregnancy outcomes. Not all cases have the same starting point; fetal status at the time of the cesarean decision also determines the acuity and urgency of the case.
A widely promulgated rule— but is it valid?
Both the American College of Obstetricians and Gynecologists (ACOG) and the Royal College of Obstetricians and Gynaecologists have published guidelines stating that any hospital offering obstetric care should have the capability to perform emergent cesarean delivery within 30 minutes.2,3 This general statement has been touted as the standard by which obstetric services should be evaluated. Regardless of the clinical situation, obstetric providers are expected to abide by this rule.
These guidelines recently have come under scrutiny. For example, a 2014 meta-analysis involving more than 30 studies and 22,000 women revealed that only 36% of all cases with a Category 2 FHR tracing were delivered within 30 minutes.4 Interestingly, investigators reported that infants with a shorter delivery interval had a higher likelihood of having a 5-minute Apgar score below 7 and an umbilical artery pH level below 7.1, with no difference in the rate of admission to a neonatal intensive care unit (NICU) when the time from decision to delivery was examined.4 This finding highlights the questionable nature of the current clinical standard, as well as the conflicting findings currently present in the literature.
In general, patients who have graver clinical findings will be delivered at a shorter interval but may still have worse neonatal outcomes than infants delivered 30 minutes or more after the decision for cesarean is made.
Although Case 1 is complicated by FHR abnormalities, the association between such abnormalities and adverse long-term outcomes in neonates is questionable. Fewer than 1% of cases involving late decelerations or decreased variability during labor lead to cerebral palsy,5 highlighting the weak association between FHR abnormalities and neurologic sequelae. Most adverse neurologic neonatal outcomes are multifactorial in nature and may not be attributable to a single prenatal event.
With such limitations, the application and use of the 30-minute “standard” by hospitals, professional societies, and the medicolegal community may not be appropriate. The literature may not justify using this arbitrary rule as the standard of care. Clearly, there are gaps in our knowledge and understanding of FHR abnormalities and the optimal interval for cesarean delivery. Therefore, it may be unfair and inappropriate to group all cases and clinical situations together.
CASE 2: 25 minutes from decision to preterm delivery
J. P. (G2P1) undergoes an ultrasonographic examination at 33.4 weeks’ gestation because of concern about a discrepancy between fetal size and gestational age. The estimated fetal weight is in the 5th percentile. Amniotic fluid level is normal, but the biophysical profile is 6/8, with no breathing for 30 seconds. Umbilical artery Doppler imaging reveals absent end-diastolic flow, and FHR monitoring reveals repetitive late decelerations.
The patient is admitted immediately to the labor and delivery unit and placed on continuous electronic fetal monitoring. Betamethasone is given to enhance fetal lung maturity. FHR monitoring continues to show repetitive late decelerations with every contraction.
After 10 minutes on the labor floor, a decision is made to proceed to emergent cesarean delivery. Within 25 minutes of that decision, a female infant weighing 1,731 g (3rd percentile) is delivered, with Apgar scores of 1, 1, and 4 at 1, 5, and 10 minutes, respectively. The infant is eventually diagnosed with moderate cerebral palsy.
Could this outcome have been prevented?
Published reports on the association between abnormal FHR patterns and adverse perinatal outcomes in preterm infants are even more scarce than they are for infants delivered at term. Case 2 highlights the fact that achievement of a 30-minute interval from decision to delivery doesn’t necessarily eliminate the risk of adverse neonatal outcomes and long-term morbidity.
One of the best evaluations of this association was published by Shy and colleagues in the 1980s.6 In that study, investigators randomly assigned 173 preterm infants to intermittent auscultation or continuous external fetal monitoring. Use of external fetal monitoring did not improve neurologic outcomes at 18 months of age. Nor did the duration of FHR abnormalities predict the development of cerebral palsy.6
A recent secondary analysis from a randomized trial evaluating the use of antenatal magnesium sulfate to prevent cerebral palsy revealed that preterm FHR patterns labeled as “fetal distress” by the treating physician were associated with an increased risk of cerebral palsy in the newborn.7 Although this analysis revealed an association, a causal link could not be established. Damage to a preterm infant’s central nervous system can occur before the mother presents to the ultrasound unit or clinic, and alterations to FHR patterns can reflect previous injury. In such cases, a short decision to incision interval would not prevent damage to the central nervous system of the preterm infant.
CASE 3: 5 minutes from decision to incision after uterine rupture
G. P. is a patient (G2P1) at 38 weeks’ gestation who has had a previous low uterine transverse cesarean delivery. She strongly wishes to attempt vaginal birth after cesarean (VBAC) and has been extensively counseled about the risks and benefits of this approach. This counseling has been appropriately documented in her chart. Her predicted likelihood of success is 54%.
Upon arrival in the triage unit, she reiterates that she hopes to deliver her child vaginally. Upon examination, she is found to be dilated to 4 cm. She is admitted to the labor and delivery unit, with reevaluation planned 2 hours after epidural administration. At that time, her labor is noted to be progressing at an appropriate rate.
After 5 hours of labor, the baseline FHR drops into the 70s. Immediate evaluation reveals significant uterine bleeding, with the fetus no longer engaged in the pelvis. The attending physician immediately suspects uterine rupture.
The patient is rushed to the OR, and delivery is complicated by the presence of extensive adhesions to the uterus and anterior abdominal wall. After 20 minutes, a female infant is delivered, with Apgar scores of 0, 0, and 1 at 1, 5, and 10 minutes, respectively. Medical care is withdrawn after 3 days in the NICU.
In a true obstetric catastrophe such as uterine rupture, should the decision to incision interval be 30 minutes?
Although it is rare, uterine rupture is a known complication of VBAC attempts. The actual rate varies across the literature but appears to be approximately 0.5% to 0.9% in women attempting vaginal birth after a prior lower uterine incision.8
If uterine rupture develops, both mother and fetus are at increased risk of morbidity and mortality. The risk of hypoxic ischemic encephalopathy after uterine rupture is about 6.2% (95% confidence interval [CI], 1.8–10.6), and the risk of neonatal death is about 1.8% (95% CI, 0–4.2).9 Uterine rupture also has been linked to an increase in:
- severe postpartum hemorrhage (odds ratio [OR], 8.51; 95% CI, 4.6–15.1)
- general anesthesia exposure (OR, 14.20; 95% CI, 9.1–22.2)
- hysterectomy (OR, 51.36; 95% CI, 13.6–193.4)
- serious perinatal outcome (OR, 24.51; 95% CI, 11.9–51.9).10
- serious perinatal outcome (OR, 24.51; 95% CI, 11.9–51.9).
Case 3 again highlights the limitations and difficulties of encompassing all cases within a 30-minute timeframe. Although the newborn was delivered within this interval after the initial insult, the intervention was insufficient to prevent severe and long-term damage.
In cases of true obstetric emergency, the catastrophic nature of the event may lead to adverse long-term neonatal outcomes even if the standard of care is met. Immediate delivery still may not allow for the prevention of neurologic morbidity in the fetus. When evaluating such cases retrospectively, all parties involved always should consider these facts before drawing any conclusions on causality and prevention.
CASE 4: Twins delivered 20 minutes after cesarean decision
P. R. (G1P0) presents for routine prenatal care at 36 weeks’ gestation. She is carrying a dichorionic/diamniotic twin gestation that so far has been uncomplicated. She has been experiencing contractions for the past 2 weeks, but they have intensified during the past 2 days. When an examination reveals that she is dilated to 4 cm, she is admitted to the labor and delivery unit.
Both fetuses are evaluated via external FHR monitoring. Initially, both have Category 1 tracings but, approximately 1 hour later, both tracings are noted to have minimal variability with variable decelerations, with a nadir at 80 bpm that lasts 30 to 45 seconds. These abnormalities persist even after intrauterine resuscitation is attempted. The cervix remains dilated at 4 cm.
After a Category 2 tracing persists for 1 hour, the attending physician proceeds to cesarean delivery. Both infants are delivered within 20 minutes after the decision is made. Two female infants of appropriate gestational size are delivered, with Apgar scores of 7 and 8 for Twin A and 8 and 9 for Twin B. The newborns eventually are discharged home with the mother. Twin B is subsequently given a diagnosis of cerebral palsy.
Should the decision to incision rule be applied to twin gestations?
Multifetal gestations carry an increased risk not only of fetal and neonatal death but also of handicap among survivors, compared with singleton pregnancies.11 The literature evaluating the link between abnormal FHR patterns and adverse neonatal outcomes in twin pregnancies is sparse. Adding to the confusion is the fact that signal loss from fetal monitoring during labor occurs more frequently in twins than in singletons, with a reported incidence of 26% to 33% during the 1st stage of labor and 41% to 63% during the 2nd stage.12 Moreover, the FHR pattern of one twin may be recorded twice inadvertently and the same tracing erroneously attributed to both twins.
The decision to incision and delivery time in twin gestations should be evaluated in the context of all the limitations the clinician faces when managing labor in a twin gestation. The 30-minute rule never has been specifically evaluated in the context of multifetal gestations. The pathway and contributing factors that lead to adverse neonatal outcomes in twin gestations may be very different from those related to singleton pregnancies and may be more relevant to antepartum than intrapartum events.
Take-home message
The 4 cases presented here call into question the applicability and generalizability of the 30-minute decision to incision rule. Diverse clinical situations encountered in practice should lead to different interpretations of this standard. No single rule can encompass all possible scenarios; therefore, a single rule should not be touted as universal. All clinical variables should be weighed and interpreted in the retrospective evaluation of a case involving a cesarean delivery performed after a 30-minute decision to incision interval.
Share your thoughts! Send your Letter to the Editor to [email protected]. Please include your name and the city and state in which you practice.
- Chauhan SP, Magann EF, Scott JR, Scardo JA, Hendrix NW, Martin JN Jr. Cesarean delivery for fetal distress: rate and risk factors. Obstet Gynecol Surv. 2003;58(5):337–350.
- American College of Obstetricians and Gynecologists, Committee on Professional Standards. Standards for Obstetric-Gynecologic Hospital Services. 7th ed. Washington, DC: ACOG; 1989.
- National Institute for Health and Care Excellence. Caesarean Section Guideline. London, UK: NICE; 2011.
- Tolcher MC, Johnson RL, El-Nashar SA, West CP. Decision-to-incision time and neonatal outcomes: a systematic review and meta-analysis. Obstet Gynecol. 2014;123(3):536–548.
- Nelson KB, Dambrosia JM, Ting TY, Grether JK. Uncertain values of electronic fetal monitoring in predicting cerebral palsy. N Engl J Med. 1996;334(10):613–618.
- Shy KK, Luthy DA, Bennett FC, et al. Effects of electronic fetal heart-rate monitoring, as compared with periodic auscultation, on the neurologic development of premature infants. N Engl J Med. 1990;322(9):588–593.
- Mendez-Figueroa H, Chauhan SP, Pedroza C, Refuerzo JS, Dahlke JD, Rouse DJ. Preterm cesarean delivery for nonreassuring fetal heart rate: neonatal and neurologic morbidity. Obstet Gynecol. 2015;125(3):636–642.
- Macones GA, Cahill AG, Samilio DM, Odibo A, Peipert J, Stevens EJ. Can uterine rupture in patients attempting vaginal birth after cesarean delivery be predicted? Am J Obstet Gynecol. 2006;195(4):1148–1152.
- Landon MB, Hauth JC, Leveno KJ, et al. Maternal and perinatal outcomes associated with a trial of labor after prior cesarean delivery. N Engl J Med. 2004;351(25):2581–2589.
- Al-Zirqi I, Stray-Pedersen B, Forsen L, Daltveit AK, Vangen S. Uterine rupture: trends over 40 years [published online ahead of print April 2, 2015]. BJOG. doi: 10.1111/1471-0528.13394.
- Ramsey PS, Repke JT. Intrapartum management of multifetal pregnancies. Semin Perinatol. 2003;27(1):54–72.
- Bakker PC, Colenbrander GJ, Verstraeten AA, Van Geijn HP. Quality of intrapartum cardiotocography in twin deliveries. Am J Obstet Gynecol. 2004;191(6):2114–2119.
Suneet P. Chauhan, MD, and Hector Mendez-Figueroa, MD

Dr. Chauhan is Professor of Obstetrics, Gynecology, and Reproductive Sciences at the University of Texas Health Science Center at Houston.

Dr. Mendez-Figueroa is Assistant Professor of Obstetrics, Gynecology, and Reproductive Sciences at the University of Texas Health Science Center at Houston.
Dr. Chauhan reports that he receives grant or research support from the Eunice Kennedy Shriver National Institute of Child Health and Human Development and is a consultant to Clinical Innovations. Dr. Mendez-Figueroa reports no financial relationships relevant to this article.
Suneet P. Chauhan, MD, and Hector Mendez-Figueroa, MD
Dr. Chauhan is Professor of Obstetrics, Gynecology, and Reproductive Sciences at the University of Texas Health Science Center at Houston.
Dr. Mendez-Figueroa is Assistant Professor of Obstetrics, Gynecology, and Reproductive Sciences at the University of Texas Health Science Center at Houston.
Dr. Chauhan reports that he receives grant or research support from the Eunice Kennedy Shriver National Institute of Child Health and Human Development and is a consultant to Clinical Innovations. Dr. Mendez-Figueroa reports no financial relationships relevant to this article.
CASE 1: Term delivery: 45 minutes from decision to incision
P. G. is a 27-year-old woman (G2P1) at 38.2 weeks’ gestation who presents to the labor and delivery unit reporting painful contractions after uncomplicated prenatal care. She has a body mass index (BMI) of 40 kg/m2. Upon admission, her fetal heart-rate (FHR) tracing falls into Category 1. An examination reveals a cervix dilated to 4 cm and 70% effaced. Epidural analgesia is administered for pain control.
After 4 hours, the FHR tracing reveals minimal variability with occasional variable decelerations. The obstetrician is informed but issues no specific instructions. After 2 more hours, the FHR tracing lacks variability, with late decelerations and no spontaneous accelerations—a Category 3 tracing, which is predictive of abnormal acid-base status. Contractions occur every 3 to 4 minutes.
When fetal scalp stimulation by the nurse fails to elicit any accelerations, intrauterine resuscitation is attempted with an intravenous fluid bolus, left lateral positioning, and oxygen administration. Despite these measures, the FHR pattern fails to improve.
Although she is apprised of the need for prompt delivery, the patient hopes to avoid cesarean delivery, if possible, and insists on more time before a decision is made to proceed to cesarean. After another 2 hours, the FHR pattern has not improved and cervical dilation remains at 4 cm. The patient gives her consent for cesarean delivery.
Approximately 35 minutes are needed to take the patient to the operating room (OR). About 45 minutes after informed consent, the incision is made. Forty-seven minutes later, a male infant is delivered with Apgar scores of 1, 3, and 4 at 1, 5, and 10 minutes, respectively. Umbilical arterial analysis reveals a pH level of 6.9, with a base excess of –21. The infant has a neonatal seizure within 3 hours and is eventually diagnosed with cerebral palsy.
A claim against the clinicians alleges that deviation from the “standard of care 30-minute rule more than likely caused” hypoxic ische- mic injury and cerebral palsy.
Does the literature support this claim?
Approximately 3% of all births involve cesarean delivery for a nonreassuring FHR tracing.1 Much has been written about the “30-minute rule” for decision to incision time. In this article, we highlight current limitations of this standard in the context of 4 distinct clinical scenarios.
Case 1 highlights several limitations and ambiguities in the obstetric literature. Although a timely delivery is always desirable, it may not always be possible to achieve safely due to intrinsic patient characteristics or situational constraints. Conditions prevailing before the decision to proceed to cesarean delivery also affect overall pregnancy outcomes. Not all cases have the same starting point; fetal status at the time of the cesarean decision also determines the acuity and urgency of the case.
A widely promulgated rule— but is it valid?
Both the American College of Obstetricians and Gynecologists (ACOG) and the Royal College of Obstetricians and Gynaecologists have published guidelines stating that any hospital offering obstetric care should have the capability to perform emergent cesarean delivery within 30 minutes.2,3 This general statement has been touted as the standard by which obstetric services should be evaluated. Regardless of the clinical situation, obstetric providers are expected to abide by this rule.
These guidelines recently have come under scrutiny. For example, a 2014 meta-analysis involving more than 30 studies and 22,000 women revealed that only 36% of all cases with a Category 2 FHR tracing were delivered within 30 minutes.4 Interestingly, investigators reported that infants with a shorter delivery interval had a higher likelihood of having a 5-minute Apgar score below 7 and an umbilical artery pH level below 7.1, with no difference in the rate of admission to a neonatal intensive care unit (NICU) when the time from decision to delivery was examined.4 This finding highlights the questionable nature of the current clinical standard, as well as the conflicting findings currently present in the literature.
In general, patients who have graver clinical findings will be delivered at a shorter interval but may still have worse neonatal outcomes than infants delivered 30 minutes or more after the decision for cesarean is made.
Although Case 1 is complicated by FHR abnormalities, the association between such abnormalities and adverse long-term outcomes in neonates is questionable. Fewer than 1% of cases involving late decelerations or decreased variability during labor lead to cerebral palsy,5 highlighting the weak association between FHR abnormalities and neurologic sequelae. Most adverse neurologic neonatal outcomes are multifactorial in nature and may not be attributable to a single prenatal event.
With such limitations, the application and use of the 30-minute “standard” by hospitals, professional societies, and the medicolegal community may not be appropriate. The literature may not justify using this arbitrary rule as the standard of care. Clearly, there are gaps in our knowledge and understanding of FHR abnormalities and the optimal interval for cesarean delivery. Therefore, it may be unfair and inappropriate to group all cases and clinical situations together.
CASE 2: 25 minutes from decision to preterm delivery
J. P. (G2P1) undergoes an ultrasonographic examination at 33.4 weeks’ gestation because of concern about a discrepancy between fetal size and gestational age. The estimated fetal weight is in the 5th percentile. Amniotic fluid level is normal, but the biophysical profile is 6/8, with no breathing for 30 seconds. Umbilical artery Doppler imaging reveals absent end-diastolic flow, and FHR monitoring reveals repetitive late decelerations.
The patient is admitted immediately to the labor and delivery unit and placed on continuous electronic fetal monitoring. Betamethasone is given to enhance fetal lung maturity. FHR monitoring continues to show repetitive late decelerations with every contraction.
After 10 minutes on the labor floor, a decision is made to proceed to emergent cesarean delivery. Within 25 minutes of that decision, a female infant weighing 1,731 g (3rd percentile) is delivered, with Apgar scores of 1, 1, and 4 at 1, 5, and 10 minutes, respectively. The infant is eventually diagnosed with moderate cerebral palsy.
Could this outcome have been prevented?
Published reports on the association between abnormal FHR patterns and adverse perinatal outcomes in preterm infants are even more scarce than they are for infants delivered at term. Case 2 highlights the fact that achievement of a 30-minute interval from decision to delivery doesn’t necessarily eliminate the risk of adverse neonatal outcomes and long-term morbidity.
One of the best evaluations of this association was published by Shy and colleagues in the 1980s.6 In that study, investigators randomly assigned 173 preterm infants to intermittent auscultation or continuous external fetal monitoring. Use of external fetal monitoring did not improve neurologic outcomes at 18 months of age. Nor did the duration of FHR abnormalities predict the development of cerebral palsy.6
A recent secondary analysis from a randomized trial evaluating the use of antenatal magnesium sulfate to prevent cerebral palsy revealed that preterm FHR patterns labeled as “fetal distress” by the treating physician were associated with an increased risk of cerebral palsy in the newborn.7 Although this analysis revealed an association, a causal link could not be established. Damage to a preterm infant’s central nervous system can occur before the mother presents to the ultrasound unit or clinic, and alterations to FHR patterns can reflect previous injury. In such cases, a short decision to incision interval would not prevent damage to the central nervous system of the preterm infant.
CASE 3: 5 minutes from decision to incision after uterine rupture
G. P. is a patient (G2P1) at 38 weeks’ gestation who has had a previous low uterine transverse cesarean delivery. She strongly wishes to attempt vaginal birth after cesarean (VBAC) and has been extensively counseled about the risks and benefits of this approach. This counseling has been appropriately documented in her chart. Her predicted likelihood of success is 54%.
Upon arrival in the triage unit, she reiterates that she hopes to deliver her child vaginally. Upon examination, she is found to be dilated to 4 cm. She is admitted to the labor and delivery unit, with reevaluation planned 2 hours after epidural administration. At that time, her labor is noted to be progressing at an appropriate rate.
After 5 hours of labor, the baseline FHR drops into the 70s. Immediate evaluation reveals significant uterine bleeding, with the fetus no longer engaged in the pelvis. The attending physician immediately suspects uterine rupture.
The patient is rushed to the OR, and delivery is complicated by the presence of extensive adhesions to the uterus and anterior abdominal wall. After 20 minutes, a female infant is delivered, with Apgar scores of 0, 0, and 1 at 1, 5, and 10 minutes, respectively. Medical care is withdrawn after 3 days in the NICU.
In a true obstetric catastrophe such as uterine rupture, should the decision to incision interval be 30 minutes?
Although it is rare, uterine rupture is a known complication of VBAC attempts. The actual rate varies across the literature but appears to be approximately 0.5% to 0.9% in women attempting vaginal birth after a prior lower uterine incision.8
If uterine rupture develops, both mother and fetus are at increased risk of morbidity and mortality. The risk of hypoxic ischemic encephalopathy after uterine rupture is about 6.2% (95% confidence interval [CI], 1.8–10.6), and the risk of neonatal death is about 1.8% (95% CI, 0–4.2).9 Uterine rupture also has been linked to an increase in:
- severe postpartum hemorrhage (odds ratio [OR], 8.51; 95% CI, 4.6–15.1)
- general anesthesia exposure (OR, 14.20; 95% CI, 9.1–22.2)
- hysterectomy (OR, 51.36; 95% CI, 13.6–193.4)
- serious perinatal outcome (OR, 24.51; 95% CI, 11.9–51.9).10
- serious perinatal outcome (OR, 24.51; 95% CI, 11.9–51.9).
Case 3 again highlights the limitations and difficulties of encompassing all cases within a 30-minute timeframe. Although the newborn was delivered within this interval after the initial insult, the intervention was insufficient to prevent severe and long-term damage.
In cases of true obstetric emergency, the catastrophic nature of the event may lead to adverse long-term neonatal outcomes even if the standard of care is met. Immediate delivery still may not allow for the prevention of neurologic morbidity in the fetus. When evaluating such cases retrospectively, all parties involved always should consider these facts before drawing any conclusions on causality and prevention.
CASE 4: Twins delivered 20 minutes after cesarean decision
P. R. (G1P0) presents for routine prenatal care at 36 weeks’ gestation. She is carrying a dichorionic/diamniotic twin gestation that so far has been uncomplicated. She has been experiencing contractions for the past 2 weeks, but they have intensified during the past 2 days. When an examination reveals that she is dilated to 4 cm, she is admitted to the labor and delivery unit.
Both fetuses are evaluated via external FHR monitoring. Initially, both have Category 1 tracings but, approximately 1 hour later, both tracings are noted to have minimal variability with variable decelerations, with a nadir at 80 bpm that lasts 30 to 45 seconds. These abnormalities persist even after intrauterine resuscitation is attempted. The cervix remains dilated at 4 cm.
After a Category 2 tracing persists for 1 hour, the attending physician proceeds to cesarean delivery. Both infants are delivered within 20 minutes after the decision is made. Two female infants of appropriate gestational size are delivered, with Apgar scores of 7 and 8 for Twin A and 8 and 9 for Twin B. The newborns eventually are discharged home with the mother. Twin B is subsequently given a diagnosis of cerebral palsy.
Should the decision to incision rule be applied to twin gestations?
Multifetal gestations carry an increased risk not only of fetal and neonatal death but also of handicap among survivors, compared with singleton pregnancies.11 The literature evaluating the link between abnormal FHR patterns and adverse neonatal outcomes in twin pregnancies is sparse. Adding to the confusion is the fact that signal loss from fetal monitoring during labor occurs more frequently in twins than in singletons, with a reported incidence of 26% to 33% during the 1st stage of labor and 41% to 63% during the 2nd stage.12 Moreover, the FHR pattern of one twin may be recorded twice inadvertently and the same tracing erroneously attributed to both twins.
The decision to incision and delivery time in twin gestations should be evaluated in the context of all the limitations the clinician faces when managing labor in a twin gestation. The 30-minute rule never has been specifically evaluated in the context of multifetal gestations. The pathway and contributing factors that lead to adverse neonatal outcomes in twin gestations may be very different from those related to singleton pregnancies and may be more relevant to antepartum than intrapartum events.
Take-home message
The 4 cases presented here call into question the applicability and generalizability of the 30-minute decision to incision rule. Diverse clinical situations encountered in practice should lead to different interpretations of this standard. No single rule can encompass all possible scenarios; therefore, a single rule should not be touted as universal. All clinical variables should be weighed and interpreted in the retrospective evaluation of a case involving a cesarean delivery performed after a 30-minute decision to incision interval.
Share your thoughts! Send your Letter to the Editor to [email protected]. Please include your name and the city and state in which you practice.
- Chauhan SP, Magann EF, Scott JR, Scardo JA, Hendrix NW, Martin JN Jr. Cesarean delivery for fetal distress: rate and risk factors. Obstet Gynecol Surv. 2003;58(5):337–350.
- American College of Obstetricians and Gynecologists, Committee on Professional Standards. Standards for Obstetric-Gynecologic Hospital Services. 7th ed. Washington, DC: ACOG; 1989.
- National Institute for Health and Care Excellence. Caesarean Section Guideline. London, UK: NICE; 2011.
- Tolcher MC, Johnson RL, El-Nashar SA, West CP. Decision-to-incision time and neonatal outcomes: a systematic review and meta-analysis. Obstet Gynecol. 2014;123(3):536–548.
- Nelson KB, Dambrosia JM, Ting TY, Grether JK. Uncertain values of electronic fetal monitoring in predicting cerebral palsy. N Engl J Med. 1996;334(10):613–618.
- Shy KK, Luthy DA, Bennett FC, et al. Effects of electronic fetal heart-rate monitoring, as compared with periodic auscultation, on the neurologic development of premature infants. N Engl J Med. 1990;322(9):588–593.
- Mendez-Figueroa H, Chauhan SP, Pedroza C, Refuerzo JS, Dahlke JD, Rouse DJ. Preterm cesarean delivery for nonreassuring fetal heart rate: neonatal and neurologic morbidity. Obstet Gynecol. 2015;125(3):636–642.
- Macones GA, Cahill AG, Samilio DM, Odibo A, Peipert J, Stevens EJ. Can uterine rupture in patients attempting vaginal birth after cesarean delivery be predicted? Am J Obstet Gynecol. 2006;195(4):1148–1152.
- Landon MB, Hauth JC, Leveno KJ, et al. Maternal and perinatal outcomes associated with a trial of labor after prior cesarean delivery. N Engl J Med. 2004;351(25):2581–2589.
- Al-Zirqi I, Stray-Pedersen B, Forsen L, Daltveit AK, Vangen S. Uterine rupture: trends over 40 years [published online ahead of print April 2, 2015]. BJOG. doi: 10.1111/1471-0528.13394.
- Ramsey PS, Repke JT. Intrapartum management of multifetal pregnancies. Semin Perinatol. 2003;27(1):54–72.
- Bakker PC, Colenbrander GJ, Verstraeten AA, Van Geijn HP. Quality of intrapartum cardiotocography in twin deliveries. Am J Obstet Gynecol. 2004;191(6):2114–2119.
In this Article
- Is the 30-minute rule valid?
- A case of uterine rupture
- Take-home message
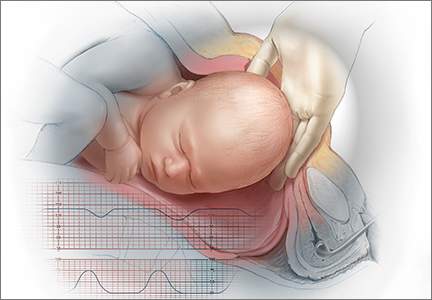
Managing Dyspepsia
Each year, an estimated 25% to 30% of the US population experiences dyspepsia.1 Most self-treat with home remedies and OTC products, while others seek medical care. Dyspepsia accounts for an estimated 2% to 5% of primary care visits annually,2 mostly by patients who are found to have no organic, or structural, cause for their symptoms.1,3
Such patients are said to have functional dyspepsia (FD), a category that applies to about two-thirds of those with dyspepsia.1 A small number of cases are categorized as organic dyspepsia, indicating the presence of a clear structural or anatomic cause, such as an ulcer or mass. The remainder are said to have undifferentiated dyspepsia, which simply means that their signs and symptoms do not rise to the level for which further investigation is warranted, and thus it is not known whether the dyspepsia is functional or organic.
There are many possible causes of FD—ranging from medications3,4 to abnormal gastroduodenal motility5,6 to Helicobacter pylori infection7—and a comprehensive differential diagnosis. The first step in an investigation is to rule out red flags suggestive of gastrointestinal (GI) cancer or other serious disorders.
Patients with FD, like the vast majority of those treated in a primary care setting, experience significant morbidity. Most have chronic symptoms, with intermittent flare-ups interspersed with periods of remission.8 This article and the dyspepsia treatment algorithm5,7-12 describe an evidence-based patient management approach.
SYMPTOMS AND CAUSES: WHAT TO LOOK FOR
The primary symptoms of dyspepsia include bothersome postprandial fullness, early satiety, and epigastric pain and burning. To meet the Rome criteria for dyspepsia, these symptoms must have been present for the last three months and have had an onset ≥ 6 months prior to diagnosis.2 Recurrent belching and nausea are also common but are not included in the Rome diagnostic criteria.
Symptom severity is a poor predictor of the seriousness of the condition, however, and more intense symptoms are no more likely than milder cases to have an organic cause.13,14 Indeed, anxiety is a common comorbidity in patients with FD and a risk factor for the diagnosis. Compared with the general public, patients with FD have been found to have higher levels of anxiety, chronic tension, hostility, and hypochondriasis, as well as a tendency to be more pessimistic.15
Possible causes of FD While the etiology of organic dyspepsia is clear, the cause of FD is often far more difficult to determine.
Medication use should always be considered, as many types of drugs—including bisphosphonates, antibiotics, narcotics, steroids, iron, metformin, and NSAIDs—are associated with dyspepsia.3,4
Gastroduodenal motility and accommodation, which has been found in numerous studies of patients with FD, is a proposed etiology.5,6
Visceral hypersensitivity also appears to play a role. In one study of patients with severe dyspepsia, 87% of those with FD had a reduced or altered GI pain threshold, compared with 20% of those with organic dyspepsia.16
H pylori, commonly linked to peptic ulcer disease (PUD), is also associated with both organic dyspepsia and FD.17,18 The gram-negative rod-shaped bacterium is present in approximately half of the population worldwide but is more common in developing nations.7H pylori immunoglobulin G (IgG) is more prevalent in patients with dyspepsia, particularly in those younger than 30. The exact mechanism by which H pylori causes nonulcerative dyspepsia is not clear, but inflammation, dysmotility, visceral hypersensitivity, and alteration of acid secretion have all been proposed.17
Dysfunctional intestinal epithelium is increasingly being considered in the pathophysiology of dyspepsia, among other conditions. Researchers theorize that certain foods, toxins, infections, and/or other stressors lead to changes in the structure and function of tight junctions, resulting in increased intestinal permeability.19 This in turn is thought to allow the outflow of antigens through the leaky epithelium and to stimulate an immune response—a process that may play a role in the increased GI inflammation or hypersensitivity associated with dyspepsia.
The “leaky gut” theory may eventually lead to new ways to treat dyspepsia. But thus far, high-quality evidence of the efficacy of treatments aimed at this mechanism is lacking.
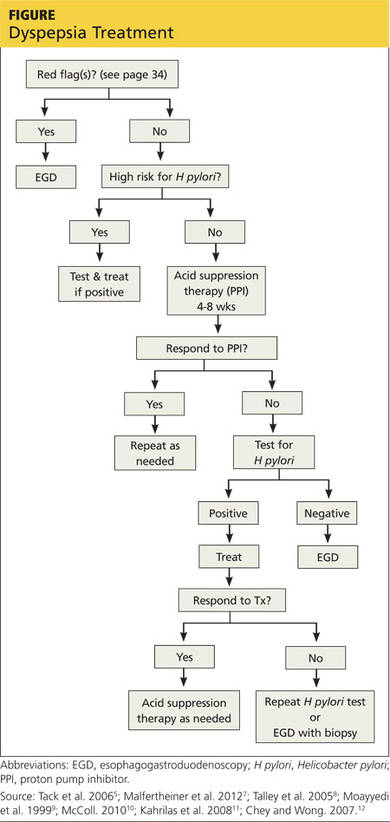
A range of disorders included in the differential
The primary differential diagnosis for dyspepsia includes gastroesophageal reflux disease (GERD), esophagitis, chronic PUD (including both gastric and duodenal ulcers), and malignancy. The differential may also include biliary disorder, pancreatitis, hepatitis, or other liver disease; chronic abdominal wall pain, irritable bowel syndrome, motility disorders, or infiltrative diseases of the stomach (eosinophilic gastritis, Crohn disease, sarcoidosis); celiac disease and food sensitivities/allergies, including gluten, lactose, and other intolerances; cardiac disease, including acute coronary syndrome, myocardial infarction, and arrhythmias; intestinal angina; small intestine bacterial overgrowth; heavy metal toxicity; and hypercalcemia.8
Ulcers are found in approximately 10% of patients undergoing evaluation for dyspepsia.8 Previously, PUD was almost exclusively due to H pylori infection. In developed countries, however, chronic use of NSAIDs, including aspirin, has increased and is now responsible for most ulcer diseases.20,21
The combination of H pylori infection and NSAID usage appears to be synergistic, with the risk for uncomplicated PUD estimated to be 17.5 times higher among those who test positive for H pylori and take NSAIDs versus a three- to four-fold increase in ulcer incidence among those with just one of these risk factors.22
Continue for the workup starts with a search for red flags >>
THE WORKUP STARTS WITH A SEARCH FOR RED FLAGS
Evaluation of a patient with dyspepsia begins with a thorough history. Start by determining whether the patient has any red flags, or alarm features, that may be associated with a more serious condition—particularly an underlying malignancy. One or more of the following is an indication for an esophagogastroduodenoscopy (EGD)5,8,12
• Family and/or personal history of upper GI cancer
• Unintended weight loss
• GI bleeding
• Progressive dysphagia
• Unexplained iron-deficiency anemia
• Persistent vomiting
• Palpable mass or lymphadenopathy
• Jaundice.
While it is important to rule out these red flags, they are poor predictors of malignancy.23,24 With the exception of a single study, their positive predictive value was a mere 1%.8 Their usefulness lies in their ability to exclude malignancy, however; when none of these features is present, the negative predictive value for malignancy is > 97%.8
Age is also a risk factor. In addition to red flags, EGD is recommended by the American Gastroenterological Association (AGA) for patients with new-onset dyspepsia who are 55 or older—an age at which upper GI malignancy becomes more common. A repeat EGD is rarely indicated, unless Barrett esophagus or severe erosive esophagitis is found on the initial EGD.25
Physical exam, H pylori evaluation follow
A physical examination of all patients presenting with symptoms suggestive of dyspepsia is crucial. While the exam is usually normal, it may reveal epigastric tenderness on abdominal palpation. Rebound tenderness, guarding, or evidence of other abnormalities should raise the prospect of alternative diagnoses. GERD, for example, has many symptoms in common with dyspepsia but is a more likely diagnosis in a patient who has retrosternal burning discomfort and regurgitation and reports that symptoms worsen at night and when lying down.
Lab work has limited value. Although laboratory work is not specifically addressed in the AGA guidelines (except for H pylori testing), a complete blood count is a reasonable part of an initial evaluation of dyspepsia to check for anemia. Other routine blood work is not needed, but further lab testing may be warranted based on the history, exam, and differential diagnosis.
H pylori risk. Because of the association between dyspepsia and H pylori, evaluating the patient’s risk for infection with this bacterium, based primarily on his or her current and previous living conditions (see Table 1),9 is the next step. Although a test for H pylori could be included in the initial work-up of all patients with dyspepsia, a better—and more cost-effective—strategy is to initially test only those at high risk. (Testing and treating H pylori will be explored further.)
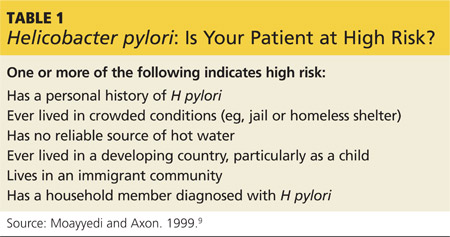
INITIATE ACID SUPPRESSION THERAPY FOR LOW-RISK PATIENTS
Firstline treatment for patients with dyspepsia who have no red flags for malignancy or other serious conditions, and either are not at high risk for H pylori or are at high risk but have tested negative, is a four- to eight-week course of acid suppression therapy. Patients at low risk for H pylori should be tested for the bacterium only if therapy fails to alleviate their symptoms.9
H2RAs or PPIs? A look at the evidence
In a Cochrane review, both H2 receptor antagonists (H2RAs) and proton pump inhibitors (PPIs) were significantly more effective than placebo for treating FD.26 However, H2RAs can lead to tachyphylaxis—an acute decrease in response to a drug—within two to six weeks, thus limiting their long-term efficacy.27
PPIs appear to be more effective than H2RAs and are the AGA’s acid suppression drug of choice.11 The CADET study, a randomized controlled trial comparing PPIs (omeprazole 20 mg/d) with an H2RA (ranitidine 150 mg bid) and a prokinetic agent (cisapride 20 mg bid) as well as placebo for dyspepsia, found the PPI to be superior to the H2RA at six months.28 In a systematic review, the number needed to treat with PPI therapy for improvement of dyspepsia symptoms was 9.29
There is no specified time limit for the use of PPIs. AGA guidelines recommend that patients who respond to initial therapy stop treatment after four to eight weeks.11 If symptoms recur, another course of the same treatment is justified; if necessary, therapy can continue long term. However, patients should be made aware of the risk for vitamin deficiency, osteoporosis, and fracture, as well as arrhythmias, Clostridium difficile infection, and rebound upon abrupt discontinuation of PPIs.
Continue for when to test for H pylori ... >>
WHEN TO TEST FOR H PYLORI ...
Empiric treatment for H pylori is not recommended. Thus, testing is indicated for patients who have risk factors for the bacterium or who fail to respond to acid suppression therapy. There are various ways to test for H pylori. Which test you choose depends, in part, on patient-specific factors.
Serology. IgG serology testing is extremely useful in patients who have never been diagnosed with H pylori. It is best suited for those who are currently taking PPIs or who recently completed a course of antibiotics, since neither medication affects the results of the serology test.
Serology testing should not be used, however, for any patient who was previously diagnosed with or treated for H pylori, because this type of test cannot distinguish between active and past infection. The IgG serology test has a sensitivity of 87% and a specificity of 67%.30
Stool antigen. Stool tests using monoclonal antibodies to detect the presence of H pylori have a sensitivity of 87% to 92% and a specificity of 70%. Stool antigen is also an excellent post-treatment test to confirm that H pylori has been eradicated.31
Stool testing has some drawbacks, however. PPIs can decrease the sensitivity and should be discontinued at least two weeks prior to stool testing.32 In addition, a stool test for H pylori is not accurate if the patient has an acute GI bleed.
Urea breath testing. This is the most sensitive and specific test for active H pylori infection (90%-96% sensitivity and 88%-96% specificity).33 PPIs can lower the sensitivity of the test, however, and are typically discontinued at least two weeks prior to testing. Urea breath testing, like stool testing, is an excellent way to confirm that H pylori has been eradicated after treatment. However, it is more expensive than other tests for H pylori and often inconvenient to obtain.13
An EGD is indicated for a patient who has failed to respond to acid suppression therapy and has a negative serology, stool antigen, or urea breath test for H pylori.
Biopsy-based testing for H pylori is performed with EGD and is therefore reserved for patients who have red flags or other indications of a need for invasive testing. There are three types of biopsy-based tests: urease (sensitivity, 70%-90% and specificity, 95%); histology (87%-92% and 70%, respectively); and culture (85%-88% and 69%, respectively). Overall, the specificity is slightly better than that of noninvasive testing, but the sensitivity can be lowered by recent use of PPIs, bismuth, or antibiotics.12,34
Continue for how to treat it >>
... AND HOW TO TREAT IT
H pylori infection is associated with an increased risk for noncardiac gastric adenocarcinoma, but a decreased risk for cardiac gastric adenocarcinoma and esophageal adenocarcinoma.35,36 Thus, the potential to reduce the risk for gastric cancer is not considered an indication for H pylori treatment. The possibility of improving dyspepsia symptoms is a reason to treat H pylori infection, although eradicating it does not always do so.
In a 2006 Cochrane Review, treating H pylori had a small but statistically significant benefit for patients with FD (NNT = 14).37 A 2011 study on the effects of H pylori eradication on symptoms and quality of life in primary care patients with FD revealed a 12.5% improvement in quality of life and a 10.6% improvement in symptoms.38
The triple-therapy regimen (a PPI + amoxicillin + clarithromycin) is the most common firstline H pylori treatment in the US and a good initial choice in regions in which clarithromycin resistance is low (see Table 2).39-44 The standard duration is seven days.
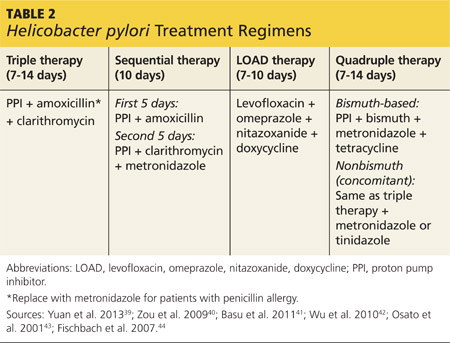
A 2013 Cochrane Review showed that a longer duration (14 days) increased the rate of eradication (82% vs 73%), but this remains controversial.39 The addition of bismuth subsalicylate to the triple-therapy regimen has been shown to increase the eradication rate of H pylori by approximately 10%.45 Adding probiotics (saccharomyces or lactobacillus) appears to increase eradication rates, as well.40
Sequential therapy consists of a five-day course of treatment in which a PPI and amoxicillin are taken twice a day, followed by another five-day course of a PPI, clarithromycin, and metronidazole. A recent meta-analysis of sequential therapy showed that it is superior to seven-day triple therapy but equivalent to 14-day triple therapy.40
LOAD (levofloxacin, omeprazole, nitazoxanide, and doxycycline) therapy for seven to 10 days can be used in place of triple therapy in areas of high resistance or for persistent H pylori. In one study, the H pylori eradication rate for a seven-day course of LOAD therapy—levofloxacin and doxycycline taken once a day, omeprazole before breakfast, and nitazoxanide twice daily—was 90% (vs 73.3% for a seven-day course of triple therapy).41
Quadruple therapy has two variations: bismuth-based and nonbismuth (concomitant) therapy. The latter uses the base triple therapy and adds either metronidazole or tinidazole for seven to 14 days. In a multicenter randomized trial, this concomitant therapy was found to have similar efficacy to sequential therapy.42
Bismuth-based quad therapy includes a PPI, bismuth, metronidazole, and tetracycline. A meta-analysis found it to have a higher rate of eradication than triple therapy for patients with antibiotic resistance.43,44
For persistent H pylori, a PPI, levofloxacin, and amoxicillin for 10 days has been shown to be more effective and better tolerated than quadruple therapy.12
Confirmation is indicated when symptoms persist
If dyspepsia symptoms persist after H pylori treatment, it is reasonable to retest to confirm that the infection has in fact been eradicated. Confirmation is also indicated if the patient has an H pylori-associated ulcer or a prior history of gastric cancer.
Retesting should be performed at least four to six weeks after treatment is completed. If H pylori has not been eradicated, you can try another regimen. If retesting confirms eradication and symptoms persist, EGD with biopsy is indicated. Although EGD typically has a very low yield, even for patients with red flags, this invasive test often provides reassurance and increased satisfaction for patients with persistent symptoms.46
Continue for more options for challenging cases >>
MORE OPTIONS FOR CHALLENGING CASES
Managing FD is challenging when both initial acid suppression therapy and H pylori eradication fail. Unproven but low-risk treatments include modification of eating habits (eg, eating slower, not gulping food), reducing stress, discontinuing medications that may be related to symptoms, avoiding foods that seem to exacerbate symptoms, and cutting down or eliminating tobacco, caffeine, alcohol, and carbonated beverages.8 Bismuth salts have been shown to be superior to placebo for the treatment of dyspepsia.25 Small studies have also demonstrated a favorable risk–benefit ratio for peppermint oil and caraway oil for the treatment of FD.47 Prokinetics have shown efficacy compared with placebo, although a Cochrane review questioned their efficacy based on publication bias.26
There is no good evidence of efficacy for OTC antacids or for GI “cocktails” (antacid, antispasmodic, and lidocaine), sucralfate, psychologic interventions (eg, cognitive behavioral therapy, relaxation therapy, or hypnosis), or antidepressants.48,49 Several recent randomized controlled trials have shown the efficacy of acupuncture for the treatment of dyspepsia.49,50 Ginger may also be helpful; it has been found to help with nausea in other GI conditions, but it’s uncertain whether it can help patients with dyspepsia.51
REFERENCES
1. Shaib Y, El-Serag HB. The prevalence and risk factors of functional dyspepsia in a multiethnic population in the United States. Am J Gastroenterol. 2004;99:2210-2216.
2. Talley NJ. Dyspepsia: management guidelines for the millennium. Gut. 2002;50(suppl 4):iv72–iv78.
3. Harmon RC, Peura DA. Evaluation and management of dyspepsia. Therap Adv Gastroenterol. 2010;3:87-98.
4. Bazaldua OV, Schneider FD. Evaluation and management of dyspepsia. Am Fam Physician. 1999;60:1773-1784.
5. Tack J, Talley NJ, Camilleri M, et al. Functional gastroduodenal disorders. Gastroenterology. 2006;130:1466-1479.
6. Haag S, Talley NJ, Holtmann G. Symptom patterns in functional dyspepsia and irritable bowel syndrome: relationship to disturbances in gastric emptying and response to a nutrient challenge in consulters and non-consulters. Gut. 2004;53:1445-1451.
7. Malfertheiner P, Megraud F, O’Morain CA, et al; European Helicobacter Study Group. Management of Helicobacter pylori infection—the Maastricht IV/Florence Consensus Report. Gut. 2012;61:646-664.
8. Talley NJ, Vakil NB, Moayyedi P. American Gastroenterological Association technical review on the evaluation of dyspepsia. Gastroenterology. 2005;129:1756-1780.
9. Moayyedi P, Axon AT. The usefulness of the likelhood ratio in the diagnosis of dyspepsia and gastroesophageal reflux disease. Am J Gastroenterol. 1999;94:3122-3125.
10. McColl KE. Clinical practice. Helicobacter pylori infection. N Engl J Med. 2010;362:1597-1604.
11. Kahrilas PJ, Shaheen NJ, Vaezi MF, et al; American Gastroenterological Association. American Gastroenterological Association Medical Position Statement on the management of gastroesophageal reflux disease. Gastroenterology. 2008;135:1383-1391.
12. Chey WD, Wong BC; Practice Parameters Committee of the American College of Gastroenterology. American College of Gastroenterology guideline on the management of Helicobacter pylori infection. Am J Gastroenterol. 2007;102:1808-1825.
13. Moayyedi P, Talley NJ, Fennerty MB, et al. Can the clinical history distinguish between organic and functional dyspepsia? JAMA. 2006;295:1566-1576.
14. Eslick GD, Howell SC, Hammer J, et al. Empirically derived symptom sub-groups correspond poorly with diagnostic criteria for functional dyspepsia and irritable bowel syndrome. A factor and cluster analysis of a patient sample. Aliment Pharmacol Ther. 2004;19:133-140.
15. Aro P, Talley NJ, Ronkainen J, et al. Anxiety is associated with uninvestigated and functional dyspepsia (Rome III criteria) in a Swedish population-based study. Gastroenterology. 2009;137:94-100.
16. Mertz H, Fullerton S, Naliboff B, et al. Symptoms and visceral perception in severe functional and organic dyspepsia. Gut. 1998;42:814-822.
17. O’Morain C. Role of Helicobacter pylori in functional dyspepsia. World J Gastroenterol. 2006;12:2677-2680.
18. Shmuely H, Obure S, Passaro DJ, et al. Dyspepsia symptoms and Helicobacter pylori infection, Nakuru, Kenya. Emerg Infect Dis. 2003;9:1103-1107.
19. Barbara G, Zecchi L, Barbaro R, et al. Mucosal permeability and immune activation as potential therapeutic targets of probiotics in irritable bowel syndrome. J Clin Gastroenterol. 2012;46(suppl):S52-S55.
20. Liu NJ, Lee CS, Tang JH, et al. Outcomes of bleeding peptic ulcers: a prospective study. J Gastroenterol Hepatol. 2008;23:e340-e347.
21. Ramsoekh D, van Leerdam ME, Rauws EA, et al. Outcome of peptic ulcer bleeding, nonsteroidal anti-inflammatory drug use, and Helicobacter pylori infection. Clin Gastroenterol Hepatol. 2005;3:859-864.
22. Papatheodoridis GV, Sougioultzis S, Archimandritis AJ. Effects of Helicobacter pylori and nonsteroidal anti-inflammatory drugs on peptic ulcer disease: a systematic review. Clin Gastroenterol Hepatol. 2006;4:130-142.
23. Bai Y, Li ZS, Zou DW, et al. Alarm features and age for predicting upper gastrointestinal malignancy in Chinese patients with dyspepsia with high background prevalence of Helicobacter pylori infection and upper gastrointestinal malignancy: an endoscopic database review of 102,665 patients from 1996 to 2006. Gut. 2010;59:722-728.
24. Vakil N. Dyspepsia, peptic ulcer, and H pylori: a remembrance of things past. Am J Gastroenterol. 2010;105:572-574.
25. Shaheen NJ, Weinberg DS, Denberg TD, et al; Clinical Guidelines Committee of the American College of Physicians. Upper endoscopy for gastroesophageal reflux disease: best practice advice from the clinical guidelines committee of the American College of Physicians. Ann Intern Med. 2012;157:808-816.
26. Moayyedi P, Soo S, Deeks J, et al. Pharmacological interventions for non-ulcer dyspepsia. Cochrane Database Syst Rev. 2006;(4):CD001960.
27. Chiu CT, Hsu CM, Wang CC, et al. Randomised clinical trial: sodium alginate oral suspension is non-inferior to omeprazole in the treatment of patients with non-erosive gastroesophageal disease. Aliment Pharmacol Ther. 2013;38:1054-1064.
28. Veldhuyzen van Zanten SJ, Chiba N, Armstrong D, et al. A randomized trial comparing omeprazole, ranitidine, cisapride, or placebo in helicobacter pylori negative, primary care patients with dyspepsia: the CADET-HN Study. Am J Gastroenterol. 2005;100:1477-1488.
29. Moayyedi P, Delaney BC, Vakil N, et al. The efficacy of proton pump inhibitors in nonulcer dyspepsia: a systematic review and economic analysis. Gastroenterology. 2004;127:1329-1337.
30. Garza-González E, Bosques-Padilla FJ, Tijerina-Menchaca R, et al. Comparison of Helicobacter pylori. Can J Gastroenterol. 2003;17:101-106.
31. Kodama M, Murakami K, Okimoto T, et al. Influence of proton pump inhibitor treatment on Helicobacter pylori stool antigen test. World J Gastroenterol. 2012;18:44-48.
32. Shimoyama T. Stool antigen tests for the management of Helicobacter pylori infection. World J Gastroenterol. 2013;19:8188-8191.
33. Howden CW, Hunt RH. Guidelines for the management of Helicobacter pylori infection. Ad Hoc Committee on Practice Parameters of the American College of Gastroenterology. Am J Gastroenterol. 1998;93:2330-2338.
34. Gisbert J, Abraira V. Accuracy of Helicobacter pylori diagnostic tests in patients with bleeding peptic ulcer: a systematic review and meta-analysis. Am J Gastroenterol. 2006;101:848-863.
35. Kamangar F, Dawsey SM, Blaser MJ, et al. Opposing risks of gastric cardiac and noncardia gastric adenocarcinomas associated with Helicobacter pylori seropositivity. J Natl Cancer Inst. 2006;98:1445-1452.
36. Islami F, Kamangar F. Helicobacter pylori and esophageal cancer risk: a meta-analysis. Cancer Prevent Res (Phila). 2008;1:329-338.
37. Moayyedi P, Soo S, Deeks J, et al. Eradication of Helicobacter pylori for non-ulcer dyspepsia. Cochrane Database Syst Rev. 2006;(2):CD002096.
38. Mazzoleni LE, Sander GB, Francesconi CF, et al. Helicobacter pylori eradication in functional dyspepsia: HEROES trial. Arch Intern Med. 2011;171:1929-1936.
39. Yuan Y, Ford AC, Khan KJ, et al. Optimum duration of regimens for Helicobacter pylori eradication. Cochrane Database Syst Rev. 2013;(12): CD008337.
40. Zou J, Dong J, Yu X. Meta-analysis: Lactobacillus containing quadruple therapy versus standard triple first-line therapy for Helicobacter pylori eradication. Helicobacter. 2009;14:97-107.
41. Basu PP, Rayapudi K, Pacana T, et al. A randomized study comparing levofloxacin, omeprazole, nitazoxanide, and doxycycline versus triple therapy for the eradication of Helicobacter pylori. Am J Gastroenterol. 2011;106:1970-1975.
42. Wu DC, Hsu PI, Wu JY, et al. Sequential and concomitant therapy with 4 drugs are equally effective for eradication of H pylori infection. Clin Gastroenterol Hepatol. 2010;8:36–41.
43. Osato R, Reddy R, Reddy SG, et al. Pattern of primary resistance of Helicobacter pylori to metronidazole or clarithromycin in the United States. Arch Intern Med. 2001;161:1217-1220.
44. Fischbach L, Evans EL. Meta-analysis: the effect of antibiotic resistance status on the efficacy of triple and quadruple first-line therapies for Helicobacter pylori. Aliment Pharmacol Ther. 2007;26:343-357.
45. Hinostroza Morales D, Díaz Ferrer J. Addition of bismuth subsalicylate to triple eradication therapy for Helicobacter pylori infection: efficiency and adverse events. Rev Gastroenterol Peru. 2014;34:315-320.
46. Rabeneck L, Wristers K, Souchek J, et al. Impact of upper endoscopy on satisfaction in patients with previously uninvestigated dyspepsia. Gastrointest Endosc. 2003;57:295-299.
47. Hojo M, Miwa H, Yokoyama T, et al. Treatment of functional dyspepsia with antianxiety or antidepressive agents: systematic review. J Gastroenterol. 2005;40:1036-1042.
48. Soo S, Moayyedi P, Deeks J, et al. Psychological interventions for non-ulcer dyspepsia. Cochrane Database Syst Rev. 2005;(2):CD002301.
49. Lima FA, Ferreira LE, Pace FH. Acupuncture effectiveness as a complementary therapy in functional dyspepsia patients. Arq Gastroenterol. 2013;50:202-207.
50. Ma TT, Yu SY, Li Y, et al. Randomised clinical trial: an assessment of acupuncture on specific meridian or specific acupoint vs sham acupuncture for treating functional dyspepsia. Aliment Pharmacol Ther. 2012;35:552-561.
51. Koretz RL, Rotblatt M. Complementary and alternative medicine in gastroenterology: the good, the bad, and the ugly. Clin Gastroenterol Hepatol. 2004;2:957-967.
Each year, an estimated 25% to 30% of the US population experiences dyspepsia.1 Most self-treat with home remedies and OTC products, while others seek medical care. Dyspepsia accounts for an estimated 2% to 5% of primary care visits annually,2 mostly by patients who are found to have no organic, or structural, cause for their symptoms.1,3
Such patients are said to have functional dyspepsia (FD), a category that applies to about two-thirds of those with dyspepsia.1 A small number of cases are categorized as organic dyspepsia, indicating the presence of a clear structural or anatomic cause, such as an ulcer or mass. The remainder are said to have undifferentiated dyspepsia, which simply means that their signs and symptoms do not rise to the level for which further investigation is warranted, and thus it is not known whether the dyspepsia is functional or organic.
There are many possible causes of FD—ranging from medications3,4 to abnormal gastroduodenal motility5,6 to Helicobacter pylori infection7—and a comprehensive differential diagnosis. The first step in an investigation is to rule out red flags suggestive of gastrointestinal (GI) cancer or other serious disorders.
Patients with FD, like the vast majority of those treated in a primary care setting, experience significant morbidity. Most have chronic symptoms, with intermittent flare-ups interspersed with periods of remission.8 This article and the dyspepsia treatment algorithm5,7-12 describe an evidence-based patient management approach.
SYMPTOMS AND CAUSES: WHAT TO LOOK FOR
The primary symptoms of dyspepsia include bothersome postprandial fullness, early satiety, and epigastric pain and burning. To meet the Rome criteria for dyspepsia, these symptoms must have been present for the last three months and have had an onset ≥ 6 months prior to diagnosis.2 Recurrent belching and nausea are also common but are not included in the Rome diagnostic criteria.
Symptom severity is a poor predictor of the seriousness of the condition, however, and more intense symptoms are no more likely than milder cases to have an organic cause.13,14 Indeed, anxiety is a common comorbidity in patients with FD and a risk factor for the diagnosis. Compared with the general public, patients with FD have been found to have higher levels of anxiety, chronic tension, hostility, and hypochondriasis, as well as a tendency to be more pessimistic.15
Possible causes of FD While the etiology of organic dyspepsia is clear, the cause of FD is often far more difficult to determine.
Medication use should always be considered, as many types of drugs—including bisphosphonates, antibiotics, narcotics, steroids, iron, metformin, and NSAIDs—are associated with dyspepsia.3,4
Gastroduodenal motility and accommodation, which has been found in numerous studies of patients with FD, is a proposed etiology.5,6
Visceral hypersensitivity also appears to play a role. In one study of patients with severe dyspepsia, 87% of those with FD had a reduced or altered GI pain threshold, compared with 20% of those with organic dyspepsia.16
H pylori, commonly linked to peptic ulcer disease (PUD), is also associated with both organic dyspepsia and FD.17,18 The gram-negative rod-shaped bacterium is present in approximately half of the population worldwide but is more common in developing nations.7H pylori immunoglobulin G (IgG) is more prevalent in patients with dyspepsia, particularly in those younger than 30. The exact mechanism by which H pylori causes nonulcerative dyspepsia is not clear, but inflammation, dysmotility, visceral hypersensitivity, and alteration of acid secretion have all been proposed.17
Dysfunctional intestinal epithelium is increasingly being considered in the pathophysiology of dyspepsia, among other conditions. Researchers theorize that certain foods, toxins, infections, and/or other stressors lead to changes in the structure and function of tight junctions, resulting in increased intestinal permeability.19 This in turn is thought to allow the outflow of antigens through the leaky epithelium and to stimulate an immune response—a process that may play a role in the increased GI inflammation or hypersensitivity associated with dyspepsia.
The “leaky gut” theory may eventually lead to new ways to treat dyspepsia. But thus far, high-quality evidence of the efficacy of treatments aimed at this mechanism is lacking.
A range of disorders included in the differential
The primary differential diagnosis for dyspepsia includes gastroesophageal reflux disease (GERD), esophagitis, chronic PUD (including both gastric and duodenal ulcers), and malignancy. The differential may also include biliary disorder, pancreatitis, hepatitis, or other liver disease; chronic abdominal wall pain, irritable bowel syndrome, motility disorders, or infiltrative diseases of the stomach (eosinophilic gastritis, Crohn disease, sarcoidosis); celiac disease and food sensitivities/allergies, including gluten, lactose, and other intolerances; cardiac disease, including acute coronary syndrome, myocardial infarction, and arrhythmias; intestinal angina; small intestine bacterial overgrowth; heavy metal toxicity; and hypercalcemia.8
Ulcers are found in approximately 10% of patients undergoing evaluation for dyspepsia.8 Previously, PUD was almost exclusively due to H pylori infection. In developed countries, however, chronic use of NSAIDs, including aspirin, has increased and is now responsible for most ulcer diseases.20,21
The combination of H pylori infection and NSAID usage appears to be synergistic, with the risk for uncomplicated PUD estimated to be 17.5 times higher among those who test positive for H pylori and take NSAIDs versus a three- to four-fold increase in ulcer incidence among those with just one of these risk factors.22
Continue for the workup starts with a search for red flags >>
THE WORKUP STARTS WITH A SEARCH FOR RED FLAGS
Evaluation of a patient with dyspepsia begins with a thorough history. Start by determining whether the patient has any red flags, or alarm features, that may be associated with a more serious condition—particularly an underlying malignancy. One or more of the following is an indication for an esophagogastroduodenoscopy (EGD)5,8,12
• Family and/or personal history of upper GI cancer
• Unintended weight loss
• GI bleeding
• Progressive dysphagia
• Unexplained iron-deficiency anemia
• Persistent vomiting
• Palpable mass or lymphadenopathy
• Jaundice.
While it is important to rule out these red flags, they are poor predictors of malignancy.23,24 With the exception of a single study, their positive predictive value was a mere 1%.8 Their usefulness lies in their ability to exclude malignancy, however; when none of these features is present, the negative predictive value for malignancy is > 97%.8
Age is also a risk factor. In addition to red flags, EGD is recommended by the American Gastroenterological Association (AGA) for patients with new-onset dyspepsia who are 55 or older—an age at which upper GI malignancy becomes more common. A repeat EGD is rarely indicated, unless Barrett esophagus or severe erosive esophagitis is found on the initial EGD.25
Physical exam, H pylori evaluation follow
A physical examination of all patients presenting with symptoms suggestive of dyspepsia is crucial. While the exam is usually normal, it may reveal epigastric tenderness on abdominal palpation. Rebound tenderness, guarding, or evidence of other abnormalities should raise the prospect of alternative diagnoses. GERD, for example, has many symptoms in common with dyspepsia but is a more likely diagnosis in a patient who has retrosternal burning discomfort and regurgitation and reports that symptoms worsen at night and when lying down.
Lab work has limited value. Although laboratory work is not specifically addressed in the AGA guidelines (except for H pylori testing), a complete blood count is a reasonable part of an initial evaluation of dyspepsia to check for anemia. Other routine blood work is not needed, but further lab testing may be warranted based on the history, exam, and differential diagnosis.
H pylori risk. Because of the association between dyspepsia and H pylori, evaluating the patient’s risk for infection with this bacterium, based primarily on his or her current and previous living conditions (see Table 1),9 is the next step. Although a test for H pylori could be included in the initial work-up of all patients with dyspepsia, a better—and more cost-effective—strategy is to initially test only those at high risk. (Testing and treating H pylori will be explored further.)
INITIATE ACID SUPPRESSION THERAPY FOR LOW-RISK PATIENTS
Firstline treatment for patients with dyspepsia who have no red flags for malignancy or other serious conditions, and either are not at high risk for H pylori or are at high risk but have tested negative, is a four- to eight-week course of acid suppression therapy. Patients at low risk for H pylori should be tested for the bacterium only if therapy fails to alleviate their symptoms.9
H2RAs or PPIs? A look at the evidence
In a Cochrane review, both H2 receptor antagonists (H2RAs) and proton pump inhibitors (PPIs) were significantly more effective than placebo for treating FD.26 However, H2RAs can lead to tachyphylaxis—an acute decrease in response to a drug—within two to six weeks, thus limiting their long-term efficacy.27
PPIs appear to be more effective than H2RAs and are the AGA’s acid suppression drug of choice.11 The CADET study, a randomized controlled trial comparing PPIs (omeprazole 20 mg/d) with an H2RA (ranitidine 150 mg bid) and a prokinetic agent (cisapride 20 mg bid) as well as placebo for dyspepsia, found the PPI to be superior to the H2RA at six months.28 In a systematic review, the number needed to treat with PPI therapy for improvement of dyspepsia symptoms was 9.29
There is no specified time limit for the use of PPIs. AGA guidelines recommend that patients who respond to initial therapy stop treatment after four to eight weeks.11 If symptoms recur, another course of the same treatment is justified; if necessary, therapy can continue long term. However, patients should be made aware of the risk for vitamin deficiency, osteoporosis, and fracture, as well as arrhythmias, Clostridium difficile infection, and rebound upon abrupt discontinuation of PPIs.
Continue for when to test for H pylori ... >>
WHEN TO TEST FOR H PYLORI ...
Empiric treatment for H pylori is not recommended. Thus, testing is indicated for patients who have risk factors for the bacterium or who fail to respond to acid suppression therapy. There are various ways to test for H pylori. Which test you choose depends, in part, on patient-specific factors.
Serology. IgG serology testing is extremely useful in patients who have never been diagnosed with H pylori. It is best suited for those who are currently taking PPIs or who recently completed a course of antibiotics, since neither medication affects the results of the serology test.
Serology testing should not be used, however, for any patient who was previously diagnosed with or treated for H pylori, because this type of test cannot distinguish between active and past infection. The IgG serology test has a sensitivity of 87% and a specificity of 67%.30
Stool antigen. Stool tests using monoclonal antibodies to detect the presence of H pylori have a sensitivity of 87% to 92% and a specificity of 70%. Stool antigen is also an excellent post-treatment test to confirm that H pylori has been eradicated.31
Stool testing has some drawbacks, however. PPIs can decrease the sensitivity and should be discontinued at least two weeks prior to stool testing.32 In addition, a stool test for H pylori is not accurate if the patient has an acute GI bleed.
Urea breath testing. This is the most sensitive and specific test for active H pylori infection (90%-96% sensitivity and 88%-96% specificity).33 PPIs can lower the sensitivity of the test, however, and are typically discontinued at least two weeks prior to testing. Urea breath testing, like stool testing, is an excellent way to confirm that H pylori has been eradicated after treatment. However, it is more expensive than other tests for H pylori and often inconvenient to obtain.13
An EGD is indicated for a patient who has failed to respond to acid suppression therapy and has a negative serology, stool antigen, or urea breath test for H pylori.
Biopsy-based testing for H pylori is performed with EGD and is therefore reserved for patients who have red flags or other indications of a need for invasive testing. There are three types of biopsy-based tests: urease (sensitivity, 70%-90% and specificity, 95%); histology (87%-92% and 70%, respectively); and culture (85%-88% and 69%, respectively). Overall, the specificity is slightly better than that of noninvasive testing, but the sensitivity can be lowered by recent use of PPIs, bismuth, or antibiotics.12,34
Continue for how to treat it >>
... AND HOW TO TREAT IT
H pylori infection is associated with an increased risk for noncardiac gastric adenocarcinoma, but a decreased risk for cardiac gastric adenocarcinoma and esophageal adenocarcinoma.35,36 Thus, the potential to reduce the risk for gastric cancer is not considered an indication for H pylori treatment. The possibility of improving dyspepsia symptoms is a reason to treat H pylori infection, although eradicating it does not always do so.
In a 2006 Cochrane Review, treating H pylori had a small but statistically significant benefit for patients with FD (NNT = 14).37 A 2011 study on the effects of H pylori eradication on symptoms and quality of life in primary care patients with FD revealed a 12.5% improvement in quality of life and a 10.6% improvement in symptoms.38
The triple-therapy regimen (a PPI + amoxicillin + clarithromycin) is the most common firstline H pylori treatment in the US and a good initial choice in regions in which clarithromycin resistance is low (see Table 2).39-44 The standard duration is seven days.
A 2013 Cochrane Review showed that a longer duration (14 days) increased the rate of eradication (82% vs 73%), but this remains controversial.39 The addition of bismuth subsalicylate to the triple-therapy regimen has been shown to increase the eradication rate of H pylori by approximately 10%.45 Adding probiotics (saccharomyces or lactobacillus) appears to increase eradication rates, as well.40
Sequential therapy consists of a five-day course of treatment in which a PPI and amoxicillin are taken twice a day, followed by another five-day course of a PPI, clarithromycin, and metronidazole. A recent meta-analysis of sequential therapy showed that it is superior to seven-day triple therapy but equivalent to 14-day triple therapy.40
LOAD (levofloxacin, omeprazole, nitazoxanide, and doxycycline) therapy for seven to 10 days can be used in place of triple therapy in areas of high resistance or for persistent H pylori. In one study, the H pylori eradication rate for a seven-day course of LOAD therapy—levofloxacin and doxycycline taken once a day, omeprazole before breakfast, and nitazoxanide twice daily—was 90% (vs 73.3% for a seven-day course of triple therapy).41
Quadruple therapy has two variations: bismuth-based and nonbismuth (concomitant) therapy. The latter uses the base triple therapy and adds either metronidazole or tinidazole for seven to 14 days. In a multicenter randomized trial, this concomitant therapy was found to have similar efficacy to sequential therapy.42
Bismuth-based quad therapy includes a PPI, bismuth, metronidazole, and tetracycline. A meta-analysis found it to have a higher rate of eradication than triple therapy for patients with antibiotic resistance.43,44
For persistent H pylori, a PPI, levofloxacin, and amoxicillin for 10 days has been shown to be more effective and better tolerated than quadruple therapy.12
Confirmation is indicated when symptoms persist
If dyspepsia symptoms persist after H pylori treatment, it is reasonable to retest to confirm that the infection has in fact been eradicated. Confirmation is also indicated if the patient has an H pylori-associated ulcer or a prior history of gastric cancer.
Retesting should be performed at least four to six weeks after treatment is completed. If H pylori has not been eradicated, you can try another regimen. If retesting confirms eradication and symptoms persist, EGD with biopsy is indicated. Although EGD typically has a very low yield, even for patients with red flags, this invasive test often provides reassurance and increased satisfaction for patients with persistent symptoms.46
Continue for more options for challenging cases >>
MORE OPTIONS FOR CHALLENGING CASES
Managing FD is challenging when both initial acid suppression therapy and H pylori eradication fail. Unproven but low-risk treatments include modification of eating habits (eg, eating slower, not gulping food), reducing stress, discontinuing medications that may be related to symptoms, avoiding foods that seem to exacerbate symptoms, and cutting down or eliminating tobacco, caffeine, alcohol, and carbonated beverages.8 Bismuth salts have been shown to be superior to placebo for the treatment of dyspepsia.25 Small studies have also demonstrated a favorable risk–benefit ratio for peppermint oil and caraway oil for the treatment of FD.47 Prokinetics have shown efficacy compared with placebo, although a Cochrane review questioned their efficacy based on publication bias.26
There is no good evidence of efficacy for OTC antacids or for GI “cocktails” (antacid, antispasmodic, and lidocaine), sucralfate, psychologic interventions (eg, cognitive behavioral therapy, relaxation therapy, or hypnosis), or antidepressants.48,49 Several recent randomized controlled trials have shown the efficacy of acupuncture for the treatment of dyspepsia.49,50 Ginger may also be helpful; it has been found to help with nausea in other GI conditions, but it’s uncertain whether it can help patients with dyspepsia.51
REFERENCES
1. Shaib Y, El-Serag HB. The prevalence and risk factors of functional dyspepsia in a multiethnic population in the United States. Am J Gastroenterol. 2004;99:2210-2216.
2. Talley NJ. Dyspepsia: management guidelines for the millennium. Gut. 2002;50(suppl 4):iv72–iv78.
3. Harmon RC, Peura DA. Evaluation and management of dyspepsia. Therap Adv Gastroenterol. 2010;3:87-98.
4. Bazaldua OV, Schneider FD. Evaluation and management of dyspepsia. Am Fam Physician. 1999;60:1773-1784.
5. Tack J, Talley NJ, Camilleri M, et al. Functional gastroduodenal disorders. Gastroenterology. 2006;130:1466-1479.
6. Haag S, Talley NJ, Holtmann G. Symptom patterns in functional dyspepsia and irritable bowel syndrome: relationship to disturbances in gastric emptying and response to a nutrient challenge in consulters and non-consulters. Gut. 2004;53:1445-1451.
7. Malfertheiner P, Megraud F, O’Morain CA, et al; European Helicobacter Study Group. Management of Helicobacter pylori infection—the Maastricht IV/Florence Consensus Report. Gut. 2012;61:646-664.
8. Talley NJ, Vakil NB, Moayyedi P. American Gastroenterological Association technical review on the evaluation of dyspepsia. Gastroenterology. 2005;129:1756-1780.
9. Moayyedi P, Axon AT. The usefulness of the likelhood ratio in the diagnosis of dyspepsia and gastroesophageal reflux disease. Am J Gastroenterol. 1999;94:3122-3125.
10. McColl KE. Clinical practice. Helicobacter pylori infection. N Engl J Med. 2010;362:1597-1604.
11. Kahrilas PJ, Shaheen NJ, Vaezi MF, et al; American Gastroenterological Association. American Gastroenterological Association Medical Position Statement on the management of gastroesophageal reflux disease. Gastroenterology. 2008;135:1383-1391.
12. Chey WD, Wong BC; Practice Parameters Committee of the American College of Gastroenterology. American College of Gastroenterology guideline on the management of Helicobacter pylori infection. Am J Gastroenterol. 2007;102:1808-1825.
13. Moayyedi P, Talley NJ, Fennerty MB, et al. Can the clinical history distinguish between organic and functional dyspepsia? JAMA. 2006;295:1566-1576.
14. Eslick GD, Howell SC, Hammer J, et al. Empirically derived symptom sub-groups correspond poorly with diagnostic criteria for functional dyspepsia and irritable bowel syndrome. A factor and cluster analysis of a patient sample. Aliment Pharmacol Ther. 2004;19:133-140.
15. Aro P, Talley NJ, Ronkainen J, et al. Anxiety is associated with uninvestigated and functional dyspepsia (Rome III criteria) in a Swedish population-based study. Gastroenterology. 2009;137:94-100.
16. Mertz H, Fullerton S, Naliboff B, et al. Symptoms and visceral perception in severe functional and organic dyspepsia. Gut. 1998;42:814-822.
17. O’Morain C. Role of Helicobacter pylori in functional dyspepsia. World J Gastroenterol. 2006;12:2677-2680.
18. Shmuely H, Obure S, Passaro DJ, et al. Dyspepsia symptoms and Helicobacter pylori infection, Nakuru, Kenya. Emerg Infect Dis. 2003;9:1103-1107.
19. Barbara G, Zecchi L, Barbaro R, et al. Mucosal permeability and immune activation as potential therapeutic targets of probiotics in irritable bowel syndrome. J Clin Gastroenterol. 2012;46(suppl):S52-S55.
20. Liu NJ, Lee CS, Tang JH, et al. Outcomes of bleeding peptic ulcers: a prospective study. J Gastroenterol Hepatol. 2008;23:e340-e347.
21. Ramsoekh D, van Leerdam ME, Rauws EA, et al. Outcome of peptic ulcer bleeding, nonsteroidal anti-inflammatory drug use, and Helicobacter pylori infection. Clin Gastroenterol Hepatol. 2005;3:859-864.
22. Papatheodoridis GV, Sougioultzis S, Archimandritis AJ. Effects of Helicobacter pylori and nonsteroidal anti-inflammatory drugs on peptic ulcer disease: a systematic review. Clin Gastroenterol Hepatol. 2006;4:130-142.
23. Bai Y, Li ZS, Zou DW, et al. Alarm features and age for predicting upper gastrointestinal malignancy in Chinese patients with dyspepsia with high background prevalence of Helicobacter pylori infection and upper gastrointestinal malignancy: an endoscopic database review of 102,665 patients from 1996 to 2006. Gut. 2010;59:722-728.
24. Vakil N. Dyspepsia, peptic ulcer, and H pylori: a remembrance of things past. Am J Gastroenterol. 2010;105:572-574.
25. Shaheen NJ, Weinberg DS, Denberg TD, et al; Clinical Guidelines Committee of the American College of Physicians. Upper endoscopy for gastroesophageal reflux disease: best practice advice from the clinical guidelines committee of the American College of Physicians. Ann Intern Med. 2012;157:808-816.
26. Moayyedi P, Soo S, Deeks J, et al. Pharmacological interventions for non-ulcer dyspepsia. Cochrane Database Syst Rev. 2006;(4):CD001960.
27. Chiu CT, Hsu CM, Wang CC, et al. Randomised clinical trial: sodium alginate oral suspension is non-inferior to omeprazole in the treatment of patients with non-erosive gastroesophageal disease. Aliment Pharmacol Ther. 2013;38:1054-1064.
28. Veldhuyzen van Zanten SJ, Chiba N, Armstrong D, et al. A randomized trial comparing omeprazole, ranitidine, cisapride, or placebo in helicobacter pylori negative, primary care patients with dyspepsia: the CADET-HN Study. Am J Gastroenterol. 2005;100:1477-1488.
29. Moayyedi P, Delaney BC, Vakil N, et al. The efficacy of proton pump inhibitors in nonulcer dyspepsia: a systematic review and economic analysis. Gastroenterology. 2004;127:1329-1337.
30. Garza-González E, Bosques-Padilla FJ, Tijerina-Menchaca R, et al. Comparison of Helicobacter pylori. Can J Gastroenterol. 2003;17:101-106.
31. Kodama M, Murakami K, Okimoto T, et al. Influence of proton pump inhibitor treatment on Helicobacter pylori stool antigen test. World J Gastroenterol. 2012;18:44-48.
32. Shimoyama T. Stool antigen tests for the management of Helicobacter pylori infection. World J Gastroenterol. 2013;19:8188-8191.
33. Howden CW, Hunt RH. Guidelines for the management of Helicobacter pylori infection. Ad Hoc Committee on Practice Parameters of the American College of Gastroenterology. Am J Gastroenterol. 1998;93:2330-2338.
34. Gisbert J, Abraira V. Accuracy of Helicobacter pylori diagnostic tests in patients with bleeding peptic ulcer: a systematic review and meta-analysis. Am J Gastroenterol. 2006;101:848-863.
35. Kamangar F, Dawsey SM, Blaser MJ, et al. Opposing risks of gastric cardiac and noncardia gastric adenocarcinomas associated with Helicobacter pylori seropositivity. J Natl Cancer Inst. 2006;98:1445-1452.
36. Islami F, Kamangar F. Helicobacter pylori and esophageal cancer risk: a meta-analysis. Cancer Prevent Res (Phila). 2008;1:329-338.
37. Moayyedi P, Soo S, Deeks J, et al. Eradication of Helicobacter pylori for non-ulcer dyspepsia. Cochrane Database Syst Rev. 2006;(2):CD002096.
38. Mazzoleni LE, Sander GB, Francesconi CF, et al. Helicobacter pylori eradication in functional dyspepsia: HEROES trial. Arch Intern Med. 2011;171:1929-1936.
39. Yuan Y, Ford AC, Khan KJ, et al. Optimum duration of regimens for Helicobacter pylori eradication. Cochrane Database Syst Rev. 2013;(12): CD008337.
40. Zou J, Dong J, Yu X. Meta-analysis: Lactobacillus containing quadruple therapy versus standard triple first-line therapy for Helicobacter pylori eradication. Helicobacter. 2009;14:97-107.
41. Basu PP, Rayapudi K, Pacana T, et al. A randomized study comparing levofloxacin, omeprazole, nitazoxanide, and doxycycline versus triple therapy for the eradication of Helicobacter pylori. Am J Gastroenterol. 2011;106:1970-1975.
42. Wu DC, Hsu PI, Wu JY, et al. Sequential and concomitant therapy with 4 drugs are equally effective for eradication of H pylori infection. Clin Gastroenterol Hepatol. 2010;8:36–41.
43. Osato R, Reddy R, Reddy SG, et al. Pattern of primary resistance of Helicobacter pylori to metronidazole or clarithromycin in the United States. Arch Intern Med. 2001;161:1217-1220.
44. Fischbach L, Evans EL. Meta-analysis: the effect of antibiotic resistance status on the efficacy of triple and quadruple first-line therapies for Helicobacter pylori. Aliment Pharmacol Ther. 2007;26:343-357.
45. Hinostroza Morales D, Díaz Ferrer J. Addition of bismuth subsalicylate to triple eradication therapy for Helicobacter pylori infection: efficiency and adverse events. Rev Gastroenterol Peru. 2014;34:315-320.
46. Rabeneck L, Wristers K, Souchek J, et al. Impact of upper endoscopy on satisfaction in patients with previously uninvestigated dyspepsia. Gastrointest Endosc. 2003;57:295-299.
47. Hojo M, Miwa H, Yokoyama T, et al. Treatment of functional dyspepsia with antianxiety or antidepressive agents: systematic review. J Gastroenterol. 2005;40:1036-1042.
48. Soo S, Moayyedi P, Deeks J, et al. Psychological interventions for non-ulcer dyspepsia. Cochrane Database Syst Rev. 2005;(2):CD002301.
49. Lima FA, Ferreira LE, Pace FH. Acupuncture effectiveness as a complementary therapy in functional dyspepsia patients. Arq Gastroenterol. 2013;50:202-207.
50. Ma TT, Yu SY, Li Y, et al. Randomised clinical trial: an assessment of acupuncture on specific meridian or specific acupoint vs sham acupuncture for treating functional dyspepsia. Aliment Pharmacol Ther. 2012;35:552-561.
51. Koretz RL, Rotblatt M. Complementary and alternative medicine in gastroenterology: the good, the bad, and the ugly. Clin Gastroenterol Hepatol. 2004;2:957-967.
What You Can Do To Improve Adult Immunization Rates
› Recommend immunization to patients routinely. Most adults believe vaccines are important and are likely to get them if recommended by their health care professionals. C
› Consider implementing standing orders that authorize nurses, pharmacists, or other trained health care personnel to assess a patient’s immunization status and administer vaccinations according to a protocol. C
› Explore the use of Web-based patient portals or other new-media communication formats to engage patients. C
Strength of recommendation (SOR)
A Good-quality patient-oriented evidence
B Inconsistent or limited-quality patient-oriented evidence
C Consensus, usual practice, opinion, disease-oriented evidence, case series
Vaccines have been proven effective in preventing disease and are one of the most cost-effective and successful public health initiatives of the 20th century. Nevertheless, adult vaccination rates in the United States for vaccine-preventable diseases are low for most routinely recommended vaccines.1 In 2013 alone, there were an estimated 3700 deaths in the United States (95% of which were adults) from pneumococcal infections—a vaccine-preventable disorder.2
Consider the threat posed by the flu. Annually, most people who die of influenza and its complications are adults, with estimates ranging from a low of 3000 to a high of 49,000 based on Centers for Disease Control and Prevention (CDC) data from the 1976-1977 flu season to the 2006-2007 season.3 Vaccination during the 2013-2014 season resulted in an estimated 7.2 million fewer cases of influenza, 90,000 fewer hospitalizations, and 3.1 million fewer medically attended cases than would have been expected without vaccination.4 If vaccination levels had reached the Healthy People 2020 target of 70%, an additional 5.9 million illnesses, 2.3 million medically attended illnesses, and 42,000 hospitalizations might have been averted.4
How are we doing with other vaccines? Based on the 2013 National Health Interview Survey, the CDC assessed vaccination coverage among adults ages ≥19 years for selected vaccines: pneumococcal vaccine, tetanus toxoid-containing vaccines (tetanus and diphtheria vaccine [Td] or tetanus and diphtheria with acellular pertussis vaccine [Tdap]), and vaccines for hepatitis A, hepatitis B, herpes zoster, and human papillomavirus (HPV). (With the exception of influenza vaccination, which is recommended annually for all adults, other vaccinations are directed at specific populations based on age, health conditions, behavioral risk factors, occupation, or travel conditions.)
Overall, coverage rates for hepatitis A and B, pneumococcal, Td, and human papillomavirus (HPV) for all adults did not improve from 2012 to 2013; rates increased only modestly for Tdap among adults ≥19 years, for herpes zoster among adults ≥60 years, and for HPV among men ages 19 to 26. Furthermore, racial and ethnic gaps in coverage are seen in all vaccines, and these gaps widened since 2012 for Tdap, herpes zoster, and HPV vaccination.1
Commonly cited barriers to improved vaccine uptake in adults include lack of regular assessment of vaccine status; lack of physician and other health care provider knowledge on current vaccine recommendations; cost; insufficient stocking of some vaccines; financial disincentives for vaccination in the primary care setting; limited use of electronic records, tools, and immunization registries; missed opportunities; and patient hesitancy and vaccine refusal.5
Removing barriers to immunization. Several recommendations on ways to improve adult vaccination rates are made by many federal organizations as well as by The Community Preventive Services Task Force (Task Force), an independent, nonfederal, unpaid panel of public health and prevention experts. The Task Force—which makes recommendations based on systematic reviews of the evidence of effectiveness, the applicability of the evidence, economic evaluations, and barriers to implementation of interventions6—advocates a 3-pronged approach to improve adult vaccination rates: 1) enhance access to vaccination services; 2) increase community demand for vaccinations; and 3) incorporate physician- or system-based interventions into practice.7
The CDC and other groups such as the National Vaccine Advisory Committee (NVAC) recommend that every routine adult office visit include a vaccination needs assessment, recommendation, and offer of vaccination.8 Additionally, the Task Force recommends 3 means of enhancing adult access to vaccination services: make home visits, reduce patient costs, and offer vaccination programs in the community.7
This article describes a number of simple steps physicians can take to increase the likelihood that adults will get their vaccines and reviews the literature on using new media such as smartphones and other Internet-based tools to improve immunization coverage.9
Increasing community demands for vaccinations
Physicians and other healthcare providers can increase community demand for vaccinations by improving their own knowledge on the subject, recommending vaccination to patients, and increasing their community and political involvement to strengthen or change laws to better support immunization uptake.
To increase awareness and education, keep abreast of the Advisory Committee on Immunization Practices (ACIP) recommendations and guidelines, which are updated annually and reported on in this journal’s Practice Alert column. Consider taking advantage of free immunization apps that are available from the CDC (“CDC Vaccine Schedules” http://www.cdc.gov/vaccines/schedules/hcp/schedule-app.html), the Society of Teachers of Family Medicine (STFM; “Shots Immunizations” http://www.immunizationed.org/Shots-Mobile-App), and the American College of Physicians (“ACP Immunization Advisor” http://immunization.acponline.org/app/).
Take steps to put guidelines into practice. Despite wide promulgation, clinical practice guidelines alone have had limited effect on changing physician behavior and improving patient outcomes. Interactive techniques are more effective than guidelines and didactic presentations alone at changing physician care and patient outcomes. Such techniques include audit/feedback (the reporting of an individual clinician’s vaccination rates compared with desired or target rates, for example), academic detailing/outreach, and reminders by way of electronic or other alerts.10,11
Promote immunization to patients. Physicians are highly influential in determining a patient’s decision to vaccinate, and it is well documented that a strong recommendation about the importance of immunizations makes a difference to patients.12,13
What you say and how you say it matters. A halfhearted recommendation for vaccination may result in the patient remaining unvaccinated.14 For example, “If you want, you can get your pneumonia shot today” is much less persuasive than, “I recommend you get your pneumonia vaccine today to prevent a potentially serious disease that affects thousands of adults each year.” Most adults believe that vaccines are important and are likely to get them if recommended by their health care professionals.15
The CDC recommends that physicians encourage patients to make an informed decision about vaccination by sharing critical information highlighting the importance of vaccinations and reminding patients what vaccines protect against while addressing their concerns (www.cdc.gov/vaccines/adultstandards). Free educational materials for patients can be found at www.cdc.gov/vaccines/AdultPatientEd.
Draw on community resources. Laws and policies that require vaccinations as a prerequisite for attending childcare, school, or college increase coverage. Community and faith-based organizations are likely to play an important role in reducing racial and ethnic disparities in adult immunizations because they can deliver education that is culturally sensitive and tailored to specific subpopulations.16,17 Physicians and other health care providers can get involved with community and faith-based groups and local and federal legislative efforts to improve immunization rates.
Consider implementing these system-based interventions
The following 6 system-based interventions can help improve adult immunization rates:
1. Develop a practice team. The practice team, based on the Patient-Centered Medical Home (PCMH), includes physicians, midlevel providers, nurses, medical assistants, pharmacists, social workers, and other staff. The PCMH team model can facilitate a shift of responsibilities among individuals to better orient the practice toward patients’ health and preventive services.18,19 While physicians have traditionally held all of the responsibility for patient care, including screening for disease and prevention, shifting the responsibility of vaccine screening to nurses or medical assistants can free up time for longer physician/patient interactions.18
The creation of a practice champion within the PCMH team—a physician, midlevel provider, or nurse—to oversee quality improvement for vaccine rates and work to generate support and cooperation from coworkers has also been shown to improve vaccination rates.20 The vaccine champion should keep abreast of new vaccine recommendations and relay that information to the practice through regular staff meetings, announcements, and office postings. The champion can also supervise pre-visit planning for immunizations.19
2. Use electronic immunization information systems (IIS). All states except New Hampshire have an IIS.21 Accurate tracking of adult immunizations in a registry provides a complete record and is essential to improving adult immunization rates,22 as does the use of chart notes, computerized alerts, checklists, and other tools that remind health care providers when patients are due for vaccinations.18 NVAC recommends that all physicians use their state IIS and create a process in their practice to include its use.
3. Incorporate physician feedback. Many health care systems and payers are using benchmarking and incentives to provide physician feedback on vaccination performance.23 Using achievable benchmarks enhances the effectiveness of physician performance feedback.24 The Task Force conducted a systematic review of the evidence on the effectiveness of health care provider assessment and feedback for increasing coverage rates and found that this strategy remains an effective means to increase vaccination rates.25
4. Use reminders/alerts. Even though you may intend to routinely recommend immunizations, remembering to do so at the time of each visit can be difficult when there are so many other issues to address. Reminders at the time of the visit can help. Some electronic records have reminder prompts, or “best practice alerts” (BPAs), programmed into their systems.26 These BPAs will prompt for needed immunizations whether the patient is being seen for a well, acute, or routine follow-up visit. These reminder/recall activities can be greatly simplified by participation in a population-based IIS.
Practices that don’t have an electronic health record can still improve vaccination rates by conveying the reminder with a brightly colored paper form attached to the front of a patient’s chart during the check-in process. One recent study showed that this approach increased rates of influenza vaccination in an urban practice by 12 percentage points.27
Furthermore, simply reminding patients to vaccinate increases the vaccination rate.28 Patient reminder/recall systems using telephone calls or mailings (phone calls are more effective than mailings) improve both childhood and adult vaccinations in all medical settings. More intensive systems using multiple reminders appear to be more effective than single reminders, and while costly, the benefits of increasing preventive visits/services and vaccine uptake help offset this cost.28
5. Implement standing orders. Standing orders—which allow nurses and other appropriately trained health care personnel to assess immunization status and administer vaccinations according to protocol—help improve immunization rates.29 ACIP advises that standing order programs be used in long-term care facilities under the supervision of a medical director to ensure the administration of recommended vaccinations for adults, and in inpatient and outpatient facilities. Because of the societal burden of influenza and pneumococcal disease, implementation of standing orders programs to improve adult vaccination coverage for these diseases is considered a national public health priority.30
6. Develop an encouraging communication style. Studies show that how one communicates with patients is just as important as what one communicates. Certain communication styles and techniques may be more or less effective when discussing vaccination needs with some patients, especially those with vaccine hesitancy or low confidence in vaccine safety or effectiveness. For example, styles that are “directing” are usually unhelpful in addressing concerns about vaccination. These styles typically use information and persuasion to achieve change and may be perceived as confrontational. This approach can lead to cues being missed, jargon being used, and vaccine safety being overstated.
Styles shown to be helpful are those that elicit patient concerns, ask permission to discuss, acknowledge/listen/empathize, determine readiness to change, inform about benefits and risks, and give appropriate resources. These helpful forms of communication are more of a “May I help you?” style vs a “This is what you should do” style of communication.31
Assure patients that recommendations are based on the best interest of their health and on the best available science. Listen to a patient’s concerns and acknowledge them in a nonconfrontational manner, allowing patients to express their concerns and thereby increase their willingness to listen.32 Saying that there is “absolutely no need to worry—vaccines are safe and you are silly not to get yours” is not as effective as saying, “What are your concerns regarding vaccines? Let’s talk about them.”
For the vaccine-hesitant group, building trust is essential through a respectful, nonjudgmental approach that aims to elicit and address specific concerns. For those who refuse vaccines, keep the consultation brief, keep the door open for further discussion, and provide appropriate resources if the patient wants them.33
Increase use of new media
Mass communication through smartphones and other Internet-based tools such as Facebook and Twitter brings a new dimension to health care, allowing patients and health professionals to communicate about health issues and possibly improve health outcomes.34 The number of people using social media increased by almost 570% worldwide between 2000 and 2012 and surpassed 2.75 billion in 2013.35
Sixty-one percent of adults in the United States look online for health information.36 In a survey conducted in September 2014, the Pew Research Center found that Facebook is the most popular social media site in the United States. Seventy-one percent of online-knowledgeable adults use Facebook, and multiplatform use is on the rise: 52% of adult Internet users now use 2 or more social media sites, a significant increase from 2013, when it stood at 42%. (Other platforms such as Twitter, Instagram, Pinterest, and LinkedIn saw significant increases over the past year in the proportion of online adults who use them).37
Health information provided by social media can answer medical questions and concerns and enhance health promotion and education.35 A recent review of 98 research studies provided evidence that social media can create a space to share, comment, and discuss health information.34 Compared with traditional communication methods, the widespread availability of social media makes health information more accessible, broadening access to various population groups, regardless of age, education, race, ethnicity, and locale.
New media platforms are proving effective. The first systematic assessment of available evidence on the use of new media to increase vaccine uptake and immunization coverage (a review of 7 randomized controlled trials [RCTs], 5 non-RCTs, 3 cross-sectional studies, one case-control study and 3 operational research studies published between 2000-2013) found that text messaging, accessing immunization campaign Web sites, using patient-held Web-based portals, computerized reminders, and standing orders increased immunization coverage rates.35 However, evidence was insufficient in this regard on the value of social networks, email communication, and smartphone applications.
One RCT showed that having access to a personalized Web-based portal where patients could manage health records as well as interact with both health care providers and other members of the community through social forums and messaging tools increased influenza vaccination rates.35
CORRESPONDENCE
Pamela G. Rockwell, DO, Department of Family Medicine, University of Michigan, 24 Frank Lloyd Wright Drive, P.O. Box 431, Ann Arbor, MI 48106-0795; [email protected].
1. Williams WW, Lu PJ, O’Halloran A, et al; Centers for Disease Control and Prevention (CDC). Vaccination coverage among adults, excluding influenza vaccination - United States, 2013. MMWR Morb Mortal Wkly Rep. 2015;64:95-102.
2. Centers for Disease Control and Prevention. Active bacterial core surveillance (ABCs) report, emerging infections program network, Streptococcus pneumoniae, 2013. Centers for Disease Control and Prevention Web site. Available at: http://www.cdc.gov/abcs/reports-findings/survreports/spneu13.pdf. Accessed August 20, 2015.
3. Centers for Disease Control and Prevention (CDC). Estimates of deaths associated with seasonal influenza --- United States, 1976-2007. MMWR Morb Mortal Wkly Rep. 2010;59:1057-1062.
4. Reed C, Kim IK, Singleton JA, et al; Centers for Disease Control and Prevention (CDC). Estimated influenza illnesses and hospitalizations averted by vaccination--United States, 2013-14 influenza season. MMWR Morb Mortal Wkly Rep. 2014;63:1151-1154.
5. Kimmel SR, Burns IT, Wolfe RM, et al. Addressing immunization barriers, benefits, and risks. J Fam Pract. 2007;56:S61-S69.
6. Briss PA, Zaza S, Pappaioanou M, et al. Developing an evidence-based Guide to Community Preventive Services—methods. The Task Force on Community Preventive Services. Am J Prev Med. 2000;18:35-43.
7. The Guide to Community Preventive Services. Increasing appropriate vaccination. The Community Guide Web site. Available at: http://www.thecommunityguide.org/vaccines/index.html. Accessed August 20, 2015.
8. National Vaccine Advisory Committee. Recommendations from the National Vaccine Advisory committee: standards for adult immunization practice. Public Health Rep. 2014;129:115-123.
9. Househ M. The use of social media in healthcare: organizational, clinical, and patient perspectives. Stud Health Technol Inform. 2013;183:244-248.
10. Bloom BS. Effects of continuing medical education on improving physician clinical care and patient health: a review of systematic reviews. Int J Technol Assess Health Care. 2005;21:380-385.
11. Cabana MD, Rand CS, Powe NR, et al. Why don’t physicians follow clinical practice guidelines? A framework for improvement. JAMA. 1999;282:1458-1465.
12. Rosenthal SL, Weiss TW, Zimet GD, et al. Predictors of HPV vaccine uptake among women aged 19-26: importance of a physician’s recommendation. Vaccine. 2011;29:890-895.
13. Zimmerman RK, Santibanez TA, Janosky JE, et al. What affects influenza vaccination rates among older patients? An analysis from inner-city, suburban, rural, and Veterans Affairs practices. Am J Med. 2003;114:31-38.
14. American Academy of Family Physicians. Strong recommendation to vaccinate against HPV is key to boosting uptake. American Academy of Family Physicians Web site. Available at: http://www.aafp.org/news/health-of-the-public/20140212hpv-vaccltr.html. Accessed August 20, 2015.
15. National Foundation for Infectious Diseases. Survey: adults do not recognize infectious disease risks. National Foundation for Infectious Diseases Web site. Available at: http://www.adultvaccination.org/newsroom/events/2009-vaccination-news-conference/NFID-Survey-Fact-Sheet.pdf. Accessed July 7, 2015.
16. Wang E, Clymer J, Davis-Hayes C, et al. Nonmedical exemptions from school immunization requirements: a systematic review. Am J Public Health. 2014;104:e62-e84.
17. National Vaccine Advisory Committee. A pathway to leadership for adult immunization: recommendations of the National Vaccine Advisory Committee: approved by the National Vaccine Advisory Committee on June 14, 2011. Public Health Rep. 2012;127:1-42.
18. Gannon M, Qaseem A, Snooks Q, et al. Improving adult immunization practices using a team approach in the primary care setting. Am J Public Health. 2012;102:e46-e52.
19. Bottino CJ, Cox JE, Kahlon PS, et al. Improving immunization rates in a hospital-based primary care practice. Pediatrics. 2014;133:e1047-e1054.
20. Hainer BL. Vaccine administration: making the process more efficient in your practice. Fam Pract Manag. 2007;14:48-53.
21. Centers for Disease Control and Prevention (CDC). Progress in immunization information systems - United States, 2012. MMWR Morb Mortal Wkly Rep. 2013;62:1005-1008.
22. Jones KL, Hammer AL, Swenson C, et al. Improving adult immunization rates in primary care clinics. Nurs Econ. 2008;26:404-407.
23. Kerr EA, McGlynn EA, Adams J, et al. Profiling the quality of care in twelve communities: results from the CQI study. Health Aff (Millwood). 2004;23:247-256.
24. Kiefe CI, Allison JJ, Williams OD, et al. Improving quality improvement using achievable benchmarks for physician feedback: a randomized controlled trial. JAMA. 2001;285:2871-2879.
25. National Center for Immunization and Respiratory Diseases. General recommendations on immunization --- recommendations of the Advisory Committee on Immunization Practices (ACIP). MMWR Recomm Rep. 2011;60:1-64.
26. Klatt TE, Hopp E. Effect of a best-practice alert on the rate of influenza vaccination of pregnant women. Obstet Gynecol. 2012;119:301-305.
27. Pierson RC, Malone AM, Haas DM. Increasing influenza vaccination rates in a busy urban clinic. J Nat Sci. 2015;1.
28. Jacobson Vann JC, Szilagyi P. Patient reminder and patient recall systems to improve immunization rates. Cochrane Database Syst Rev. 2005;CD003941.
29. Recommendations regarding interventions to improve vaccination coverage in children, adolescents, and adults. Task Force on Community Preventive Services. Am J Prev Med. 2000;18:92-96.
30. McKibben LJ, Stange PV, Sneller VP, et al; Advisory Committee on Immunization Practices. Use of standing orders programs to increase adult vaccination rates. MMWR Recomm Rep. 2000;49:15-16.
31. Leask J, Kinnersley P, Jackson C, et al. Communicating with parents about vaccination: a framework for health professionals. BMC Pediatr. 2012;12:154.
32. Kimmel SR, Wolfe RM. Communicating the benefits and risks of vaccines. J Fam Pract. 2005;54:S51-S57.
33. Danchin M, Nolan T. A positive approach to parents with concerns about vaccination for the family physician. Aust Fam Physician. 2014;43:690-694.
34. Moorhead SA, Hazlett DE, Harrison L, et al. A new dimension of health care: systematic review of the uses, benefits, and limitations of social media for health communication. J Med Internet Res. 2013;15:e85.
35. Odone A, Ferrari A, Spagnoli F, et al. Effectiveness of interventions that apply new media to improve vaccine uptake and vaccine coverage. Hum Vaccin Immunother. 2015;11:72-82.
36. Pew Research Center. Fox S. The Social Life of Health Information, 2011. Pew Research Center Web site. Available at: http://www.pewinternet.org/2011/05/12/the-social-life-of-health-information-2011/. Accessed August 20, 2015.
37. Pew Research Center. Duggan M, Ellison NB, Lampe C, et al. Social Media Update 2014. Pew Research Center Web site. Available at: http://www.pewinternet.org/2015/01/09/social-media-update-2014/. Accessed August 20, 2015.
› Recommend immunization to patients routinely. Most adults believe vaccines are important and are likely to get them if recommended by their health care professionals. C
› Consider implementing standing orders that authorize nurses, pharmacists, or other trained health care personnel to assess a patient’s immunization status and administer vaccinations according to a protocol. C
› Explore the use of Web-based patient portals or other new-media communication formats to engage patients. C
Strength of recommendation (SOR)
A Good-quality patient-oriented evidence
B Inconsistent or limited-quality patient-oriented evidence
C Consensus, usual practice, opinion, disease-oriented evidence, case series
Vaccines have been proven effective in preventing disease and are one of the most cost-effective and successful public health initiatives of the 20th century. Nevertheless, adult vaccination rates in the United States for vaccine-preventable diseases are low for most routinely recommended vaccines.1 In 2013 alone, there were an estimated 3700 deaths in the United States (95% of which were adults) from pneumococcal infections—a vaccine-preventable disorder.2
Consider the threat posed by the flu. Annually, most people who die of influenza and its complications are adults, with estimates ranging from a low of 3000 to a high of 49,000 based on Centers for Disease Control and Prevention (CDC) data from the 1976-1977 flu season to the 2006-2007 season.3 Vaccination during the 2013-2014 season resulted in an estimated 7.2 million fewer cases of influenza, 90,000 fewer hospitalizations, and 3.1 million fewer medically attended cases than would have been expected without vaccination.4 If vaccination levels had reached the Healthy People 2020 target of 70%, an additional 5.9 million illnesses, 2.3 million medically attended illnesses, and 42,000 hospitalizations might have been averted.4
How are we doing with other vaccines? Based on the 2013 National Health Interview Survey, the CDC assessed vaccination coverage among adults ages ≥19 years for selected vaccines: pneumococcal vaccine, tetanus toxoid-containing vaccines (tetanus and diphtheria vaccine [Td] or tetanus and diphtheria with acellular pertussis vaccine [Tdap]), and vaccines for hepatitis A, hepatitis B, herpes zoster, and human papillomavirus (HPV). (With the exception of influenza vaccination, which is recommended annually for all adults, other vaccinations are directed at specific populations based on age, health conditions, behavioral risk factors, occupation, or travel conditions.)
Overall, coverage rates for hepatitis A and B, pneumococcal, Td, and human papillomavirus (HPV) for all adults did not improve from 2012 to 2013; rates increased only modestly for Tdap among adults ≥19 years, for herpes zoster among adults ≥60 years, and for HPV among men ages 19 to 26. Furthermore, racial and ethnic gaps in coverage are seen in all vaccines, and these gaps widened since 2012 for Tdap, herpes zoster, and HPV vaccination.1
Commonly cited barriers to improved vaccine uptake in adults include lack of regular assessment of vaccine status; lack of physician and other health care provider knowledge on current vaccine recommendations; cost; insufficient stocking of some vaccines; financial disincentives for vaccination in the primary care setting; limited use of electronic records, tools, and immunization registries; missed opportunities; and patient hesitancy and vaccine refusal.5
Removing barriers to immunization. Several recommendations on ways to improve adult vaccination rates are made by many federal organizations as well as by The Community Preventive Services Task Force (Task Force), an independent, nonfederal, unpaid panel of public health and prevention experts. The Task Force—which makes recommendations based on systematic reviews of the evidence of effectiveness, the applicability of the evidence, economic evaluations, and barriers to implementation of interventions6—advocates a 3-pronged approach to improve adult vaccination rates: 1) enhance access to vaccination services; 2) increase community demand for vaccinations; and 3) incorporate physician- or system-based interventions into practice.7
The CDC and other groups such as the National Vaccine Advisory Committee (NVAC) recommend that every routine adult office visit include a vaccination needs assessment, recommendation, and offer of vaccination.8 Additionally, the Task Force recommends 3 means of enhancing adult access to vaccination services: make home visits, reduce patient costs, and offer vaccination programs in the community.7
This article describes a number of simple steps physicians can take to increase the likelihood that adults will get their vaccines and reviews the literature on using new media such as smartphones and other Internet-based tools to improve immunization coverage.9
Increasing community demands for vaccinations
Physicians and other healthcare providers can increase community demand for vaccinations by improving their own knowledge on the subject, recommending vaccination to patients, and increasing their community and political involvement to strengthen or change laws to better support immunization uptake.
To increase awareness and education, keep abreast of the Advisory Committee on Immunization Practices (ACIP) recommendations and guidelines, which are updated annually and reported on in this journal’s Practice Alert column. Consider taking advantage of free immunization apps that are available from the CDC (“CDC Vaccine Schedules” http://www.cdc.gov/vaccines/schedules/hcp/schedule-app.html), the Society of Teachers of Family Medicine (STFM; “Shots Immunizations” http://www.immunizationed.org/Shots-Mobile-App), and the American College of Physicians (“ACP Immunization Advisor” http://immunization.acponline.org/app/).
Take steps to put guidelines into practice. Despite wide promulgation, clinical practice guidelines alone have had limited effect on changing physician behavior and improving patient outcomes. Interactive techniques are more effective than guidelines and didactic presentations alone at changing physician care and patient outcomes. Such techniques include audit/feedback (the reporting of an individual clinician’s vaccination rates compared with desired or target rates, for example), academic detailing/outreach, and reminders by way of electronic or other alerts.10,11
Promote immunization to patients. Physicians are highly influential in determining a patient’s decision to vaccinate, and it is well documented that a strong recommendation about the importance of immunizations makes a difference to patients.12,13
What you say and how you say it matters. A halfhearted recommendation for vaccination may result in the patient remaining unvaccinated.14 For example, “If you want, you can get your pneumonia shot today” is much less persuasive than, “I recommend you get your pneumonia vaccine today to prevent a potentially serious disease that affects thousands of adults each year.” Most adults believe that vaccines are important and are likely to get them if recommended by their health care professionals.15
The CDC recommends that physicians encourage patients to make an informed decision about vaccination by sharing critical information highlighting the importance of vaccinations and reminding patients what vaccines protect against while addressing their concerns (www.cdc.gov/vaccines/adultstandards). Free educational materials for patients can be found at www.cdc.gov/vaccines/AdultPatientEd.
Draw on community resources. Laws and policies that require vaccinations as a prerequisite for attending childcare, school, or college increase coverage. Community and faith-based organizations are likely to play an important role in reducing racial and ethnic disparities in adult immunizations because they can deliver education that is culturally sensitive and tailored to specific subpopulations.16,17 Physicians and other health care providers can get involved with community and faith-based groups and local and federal legislative efforts to improve immunization rates.
Consider implementing these system-based interventions
The following 6 system-based interventions can help improve adult immunization rates:
1. Develop a practice team. The practice team, based on the Patient-Centered Medical Home (PCMH), includes physicians, midlevel providers, nurses, medical assistants, pharmacists, social workers, and other staff. The PCMH team model can facilitate a shift of responsibilities among individuals to better orient the practice toward patients’ health and preventive services.18,19 While physicians have traditionally held all of the responsibility for patient care, including screening for disease and prevention, shifting the responsibility of vaccine screening to nurses or medical assistants can free up time for longer physician/patient interactions.18
The creation of a practice champion within the PCMH team—a physician, midlevel provider, or nurse—to oversee quality improvement for vaccine rates and work to generate support and cooperation from coworkers has also been shown to improve vaccination rates.20 The vaccine champion should keep abreast of new vaccine recommendations and relay that information to the practice through regular staff meetings, announcements, and office postings. The champion can also supervise pre-visit planning for immunizations.19
2. Use electronic immunization information systems (IIS). All states except New Hampshire have an IIS.21 Accurate tracking of adult immunizations in a registry provides a complete record and is essential to improving adult immunization rates,22 as does the use of chart notes, computerized alerts, checklists, and other tools that remind health care providers when patients are due for vaccinations.18 NVAC recommends that all physicians use their state IIS and create a process in their practice to include its use.
3. Incorporate physician feedback. Many health care systems and payers are using benchmarking and incentives to provide physician feedback on vaccination performance.23 Using achievable benchmarks enhances the effectiveness of physician performance feedback.24 The Task Force conducted a systematic review of the evidence on the effectiveness of health care provider assessment and feedback for increasing coverage rates and found that this strategy remains an effective means to increase vaccination rates.25
4. Use reminders/alerts. Even though you may intend to routinely recommend immunizations, remembering to do so at the time of each visit can be difficult when there are so many other issues to address. Reminders at the time of the visit can help. Some electronic records have reminder prompts, or “best practice alerts” (BPAs), programmed into their systems.26 These BPAs will prompt for needed immunizations whether the patient is being seen for a well, acute, or routine follow-up visit. These reminder/recall activities can be greatly simplified by participation in a population-based IIS.
Practices that don’t have an electronic health record can still improve vaccination rates by conveying the reminder with a brightly colored paper form attached to the front of a patient’s chart during the check-in process. One recent study showed that this approach increased rates of influenza vaccination in an urban practice by 12 percentage points.27
Furthermore, simply reminding patients to vaccinate increases the vaccination rate.28 Patient reminder/recall systems using telephone calls or mailings (phone calls are more effective than mailings) improve both childhood and adult vaccinations in all medical settings. More intensive systems using multiple reminders appear to be more effective than single reminders, and while costly, the benefits of increasing preventive visits/services and vaccine uptake help offset this cost.28
5. Implement standing orders. Standing orders—which allow nurses and other appropriately trained health care personnel to assess immunization status and administer vaccinations according to protocol—help improve immunization rates.29 ACIP advises that standing order programs be used in long-term care facilities under the supervision of a medical director to ensure the administration of recommended vaccinations for adults, and in inpatient and outpatient facilities. Because of the societal burden of influenza and pneumococcal disease, implementation of standing orders programs to improve adult vaccination coverage for these diseases is considered a national public health priority.30
6. Develop an encouraging communication style. Studies show that how one communicates with patients is just as important as what one communicates. Certain communication styles and techniques may be more or less effective when discussing vaccination needs with some patients, especially those with vaccine hesitancy or low confidence in vaccine safety or effectiveness. For example, styles that are “directing” are usually unhelpful in addressing concerns about vaccination. These styles typically use information and persuasion to achieve change and may be perceived as confrontational. This approach can lead to cues being missed, jargon being used, and vaccine safety being overstated.
Styles shown to be helpful are those that elicit patient concerns, ask permission to discuss, acknowledge/listen/empathize, determine readiness to change, inform about benefits and risks, and give appropriate resources. These helpful forms of communication are more of a “May I help you?” style vs a “This is what you should do” style of communication.31
Assure patients that recommendations are based on the best interest of their health and on the best available science. Listen to a patient’s concerns and acknowledge them in a nonconfrontational manner, allowing patients to express their concerns and thereby increase their willingness to listen.32 Saying that there is “absolutely no need to worry—vaccines are safe and you are silly not to get yours” is not as effective as saying, “What are your concerns regarding vaccines? Let’s talk about them.”
For the vaccine-hesitant group, building trust is essential through a respectful, nonjudgmental approach that aims to elicit and address specific concerns. For those who refuse vaccines, keep the consultation brief, keep the door open for further discussion, and provide appropriate resources if the patient wants them.33
Increase use of new media
Mass communication through smartphones and other Internet-based tools such as Facebook and Twitter brings a new dimension to health care, allowing patients and health professionals to communicate about health issues and possibly improve health outcomes.34 The number of people using social media increased by almost 570% worldwide between 2000 and 2012 and surpassed 2.75 billion in 2013.35
Sixty-one percent of adults in the United States look online for health information.36 In a survey conducted in September 2014, the Pew Research Center found that Facebook is the most popular social media site in the United States. Seventy-one percent of online-knowledgeable adults use Facebook, and multiplatform use is on the rise: 52% of adult Internet users now use 2 or more social media sites, a significant increase from 2013, when it stood at 42%. (Other platforms such as Twitter, Instagram, Pinterest, and LinkedIn saw significant increases over the past year in the proportion of online adults who use them).37
Health information provided by social media can answer medical questions and concerns and enhance health promotion and education.35 A recent review of 98 research studies provided evidence that social media can create a space to share, comment, and discuss health information.34 Compared with traditional communication methods, the widespread availability of social media makes health information more accessible, broadening access to various population groups, regardless of age, education, race, ethnicity, and locale.
New media platforms are proving effective. The first systematic assessment of available evidence on the use of new media to increase vaccine uptake and immunization coverage (a review of 7 randomized controlled trials [RCTs], 5 non-RCTs, 3 cross-sectional studies, one case-control study and 3 operational research studies published between 2000-2013) found that text messaging, accessing immunization campaign Web sites, using patient-held Web-based portals, computerized reminders, and standing orders increased immunization coverage rates.35 However, evidence was insufficient in this regard on the value of social networks, email communication, and smartphone applications.
One RCT showed that having access to a personalized Web-based portal where patients could manage health records as well as interact with both health care providers and other members of the community through social forums and messaging tools increased influenza vaccination rates.35
CORRESPONDENCE
Pamela G. Rockwell, DO, Department of Family Medicine, University of Michigan, 24 Frank Lloyd Wright Drive, P.O. Box 431, Ann Arbor, MI 48106-0795; [email protected].
1. Williams WW, Lu PJ, O’Halloran A, et al; Centers for Disease Control and Prevention (CDC). Vaccination coverage among adults, excluding influenza vaccination - United States, 2013. MMWR Morb Mortal Wkly Rep. 2015;64:95-102.
2. Centers for Disease Control and Prevention. Active bacterial core surveillance (ABCs) report, emerging infections program network, Streptococcus pneumoniae, 2013. Centers for Disease Control and Prevention Web site. Available at: http://www.cdc.gov/abcs/reports-findings/survreports/spneu13.pdf. Accessed August 20, 2015.
3. Centers for Disease Control and Prevention (CDC). Estimates of deaths associated with seasonal influenza --- United States, 1976-2007. MMWR Morb Mortal Wkly Rep. 2010;59:1057-1062.
4. Reed C, Kim IK, Singleton JA, et al; Centers for Disease Control and Prevention (CDC). Estimated influenza illnesses and hospitalizations averted by vaccination--United States, 2013-14 influenza season. MMWR Morb Mortal Wkly Rep. 2014;63:1151-1154.
5. Kimmel SR, Burns IT, Wolfe RM, et al. Addressing immunization barriers, benefits, and risks. J Fam Pract. 2007;56:S61-S69.
6. Briss PA, Zaza S, Pappaioanou M, et al. Developing an evidence-based Guide to Community Preventive Services—methods. The Task Force on Community Preventive Services. Am J Prev Med. 2000;18:35-43.
7. The Guide to Community Preventive Services. Increasing appropriate vaccination. The Community Guide Web site. Available at: http://www.thecommunityguide.org/vaccines/index.html. Accessed August 20, 2015.
8. National Vaccine Advisory Committee. Recommendations from the National Vaccine Advisory committee: standards for adult immunization practice. Public Health Rep. 2014;129:115-123.
9. Househ M. The use of social media in healthcare: organizational, clinical, and patient perspectives. Stud Health Technol Inform. 2013;183:244-248.
10. Bloom BS. Effects of continuing medical education on improving physician clinical care and patient health: a review of systematic reviews. Int J Technol Assess Health Care. 2005;21:380-385.
11. Cabana MD, Rand CS, Powe NR, et al. Why don’t physicians follow clinical practice guidelines? A framework for improvement. JAMA. 1999;282:1458-1465.
12. Rosenthal SL, Weiss TW, Zimet GD, et al. Predictors of HPV vaccine uptake among women aged 19-26: importance of a physician’s recommendation. Vaccine. 2011;29:890-895.
13. Zimmerman RK, Santibanez TA, Janosky JE, et al. What affects influenza vaccination rates among older patients? An analysis from inner-city, suburban, rural, and Veterans Affairs practices. Am J Med. 2003;114:31-38.
14. American Academy of Family Physicians. Strong recommendation to vaccinate against HPV is key to boosting uptake. American Academy of Family Physicians Web site. Available at: http://www.aafp.org/news/health-of-the-public/20140212hpv-vaccltr.html. Accessed August 20, 2015.
15. National Foundation for Infectious Diseases. Survey: adults do not recognize infectious disease risks. National Foundation for Infectious Diseases Web site. Available at: http://www.adultvaccination.org/newsroom/events/2009-vaccination-news-conference/NFID-Survey-Fact-Sheet.pdf. Accessed July 7, 2015.
16. Wang E, Clymer J, Davis-Hayes C, et al. Nonmedical exemptions from school immunization requirements: a systematic review. Am J Public Health. 2014;104:e62-e84.
17. National Vaccine Advisory Committee. A pathway to leadership for adult immunization: recommendations of the National Vaccine Advisory Committee: approved by the National Vaccine Advisory Committee on June 14, 2011. Public Health Rep. 2012;127:1-42.
18. Gannon M, Qaseem A, Snooks Q, et al. Improving adult immunization practices using a team approach in the primary care setting. Am J Public Health. 2012;102:e46-e52.
19. Bottino CJ, Cox JE, Kahlon PS, et al. Improving immunization rates in a hospital-based primary care practice. Pediatrics. 2014;133:e1047-e1054.
20. Hainer BL. Vaccine administration: making the process more efficient in your practice. Fam Pract Manag. 2007;14:48-53.
21. Centers for Disease Control and Prevention (CDC). Progress in immunization information systems - United States, 2012. MMWR Morb Mortal Wkly Rep. 2013;62:1005-1008.
22. Jones KL, Hammer AL, Swenson C, et al. Improving adult immunization rates in primary care clinics. Nurs Econ. 2008;26:404-407.
23. Kerr EA, McGlynn EA, Adams J, et al. Profiling the quality of care in twelve communities: results from the CQI study. Health Aff (Millwood). 2004;23:247-256.
24. Kiefe CI, Allison JJ, Williams OD, et al. Improving quality improvement using achievable benchmarks for physician feedback: a randomized controlled trial. JAMA. 2001;285:2871-2879.
25. National Center for Immunization and Respiratory Diseases. General recommendations on immunization --- recommendations of the Advisory Committee on Immunization Practices (ACIP). MMWR Recomm Rep. 2011;60:1-64.
26. Klatt TE, Hopp E. Effect of a best-practice alert on the rate of influenza vaccination of pregnant women. Obstet Gynecol. 2012;119:301-305.
27. Pierson RC, Malone AM, Haas DM. Increasing influenza vaccination rates in a busy urban clinic. J Nat Sci. 2015;1.
28. Jacobson Vann JC, Szilagyi P. Patient reminder and patient recall systems to improve immunization rates. Cochrane Database Syst Rev. 2005;CD003941.
29. Recommendations regarding interventions to improve vaccination coverage in children, adolescents, and adults. Task Force on Community Preventive Services. Am J Prev Med. 2000;18:92-96.
30. McKibben LJ, Stange PV, Sneller VP, et al; Advisory Committee on Immunization Practices. Use of standing orders programs to increase adult vaccination rates. MMWR Recomm Rep. 2000;49:15-16.
31. Leask J, Kinnersley P, Jackson C, et al. Communicating with parents about vaccination: a framework for health professionals. BMC Pediatr. 2012;12:154.
32. Kimmel SR, Wolfe RM. Communicating the benefits and risks of vaccines. J Fam Pract. 2005;54:S51-S57.
33. Danchin M, Nolan T. A positive approach to parents with concerns about vaccination for the family physician. Aust Fam Physician. 2014;43:690-694.
34. Moorhead SA, Hazlett DE, Harrison L, et al. A new dimension of health care: systematic review of the uses, benefits, and limitations of social media for health communication. J Med Internet Res. 2013;15:e85.
35. Odone A, Ferrari A, Spagnoli F, et al. Effectiveness of interventions that apply new media to improve vaccine uptake and vaccine coverage. Hum Vaccin Immunother. 2015;11:72-82.
36. Pew Research Center. Fox S. The Social Life of Health Information, 2011. Pew Research Center Web site. Available at: http://www.pewinternet.org/2011/05/12/the-social-life-of-health-information-2011/. Accessed August 20, 2015.
37. Pew Research Center. Duggan M, Ellison NB, Lampe C, et al. Social Media Update 2014. Pew Research Center Web site. Available at: http://www.pewinternet.org/2015/01/09/social-media-update-2014/. Accessed August 20, 2015.

ALTE: A Four-Letter Word?
Case
An emergency medical services (EMS) telemetry call notified the ED of an 8-week-old infant who had turned blue during a choking and coughing episode at home. While en route to the ED, the EMS technicians stated that the infant was currently appearing well, with the following vital signs: heart rate, 122 beats/minute; respiratory rate, 30 breaths/minute; and blood pressure, 90/54 mm Hg. They also noted that the infant’s oxygen saturation was 100% on room air. At the time of the call, the patient’s estimated time to arrival at the ED was 5 minutes.
When the patient arrived at the ED, followed by his tearful mother, the emergency physician (EP) noted that the infant was alert and in no acute distress. The patient was triaged and placed on a cardiorespiratory monitor while the EP spoke with his mother. The infant’s mother stated that the event occurred approximately 15 minutes after she had finished breastfeeding the patient and had placed him on his back in his crib. She said that she had heard her son making choking and gurgling sounds and had gone back to his room to check on him, whereupon she noticed that his face had turned purple. She further noted that when she picked her son up, he was limp and did not seem to be breathing. She immediately shouted for her husband to call EMS while she “blew air into his mouth.” After about 10 seconds, she said her infant responded and seemed to be back to his normal self by the time EMS arrived.
With respect to history, the mother reported her son was born via normal vaginal delivery at 39 weeks gestation and that there were no complications during pregnancy or delivery. After the standard 48-hour inpatient stay, both mother and patient were discharged home together and had been doing well up until the time of the incident.
The patient, who was up to date on his routine preventive pediatric-care visits, was in the 85th percentile for height, weight, and head circumference. Regarding his feeding routine, the patient was exclusively breastfed and, according to his mother, he tolerated his feedings well and did not typically spit-up afterward. The patient was not taking any medications. He resided at home with both his mother and father and did not attend daycare.
The physical examination showed a well-appearing 8-week-old boy, who acted appropriately for his age and was breathing comfortably on room air. His temperature at presentation was 98.4˚F, and his mother reported no history of fever. The patient’s fontanel was soft and flat, his lungs were clear on auscultation, and he had no murmurs. The abdomen was soft and without mass or hepatosplenomegaly. There were no rashes, bruises, or birthmarks.
After the examination, the patient’s mother, who was understandably distressed, asked the EP if she could breastfeed her son. As the EP prepared to answer this question, several questions came to mind: (1) Is this an apparent life-threatening event (ALTE)? (2) Is there a way to stratify this child’s risk for coexistent serious illnesses? (3) Will this patient be cleared for discharge from the ED today? (4) What tests should be ordered during his stay in the ED?
Overview
Few pediatric diagnoses result in as much consternation and uncertainty as the nebulous ALTE. The term was established to describe a spectrum of symptoms with a great number of possible underlying etiologies, and its definition leaves much room for interpretation. According to the 1986 National Institutes of Health Consensus Development Conference on Infantile Apnea and Home Monitoring, an ALTE is “an episode that is frightening to the observer, that is characterized by some combination of apnea (centrally or occasionally obstructive), color change (usually cyanotic or pallid, but occasionally erythematous or plethoric), marked change in muscle tone (usually marked limpness), choking or gagging. In some cases, the observer feels that the infant has died.”1
Parents, as well as some providers, may have misconceptions about the relation of ALTE to sudden infant death syndrome (SIDS). While ALTEs were previously considered to be “near-miss SIDS” or “aborted crib death,” fewer than 8% of SIDS patients have a history of ALTE prior to death.2 Additionally, rates of ALTE peak before 2 months of age, whereas SIDS rates are highest between 2 and 4 months of life.3
Apparent life-threatening events are less prevalent in preterm patients compared to their full-term counterparts—though most study cohorts are comprised of full-term infants. When ALTEs, however, do occur in preterm infants, EPs should have a higher index of suspicion for an undiagnosed medical etiology associated with the patient’s prematurity—one that may potentially place the patient at an increased risk for SIDS (eg, limited pulmonary functional residual capacitance, hypoxic ischemic encephalopathy leading to seizure disorder).
Risk Factors
The risk factors for ALTE are not as well defined as for SIDS, further complicating the diagnostic picture. One prospective study found increased risk of recurrent ALTE in infants presenting beyond 2 months of age, or with abnormal findings on physical examination.4 Another study identified prematurity, upper respiratory infection symptoms, and postconceptional age younger than 43 weeks to be associated with a higher likelihood of having a prolonged, significant bradycardic, apneic, or hypoxic event after presenting with ALTE.5 Premature infants who present with ALTEs are particularly concerning as they have unique and often dynamic pulmonary, cardiac, and central nervous system physiology which may require additional investigation.
Initial Evaluation
Many patients presenting with ALTE will have returned to their baseline healthy appearance by the time they arrive at the ED. If the physical examination reveals no clues to etiology of the event, the history may lead to the diagnosis—underscoring the need to take a thorough history.
The case history of an ALTE can be limited by a frightened and worried parent’s inability to accurately recall the event. It is important, therefore, to systematically review what was happening before, during, and after the event (eg, the temporal relationship to feeding, sleeping). Questions about color change, vomiting, limb and eye movements, breathing, and loss of consciousness can further help direct diagnostic efforts. It is therefore crucial to obtain a thorough prenatal, birth, and family history.6
Etiologies
Gastrointestinal
Gastroesophageal reflux disease (GERD) is the most commonly cited underlying cause of ALTE, and is diagnosed in 42% to 54% of cases.7,8 However, many diagnoses of GERD are made clinically, without the use of a pH probe or upper gastrointestinal series imaging. In fact, the North American Society for Pediatric Gastroenterology, Hepatology, and Nutrition does not currently recommend invasive testing for GERD.9 Gastroesophageal reflux is a common condition, and even thought to be physiologic in infancy; moreover, some studies have failed to demonstrate a relation between apnea and reflux.10
Neurological
Two recent systematic reviews have found seizure to be the second most frequent diagnosis after ALTE, present in 11% to 30% of cases.7,8 In one study, 3.6% of ALTE patients were ultimately diagnosed with chronic epilepsy, with 47% of those diagnoses made within 1 week of the initial ALTE.11 Yet, electroencephalography (EEG) at the time of the ALTE presentation had only a 15% sensitivity for diagnosing chronic epilepsy.11 Despite this low sensitivity, EEG is a reasonable diagnostic tool in patients whose history is suggestive of seizure-like activity.
Respiratory
Problems of the respiratory tract may account for up to 20% of ALTEs.8 Obstructive sleep apnea has been described in infants, and may be idiopathic, the result of anatomic abnormalities, or associated with infections.8 Respiratory tract infections, including pertussis and respiratory syncytial virus (RSV), are diagnosed in 8% of ALTE cases.7 Respiratory syncytial virus causes apnea, particularly in premature infants, with a frequency of up to 20% in patients hospitalized due to this infection.7,12 The presence of upper respiratory infection (URI) symptoms, such as cough or rhinorrhea, in patients presenting with ALTE must be taken into consideration when deciding on further workup or disposition. One clinical prediction rule suggested the absence of URI as a predictor of ALTE patients requiring intervention and admission.13 However, a separate retrospective review found that infants presenting with symptoms of URI at the time of an ALTE were at an increased risk of a subsequent prolonged apneic, bradycardic, or significant desaturation event.5 These contradictory findings regarding URI symptoms highlight the importance of considering the entire clinical picture in determining the disposition of ALTE patients.
Infectious
Serious bacterial infection (SBI), such as meningitis, bacteremia or urinary tract infection (UTI), is a rare, but critical diagnosis in the infant with ALTE. One study of 182 well-appearing, afebrile infants younger than 61 days old who presented with ALTE found the rate of SBI to be 2.7% (5 patients).14 Of those five infants, three had positive bacterial blood cultures, one had a positive urine culture, and one had a positive pertussis polymerase chain reaction. There were no cases of meningitis or positive cerebrospinal fluid culture. Prematurity was a positive predictor of increased risk of SBI in these patients.14 A 2004 systematic review of 8 studies reported 1.1% of ALTE patients were diagnosed with UTI.7
Cardiac
Underlying cardiac disease is a less frequent cause of ALTE, with cardiac abnormalities detected in less than 5% of patients, and significant cardiac disease in less than 1%.15 Prematurity was associated with cardiac abnormalities and an electrocardiogram was 100% sensitive in detecting cardiac pathology.15
Metabolic
Although in-born errors of metabolism are uncommon diagnoses, they must be considered as a cause of ALTE in the appropriate clinical context as they are reported in 1.5% to 7.7% of ALTE patients.7 Clinical clues suggesting an inborn error of metabolism include poor weight gain, unusual body odors (eg, of urine or sweat), symptom onset with institution of formula or diet change (eg, protein introduction), metabolic acidosis, hypoglycemia, thrombocytopenia, and neutropenia. Any of these clinical clues can point the practitioner toward a metabolic workup.
Nontraumatic Injury
The EP must always be watchful for signs of nonaccidental trauma in pediatric patients, as abusive head injury is diagnosed in 1% to 3% of ALTE case presentations.6,16 A retrospective review found vomiting, irritability, and a documented 911 call to be risk factors associated with increased likelihood of abusive head trauma.16 Again, a thorough history and physical examination is prudent in all ALTE patients, and close attention should be paid to inconsistent or poorly explained histories and findings such as bruising or burns. Fictitious illness has also been documented in cases of ALTE in less than 3% of all cases, and should be considered especially in cases of repeated ALTEs witnessed by the same caregiver.7
Hematologic and Idiopathic
Almost a quarter of patients presenting with ALTE are found to have low hemoglobin for their respective age, with higher rates of anemia in patients with repeat ALTEs.6 However, there is no clear causative effect between anemia and ALTE. Moreover, in 25% to 50% of ALTE cases, there is no clear diagnosis and therefore the cause is considered idiopathic in nature.7,8
Workup
While there is no standardized workup for ALTE, a careful history and physical examination should help guide diagnostic testing ordered in the ED. A retrospective study of 243 patients found that in 49%, the history and physical examination suggested an etiology that was confirmed by diagnostic testing (eg, a patient presenting with wheezing and rhinorrhea, who has a positive RSV antigen).17 Another 21% of patients were diagnosed solely on history and physical examination findings. While these patients may have had diagnostic tests performed, the tests did not contribute to the final diagnosis. In this study cohort, a final diagnosis was made by positive diagnostic tests alone in only 14% of patients with both nonspecific histories and physical examination findings. As previously mentioned, these findings underscore the critical role that history and physical examination play in the diagnosis of ALTE.
As no obvious pathology is found in up to half of all ALTE cases, the EP must decide which tests will most likely be of diagnostic utility. Diagnostic tests are ordered in a majority of patients18 and a chest X-ray is one of the most frequently positive tests.4,19
A positive test, however, does not necessarily lead to a diagnosis for the etiology of the ALTE. Only approximately one-third of the positive tests in the previously cited study were determined to contribute to the final diagnosis.17 The list of possible diagnostic tests for ALTE patients is lengthy and, at times, invasive. For this reason, EPs should perform focused testing based on the concerning elements in the history and physical examination rather than order a set of specific screening labs for each infant.
Need for Admission
Disposition is often a difficult decision in treating ALTE patients (and their families). Infants often look well and are acting normally by the time they arrive in the ED and remain well-appearing throughout the ED stay. If a thorough history, physical examination, and focused diagnostic testing uncover no specific etiology, the EP must decide whether to admit the patient for observation or discharge him or her home with instructions for pediatric follow up.
The majority of patients presenting to the ED with ALTE are admitted to inpatient services, many for overnight observation.13,20,21 Since 12% to 23% of patients with ALTE experience a repeat event or clinical condition requiring intervention,13,20,21 multiple studies have attempted to design a clinical decision rule to determine high-risk infants requiring admission.13,20,21 One small study had 100% sensitivity for infants requiring admission with two criteria: a history of multiple ALTEs and/or age younger than 1 month.21 Another study suggested high-risk criteria include prematurity and abnormal physical examination in the ED.13 To date, there are no well-validated clinical decision rules allowing for risk stratification of ALTE infants to home. As such, most infants with ALTE will be admitted for observation, but the appropriate disposition is best made in a collaborative decision-making process involving both the caregivers and the child’s pediatrician.
Case Conclusion
The infant in this case was a full-term, healthy male, older than 1 month of age, with no significant findings on physical examination. He had never had a prior ALTE. Though this episode started with a choking sound following a feeding, the EP correctly recognized this presentation as an ALTE based on parental history of the event.
The EP appropriately ordered a chest X-ray to exclude foreign body aspiration or aspiration pneumonia. The X-ray was unremarkable and, based on the physical examination and history, there was no indication requiring additional workup of this patient. After a discussion with the patient’s mother, the EP admitted the infant to pediatric services for overnight evaluation. The patient had no further apneic episodes during admission, but did have reflux after most feeds. No further interventions were required during the hospital stay, and the infant was discharged home the following day after parental education on home management of infantile GERD.
Dr Clingenpeel is a fellowship director of pediatric emergency medicine, and an associate professor of pediatrics, Eastern Virginia Medical School, Norfolk. Dr Eason is a pediatric emergency medicine fellow at Eastern Virginia Medical School, Norfolk.
- National Institutes of Health. Consensus Development Conference on Infantile Apnea and Home Monitoring. Sept 29 to Oct 1, 1986. Pediatrics. 1987;79(2):292-299.
- Edner A, Wennborg M, Alm B, et al. Why do ALTE infants not die in SIDS? Acta Paediatr. 2007;96(2):191-194.
- Esani N, Hodgman JE, Ehsani N, Hoppenbrouwers T. Apparent life-threatening events and sudden infant death syndrome: comparison of risk factors. J Pediatr. 2008;152(3):365-370.
- Davies F, Gupta R. Apparent life threatening events in infants presenting to an emergency department. Emerg Med J. 2002;19(1):11-16.
- Al-Kindy H, Gélinas J, Hatzakis G, Côté A. Risk factors for extreme events in infants hospitalized for apparent life-threatening events. J Pediatr. 2009;154(3):332-337.
- Sarohia M, Platt S. Apparent life-threatening events in children: practical evaluation and management. Pediatr Emerg Med Pract. 2014;11(4):1-14, quiz 15.
- McGovern MC, Smith MB. Causes of apparent life threatening events in infants: a systematic review. Arch Dis Child. 2004;89(11):1043-1048.
- Kahn A; European Society for the Study and Prevention of Infant Death. Recommended clinical evaluation of infants with an apparent life-threatening event. Consensus document of the European Society for the Study and Prevention of Infant Death. Eur J Pediatr. 2004;163(2):108-115.
- Vandenplas Y, Rudolph CD, Di Lorenzo C, et al; North American Society for Pediatric Gastroenterology Hepatology and Nutrition, European Society for Pediatric Gastroenterology Hepatology and Nutrition. Pediatric gastroesophageal reflux clinical practice guidelines: joint recommendations of North American Society for Pediatric Gastroenterology, Hepatology, and Nutrition (NASPGHAN) and the European Society for Pediatric Gastroenterology, Hepatology, and Nutrition (ESPGHAN). J Pediatr Gastroenterol Nutr. 2009;49(4):498-547.
- Arad-Cohen N, Cohen A, Tirosh E. The relationship between gastroesophageal reflux and apnea in infants. J Pediatr. 2000;137(3):321-326.
- Bonkowsky J, Guenther E, Srivastava R, Filloux FM. Seizures in children following an apparent life-threatening event. J Child Neurol. 2009;24(6):709-713.
- DePiero AD, Sharieff GQ, Whiteman PJ. Apparent life-theatening events: an evidence-based approach. Pediatr Emerg Med Pract. 2006;3(7):1-20.
- Mittal MK, Sun G, Baren JM. A clinical decision rule to identify infants with apparent life-threatening event who can be safely discharged from the emergency department. Pediatr Emerg Care. 2012;28(7):599-605.
- Zuckerbraun N, Zomorrodi A, Pitetti R. Occurrence of serious bacterial infection in infants aged 60 days or younger with an apparent life-threatening event. Pediatr Emerg Care. 2009;25(1):19-25.
- Hoki R, Bonkowsky JL, Minich LL. Cardiac testing and outcomes in infants after an apparent life-threatening event. Arch Dis Child. 2012;97(12):1034-1038.
- Guenther E, Powers A, Srivastava R, Bonkowsky JL. Abusive head trauma in children presenting with an apparent life-threatening event. J Pediatr. 2010;157(5):821-825.
- Brand DA, Altman RL, Purtill K, Edwards KS. Yield of diagnostic testing in infants who have had an apparent life-threatening event. Pediatrics. 2005;115(4);885-893.
- De Piero AD, Teach SJ, Chamberlain JM. ED evaluation of infants after an apparent life-threatening event. Am J Emerg Med. 2004;22(2):83-86.
- Gray C, Davies F, Molyneux E. Apparent life-threatening events presenting to a pediatric emergency department. Pediatr Emerg Care. 1999;15(3):195-199.
- Kaji A, Claudius I, Santillanes G, et al. Apparent life-threatening event: multicenter prospective cohort study to develop a clinical decision rule for admission to the hospital. Ann Emerg Med. 2013;61(4):379-387.
- Claudius I, Keens T. Do all infants with apparent life-threatening events need to be admitted? Pediatrics. 2007;119;679-83.
Case
An emergency medical services (EMS) telemetry call notified the ED of an 8-week-old infant who had turned blue during a choking and coughing episode at home. While en route to the ED, the EMS technicians stated that the infant was currently appearing well, with the following vital signs: heart rate, 122 beats/minute; respiratory rate, 30 breaths/minute; and blood pressure, 90/54 mm Hg. They also noted that the infant’s oxygen saturation was 100% on room air. At the time of the call, the patient’s estimated time to arrival at the ED was 5 minutes.
When the patient arrived at the ED, followed by his tearful mother, the emergency physician (EP) noted that the infant was alert and in no acute distress. The patient was triaged and placed on a cardiorespiratory monitor while the EP spoke with his mother. The infant’s mother stated that the event occurred approximately 15 minutes after she had finished breastfeeding the patient and had placed him on his back in his crib. She said that she had heard her son making choking and gurgling sounds and had gone back to his room to check on him, whereupon she noticed that his face had turned purple. She further noted that when she picked her son up, he was limp and did not seem to be breathing. She immediately shouted for her husband to call EMS while she “blew air into his mouth.” After about 10 seconds, she said her infant responded and seemed to be back to his normal self by the time EMS arrived.
With respect to history, the mother reported her son was born via normal vaginal delivery at 39 weeks gestation and that there were no complications during pregnancy or delivery. After the standard 48-hour inpatient stay, both mother and patient were discharged home together and had been doing well up until the time of the incident.
The patient, who was up to date on his routine preventive pediatric-care visits, was in the 85th percentile for height, weight, and head circumference. Regarding his feeding routine, the patient was exclusively breastfed and, according to his mother, he tolerated his feedings well and did not typically spit-up afterward. The patient was not taking any medications. He resided at home with both his mother and father and did not attend daycare.
The physical examination showed a well-appearing 8-week-old boy, who acted appropriately for his age and was breathing comfortably on room air. His temperature at presentation was 98.4˚F, and his mother reported no history of fever. The patient’s fontanel was soft and flat, his lungs were clear on auscultation, and he had no murmurs. The abdomen was soft and without mass or hepatosplenomegaly. There were no rashes, bruises, or birthmarks.
After the examination, the patient’s mother, who was understandably distressed, asked the EP if she could breastfeed her son. As the EP prepared to answer this question, several questions came to mind: (1) Is this an apparent life-threatening event (ALTE)? (2) Is there a way to stratify this child’s risk for coexistent serious illnesses? (3) Will this patient be cleared for discharge from the ED today? (4) What tests should be ordered during his stay in the ED?
Overview
Few pediatric diagnoses result in as much consternation and uncertainty as the nebulous ALTE. The term was established to describe a spectrum of symptoms with a great number of possible underlying etiologies, and its definition leaves much room for interpretation. According to the 1986 National Institutes of Health Consensus Development Conference on Infantile Apnea and Home Monitoring, an ALTE is “an episode that is frightening to the observer, that is characterized by some combination of apnea (centrally or occasionally obstructive), color change (usually cyanotic or pallid, but occasionally erythematous or plethoric), marked change in muscle tone (usually marked limpness), choking or gagging. In some cases, the observer feels that the infant has died.”1
Parents, as well as some providers, may have misconceptions about the relation of ALTE to sudden infant death syndrome (SIDS). While ALTEs were previously considered to be “near-miss SIDS” or “aborted crib death,” fewer than 8% of SIDS patients have a history of ALTE prior to death.2 Additionally, rates of ALTE peak before 2 months of age, whereas SIDS rates are highest between 2 and 4 months of life.3
Apparent life-threatening events are less prevalent in preterm patients compared to their full-term counterparts—though most study cohorts are comprised of full-term infants. When ALTEs, however, do occur in preterm infants, EPs should have a higher index of suspicion for an undiagnosed medical etiology associated with the patient’s prematurity—one that may potentially place the patient at an increased risk for SIDS (eg, limited pulmonary functional residual capacitance, hypoxic ischemic encephalopathy leading to seizure disorder).
Risk Factors
The risk factors for ALTE are not as well defined as for SIDS, further complicating the diagnostic picture. One prospective study found increased risk of recurrent ALTE in infants presenting beyond 2 months of age, or with abnormal findings on physical examination.4 Another study identified prematurity, upper respiratory infection symptoms, and postconceptional age younger than 43 weeks to be associated with a higher likelihood of having a prolonged, significant bradycardic, apneic, or hypoxic event after presenting with ALTE.5 Premature infants who present with ALTEs are particularly concerning as they have unique and often dynamic pulmonary, cardiac, and central nervous system physiology which may require additional investigation.
Initial Evaluation
Many patients presenting with ALTE will have returned to their baseline healthy appearance by the time they arrive at the ED. If the physical examination reveals no clues to etiology of the event, the history may lead to the diagnosis—underscoring the need to take a thorough history.
The case history of an ALTE can be limited by a frightened and worried parent’s inability to accurately recall the event. It is important, therefore, to systematically review what was happening before, during, and after the event (eg, the temporal relationship to feeding, sleeping). Questions about color change, vomiting, limb and eye movements, breathing, and loss of consciousness can further help direct diagnostic efforts. It is therefore crucial to obtain a thorough prenatal, birth, and family history.6
Etiologies
Gastrointestinal
Gastroesophageal reflux disease (GERD) is the most commonly cited underlying cause of ALTE, and is diagnosed in 42% to 54% of cases.7,8 However, many diagnoses of GERD are made clinically, without the use of a pH probe or upper gastrointestinal series imaging. In fact, the North American Society for Pediatric Gastroenterology, Hepatology, and Nutrition does not currently recommend invasive testing for GERD.9 Gastroesophageal reflux is a common condition, and even thought to be physiologic in infancy; moreover, some studies have failed to demonstrate a relation between apnea and reflux.10
Neurological
Two recent systematic reviews have found seizure to be the second most frequent diagnosis after ALTE, present in 11% to 30% of cases.7,8 In one study, 3.6% of ALTE patients were ultimately diagnosed with chronic epilepsy, with 47% of those diagnoses made within 1 week of the initial ALTE.11 Yet, electroencephalography (EEG) at the time of the ALTE presentation had only a 15% sensitivity for diagnosing chronic epilepsy.11 Despite this low sensitivity, EEG is a reasonable diagnostic tool in patients whose history is suggestive of seizure-like activity.
Respiratory
Problems of the respiratory tract may account for up to 20% of ALTEs.8 Obstructive sleep apnea has been described in infants, and may be idiopathic, the result of anatomic abnormalities, or associated with infections.8 Respiratory tract infections, including pertussis and respiratory syncytial virus (RSV), are diagnosed in 8% of ALTE cases.7 Respiratory syncytial virus causes apnea, particularly in premature infants, with a frequency of up to 20% in patients hospitalized due to this infection.7,12 The presence of upper respiratory infection (URI) symptoms, such as cough or rhinorrhea, in patients presenting with ALTE must be taken into consideration when deciding on further workup or disposition. One clinical prediction rule suggested the absence of URI as a predictor of ALTE patients requiring intervention and admission.13 However, a separate retrospective review found that infants presenting with symptoms of URI at the time of an ALTE were at an increased risk of a subsequent prolonged apneic, bradycardic, or significant desaturation event.5 These contradictory findings regarding URI symptoms highlight the importance of considering the entire clinical picture in determining the disposition of ALTE patients.
Infectious
Serious bacterial infection (SBI), such as meningitis, bacteremia or urinary tract infection (UTI), is a rare, but critical diagnosis in the infant with ALTE. One study of 182 well-appearing, afebrile infants younger than 61 days old who presented with ALTE found the rate of SBI to be 2.7% (5 patients).14 Of those five infants, three had positive bacterial blood cultures, one had a positive urine culture, and one had a positive pertussis polymerase chain reaction. There were no cases of meningitis or positive cerebrospinal fluid culture. Prematurity was a positive predictor of increased risk of SBI in these patients.14 A 2004 systematic review of 8 studies reported 1.1% of ALTE patients were diagnosed with UTI.7
Cardiac
Underlying cardiac disease is a less frequent cause of ALTE, with cardiac abnormalities detected in less than 5% of patients, and significant cardiac disease in less than 1%.15 Prematurity was associated with cardiac abnormalities and an electrocardiogram was 100% sensitive in detecting cardiac pathology.15
Metabolic
Although in-born errors of metabolism are uncommon diagnoses, they must be considered as a cause of ALTE in the appropriate clinical context as they are reported in 1.5% to 7.7% of ALTE patients.7 Clinical clues suggesting an inborn error of metabolism include poor weight gain, unusual body odors (eg, of urine or sweat), symptom onset with institution of formula or diet change (eg, protein introduction), metabolic acidosis, hypoglycemia, thrombocytopenia, and neutropenia. Any of these clinical clues can point the practitioner toward a metabolic workup.
Nontraumatic Injury
The EP must always be watchful for signs of nonaccidental trauma in pediatric patients, as abusive head injury is diagnosed in 1% to 3% of ALTE case presentations.6,16 A retrospective review found vomiting, irritability, and a documented 911 call to be risk factors associated with increased likelihood of abusive head trauma.16 Again, a thorough history and physical examination is prudent in all ALTE patients, and close attention should be paid to inconsistent or poorly explained histories and findings such as bruising or burns. Fictitious illness has also been documented in cases of ALTE in less than 3% of all cases, and should be considered especially in cases of repeated ALTEs witnessed by the same caregiver.7
Hematologic and Idiopathic
Almost a quarter of patients presenting with ALTE are found to have low hemoglobin for their respective age, with higher rates of anemia in patients with repeat ALTEs.6 However, there is no clear causative effect between anemia and ALTE. Moreover, in 25% to 50% of ALTE cases, there is no clear diagnosis and therefore the cause is considered idiopathic in nature.7,8
Workup
While there is no standardized workup for ALTE, a careful history and physical examination should help guide diagnostic testing ordered in the ED. A retrospective study of 243 patients found that in 49%, the history and physical examination suggested an etiology that was confirmed by diagnostic testing (eg, a patient presenting with wheezing and rhinorrhea, who has a positive RSV antigen).17 Another 21% of patients were diagnosed solely on history and physical examination findings. While these patients may have had diagnostic tests performed, the tests did not contribute to the final diagnosis. In this study cohort, a final diagnosis was made by positive diagnostic tests alone in only 14% of patients with both nonspecific histories and physical examination findings. As previously mentioned, these findings underscore the critical role that history and physical examination play in the diagnosis of ALTE.
As no obvious pathology is found in up to half of all ALTE cases, the EP must decide which tests will most likely be of diagnostic utility. Diagnostic tests are ordered in a majority of patients18 and a chest X-ray is one of the most frequently positive tests.4,19
A positive test, however, does not necessarily lead to a diagnosis for the etiology of the ALTE. Only approximately one-third of the positive tests in the previously cited study were determined to contribute to the final diagnosis.17 The list of possible diagnostic tests for ALTE patients is lengthy and, at times, invasive. For this reason, EPs should perform focused testing based on the concerning elements in the history and physical examination rather than order a set of specific screening labs for each infant.
Need for Admission
Disposition is often a difficult decision in treating ALTE patients (and their families). Infants often look well and are acting normally by the time they arrive in the ED and remain well-appearing throughout the ED stay. If a thorough history, physical examination, and focused diagnostic testing uncover no specific etiology, the EP must decide whether to admit the patient for observation or discharge him or her home with instructions for pediatric follow up.
The majority of patients presenting to the ED with ALTE are admitted to inpatient services, many for overnight observation.13,20,21 Since 12% to 23% of patients with ALTE experience a repeat event or clinical condition requiring intervention,13,20,21 multiple studies have attempted to design a clinical decision rule to determine high-risk infants requiring admission.13,20,21 One small study had 100% sensitivity for infants requiring admission with two criteria: a history of multiple ALTEs and/or age younger than 1 month.21 Another study suggested high-risk criteria include prematurity and abnormal physical examination in the ED.13 To date, there are no well-validated clinical decision rules allowing for risk stratification of ALTE infants to home. As such, most infants with ALTE will be admitted for observation, but the appropriate disposition is best made in a collaborative decision-making process involving both the caregivers and the child’s pediatrician.
Case Conclusion
The infant in this case was a full-term, healthy male, older than 1 month of age, with no significant findings on physical examination. He had never had a prior ALTE. Though this episode started with a choking sound following a feeding, the EP correctly recognized this presentation as an ALTE based on parental history of the event.
The EP appropriately ordered a chest X-ray to exclude foreign body aspiration or aspiration pneumonia. The X-ray was unremarkable and, based on the physical examination and history, there was no indication requiring additional workup of this patient. After a discussion with the patient’s mother, the EP admitted the infant to pediatric services for overnight evaluation. The patient had no further apneic episodes during admission, but did have reflux after most feeds. No further interventions were required during the hospital stay, and the infant was discharged home the following day after parental education on home management of infantile GERD.
Dr Clingenpeel is a fellowship director of pediatric emergency medicine, and an associate professor of pediatrics, Eastern Virginia Medical School, Norfolk. Dr Eason is a pediatric emergency medicine fellow at Eastern Virginia Medical School, Norfolk.
- National Institutes of Health. Consensus Development Conference on Infantile Apnea and Home Monitoring. Sept 29 to Oct 1, 1986. Pediatrics. 1987;79(2):292-299.
- Edner A, Wennborg M, Alm B, et al. Why do ALTE infants not die in SIDS? Acta Paediatr. 2007;96(2):191-194.
- Esani N, Hodgman JE, Ehsani N, Hoppenbrouwers T. Apparent life-threatening events and sudden infant death syndrome: comparison of risk factors. J Pediatr. 2008;152(3):365-370.
- Davies F, Gupta R. Apparent life threatening events in infants presenting to an emergency department. Emerg Med J. 2002;19(1):11-16.
- Al-Kindy H, Gélinas J, Hatzakis G, Côté A. Risk factors for extreme events in infants hospitalized for apparent life-threatening events. J Pediatr. 2009;154(3):332-337.
- Sarohia M, Platt S. Apparent life-threatening events in children: practical evaluation and management. Pediatr Emerg Med Pract. 2014;11(4):1-14, quiz 15.
- McGovern MC, Smith MB. Causes of apparent life threatening events in infants: a systematic review. Arch Dis Child. 2004;89(11):1043-1048.
- Kahn A; European Society for the Study and Prevention of Infant Death. Recommended clinical evaluation of infants with an apparent life-threatening event. Consensus document of the European Society for the Study and Prevention of Infant Death. Eur J Pediatr. 2004;163(2):108-115.
- Vandenplas Y, Rudolph CD, Di Lorenzo C, et al; North American Society for Pediatric Gastroenterology Hepatology and Nutrition, European Society for Pediatric Gastroenterology Hepatology and Nutrition. Pediatric gastroesophageal reflux clinical practice guidelines: joint recommendations of North American Society for Pediatric Gastroenterology, Hepatology, and Nutrition (NASPGHAN) and the European Society for Pediatric Gastroenterology, Hepatology, and Nutrition (ESPGHAN). J Pediatr Gastroenterol Nutr. 2009;49(4):498-547.
- Arad-Cohen N, Cohen A, Tirosh E. The relationship between gastroesophageal reflux and apnea in infants. J Pediatr. 2000;137(3):321-326.
- Bonkowsky J, Guenther E, Srivastava R, Filloux FM. Seizures in children following an apparent life-threatening event. J Child Neurol. 2009;24(6):709-713.
- DePiero AD, Sharieff GQ, Whiteman PJ. Apparent life-theatening events: an evidence-based approach. Pediatr Emerg Med Pract. 2006;3(7):1-20.
- Mittal MK, Sun G, Baren JM. A clinical decision rule to identify infants with apparent life-threatening event who can be safely discharged from the emergency department. Pediatr Emerg Care. 2012;28(7):599-605.
- Zuckerbraun N, Zomorrodi A, Pitetti R. Occurrence of serious bacterial infection in infants aged 60 days or younger with an apparent life-threatening event. Pediatr Emerg Care. 2009;25(1):19-25.
- Hoki R, Bonkowsky JL, Minich LL. Cardiac testing and outcomes in infants after an apparent life-threatening event. Arch Dis Child. 2012;97(12):1034-1038.
- Guenther E, Powers A, Srivastava R, Bonkowsky JL. Abusive head trauma in children presenting with an apparent life-threatening event. J Pediatr. 2010;157(5):821-825.
- Brand DA, Altman RL, Purtill K, Edwards KS. Yield of diagnostic testing in infants who have had an apparent life-threatening event. Pediatrics. 2005;115(4);885-893.
- De Piero AD, Teach SJ, Chamberlain JM. ED evaluation of infants after an apparent life-threatening event. Am J Emerg Med. 2004;22(2):83-86.
- Gray C, Davies F, Molyneux E. Apparent life-threatening events presenting to a pediatric emergency department. Pediatr Emerg Care. 1999;15(3):195-199.
- Kaji A, Claudius I, Santillanes G, et al. Apparent life-threatening event: multicenter prospective cohort study to develop a clinical decision rule for admission to the hospital. Ann Emerg Med. 2013;61(4):379-387.
- Claudius I, Keens T. Do all infants with apparent life-threatening events need to be admitted? Pediatrics. 2007;119;679-83.

Case Report: Diagnosis of Small Bowel Obstruction With Bedside Ultrasound
Case
A 64-year-old man presented to the ED seeking assistance in withdrawing from his prescription of oxycodone, which he had been taking to manage chronic pain due to rheumatoid arthritis. He stated that he had discontinued the oxycodone approximately 4 days prior to presentation and over the past 3 days, had been experiencing abdominal pain, nausea, vomiting, diarrhea, and diaphoresis. He noted that his symptoms were identical to those he had during previous unsuccessful attempts to wean himself from the narcotic medication. He denied any fever, dysuria, penile discharge, or any skin changes. Further evaluation revealed a remote history of a cholecystectomy and an appendectomy.
During the initial examination, the patient appeared uncomfortable but in no acute distress. His vital signs were: heart rate, 110 beats/minute; blood pressure, 107/76 mm Hg, respiratory rate, 22 breaths/minute; and temperature, 99˚F. Oxygen saturation was 97% on room air. The abdominal examination revealed moderate diffuse tenderness, mild distension without guarding or rebound, and some well-healed surgical scars.
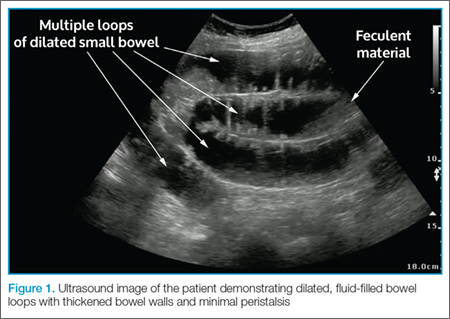
In light of the abnormal sonographic findings, a computed tomography (CT) scan with intravenous (IV) contrast was performed, which confirmed the diagnosis of a distal small bowel obstruction (SBO). Surgery services were consulted. As the patient’s current symptoms were believed to be the result of an SBO and not from narcotic withdrawal, surgery services instructed nothing by mouth and elected nonsurgical management. They placed a nasogastric tube and administered fluids and analgesics via IV. The patient was discharged 4 days after presentation to the ED, with complete resolution of his symptoms.
Discussion
Annually in the United States, less than 1% of all patients presenting to EDs are subsequently diagnosed with SBO.1 However, this disease comprises 15% of all surgical hospital admissions, costing upward of $1 billion in annual hospital charges.2 Moreover, patients with SBO suffer from a disproportionately high morbidity (eg, bowel strangulation, necrosis) and mortality than the general population,3-5 and delayed diagnosis is associated with a higher risk of bowel resection. One study by Bickell et al6 showed that only 4% of patients appropriately managed less than 24 hours after symptom onset required resection compared with 10% to 14% of patients managed more than 24 hours after symptom onset.
As most patients diagnosed with SBO are first seen in the ED, emergency physicians (EPs) have a distinctive role in lowering the likelihood of a poor outcome by making this diagnosis early.7 Multiple methods of diagnosing SBO are at the disposal of the clinician, including the history and physical examination, abdominal X-ray, ultrasound, CT, and magnetic resonance imaging (MRI).
The history and physical examination can be rapidly performed at the bedside in patients with suspected SBO. The factors typically associated with SBO include constipation, a previous history of abdominal surgeries, abnormal bowel sounds, and abdominal distension.3 However, these findings are not sufficient to accurately and adequately rule in or rule out disease.3,8,9
Diagnostic Imaging
While patient history and physical examination may be helpful in diagnosing SBO, imaging plays a critical role in the definitive diagnosis. The imaging modality that is the de facto gold standard for diagnosis is the CT scan.10 A meta-analysis by Taylor et al,3 which included 64-slice multidetector CT imaging studies (using both oral and IV contrast), demonstrated sensitivities of 93% to 96% and specificities of 93% to 100% in diagnosing SBO.
In patients in whom CT is contraindicated, MRI can be a useful alternative, with studies showing a similar diagnostic accuracy to 64-slice CT.13,14 Both CT and MRI are highly accurate in diagnosing SBO; however, there are disadvantages to their use. Such disadvantages include the inability to perform these studies at bedside; the length of time to perform these studies; the higher cost compared to other modalities; and, in CT, the adverse side effects of radiation and possible contrast reactions.
Bedside Ultrasound
Abdominal X-ray traditionally has been the initial choice in bedside imaging for SBO; however, a recent meta-analysis found this modality to have a summary sensitivity of 75%, specificity of 66%, positive likelihood ratio of 1.6, and negative likelihood ratio of 0.43 in diagnosing SBO.3 Based on these statistics, bedside ultrasound has recently ascended as a viable alternative to abdominal X-ray.
Although there is limited research regarding the accuracy of ultrasound to evaluate SBO, initial study results are encouraging. The previously cited meta-analysis by Taylor et al3 identified six ultrasound studies, two of which were performed in the ED. In one of these two studies, Unlüer et al10 performed a prospective study that enrolled 174 patients in the ED, 90 of whom were subsequently found to have an SBO. In addition, Unlüer et al’s study found that relatively inexperienced emergency medicine (EM) residents were able to use bedside ultrasound in the diagnosis of SBO with a sensitivity of 97.7% and a specificity of 92.7%.
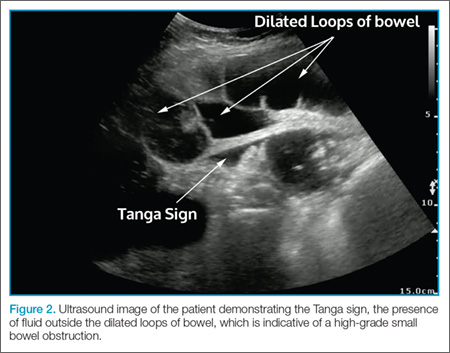
Another ED study by Jang et al15 enrolled 76 patients, 33 of whom were diagnosed with SBO using CT. In this study, the authors found ultrasound to have a 91% sensitivity and 84% specificity for dilated bowel, and a specificity of 98% and sensitivity of 27% for decreased peristalsis.15 Imaging in this study was performed by EM residents, who received only 10 minutes of didactic lecture.
The criteria used in the abovementioned studies varied slightly. The study by Jang et al15 used either fluid-filled dilated bowel >2.5 cm or decreased/absent forward bowel peristalsis, while the study by Unlüer et al10 defined sonographic SBO as two of the three following criteria: greater than 3 dilated loops of either jejunum (>25 mm), or of ileum (>15 mm), increased peristalsis or a collapsed colonic lumen. In cases of higher-grade obstruction, the Tanga sign, fluid seen outside of the dilated loops of bowel, has also been reported (Figure 2).16
Conclusion
There are several distinct advantages to using bedside ultrasound in cases of suspected SBO, including its lack of ionizing radiation, the ability to perform the scan rapidly, and the high accuracy rate in detecting this condition—even in the hands of providers with minimal training. In addition to its cost-effectiveness, ultrasound may be preferred in patients with relative contraindications to CT, such as pregnant patients and patients with contrast allergies. Even in patients in whom there is no contraindication to CT, ultrasound may be used to safely and quickly identify and risk-stratify those who require further imaging versus those who can be safely discharged home—or possibly even finding alternative diagnoses of acute abdominal pain (eg, acute cholecystitis, ureterolithiasis, abdominal aortic aneurysm).
Dr Avila is an attending physician and ultrasound fellow in the department of emergency medicine at the University of Kentucky, Lexington. Dr Smith is the director of emergency ultrasound in the department of emergency medicine at the University of Tennessee College of Medicine Chattanooga. Dr Whittle is the director of research in the department of emergency medicine at the University of Tennessee College of Medicine Chattanooga.
- Hastings RS, Powers RD. Abdominal pain in the ED: a 35 year retrospective. Am J Emerg Med. 201;29(7):711-716.
- Rocha FG, Theman TA, Matros E, Ledbetter SM, Zinner MJ, Ferzoco SJ. Nonoperative management of patients with a diagnosis of high-grade small bowel obstruction by computed tomography. Arch Surg. 2009;144(11):1000-1004.
- Taylor M, Lalani N. Adult small bowel obstruction. Acad Emerg Med. 2013;20(6):528-544.
- Fevang BT, Fevang J, Stangeland L, Soreide O, Svanes K, Viste A. Complications and death after surgical treatment of small bowel obstruction: a 35-year institutional experience. Ann Surg. 2000;231(4):529-537.
- Cheadle WG, Garr EE, Richardson JD. The importance of early diagnosis of small bowel obstruction. Am Surg. 1988;54(9):565-569.
- Bickell NA, Federman AD, Aufses AH Jr. Influence of time on risk of bowel resection in complete small bowel obstruction. J Am Coll Surg. 2005;201(6):847-854.
- Foster NM, McGory ML, Zingmond DS, Ko CY. Small bowel obstruction: a population-based appraisal. J Am Coll Surg. 2006;203(2):170-176.
- Eskelinen M, Ikonen J, Lipponen P. Contributions of history-taking, physical examination, and computer assistance to diagnosis of acute small-bowel obstruction. Scand J Gastroenterol. 1994;29(8):715-721.
- Böhner H, Yang Q, Franke C, Verreet PR, Ohmann C. Simple data from history and physical examination help to exclude bowel obstruction and to avoid radiographic studies in patients with acute abdominal pain. Eur J Surg. 1998;164(10):777-784.
- Unlüer EE, Yavaşi O, Eroğlu O, Yilmaz C, Akarca FK. Ultrasonography by emergency medicine and radiology residents for the diagnosis of small bowel obstruction. Eur J Emerg Med. 2010;17(5):260-264.
- Pongpornsup S, Tarachat K, Srisajjakul S. Accuracy of 64-slice multi-detector computed tomography in diagnosis of small bowel obstruction. J Med Assoc Thai. 2009;92(12):1651-1661.
- Shakil O, Zafar SN, Zia-ur-Rehman, Saleem S, Khan R, Pal KM. The role of computed tomography for identifying mechanical bowel obstruction in a Pakistani population. J Pak Med Assoc. 2011;61(9):871-874.
- Beall DP, Fortman BJ, Lawler BC, Regan F. Imaging bowel obstruction: a comparison between fast magnetic resonance imaging and helical computed tomography. Clin Radiol. 2002;57(8):719-724.
- Regan F, Beall DP, Bohlman ME, Khazan R, Sufi A, Schaefer DC. Fast MR imaging and the detection of small-bowel obstruction. Am J Roentgenol. 1998;170(6):1465-1469.
- Jang TB, Schindler D, Kaji AH. Bedside ultrasonography for the detection of small bowel obstruction in the emergency department. Emerg Med J. 2011;28(8):676-678.
- Grassi R, Romano S, D’Amario F, et al. The relevance of free fluid between intestinal loops detected by sonography in the clinical assessment of small bowel obstruction in adults. Eur J Radiol. 2004;50(1):5-14.
Case
A 64-year-old man presented to the ED seeking assistance in withdrawing from his prescription of oxycodone, which he had been taking to manage chronic pain due to rheumatoid arthritis. He stated that he had discontinued the oxycodone approximately 4 days prior to presentation and over the past 3 days, had been experiencing abdominal pain, nausea, vomiting, diarrhea, and diaphoresis. He noted that his symptoms were identical to those he had during previous unsuccessful attempts to wean himself from the narcotic medication. He denied any fever, dysuria, penile discharge, or any skin changes. Further evaluation revealed a remote history of a cholecystectomy and an appendectomy.
During the initial examination, the patient appeared uncomfortable but in no acute distress. His vital signs were: heart rate, 110 beats/minute; blood pressure, 107/76 mm Hg, respiratory rate, 22 breaths/minute; and temperature, 99˚F. Oxygen saturation was 97% on room air. The abdominal examination revealed moderate diffuse tenderness, mild distension without guarding or rebound, and some well-healed surgical scars.
In light of the abnormal sonographic findings, a computed tomography (CT) scan with intravenous (IV) contrast was performed, which confirmed the diagnosis of a distal small bowel obstruction (SBO). Surgery services were consulted. As the patient’s current symptoms were believed to be the result of an SBO and not from narcotic withdrawal, surgery services instructed nothing by mouth and elected nonsurgical management. They placed a nasogastric tube and administered fluids and analgesics via IV. The patient was discharged 4 days after presentation to the ED, with complete resolution of his symptoms.
Discussion
Annually in the United States, less than 1% of all patients presenting to EDs are subsequently diagnosed with SBO.1 However, this disease comprises 15% of all surgical hospital admissions, costing upward of $1 billion in annual hospital charges.2 Moreover, patients with SBO suffer from a disproportionately high morbidity (eg, bowel strangulation, necrosis) and mortality than the general population,3-5 and delayed diagnosis is associated with a higher risk of bowel resection. One study by Bickell et al6 showed that only 4% of patients appropriately managed less than 24 hours after symptom onset required resection compared with 10% to 14% of patients managed more than 24 hours after symptom onset.
As most patients diagnosed with SBO are first seen in the ED, emergency physicians (EPs) have a distinctive role in lowering the likelihood of a poor outcome by making this diagnosis early.7 Multiple methods of diagnosing SBO are at the disposal of the clinician, including the history and physical examination, abdominal X-ray, ultrasound, CT, and magnetic resonance imaging (MRI).
The history and physical examination can be rapidly performed at the bedside in patients with suspected SBO. The factors typically associated with SBO include constipation, a previous history of abdominal surgeries, abnormal bowel sounds, and abdominal distension.3 However, these findings are not sufficient to accurately and adequately rule in or rule out disease.3,8,9
Diagnostic Imaging
While patient history and physical examination may be helpful in diagnosing SBO, imaging plays a critical role in the definitive diagnosis. The imaging modality that is the de facto gold standard for diagnosis is the CT scan.10 A meta-analysis by Taylor et al,3 which included 64-slice multidetector CT imaging studies (using both oral and IV contrast), demonstrated sensitivities of 93% to 96% and specificities of 93% to 100% in diagnosing SBO.
In patients in whom CT is contraindicated, MRI can be a useful alternative, with studies showing a similar diagnostic accuracy to 64-slice CT.13,14 Both CT and MRI are highly accurate in diagnosing SBO; however, there are disadvantages to their use. Such disadvantages include the inability to perform these studies at bedside; the length of time to perform these studies; the higher cost compared to other modalities; and, in CT, the adverse side effects of radiation and possible contrast reactions.
Bedside Ultrasound
Abdominal X-ray traditionally has been the initial choice in bedside imaging for SBO; however, a recent meta-analysis found this modality to have a summary sensitivity of 75%, specificity of 66%, positive likelihood ratio of 1.6, and negative likelihood ratio of 0.43 in diagnosing SBO.3 Based on these statistics, bedside ultrasound has recently ascended as a viable alternative to abdominal X-ray.
Although there is limited research regarding the accuracy of ultrasound to evaluate SBO, initial study results are encouraging. The previously cited meta-analysis by Taylor et al3 identified six ultrasound studies, two of which were performed in the ED. In one of these two studies, Unlüer et al10 performed a prospective study that enrolled 174 patients in the ED, 90 of whom were subsequently found to have an SBO. In addition, Unlüer et al’s study found that relatively inexperienced emergency medicine (EM) residents were able to use bedside ultrasound in the diagnosis of SBO with a sensitivity of 97.7% and a specificity of 92.7%.
Another ED study by Jang et al15 enrolled 76 patients, 33 of whom were diagnosed with SBO using CT. In this study, the authors found ultrasound to have a 91% sensitivity and 84% specificity for dilated bowel, and a specificity of 98% and sensitivity of 27% for decreased peristalsis.15 Imaging in this study was performed by EM residents, who received only 10 minutes of didactic lecture.
The criteria used in the abovementioned studies varied slightly. The study by Jang et al15 used either fluid-filled dilated bowel >2.5 cm or decreased/absent forward bowel peristalsis, while the study by Unlüer et al10 defined sonographic SBO as two of the three following criteria: greater than 3 dilated loops of either jejunum (>25 mm), or of ileum (>15 mm), increased peristalsis or a collapsed colonic lumen. In cases of higher-grade obstruction, the Tanga sign, fluid seen outside of the dilated loops of bowel, has also been reported (Figure 2).16
Conclusion
There are several distinct advantages to using bedside ultrasound in cases of suspected SBO, including its lack of ionizing radiation, the ability to perform the scan rapidly, and the high accuracy rate in detecting this condition—even in the hands of providers with minimal training. In addition to its cost-effectiveness, ultrasound may be preferred in patients with relative contraindications to CT, such as pregnant patients and patients with contrast allergies. Even in patients in whom there is no contraindication to CT, ultrasound may be used to safely and quickly identify and risk-stratify those who require further imaging versus those who can be safely discharged home—or possibly even finding alternative diagnoses of acute abdominal pain (eg, acute cholecystitis, ureterolithiasis, abdominal aortic aneurysm).
Dr Avila is an attending physician and ultrasound fellow in the department of emergency medicine at the University of Kentucky, Lexington. Dr Smith is the director of emergency ultrasound in the department of emergency medicine at the University of Tennessee College of Medicine Chattanooga. Dr Whittle is the director of research in the department of emergency medicine at the University of Tennessee College of Medicine Chattanooga.
- Hastings RS, Powers RD. Abdominal pain in the ED: a 35 year retrospective. Am J Emerg Med. 201;29(7):711-716.
- Rocha FG, Theman TA, Matros E, Ledbetter SM, Zinner MJ, Ferzoco SJ. Nonoperative management of patients with a diagnosis of high-grade small bowel obstruction by computed tomography. Arch Surg. 2009;144(11):1000-1004.
- Taylor M, Lalani N. Adult small bowel obstruction. Acad Emerg Med. 2013;20(6):528-544.
- Fevang BT, Fevang J, Stangeland L, Soreide O, Svanes K, Viste A. Complications and death after surgical treatment of small bowel obstruction: a 35-year institutional experience. Ann Surg. 2000;231(4):529-537.
- Cheadle WG, Garr EE, Richardson JD. The importance of early diagnosis of small bowel obstruction. Am Surg. 1988;54(9):565-569.
- Bickell NA, Federman AD, Aufses AH Jr. Influence of time on risk of bowel resection in complete small bowel obstruction. J Am Coll Surg. 2005;201(6):847-854.
- Foster NM, McGory ML, Zingmond DS, Ko CY. Small bowel obstruction: a population-based appraisal. J Am Coll Surg. 2006;203(2):170-176.
- Eskelinen M, Ikonen J, Lipponen P. Contributions of history-taking, physical examination, and computer assistance to diagnosis of acute small-bowel obstruction. Scand J Gastroenterol. 1994;29(8):715-721.
- Böhner H, Yang Q, Franke C, Verreet PR, Ohmann C. Simple data from history and physical examination help to exclude bowel obstruction and to avoid radiographic studies in patients with acute abdominal pain. Eur J Surg. 1998;164(10):777-784.
- Unlüer EE, Yavaşi O, Eroğlu O, Yilmaz C, Akarca FK. Ultrasonography by emergency medicine and radiology residents for the diagnosis of small bowel obstruction. Eur J Emerg Med. 2010;17(5):260-264.
- Pongpornsup S, Tarachat K, Srisajjakul S. Accuracy of 64-slice multi-detector computed tomography in diagnosis of small bowel obstruction. J Med Assoc Thai. 2009;92(12):1651-1661.
- Shakil O, Zafar SN, Zia-ur-Rehman, Saleem S, Khan R, Pal KM. The role of computed tomography for identifying mechanical bowel obstruction in a Pakistani population. J Pak Med Assoc. 2011;61(9):871-874.
- Beall DP, Fortman BJ, Lawler BC, Regan F. Imaging bowel obstruction: a comparison between fast magnetic resonance imaging and helical computed tomography. Clin Radiol. 2002;57(8):719-724.
- Regan F, Beall DP, Bohlman ME, Khazan R, Sufi A, Schaefer DC. Fast MR imaging and the detection of small-bowel obstruction. Am J Roentgenol. 1998;170(6):1465-1469.
- Jang TB, Schindler D, Kaji AH. Bedside ultrasonography for the detection of small bowel obstruction in the emergency department. Emerg Med J. 2011;28(8):676-678.
- Grassi R, Romano S, D’Amario F, et al. The relevance of free fluid between intestinal loops detected by sonography in the clinical assessment of small bowel obstruction in adults. Eur J Radiol. 2004;50(1):5-14.