User login
Review of the Long-Term Effects of Proton Pump Inhibitors
Proton pump inhibitors (PPIs) are one of the most frequently used drug classes, given that they are readily accessible over-the-counter as well as via prescription. About 100 million PPI prescriptions dispensed an
The human stomach uses 3 primary neurotransmitters that regulate gastric acid secretion: acetylcholine (ACh), histamine (H), and gastrin (G). The interactions between these neurotransmitters promote and inhibit hydrogen ion (H+) generation. Stimulation of their corresponding receptors draws H+ into parietal cells that line the stomach. Once in the cell, a H+-K+-ATPase (more commonly known as the proton pump) actively transports H+ into the lumen of the stomach. The H+ bind with chlorine ions to form hydrochloric acid, which increases stomach acidity.5 Histamine receptors were thought to be responsible for the greatest degree of stimulation. Hence, histamine type 2-receptor antagonists (H2RAs) became a novel means of therapy to reduce stomach acidity. While utilizing H2RAs was effective, it was theorized the downstream inhibition of the action of all 3 neurotransmitters would serve as a more successful therapy. Therefore, PPIs were developed to target the H+-K+-ATPase Over the past decade, many studies have evaluated the long-term PPI adverse effects (AEs). These include calcium and magnesium malabsorption, vitamin B12 deficiency, Clostridium difficile (C difficile) associated disease (CDAD), and community-acquired pneumonia (CAP). Within the past year, data have become available linking PPI use to dementia and chronic kidney disease (CKD).3,4 The following article reviews literature on the safety of long-term PPI use and proposes recommendations for proper use for their most common indications.
Malabsorption
Calcium & Long-Term Fracture Risk
Calcium is an essential component in bone health and formation. In fact, 99% of all calcium found in the body is stored in bones.6 The primary source of calcium is through diet and oral supplements. After it is ingested, calcium is absorbed from the stomach into the blood in a pH dependent manner. If the pH of the stomach is too high (ie, too basic) calcium is not absorbed into blood and remains in the gastrointestinal (GI) tract for fecal excretion. Without sufficient calcium, the body’s osteoclasts and osteoblasts remain inactive, which hinders proper bone turnover.7
The decrease in acidity leads to calcium malabsorption and increases fracture risk long- term.8 Khalili and colleagues surveyed 80,000 postmenopausal women to measure the incidence of hip fracture in women taking PPIs. The study found that there was a 35% increase in risk of hip fracture among women who regularly used PPIs for at least 2 years (age-adjusted hazard ratio [HR] 1.35; 95% confidence interval [CI], 1.13 -1.62). Adjusted HRs for 4-year and 6- to 8-year use of a PPI was 1.42 (95% CI, 1.05-1.93) and 1.55 (95% CI, 1.03-2.32), respectively, indicating that the longer women were on PPI therapy, the higher the risk of hip fracture. The study also evaluated the time since stopping PPI and the risk of hip fracture. Women who stopped PPI use more than 2 years prior had a similar risk to that of women who never used a PPI, indicating that the effect was reversible.9
Magnesium
Magnesium is an important intracellular ion that has a number of key functions in metabolism and ion transport in the human body. Once ingested, magnesium is absorbed into the bloodstream from the small and large intestines via passive and active transport. Transient receptor potential melastatin 6 (TRPM6) is one of the essential proteins that serve as a transporter for magnesium.10 The high affinity for magnesium of these transporters allows them to maintain adequate levels of magnesium in the blood. In states of low magnesium (hypomagnesemia), the body is at risk for many AEs including seizures, arrhythmias, tetany, and hypotension.11
Proton pump inhibitors have been linked to hypomagnesemia, and recent evaluation has clarified a potential mechanism.12 TRPM6 activity is increased in an acidic environment. When a PPI increases the pH of the stomach, TRPM6 and magnesium levels decrease.12 Luk and colleagues identified 66,102 subjects experiencing AEs while taking a PPI. Hypomagnesemia had a prevalence rate of 1% in these patients. According to the researchers, PPIs were associated with hypomagnesemia and that pantoprazole had the highest incidence among all other PPIs studied (OR, 4.3; 95% CI, 3.3 – 5.7; P < .001).13
Vitamin B12
In recent years, vitamin B12 has been the subject of many studies. An area of concern is vitamin B12’s neurologic effect, as it has been successfully demonstrated that vitamin B12 is essential for proper cognitive function.14 Some data suggest that degeneration is present in parts of the spinal column in patients with cognitive decline or neurologic problems. These lesions are due to improper myelin formation and are specific to vitamin B12 deficiency.15 In 2013 the CDC published the Healthy Brain Initiative, which stated cognitive impairment can be caused by vitamin B12 deficiency.16
Similar to calcium, vitamin B12 needs an acidic environment to be digested and absorbed.17 Vitamin B12 is released from food proteins via gastric acid and pepsin. Once free, the vitamin B12 pairs with R-binders secreted in the stomach. Pancreatic enzymes then degrade this complex into a form that can be absorbed into circulation by the intestine. Given that PPIs reduce the acidity of the stomach, they also reduce the body’s ability to release vitamin B12 from food proteins and be paired with the R-binders.18
In 2013, Lam and colleagues evaluated the association between vitamin B12 deficiency and the use of PPIs and H2RAs. An extensive evaluation was performed on 25,956 patients with a diagnosis of vitamin B12 deficiency and 184,199 patients without. About 12% of patients with vitamin B12 deficiency had received more than a 2-year supply of a PPI, whereas only 7.2% of the patients without vitamin B12 deficiency received a 2-year supply of a PPI. Four point 3 percent of patients with vitamin B12 deficiency received more than a 2-year supply of an H2RA. Only 3.2% of patients without vitamin B12 deficiency received more than a 2-year supply of H2RA. The study concluded that a 2-year or greater history of PPI (OR, 1.65; 95% CI, 1.58-1.73) or H2RA (OR, 1.25; 95% CI, 1.17-1.34) use was associated with vitamin B12 deficiency.19
PPIs and Infections
Clostridium difficile-associated disease
Nationwide CDAD has become a prevalent infection nationwide. In 2011, C difficile caused nearly 500,000 infections and was associated with 29,000 deaths in the U.S.20 One study stated that C difficile is the third most common cause of infectious diarrhea in people aged >75 years.21
C difficile is part of the body’s normal flora in the large intestine. It grows and colonizes in an environment of low acidity. Therefore, in the stomach, where the pH is relatively low, C difficile is unable to colonize.22 When a PPI is introduced, the increased gastric pH increases the risk for CDAD.
Dial and colleagues conducted a multicenter case control study to determine whether gastric acid suppression increases the risk of CDAD. Compared with patients who did not take a gastric acid suppressant, those taking a PPI had a 2.9-fold increase in developing CDAD (95% CI, 2.4-3.4). Comparatively, H2RAs had a 2.0-fold increase for CDAD (95% CI, 1.6 to 2.7). These results correlated with the fact that PPIs have a greater impact on gastric pH than do H2RAs.23
Community-Acquired Pneumonia
Community-acquired pneumonia (CAP) has become a growing concern in the U.S. According to the Infectious Disease Society of America (IDSA) and American Thoracic clinical consensus guidelines, CAP remains one of the top reasons for hospitalizations in the U.S., and about 10% of patients admitted to the hospital for CAP end up in the intensive care unit (ICU).24 In the past, PPIs have been linked to patients’ predisposal for developingCAP.25 Although controversial, available evidence suggests a direct association. In 2008 Sarker and colleagues theorized a mechanism that the acid reduction of the gastric lumen allows for increased bacterial colonization in the upper part of the GI tract.26 Since the acidity of the stomach serves as a defense mechanism against many ingested bacteria, many pathogens will be able to survive in the more basic environment.25
Sarkar and colleagues went on to evaluate 80,000 cases over 15 years. The objective was to examine the association between PPI use and the date of diagnosis of the CAP infection, known as the index date. The study demonstrated that PPI use was not associated with increased CAP risk in the long-term (adjusted odds ratio (OR), 1.02; 95% CI, 0.97-1.08). The study did find a strong increase in the risk of CAP if a PPI was started within 2 days (adjusted OR, 6.53; 95% CI, 3.95-10.80), 7 days (adjusted OR, 3.79; 95% CI, 2.66-5.42), and 14 days (adjusted OR, 3.21; 95% CI, 2.46-4.18) of the index date.26
Four years later, de Jagar and colleagues examined the differences in microbial etiology in CAP patients with and without an active PPI. Over a 4-year study period, 463 individuals were selected with clinical suspicion of CAP. The microbial etiology could be determined in 70% of those patients. The remaining 30% were excluded due to an alternative diagnosis. One of the most likely pathogens to cause a CAP infection is Streptococcus pneumoniae (S pneumonia).27 Patients prescribed a PPI were significantly more likely to be infected with S pneumoniae than those not prescribed a PPI (28% vs 11%). The study concluded that the risk of S pneumoniae in patients taking a PPI was 2.23 times more likely (95% CI, 1.28-3.75).28
Dementia
In 2040, it is estimated that more than 80 million people will have from dementia.29 This is expected to become a large fiscal burden on the health care system. In 2010, about $604 billion was spent on therapy for dementia worldwide.30 Although no cure for dementia exists, it is more feasible than in previous years to prevent its occurrence. However, many medications, including PPIs, are associated with the development of dementia; therefore, it is important to minimize their use when possible.
As noted earlier vitamin B12 deficiency may lead to cognitive decline. Due to the malabsorption of vitamin B12 that results from PPI use, it is hypothesized that PPIs may be associated with incidence of dementia. Badiola and colleagues discovered that in the brains of mice given a PPI, levels of β-amyloid increased significantly affecting enzymes responsible for cognition.31 In a February 2016, JAMA article, researchers conducted a prospective cohort study evaluating 73,679 patients aged ≥75 years with no dementia at baseline. They went on to assess regular use of a PPI, defined as at least 1 PPI prescription every 3 months, and the incidence of dementia. Patients with regular use of a PPI (≥ 1 PPI prescription every 3 months) had a 44% increase risk of incident dementia (HR, 1.44; 95% CI, 1.36-1.52; P < .001).3 Therefore, it is theorized that avoiding PPI use in the elderly may prevent the development of dementia.
Chronic Kidney Disease
The prevalence of CKD has drastically increased in recent decades. It is estimated that up to 13% of people in the U.S. are affected by CKD.32 Some studies suggest that dosing errors occur at much higher rates in patients with declined glomerular filtration rate (GFR).33 The correct utilization use of medications becomes especially pertinent to this population. Several studies have already linked PPI use to acute interstitial nephritis (AIN) and acute kidney injury (AKI).34-36
Lazarus and colleagues evaluated the association between PPI use and the incidence of CKD. Their analysis was performed in a long-term running population-based cohort and replicated in a separate health care system. In the running cohort, patients receiving a PPI had a 1.45-fold greater chance of developing CKD (95% CI, 1.11-1.90; P = .006). In that same cohort, patients on a PPI had a 1.72-fold increase risk of AKI (95% CI, 1.28-2.30; P < .001).4 Similar outcomes were seen in the replicated cohort. However, the replicated cohort did observe that twice daily dosing of a PPI (adjusted HR, 1.46; CI, 1.28-1.67; P < .001) had a stronger association with CKD than once- daily dosing (adjusted HR, 1.15; 95% CI, 1.09-1.21; P < .001). H2RAs exhibited no association with CKD in the running cohort (HR, 1.15; 97% CI, 0.98-1.36; P = .10) or the replication cohort (HR, 0.93; 95% CI, 0.88-0.99; P = .03).4
Clinical PPI Recommendations
There are several FDA-approved and unapproved indications that warrant PPI therapy. Proton pump inhibitor indications include gastroesophageal reflux disease (GERD), peptic ulcer disease (PUD), Helicobacter pylori, and ulcers associated with the use of nonsteroidal anti-inflammatory drugs (NSAIDs).
GERD Recommendations
Optimal dosing and duration is important with all medications to maximize efficacy and minimize toxicity. In the case of PPIs, dosing and duration are of particularly concern due to the aforementioned AEs. Table illustrates manufacturer-recommended dosing and duration for the most commonly prescribed PPIs. Although these dosing regimens are based on clinical studies, PPIs are commonly prescribed at higher doses and for longer durations. By extending the duration of therapy, the risk of potential long-term AEs increases dramatically. If durations are limited to the recommended window, risk of AEs can be reduced.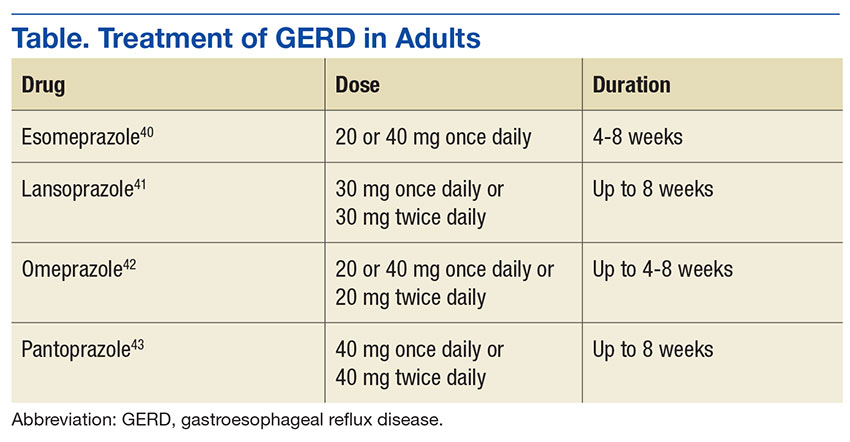
Alternative Therapies
There are several strategies that exist to limit the use of PPIs, including lifestyle modifications to prevent GERD, supplementation of an alternative agent to prevent high doses of the PPI, or discontinuing PPI therapy all together. Lifestyle modifications provide additional benefit as monotherapy or to supplement a pharmacologic regimen.
The American Journal of Gastroenterology promoted lifestyle modifications that include:
- Weight loss for patients with GERD who are overweight and had a recent weight gain;
- Elevation of the head of the bed (if nighttime symptoms present);
- Elimination of dietary triggers;
- Fatty foods, caffeine, chocolate, spicy food, food with high fat content, carbonated beverages, and peppermint;
- Avoiding tight fitting garments to prevent increase in gastric pressure;
- Promote salivation through oral lozenges or chewing gum to neutralize refluxed acid;
- Avoidance of tobacco and alcohol; and
- Abdominal breathing exercise to strengthen the barrier of the lower esophageal sphincter.37
The above modifications may reduce the need for pharmacologic therapy, thereby reducing possible of long-term AEs.
If lifestyle modifications alone are not enough, it is reasonable to use a H2RA for acute symptom relief or reduce high doses and frequencies of a PPI. H2RAs are well studied and effective in the management of GERD. According to the American College of Gastroenterology 2013 clinical practice guidelines, H2RAs can serve as an effective maintenance medication to relieve heartburn in patients without erosive disease. The guideline also states that a bedtime H2RA can be used to supplement a once- daily daytime PPI if nighttime reflux exists. This can eliminate the need to exceed manufacturer-recommended doses.37
One of the final challenges to overcome is a patient that has been maintained on chronic PPI therapy. However, caution should be exercised if choosing to discontinue a PPI. In a study by Niklesson and colleagues, after a 4-week course of pantoprazole given to healthy volunteers, those patients with no preexisting symptoms developed dyspeptic symptoms of GERD, such as heartburn, indigestion, and stomach discomfort. This correlation suggests that a rebound hypersecretion occurs after prolonged suppression of the proton pump, and therefore a gradual taper should be used.38 Although no definitive national recommendations on how to taper a patient off of a PPI exist, one suggestion is a 2- to 3-week taper by using a half-dose once daily or full dose on alternate days.39 This strategy has exhibited moderate success rates when used. Oral and written education on symptom management and the administration of H2RAs for infrequent breakthrough symptoms supplemented the reduction of the PPI.
Conclusion
Proton pump inhibitors have become a popular and effective drug class for a multitude of indications. However, it is crucial to recognize the risk of long-term use. It is important to properly assess the need for a PPI and to use appropriate dosing and duration, since prolonged durations and doses above the manufacturer’s recommendations is a primary contributor to long-term consequences. Both package inserts and clinical guidelines serve as valuable resources to help balance the risks and benefits of this medication class and can help guide therapeutic decisions.
1. U.S. Food and Drug Administration. FDA Drug Safety Communication: Low magnesium levels can be associated with long-term use of Proton Pump Inhibitor drugs (PPIs). http://www.fda.gov/Drugs/DrugSafety/ucm245011.htm. Updated April 7, 2016. Accessed January 12, 2017.
2. Forgacs I. Overprescribing proton pump inhibitors. BMJ. 2008;336(7634):2-3.
3. Gomm W, von Holt K, Thome F, et al. Association of proton pump inhibitors with risk of dementia. JAMA Neurol. 2016;73(4):410-416.
4. Lazarus B, Chen Y, Wilson FP, et al. Proton pump inhibitor use and the risk of chronic kidney disease. JAMA Intern Med. 2016;176(2):238-246.
5. Wolfe MM, Soll AH. The physiology of gastric acid secretion. N Engl J Med. 1988;319(26):1707-1715.
6. Flynn A. The role of dietary calcium in bone health. Proc Nutr Soc. 2003;62(4):851-858.
7. Mizunashi K, Furukawa Y, Katano K, Abe K. Effect of omeprazole, an inhibitor of H+, K(+)-ATPase, on bone resorption in humans. Calcif Tissue Int. 1993;53(1):21-25.
8. O’Connell MB, Darren DM, Murray AM, Heaney RP, Kerzner LJ. Effects of proton pump inhibitors on calcium carbonate absorption in women: a randomized crossover trial. Am J Med. 2005;118(7):778-781.
9. Khalili H, Huang ES, Jacobson BC, Camargo CA Jr, Feskanich D, Chan AT. Use of proton pump inhibitors and risk of hip fracture in relation to dietary and lifestyle factors: a prospective cohort study. BMJ. 2012;344:e372.
10. Schweigel M, Martens H. Magnesium transport in the gastrointestinal tract. Front Biosci. 2000;5:D666-D677.
11. Hess MW, Hoenderop JG, Bindels RJ, Drenth JP. Systematic review: hypomagnesaemia induced by proton pump inhibition. Aliment Pharmacol Ther. 2012;36(5):405-413.
12. William JH, Danziger J. Proton-pump inhibitor-induced hypomagnesemia: current research and proposed mechanisms. World J Nephrol. 2016;5(2):152-157.
13. Luk CP, Parsons R, Lee YP, Hughes JD. Proton pump inhibitor-associated hypomagnesemia: what do FDA data tell us? Ann Pharmacother. 2013;47(6):773-780.
14. Health Quality Ontario. Vitamin B12 and cognitive function: an evidence-based analysis. Ont Health Technol Assess Ser. 2013;13(23):1-45.
15. Green R, Kinsella LJ. Current concepts in the diagnosis of cobalamin deficiency. Neurology. 1995;45(8):1435-1440.
16. Centers for Disease Control and Prevention. The Healthy Brain Initiative. https://www.cdc.gov/aging/pdf/2013-healthy-brain-initiative.pdf. Accessed January 17, 2017.
17. Toh BH, van Driel IR, Gleeson PA. Pernicious anemia. N Engl J Med. 1997;337(20):1441-1448.
18. Tefferi A, Pruthi RK. The biochemical basis of cobalamin deficiency. Mayo Clin Proc. 1994;69(2):181-186.
19. Lam JR, Schneider JL, Zhao W, Corley DA. Proton pump inhibitor and histamine 2 receptor antagonist use and vitamin B12 deficiency. JAMA. 2013;310(22):2435-2442.
20. Lessa FC, Mu Y, Bamberg WM, et al. Burden of Clostridium difficile infection in the United States. N Engl J Med. 2015;372(9):825-834.
21. National Clostridium difficile Standards Group. National Clostridium difficile Standards Group: report to the Department of Health. J Hosp Infect. 2004;56(suppl 1):1-38.
22. Thorens J, Frohlich F, Schwizer W, et al. Bacterial overgrowth during treatment with omeprazole compared with cimetidine. Gut. 1996;39(1):54-59.
23. Dial S, Delaney JAC, Barkun AN, et al. Use of gastric acid-suppressive agents and the risk of community-acquired Clostridium difficile-associated disease. JAMA. 2005;294(23):2989-2995
24. Mandell LA, Wunderink RG, Anzueto A, et al; Infectious Diseases Society of America; and American Thoracic Society. Infectious Diseases Society of America/American Thoracic Society consensus guidelines on the management of community-acquired pneumonia in adults. Clin Infect Dis. 2007;44(suppl 2):S27-S72.
25. Laheij RJ, Sturkenboom MC, Hassing RJ, Dieleman J, Stricker BH, Jansen JB. Risk of community-acquired pneumonia and use of gastric acid-suppressive drugs. JAMA. 2004;292(16):1955-1960.
26. Sarkar M, Hennessy S, Yang Y. Proton-pump inhibitor use and the risk for community-acquired pneumonia. Ann Intern Med. 2008;149(6):391-398.
27. Waterer GW, Wunderink RG. The influence of the severity of community-acquired pneumonia on the usefulness of blood cultures. Respir Med. 2001;95(1):78-82.
28. de Jagar CP, Wever PC, Gemen EF, et al. Proton pump inhibitor therapy predisposes to community-acquired Streptococcus pneumoniae pneumonia. Aliment Pharmacol Ther. 2012;36(10):941-949.
29. Reitz C, Brayne C, Mayeux R. Epidemiology of Alzheimer disease. Nat Rev Neurol. 2011;7(3):137-152.
30. Wimo A, Jönsson L, Bond J, Prince M, Winblad B; Alzheimer Disease International. The worldwide economic impact of dementia 2010. Alzheimers Dement. 2013;9(1):1-11.
31. Badiola N, Alcalde V, Pujol A, et al. The proton-pump inhibitor lansoprazole enhances amyloid beta production. PLoS One. 2013;8(3):e58537.
32. Stevens LA, Li S, Wang C, et al. Prevalence of CKD and comorbid illness in elderly patients in the United States: results from the Kidney Early Evaluation Program (KEEP). Am J Kidney Dis. 2010;55(3)(suppl 2):S23-S33.
33. Weir MR, Fink JC. Safety of medical therapy in patients with chronic kidney disease and end-stage renal disease. Curr Opin Nephrol Hypertens 2014;23(3):306-313.
34. Blank ML, Parkin L, Paul C, Herbison P. A nationwide nested case-control study indicates an increased risk of acute interstitial nephritis with proton pump inhibitor use. Kidney Int. 2014;86(4):837-844.
35. Antoniou T, Macdonald EM, Holland S, et al. Proton pump inhibitors and the risk of acute kidney injury in older patients: a population-based cohort study. CMAJ Open. 2015;3(2):E166-E171.
36. Klepser DG, Collier DS, Cochran GL. Proton pump inhibitors and acute kidney injury: a nested case-control study. BMC Nephrol. 2013;14:150.
37. Katz PO, Gerson LB, Vela MF. Guidelines for the diagnosis and management of gastroesophageal reflux disease. Am J Gastroenterol. 2013;108(3):308-328.
38. Niklasson A, Lindström L, Simrén M, Lindberg G, Björnsson E. Dyspeptic symptom development after discontinuation of a proton pump inhibitor: a double-blind placebo-controlled trial. Am J Gastroenterol. 2010;105(7):1531-1537.
39. Haastrup P, Paulsen MS, Begtrup LM, Hansen JM, Jarbøl DE. Strategies for discontinuation of proton pump inhibitors: a systematic review. Fam Pract. 2014;31(6):625-630.
40. Nexium [package insert]. Wilmington, DE: AstraZeneca Pharmaceuticals; 2012.
41. Prevacid [package insert]. Deerfield, IL: Takeda Pharmaceuticals; 2012.
42. Prilosec [package insert]. Wilmington, DE: AstraZeneca Pharmaceuticals; 2012.
43. Protonix [package insert]. Konstanz, Germany: Pfizer; 2012.
Proton pump inhibitors (PPIs) are one of the most frequently used drug classes, given that they are readily accessible over-the-counter as well as via prescription. About 100 million PPI prescriptions dispensed an
The human stomach uses 3 primary neurotransmitters that regulate gastric acid secretion: acetylcholine (ACh), histamine (H), and gastrin (G). The interactions between these neurotransmitters promote and inhibit hydrogen ion (H+) generation. Stimulation of their corresponding receptors draws H+ into parietal cells that line the stomach. Once in the cell, a H+-K+-ATPase (more commonly known as the proton pump) actively transports H+ into the lumen of the stomach. The H+ bind with chlorine ions to form hydrochloric acid, which increases stomach acidity.5 Histamine receptors were thought to be responsible for the greatest degree of stimulation. Hence, histamine type 2-receptor antagonists (H2RAs) became a novel means of therapy to reduce stomach acidity. While utilizing H2RAs was effective, it was theorized the downstream inhibition of the action of all 3 neurotransmitters would serve as a more successful therapy. Therefore, PPIs were developed to target the H+-K+-ATPase Over the past decade, many studies have evaluated the long-term PPI adverse effects (AEs). These include calcium and magnesium malabsorption, vitamin B12 deficiency, Clostridium difficile (C difficile) associated disease (CDAD), and community-acquired pneumonia (CAP). Within the past year, data have become available linking PPI use to dementia and chronic kidney disease (CKD).3,4 The following article reviews literature on the safety of long-term PPI use and proposes recommendations for proper use for their most common indications.
Malabsorption
Calcium & Long-Term Fracture Risk
Calcium is an essential component in bone health and formation. In fact, 99% of all calcium found in the body is stored in bones.6 The primary source of calcium is through diet and oral supplements. After it is ingested, calcium is absorbed from the stomach into the blood in a pH dependent manner. If the pH of the stomach is too high (ie, too basic) calcium is not absorbed into blood and remains in the gastrointestinal (GI) tract for fecal excretion. Without sufficient calcium, the body’s osteoclasts and osteoblasts remain inactive, which hinders proper bone turnover.7
The decrease in acidity leads to calcium malabsorption and increases fracture risk long- term.8 Khalili and colleagues surveyed 80,000 postmenopausal women to measure the incidence of hip fracture in women taking PPIs. The study found that there was a 35% increase in risk of hip fracture among women who regularly used PPIs for at least 2 years (age-adjusted hazard ratio [HR] 1.35; 95% confidence interval [CI], 1.13 -1.62). Adjusted HRs for 4-year and 6- to 8-year use of a PPI was 1.42 (95% CI, 1.05-1.93) and 1.55 (95% CI, 1.03-2.32), respectively, indicating that the longer women were on PPI therapy, the higher the risk of hip fracture. The study also evaluated the time since stopping PPI and the risk of hip fracture. Women who stopped PPI use more than 2 years prior had a similar risk to that of women who never used a PPI, indicating that the effect was reversible.9
Magnesium
Magnesium is an important intracellular ion that has a number of key functions in metabolism and ion transport in the human body. Once ingested, magnesium is absorbed into the bloodstream from the small and large intestines via passive and active transport. Transient receptor potential melastatin 6 (TRPM6) is one of the essential proteins that serve as a transporter for magnesium.10 The high affinity for magnesium of these transporters allows them to maintain adequate levels of magnesium in the blood. In states of low magnesium (hypomagnesemia), the body is at risk for many AEs including seizures, arrhythmias, tetany, and hypotension.11
Proton pump inhibitors have been linked to hypomagnesemia, and recent evaluation has clarified a potential mechanism.12 TRPM6 activity is increased in an acidic environment. When a PPI increases the pH of the stomach, TRPM6 and magnesium levels decrease.12 Luk and colleagues identified 66,102 subjects experiencing AEs while taking a PPI. Hypomagnesemia had a prevalence rate of 1% in these patients. According to the researchers, PPIs were associated with hypomagnesemia and that pantoprazole had the highest incidence among all other PPIs studied (OR, 4.3; 95% CI, 3.3 – 5.7; P < .001).13
Vitamin B12
In recent years, vitamin B12 has been the subject of many studies. An area of concern is vitamin B12’s neurologic effect, as it has been successfully demonstrated that vitamin B12 is essential for proper cognitive function.14 Some data suggest that degeneration is present in parts of the spinal column in patients with cognitive decline or neurologic problems. These lesions are due to improper myelin formation and are specific to vitamin B12 deficiency.15 In 2013 the CDC published the Healthy Brain Initiative, which stated cognitive impairment can be caused by vitamin B12 deficiency.16
Similar to calcium, vitamin B12 needs an acidic environment to be digested and absorbed.17 Vitamin B12 is released from food proteins via gastric acid and pepsin. Once free, the vitamin B12 pairs with R-binders secreted in the stomach. Pancreatic enzymes then degrade this complex into a form that can be absorbed into circulation by the intestine. Given that PPIs reduce the acidity of the stomach, they also reduce the body’s ability to release vitamin B12 from food proteins and be paired with the R-binders.18
In 2013, Lam and colleagues evaluated the association between vitamin B12 deficiency and the use of PPIs and H2RAs. An extensive evaluation was performed on 25,956 patients with a diagnosis of vitamin B12 deficiency and 184,199 patients without. About 12% of patients with vitamin B12 deficiency had received more than a 2-year supply of a PPI, whereas only 7.2% of the patients without vitamin B12 deficiency received a 2-year supply of a PPI. Four point 3 percent of patients with vitamin B12 deficiency received more than a 2-year supply of an H2RA. Only 3.2% of patients without vitamin B12 deficiency received more than a 2-year supply of H2RA. The study concluded that a 2-year or greater history of PPI (OR, 1.65; 95% CI, 1.58-1.73) or H2RA (OR, 1.25; 95% CI, 1.17-1.34) use was associated with vitamin B12 deficiency.19
PPIs and Infections
Clostridium difficile-associated disease
Nationwide CDAD has become a prevalent infection nationwide. In 2011, C difficile caused nearly 500,000 infections and was associated with 29,000 deaths in the U.S.20 One study stated that C difficile is the third most common cause of infectious diarrhea in people aged >75 years.21
C difficile is part of the body’s normal flora in the large intestine. It grows and colonizes in an environment of low acidity. Therefore, in the stomach, where the pH is relatively low, C difficile is unable to colonize.22 When a PPI is introduced, the increased gastric pH increases the risk for CDAD.
Dial and colleagues conducted a multicenter case control study to determine whether gastric acid suppression increases the risk of CDAD. Compared with patients who did not take a gastric acid suppressant, those taking a PPI had a 2.9-fold increase in developing CDAD (95% CI, 2.4-3.4). Comparatively, H2RAs had a 2.0-fold increase for CDAD (95% CI, 1.6 to 2.7). These results correlated with the fact that PPIs have a greater impact on gastric pH than do H2RAs.23
Community-Acquired Pneumonia
Community-acquired pneumonia (CAP) has become a growing concern in the U.S. According to the Infectious Disease Society of America (IDSA) and American Thoracic clinical consensus guidelines, CAP remains one of the top reasons for hospitalizations in the U.S., and about 10% of patients admitted to the hospital for CAP end up in the intensive care unit (ICU).24 In the past, PPIs have been linked to patients’ predisposal for developingCAP.25 Although controversial, available evidence suggests a direct association. In 2008 Sarker and colleagues theorized a mechanism that the acid reduction of the gastric lumen allows for increased bacterial colonization in the upper part of the GI tract.26 Since the acidity of the stomach serves as a defense mechanism against many ingested bacteria, many pathogens will be able to survive in the more basic environment.25
Sarkar and colleagues went on to evaluate 80,000 cases over 15 years. The objective was to examine the association between PPI use and the date of diagnosis of the CAP infection, known as the index date. The study demonstrated that PPI use was not associated with increased CAP risk in the long-term (adjusted odds ratio (OR), 1.02; 95% CI, 0.97-1.08). The study did find a strong increase in the risk of CAP if a PPI was started within 2 days (adjusted OR, 6.53; 95% CI, 3.95-10.80), 7 days (adjusted OR, 3.79; 95% CI, 2.66-5.42), and 14 days (adjusted OR, 3.21; 95% CI, 2.46-4.18) of the index date.26
Four years later, de Jagar and colleagues examined the differences in microbial etiology in CAP patients with and without an active PPI. Over a 4-year study period, 463 individuals were selected with clinical suspicion of CAP. The microbial etiology could be determined in 70% of those patients. The remaining 30% were excluded due to an alternative diagnosis. One of the most likely pathogens to cause a CAP infection is Streptococcus pneumoniae (S pneumonia).27 Patients prescribed a PPI were significantly more likely to be infected with S pneumoniae than those not prescribed a PPI (28% vs 11%). The study concluded that the risk of S pneumoniae in patients taking a PPI was 2.23 times more likely (95% CI, 1.28-3.75).28
Dementia
In 2040, it is estimated that more than 80 million people will have from dementia.29 This is expected to become a large fiscal burden on the health care system. In 2010, about $604 billion was spent on therapy for dementia worldwide.30 Although no cure for dementia exists, it is more feasible than in previous years to prevent its occurrence. However, many medications, including PPIs, are associated with the development of dementia; therefore, it is important to minimize their use when possible.
As noted earlier vitamin B12 deficiency may lead to cognitive decline. Due to the malabsorption of vitamin B12 that results from PPI use, it is hypothesized that PPIs may be associated with incidence of dementia. Badiola and colleagues discovered that in the brains of mice given a PPI, levels of β-amyloid increased significantly affecting enzymes responsible for cognition.31 In a February 2016, JAMA article, researchers conducted a prospective cohort study evaluating 73,679 patients aged ≥75 years with no dementia at baseline. They went on to assess regular use of a PPI, defined as at least 1 PPI prescription every 3 months, and the incidence of dementia. Patients with regular use of a PPI (≥ 1 PPI prescription every 3 months) had a 44% increase risk of incident dementia (HR, 1.44; 95% CI, 1.36-1.52; P < .001).3 Therefore, it is theorized that avoiding PPI use in the elderly may prevent the development of dementia.
Chronic Kidney Disease
The prevalence of CKD has drastically increased in recent decades. It is estimated that up to 13% of people in the U.S. are affected by CKD.32 Some studies suggest that dosing errors occur at much higher rates in patients with declined glomerular filtration rate (GFR).33 The correct utilization use of medications becomes especially pertinent to this population. Several studies have already linked PPI use to acute interstitial nephritis (AIN) and acute kidney injury (AKI).34-36
Lazarus and colleagues evaluated the association between PPI use and the incidence of CKD. Their analysis was performed in a long-term running population-based cohort and replicated in a separate health care system. In the running cohort, patients receiving a PPI had a 1.45-fold greater chance of developing CKD (95% CI, 1.11-1.90; P = .006). In that same cohort, patients on a PPI had a 1.72-fold increase risk of AKI (95% CI, 1.28-2.30; P < .001).4 Similar outcomes were seen in the replicated cohort. However, the replicated cohort did observe that twice daily dosing of a PPI (adjusted HR, 1.46; CI, 1.28-1.67; P < .001) had a stronger association with CKD than once- daily dosing (adjusted HR, 1.15; 95% CI, 1.09-1.21; P < .001). H2RAs exhibited no association with CKD in the running cohort (HR, 1.15; 97% CI, 0.98-1.36; P = .10) or the replication cohort (HR, 0.93; 95% CI, 0.88-0.99; P = .03).4
Clinical PPI Recommendations
There are several FDA-approved and unapproved indications that warrant PPI therapy. Proton pump inhibitor indications include gastroesophageal reflux disease (GERD), peptic ulcer disease (PUD), Helicobacter pylori, and ulcers associated with the use of nonsteroidal anti-inflammatory drugs (NSAIDs).
GERD Recommendations
Optimal dosing and duration is important with all medications to maximize efficacy and minimize toxicity. In the case of PPIs, dosing and duration are of particularly concern due to the aforementioned AEs. Table illustrates manufacturer-recommended dosing and duration for the most commonly prescribed PPIs. Although these dosing regimens are based on clinical studies, PPIs are commonly prescribed at higher doses and for longer durations. By extending the duration of therapy, the risk of potential long-term AEs increases dramatically. If durations are limited to the recommended window, risk of AEs can be reduced.
Alternative Therapies
There are several strategies that exist to limit the use of PPIs, including lifestyle modifications to prevent GERD, supplementation of an alternative agent to prevent high doses of the PPI, or discontinuing PPI therapy all together. Lifestyle modifications provide additional benefit as monotherapy or to supplement a pharmacologic regimen.
The American Journal of Gastroenterology promoted lifestyle modifications that include:
- Weight loss for patients with GERD who are overweight and had a recent weight gain;
- Elevation of the head of the bed (if nighttime symptoms present);
- Elimination of dietary triggers;
- Fatty foods, caffeine, chocolate, spicy food, food with high fat content, carbonated beverages, and peppermint;
- Avoiding tight fitting garments to prevent increase in gastric pressure;
- Promote salivation through oral lozenges or chewing gum to neutralize refluxed acid;
- Avoidance of tobacco and alcohol; and
- Abdominal breathing exercise to strengthen the barrier of the lower esophageal sphincter.37
The above modifications may reduce the need for pharmacologic therapy, thereby reducing possible of long-term AEs.
If lifestyle modifications alone are not enough, it is reasonable to use a H2RA for acute symptom relief or reduce high doses and frequencies of a PPI. H2RAs are well studied and effective in the management of GERD. According to the American College of Gastroenterology 2013 clinical practice guidelines, H2RAs can serve as an effective maintenance medication to relieve heartburn in patients without erosive disease. The guideline also states that a bedtime H2RA can be used to supplement a once- daily daytime PPI if nighttime reflux exists. This can eliminate the need to exceed manufacturer-recommended doses.37
One of the final challenges to overcome is a patient that has been maintained on chronic PPI therapy. However, caution should be exercised if choosing to discontinue a PPI. In a study by Niklesson and colleagues, after a 4-week course of pantoprazole given to healthy volunteers, those patients with no preexisting symptoms developed dyspeptic symptoms of GERD, such as heartburn, indigestion, and stomach discomfort. This correlation suggests that a rebound hypersecretion occurs after prolonged suppression of the proton pump, and therefore a gradual taper should be used.38 Although no definitive national recommendations on how to taper a patient off of a PPI exist, one suggestion is a 2- to 3-week taper by using a half-dose once daily or full dose on alternate days.39 This strategy has exhibited moderate success rates when used. Oral and written education on symptom management and the administration of H2RAs for infrequent breakthrough symptoms supplemented the reduction of the PPI.
Conclusion
Proton pump inhibitors have become a popular and effective drug class for a multitude of indications. However, it is crucial to recognize the risk of long-term use. It is important to properly assess the need for a PPI and to use appropriate dosing and duration, since prolonged durations and doses above the manufacturer’s recommendations is a primary contributor to long-term consequences. Both package inserts and clinical guidelines serve as valuable resources to help balance the risks and benefits of this medication class and can help guide therapeutic decisions.
1. U.S. Food and Drug Administration. FDA Drug Safety Communication: Low magnesium levels can be associated with long-term use of Proton Pump Inhibitor drugs (PPIs). http://www.fda.gov/Drugs/DrugSafety/ucm245011.htm. Updated April 7, 2016. Accessed January 12, 2017.
2. Forgacs I. Overprescribing proton pump inhibitors. BMJ. 2008;336(7634):2-3.
3. Gomm W, von Holt K, Thome F, et al. Association of proton pump inhibitors with risk of dementia. JAMA Neurol. 2016;73(4):410-416.
4. Lazarus B, Chen Y, Wilson FP, et al. Proton pump inhibitor use and the risk of chronic kidney disease. JAMA Intern Med. 2016;176(2):238-246.
5. Wolfe MM, Soll AH. The physiology of gastric acid secretion. N Engl J Med. 1988;319(26):1707-1715.
6. Flynn A. The role of dietary calcium in bone health. Proc Nutr Soc. 2003;62(4):851-858.
7. Mizunashi K, Furukawa Y, Katano K, Abe K. Effect of omeprazole, an inhibitor of H+, K(+)-ATPase, on bone resorption in humans. Calcif Tissue Int. 1993;53(1):21-25.
8. O’Connell MB, Darren DM, Murray AM, Heaney RP, Kerzner LJ. Effects of proton pump inhibitors on calcium carbonate absorption in women: a randomized crossover trial. Am J Med. 2005;118(7):778-781.
9. Khalili H, Huang ES, Jacobson BC, Camargo CA Jr, Feskanich D, Chan AT. Use of proton pump inhibitors and risk of hip fracture in relation to dietary and lifestyle factors: a prospective cohort study. BMJ. 2012;344:e372.
10. Schweigel M, Martens H. Magnesium transport in the gastrointestinal tract. Front Biosci. 2000;5:D666-D677.
11. Hess MW, Hoenderop JG, Bindels RJ, Drenth JP. Systematic review: hypomagnesaemia induced by proton pump inhibition. Aliment Pharmacol Ther. 2012;36(5):405-413.
12. William JH, Danziger J. Proton-pump inhibitor-induced hypomagnesemia: current research and proposed mechanisms. World J Nephrol. 2016;5(2):152-157.
13. Luk CP, Parsons R, Lee YP, Hughes JD. Proton pump inhibitor-associated hypomagnesemia: what do FDA data tell us? Ann Pharmacother. 2013;47(6):773-780.
14. Health Quality Ontario. Vitamin B12 and cognitive function: an evidence-based analysis. Ont Health Technol Assess Ser. 2013;13(23):1-45.
15. Green R, Kinsella LJ. Current concepts in the diagnosis of cobalamin deficiency. Neurology. 1995;45(8):1435-1440.
16. Centers for Disease Control and Prevention. The Healthy Brain Initiative. https://www.cdc.gov/aging/pdf/2013-healthy-brain-initiative.pdf. Accessed January 17, 2017.
17. Toh BH, van Driel IR, Gleeson PA. Pernicious anemia. N Engl J Med. 1997;337(20):1441-1448.
18. Tefferi A, Pruthi RK. The biochemical basis of cobalamin deficiency. Mayo Clin Proc. 1994;69(2):181-186.
19. Lam JR, Schneider JL, Zhao W, Corley DA. Proton pump inhibitor and histamine 2 receptor antagonist use and vitamin B12 deficiency. JAMA. 2013;310(22):2435-2442.
20. Lessa FC, Mu Y, Bamberg WM, et al. Burden of Clostridium difficile infection in the United States. N Engl J Med. 2015;372(9):825-834.
21. National Clostridium difficile Standards Group. National Clostridium difficile Standards Group: report to the Department of Health. J Hosp Infect. 2004;56(suppl 1):1-38.
22. Thorens J, Frohlich F, Schwizer W, et al. Bacterial overgrowth during treatment with omeprazole compared with cimetidine. Gut. 1996;39(1):54-59.
23. Dial S, Delaney JAC, Barkun AN, et al. Use of gastric acid-suppressive agents and the risk of community-acquired Clostridium difficile-associated disease. JAMA. 2005;294(23):2989-2995
24. Mandell LA, Wunderink RG, Anzueto A, et al; Infectious Diseases Society of America; and American Thoracic Society. Infectious Diseases Society of America/American Thoracic Society consensus guidelines on the management of community-acquired pneumonia in adults. Clin Infect Dis. 2007;44(suppl 2):S27-S72.
25. Laheij RJ, Sturkenboom MC, Hassing RJ, Dieleman J, Stricker BH, Jansen JB. Risk of community-acquired pneumonia and use of gastric acid-suppressive drugs. JAMA. 2004;292(16):1955-1960.
26. Sarkar M, Hennessy S, Yang Y. Proton-pump inhibitor use and the risk for community-acquired pneumonia. Ann Intern Med. 2008;149(6):391-398.
27. Waterer GW, Wunderink RG. The influence of the severity of community-acquired pneumonia on the usefulness of blood cultures. Respir Med. 2001;95(1):78-82.
28. de Jagar CP, Wever PC, Gemen EF, et al. Proton pump inhibitor therapy predisposes to community-acquired Streptococcus pneumoniae pneumonia. Aliment Pharmacol Ther. 2012;36(10):941-949.
29. Reitz C, Brayne C, Mayeux R. Epidemiology of Alzheimer disease. Nat Rev Neurol. 2011;7(3):137-152.
30. Wimo A, Jönsson L, Bond J, Prince M, Winblad B; Alzheimer Disease International. The worldwide economic impact of dementia 2010. Alzheimers Dement. 2013;9(1):1-11.
31. Badiola N, Alcalde V, Pujol A, et al. The proton-pump inhibitor lansoprazole enhances amyloid beta production. PLoS One. 2013;8(3):e58537.
32. Stevens LA, Li S, Wang C, et al. Prevalence of CKD and comorbid illness in elderly patients in the United States: results from the Kidney Early Evaluation Program (KEEP). Am J Kidney Dis. 2010;55(3)(suppl 2):S23-S33.
33. Weir MR, Fink JC. Safety of medical therapy in patients with chronic kidney disease and end-stage renal disease. Curr Opin Nephrol Hypertens 2014;23(3):306-313.
34. Blank ML, Parkin L, Paul C, Herbison P. A nationwide nested case-control study indicates an increased risk of acute interstitial nephritis with proton pump inhibitor use. Kidney Int. 2014;86(4):837-844.
35. Antoniou T, Macdonald EM, Holland S, et al. Proton pump inhibitors and the risk of acute kidney injury in older patients: a population-based cohort study. CMAJ Open. 2015;3(2):E166-E171.
36. Klepser DG, Collier DS, Cochran GL. Proton pump inhibitors and acute kidney injury: a nested case-control study. BMC Nephrol. 2013;14:150.
37. Katz PO, Gerson LB, Vela MF. Guidelines for the diagnosis and management of gastroesophageal reflux disease. Am J Gastroenterol. 2013;108(3):308-328.
38. Niklasson A, Lindström L, Simrén M, Lindberg G, Björnsson E. Dyspeptic symptom development after discontinuation of a proton pump inhibitor: a double-blind placebo-controlled trial. Am J Gastroenterol. 2010;105(7):1531-1537.
39. Haastrup P, Paulsen MS, Begtrup LM, Hansen JM, Jarbøl DE. Strategies for discontinuation of proton pump inhibitors: a systematic review. Fam Pract. 2014;31(6):625-630.
40. Nexium [package insert]. Wilmington, DE: AstraZeneca Pharmaceuticals; 2012.
41. Prevacid [package insert]. Deerfield, IL: Takeda Pharmaceuticals; 2012.
42. Prilosec [package insert]. Wilmington, DE: AstraZeneca Pharmaceuticals; 2012.
43. Protonix [package insert]. Konstanz, Germany: Pfizer; 2012.
Biosimilars in Psoriasis: The Future or Not?
According to the US Food and Drug Administration (FDA), a biosimilar is “highly similar to an FDA-approved biological product, . . . and has no clinically meaningful differences in terms of safety and effectiveness.”1 The Biologics Price Competition and Innovation (BPCI) Act of 2009 created an expedited pathway for the approval of products shown to be biosimilar to FDA-licensed reference products.2 In 2013, the European Medicines Agency approved the first biosimilar modeled on infliximab (Remsima [formerly known as CT-P13], Celltrion Healthcare Co, Ltd) for the same indications as its reference product.3 In 2016, the FDA approved Inflectra (Hospira, a Pfizer Company), an infliximab biosimilar; Erelzi (Sandoz, a Novartis Division), an etanercept biosimilar; and Amjevita (Amgen Inc), an adalimumab biosimilar, all for numerous clinical indications including plaque psoriasis and psoriatic arthritis.4-6
There has been a substantial amount of distrust surrounding the biosimilars; however, as the patents for the biologic agents expire, new biosimilars will undoubtedly flood the market. In this article, we provide information that will help dermatologists understand the need for and use of these agents.
Biosimilars Versus Generic Drugs
Small-molecule generics can be made in a process that is relatively inexpensive, reproducible, and able to yield identical products with each lot.7 In contrast, biosimilars are large complex proteins made in living cells. They differ from their reference product because of changes that occur during manufacturing (eg, purification system, posttranslational modifications).7-9 Glycosylation is particularly sensitive to manufacturing and can affect the immunogenicity of the product.9 The impact of manufacturing can be substantial; for example, during phase 3 trials for efalizumab, a change in the manufacturing facility affected pharmacokinetic properties to such a degree that the FDA required a repeat of the trials.10
FDA Guidelines on Biosimilarity
The FDA outlines the following approach to demonstrate biosimilarity.2 The first step is structural characterization to evaluate the primary, secondary, tertiary, and quaternary structures and posttranslational modifications. The next step utilizes in vivo and/or in vitro functional assays to compare the biosimilar and reference product. The third step is a focus on toxicity and immunogenicity. The fourth step involves clinical studies to study pharmacokinetic and pharmacodynamic data, immunogenicity, safety, and efficacy. After the biosimilar has been approved, there must be a system in place to monitor postmarketing safety. If a biosimilar is tested in one patient population (eg, patients with plaque psoriasis), a request can be made to approve the drug for all the conditions that the reference product was approved for, such as plaque psoriasis, rheumatoid arthritis, and inflammatory bowel disease, even though clinical trials were not performed in all of these patient populations.2 The BPCI Act leaves it up to the FDA to determine how much and what type of data (eg, in vitro, in vivo, clinical) are required.11
Extrapolation and Interchangeability
Once a biosimilar has been approved, 2 questions must be answered: First, can its use be extrapolated to all indications for the reference product? The infliximab biosimilar approved by the European Medicines Agency and the FDA had only been studied in patients with ankylosing spondylitis12 and rheumatoid arthritis,13 yet it was granted all the indications for infliximab, including severe plaque psoriasis.14 As of now, the various regulatory agencies differ on their policies regarding extrapolation. Extrapolation is not automatically bestowed on a biosimilar in the United States but can be requested by the manufacturer.2
Second, can the biosimilar be seamlessly switched with its reference product at the pharmacy level? The BPCI Act allows for the substitution of biosimilars that are deemed interchangeable without notifying the provider, yet individual states ultimately can pass laws regarding this issue.15,16 An interchangeable agent would “produce the same clinical result as the reference product,” and “the risk in terms of safety or diminished efficacy of alternating or switching between use of the biological product and the reference product is not greater than the risk of using the reference product.”15 Generic drugs are allowed to be substituted without notifying the patient or prescriber16; however, biosimilars that are not deemed interchangeable would require permission from the prescriber before substitution.11
Biosimilars for Psoriasis
In April 2016, an infliximab biosimilar (Inflectra) became the second biosimilar approved by the FDA.4 Inflectra was studied in clinical trials for patients with ankylosing spondylitis17 and rheumatoid arthritis,18 and in both trials the biosimilar was found to have similar efficacy and safety profiles to that of the reference product. In August 2016, an etanercept biosimilar (Erelzi) was approved,5 and in September 2016, an adalimumab biosimilar (Amjevita) was approved.6
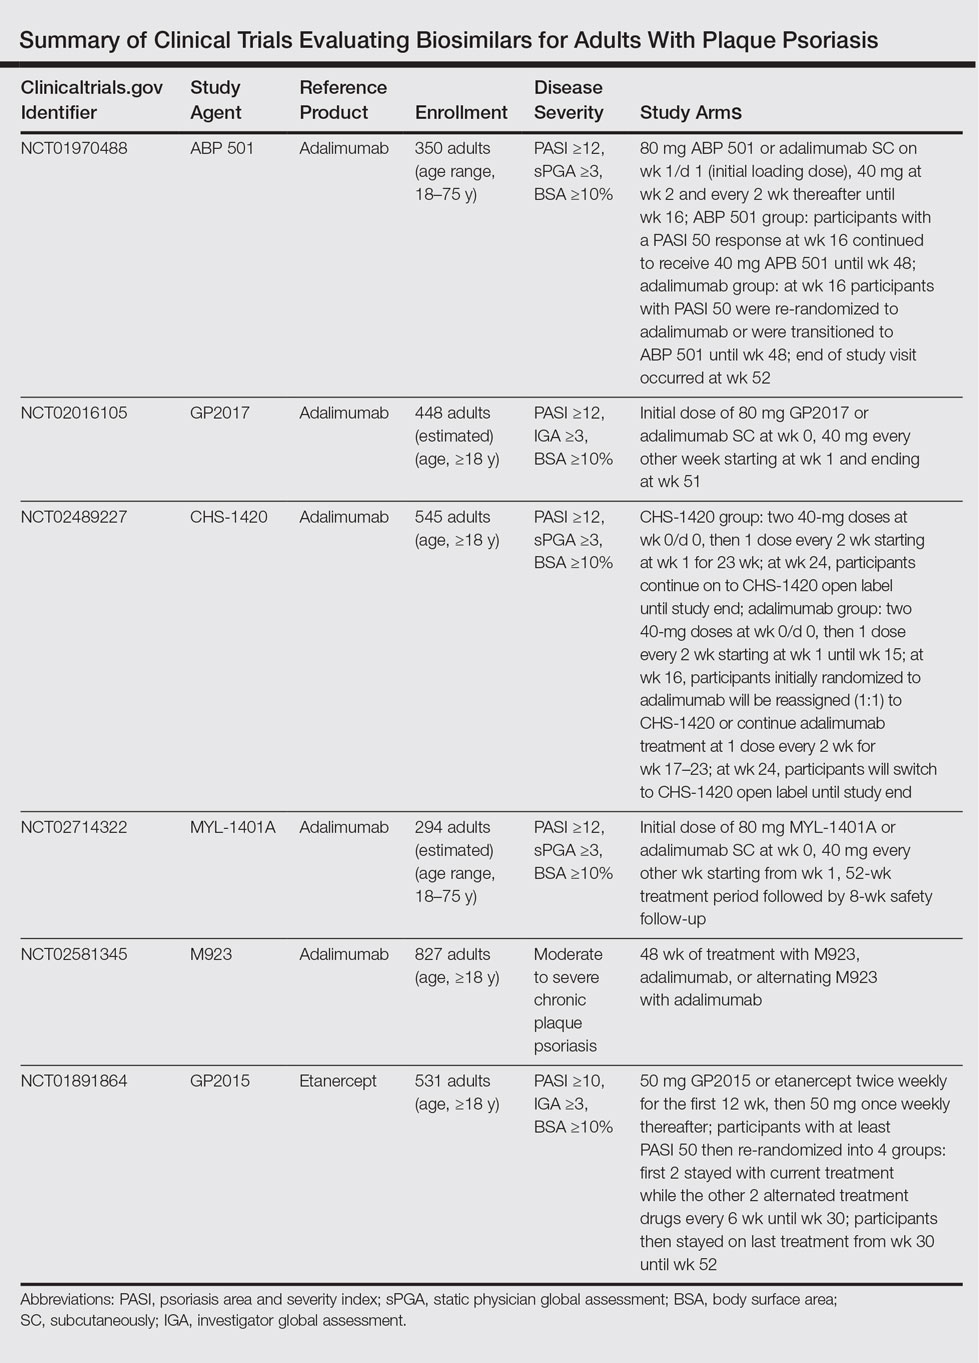
The Table summarizes clinical trials (both completed and ongoing) evaluating biosimilars in adults with plaque psoriasis; thus far, there are 2464 participants enrolled across 5 different studies of adalimumab biosimilars (registered at www.clinicaltrials.gov with the identifiers NCT01970488, NCT02016105, NCT02489227, NCT02714322, NCT02581345) and 531 participants in an etanercept biosimilar study (NCT01891864).
A phase 3 double-blind study compared adalimumab to an adalimumab biosimilar (ABP 501) in 350 adults with plaque psoriasis (NCT01970488). Participants received an initial loading dose of adalimumab (n=175) or ABP 501 (n=175) 80 mg subcutaneously on week 1/day 1, followed by 40 mg at week 2 every 2 weeks thereafter. At week 16, participants with psoriasis area and severity index (PASI) 50 or greater remained in the study for up to 52 weeks; those who were receiving adalimumab were re-randomized to receive either ABP 501 or adalimumab. Participants receiving ABP 501 continued to receive the biosimilar. The mean PASI improvement at weeks 16, 32, and 50 was 86.6, 87.6, and 87.2, respectively, in the ABP 501/ABP 501 group (A/A) compared to 88.0, 88.2, and 88.1, respectively, in the adalimumab/adalimumab group (B/B).19 Autoantibodies developed in 68.4% of participants in the A/A group compared to 74.7% in the B/B group. The incidence of treatment-emergent adverse events (TEAEs) was 86.2% in the A/A group and 78.5% in the B/B group. The most common TEAEs were nasopharyngitis, headache, and upper respiratory tract infection. The incidence of serious TEAEs was 4.6% in the A/A group compared to 5.1% in the B/B group. Overall, the efficacy, safety, and immunogenicity of the adalimumab biosimilar was comparable to the reference product.19
A second phase 3 trial (ADACCESS) evaluated the adalimumab biosimilar GP2017 (NCT02016105). Participants received an initial dose of 80 mg subcutaneously of either GP2017 or adalimumab at week 0, followed by 40 mg every other week starting at week 1 and ending at week 51. The study has been completed but results are not yet available.
The third trial is evaluating the adalimumab biosimilar CHS-1420 (NCT02489227). Participants in the experimental arm receive two 40-mg doses of CHS-1420 at week 0/day 0, and then 1 dose every 2 weeks from week 1 for 23 weeks. At week 24, participants continue with an open-label study. Participants in the adalimumab group receive two 40-mg doses at week 0/day 0, and then 1 dose every 2 weeks from week 1 to week 15. At week 16, participants will be re-randomized (1:1) to continue adalimumab or start CHS-1420 at one 40-mg dose every 2 weeks during weeks 17 to 23. At week 24, participants will switch to CHS-1420 open label until the end of the study. Study results are not yet available; the study is ongoing but not recruiting.
The fourth ongoing trial is evaluating the adalimumab biosimilar MYL-1401A (NCT02714322). Participants receive an initial dose of 80 mg subcutaneously of either MYL-1401A or adalimumab (2:1), followed by 40 mg every other week starting 1 week after the initial dose. After the 52-week treatment period, there is an 8-week safety follow-up period. Study results are not yet available; the study is ongoing but not recruiting.
A fifth adalimumab biosimilar, M923, also is currently being tested in clinical trials (NCT02581345). Participants receive either M923, adalimumab, or alternate between the 2 agents. Although the study is still ongoing, data released from the manufacturer state that the proportion of participants who achieved PASI 75 after 16 weeks of treatment was equivalent in the 2 treatment groups. The proportion of participants who achieved PASI 90, as well as the type, frequency, and severity of adverse events, also were comparable.20
The EGALITY trial, completed in March 2015, compared the etanercept biosimilar GP2015 to etanercept over a 52-week period (NCT01891864). Participants received either GP2015 or etanercept 50 mg twice weekly for the first 12 weeks. Participants with at least PASI 50 were then re-randomized into 4 groups: the first 2 groups stayed with their current treatments while the other 2 groups alternated treatments every 6 weeks until week 30. Participants then stayed on their last treatment from week 30 to week 52. The adjusted PASI 75 response rate at week 12 was 73.4% in the group receiving GP2015 and 75.7% in the group receiving etanercept.21 The percentage change in PASI score at all time points was found to be comparable from baseline until week 52. Importantly, the incidence of TEAEs up to week 52 was comparable and no new safety issues were reported. Additionally, switching participants from etanercept to the biosimilar during the subsequent treatment periods did not cause an increase in formation of antidrug antibodies.21
There are 2 upcoming studies involving biosimilars that are not yet recruiting patients. The first (NCT02925338) will analyze the characteristics of patients treated with Inflectra as well as their response to treatment. The second (NCT02762955) will be comparing the efficacy and safety of an adalimumab biosimilar (BCD-057, BIOCAD) to adalimumab.
Economic Advantages of Biosimilars
The annual economic burden of psoriasis in the United States is substantial, with estimates between $35.2 billion22 and $112 billion.23 Biosimilars can be 25% to 30% cheaper than their reference products9,11,24 and have the potential to save the US health care system billions of dollars.25 Furthermore, the developers of biosimilars could offer patient assistance programs.11 That being said, drug developers can extend patents for their branded drugs; for instance, 2 patents for Enbrel (Amgen Inc) could protect the drug until 2029.26,27
Although cost is an important factor in deciding which medications to prescribe for patients, it should never take precedence over safety and efficacy. Manufacturers can develop new drugs with greater efficacy, fewer side effects, or more convenient dosing schedules,26,27 or they could offer co-payment assistance programs.26,28 Physicians also must consider how the biosimilars will be integrated into drug formularies. Would patients be required to use a biosimilar before a branded drug?11,29 Will patients already taking a branded drug be grandfathered in?11 Would they have to pay a premium to continue taking their drug? And finally, could changes in formularies and employer-payer relationships destabilize patient regimens?30
Conclusion
Preliminary results suggest that biosimilars can have similar safety, efficacy, and immunogenicity data compared to their reference products.19,21 Biosimilars have the potential to greatly reduce the cost burden associated with psoriasis. However, how similar is “highly similar”? Although cost is an important consideration in selecting drug therapies, the reason for using a biosimilar should never be based on cost alone.
- Information on biosimilars. US Food and Drug Administration website. http://www.fda.gov/Drugs/DevelopmentApprovalProcess/HowDrugsareDevelopedandApproved/ApprovalApplications/TherapeuticBiologicApplications/Biosimilars/. Updated May 10, 2016. Accessed July 5, 2016.
- US Department of Health and Human Services. Scientific Considerations in Demonstrating Biosimilarity to a Reference Product: Guidance for Industry. Silver Spring, MD: US Food and Drug Administration; 2015.
- McKeage K. A review of CT-P13: an infliximab biosimilar. BioDrugs. 2014;28:313-321.
- FDA approves Inflectra, a biosimilar to Remicade [news release]. Silver Spring, MD: US Food and Drug Administration; April 5, 2016. http://www.fda.gov/NewsEvents/Newsroom/PressAnnouncements/ucm494227.htm. Updated April 20, 2016. Accessed January 23, 2017.
- FDA approves Erelzi, a biosimilar to Enbrel [news release]. Silver Spring, MD: US Food and Drug Administration; August 30, 2016. http://www.fda.gov/NewsEvents/Newsroom/PressAnnouncements/ucm518639.htm. Accessed January 23, 2017.
- FDA approves Amjevita, a biosimilar to Humira [news release]. Silver Spring, MD: US Food and Drug Administration; September 23, 2016. http://www.fda.gov/NewsEvents/Newsroom/PressAnnouncements/ucm522243.htm. Accessed January 23, 2017.
- Scott BJ, Klein AV, Wang J. Biosimilar monoclonal antibodies: a Canadian regulatory perspective on the assessment of clinically relevant differences and indication extrapolation [published online June 26, 2014]. J Clin Pharmacol. 2015;55(suppl 3):S123-S132.
- Mellstedt H, Niederwieser D, Ludwig H. The challenge of biosimilars [published online September 14, 2007]. Ann Oncol. 2008;19:411-419.
- Puig L. Biosimilars and reference biologics: decisions on biosimilar interchangeability require the involvement of dermatologists [published online October 2, 2013]. Actas Dermosifiliogr. 2014;105:435-437.
- Strober BE, Armour K, Romiti R, et al. Biopharmaceuticals and biosimilars in psoriasis: what the dermatologist needs to know. J Am Acad Dermatol. 2012;66:317-322.
- Falit BP, Singh SC, Brennan TA. Biosimilar competition in the United States: statutory incentives, payers, and pharmacy benefit managers. Health Aff (Millwood). 2015;34:294-301.
- Park W, Hrycaj P, Jeka S, et al. A randomised, double-blind, multicentre, parallel-group, prospective study comparing the pharmacokinetics, safety, and efficacy of CT-P13 and innovator infliximab in patients with ankylosing spondylitis: the PLANETAS study. Ann Rheum Dis. 2013;72:1605-1612.
- Yoo DH, Hrycaj P, Miranda P, et al. A randomised, double-blind, parallel-group study to demonstrate equivalence in efficacy and safety of CT-P13 compared with innovator infliximab when coadministered with methotrexate in patients with active rheumatoid arthritis: the PLANETRA study. Ann Rheum Dis. 2013;72:1613-1620.
- Carretero Hernandez G, Puig L. The use of biosimilar drugs in psoriasis: a position paper. Actas Dermosifiliogr. 2015;106:249-251.
- Regulation of Biological Products, 42 USC §262 (2013).
- Ventola CL. Evaluation of biosimilars for formulary inclusion: factors for consideration by P&T committees. P T. 2015;40:680-689.
- Park W, Yoo DH, Jaworski J, et al. Comparable long-term efficacy, as assessed by patient-reported outcomes, safety and pharmacokinetics, of CT-P13 and reference infliximab in patients with ankylosing spondylitis: 54-week results from the randomized, parallel-group PLANETAS study. Arthritis Res Ther. 2016;18:25.
- Yoo DH, Racewicz A, Brzezicki J, et al. A phase III randomized study to evaluate the efficacy and safety of CT-P13 compared with reference infliximab in patients with active rheumatoid arthritis: 54-week results from the PLANETRA study. Arthritis Res Ther. 2015;18:82.
- Strober B, Foley P, Philipp S, et al. Evaluation of efficacy and safety of ABP 501 in a phase 3 study in subjects with moderate to severe plaque psoriasis: 52-week results. J Am Acad Dermatol. 2016;74(5, suppl 1):AB249.
- Momenta Pharmaceuticals announces positive top-line phase 3 results for M923, a proposed Humira (adalimumab) biosimilar [news release]. Cambridge, MA: Momenta Pharmaceuticals, Inc; November 29, 2016. http://ir.momentapharma.com/releasedetail.cfm?ReleaseID=1001255. Accessed January 25, 2017.
- Griffiths CE, Thaci D, Gerdes S, et al. The EGALITY study: a confirmatory, randomised, double-blind study comparing the efficacy, safety and immunogenicity of GP2015, a proposed etanercept biosimilar, versus the originator product in patients with moderate to severe chronic plaque-type psoriasis [published online October 27, 2016]. Br J Dermatol. doi:10.1111/bjd.15152.
- Vanderpuye-Orgle J, Zhao Y, Lu J, et al. Evaluating the economic burden of psoriasis in the United States [published online April 14, 2015]. J Am Acad Dermatol. 2015;72:961-967.
- Brezinski EA, Dhillon JS, Armstrong AW. Economic burden of psoriasis in the United States: a systematic review. JAMA Dermatol. 2015;151:651-658.
- Menter MA, Griffiths CE. Psoriasis: the future. Dermatol Clin. 2015;33:161-166.
- Hackbarth GM, Crosson FJ, Miller ME. Report to the Congress: improving incentives in the Medicare program. Medicare Payment Advisory Commission, Washington, DC; 2009.
- Lovenworth SJ. The new biosimilar era: the basics, the landscape, and the future. Bloomberg website. http://about.bloomberglaw.com/practitioner-contributions/the-new-biosimilar-era-the-basics-the-landscape-and-the-future. Published September 21, 2012. Accessed July 6, 2016.
- Blackstone EA, Joseph PF. The economics of biosimilars. Am Health Drug Benefits. 2013;6:469-478.
- Calvo B, Zuniga L. The US approach to biosimilars: the long-awaited FDA approval pathway. BioDrugs. 2012;26:357-361.
- Lucio SD, Stevenson JG, Hoffman JM. Biosimilars: implications for health-system pharmacists. Am J Health Syst Pharm. 2013;70:2004-2017.
- Barriers to access attributed to formulary changes. Manag Care. 2012;21:41.
According to the US Food and Drug Administration (FDA), a biosimilar is “highly similar to an FDA-approved biological product, . . . and has no clinically meaningful differences in terms of safety and effectiveness.”1 The Biologics Price Competition and Innovation (BPCI) Act of 2009 created an expedited pathway for the approval of products shown to be biosimilar to FDA-licensed reference products.2 In 2013, the European Medicines Agency approved the first biosimilar modeled on infliximab (Remsima [formerly known as CT-P13], Celltrion Healthcare Co, Ltd) for the same indications as its reference product.3 In 2016, the FDA approved Inflectra (Hospira, a Pfizer Company), an infliximab biosimilar; Erelzi (Sandoz, a Novartis Division), an etanercept biosimilar; and Amjevita (Amgen Inc), an adalimumab biosimilar, all for numerous clinical indications including plaque psoriasis and psoriatic arthritis.4-6
There has been a substantial amount of distrust surrounding the biosimilars; however, as the patents for the biologic agents expire, new biosimilars will undoubtedly flood the market. In this article, we provide information that will help dermatologists understand the need for and use of these agents.
Biosimilars Versus Generic Drugs
Small-molecule generics can be made in a process that is relatively inexpensive, reproducible, and able to yield identical products with each lot.7 In contrast, biosimilars are large complex proteins made in living cells. They differ from their reference product because of changes that occur during manufacturing (eg, purification system, posttranslational modifications).7-9 Glycosylation is particularly sensitive to manufacturing and can affect the immunogenicity of the product.9 The impact of manufacturing can be substantial; for example, during phase 3 trials for efalizumab, a change in the manufacturing facility affected pharmacokinetic properties to such a degree that the FDA required a repeat of the trials.10
FDA Guidelines on Biosimilarity
The FDA outlines the following approach to demonstrate biosimilarity.2 The first step is structural characterization to evaluate the primary, secondary, tertiary, and quaternary structures and posttranslational modifications. The next step utilizes in vivo and/or in vitro functional assays to compare the biosimilar and reference product. The third step is a focus on toxicity and immunogenicity. The fourth step involves clinical studies to study pharmacokinetic and pharmacodynamic data, immunogenicity, safety, and efficacy. After the biosimilar has been approved, there must be a system in place to monitor postmarketing safety. If a biosimilar is tested in one patient population (eg, patients with plaque psoriasis), a request can be made to approve the drug for all the conditions that the reference product was approved for, such as plaque psoriasis, rheumatoid arthritis, and inflammatory bowel disease, even though clinical trials were not performed in all of these patient populations.2 The BPCI Act leaves it up to the FDA to determine how much and what type of data (eg, in vitro, in vivo, clinical) are required.11
Extrapolation and Interchangeability
Once a biosimilar has been approved, 2 questions must be answered: First, can its use be extrapolated to all indications for the reference product? The infliximab biosimilar approved by the European Medicines Agency and the FDA had only been studied in patients with ankylosing spondylitis12 and rheumatoid arthritis,13 yet it was granted all the indications for infliximab, including severe plaque psoriasis.14 As of now, the various regulatory agencies differ on their policies regarding extrapolation. Extrapolation is not automatically bestowed on a biosimilar in the United States but can be requested by the manufacturer.2
Second, can the biosimilar be seamlessly switched with its reference product at the pharmacy level? The BPCI Act allows for the substitution of biosimilars that are deemed interchangeable without notifying the provider, yet individual states ultimately can pass laws regarding this issue.15,16 An interchangeable agent would “produce the same clinical result as the reference product,” and “the risk in terms of safety or diminished efficacy of alternating or switching between use of the biological product and the reference product is not greater than the risk of using the reference product.”15 Generic drugs are allowed to be substituted without notifying the patient or prescriber16; however, biosimilars that are not deemed interchangeable would require permission from the prescriber before substitution.11
Biosimilars for Psoriasis
In April 2016, an infliximab biosimilar (Inflectra) became the second biosimilar approved by the FDA.4 Inflectra was studied in clinical trials for patients with ankylosing spondylitis17 and rheumatoid arthritis,18 and in both trials the biosimilar was found to have similar efficacy and safety profiles to that of the reference product. In August 2016, an etanercept biosimilar (Erelzi) was approved,5 and in September 2016, an adalimumab biosimilar (Amjevita) was approved.6
The Table summarizes clinical trials (both completed and ongoing) evaluating biosimilars in adults with plaque psoriasis; thus far, there are 2464 participants enrolled across 5 different studies of adalimumab biosimilars (registered at www.clinicaltrials.gov with the identifiers NCT01970488, NCT02016105, NCT02489227, NCT02714322, NCT02581345) and 531 participants in an etanercept biosimilar study (NCT01891864).
A phase 3 double-blind study compared adalimumab to an adalimumab biosimilar (ABP 501) in 350 adults with plaque psoriasis (NCT01970488). Participants received an initial loading dose of adalimumab (n=175) or ABP 501 (n=175) 80 mg subcutaneously on week 1/day 1, followed by 40 mg at week 2 every 2 weeks thereafter. At week 16, participants with psoriasis area and severity index (PASI) 50 or greater remained in the study for up to 52 weeks; those who were receiving adalimumab were re-randomized to receive either ABP 501 or adalimumab. Participants receiving ABP 501 continued to receive the biosimilar. The mean PASI improvement at weeks 16, 32, and 50 was 86.6, 87.6, and 87.2, respectively, in the ABP 501/ABP 501 group (A/A) compared to 88.0, 88.2, and 88.1, respectively, in the adalimumab/adalimumab group (B/B).19 Autoantibodies developed in 68.4% of participants in the A/A group compared to 74.7% in the B/B group. The incidence of treatment-emergent adverse events (TEAEs) was 86.2% in the A/A group and 78.5% in the B/B group. The most common TEAEs were nasopharyngitis, headache, and upper respiratory tract infection. The incidence of serious TEAEs was 4.6% in the A/A group compared to 5.1% in the B/B group. Overall, the efficacy, safety, and immunogenicity of the adalimumab biosimilar was comparable to the reference product.19
A second phase 3 trial (ADACCESS) evaluated the adalimumab biosimilar GP2017 (NCT02016105). Participants received an initial dose of 80 mg subcutaneously of either GP2017 or adalimumab at week 0, followed by 40 mg every other week starting at week 1 and ending at week 51. The study has been completed but results are not yet available.
The third trial is evaluating the adalimumab biosimilar CHS-1420 (NCT02489227). Participants in the experimental arm receive two 40-mg doses of CHS-1420 at week 0/day 0, and then 1 dose every 2 weeks from week 1 for 23 weeks. At week 24, participants continue with an open-label study. Participants in the adalimumab group receive two 40-mg doses at week 0/day 0, and then 1 dose every 2 weeks from week 1 to week 15. At week 16, participants will be re-randomized (1:1) to continue adalimumab or start CHS-1420 at one 40-mg dose every 2 weeks during weeks 17 to 23. At week 24, participants will switch to CHS-1420 open label until the end of the study. Study results are not yet available; the study is ongoing but not recruiting.
The fourth ongoing trial is evaluating the adalimumab biosimilar MYL-1401A (NCT02714322). Participants receive an initial dose of 80 mg subcutaneously of either MYL-1401A or adalimumab (2:1), followed by 40 mg every other week starting 1 week after the initial dose. After the 52-week treatment period, there is an 8-week safety follow-up period. Study results are not yet available; the study is ongoing but not recruiting.
A fifth adalimumab biosimilar, M923, also is currently being tested in clinical trials (NCT02581345). Participants receive either M923, adalimumab, or alternate between the 2 agents. Although the study is still ongoing, data released from the manufacturer state that the proportion of participants who achieved PASI 75 after 16 weeks of treatment was equivalent in the 2 treatment groups. The proportion of participants who achieved PASI 90, as well as the type, frequency, and severity of adverse events, also were comparable.20
The EGALITY trial, completed in March 2015, compared the etanercept biosimilar GP2015 to etanercept over a 52-week period (NCT01891864). Participants received either GP2015 or etanercept 50 mg twice weekly for the first 12 weeks. Participants with at least PASI 50 were then re-randomized into 4 groups: the first 2 groups stayed with their current treatments while the other 2 groups alternated treatments every 6 weeks until week 30. Participants then stayed on their last treatment from week 30 to week 52. The adjusted PASI 75 response rate at week 12 was 73.4% in the group receiving GP2015 and 75.7% in the group receiving etanercept.21 The percentage change in PASI score at all time points was found to be comparable from baseline until week 52. Importantly, the incidence of TEAEs up to week 52 was comparable and no new safety issues were reported. Additionally, switching participants from etanercept to the biosimilar during the subsequent treatment periods did not cause an increase in formation of antidrug antibodies.21
There are 2 upcoming studies involving biosimilars that are not yet recruiting patients. The first (NCT02925338) will analyze the characteristics of patients treated with Inflectra as well as their response to treatment. The second (NCT02762955) will be comparing the efficacy and safety of an adalimumab biosimilar (BCD-057, BIOCAD) to adalimumab.
Economic Advantages of Biosimilars
The annual economic burden of psoriasis in the United States is substantial, with estimates between $35.2 billion22 and $112 billion.23 Biosimilars can be 25% to 30% cheaper than their reference products9,11,24 and have the potential to save the US health care system billions of dollars.25 Furthermore, the developers of biosimilars could offer patient assistance programs.11 That being said, drug developers can extend patents for their branded drugs; for instance, 2 patents for Enbrel (Amgen Inc) could protect the drug until 2029.26,27
Although cost is an important factor in deciding which medications to prescribe for patients, it should never take precedence over safety and efficacy. Manufacturers can develop new drugs with greater efficacy, fewer side effects, or more convenient dosing schedules,26,27 or they could offer co-payment assistance programs.26,28 Physicians also must consider how the biosimilars will be integrated into drug formularies. Would patients be required to use a biosimilar before a branded drug?11,29 Will patients already taking a branded drug be grandfathered in?11 Would they have to pay a premium to continue taking their drug? And finally, could changes in formularies and employer-payer relationships destabilize patient regimens?30
Conclusion
Preliminary results suggest that biosimilars can have similar safety, efficacy, and immunogenicity data compared to their reference products.19,21 Biosimilars have the potential to greatly reduce the cost burden associated with psoriasis. However, how similar is “highly similar”? Although cost is an important consideration in selecting drug therapies, the reason for using a biosimilar should never be based on cost alone.
- Information on biosimilars. US Food and Drug Administration website. http://www.fda.gov/Drugs/DevelopmentApprovalProcess/HowDrugsareDevelopedandApproved/ApprovalApplications/TherapeuticBiologicApplications/Biosimilars/. Updated May 10, 2016. Accessed July 5, 2016.
- US Department of Health and Human Services. Scientific Considerations in Demonstrating Biosimilarity to a Reference Product: Guidance for Industry. Silver Spring, MD: US Food and Drug Administration; 2015.
- McKeage K. A review of CT-P13: an infliximab biosimilar. BioDrugs. 2014;28:313-321.
- FDA approves Inflectra, a biosimilar to Remicade [news release]. Silver Spring, MD: US Food and Drug Administration; April 5, 2016. http://www.fda.gov/NewsEvents/Newsroom/PressAnnouncements/ucm494227.htm. Updated April 20, 2016. Accessed January 23, 2017.
- FDA approves Erelzi, a biosimilar to Enbrel [news release]. Silver Spring, MD: US Food and Drug Administration; August 30, 2016. http://www.fda.gov/NewsEvents/Newsroom/PressAnnouncements/ucm518639.htm. Accessed January 23, 2017.
- FDA approves Amjevita, a biosimilar to Humira [news release]. Silver Spring, MD: US Food and Drug Administration; September 23, 2016. http://www.fda.gov/NewsEvents/Newsroom/PressAnnouncements/ucm522243.htm. Accessed January 23, 2017.
- Scott BJ, Klein AV, Wang J. Biosimilar monoclonal antibodies: a Canadian regulatory perspective on the assessment of clinically relevant differences and indication extrapolation [published online June 26, 2014]. J Clin Pharmacol. 2015;55(suppl 3):S123-S132.
- Mellstedt H, Niederwieser D, Ludwig H. The challenge of biosimilars [published online September 14, 2007]. Ann Oncol. 2008;19:411-419.
- Puig L. Biosimilars and reference biologics: decisions on biosimilar interchangeability require the involvement of dermatologists [published online October 2, 2013]. Actas Dermosifiliogr. 2014;105:435-437.
- Strober BE, Armour K, Romiti R, et al. Biopharmaceuticals and biosimilars in psoriasis: what the dermatologist needs to know. J Am Acad Dermatol. 2012;66:317-322.
- Falit BP, Singh SC, Brennan TA. Biosimilar competition in the United States: statutory incentives, payers, and pharmacy benefit managers. Health Aff (Millwood). 2015;34:294-301.
- Park W, Hrycaj P, Jeka S, et al. A randomised, double-blind, multicentre, parallel-group, prospective study comparing the pharmacokinetics, safety, and efficacy of CT-P13 and innovator infliximab in patients with ankylosing spondylitis: the PLANETAS study. Ann Rheum Dis. 2013;72:1605-1612.
- Yoo DH, Hrycaj P, Miranda P, et al. A randomised, double-blind, parallel-group study to demonstrate equivalence in efficacy and safety of CT-P13 compared with innovator infliximab when coadministered with methotrexate in patients with active rheumatoid arthritis: the PLANETRA study. Ann Rheum Dis. 2013;72:1613-1620.
- Carretero Hernandez G, Puig L. The use of biosimilar drugs in psoriasis: a position paper. Actas Dermosifiliogr. 2015;106:249-251.
- Regulation of Biological Products, 42 USC §262 (2013).
- Ventola CL. Evaluation of biosimilars for formulary inclusion: factors for consideration by P&T committees. P T. 2015;40:680-689.
- Park W, Yoo DH, Jaworski J, et al. Comparable long-term efficacy, as assessed by patient-reported outcomes, safety and pharmacokinetics, of CT-P13 and reference infliximab in patients with ankylosing spondylitis: 54-week results from the randomized, parallel-group PLANETAS study. Arthritis Res Ther. 2016;18:25.
- Yoo DH, Racewicz A, Brzezicki J, et al. A phase III randomized study to evaluate the efficacy and safety of CT-P13 compared with reference infliximab in patients with active rheumatoid arthritis: 54-week results from the PLANETRA study. Arthritis Res Ther. 2015;18:82.
- Strober B, Foley P, Philipp S, et al. Evaluation of efficacy and safety of ABP 501 in a phase 3 study in subjects with moderate to severe plaque psoriasis: 52-week results. J Am Acad Dermatol. 2016;74(5, suppl 1):AB249.
- Momenta Pharmaceuticals announces positive top-line phase 3 results for M923, a proposed Humira (adalimumab) biosimilar [news release]. Cambridge, MA: Momenta Pharmaceuticals, Inc; November 29, 2016. http://ir.momentapharma.com/releasedetail.cfm?ReleaseID=1001255. Accessed January 25, 2017.
- Griffiths CE, Thaci D, Gerdes S, et al. The EGALITY study: a confirmatory, randomised, double-blind study comparing the efficacy, safety and immunogenicity of GP2015, a proposed etanercept biosimilar, versus the originator product in patients with moderate to severe chronic plaque-type psoriasis [published online October 27, 2016]. Br J Dermatol. doi:10.1111/bjd.15152.
- Vanderpuye-Orgle J, Zhao Y, Lu J, et al. Evaluating the economic burden of psoriasis in the United States [published online April 14, 2015]. J Am Acad Dermatol. 2015;72:961-967.
- Brezinski EA, Dhillon JS, Armstrong AW. Economic burden of psoriasis in the United States: a systematic review. JAMA Dermatol. 2015;151:651-658.
- Menter MA, Griffiths CE. Psoriasis: the future. Dermatol Clin. 2015;33:161-166.
- Hackbarth GM, Crosson FJ, Miller ME. Report to the Congress: improving incentives in the Medicare program. Medicare Payment Advisory Commission, Washington, DC; 2009.
- Lovenworth SJ. The new biosimilar era: the basics, the landscape, and the future. Bloomberg website. http://about.bloomberglaw.com/practitioner-contributions/the-new-biosimilar-era-the-basics-the-landscape-and-the-future. Published September 21, 2012. Accessed July 6, 2016.
- Blackstone EA, Joseph PF. The economics of biosimilars. Am Health Drug Benefits. 2013;6:469-478.
- Calvo B, Zuniga L. The US approach to biosimilars: the long-awaited FDA approval pathway. BioDrugs. 2012;26:357-361.
- Lucio SD, Stevenson JG, Hoffman JM. Biosimilars: implications for health-system pharmacists. Am J Health Syst Pharm. 2013;70:2004-2017.
- Barriers to access attributed to formulary changes. Manag Care. 2012;21:41.
Practice Points
- Three biosimilars have been approved by the US Food and Drug Administration to treat adult patients with plaque psoriasis and psoriatic arthritis.
- By virtue of their production, biosimilars are not identical to their reference products, and we must ensure that their safety is comparable.

Transgender Patients: Providing Sensitive Care
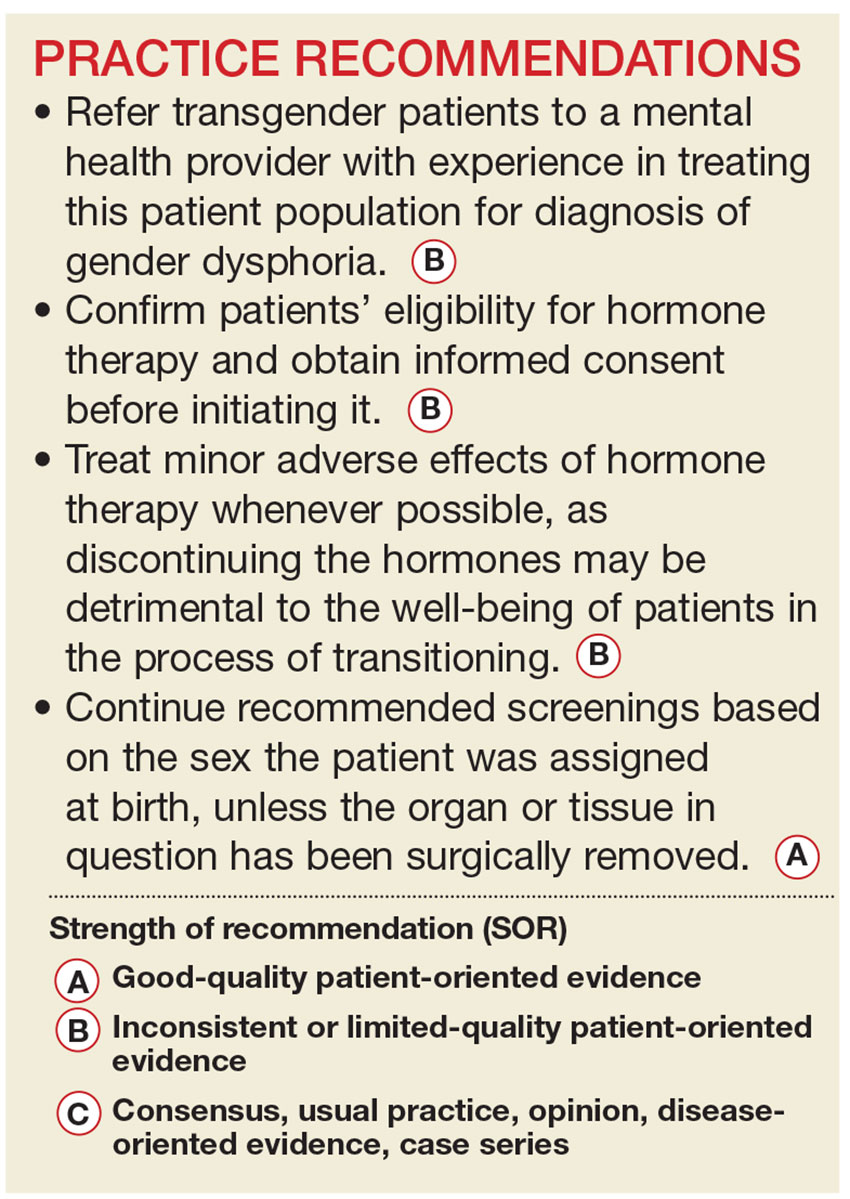
Civil rights for the lesbian, gay, bisexual, and transgender population have advanced markedly in the past decade, and the medical community has gradually begun to address more of their health concerns. More recently, media attention to transgender individuals has encouraged many more to openly seek care.1,2
It is estimated that anywhere from 0.3% to 5% of the US population identifies as transgender.1-3 While awareness of this population has slowly increased, there is a paucity of research on the hormone treatment that is often essential to patients’ well-being. Studies of surgical options for transgender patients have been minimal, as well.
Primary care providers are uniquely positioned to coordinate medical services and ensure continuity of care for transgender patients as they strive to become their authentic selves. Our goal in writing this article is to equip you with the tools to provide this patient population with sensitive, high-quality care (see Table 1).4-7 Our focus is on the diagnosis of gender dysphoria (GD) and its medical and hormonal management—the realm of primary care providers. We briefly discuss surgical management of GD, as well.
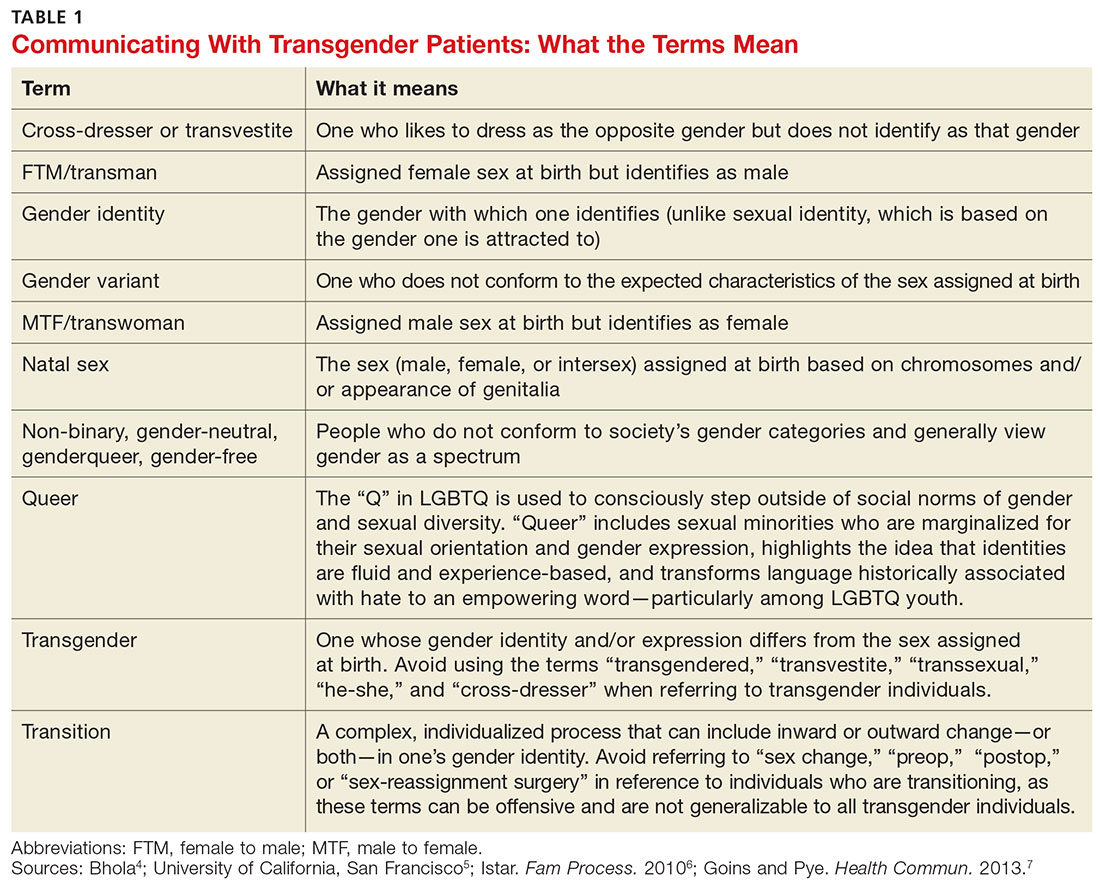
UNDERSTANDING AND DIAGNOSING GENDER DYSPHORIA
Two classification systems are used for diagnoses related to GD: the Diagnostic and Statistical Manual of Mental Disorders, Fifth Ed (DSM-5)8 and the International Classification of Diseases, 10th Rev (ICD-10).9
ICD-10 criteria use the term gender identity disorder; DSM-5 refers to gender dysphoria instead. It is important to emphasize that these classification systems represent an attempt to categorize a group of signs and symptoms that lead to distress for the patient and are not meant to suggest that being transgender is pathological. In fact, in DSM-5—released in 2013—the American Psychiatric Association revised the terminology to emphasize that such individuals are not “disordered” by the nature of their identity, but rather by the distress that being transgender causes.8
For a diagnosis of GD in children, DSM-5 criteria include characteristics perceived to be incongruent between the child’s sex at birth and the self-identified gender based on preferred activities or dislike of his or her own sexual anatomy. The child must meet six or more of the following for at least six months
- A repeatedly stated desire to be, or insistence that he or she is, of the other gender
- In boys, a preference for cross-dressing or simulating female attire; in girls, insistence on wearing only stereotypical masculine clothing
- Strong and persistent preferences for cross-gender roles in make-believe play or fantasy
- A strong rejection of toys/games typically associated with the child’s sex
- Intense desire to participate in stereotypical games and pastimes of the other gender
- Strong preference for playmates of the other gender
- A strong dislike of one’s sexual anatomy
- A strong desire for the primary (eg, penis or vagina) or secondary (eg, menstruation) sex characteristics of the other gender.8
Adolescents and adults must meet two or more of the following for at least six months
- A noticeable incongruence between the gender that the patient sees themselves as and their sex characteristics
- An intense need to do away with (or prevent) his or her primary or secondary sex features
- An intense desire to have the primary and/or secondary sex features of the other gender
- A deep desire to transform into another gender
- A profound need for society to treat them as someone of the other gender
- A powerful assurance of having the characteristic feelings and responses of the other gender.8
For children as well as adolescents and adults, the condition should cause the patient significant distress or significantly affect him or her socially, at work or school, and in other important areas of life.8
Is the patient a candidate for hormone therapy?
Two primary sources—Standards of Care for the Health of Transsexual, Transgender, and Gender-Nonconforming People, Version 7, issued by the World Professional Association for Transgender Health (WPATH)10 and Endocrine Treatment of Transsexual Persons11 by the Endocrine Society—offer clinical practice guidance based on evidence and expert opinion.
WPATH recommends that a mental health professional (MHP) experienced in transgender care diagnose GD to ensure that it is not mistaken for a psychiatric condition manifesting as altered gender identity. However, if no one with such experience is available or accessible in the region, it is reasonable for a primary care provider to make the diagnosis and consider initiating hormone therapy without a mental health referral,12 as the expected benefits outweigh the risks of nontreatment.13
Whether or not an MHP confirms a diagnosis of GD, it is still up to the treating provider to confirm the patient’s eligibility and readiness for hormone therapy: He or she should meet DSM-5 or ICD-10 criteria for GD, have no psychiatric comorbidity (eg, schizophrenia, body dysmorphic disorder, or uncontrolled bipolar disorder) likely to interfere with treatment, understand the expected outcomes and the social benefits and risks, and have indicated a willingness to take the hormones responsibly.
Historically, patients were required to have a documented real-life experience, defined as having fully adopted the new gender role in everyday life for at least three months.10,11 This model has fallen out of favor, however, as it is unsupported by evidence and may place transgender individuals at physical and emotional risk. Instead, readiness is confirmed by obtaining informed consent.12
Puberty may be suppressed with a gonadotropin-releasing hormone (GnRH) agonist in adolescents who have a GD diagnosis and are at Tanner stage 2 to 3 of puberty until age 16. At that point, hormone therapy consistent with their gender identification may be initiated (see “How to Help Transgender Teens”).11

Beginning the transition
The transitioning process is a complex and individualized journey that can include inward or outward change, or both.
For patients interested in medical interventions, possible therapies include cross-sex hormone administration and gender-affirming surgery. Both are aimed at making the physical and the psychologic more congruent. Hormone treatment (see Table 2) is often essential to reduce the distress of individuals with GD and to help them feel comfortable in their own body.10,11,21 Psychologic conditions, such as depression, tend to improve as the transitioning process gets underway.22
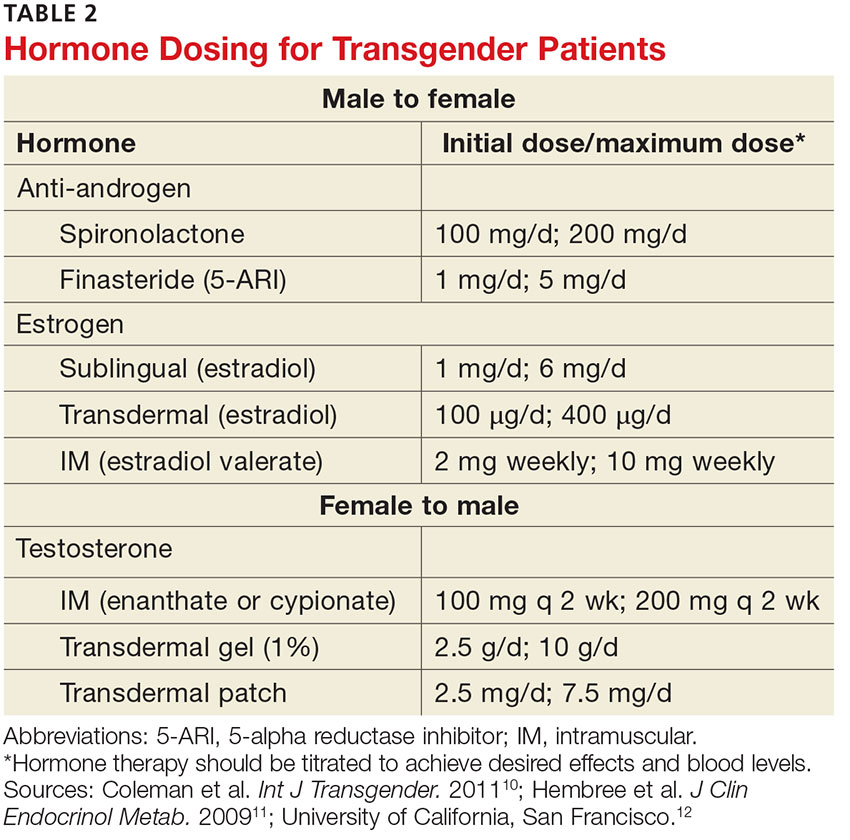
FEMALE-TO-MALE TRANSITION
CASE 1 Jennie R, a 55-year-old postmenopausal patient, comes to your office for an annual exam. Although you’ve been her primary care provider for several years, she confides for the first time that she has never been comfortable as a woman. “I’ve always felt that my body didn’t belong to me,” the patient admits, and goes on to say that for the past several years she has been living as a man. Jennie R says she is ready to start hormone therapy to assist with the gender transition and asks about the process, the benefits and risks, and how quickly she can expect to achieve the desired results.
If Jennie R were your patient, how would you respond?
Masculinizing hormone treatment
As you would explain to a patient like Jennie R, the goal of hormone therapy is to suppress the effects of the sex assigned at birth and replace them with those of the desired gender. In the case of a female transitioning to a male (known as a transman), masculinizing hormones would promote growth of facial and body hair, cessation of menses, increased muscle mass, deepening of the voice, and clitoral enlargement.
Physical changes induced by masculinizing hormone therapy have an expected onset of one to six months and achieve maximum effect in approximately two to five years.10,11 Although there have been no controlled clinical trials evaluating the safety or efficacy of any transitional hormone regimen, WPATH and the Center of Excellence for Transgender Health at the University of California, San Francisco, suggest initiating intramuscular or transdermal testosterone at increasing doses until normal physiologic male testosterone levels between 350 and 700 ng/dL are achieved, or until cessation of menses.13,25-28 The dose at which either, or both, occur should be continued as long-term maintenance therapy. Medroxyprogesterone can be added, if necessary for menstrual cessation, and a GnRH agonist or endometrial ablation can be used for refractory uterine bleeding.29,30
Testosterone is not a contraceptive. It is important to emphasize to transmen like Jennie that they remain at risk for pregnancy if they are having sex with fertile males. Caution patients not to assume that the possibility of pregnancy ends when menses stop.
Treat minor adverse effects. Adverse effects of masculinizing hormones include vaginal atrophy, fat redistribution and weight gain, polycythemia, acne, scalp hair loss, sleep apnea, elevated liver enzymes, hyperlipidemia, cardiovascular disease, diabetes, and bone density loss. Increased risk for cancer of the female organs has not been proven.10,11 It is reasonable to treat minor adverse effects after reviewing the risks/benefits of doing so, as discontinuing hormone therapy could be detrimental to the well-being of transitioning patients.11
There are absolute contraindications to masculinizing hormone therapy, however, including pregnancy, unstable coronary artery disease, and untreated polycythemia with a hematocrit > 55%.10
Monitoring is essential. Patients receiving masculinizing hormone therapy should be monitored every three months during the first year and once or twice a year thereafter, with a focused history (including mood symptoms), physical exam (including weight and blood pressure), and labs (including complete blood count, liver function, renal function, and lipids) at each visit.11,23 Some clinicians also check estradiol levels until they fall below 50 pg/mL,23,27 while others take the cessation of uterine bleeding for > 6 months as an indicator of estrogen suppression.
Preventive health measures continue. Routine screening should continue, based on the patient’s assigned sex at birth. Thus, a transman who has not had a hysterectomy still needs Pap smears, mammograms if the patient has not had a double mastectomy, and bone mineral density (BMD) testing to screen for osteoporosis.31,32 Some experts recommend starting to test BMD at age 50 for patients receiving masculinizing hormones, given the unknown effect of testosterone on bone density.11,31,32
CASE 1 The first question for a transgender patient is about his or her current gender identity, but Jennie R has already reported living as a man. So you start by asking “What name do you prefer to use?” and “Do you prefer to be referred to with male or female pronouns?”
The patient tells you that he sees himself as a man, he wants to be called Jeff, and he prefers male pronouns. You explain that you believe he has gender dysphoria and would benefit from hormone therapy, but it is important to confirm this diagnosis with an MHP. You explain that testosterone can be prescribed for masculinizing effects, and describe the expected effects—more facial and body hair, a deeper voice, and greater muscle mass, among others—and review the likely time frame.
You also discuss the risks of masculinizing hormones (hyperlipidemia, cardiovascular disease, diabetes, and loss of bone density) that will need to be monitored. Before he leaves, you give him the name of an MHP who is experienced in transgender care and tell him to make a follow-up appointment with you after he has seen her. At the conclusion of the visit, you make a note of the patient’s name and gender identity in the chart and inform the staff of the changes.
MALE-TO-FEMALE TRANSITION
CASE 2 Before heading into your office to talk to a new patient named Carl S, you glance at his chart and see that he is a healthy 21-year-old who has come in for a routine physical. When you enter the room, you find Carl wearing a dress, heels, and make-up. After confirming that you have the right patient, you ask, “What is your current gender identity?” “Female,” says Carl, who indicates that she now goes by Carol. The patient has no medical problems, surgical history, or significant family history but reports that she has been taking spironolactone and estrogen for the past three years. Carol also says she has a new female partner and is having unprotected sexual activity.
Feminizing hormone treatment
The desired effects of feminizing hormones include voice change, decreased hair growth, breast growth, body fat redistribution, decreased muscle mass, skin softening, decreased oiliness of skin and hair, and a decrease in spontaneous erections, testicular volume, and sperm production.10,11 The onset of feminizing effects ranges from one month to one year and the expected maximum effect occurs anywhere between three months and five years.10,11 Regimens usually include anti-androgen agents and estrogen.13,26-28
The medications that have been most studied with anti-androgenic effects include spironolactone and 5-α reductase inhibitors (5-ARIs) such as finasteride. Spironolactone inhibits testosterone secretion and inhibits androgen binding to androgen receptors; 5-ARIs block the conversion of testosterone to 5-α-dihydrotestosterone, the more active form.
Estrogen can be administered via oral, sublingual, transdermal, or intramuscular route, but parenteral formulations are preferred to avoid first-pass metabolism. The serum estradiol target is similar to the mean daily level of premenopausal women (< 200 pg/mL) and the level of testosterone should be in the normal female range (< 55 ng/dL).13,26-28
The selection of medications should be individualized for each patient. Comorbidities must be considered, as well as the risk for adverse effects, which include venous thromboembolism, elevated liver enzymes, breast cancer, cardiovascular disease, diabetes, hyperprolactinemia, weight gain, gallstones, cerebrovascular disease, and severe migraine headaches.10,11 Estrogen therapy is not reported to induce hypertrophy or premalignant changes in the prostate.33 As is the case for masculinizing hormones, feminizing hormone therapy should be continued indefinitely for long-term effects.
Frequent monitoring is recommended. Patients taking feminizing hormones (transwomen) should be seen every two to three months in the first year and monitored once or twice a year thereafter. Serum testosterone and estradiol levels should initially be monitored every three months; serum electrolytes, specifically potassium, should be monitored every two to three months in the first year until stable.
CASE 2 You recommend that Carol S be screened annually for sexually transmitted diseases, as you would for any 21-year-old patient. You point out, too, that while estrogen and androgen-suppressing therapy decrease sperm production, there is a possibility that the patient could impregnate a female partner and recommend that contraception be used if the couple is not trying to conceive.
You also discuss the risks and benefits of hormone therapy and reasonable expectations of continued treatment. You ask Carol to schedule a follow-up visit in six months, as her hormone regimen is stable. Finally, if the patient remains on hormone therapy, you mention that the only screening unique to men transitioning to women is for breast cancer, which should begin at age 40 to 50 (as it should for all women).
Gender-affirming surgical options
Surgical management of transgender patients is not within the scope of family medicine. But it is essential to know what procedures are available, as you may have occasion to advocate for patients during the surgical referral process and possibly to provide postoperative care.
For transmen, surgical options include chest reconstruction, hysterectomy/oophorectomy, metoidioplasty (using the clitoris to surgically approximate a penis), phalloplasty, scrotoplasty, urethroplasty, and vaginectomy.10,34 The surgeries available for transwomen are orchiectomy, vaginoplasty, penectomy, breast augmentation, thyroid chondroplasty and voice surgery, and facial feminization.10,34 Keep in mind that not all transgender individuals desire surgery as part of the transitioning process.
The authors would like to acknowledge the assistance of Michelle Forcier, MD, MPH, and Karen S. Bernstein, MD, MPH, in the preparation of this manuscript.
1. Pew Research Center. A survey of LGBT Americans: attitudes, experiences and values in changing times. www.pewsocialtrends.org/2013/06/13/a-survey-of-lgbt-americans. Accessed January 13, 2017.
2. Gates GJ. How many people are lesbian, gay, bisexual and transgender? http://williamsinstitute.law.ucla.edu/wp-content/uploads/Gates-How-Many-People-LGBT-Apr-2011.pdf. Accessed January 13, 2017.
3. van Kesteren PJ, Gooren LJ, Megens JA. An epidemiological and demographic study of transsexuals in The Netherlands. Arch Sex Behav. 1996;25:589-600.
4. Bhola S. An ally’s guide to terminology: talking about LGBT people & equality. www.glaad.org/2011/07/28/an-allys-guide-to-terminology-talking-about-lgbt-people-equality. Accessed January 13, 2017.
5. University of California, San Francisco. Transgender terminology. UCSF Center of Excellence for Transgender Health. http://transhealth.ucsf.edu/tcoe?page=protocol-terminology. Accessed January 13, 2017.
6. Istar A. How queer! The development of gender identity and sexual orientation in LGBTQ-headed families. Fam Process. 2010;49:268-290.
7. Goins ES, Pye D. Check the box that best describes you: reflexively managing theory and praxis in LGBTQ health communication research. Health Commun. 2013;28:397-407.
8. American Psychiatric Association. Gender dysphoria. Diagnostic and Statistical Manual of Mental Disorders, 5th ed. Washington, DC: American Psychiatric Association; 2013: 451-459.
9. World Health Organization. The International Classification of Diseases, 10th rev. Classification of mental and behavioural disorders: clinical descriptions and diagnostic guidelines. 1992; Geneva.
10. Coleman E, Bockting W, Botzer M, et al; World Professional Association for Transgender Health. Standards of Care for the Health of Transsexual, Transgender, and Gender-Nonconforming People, Version 7. Int J Transgender. 2011; 13:165-232.
11. Hembree WC, Cohen-Kettenis P, Delemarre-van de Waal HA, et al. Endocrine treatment of transsexual persons: an Endocrine Society clinical practice guideline. J Clin Endo Metabol. 2009;94:3132-3154.
12. University of California, San Francisco. Assessing readiness for hormones. UCSF Center of Excellence for Transgender Health. http://transhealth.ucsf.edu/tcoe?page=protocol-hormone-ready. Accessed January 13, 2017.
13. Gooren L. Hormone treatment of the adult transsexual patient. Horm Res. 2005;64(suppl 2):S31-S36.
14. Hembree WC. Guidelines for pubertal suspension and gender reassignment for transgender adolescents. Child Adolesc Psychiatr Clin N Am. 2011;20:725-732.
15. Gay, Lesbian, and Straight Education Network (GLSEN). Harsh realities. The experiences of transgender youth in our nation’s schools. www.glsen.org/sites/default/files/Harsh%20Realities.pdf. Accessed January 13, 2017.
16. Berman M, Balingit M. Eleven states sue Obama administration over bathroom guidance for transgender students. May 25, 2016. Washington Post. www.washingtonpost.com/news/post-nation/wp/2016/05/25/texas-governor-says-state-will-sue-obama-administration-over-bathroom-directive/. Accessed January 13, 2017.
17. de Vries AL, Cohen-Kettenis PT, Delemarre-van de Waal H. Clinical management of gender dysphoria in adolescents. 2006. Vancouver Coastal Health - Transgender Health Program. www.amsa.org/wp-content/uploads/2015/04/CaringForTransgenderAdolescents.pdf. Accessed January 13, 2017.
18. TransYouth Family Allies. Empowering transgender youth & families. www.imatyfa.org/. Accessed January 13, 2017.
19. Human Rights Campaign. On our own: a survival guide for independent LGBTQ youth. www.hrc.org/resources/on-our-own-a-survival-guide-for-independent-lgbtq-youth. Accessed January 13, 2017.
20. Gay, Lesbian, Bisexual, and Transgender National Help Center. www.glbthotline.org. Accessed January 13, 2017.
21. University of California, San Francisco. Hormone administration. UCSF Center of Excellence for Transgender Health. http://transhealth.ucsf.edu/trans?page=protocol-hormones. Accessed January 13, 2017.
22. Gorin-Lazard A, Baumstarck K, Boyer L, et al. Hormonal therapy is associated with better self-esteem, mood, and quality of life in transsexuals. J Nerv Ment Dis. 2013;201:996-1000.
23. Bhasin S, Cunningham GR, Hayes FJ, et al. Testosterone therapy in adult men with androgen deficiency syndromes: an Endocrine Society clinical practice guideline. J Clin Endocrinol Metab. 2006;91:1995-2010.
24. Boloña ER, Uraga MV, Haddad RM, et al. Testosterone use in men with sexual dysfunction: a systematic review and meta-analysis of randomized placebo-controlled trials. Mayo Clin Proc. 2007;82:20-28.
25. Gooren LJ, Giltay EJ. Review of studies of androgen treatment of female-to-male transsexuals: effects and risks of administration of androgens to females. J Sex Med. 2008; 5:765-776.
26. Levy A, Crown A, Reid R. Endocrine intervention for transsexuals. Clin Endocrinol (Oxf). 2003;59:409-418.
27. Moore E, Wisniewski A, Dobs A. Endocrine treatment of transsexual people: a review of treatment regimens, outcomes, and adverse effects. J Clin Endocrinol Metab. 2003;88:3467-3473.
28. Tangpricha V, Ducharme SH, Barber TW, et al. Endocrinologic treatment of gender identity disorders. Endocr Pract. 2003;9:12-21.
29. Dickersin K, Munro MG, Clark M, et al. Hysterectomy compared with endometrial ablation for dysfunctional uterine bleeding: a randomized controlled trial. Obstet Gynecol. 2007;110:1279-1289.
30. Prasad P, Powell MC. Prospective observational study of Thermablate Endometrial Ablation System as an outpatient procedure. J Minim Invasive Gynecol. 2008;15:476-479.
31. University of California, San Francisco. General prevention and screening. UCSF Center of Excellence for Transgender Health. http://transhealth.ucsf.edu/trans?page=protocol-screening. Accessed January 13, 2017.
32. Ganly I, Taylor EW. Breast cancer in a trans-sexual man receiving hormone replacement therapy. Br J Surg. 1995; 82:341.
33. Meriggiola MC, Gava G. Endocrine care of transpeople part II: a review of cross-sex hormonal treatments, outcomes and adverse effects in transwomen. Clin Endocrinol (Oxf). 2015;83:607-615.
34. University of California, San Francisco. Surgical options. UCSF Center of Excellence for Transgender Health. http://transhealth.ucsf.edu/trans?page=protocol-surgery. Accessed January 13, 2017.
Civil rights for the lesbian, gay, bisexual, and transgender population have advanced markedly in the past decade, and the medical community has gradually begun to address more of their health concerns. More recently, media attention to transgender individuals has encouraged many more to openly seek care.1,2
It is estimated that anywhere from 0.3% to 5% of the US population identifies as transgender.1-3 While awareness of this population has slowly increased, there is a paucity of research on the hormone treatment that is often essential to patients’ well-being. Studies of surgical options for transgender patients have been minimal, as well.
Primary care providers are uniquely positioned to coordinate medical services and ensure continuity of care for transgender patients as they strive to become their authentic selves. Our goal in writing this article is to equip you with the tools to provide this patient population with sensitive, high-quality care (see Table 1).4-7 Our focus is on the diagnosis of gender dysphoria (GD) and its medical and hormonal management—the realm of primary care providers. We briefly discuss surgical management of GD, as well.
UNDERSTANDING AND DIAGNOSING GENDER DYSPHORIA
Two classification systems are used for diagnoses related to GD: the Diagnostic and Statistical Manual of Mental Disorders, Fifth Ed (DSM-5)8 and the International Classification of Diseases, 10th Rev (ICD-10).9
ICD-10 criteria use the term gender identity disorder; DSM-5 refers to gender dysphoria instead. It is important to emphasize that these classification systems represent an attempt to categorize a group of signs and symptoms that lead to distress for the patient and are not meant to suggest that being transgender is pathological. In fact, in DSM-5—released in 2013—the American Psychiatric Association revised the terminology to emphasize that such individuals are not “disordered” by the nature of their identity, but rather by the distress that being transgender causes.8
For a diagnosis of GD in children, DSM-5 criteria include characteristics perceived to be incongruent between the child’s sex at birth and the self-identified gender based on preferred activities or dislike of his or her own sexual anatomy. The child must meet six or more of the following for at least six months
- A repeatedly stated desire to be, or insistence that he or she is, of the other gender
- In boys, a preference for cross-dressing or simulating female attire; in girls, insistence on wearing only stereotypical masculine clothing
- Strong and persistent preferences for cross-gender roles in make-believe play or fantasy
- A strong rejection of toys/games typically associated with the child’s sex
- Intense desire to participate in stereotypical games and pastimes of the other gender
- Strong preference for playmates of the other gender
- A strong dislike of one’s sexual anatomy
- A strong desire for the primary (eg, penis or vagina) or secondary (eg, menstruation) sex characteristics of the other gender.8
Adolescents and adults must meet two or more of the following for at least six months
- A noticeable incongruence between the gender that the patient sees themselves as and their sex characteristics
- An intense need to do away with (or prevent) his or her primary or secondary sex features
- An intense desire to have the primary and/or secondary sex features of the other gender
- A deep desire to transform into another gender
- A profound need for society to treat them as someone of the other gender
- A powerful assurance of having the characteristic feelings and responses of the other gender.8
For children as well as adolescents and adults, the condition should cause the patient significant distress or significantly affect him or her socially, at work or school, and in other important areas of life.8
Is the patient a candidate for hormone therapy?
Two primary sources—Standards of Care for the Health of Transsexual, Transgender, and Gender-Nonconforming People, Version 7, issued by the World Professional Association for Transgender Health (WPATH)10 and Endocrine Treatment of Transsexual Persons11 by the Endocrine Society—offer clinical practice guidance based on evidence and expert opinion.
WPATH recommends that a mental health professional (MHP) experienced in transgender care diagnose GD to ensure that it is not mistaken for a psychiatric condition manifesting as altered gender identity. However, if no one with such experience is available or accessible in the region, it is reasonable for a primary care provider to make the diagnosis and consider initiating hormone therapy without a mental health referral,12 as the expected benefits outweigh the risks of nontreatment.13
Whether or not an MHP confirms a diagnosis of GD, it is still up to the treating provider to confirm the patient’s eligibility and readiness for hormone therapy: He or she should meet DSM-5 or ICD-10 criteria for GD, have no psychiatric comorbidity (eg, schizophrenia, body dysmorphic disorder, or uncontrolled bipolar disorder) likely to interfere with treatment, understand the expected outcomes and the social benefits and risks, and have indicated a willingness to take the hormones responsibly.
Historically, patients were required to have a documented real-life experience, defined as having fully adopted the new gender role in everyday life for at least three months.10,11 This model has fallen out of favor, however, as it is unsupported by evidence and may place transgender individuals at physical and emotional risk. Instead, readiness is confirmed by obtaining informed consent.12
Puberty may be suppressed with a gonadotropin-releasing hormone (GnRH) agonist in adolescents who have a GD diagnosis and are at Tanner stage 2 to 3 of puberty until age 16. At that point, hormone therapy consistent with their gender identification may be initiated (see “How to Help Transgender Teens”).11
Beginning the transition
The transitioning process is a complex and individualized journey that can include inward or outward change, or both.
For patients interested in medical interventions, possible therapies include cross-sex hormone administration and gender-affirming surgery. Both are aimed at making the physical and the psychologic more congruent. Hormone treatment (see Table 2) is often essential to reduce the distress of individuals with GD and to help them feel comfortable in their own body.10,11,21 Psychologic conditions, such as depression, tend to improve as the transitioning process gets underway.22
FEMALE-TO-MALE TRANSITION
CASE 1 Jennie R, a 55-year-old postmenopausal patient, comes to your office for an annual exam. Although you’ve been her primary care provider for several years, she confides for the first time that she has never been comfortable as a woman. “I’ve always felt that my body didn’t belong to me,” the patient admits, and goes on to say that for the past several years she has been living as a man. Jennie R says she is ready to start hormone therapy to assist with the gender transition and asks about the process, the benefits and risks, and how quickly she can expect to achieve the desired results.
If Jennie R were your patient, how would you respond?
Masculinizing hormone treatment
As you would explain to a patient like Jennie R, the goal of hormone therapy is to suppress the effects of the sex assigned at birth and replace them with those of the desired gender. In the case of a female transitioning to a male (known as a transman), masculinizing hormones would promote growth of facial and body hair, cessation of menses, increased muscle mass, deepening of the voice, and clitoral enlargement.
Physical changes induced by masculinizing hormone therapy have an expected onset of one to six months and achieve maximum effect in approximately two to five years.10,11 Although there have been no controlled clinical trials evaluating the safety or efficacy of any transitional hormone regimen, WPATH and the Center of Excellence for Transgender Health at the University of California, San Francisco, suggest initiating intramuscular or transdermal testosterone at increasing doses until normal physiologic male testosterone levels between 350 and 700 ng/dL are achieved, or until cessation of menses.13,25-28 The dose at which either, or both, occur should be continued as long-term maintenance therapy. Medroxyprogesterone can be added, if necessary for menstrual cessation, and a GnRH agonist or endometrial ablation can be used for refractory uterine bleeding.29,30
Testosterone is not a contraceptive. It is important to emphasize to transmen like Jennie that they remain at risk for pregnancy if they are having sex with fertile males. Caution patients not to assume that the possibility of pregnancy ends when menses stop.
Treat minor adverse effects. Adverse effects of masculinizing hormones include vaginal atrophy, fat redistribution and weight gain, polycythemia, acne, scalp hair loss, sleep apnea, elevated liver enzymes, hyperlipidemia, cardiovascular disease, diabetes, and bone density loss. Increased risk for cancer of the female organs has not been proven.10,11 It is reasonable to treat minor adverse effects after reviewing the risks/benefits of doing so, as discontinuing hormone therapy could be detrimental to the well-being of transitioning patients.11
There are absolute contraindications to masculinizing hormone therapy, however, including pregnancy, unstable coronary artery disease, and untreated polycythemia with a hematocrit > 55%.10
Monitoring is essential. Patients receiving masculinizing hormone therapy should be monitored every three months during the first year and once or twice a year thereafter, with a focused history (including mood symptoms), physical exam (including weight and blood pressure), and labs (including complete blood count, liver function, renal function, and lipids) at each visit.11,23 Some clinicians also check estradiol levels until they fall below 50 pg/mL,23,27 while others take the cessation of uterine bleeding for > 6 months as an indicator of estrogen suppression.
Preventive health measures continue. Routine screening should continue, based on the patient’s assigned sex at birth. Thus, a transman who has not had a hysterectomy still needs Pap smears, mammograms if the patient has not had a double mastectomy, and bone mineral density (BMD) testing to screen for osteoporosis.31,32 Some experts recommend starting to test BMD at age 50 for patients receiving masculinizing hormones, given the unknown effect of testosterone on bone density.11,31,32
CASE 1 The first question for a transgender patient is about his or her current gender identity, but Jennie R has already reported living as a man. So you start by asking “What name do you prefer to use?” and “Do you prefer to be referred to with male or female pronouns?”
The patient tells you that he sees himself as a man, he wants to be called Jeff, and he prefers male pronouns. You explain that you believe he has gender dysphoria and would benefit from hormone therapy, but it is important to confirm this diagnosis with an MHP. You explain that testosterone can be prescribed for masculinizing effects, and describe the expected effects—more facial and body hair, a deeper voice, and greater muscle mass, among others—and review the likely time frame.
You also discuss the risks of masculinizing hormones (hyperlipidemia, cardiovascular disease, diabetes, and loss of bone density) that will need to be monitored. Before he leaves, you give him the name of an MHP who is experienced in transgender care and tell him to make a follow-up appointment with you after he has seen her. At the conclusion of the visit, you make a note of the patient’s name and gender identity in the chart and inform the staff of the changes.
MALE-TO-FEMALE TRANSITION
CASE 2 Before heading into your office to talk to a new patient named Carl S, you glance at his chart and see that he is a healthy 21-year-old who has come in for a routine physical. When you enter the room, you find Carl wearing a dress, heels, and make-up. After confirming that you have the right patient, you ask, “What is your current gender identity?” “Female,” says Carl, who indicates that she now goes by Carol. The patient has no medical problems, surgical history, or significant family history but reports that she has been taking spironolactone and estrogen for the past three years. Carol also says she has a new female partner and is having unprotected sexual activity.
Feminizing hormone treatment
The desired effects of feminizing hormones include voice change, decreased hair growth, breast growth, body fat redistribution, decreased muscle mass, skin softening, decreased oiliness of skin and hair, and a decrease in spontaneous erections, testicular volume, and sperm production.10,11 The onset of feminizing effects ranges from one month to one year and the expected maximum effect occurs anywhere between three months and five years.10,11 Regimens usually include anti-androgen agents and estrogen.13,26-28
The medications that have been most studied with anti-androgenic effects include spironolactone and 5-α reductase inhibitors (5-ARIs) such as finasteride. Spironolactone inhibits testosterone secretion and inhibits androgen binding to androgen receptors; 5-ARIs block the conversion of testosterone to 5-α-dihydrotestosterone, the more active form.
Estrogen can be administered via oral, sublingual, transdermal, or intramuscular route, but parenteral formulations are preferred to avoid first-pass metabolism. The serum estradiol target is similar to the mean daily level of premenopausal women (< 200 pg/mL) and the level of testosterone should be in the normal female range (< 55 ng/dL).13,26-28
The selection of medications should be individualized for each patient. Comorbidities must be considered, as well as the risk for adverse effects, which include venous thromboembolism, elevated liver enzymes, breast cancer, cardiovascular disease, diabetes, hyperprolactinemia, weight gain, gallstones, cerebrovascular disease, and severe migraine headaches.10,11 Estrogen therapy is not reported to induce hypertrophy or premalignant changes in the prostate.33 As is the case for masculinizing hormones, feminizing hormone therapy should be continued indefinitely for long-term effects.
Frequent monitoring is recommended. Patients taking feminizing hormones (transwomen) should be seen every two to three months in the first year and monitored once or twice a year thereafter. Serum testosterone and estradiol levels should initially be monitored every three months; serum electrolytes, specifically potassium, should be monitored every two to three months in the first year until stable.
CASE 2 You recommend that Carol S be screened annually for sexually transmitted diseases, as you would for any 21-year-old patient. You point out, too, that while estrogen and androgen-suppressing therapy decrease sperm production, there is a possibility that the patient could impregnate a female partner and recommend that contraception be used if the couple is not trying to conceive.
You also discuss the risks and benefits of hormone therapy and reasonable expectations of continued treatment. You ask Carol to schedule a follow-up visit in six months, as her hormone regimen is stable. Finally, if the patient remains on hormone therapy, you mention that the only screening unique to men transitioning to women is for breast cancer, which should begin at age 40 to 50 (as it should for all women).
Gender-affirming surgical options
Surgical management of transgender patients is not within the scope of family medicine. But it is essential to know what procedures are available, as you may have occasion to advocate for patients during the surgical referral process and possibly to provide postoperative care.
For transmen, surgical options include chest reconstruction, hysterectomy/oophorectomy, metoidioplasty (using the clitoris to surgically approximate a penis), phalloplasty, scrotoplasty, urethroplasty, and vaginectomy.10,34 The surgeries available for transwomen are orchiectomy, vaginoplasty, penectomy, breast augmentation, thyroid chondroplasty and voice surgery, and facial feminization.10,34 Keep in mind that not all transgender individuals desire surgery as part of the transitioning process.
The authors would like to acknowledge the assistance of Michelle Forcier, MD, MPH, and Karen S. Bernstein, MD, MPH, in the preparation of this manuscript.
1. Pew Research Center. A survey of LGBT Americans: attitudes, experiences and values in changing times. www.pewsocialtrends.org/2013/06/13/a-survey-of-lgbt-americans. Accessed January 13, 2017.
2. Gates GJ. How many people are lesbian, gay, bisexual and transgender? http://williamsinstitute.law.ucla.edu/wp-content/uploads/Gates-How-Many-People-LGBT-Apr-2011.pdf. Accessed January 13, 2017.
3. van Kesteren PJ, Gooren LJ, Megens JA. An epidemiological and demographic study of transsexuals in The Netherlands. Arch Sex Behav. 1996;25:589-600.
4. Bhola S. An ally’s guide to terminology: talking about LGBT people & equality. www.glaad.org/2011/07/28/an-allys-guide-to-terminology-talking-about-lgbt-people-equality. Accessed January 13, 2017.
5. University of California, San Francisco. Transgender terminology. UCSF Center of Excellence for Transgender Health. http://transhealth.ucsf.edu/tcoe?page=protocol-terminology. Accessed January 13, 2017.
6. Istar A. How queer! The development of gender identity and sexual orientation in LGBTQ-headed families. Fam Process. 2010;49:268-290.
7. Goins ES, Pye D. Check the box that best describes you: reflexively managing theory and praxis in LGBTQ health communication research. Health Commun. 2013;28:397-407.
8. American Psychiatric Association. Gender dysphoria. Diagnostic and Statistical Manual of Mental Disorders, 5th ed. Washington, DC: American Psychiatric Association; 2013: 451-459.
9. World Health Organization. The International Classification of Diseases, 10th rev. Classification of mental and behavioural disorders: clinical descriptions and diagnostic guidelines. 1992; Geneva.
10. Coleman E, Bockting W, Botzer M, et al; World Professional Association for Transgender Health. Standards of Care for the Health of Transsexual, Transgender, and Gender-Nonconforming People, Version 7. Int J Transgender. 2011; 13:165-232.
11. Hembree WC, Cohen-Kettenis P, Delemarre-van de Waal HA, et al. Endocrine treatment of transsexual persons: an Endocrine Society clinical practice guideline. J Clin Endo Metabol. 2009;94:3132-3154.
12. University of California, San Francisco. Assessing readiness for hormones. UCSF Center of Excellence for Transgender Health. http://transhealth.ucsf.edu/tcoe?page=protocol-hormone-ready. Accessed January 13, 2017.
13. Gooren L. Hormone treatment of the adult transsexual patient. Horm Res. 2005;64(suppl 2):S31-S36.
14. Hembree WC. Guidelines for pubertal suspension and gender reassignment for transgender adolescents. Child Adolesc Psychiatr Clin N Am. 2011;20:725-732.
15. Gay, Lesbian, and Straight Education Network (GLSEN). Harsh realities. The experiences of transgender youth in our nation’s schools. www.glsen.org/sites/default/files/Harsh%20Realities.pdf. Accessed January 13, 2017.
16. Berman M, Balingit M. Eleven states sue Obama administration over bathroom guidance for transgender students. May 25, 2016. Washington Post. www.washingtonpost.com/news/post-nation/wp/2016/05/25/texas-governor-says-state-will-sue-obama-administration-over-bathroom-directive/. Accessed January 13, 2017.
17. de Vries AL, Cohen-Kettenis PT, Delemarre-van de Waal H. Clinical management of gender dysphoria in adolescents. 2006. Vancouver Coastal Health - Transgender Health Program. www.amsa.org/wp-content/uploads/2015/04/CaringForTransgenderAdolescents.pdf. Accessed January 13, 2017.
18. TransYouth Family Allies. Empowering transgender youth & families. www.imatyfa.org/. Accessed January 13, 2017.
19. Human Rights Campaign. On our own: a survival guide for independent LGBTQ youth. www.hrc.org/resources/on-our-own-a-survival-guide-for-independent-lgbtq-youth. Accessed January 13, 2017.
20. Gay, Lesbian, Bisexual, and Transgender National Help Center. www.glbthotline.org. Accessed January 13, 2017.
21. University of California, San Francisco. Hormone administration. UCSF Center of Excellence for Transgender Health. http://transhealth.ucsf.edu/trans?page=protocol-hormones. Accessed January 13, 2017.
22. Gorin-Lazard A, Baumstarck K, Boyer L, et al. Hormonal therapy is associated with better self-esteem, mood, and quality of life in transsexuals. J Nerv Ment Dis. 2013;201:996-1000.
23. Bhasin S, Cunningham GR, Hayes FJ, et al. Testosterone therapy in adult men with androgen deficiency syndromes: an Endocrine Society clinical practice guideline. J Clin Endocrinol Metab. 2006;91:1995-2010.
24. Boloña ER, Uraga MV, Haddad RM, et al. Testosterone use in men with sexual dysfunction: a systematic review and meta-analysis of randomized placebo-controlled trials. Mayo Clin Proc. 2007;82:20-28.
25. Gooren LJ, Giltay EJ. Review of studies of androgen treatment of female-to-male transsexuals: effects and risks of administration of androgens to females. J Sex Med. 2008; 5:765-776.
26. Levy A, Crown A, Reid R. Endocrine intervention for transsexuals. Clin Endocrinol (Oxf). 2003;59:409-418.
27. Moore E, Wisniewski A, Dobs A. Endocrine treatment of transsexual people: a review of treatment regimens, outcomes, and adverse effects. J Clin Endocrinol Metab. 2003;88:3467-3473.
28. Tangpricha V, Ducharme SH, Barber TW, et al. Endocrinologic treatment of gender identity disorders. Endocr Pract. 2003;9:12-21.
29. Dickersin K, Munro MG, Clark M, et al. Hysterectomy compared with endometrial ablation for dysfunctional uterine bleeding: a randomized controlled trial. Obstet Gynecol. 2007;110:1279-1289.
30. Prasad P, Powell MC. Prospective observational study of Thermablate Endometrial Ablation System as an outpatient procedure. J Minim Invasive Gynecol. 2008;15:476-479.
31. University of California, San Francisco. General prevention and screening. UCSF Center of Excellence for Transgender Health. http://transhealth.ucsf.edu/trans?page=protocol-screening. Accessed January 13, 2017.
32. Ganly I, Taylor EW. Breast cancer in a trans-sexual man receiving hormone replacement therapy. Br J Surg. 1995; 82:341.
33. Meriggiola MC, Gava G. Endocrine care of transpeople part II: a review of cross-sex hormonal treatments, outcomes and adverse effects in transwomen. Clin Endocrinol (Oxf). 2015;83:607-615.
34. University of California, San Francisco. Surgical options. UCSF Center of Excellence for Transgender Health. http://transhealth.ucsf.edu/trans?page=protocol-surgery. Accessed January 13, 2017.
New Biologics in Psoriasis: An Update on IL-23 and IL-17 Inhibitors
The role of current biologic therapies in psoriasis predicates on the pathogenic role of upregulated, immune-related mechanisms that result in the activation of myeloid dendritic cells, which release IL-17, IL-23, and other cytokines to activate T cells, including helper T cell TH17. Along with other immune cells, TH17 produces IL-17. This proinflammatory cascade results in keratinocyte proliferation, angiogenesis, and migration of immune cells toward psoriatic lesions.1 Thus, the newest classes of biologics target IL-12, IL-23, and IL-17 to disrupt this inflammatory cascade.
We provide an updated review of the most recent clinical efficacy and safety data on the newest IL-23 and IL-17 inhibitors in the pipeline or approved for psoriasis, including risankizumab, guselkumab, tildrakizumab, ixekizumab, and brodalumab (Table). Ustekinumab and adalimumab, which have been previously approved by the US Food and Drug Administration (FDA), will be discussed here only as comparators.
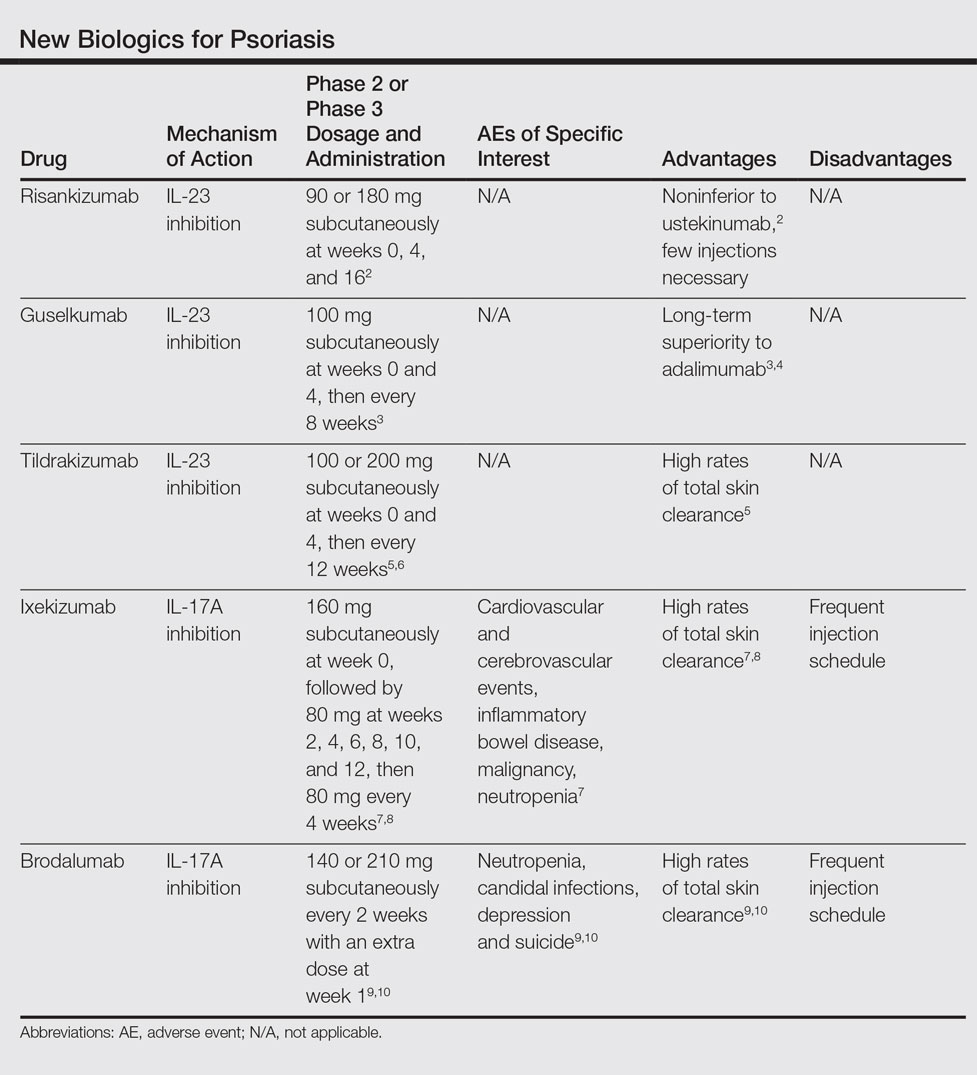
IL-23 Inhibitors
Risankizumab
Risankizumab (formerly known as BI 655066)(Boehringer Ingelheim) is a selective human monoclonal antibody targeting the p19 subunit of IL-23 and currently is undergoing phase 3 trials for psoriasis. A proof-of-concept phase 1 study of 39 participants demonstrated efficacy after 12 weeks of treatment at varying subcutaneous and intravenous doses with placebo control.11 At week 12, 87% (27/31)(P<.001) of all risankizumab-treated participants achieved 75% reduction in psoriasis area and severity index (PASI) score compared to 0% of 8 placebo-treated participants. Common adverse effects (AEs) occurred in 65% (20/31) of risankizumab-treated participants, including non–dose-dependent upper respiratory tract infections, nasopharyngitis, and headache. Serious adverse events (SAEs) that occurred were considered unrelated to the study medication.11
A phase 2 trial of 166 participants compared 3 dosing regimens of subcutaneous risankizumab (single 18-mg dose at week 0; single 90-mg dose at weeks 0, 4, and 16; or single 180-mg dose at weeks 0, 4, and 16) and ustekinumab (weight-based single 45- or 90-mg dose at weeks 0, 4, and 16), demonstrating noninferiority at higher doses of risankizumab.2 Preliminary primary end point results at week 12 showed PASI 90 in 32.6% (P=.4667), 73.2% (P=.0013), 81.0% (P<.0001), and 40.0% of the treatment groups, respectively. Participants in the 180-mg risankizumab group achieved PASI 90 eight weeks faster than those on ustekinumab, lasting more than 2 months longer. Adverse effects were similar across all treatment groups and SAEs were unrelated to the study medications.2
Guselkumab
Guselkumab (Janssen Biotech, Inc) is a selective human monoclonal antibody against the p19 subunit of IL-23. The 52-week phase 2 X-PLORE trial compared dose-ranging subcutaneous guselkumab (5 mg at weeks 0 and 4, then every 12 weeks; 15 mg every 8 weeks; 50 mg at weeks 0 and 4, then every 12 weeks; 100 mg every 8 weeks; or 200 mg at weeks 0 and 4, then every 12 weeks), adalimumab (80-mg loading dose, followed by 40 mg at week 1, then every other week), and placebo in 293 randomized participants.4 At week 16, 34% (P=.002) of participants in the 5-mg guselkumab group, 61% (P<.001) in the 15-mg group, 79% (P<.001) in the 50-mg group, 86% (P<.001) in the 100-mg group, 83% (P<.001) in the 200-mg group, and 58% (P<.001) in the adalimumab group achieved physician global assessment (PGA) scores of 0 (clear) or 1 (minimal psoriasis) compared to 7% of the placebo group. Achievement of PASI 75 similarly favored the guselkumab (44% [P<.001]; 76% [no P value given]; 81% [P<.001]; 79% [P<.001]; and 81% [P<.001], respectively) and adalimumab treatment arms (70% [P<.001]) compared to 5% in the placebo group. In longer-term comparisons to week 40, participants in the 50-, 100-, and 200-mg guselkumab groups showed significantly greater remission of psoriatic lesions, measured by a PGA score of 0 or 1, than participants in the adalimumab group (71% [P=.05]; 77% [P=.005]; 81% [P=.01]; and 49%, respectively).4
Preliminary results from VOYAGE 1 (N=837), the first of several phase 3 trials, further demonstrate the superiority of guselkumab 100 mg at weeks 0 and 4 and then every 8 weeks over adalimumab (standard dosing) and placebo; at week 16, 73.3% (P<.001 for both comparisons) versus 49.7% and 2.9% of participants, respectively, achieved PASI 90, with sustained superiority of skin clearance in guselkumab-treated participants compared to adalimumab and placebo through week 48.3
Long-term safety data showed no dose dependence or trend from 0 to 16 weeks and 16 to 52 weeks of treatment regarding rates of AEs, SAEs, or serious infections.4 Between weeks 16 and 52, 48.9% of all guselkumab-treated participants exhibited AEs compared to 60.5% of adalimumab-treated participants and 51.3% of placebo participants. Overall infection rates also were lowest in the guselkumab group at 29.8% compared to 36.8% and 35.9%, respectively. Three participants treated with guselkumab had major cardiovascular events, including a fatal myocardial infarction. No cases of tuberculosis or serious opportunistic infections were reported.4
Tildrakizumab
Tildrakizumab (formerly known as MK-3222)(Sun Pharmaceutical Industries Ltd) is a human monoclonal antibody also targeting the p19 subunit of IL-23. In a phase 2 study of 355 participants with chronic plaque psoriasis, participants received 5-, 25-, 100-, or 200-mg subcutaneous tildrakizumab or placebo at weeks 0 and 4 and then every 12 weeks for a total of 52 weeks.6 At week 16, PASI 75 results were 33.3%, 64.4%, 66.3%, 74.4%, and 4.4%, respectively (P<.001 for each comparison). Improvement began within the first month of treatment, with median times to PASI 75 of 57 days at 200-mg dosing and 84 days at 100-mg dosing. Of those participants achieving PASI 75 by drug discontinuation at week 52, 96% of the 100-mg group and 93% of the 200-mg group maintained PASI 75 through week 72, suggesting low relapse rates after treatment cessation.6
In October 2016, the efficacy results of 2 pivotal phase 3 trials (reSURFACE 1 and reSURFACE 2) involving more than 1800 participants combined revealed PASI 90 achievement in an average of 54% of participants on tildrakizumab 100 mg and 59% of participants on tildrakizumab 200 mg at week 28.5 Achievement of PASI 100 occurred in 24% and 30% of participants at week 28, respectively. The second of these trials included an etanercept comparison group and demonstrated head-to-head superiority of 100 and 200 mg subcutaneous tildrakizumab at week 12 by end point measures.5
Treatment-related AEs occurred at rates of 25% in tildrakizumab-treated participants and 22% in placebo-treated participants, most frequently nasopharyngitis and headache.6 At least 1 AE occurred in 64% of tildrakizumab-treated participants without dose dependence compared to 69% of placebo-treated participants. Severe AEs thought to be drug treatment related were bacterial arthritis, lymphedema, melanoma, stroke, and epiglottitis.6
IL-17 Inhibitors
Ixekizumab
Ixekizumab (Eli Lilly and Company), a monoclonal inhibitor of IL-17A, is the most recently approved psoriasis biologic on the market and has been cleared for use in adults with moderate to severe plaque psoriasis. Recommended dosing is 160 mg (given in two 80-mg subcutaneous injections via an autoinjector or prefilled syringe) at week 0, followed by an 80-mg injection at weeks 2, 4, 6, 8, 10, and 12, and then 80 mg every 4 weeks thereafter. The FDA approved ixekizumab in March 2016 following favorable results of several phase 3 trials: UNCOVER-1, UNCOVER-2, and UNCOVER-3.7,8
In UNCOVER-1, 1296 participants were randomized to 1 of 2 ixekizumab treatment arms—160 mg starting dose at week 0, 80 mg every 2 or 4 weeks thereafter—or placebo.7 At week 12, 89.1%, 82.6%, and 3.9% achieved PASI 75, respectively (P<.001 for both). Importantly, high numbers of participants also achieved PASI 90 (70.9% in the 2-week group and 64.6% in the 4-week group vs 0.5% in the placebo group [P<.001]) and PASI 100 (35.3% and 33.6% vs 0%, respectively [P<.001]), suggesting high rates of disease clearance.7
UNCOVER-2 (N=1224) and UNCOVER-3 (N=1346) investigated the same 2 dosing regimens of ixekizumab compared to etanercept 50 mg biweekly and placebo.8 At week 12, the percentage of participants achieving PASI 90 in UNCOVER-2 was 70.7%, 59.7%, 18.7%, and 0.6%, respectively, and 68.1%, 65.3%, 25.7%, and 3.1%, respectively, in UNCOVER-3 (P<.0001 for all comparisons to placebo and etanercept). At week 12, PASI 100 results also showed striking superiority, with 40.5%, 30.8%, 5.3%, and 0.6% of participants, respectively, in UNCOVER-2, and 37.7%, 35%, 7.3%, and 0%, respectively, in UNCOVER-3, achieving complete clearance of disease (P<.0001 for all comparisons to placebo and etanercept). Responses to ixekizumab were observed as early as weeks 1 and 2, while no participants in the etanercept and placebo treatment groups achieved comparative efficiency.8
In an extension of UNCOVER-3, efficacy increased from week 12 to week 60 according to PASI 90 (68%–73% in the 2-week group; 65%–72% in the 4-week group) and PASI 100 measures (38%–55% in the 2-week group; 35%–52% in the 4-week group).7
The most common AEs associated with ixekizumab treatment from weeks 0 to 12 occurred at higher rates in the 2-week and 4-week ixekizumab groups compared to placebo, including nasopharyngitis (9.5% and 9% vs 8.7%, respectively), upper respiratory tract infection (4.4% and 3.9% vs 3.5%, respectively), injection-site reaction (10% and 7.7% vs 1%, respectively), arthralgia (4.4% and 4.3% vs 2.9%, respectively), and headache (2.5% and 1.9% vs 2.1%, respectively). Infections, including candidal, oral, vulvovaginal, and cutaneous, occurred in 27% of the 2-week dosing group and 27.4% of the 4-week dosing group compared to 22.9% of the placebo group during weeks 0 to 12, with candidal infections in particular occurring more frequently in the active treatment groups and exhibiting dose dependence. Other AEs of special interest that occurred among all ixekizumab-treated participants (n=3736) from weeks 0 to 60 were cardiovascular and cerebrovascular events (22 [0.6%]), inflammatory bowel disease (11 [0.3%]), non–skin cancer malignancy (14 [0.4%]), and nonmelanoma skin cancer (20 [0.5%]). Neutropenia occurred at higher rates in ixekizumab-treated participants (9.3% in the 2-week group and 8.6% in the 4-week group) compared to placebo (3.3%) and occurred in 11.5% of all ixekizumab participants over 60 weeks.7
Brodalumab
Brodalumab (Valeant Pharmaceuticals International, Inc) is a human monoclonal antibody targeting the IL-17A receptor currently under review for FDA approval after undergoing phase 3 trials. The first of these trials, AMAGINE-1, showed efficacy of subcutaneous brodalumab (140 or 210 mg administered every 2 weeks with an extra dose at week 1) compared to placebo in 661 participants.9 At week 12, 60%, 83%, and 3%, respectively, achieved PASI 75; 43%, 70%, and 1%, respectively, achieved PASI 90; and 23%, 42%, and 1%, respectively, achieved PASI 100 (P<.001 for all respective comparisons to placebo). These effects were retained through 52 weeks of treatment. The median time to complete disease clearance in participants reaching PASI 100 was 12 weeks. Conversely, participants who were re-randomized to placebo after week 12 of brodalumab treatment relapsed within weeks to months.9
AMAGINE-2 and AMAGINE-3 further demonstrated the efficacy of brodalumab (140 or 210 mg every 2 weeks with extra dose at week 1) compared to ustekinumab (45 or 90 mg weight-based standard dosing) and placebo in 1831 participants, respectively.10 In AMAGINE-2, 49% of participants in the 140-mg group (P<.001 vs placebo), 70% in the 210-mg group (P<.001 vs placebo), 47% in the ustekinumab group, and 3% in the placebo group achieved PASI 90 at week 12. Similarly, in AMAGINE-3, 52% of participants in the 140-mg group (P<.001), 69% in the 210-mg group (P<.001), 48% in the ustekinumab group, and 2% in the placebo group achieved PASI 90. Impressively, complete clearance (PASI 100) at week 12 occurred in 26% of the 140-mg group (P<.001 vs placebo), 44% of the 210-mg group (P<.001 vs placebo), and 22% of the ustekinumab group compared to 2% of the placebo group in AMAGINE-2, with similar rates in AMAGINE-3. Brodalumab was significantly superior to ustekinumab at the 210-mg dose by PASI 90 measures (P<.001) in both studies and at the 140-mg dose by PASI 100 measures (P=.007) in AMAGINE-3 only.10
Common AEs were nasopharyngitis, upper respiratory tract infection, headache, and arthralgia, all occurring at grossly similar rates (49%–60%) across all experimental groups in AMAGINE-1, AMAGINE-2, and AMAGINE-3 during the first 12-week treatment period.9,10 Brodalumab treatment groups had high rates of specific interest AEs compared to ustekinumab and placebo groups, including neutropenia (0.8%, 1.1%, 0.3%, and 0%, respectively) and candidal infections (0.8%, 1.3%, 0.3%, and 0.3%, respectively). Induction phase (weeks 0–12) depression rates were concerning, with 6 cases each in AMAGINE-2 (4 [0.7%] in the 140-mg group, 2 [0.3%] in the 210-mg group) and AMAGINE-3 (4 [0.6%] in the 140-mg group, 2 [0.3%] in the 210-mg group). Cases of neutropenia were mild, were not associated with major infection, and were transient or reversible. Depression rates after 52 weeks of treatment were 1.7% (23/1567) of brodalumab participants in AMAGINE-2 and 1.8% (21/1613) in AMAGINE-3. Three participants, all on constant 210-mg dosing through week 52, attempted suicide with 1 completion10; however, because no other IL-17 inhibitors were associated with depression or suicide in other trials, it has been suggested that these cases were incidental and not treatment related.12 An FDA advisory panel recommended approval of brodalumab in July 2016 despite ongoing concerns of depression and suicide.13
Conclusion
The robust investigation into IL-23 and IL-17 inhibitors to treat plaque psoriasis has yielded promising results, including the unprecedented rates of PASI 100 achievement with these new biologics. Risankizumab, ixekizumab, and brodalumab have demonstrated superior efficacy in trials compared to ustekinumab. Tildrakizumab has shown low disease relapse after drug cessation. Ixekizumab and brodalumab have shown high rates of total disease clearance. Thus far, safety findings for these pipeline biologics have been consistent with those of ustekinumab. With ixekizumab approved in 2016 and brodalumab under review, new options in biologic therapy will offer patients and clinicians greater choices in treating severe and recalcitrant psoriasis.
- Nestle FO, Kaplan DH, Barker J. Psoriasis. N Engl J Med. 2009;361:496-509.
- Papp K, Menter A, Sofen H, et al. Efficacy and safety of different dose regimens of a selective IL-23p19 inhibitor (BI 655066) compared with ustekinumab in patients with moderate-to-severe plaque psoriasis with and without psoriatic arthritis. Paper presented at: 2015 American College of Rheumatology/Association of Rheumatology Health Professionals Annual Meeting; November 6-11, 2015; San Francisco, CA.
- New phase 3 data show significant efficacy versus placebo and superiority of guselkumab versus Humira in treatment of moderate to severe plaque psoriasis [press release]. Vienna, Austria; Janssen Research & Development, LLC: October 1, 2016.
- Gordon KB, Duffin KC, Bissonnette R, et al. A phase 2 trial of guselkumab versus adalimumab for plaque psoriasis. N Engl J Med. 2015;373:136-144.
- Sun Pharma to announce late-breaking results for investigational IL-23p19 inhibitor, Tildrakizumab, achieves primary end point in both phase-3 studies in patients with moderate-to-severe plaque psoriasis [press release]. Mumbai, India; Sun Pharmaceutical Industries Ltd: October 1, 2016.
- Papp K, Thaci D, Reich K, et al. Tildrakizumab (MK-3222), an anti-interleukin-23p19 monoclonal antibody, improves psoriasis in a phase IIb randomized placebo-controlled trial. Br J Dermatol. 2015;173:930-939.
- Gordon KB, Blauvelt A, Papp KA, et al; UNCOVER-1 Study Group, UNCOVER-2 Study Group, UNCOVER-3 Study Group. Phase 3 trials of ixekizumab in moderate-to-severe plaque psoriasis. N Engl J Med. 2016;375:345-356.
- Griffiths CE, Reich K, Lebwohl M, et al. Comparison of ixekizumab with etanercept or placebo in moderate-to-severe psoriasis (UNCOVER-2 and UNCOVER-3): results from two phase 3 randomised trials. Lancet. 2015;386:541-551.
- Papp KA, Reich K, Paul C, et al. A prospective phase III, randomized, double-blind, placebo-controlled study of brodalumab in patients with moderate-to-severe plaque psoriasis [published online June 23, 2016]. Br J Dermatol. 2016;175:273-286.
- Lebwohl M, Strober B, Menter A, et al. Phase 3 studies comparing brodalumab with ustekinumab in psoriasis. N Engl J Med. 2015;373:1318-1328.
- Krueger JG, Ferris LK, Menter A, et al. Anti-IL-23A mAb BI 655066 for treatment of moderate-to-severe psoriasis: safety, efficacy, pharmacokinetics, and biomarker results of a single-rising-dose, randomized, double-blind, placebo-controlled trial [published online March 1, 2015]. J Allergy Clin Immunol. 2015;136:116-124.e7.
- Chiricozzi A, Romanelli M, Saraceno R, et al. No meaningful association between suicidal behavior and the use of IL-17A-neutralizing or IL-17RA-blocking agents [published online August 31, 2016]. Expert Opin Drug Saf. 2016;15:1653-1659.
- FDA advisory committee recommends approval of brodalumab for treatment of moderate-to-severe plaque psoriasis [news release]. Laval, Quebec: Valeant Pharmaceuticals International, Inc; July 19, 2016.
The role of current biologic therapies in psoriasis predicates on the pathogenic role of upregulated, immune-related mechanisms that result in the activation of myeloid dendritic cells, which release IL-17, IL-23, and other cytokines to activate T cells, including helper T cell TH17. Along with other immune cells, TH17 produces IL-17. This proinflammatory cascade results in keratinocyte proliferation, angiogenesis, and migration of immune cells toward psoriatic lesions.1 Thus, the newest classes of biologics target IL-12, IL-23, and IL-17 to disrupt this inflammatory cascade.
We provide an updated review of the most recent clinical efficacy and safety data on the newest IL-23 and IL-17 inhibitors in the pipeline or approved for psoriasis, including risankizumab, guselkumab, tildrakizumab, ixekizumab, and brodalumab (Table). Ustekinumab and adalimumab, which have been previously approved by the US Food and Drug Administration (FDA), will be discussed here only as comparators.
IL-23 Inhibitors
Risankizumab
Risankizumab (formerly known as BI 655066)(Boehringer Ingelheim) is a selective human monoclonal antibody targeting the p19 subunit of IL-23 and currently is undergoing phase 3 trials for psoriasis. A proof-of-concept phase 1 study of 39 participants demonstrated efficacy after 12 weeks of treatment at varying subcutaneous and intravenous doses with placebo control.11 At week 12, 87% (27/31)(P<.001) of all risankizumab-treated participants achieved 75% reduction in psoriasis area and severity index (PASI) score compared to 0% of 8 placebo-treated participants. Common adverse effects (AEs) occurred in 65% (20/31) of risankizumab-treated participants, including non–dose-dependent upper respiratory tract infections, nasopharyngitis, and headache. Serious adverse events (SAEs) that occurred were considered unrelated to the study medication.11
A phase 2 trial of 166 participants compared 3 dosing regimens of subcutaneous risankizumab (single 18-mg dose at week 0; single 90-mg dose at weeks 0, 4, and 16; or single 180-mg dose at weeks 0, 4, and 16) and ustekinumab (weight-based single 45- or 90-mg dose at weeks 0, 4, and 16), demonstrating noninferiority at higher doses of risankizumab.2 Preliminary primary end point results at week 12 showed PASI 90 in 32.6% (P=.4667), 73.2% (P=.0013), 81.0% (P<.0001), and 40.0% of the treatment groups, respectively. Participants in the 180-mg risankizumab group achieved PASI 90 eight weeks faster than those on ustekinumab, lasting more than 2 months longer. Adverse effects were similar across all treatment groups and SAEs were unrelated to the study medications.2
Guselkumab
Guselkumab (Janssen Biotech, Inc) is a selective human monoclonal antibody against the p19 subunit of IL-23. The 52-week phase 2 X-PLORE trial compared dose-ranging subcutaneous guselkumab (5 mg at weeks 0 and 4, then every 12 weeks; 15 mg every 8 weeks; 50 mg at weeks 0 and 4, then every 12 weeks; 100 mg every 8 weeks; or 200 mg at weeks 0 and 4, then every 12 weeks), adalimumab (80-mg loading dose, followed by 40 mg at week 1, then every other week), and placebo in 293 randomized participants.4 At week 16, 34% (P=.002) of participants in the 5-mg guselkumab group, 61% (P<.001) in the 15-mg group, 79% (P<.001) in the 50-mg group, 86% (P<.001) in the 100-mg group, 83% (P<.001) in the 200-mg group, and 58% (P<.001) in the adalimumab group achieved physician global assessment (PGA) scores of 0 (clear) or 1 (minimal psoriasis) compared to 7% of the placebo group. Achievement of PASI 75 similarly favored the guselkumab (44% [P<.001]; 76% [no P value given]; 81% [P<.001]; 79% [P<.001]; and 81% [P<.001], respectively) and adalimumab treatment arms (70% [P<.001]) compared to 5% in the placebo group. In longer-term comparisons to week 40, participants in the 50-, 100-, and 200-mg guselkumab groups showed significantly greater remission of psoriatic lesions, measured by a PGA score of 0 or 1, than participants in the adalimumab group (71% [P=.05]; 77% [P=.005]; 81% [P=.01]; and 49%, respectively).4
Preliminary results from VOYAGE 1 (N=837), the first of several phase 3 trials, further demonstrate the superiority of guselkumab 100 mg at weeks 0 and 4 and then every 8 weeks over adalimumab (standard dosing) and placebo; at week 16, 73.3% (P<.001 for both comparisons) versus 49.7% and 2.9% of participants, respectively, achieved PASI 90, with sustained superiority of skin clearance in guselkumab-treated participants compared to adalimumab and placebo through week 48.3
Long-term safety data showed no dose dependence or trend from 0 to 16 weeks and 16 to 52 weeks of treatment regarding rates of AEs, SAEs, or serious infections.4 Between weeks 16 and 52, 48.9% of all guselkumab-treated participants exhibited AEs compared to 60.5% of adalimumab-treated participants and 51.3% of placebo participants. Overall infection rates also were lowest in the guselkumab group at 29.8% compared to 36.8% and 35.9%, respectively. Three participants treated with guselkumab had major cardiovascular events, including a fatal myocardial infarction. No cases of tuberculosis or serious opportunistic infections were reported.4
Tildrakizumab
Tildrakizumab (formerly known as MK-3222)(Sun Pharmaceutical Industries Ltd) is a human monoclonal antibody also targeting the p19 subunit of IL-23. In a phase 2 study of 355 participants with chronic plaque psoriasis, participants received 5-, 25-, 100-, or 200-mg subcutaneous tildrakizumab or placebo at weeks 0 and 4 and then every 12 weeks for a total of 52 weeks.6 At week 16, PASI 75 results were 33.3%, 64.4%, 66.3%, 74.4%, and 4.4%, respectively (P<.001 for each comparison). Improvement began within the first month of treatment, with median times to PASI 75 of 57 days at 200-mg dosing and 84 days at 100-mg dosing. Of those participants achieving PASI 75 by drug discontinuation at week 52, 96% of the 100-mg group and 93% of the 200-mg group maintained PASI 75 through week 72, suggesting low relapse rates after treatment cessation.6
In October 2016, the efficacy results of 2 pivotal phase 3 trials (reSURFACE 1 and reSURFACE 2) involving more than 1800 participants combined revealed PASI 90 achievement in an average of 54% of participants on tildrakizumab 100 mg and 59% of participants on tildrakizumab 200 mg at week 28.5 Achievement of PASI 100 occurred in 24% and 30% of participants at week 28, respectively. The second of these trials included an etanercept comparison group and demonstrated head-to-head superiority of 100 and 200 mg subcutaneous tildrakizumab at week 12 by end point measures.5
Treatment-related AEs occurred at rates of 25% in tildrakizumab-treated participants and 22% in placebo-treated participants, most frequently nasopharyngitis and headache.6 At least 1 AE occurred in 64% of tildrakizumab-treated participants without dose dependence compared to 69% of placebo-treated participants. Severe AEs thought to be drug treatment related were bacterial arthritis, lymphedema, melanoma, stroke, and epiglottitis.6
IL-17 Inhibitors
Ixekizumab
Ixekizumab (Eli Lilly and Company), a monoclonal inhibitor of IL-17A, is the most recently approved psoriasis biologic on the market and has been cleared for use in adults with moderate to severe plaque psoriasis. Recommended dosing is 160 mg (given in two 80-mg subcutaneous injections via an autoinjector or prefilled syringe) at week 0, followed by an 80-mg injection at weeks 2, 4, 6, 8, 10, and 12, and then 80 mg every 4 weeks thereafter. The FDA approved ixekizumab in March 2016 following favorable results of several phase 3 trials: UNCOVER-1, UNCOVER-2, and UNCOVER-3.7,8
In UNCOVER-1, 1296 participants were randomized to 1 of 2 ixekizumab treatment arms—160 mg starting dose at week 0, 80 mg every 2 or 4 weeks thereafter—or placebo.7 At week 12, 89.1%, 82.6%, and 3.9% achieved PASI 75, respectively (P<.001 for both). Importantly, high numbers of participants also achieved PASI 90 (70.9% in the 2-week group and 64.6% in the 4-week group vs 0.5% in the placebo group [P<.001]) and PASI 100 (35.3% and 33.6% vs 0%, respectively [P<.001]), suggesting high rates of disease clearance.7
UNCOVER-2 (N=1224) and UNCOVER-3 (N=1346) investigated the same 2 dosing regimens of ixekizumab compared to etanercept 50 mg biweekly and placebo.8 At week 12, the percentage of participants achieving PASI 90 in UNCOVER-2 was 70.7%, 59.7%, 18.7%, and 0.6%, respectively, and 68.1%, 65.3%, 25.7%, and 3.1%, respectively, in UNCOVER-3 (P<.0001 for all comparisons to placebo and etanercept). At week 12, PASI 100 results also showed striking superiority, with 40.5%, 30.8%, 5.3%, and 0.6% of participants, respectively, in UNCOVER-2, and 37.7%, 35%, 7.3%, and 0%, respectively, in UNCOVER-3, achieving complete clearance of disease (P<.0001 for all comparisons to placebo and etanercept). Responses to ixekizumab were observed as early as weeks 1 and 2, while no participants in the etanercept and placebo treatment groups achieved comparative efficiency.8
In an extension of UNCOVER-3, efficacy increased from week 12 to week 60 according to PASI 90 (68%–73% in the 2-week group; 65%–72% in the 4-week group) and PASI 100 measures (38%–55% in the 2-week group; 35%–52% in the 4-week group).7
The most common AEs associated with ixekizumab treatment from weeks 0 to 12 occurred at higher rates in the 2-week and 4-week ixekizumab groups compared to placebo, including nasopharyngitis (9.5% and 9% vs 8.7%, respectively), upper respiratory tract infection (4.4% and 3.9% vs 3.5%, respectively), injection-site reaction (10% and 7.7% vs 1%, respectively), arthralgia (4.4% and 4.3% vs 2.9%, respectively), and headache (2.5% and 1.9% vs 2.1%, respectively). Infections, including candidal, oral, vulvovaginal, and cutaneous, occurred in 27% of the 2-week dosing group and 27.4% of the 4-week dosing group compared to 22.9% of the placebo group during weeks 0 to 12, with candidal infections in particular occurring more frequently in the active treatment groups and exhibiting dose dependence. Other AEs of special interest that occurred among all ixekizumab-treated participants (n=3736) from weeks 0 to 60 were cardiovascular and cerebrovascular events (22 [0.6%]), inflammatory bowel disease (11 [0.3%]), non–skin cancer malignancy (14 [0.4%]), and nonmelanoma skin cancer (20 [0.5%]). Neutropenia occurred at higher rates in ixekizumab-treated participants (9.3% in the 2-week group and 8.6% in the 4-week group) compared to placebo (3.3%) and occurred in 11.5% of all ixekizumab participants over 60 weeks.7
Brodalumab
Brodalumab (Valeant Pharmaceuticals International, Inc) is a human monoclonal antibody targeting the IL-17A receptor currently under review for FDA approval after undergoing phase 3 trials. The first of these trials, AMAGINE-1, showed efficacy of subcutaneous brodalumab (140 or 210 mg administered every 2 weeks with an extra dose at week 1) compared to placebo in 661 participants.9 At week 12, 60%, 83%, and 3%, respectively, achieved PASI 75; 43%, 70%, and 1%, respectively, achieved PASI 90; and 23%, 42%, and 1%, respectively, achieved PASI 100 (P<.001 for all respective comparisons to placebo). These effects were retained through 52 weeks of treatment. The median time to complete disease clearance in participants reaching PASI 100 was 12 weeks. Conversely, participants who were re-randomized to placebo after week 12 of brodalumab treatment relapsed within weeks to months.9
AMAGINE-2 and AMAGINE-3 further demonstrated the efficacy of brodalumab (140 or 210 mg every 2 weeks with extra dose at week 1) compared to ustekinumab (45 or 90 mg weight-based standard dosing) and placebo in 1831 participants, respectively.10 In AMAGINE-2, 49% of participants in the 140-mg group (P<.001 vs placebo), 70% in the 210-mg group (P<.001 vs placebo), 47% in the ustekinumab group, and 3% in the placebo group achieved PASI 90 at week 12. Similarly, in AMAGINE-3, 52% of participants in the 140-mg group (P<.001), 69% in the 210-mg group (P<.001), 48% in the ustekinumab group, and 2% in the placebo group achieved PASI 90. Impressively, complete clearance (PASI 100) at week 12 occurred in 26% of the 140-mg group (P<.001 vs placebo), 44% of the 210-mg group (P<.001 vs placebo), and 22% of the ustekinumab group compared to 2% of the placebo group in AMAGINE-2, with similar rates in AMAGINE-3. Brodalumab was significantly superior to ustekinumab at the 210-mg dose by PASI 90 measures (P<.001) in both studies and at the 140-mg dose by PASI 100 measures (P=.007) in AMAGINE-3 only.10
Common AEs were nasopharyngitis, upper respiratory tract infection, headache, and arthralgia, all occurring at grossly similar rates (49%–60%) across all experimental groups in AMAGINE-1, AMAGINE-2, and AMAGINE-3 during the first 12-week treatment period.9,10 Brodalumab treatment groups had high rates of specific interest AEs compared to ustekinumab and placebo groups, including neutropenia (0.8%, 1.1%, 0.3%, and 0%, respectively) and candidal infections (0.8%, 1.3%, 0.3%, and 0.3%, respectively). Induction phase (weeks 0–12) depression rates were concerning, with 6 cases each in AMAGINE-2 (4 [0.7%] in the 140-mg group, 2 [0.3%] in the 210-mg group) and AMAGINE-3 (4 [0.6%] in the 140-mg group, 2 [0.3%] in the 210-mg group). Cases of neutropenia were mild, were not associated with major infection, and were transient or reversible. Depression rates after 52 weeks of treatment were 1.7% (23/1567) of brodalumab participants in AMAGINE-2 and 1.8% (21/1613) in AMAGINE-3. Three participants, all on constant 210-mg dosing through week 52, attempted suicide with 1 completion10; however, because no other IL-17 inhibitors were associated with depression or suicide in other trials, it has been suggested that these cases were incidental and not treatment related.12 An FDA advisory panel recommended approval of brodalumab in July 2016 despite ongoing concerns of depression and suicide.13
Conclusion
The robust investigation into IL-23 and IL-17 inhibitors to treat plaque psoriasis has yielded promising results, including the unprecedented rates of PASI 100 achievement with these new biologics. Risankizumab, ixekizumab, and brodalumab have demonstrated superior efficacy in trials compared to ustekinumab. Tildrakizumab has shown low disease relapse after drug cessation. Ixekizumab and brodalumab have shown high rates of total disease clearance. Thus far, safety findings for these pipeline biologics have been consistent with those of ustekinumab. With ixekizumab approved in 2016 and brodalumab under review, new options in biologic therapy will offer patients and clinicians greater choices in treating severe and recalcitrant psoriasis.
- Nestle FO, Kaplan DH, Barker J. Psoriasis. N Engl J Med. 2009;361:496-509.
- Papp K, Menter A, Sofen H, et al. Efficacy and safety of different dose regimens of a selective IL-23p19 inhibitor (BI 655066) compared with ustekinumab in patients with moderate-to-severe plaque psoriasis with and without psoriatic arthritis. Paper presented at: 2015 American College of Rheumatology/Association of Rheumatology Health Professionals Annual Meeting; November 6-11, 2015; San Francisco, CA.
- New phase 3 data show significant efficacy versus placebo and superiority of guselkumab versus Humira in treatment of moderate to severe plaque psoriasis [press release]. Vienna, Austria; Janssen Research & Development, LLC: October 1, 2016.
- Gordon KB, Duffin KC, Bissonnette R, et al. A phase 2 trial of guselkumab versus adalimumab for plaque psoriasis. N Engl J Med. 2015;373:136-144.
- Sun Pharma to announce late-breaking results for investigational IL-23p19 inhibitor, Tildrakizumab, achieves primary end point in both phase-3 studies in patients with moderate-to-severe plaque psoriasis [press release]. Mumbai, India; Sun Pharmaceutical Industries Ltd: October 1, 2016.
- Papp K, Thaci D, Reich K, et al. Tildrakizumab (MK-3222), an anti-interleukin-23p19 monoclonal antibody, improves psoriasis in a phase IIb randomized placebo-controlled trial. Br J Dermatol. 2015;173:930-939.
- Gordon KB, Blauvelt A, Papp KA, et al; UNCOVER-1 Study Group, UNCOVER-2 Study Group, UNCOVER-3 Study Group. Phase 3 trials of ixekizumab in moderate-to-severe plaque psoriasis. N Engl J Med. 2016;375:345-356.
- Griffiths CE, Reich K, Lebwohl M, et al. Comparison of ixekizumab with etanercept or placebo in moderate-to-severe psoriasis (UNCOVER-2 and UNCOVER-3): results from two phase 3 randomised trials. Lancet. 2015;386:541-551.
- Papp KA, Reich K, Paul C, et al. A prospective phase III, randomized, double-blind, placebo-controlled study of brodalumab in patients with moderate-to-severe plaque psoriasis [published online June 23, 2016]. Br J Dermatol. 2016;175:273-286.
- Lebwohl M, Strober B, Menter A, et al. Phase 3 studies comparing brodalumab with ustekinumab in psoriasis. N Engl J Med. 2015;373:1318-1328.
- Krueger JG, Ferris LK, Menter A, et al. Anti-IL-23A mAb BI 655066 for treatment of moderate-to-severe psoriasis: safety, efficacy, pharmacokinetics, and biomarker results of a single-rising-dose, randomized, double-blind, placebo-controlled trial [published online March 1, 2015]. J Allergy Clin Immunol. 2015;136:116-124.e7.
- Chiricozzi A, Romanelli M, Saraceno R, et al. No meaningful association between suicidal behavior and the use of IL-17A-neutralizing or IL-17RA-blocking agents [published online August 31, 2016]. Expert Opin Drug Saf. 2016;15:1653-1659.
- FDA advisory committee recommends approval of brodalumab for treatment of moderate-to-severe plaque psoriasis [news release]. Laval, Quebec: Valeant Pharmaceuticals International, Inc; July 19, 2016.
Practice Points
- The newest biologics for treatment of moderate to severe plaque psoriasis are IL-23 and IL-17 inhibitors with unprecedented efficacy of complete skin clearance compared to older biologics.
- Risankizumab, guselkumab, and tildrakizumab are new IL-23 inhibitors currently in phase 3 trials with promising early efficacy and safety results.
- Ixekizumab, which recently was approved, and brodalumab, which is pending US Food and Drug Administration review, are new IL-17 inhibitors that achieved total skin clearance in more than one-quarter of phase 3 participants after 12 weeks of treatment.

The New Opioid Epidemic: Prescriptions, Synthetics, and Street Drugs
Opioid misuse, which often is the result of a prescription written for a very painful condition, has created an epidemic of opioid abuse, addiction, and fatalities across the United States. To reduce the risks from prescribed opioids, regulators and public health authorities have implemented intensive risk mitigation programs, prescription-monitoring programs, and prescribing guidelines.
Clinicians have been encouraged to manage acute and chronic pain more comprehensively. Concurrently, pharmaceutical companies have introduced tamper-resistant formulations, also known as abuse-deterrent formulations, intended to limit manipulation of the contents for insufflation or injection. Although some of these formulations have made tampering difficult, overall they have not effectively reduced inappropriate use or abuse.
All of these interventions have resulted in a reduction in the availability of affordable, commercially available pharmaceutical opioids (Table 1). Simultaneously, other prescription opioid users have found that the analgesic or euphoric effects of their prescription opioids were no longer sufficient, due to opioid tolerance and hyperalgesia. Both of these forces are driving opioid users to seek more potent opioid products and higher doses to achieve the desired psychoactive and pain-relieving effects.

For these reasons, many opioid users turned to less expensive, readily available, illicitly produced heroin and potent synthetic opioids—mainly fentanyl derivatives. The increased use of heroin and synthetic opioids has resulted in a sharp rise in overdoses and deaths, which continue to be a daily presentation in EDs throughout the country.
This review describes the emergence of the new synthetic opioids, and the steps emergency physicians (EPs) can take to identify and manage ED patients who have been exposed to these agents.
Case
A 34-year-old woman with a history of opioid-use disorder was found unresponsive by a family member who immediately called emergency medical services (EMS). Upon arrival, the emergency medical technicians noted the patient’s agonal respiration and pinpoint pupils. They immediately provided assisted ventilations via a bag-valve-mask (BVM) and administered 2 mg of intranasal naloxone prior to transport. The patient remained unresponsive, with no improvement in her respiratory status.
Upon arrival at the ED, the patient was still comatose, and her pupils remained pinpoint. Vital signs at presentation were: heart rate, 48 beats/min; blood pressure, 70/40 mm Hg; agonal respiration; and temperature, 98.2°F. Oxygen saturation was 86% while receiving assisted ventilation through BVM. An intravenous (IV) line was established.
What is the differential diagnosis of this toxidrome in the current era of emerging drugs of abuse?
The differential diagnosis of a patient with pinpoint pupils and respiratory depression who does not respond to naloxone typically includes overdose with gamma-hydroxybutyrate, clonidine, or the combined use of sedative-hypnotic agents with ethanol (organophosphate exposure and pontine strokes are two other causes). Naloxone administration may help diagnose opioids as a cause, and, in the past, a lack of response to naloxone was used to help exclude opioids as a cause. However, opioid poisoning should no longer be excluded from consideration in the differential diagnosis when patients are nonresponsive to naloxone. Patients who combine the use of opioids with another sedative hypnotic or who develop hypoxic encephalopathy following opioid overdose may not respond to naloxone with arousal. Most important, the emergence of ultra-potent synthetic opioid use raises the possibility that a patient may appear to be resistant to naloxone due to the extreme potency of these drugs, but may respond to extremely large doses of naloxone. These new opioids pose a grave public health threat and have already resulted in hundreds, if not thousands, of deaths.1
What are novel synthetic opioids?
Unlike heroin, which requires harvesting of plant-derived opium, the novel synthetic opioids are synthesized in laboratories, primarily in China, and shipped to the United States through commercial channels (eg, US Postal Service).2,3 Over the past few years, novel synthetic opioids have been supplementing or replacing heroin sold on the illicit market.1 Most of these novel synthetic opioids are fentanyl analogs (Table 2) that are purchased in bulk on the “Darknet”—an area hidden deep in the Internet (not discoverable by the common major search engines) that allows users to engage in questionable, even illegal, activities utilizing nontraceable currencies such as Bitcoin.4

At the local level, dealers may seek to attract heroin users by adulterating, or even replacing, heroin with fentanyl or novel synthetic opioids, marketing it as a “high-quality” heroin offering more rapid, intense effects. These fentanyl analogs are often hundreds of times more potent than fentanyl, and therefore thousands of times more potent than heroin. Only a miniscule amount increases the perceived potency of the “heroin,” allowing dealers to increase their profit margins.
Selling and using novel synthetic opioids leave little room for error, and small dosing miscalculations have resulted in profound overdoses and deaths. Obviously, the quality control, contents, and dose uniformity of illicitly traded products are poor, adding to the risks of use. In some cases, the novel synthetic opioids are pressed into tablets and marketed as diverted prescription opioids or benzodiazepines. In many, if not most, circumstances, intermediary dealers, as well as users, may be unaware of the product’s contents.5,6 Carfentanil, used as a large-animal tranquilizer, is reportedly 10,000 times more potent than morphine and has recently been implicated in a cluster of deaths of opioid users in the Midwest.7,8 Other synthetic opioids coming to market were initially developed for laboratory research, including W18, which was identified in Canada; and U47700, an opioid identified on autopsy of the musician Prince3,9 (Table 2).
Novel synthetic opioids can be identified only by specific, specialized assays not available in clinical settings. Because their molecular structures differ substantially from morphine, these compounds skirt identification by standard urine “opiate” drug screens. With the exception of fentanyl, pharmacokinetic data for the use of the majority of these agents in humans is unknown.
How are patients who present to EDs with an opioid toxidrome managed in practice today?
Classic teaching for the management of opioid-induced respiratory depression in adults is to provide ventilatory support (ie, BVM or intubation) or administer a low dose of naloxone (0.04 mg IV every 2-5 minutes, up to 2 mg) until adequate respirations are restored. This approach is reasonable for patients exposed to heroin or fentanyl, and provides safer reversal in the ED than administration of a large bolus dose of 0.4 or 2 mg naloxone in opioid-dependent patients.
However, patients exposed to novel synthetic opioids may ultimately require higher than usual doses of naloxone to achieve reversal—reportedly IV doses as high as 6 to 10 mg or more.10 It is not yet fully understood if the need for high-dose naloxone is due to the binding affinity of the opioid or the relatively high dose of opioid administered.
Because the clinical effects of the novel synthetic opioids are generally indistinguishable from those of other opioids, providing respiratory support in the ED remains a critical intervention while awaiting the effect of titrated doses of naloxone. Of concern, though, is that these opioids are so potent that they may cause immediate respiratory arrest, resulting in a more rapid progression to cardiac arrest, limiting the ability to administer rescue breathing or antidote.
In the “bystander” setting, administration of a larger initial dose of naloxone may be reasonable, given the lack of advanced medical supportive care. However, the ability to provide larger doses in these settings is hampered by the accessibility of the antidote. In addition, prehospital-care providers need to consider the possibility of precipitating opioid withdrawal in patients with opioid dependence, which itself can carry significant consequences (eg, aspiration, agitated delirium), as well as the subsequent uncooperativeness of the victim, who may attempt to leave the scene and self-administer an additional dose of opioid or develop recurrent respiratory depression when the naloxone wanes. Since many patients with life-threatening opioid intoxication will suffer long-term consequences if reversal is delayed, the risk of administering high-dose naloxone in the bystander setting generally is worthwhile. However, the risks and benefits of naloxone must still be thoughtfully considered by prehospital-care providers who can provide alternative supportive therapies.
In the ED, the EP must decide whether to intubate the patient directly or first give a brief trial of low-dose naloxone. If a trial of naloxone is unsuccessful at reversing the respiratory depression, dose escalation can be tried while supporting oxygenation and ventilation noninvasively. Administration of naloxone postintubation is not usually necessary or even desired, since respiratory depression, the primary mechanism of death, has been addressed.
Are any special precautions required for health care workers?
Some of the ultra-potent synthetic opioids are available as powders or sprays that can be inadvertently absorbed through the skin (after dissolution in skin moisture) or inhaled.8 The safety of health care providers and law enforcement personnel who may be exposed to synthetic opioids in this manner is currently unknown, though some law enforcement and public health agencies have published warnings in an effort to be proactively cautious.8
While it is highly unlikely that the handling of body fluids of opioid-intoxicated patients poses any health threats, universal safety precautions of wearing disposable gloves should be utilized. As noted, contact with the actual substances may be more concerning, particularly when airborne; in such situations, a particulate mask should also be utilized. Although fentanyl in liquid formulation can slowly enter the skin transdermally (eg, fentanyl patch), there are very limited data to either support or refute the ability of the newer potent opioids to do so. Until more data on these opioid analogs become available, those entering grossly contaminated areas, in which dermal or inhalational exposure is high, should employ a higher level of personal safety precautions.11 In addition, naloxone should be readily available.
How can we detect novel opioid use?
As noted, there is no ability to specifically detect the use of novel potent opioids in the clinical setting (eg, hospital laboratory); therefore, clinicians must maintain a high level of suspicion and provide care empirically. The ability to make a specific diagnosis is further clouded because a patient who has used a synthetic opioid may have also used certain prescription opioids or heroin, which can be detected by standard testing.
Blood and urine samples obtained early in care and sent to specialized laboratories may provide specific identification. Such testing is typically only done by reference laboratories, health departments, or law enforcement agencies. The information obtained from these analyses may help to understand the epidemiology of novel opioid abuse, prevent others from succumbing to addiction, and determine the cause of related deaths.
Which patients can be safely discharged from the ED after an opioid overdose?
Patients who survive reversal of an opioid overdose, whether from a conventional or novel opioid, are at extremely high risk of subsequent death from continued use, as well as from the initial exposure to a long-acting opioid that outlasts the reversal effects of naloxone. Such patients should undergo a sufficient observation period after the last dose of naloxone has been administered to allow its effects to dissipate. This is likely at least 2 hours, but may be longer in certain individuals. Attempts at establishing a link for the patient to long-term treatment or (where available) providing a naloxone rescue kit and training to patients and their families are worthwhile. Although some data support releasing responsive patients after a short, but safe interval after naloxone administration, the changing landscape of opioid use should prompt reconsideration of such practices.12
To whom should suspected opioid overdose patients be reported?
While most EPs are familiar with the management of patients with opioid-induced respiratory depression, atypical cases (eg, patients less responsive to naloxone, those who suffer cardiac arrest) or clusters of suspected cases should always be reported to a regional poison control center (PCC) or health department. The PCC is typically engaged in surveillance and works cooperatively with area EDs and public health officials to track and notify physicians of emerging trends. The epidemiological data derived from reports from a variety of hospitals allow health officials to effectively engage resources for public warnings, facilitate forensic identification of circulating products, and determine any unique clinical information that can then be broadly disseminated.
Case Conclusion
The patient was supported with BVM ventilations. Despite additional titrated IV naloxone (up to a total of 4 mg) the patient was nonresponsive and unarousable. She was intubated, and awoke several hours later. She fully recovered and subsequently was referred to both a harm-reduction and an opioid detoxification program. Analysis of her blood and urine, available several weeks later, confirmed an exposure to U47700.
1. Centers for Disease Control and Prevention. Health Alert Network. Increases in fentanyl drug confiscations and fentanyl-related overdose fatalities. https://emergency.cdc.gov/han/han00384.asp. Updated October 26, 2015. Accessed January 10, 2017.
2. MacQuarrie B. Synthetic opioids are getting into US by mail. Boston Globe. December 27, 2016. http://www.bostonglobe.com/metro/2016/12/26/synthetic-opioids-slipping-into-via-mail-security-experts-say/23TCEuIES8aEQYAWWHKCiI/story.html. Accessed January 10, 2017.
3. Lucyk SN, Nelson LS. Novel synthetic opioids: an opioid epidemic within an opioid epidemic. Ann Emerg Med. 2017;69(1):91-93. doi:10.1016/j.annemergmed.2016.08.445.
4. Mounteney J, Bo A, Oteo A; OteoEuropean Monitoring Centre for Drugs and Drug Addiction project group. The Internet and Drug Markets. Publications Office of the European Union, Luxembourg, Luxembourg; 2016:1-136. http://www.emcdda.europa.eu/system/files/publications/2155/TDXD16001ENN_FINAL. pdf. doi:10.2810/324608. Accessed January 17, 2017.
5. Associated Press. ‘Norco’ fentanyl overdose deaths rise to 14; problem spreads to Bay Area. Los Angeles Times. April 26, 2016. http://www.latimes.com/local/lanow/la-me-ln-norco-fentanyl-overdose-deaths-rise-to-14-problem-spreads-to-bay-area-20160426-story.html.
6. Centers for Disease Control and Prevention. Health Alert Network. Influx of fentanyl-laced counterfeit pills and toxic fentanyl-related compounds further increases risk of fentanyl-related overdose and fatalities. https://emergency.cdc.gov/han/han00395.asp. Accessed January 10, 2017.
7. Sandy E. Cleveland Scene. 236 heroin overdoses in Akron in 3 weeks; heroin being cut with elephant sedative. http://www.clevescene.com/scene-and-heard/archives/2016/07/14/akron-police-chief-heroin-being-cut-with-elephant-sedative-88-overdoses-since-july-5. Accessed January 10, 2017.
8. DEA issues carfentanil warning to police and public [news release]. Washington, DC: United States Drug Enforcement Administration; September 22, 2016. https://www.dea.gov/divisions/hq/2016/hq092216.shtml. Accessed January 10, 2017.
9. Armenian P, Olson A, Anaya A, Kurtz A, Ruegner R, Gerona RR. Fentanyl and a novel synthetic opioid U-47700 masquerading as street “Norco” in Central California: a case report. Ann Emerg Med. 2017;69(1):87-90. doi:10.1016/j.annemergmed.2016.06.014.
10. Schumann H, Erickson T, Thompson TM, Zautcke JL, Denton JS. Fentanyl epidemic in Chicago, Illinois and surrounding Cook County. Clin Toxicol (Phila). 2008;46(6):501-506. doi:10.1080/15563650701877374.
11. George AV, Lu JJ, Pisano MV, Metz J, Erickson TB. Carfentanil—an ultra potent opioid. Am J Emerg Med. 2010;28(4):530-532. doi:10.1016/j.ajem.2010.03.003.
12. Kolinsky D, Keim SM, Cohn BG, Schwarz ES, Yealy DM. Is a prehospital treat and release protocol for opioid overdose safe? J Emerg Med. 2017;52(1):52-58. doi:10.1016/j.jemermed.2016.09.015.
Opioid misuse, which often is the result of a prescription written for a very painful condition, has created an epidemic of opioid abuse, addiction, and fatalities across the United States. To reduce the risks from prescribed opioids, regulators and public health authorities have implemented intensive risk mitigation programs, prescription-monitoring programs, and prescribing guidelines.
Clinicians have been encouraged to manage acute and chronic pain more comprehensively. Concurrently, pharmaceutical companies have introduced tamper-resistant formulations, also known as abuse-deterrent formulations, intended to limit manipulation of the contents for insufflation or injection. Although some of these formulations have made tampering difficult, overall they have not effectively reduced inappropriate use or abuse.
All of these interventions have resulted in a reduction in the availability of affordable, commercially available pharmaceutical opioids (Table 1). Simultaneously, other prescription opioid users have found that the analgesic or euphoric effects of their prescription opioids were no longer sufficient, due to opioid tolerance and hyperalgesia. Both of these forces are driving opioid users to seek more potent opioid products and higher doses to achieve the desired psychoactive and pain-relieving effects.
For these reasons, many opioid users turned to less expensive, readily available, illicitly produced heroin and potent synthetic opioids—mainly fentanyl derivatives. The increased use of heroin and synthetic opioids has resulted in a sharp rise in overdoses and deaths, which continue to be a daily presentation in EDs throughout the country.
This review describes the emergence of the new synthetic opioids, and the steps emergency physicians (EPs) can take to identify and manage ED patients who have been exposed to these agents.
Case
A 34-year-old woman with a history of opioid-use disorder was found unresponsive by a family member who immediately called emergency medical services (EMS). Upon arrival, the emergency medical technicians noted the patient’s agonal respiration and pinpoint pupils. They immediately provided assisted ventilations via a bag-valve-mask (BVM) and administered 2 mg of intranasal naloxone prior to transport. The patient remained unresponsive, with no improvement in her respiratory status.
Upon arrival at the ED, the patient was still comatose, and her pupils remained pinpoint. Vital signs at presentation were: heart rate, 48 beats/min; blood pressure, 70/40 mm Hg; agonal respiration; and temperature, 98.2°F. Oxygen saturation was 86% while receiving assisted ventilation through BVM. An intravenous (IV) line was established.
What is the differential diagnosis of this toxidrome in the current era of emerging drugs of abuse?
The differential diagnosis of a patient with pinpoint pupils and respiratory depression who does not respond to naloxone typically includes overdose with gamma-hydroxybutyrate, clonidine, or the combined use of sedative-hypnotic agents with ethanol (organophosphate exposure and pontine strokes are two other causes). Naloxone administration may help diagnose opioids as a cause, and, in the past, a lack of response to naloxone was used to help exclude opioids as a cause. However, opioid poisoning should no longer be excluded from consideration in the differential diagnosis when patients are nonresponsive to naloxone. Patients who combine the use of opioids with another sedative hypnotic or who develop hypoxic encephalopathy following opioid overdose may not respond to naloxone with arousal. Most important, the emergence of ultra-potent synthetic opioid use raises the possibility that a patient may appear to be resistant to naloxone due to the extreme potency of these drugs, but may respond to extremely large doses of naloxone. These new opioids pose a grave public health threat and have already resulted in hundreds, if not thousands, of deaths.1
What are novel synthetic opioids?
Unlike heroin, which requires harvesting of plant-derived opium, the novel synthetic opioids are synthesized in laboratories, primarily in China, and shipped to the United States through commercial channels (eg, US Postal Service).2,3 Over the past few years, novel synthetic opioids have been supplementing or replacing heroin sold on the illicit market.1 Most of these novel synthetic opioids are fentanyl analogs (Table 2) that are purchased in bulk on the “Darknet”—an area hidden deep in the Internet (not discoverable by the common major search engines) that allows users to engage in questionable, even illegal, activities utilizing nontraceable currencies such as Bitcoin.4
At the local level, dealers may seek to attract heroin users by adulterating, or even replacing, heroin with fentanyl or novel synthetic opioids, marketing it as a “high-quality” heroin offering more rapid, intense effects. These fentanyl analogs are often hundreds of times more potent than fentanyl, and therefore thousands of times more potent than heroin. Only a miniscule amount increases the perceived potency of the “heroin,” allowing dealers to increase their profit margins.
Selling and using novel synthetic opioids leave little room for error, and small dosing miscalculations have resulted in profound overdoses and deaths. Obviously, the quality control, contents, and dose uniformity of illicitly traded products are poor, adding to the risks of use. In some cases, the novel synthetic opioids are pressed into tablets and marketed as diverted prescription opioids or benzodiazepines. In many, if not most, circumstances, intermediary dealers, as well as users, may be unaware of the product’s contents.5,6 Carfentanil, used as a large-animal tranquilizer, is reportedly 10,000 times more potent than morphine and has recently been implicated in a cluster of deaths of opioid users in the Midwest.7,8 Other synthetic opioids coming to market were initially developed for laboratory research, including W18, which was identified in Canada; and U47700, an opioid identified on autopsy of the musician Prince3,9 (Table 2).
Novel synthetic opioids can be identified only by specific, specialized assays not available in clinical settings. Because their molecular structures differ substantially from morphine, these compounds skirt identification by standard urine “opiate” drug screens. With the exception of fentanyl, pharmacokinetic data for the use of the majority of these agents in humans is unknown.
How are patients who present to EDs with an opioid toxidrome managed in practice today?
Classic teaching for the management of opioid-induced respiratory depression in adults is to provide ventilatory support (ie, BVM or intubation) or administer a low dose of naloxone (0.04 mg IV every 2-5 minutes, up to 2 mg) until adequate respirations are restored. This approach is reasonable for patients exposed to heroin or fentanyl, and provides safer reversal in the ED than administration of a large bolus dose of 0.4 or 2 mg naloxone in opioid-dependent patients.
However, patients exposed to novel synthetic opioids may ultimately require higher than usual doses of naloxone to achieve reversal—reportedly IV doses as high as 6 to 10 mg or more.10 It is not yet fully understood if the need for high-dose naloxone is due to the binding affinity of the opioid or the relatively high dose of opioid administered.
Because the clinical effects of the novel synthetic opioids are generally indistinguishable from those of other opioids, providing respiratory support in the ED remains a critical intervention while awaiting the effect of titrated doses of naloxone. Of concern, though, is that these opioids are so potent that they may cause immediate respiratory arrest, resulting in a more rapid progression to cardiac arrest, limiting the ability to administer rescue breathing or antidote.
In the “bystander” setting, administration of a larger initial dose of naloxone may be reasonable, given the lack of advanced medical supportive care. However, the ability to provide larger doses in these settings is hampered by the accessibility of the antidote. In addition, prehospital-care providers need to consider the possibility of precipitating opioid withdrawal in patients with opioid dependence, which itself can carry significant consequences (eg, aspiration, agitated delirium), as well as the subsequent uncooperativeness of the victim, who may attempt to leave the scene and self-administer an additional dose of opioid or develop recurrent respiratory depression when the naloxone wanes. Since many patients with life-threatening opioid intoxication will suffer long-term consequences if reversal is delayed, the risk of administering high-dose naloxone in the bystander setting generally is worthwhile. However, the risks and benefits of naloxone must still be thoughtfully considered by prehospital-care providers who can provide alternative supportive therapies.
In the ED, the EP must decide whether to intubate the patient directly or first give a brief trial of low-dose naloxone. If a trial of naloxone is unsuccessful at reversing the respiratory depression, dose escalation can be tried while supporting oxygenation and ventilation noninvasively. Administration of naloxone postintubation is not usually necessary or even desired, since respiratory depression, the primary mechanism of death, has been addressed.
Are any special precautions required for health care workers?
Some of the ultra-potent synthetic opioids are available as powders or sprays that can be inadvertently absorbed through the skin (after dissolution in skin moisture) or inhaled.8 The safety of health care providers and law enforcement personnel who may be exposed to synthetic opioids in this manner is currently unknown, though some law enforcement and public health agencies have published warnings in an effort to be proactively cautious.8
While it is highly unlikely that the handling of body fluids of opioid-intoxicated patients poses any health threats, universal safety precautions of wearing disposable gloves should be utilized. As noted, contact with the actual substances may be more concerning, particularly when airborne; in such situations, a particulate mask should also be utilized. Although fentanyl in liquid formulation can slowly enter the skin transdermally (eg, fentanyl patch), there are very limited data to either support or refute the ability of the newer potent opioids to do so. Until more data on these opioid analogs become available, those entering grossly contaminated areas, in which dermal or inhalational exposure is high, should employ a higher level of personal safety precautions.11 In addition, naloxone should be readily available.
How can we detect novel opioid use?
As noted, there is no ability to specifically detect the use of novel potent opioids in the clinical setting (eg, hospital laboratory); therefore, clinicians must maintain a high level of suspicion and provide care empirically. The ability to make a specific diagnosis is further clouded because a patient who has used a synthetic opioid may have also used certain prescription opioids or heroin, which can be detected by standard testing.
Blood and urine samples obtained early in care and sent to specialized laboratories may provide specific identification. Such testing is typically only done by reference laboratories, health departments, or law enforcement agencies. The information obtained from these analyses may help to understand the epidemiology of novel opioid abuse, prevent others from succumbing to addiction, and determine the cause of related deaths.
Which patients can be safely discharged from the ED after an opioid overdose?
Patients who survive reversal of an opioid overdose, whether from a conventional or novel opioid, are at extremely high risk of subsequent death from continued use, as well as from the initial exposure to a long-acting opioid that outlasts the reversal effects of naloxone. Such patients should undergo a sufficient observation period after the last dose of naloxone has been administered to allow its effects to dissipate. This is likely at least 2 hours, but may be longer in certain individuals. Attempts at establishing a link for the patient to long-term treatment or (where available) providing a naloxone rescue kit and training to patients and their families are worthwhile. Although some data support releasing responsive patients after a short, but safe interval after naloxone administration, the changing landscape of opioid use should prompt reconsideration of such practices.12
To whom should suspected opioid overdose patients be reported?
While most EPs are familiar with the management of patients with opioid-induced respiratory depression, atypical cases (eg, patients less responsive to naloxone, those who suffer cardiac arrest) or clusters of suspected cases should always be reported to a regional poison control center (PCC) or health department. The PCC is typically engaged in surveillance and works cooperatively with area EDs and public health officials to track and notify physicians of emerging trends. The epidemiological data derived from reports from a variety of hospitals allow health officials to effectively engage resources for public warnings, facilitate forensic identification of circulating products, and determine any unique clinical information that can then be broadly disseminated.
Case Conclusion
The patient was supported with BVM ventilations. Despite additional titrated IV naloxone (up to a total of 4 mg) the patient was nonresponsive and unarousable. She was intubated, and awoke several hours later. She fully recovered and subsequently was referred to both a harm-reduction and an opioid detoxification program. Analysis of her blood and urine, available several weeks later, confirmed an exposure to U47700.
1. Centers for Disease Control and Prevention. Health Alert Network. Increases in fentanyl drug confiscations and fentanyl-related overdose fatalities. https://emergency.cdc.gov/han/han00384.asp. Updated October 26, 2015. Accessed January 10, 2017.
2. MacQuarrie B. Synthetic opioids are getting into US by mail. Boston Globe. December 27, 2016. http://www.bostonglobe.com/metro/2016/12/26/synthetic-opioids-slipping-into-via-mail-security-experts-say/23TCEuIES8aEQYAWWHKCiI/story.html. Accessed January 10, 2017.
3. Lucyk SN, Nelson LS. Novel synthetic opioids: an opioid epidemic within an opioid epidemic. Ann Emerg Med. 2017;69(1):91-93. doi:10.1016/j.annemergmed.2016.08.445.
4. Mounteney J, Bo A, Oteo A; OteoEuropean Monitoring Centre for Drugs and Drug Addiction project group. The Internet and Drug Markets. Publications Office of the European Union, Luxembourg, Luxembourg; 2016:1-136. http://www.emcdda.europa.eu/system/files/publications/2155/TDXD16001ENN_FINAL. pdf. doi:10.2810/324608. Accessed January 17, 2017.
5. Associated Press. ‘Norco’ fentanyl overdose deaths rise to 14; problem spreads to Bay Area. Los Angeles Times. April 26, 2016. http://www.latimes.com/local/lanow/la-me-ln-norco-fentanyl-overdose-deaths-rise-to-14-problem-spreads-to-bay-area-20160426-story.html.
6. Centers for Disease Control and Prevention. Health Alert Network. Influx of fentanyl-laced counterfeit pills and toxic fentanyl-related compounds further increases risk of fentanyl-related overdose and fatalities. https://emergency.cdc.gov/han/han00395.asp. Accessed January 10, 2017.
7. Sandy E. Cleveland Scene. 236 heroin overdoses in Akron in 3 weeks; heroin being cut with elephant sedative. http://www.clevescene.com/scene-and-heard/archives/2016/07/14/akron-police-chief-heroin-being-cut-with-elephant-sedative-88-overdoses-since-july-5. Accessed January 10, 2017.
8. DEA issues carfentanil warning to police and public [news release]. Washington, DC: United States Drug Enforcement Administration; September 22, 2016. https://www.dea.gov/divisions/hq/2016/hq092216.shtml. Accessed January 10, 2017.
9. Armenian P, Olson A, Anaya A, Kurtz A, Ruegner R, Gerona RR. Fentanyl and a novel synthetic opioid U-47700 masquerading as street “Norco” in Central California: a case report. Ann Emerg Med. 2017;69(1):87-90. doi:10.1016/j.annemergmed.2016.06.014.
10. Schumann H, Erickson T, Thompson TM, Zautcke JL, Denton JS. Fentanyl epidemic in Chicago, Illinois and surrounding Cook County. Clin Toxicol (Phila). 2008;46(6):501-506. doi:10.1080/15563650701877374.
11. George AV, Lu JJ, Pisano MV, Metz J, Erickson TB. Carfentanil—an ultra potent opioid. Am J Emerg Med. 2010;28(4):530-532. doi:10.1016/j.ajem.2010.03.003.
12. Kolinsky D, Keim SM, Cohn BG, Schwarz ES, Yealy DM. Is a prehospital treat and release protocol for opioid overdose safe? J Emerg Med. 2017;52(1):52-58. doi:10.1016/j.jemermed.2016.09.015.

First EDition: A-Fib Management Pathway in the ED, more
Atrial Fibrillation Management Pathway in the ED May Lower Hospital Admissions
TED BOSWORTH
FRONTLINE MEDICAL NEWS
An atrial fibrillation (AF) treatment pathway designed specifically to reduce the proportion of patients with this complaint who are admitted to the hospital from the ED was remarkably effective, according to a pilot study presented at the annual International AF Symposium.
“In this single-center observational study, a multidisciplinary AF pathway was associated with 5-fold reduction in admission rate and 2.5-fold reduction in length-of-stay [LOS] for those who were admitted,” reported Jeremy N. Ruskin, MD.
Relative to many other countries, admission rates for AF in the United States are “extremely high,” according to Dr Ruskin, director of the cardiac arrhythmia service at Massachusetts General Hospital, Boston. Citing 2013 figures from the Nationwide Emergency Department Sample (NEDS) database, rates ranged between 60% and 80% by geographic region, with an average of about 66%. In contrast, and as an example of lower rates elsewhere, fewer than 40% of AF patients with similar characteristics presenting at EDs in Ontario, Canada were admitted. Similarly low admission rates have been reported in Europe.
The AF pathway tested in the study at Massachusetts General was developed through collaboration between electrophysiologists and emergency physicians (EPs). It is suitable for patients presenting with a primary complaint of AF without concomitant diseases, such as sepsis or myocardial infarction. Patients were entered into this study after it was shown that AF was the chief complaint. The first step was to determine whether participants were best suited to a rhythm-control or rate-control strategy.
“The rhythm-control group was anticoagulated and then underwent expedited cardioversion with TEE [transesophageal echocardiogram] if necessary. The rate-control group was anticoagulated and then given appropriate pharmacologic therapy,” Dr Ruskin explained. Once patients were on treatment, an electrophysiologist and an EP evaluated the patients’ response. For both groups, stable patients were discharged and unstable patients were admitted.
In this nonrandomized observational study conducted over a 1-year period, 94 patients were managed with the AF pathway. Admissions and outcomes in this group were compared with 265 patients who received usual care.
Only 16% of those managed through the AF pathway were admitted versus 80% (P < .001) in the usual care group. Among those admitted, LOS was shorter in patients managed along the AF pathway relative to usual care (32 vs 85 hours; P = .002). Dr Ruskin reported that both the cardioversion rate and the proportion of patients discharged on novel oral anticoagulation drugs were higher in the AF pathway group.
The reductions in hospital admissions would be expected to translate into large reductions in costs, particularly as follow-up showed no difference in return visits to the hospital between those entered into the AF pathway relative to those who received routine care, according to Dr Ruskin. Emphasizing the cost burden of AF admissions, he noted that the estimated charges for the more than 300,000 AF admissions in US hospitals in 2013 exceeded $7 billion.
Currently, there are no uniform guidelines for managing AF in the ED, and there is wide variation in practice among centers, according to Dr Ruskin. He provided data from the NEDS database demonstrating highly significant variations in rates of admission by geographic region (eg, rates were >10% higher in the northeast vs the west) and hospital type (eg, rates were twice as high in metropolitan than nonmetropolitan hospitals).
In the NEDS database, various patient characteristics were associated with increased odds ratios (ORs) for admission. These included hypertension (OR, 2.3), valvular disease (OR, 3.6), and congestive heart failure (OR, 3.7). However, Dr Ruskin indicated that patients with these or other characteristics associated with increased likelihood of admission, such as older age, have better outcomes with hospitalization.
The data from this initial observational study were recently published, and a larger prospective study of this AF pathway is already underway at both Massachusetts General and at Brigham and Women’s Hospital, Boston. If the data confirm that AF admissions can be safely reduced through this pathway, Dr Ruskin anticipates that implementation will be adopted at other hospitals in the Harvard system.
Ptaszek LM, White B, Lubitz SA, et al. Effect of a multidisciplinary approach for the management of patients with atrial fibrillation in the emergency department on hospital admission rate and length of stay. Am J Cardiol. 2016;118(1):64-71. doi:10.1016/j.amjcard.2016.04.014.
Understanding SSTI Admission, Treatment Crucial to Reducing Disease Burden
DEEPAK CHITNIS
FRONTLINE MEDICAL NEWS
Decreasing the burden of treating skin and soft tissue infections (SSTIs) is critical to improving care and reducing the costs that SSTIs place on health care facilities, according to a study published in Hospital Practice.
“Despite expert panel recommendations and treatment guidelines, there is no widely accepted classification system for grading SSTIs to outcomes,” wrote the study’s lead author, Kristin E. Linder, PharmD, of Hartford (Connecticut) Hospital. “This leads to a considerable variation in treatment approach on initial presentation when deciding which patients should be admitted to receive intravenous antibiotic therapy or treated as outpatients.”
Dr Linder and her coinvestigators conducted a single-center retrospective cohort study with the primary objective of determining rates of admission and re-presentation, along with average LOS and cost of care for both inpatients and outpatients with SSTIs. Patients aged 18 years and older who received a primary diagnosis of an SSTI during May and June 2015 at Hartford Hospital were screened; 446 were deemed eligible, with 357 ultimately selected for inclusion.
“Patients were categorized into two groups based on disposition of care, inpatient or outpatient, on index presentation,” the authors explained. “Economic data were collected using reports from hospital finance databases and included reports of total billed costs.”
Of the 357 patients included for analysis, 106 (29.7%) were admitted as inpatients while the remaining 251 (70.3%) were treated as outpatients. However, there were no significant differences found in re-presentation rates, either overall (22.6% for inpatients and 28.3% for outpatients; P > .05) or for SSTI-related re-presentation (10.4% for inpatients and 15.1% for outpatients; P > .05). For those patients who were admitted, the mean LOS was 7.3 days.
Patients who presented with a Charlson Comorbidity Index (CCI) score of 0 were admitted at a rate of 14.1%, compared to 30.1% of those with a CCI score of 1, and 60.9% of those with a CCI score of 2 or higher. The biggest disparity, however, was in terms of cost of care; while outpatient care cost an average of $413 per patient, inpatient care cost an average of $13,313 per patient.
Wound and abscess cultures that were tested found methicillin-susceptible Staphylococcus aureus to be the most prevalent gram-positive organism (37.1%) found in inpatients, while for outpatients, methicillin-resistant S aureus (MRSA) was the most common (66.7%). According to the investigators, gram-negative bacteria were not isolated in every case, so “prevalent use of combination therapy in this setting may not be warranted.
“Understanding how and where patients with SSTI are treated and their re-presentation rate is important to understand to direct resources for this high-frequency disease,” the authors concluded. “This study demonstrated that approximately 70% of patients presenting to the ED with SSTI were treated as outpatients [and] while 30-day re-presentation was similar for inpatient and outpatients, readmission was more likely in those previously admitted.”
Linder KE, Nicolau DP, Nailor MD. Epidemiology, treatment, and economics of patients presenting to the emergency department for skin and soft tissue infections. Hosp Pract (1995). 2017;16:1-7. doi:10.1080/21548331.2017.1279519.
Adolescents, Boys, Black Children Most Likely To Be Hospitalized for SJS and TEN
WHITNEY MCKNIGHT
FRONTLINE MEDICAL NEWS
Annual hospitalization rates in the United States for Stevens-Johnson syndrome (SJS) and toxic epidermal necrolysis (TEN) were shown to be higher in adolescents, boys, and black children, in a cross-sectional analysis of discharge records from more than 4,100 hospitals.
Using relevant ICD-9 codes, researchers at Harvard University identified 1,571 patients hospitalized for SJS, TEN, or both in 2009 and 2012, as listed in the Kids Inpatient Database from the Agency for Healthcare Research and Quality. The highest hospitalization rates per 100,000 in each year were for adolescents between ages 15 and 19 years (P = .01), boys (P = .03), and black children (P = .82). The overall risk of death from these conditions was 1.5% in 2009 and 0.3% in 2012. The data were published online in a brief report.
Although the difference in the number of hospitalizations for black children was not significant when compared with other ethnic and racial groups, at 1.03 hospitalizations per 100,000 children (95% confidence interval [CI], 0.80-1.31) in 2009 and 1.06 hospitalizations per 100,000 children (95% CI, 0.86-1.30) in 2012, the rate was greatest in this group. The next highest ratio was in white children at 0.82 hospitalizations per 100,000 (95% CI, 0.74-0.91) in 2009, and 0.95 hospitalizations per 100,000 (95% CI, 0.86-1.05) in 2012.
With the number of SJS- and TEN-related hospitalizations between 0.1 and 1.0 per 100,000, lead author Yusuke Okubo, MD, MPH, and colleagues wrote that their data aligned with previous studies; however, regarding the emphasis on demographic differences, theirs was, to the best of their knowledge, “the first study to reveal these disparities.” Compared with adults, they added, mortality was “remarkably lower” in children.
Okubo Y, Nochioka K, Testa MA. Nationwide survey of Stevens-Johnson syndrome and toxic epidermal necrolysis in children in the United States. Pediatr Dermatol. 2016 Dec 19. doi:10.1111/pde.13050. [Epub ahead of print]
Guidelines Released for Diagnosing TB in Adults, Children
MARY ANN MOON
FRONTLINE MEDICAL NEWS
A clinical practice guideline for diagnosing pulmonary, extrapulmonary, and latent tuberculosis (TB) in adults and children has been released jointly by the American Thoracic Society, the Centers for Disease Control and Prevention, and the Infectious Diseases Society of America.
The American Academy of Pediatrics also provided input to the guideline, which includes 23 evidence-based recommendations. The document is intended to assist clinicians in high-resource countries with a low incidence of TB disease and latent TB infection, such as the United States, said David M. Lewinsohn, MD, PhD, and his associates on the joint task force that wrote the guideline.
There were 9,412 cases of TB disease reported in the United States in 2014, the most recent year for which data are available. This translates to a rate of 3.0 cases per 100,000 persons. Two-thirds of the cases in the United States developed in foreign-born persons. “The rate of disease was 13.4 times higher in foreign-born persons than in US-born individuals [15.3 vs 1.1 per 100,000, respectively],” wrote Dr Lewinsohn of pulmonary and critical care medicine, Oregon Health & Science University, Portland, and colleagues.
Even though the case rate is relatively low in the United States and has declined in recent years, “an estimated 11 million persons are infected with Mycobacterium tuberculosis. Thus…there remains a large reservoir of individuals who are infected. Without the application of improved diagnosis and effective treatment for latent [disease], new cases of TB will develop from within this group,” they noted.
Among the guideline’s strongest recommendations are the following:
- Acid-fast bacilli smear microscopy should be performed in all patients suspected of having pulmonary TB, using at least three sputum samples. A sputum volume of at least 3 mL is needed, but 5 to 10 mL would be better.
- Both liquid and solid mycobacterial cultures should be performed on every specimen from patients suspected of having TB disease, rather than either type alone.
- A diagnostic nucleic acid amplification test should be performed on the initial specimen from patients suspected of having pulmonary TB.
- Rapid molecular drug-susceptibility testing of respiratory specimens is advised for certain patients, with a focus on testing for rifampin susceptibility with or without isoniazid.
- Patients suspected of having extrapulmonary TB also should have mycobacterial cultures performed on all specimens.
- For all mycobacterial cultures that are positive for TB, a culture isolate should be submitted for genotyping to a regional genotyping laboratory.
- For patients aged 5 and older who are suspected of having latent TB infection, an interferon-gamma release assay (IGRA) is advised rather than a tuberculin skin test, especially if the patient is not likely to return to have the test result read. A tuberculin skin test is an acceptable alternative if IGRA is not available, is too expensive, or is too burdensome.
The guideline also addresses bronchoscopic sampling, cell counts and chemistries from fluid specimens collected from sites suspected of harboring extrapulmonary TB (such as pleural, cerebrospinal, ascetic, or joint fluids), and measurement of adenosine deaminase levels.
Lewinsohn DM, Leonard MK, LoBue PA, et al. Official American Thoracic Society/Infectious Diseases Society of America/Centers for Disease Control and Prevention Clinical Practice Guidelines: Diagnosis of tuberculosis in adults and children. Clin Infect Dis. 2017;64(2):e1-e33. doi:10.1093/cid/ciw694.

2017 Update on fertility
Zika virus is a serious problem. Education and infection prevention are critical to effective management, and why we chose to include Zika virus as a topic for this year’s Update. We also discuss obesity’s effects on reproduction—a very relevant concern for all ObGyns and patients alike as about half of reproductive-age women are obese. Finally, subclinical hypothyroidism can present unique management challenges, such as determining when it is present and when treatment is indicated.
Read about counseling patients about Zika virus
Managing attempted pregnancy in the era of Zika virus
Oduyebo T, Igbinosa I, Petersen EE, et al. Update: interim guidance for health care providers caring for pregnant women with possible Zika virus exposure--United States, July 2016. MMWR Morb Mortal Wkly Rep. 2016;65(29):739-744.
Petersen EE, Meaney-Delman D, Neblett-Fanfair R, et al. Update: interim guidance for preconception counseling and prevention of sexual transmission of Zika virus for persons with possible Zika virus exposure--United States, September 2016. MMWR Morb Mortal Wkly Rep. 2016;65(39):1077-1081.
US Food and Drug Administration. Donor Screening Recommendations to Reduce the Risk of Transmission of Zika Virus by Human Cells, Tissues, and Cellular and Tissue-Based Products. http://www.fda.gov/downloads/BiologicsBloodVaccines/GuidanceComplianceRegulatoryInformation/Guidances/Tissue/UCM488582.pdf. Published March 2016. Accessed January 12, 2017.
National Institutes of Health. Zika: Overview. https://www.nichd.nih.gov/health/topics/zika/Pages/default.aspx. Accessed January 12, 2017.
World Health Organization. Prevention of sexual transmission of Zika virus interim guidance. WHO reference number: WHO/ZIKV/MOC/16. 1 Rev. 3, September 6, 2016.
Zika Virus Guidance Task Force of the American Society for Reproductive Medicine. Rev. 13, September 2016.
Zika virus presents unique challenges to physicians managing the care of patients attempting pregnancy, with or without fertility treatment. Neonatal Zika virus infection sequelae only recently have been appreciated; microcephaly was associated with Zika virus in October 2015, followed by other neurologic conditions including brain abnormalities, neural tube defects, and eye abnormalities. Results of recent studies involving the US Zika Pregnancy Registry show that 6% of women with Zika at any time in pregnancy had affected babies, but 11% of those who contracted the disease in the first trimester were affected.
Diagnosis is difficult because symptoms are generally mild, with 80% of affected patients asymptomatic. Possible Zika virus exposure is defined as travel to or residence in an area of active Zika virus transmission, or sex without a condom with a partner who traveled to or lived in an area of active transmission. Much is unknown about the interval from exposure to symptoms. Testing availability is limited and variable, and much is unknown about sensitivity and specificity of direct viral RNA testing, appearance and disappearance of detectable immunoglobulin (Ig) M and IgG antibodies that affect false positive and false negative test results, duration of infectious phase, risk of transmission, and numerous other factors.
Positive serum viral testing likely indicates virus in semen or other bodily fluids, but a negative serum viral test cannot definitively preclude virus in other bodily fluids. Zika virus likely can be passed from any combination of semen and vaginal and cervical fluids, but validating tests for these fluids are not yet available. It is not known if sperm preparation and assisted reproductive technology (ART) procedures that minimize risk of HIV transmission are effective against Zika virus or whether or not cryopreservation can destroy the virus.
Pregnancy timing
The Centers for Disease Control and Prevention now recommends that all men with possible Zika virus exposure who are considering attempting pregnancy with their partner wait to get pregnant until at least 6 months after symptom onset (if symptomatic) or last possible Zika virus exposure (if asymptomatic). Women with possible Zika virus exposure are recommended to wait to get pregnant until at least 8 weeks after symptom onset (if symptomatic) or last possible Zika virus exposure (if asymptomatic).
Women and men with possible exposure to Zika virus but without clinical symptoms of illness should consider testing for Zika viral RNA within 2 weeks of suspected exposure and wait at least 8 weeks after the last date of exposure before being re-tested. If direct viral testing (using rRT-PCR) results initially are negative, ideally, antibody testing would be obtained, if available, at 8 weeks. However, no testing paradigm will absolutely guarantee lack of Zika virus infectivity.
Virus management problems are dramatically compounded in areas endemic for Zika. Women and men who have had Zika virus disease should wait at least 6 months after illness onset to attempt reproduction. The temporal relationship between the presence of viral RNA and infectivity is not known definitively, and so the absolute duration of time to wait before attempting pregnancy is unknown. Male and female partners who become infected should avoid all forms of intimate sexual conduct or use condoms for the same 6 months. There is no evidence Zika will cause congenital infection in pregnancies initiated after resolution of maternal Zika viremia. However, any testing performed at a time other than the time of treatment might not reflect true viral status, particularly in areas of active Zika virus transmission.
Prevention
Women and men, especially those residing in areas of active Zika virus transmission, should talk with their physicians regarding pregnancy plans and avoid mosquito bites using the usual precautions: avoid mosquito areas, drain standing water, use mosquito repellent containing DEET, and use mosquito netting. Some people have gone so far as to relocate to nonendemic areas.
Those contemplating pregnancy should be advised to consider what they would do if they become exposed to or have suspected or confirmed Zika virus during pregnancy. Additional considerations are gamete or embryo cryopreservation and quarantine until a subsequent rRT-PCR test result is negative in both the male and female and at least 8 weeks have passed from gamete collection.
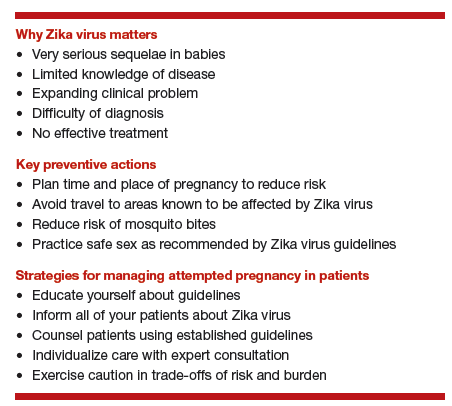
Patient counseling essentials
Counsel patients considering reproduction about:
- Zika virus as a new reproductive hazard
- the significance of the hazard to the fetus if infected
- the areas of active transmission, and that they are constantly changing
- avoidance of Zika areas if possible
- methods of transmission through mosquito bites or sex
- avoidance of mosquito bites
- symptoms of Zika infection
- safe sex practices
- testing limitations and knowledge deficiency about Zika.
Not uncommonly, clinical situations require complex individualized management decisions regarding trade-offs of risks, especially in older patients with decreased ovarian reserve. Consultation with infectious disease and reproductive specialists should be obtained when complicated and consequential decisions have to be made.
All practitioners should inform their patients, especially those undergoing fertility treatments, about Zika, and develop language in their informed consent that conveys the gap in knowledge to these patients.
Read how obesity specifically affects reproduction in an adverse way
Obesity adversely affects reproduction, but how specifically?
Practice Committee of the American Society for Reproductive Medicine. Obesity and Reproduction: A committee opinion. Fertil Steril. 2015;104(5):1116-1126.
The prevalence of obesity has increased substantially over the past 2 decades. Almost two-thirds of women and three-fourths of men in the United States are overweight or obese (defined as a body mass index [BMI] ≥25 kg/m2 and BMI ≥30 kg/m2, respectively; TABLE). Nearly 50% of reproductive-age women are obese.
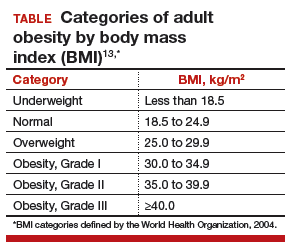
A disease of excess body fat and insulin resistance, obesity increases the risks of hypertension, diabetes, dyslipidemia, cardiovascular disease, sleep apnea, respiratory problems, and cancer as well as other serious health problems. While not all individuals with obesity will have infertility, obesity is associated with impaired reproduction in both women and men, adverse obstetric outcomes, and health problems in offspring. The American Society for Reproductive Medicine (ASRM) reviewed this important issue in a recent practice committee opinion.
Menstrual cycle and ovulatory dysfunction
Menstrual cycle abnormalities are more common in women with obesity. Elevated levels of insulin in obese women suppress sex hormone−binding globulin (SHBG) which in turn reduces gonadotropin secretion due to increased production of estrogen from conversion of androgens by adipose aromatase.1 Adipose tissue produces adipokines, which directly can suppress ovarian function.2
Ovulatory dysfunction is common among obese women; the relative risk of such dysfunction is 3.1 (95% confidence interval [CI], 2.2−4.4) among women with BMI levels >27 kg/m2 versus BMI levels 20.0 to 24.9 kg/m2.3,4 Obesity decreases fecundity even in women with normal menstrual cycles.5 This may in part be due to altered ovulatory dynamics with reduced early follicular luteinizing hormone pulse amplitude accompanied by prolonged folliculogenesis and reduced luteal progesterone levels.6
Compared with normal-weight women, obese women have a lower chance of conception within 1 year of stopping contraception; about 66% of obese women conceive within 1 year of stopping contraception, compared with about 81% of women with normal weight.7 Results of a Dutch study of 3,029 women with regular ovulation, at least one patent tube, and a partner with a normal semen analysis indicated a direct correlation between obesity and delayed conception, with a 4% lower spontaneous pregnancy rate per kg/m2 increase in women with a BMI >29 kg/m2 versus a BMI of 21 to 29 kg/m2 (hazard ratio, 0.96; 95% CI, 0.91−0.99).8
Assisted reproduction
Assisted reproduction in women with obesity is associated with lower success rates than in women with normal weight. A systematic review of 27 in vitro fertilization (IVF) studies (23 of which were retrospective) reveals 10% lower live-birth rate in overweight (BMI >25 kg/m2) versus normal-weight women (BMI <25 kg/m2) undergoing IVF (odds ratio [OR], 0.90; 95% CI, 0.82−1.0).9 Data from a meta-analysis of 33 IVF studies, including 47,967 cycles, show that, compared with women with a BMI <25 kg/m2, overweight or obese women have significantly reduced rates of clinical pregnancy (relative risk [RR], 0.90; P<.0001) and live birth (RR, 0.84; P = .0002).10
Results of a retrospective study of 4,609 women undergoing first IVF or IVF/intracytoplasmic sperm injection cycles revealed impaired embryo implantation (controlling for embryo quality and transfer day), reducing the age-adjusted odds of live birth in a BMI-dependent manner by 37% (BMI, 30.0−34.9 kg/m2), 61% (BMI, 35.0−39.9 kg/m2), and 68% (BMI, >40 kg/m2) compared with women with a BMI of 18.5 to 24.9 kg/m2.11 In a study of 12,566 Danish couples undergoing assisted reproduction, overweight and obese ovulatory women had a 12% (95% CI, 0.79−0.99) and 25% (95% CI, 0.63−0.90) reduction in IVF-related live birth rate, respectively (referent BMI, 18.5−24.9 kg/m2), with a 2% (95% CI, 0.97−0.99) decrease in live-birth rate for every one-unit increase in BMI.12 Putative mechanisms for these findings include altered oocyte morphology and reduced fertilization in eggs from obese women,13 and impaired embryo quality in women less than age 35.14 Oocytes from women with a BMI >25 kg/m2 are smaller and less likely to complete development postfertilization, with embryos arrested prior to blastulation containing more triglyceride than those forming blastocysts.15
Blastocysts developed from oocytes of high-BMI women are smaller, contain fewer cells and have a higher content of triglycerides, lower glucose consumption, and altered amino acid metabolism compared with embryos of normal-weight women (BMI <24.9 kg/m2).15 Obesity may alter endometrial receptivity during IVF given the finding that third-party surrogate women with a BMI >35 kg/m2 have a lower live-birth rate (25%) compared with women with a BMI <35 kg/m2 (49%; P<.05).16
Pregnancy outcomes
Obesity is linked to an increased risk of miscarriage. Results of a meta-analysis of 33 IVF studies including 47,967 cycles indicated that overweight or obese women have a higher rate of miscarriage (RR, 1.31; P<.0001) than normal-weight women (BMI <25 kg/m2).17 Maternal and perinatal morbid obesity are strongly associated with obstetric and perinatal complications, including gestational diabetes, hypertension, preeclampsia, preterm delivery, shoulder dystocia, fetal distress, early neonatal death, and small- as well as large-for-gestational age infants.
Obese women who conceive by IVF are at increased risk for preeclampsia, gestational diabetes, preterm delivery, and cesarean delivery.13 Authors of a meta-analysis of 18 observational studies concluded that obese mothers were at increased odds of pregnancies affected by such birth defects as neural tube defects, cardiovascular anomalies, and cleft lip and palate, among others.18
In addition to being the cause of these fetal abnormalities, maternal metabolic dysfunction is linked to promoting obesity in offspring, thereby perpetuating a cycle of obesity and adverse health outcomes that include an increased risk of premature death in adult offspring in subsequent generations.13
Treatment for obesity
Lifestyle modification is the first-line treatment for obesity.
Pre-fertility therapy and pregnancy goals. Targets for pregnancy should include:
- preconception weight loss to a BMI of 35 kg/m2
- prevention of excess weight gain in pregnancy
- long-term reduction in weight.
For all obese individuals, lifestyle modifications should include a weight loss of 7% of body weight and increased physical activity to at least 150 minutes of moderate activity, such as walking, per week. Calorie restriction should be emphasized. A 500 to 1,000 kcal/day decrease from usual dietary intake is expected to result in a 1- to 2-lb weight loss per week. A low-calorie diet of 1,000 to 1,200 kcal/day can lead to an average 10% decrease in total body weight over 6 months.
Adjunct supervised medical therapy or bariatric surgery can play an important role in successful weight loss prepregnancy but are not appropriate for women actively attempting conception. Importantly, pregnancy should be deferred for a minimum of 1 year after bariatric surgery. The decision to postpone pregnancy to achieve weight loss must be balanced against the risk of declining fertility with advancing age of the woman.
Read about when to treat subclinical hypothyroidism
Optimal management of subclinical hypothyroidism in women with infertility
Practice Committee of the American Society for Reproductive Medicine. Subclinical hypothyroidism in the infertile female population: a guideline. Fertil Steril. 2015;104(3):545-553.
Thyroid disorders long have been associated with the potential for adverse reproductive outcomes. While overt hypothyroidism has been linked to infertility, increased miscarriage risk, and poor maternal and fetal outcomes, controversy has existed regarding the association between subclinical hypothyroidism (SCH) and reproductive problems. The ASRM recently published a guideline on the role of SCH in the infertile female population.
How is subclinical hypothyroidism defined?
SCH is classically defined as a thyrotropin (TSH) level above the upper limit of normal range (4.5−5.0 mIU/L) with normal free thyroxine (FT4) levels. The National Health and Nutrition Examination Survey (NHANES III) population has been used to establish normative data for TSH for a disease-free population. These include a median serum level for TSH of 1.5 mIU/L, with the corresponding 2.5 and 97.5 percentiles of 0.41 and 6.10, respectively.19 Data from the National Academy of Clinical Biochemistry, however, reveal that 95% of individuals without evidence of thyroid disease have a TSH level <2.5 mIU/L, and that the normal reference range is skewed to the right.20 Adjusting the upper limit of the normal range to 2.5 mIU/L would result in an additional 11.8% to 14.2% of the United States population (22 to 28 million individuals) being diagnosed with hypothyroidism.
This information raises several important questions.
1. Should nonpregnant women be treated for SCH?
No. There is no benefit from the standpoint of lipid profile or alteration of cardiovascular risk in the treatment of TSH levels between 5 and 10 mIU/L and, therefore, treatment of individuals with TSH <5 mIU/L is questionable. Furthermore, the risk of overtreatment resulting in bone loss is a concern. The Endocrine Society does not recommend changing the current normal TSH range for nonpregnant women.
2. What are normal TSH levels in pregnant women?
Because human chorionic gonadotropin (hCG) can bind to and affect the TSH receptor, thereby influencing TSH values, the normal range for TSH is modified in pregnancy. The Endocrine Society recommends the following pregnancy trimester guidelines for TSH levels: 2.5 mIU/L is the recommended upper limit of normal in the first trimester, 3.0 mIU/L in the second trimester, and 3.5 mIU/L in the third trimester.
3. Is untreated SCH associated with miscarriage?
There is fair evidence that SCH, defined as a TSH level >4 mIU/L during pregnancy, is associated with miscarriage, but there is insufficient evidence that TSH levels between 2.5 and 4 mIU/L are associated with miscarriage.
4. Is untreated SCH associated with infertility?
Limited data are available to assess the effect of SCH on infertility. While a few studies show an association between SCH on unexplained infertility and ovulatory disorders, SCH does not appear to be increased in other causes of infertility.
5. Is SCH associated with adverse obstetric outcomes?
Available data reveal that SCH with TSH levels outside the normal pregnancy range are associated with an increased risk of such obstetric complications as placental abruption, preterm birth, fetal death, and preterm premature rupture of membranes (PPROM). However, it is unclear if prepregnancy TSH levels between 2.5 and 4 mIU/L are associated with adverse obstetric outcomes.
6. Does untreated SCH affect developmental outcomes in children?
The fetus is solely dependent on maternal thyroid hormone in early pregnancy because the fetal thyroid does not produce thyroid hormone before 10 to 13 weeks of gestation. Significant evidence has associated untreated maternal hypothyroidism with delayed fetal neurologic development, impaired school performance, and lower intelligence quotient (IQ) among offspring.21 There is fair evidence that SCH diagnosed in pregnancy is associated with adverse neurologic development. There is no evidence that SCH prior to pregnancy is associated with adverse neurodevelopmental outcomes. It should be noted that only one study has examined whether treatment of SCH improves developmental outcomes (measured by IQ scored at age 3 years) and no significant differences were observed in women with SCH who were treated with levothyroxine versus those who were not.22
7. Does treatment of SCH improve miscarriage rates, live-birth rates, and/or clinical pregnancy rates?
Small randomized controlled studies of women undergoing infertility treatment and a few observational studies in the general population yield good evidence that levothyroxine treatment in women with SCH defined as TSH >4.0 mIU/L is associated with improvement in pregnancy, live birth, and miscarriage rates. There are no randomized trials assessing whether levothyroxine treatment in women with TSH levels between 2.5 and 4 mIU/L would yield similar benefits to those observed in women with TSH levels above 4 mIU/L.
8. Are thyroid antibodies associated with infertility or adverse reproductive outcomes?
There is good evidence that the thyroid autoimmunity, or the presence of TPO-Ab, is associated with miscarriage and fair evidence that it is associated with infertility. Treatment with levothyroxine may improve pregnancy outcomes especially if the TSH level is above 2.5 mIU/L.
9. Should there be universal screening for hypothyroidism in the first trimester of pregnancy?
Current evidence does not reveal a benefit of universal screening at this time. The American College of Obstetricians and Gynecologists does not recommend routine screening for hypothyroidism in pregnancy unless women have risk factors for thyroid disease, including a personal or family history of thyroid disease, physical findings or symptoms of goiter or hypothyroidism, type 1 diabetes mellitus, infertility, history of miscarriage or preterm delivery, and/or personal or family history of autoimmune disease.
The bottom line
SCH, defined as a TSH level greater than the upper limit of normal range (4.5−5.0 mIU/L)with normal FT4 levels, is associated with adverse reproductive outcomes including miscarriage, pregnancy complications, and delayed fetal neurodevelopment. Thyroid supplementation is beneficial; however, treatment has not been shown to improve long-term neurologic developmental outcomes in offspring. Data are limited on whether TSH values between 2.5 mIU/L and the upper range of normal are associated with adverse pregnancy outcomes and therefore treatment in this group remains controversial. Although available evidence is weak, there may be a benefit in some subgroups, and because risk is minimal, it may be reasonable to treat or to monitor levels and treat above nonpregnant and pregnancy ranges. There is fair evidence that thyroid autoimmunity (positive thyroid antibody) is associated with miscarriage and infertility. Levothyroxine therapy may improve pregnancy outcomes especially if the TSH level is above 2.5 mIU/L. While universal screening of thyroid function in pregnancy is not recommended, women at high risk for thyroid disease should be screened.23
Share your thoughts! Send your Letter to the Editor to [email protected]. Please include your name and the city and state in which you practice.
- Pasquali R, Pelusi C, Genghini S, Cacciari M, Gambineri A. Obesity and reproductive disorders in women. Hum Reprod Update. 2003;9(4):359-372.
- Greisen S, Ledet T, Møller N, et al. Effects of leptin on basal and FSH stimulated steroidogenesis in human granulosa luteal cells. Acta Obstet Gynecol Scand. 2000;79(11):931-935.
- Rich-Edwards JW, Goldman MB, Willett WC, et al. Adolescent body mass index and infertility caused by ovulatory disorder. Am J Obstet Gynecol. 1994;171(1):171-177.
- Grodstein F, Goldman MB, Cramer DW. Body mass index and ovulatory infertility. Epidemiology. 1994;5(2):247-250.
- Gesink Law DC, Maclehose RF, Longnecker MP. Obesity and time to pregnancy. Hum Reprod. 2007;22(2):414-420.
- Jain A, Polotsky AJ, Rochester D, et al. Pulsatile luteinizing hormone amplitude and progesterone metabolite excretion are reduced in obese women. J Clin Endocrinol Metab. 2007;92(7):2468-2473.
- Lake JK, Power C, Cole TJ. Women's reproductive health: the role of body mass index in early and adult life. Int J Obes Relat Metab Disord. 1997;21(6):432-438.
- van der Steeg JW, Steures P, Eijkemans MJ, et al. Obesity affects spontaneous pregnancy chances in subfertile, ovulatory women. Hum Reprod. 2008;23(2):324-328.
- Koning AM, Mutsaerts MA, Kuchenbecker WK, et al. Complications and outcome of assisted reproduction technologies in overweight and obese women [Published correction appears in Hum Reprod. 2012;27(8):2570.] Hum Reprod. 2012;27(2):457-467.
- Rittenberg V, Seshadri S, Sunkara SK, Sobaleva S, Oteng-Ntim E, El-Toukhy T. Effect of body mass index on IVF treatment outcome: an updated systematic review and meta-analysis. Reprod Biomed Online. 2011;23(4):421-439.
- Moragianni VA, Jones SM, Ryley DA. The effect of body mass index on the outcomes of first assisted reproductive technology cycles. Fertil Steril. 2012;98(1):102-108.
- Petersen GL, Schmidt L, Pinborg A, Kamper-Jørgensen M. The influence of female and male body mass index on live births after assisted reproductive technology treatment: a nationwide register-based cohort study. Fertil Steril. 2013;99(6):1654-1662.
- Practice Committee of the American Society for Reproductive Medicine. Obesity and Reproduction: A committee opinion. Fertil Steril. 2015;104(5):1116-1126.
- Metwally M, Cutting R, Tipton A, Skull J, Ledger WL, Li TC. Effect of increased body mass index on oocyte and embryo quality in IVF patients. Reprod Biomed Online. 2007;15(5):532-538.
- Leary C, Leese HJ, Sturmey RG. Human embryos from overweight and obese women display phenotypic and metabolic abnormalities. Hum Reprod. 2015;30(1):122-132.
- Deugarte D, Deugarte C, Sahakian V. Surrogate obesity negatively impacts pregnancy rates in third-party reproduction. Fertil Steril. 2010;93(3):1008-1010.
- Rittenberg V, Seshadri S, Sunkara SK, Sobaleva S, Oteng-Ntim E, El-Toukhy T. Effect of body mass index on IVF treatment outcome: an updated systematic review and meta-analysis. Reprod Biomed Online. 2011;23(4):421-439.
- Stothard KJ, Tennant PWG, Bell R, Rankin J. Maternal overweight and obesity and the risk of congenital anomalies: a systematic review and meta-analysis. JAMA. 2009;301(6):636-650.
- Hollowell JG, Staehling NW, Flanders WD, et al. Serum TSH, T(4), and thyroid antibodies in the United States population (1988 to 1994): National Health and Nutrition Examination Survey (NHANES III). J Clin Endocrinol Metab. 2002;87(2):489-499.
- Baloch Z, Carayon P, Conte-Devolx B, et al. Laboratory medicine practice guidelines. Laboratory support for the diagnosis and monitoring of thyroid disease. Thyroid. 2003;13(1):3-126.
- Pop VJ, Kuijpens JL, van Baar AL, et al. Low maternal free thyroxine concentrations during early pregnancy are associated with impaired psychomotor development in infancy. Clin Endocrinol (Oxf). 1999;50(2):149-155.
- Lazarus JH, Bestwick JP, Channon S, et al. Antenatal thyroid screening and childhood cognitive function. N Engl J Med. 2012;366(17):493-501.
- Practice Committee of the American Society for Reproductive Medicine. Subclinical hypothyroidism in the infertile female population: a guideline. Fertil Steril. 2015;104(3):545-553.

Dr. Adamson is Founder/Executive Chairman of Advanced Reproductive Care, Inc; Adjunct Clinical Professor at Stanford University; and Associate Clinical Professor at the University of California, San Francisco. He is also Medical Director, Assisted Reproductive Technologies Program, Palo Alto Medical Foundation Fertility Physicians of Northern California in Palo Alto and San Jose.

Dr. Abusief is a Board-Certified Specialist in Reproductive Endocrinology and Infertility and Chair, Department of Reproductive Endocrine Fertility at Palo Alto Medical Foundation Fertility Physicians of Northern California.
Dr. Adamson reports being a consultant to Abbvie, Bayer, and Ferring and that he has equity in ARC Fertility. Dr. Abusief reports no financial relationships relevant to this article.
Dr. Adamson is Founder/Executive Chairman of Advanced Reproductive Care, Inc; Adjunct Clinical Professor at Stanford University; and Associate Clinical Professor at the University of California, San Francisco. He is also Medical Director, Assisted Reproductive Technologies Program, Palo Alto Medical Foundation Fertility Physicians of Northern California in Palo Alto and San Jose.
Dr. Abusief is a Board-Certified Specialist in Reproductive Endocrinology and Infertility and Chair, Department of Reproductive Endocrine Fertility at Palo Alto Medical Foundation Fertility Physicians of Northern California.
Dr. Adamson reports being a consultant to Abbvie, Bayer, and Ferring and that he has equity in ARC Fertility. Dr. Abusief reports no financial relationships relevant to this article.
Zika virus is a serious problem. Education and infection prevention are critical to effective management, and why we chose to include Zika virus as a topic for this year’s Update. We also discuss obesity’s effects on reproduction—a very relevant concern for all ObGyns and patients alike as about half of reproductive-age women are obese. Finally, subclinical hypothyroidism can present unique management challenges, such as determining when it is present and when treatment is indicated.
Read about counseling patients about Zika virus
Managing attempted pregnancy in the era of Zika virus
Oduyebo T, Igbinosa I, Petersen EE, et al. Update: interim guidance for health care providers caring for pregnant women with possible Zika virus exposure--United States, July 2016. MMWR Morb Mortal Wkly Rep. 2016;65(29):739-744.
Petersen EE, Meaney-Delman D, Neblett-Fanfair R, et al. Update: interim guidance for preconception counseling and prevention of sexual transmission of Zika virus for persons with possible Zika virus exposure--United States, September 2016. MMWR Morb Mortal Wkly Rep. 2016;65(39):1077-1081.
US Food and Drug Administration. Donor Screening Recommendations to Reduce the Risk of Transmission of Zika Virus by Human Cells, Tissues, and Cellular and Tissue-Based Products. http://www.fda.gov/downloads/BiologicsBloodVaccines/GuidanceComplianceRegulatoryInformation/Guidances/Tissue/UCM488582.pdf. Published March 2016. Accessed January 12, 2017.
National Institutes of Health. Zika: Overview. https://www.nichd.nih.gov/health/topics/zika/Pages/default.aspx. Accessed January 12, 2017.
World Health Organization. Prevention of sexual transmission of Zika virus interim guidance. WHO reference number: WHO/ZIKV/MOC/16. 1 Rev. 3, September 6, 2016.
Zika Virus Guidance Task Force of the American Society for Reproductive Medicine. Rev. 13, September 2016.
Zika virus presents unique challenges to physicians managing the care of patients attempting pregnancy, with or without fertility treatment. Neonatal Zika virus infection sequelae only recently have been appreciated; microcephaly was associated with Zika virus in October 2015, followed by other neurologic conditions including brain abnormalities, neural tube defects, and eye abnormalities. Results of recent studies involving the US Zika Pregnancy Registry show that 6% of women with Zika at any time in pregnancy had affected babies, but 11% of those who contracted the disease in the first trimester were affected.
Diagnosis is difficult because symptoms are generally mild, with 80% of affected patients asymptomatic. Possible Zika virus exposure is defined as travel to or residence in an area of active Zika virus transmission, or sex without a condom with a partner who traveled to or lived in an area of active transmission. Much is unknown about the interval from exposure to symptoms. Testing availability is limited and variable, and much is unknown about sensitivity and specificity of direct viral RNA testing, appearance and disappearance of detectable immunoglobulin (Ig) M and IgG antibodies that affect false positive and false negative test results, duration of infectious phase, risk of transmission, and numerous other factors.
Positive serum viral testing likely indicates virus in semen or other bodily fluids, but a negative serum viral test cannot definitively preclude virus in other bodily fluids. Zika virus likely can be passed from any combination of semen and vaginal and cervical fluids, but validating tests for these fluids are not yet available. It is not known if sperm preparation and assisted reproductive technology (ART) procedures that minimize risk of HIV transmission are effective against Zika virus or whether or not cryopreservation can destroy the virus.
Pregnancy timing
The Centers for Disease Control and Prevention now recommends that all men with possible Zika virus exposure who are considering attempting pregnancy with their partner wait to get pregnant until at least 6 months after symptom onset (if symptomatic) or last possible Zika virus exposure (if asymptomatic). Women with possible Zika virus exposure are recommended to wait to get pregnant until at least 8 weeks after symptom onset (if symptomatic) or last possible Zika virus exposure (if asymptomatic).
Women and men with possible exposure to Zika virus but without clinical symptoms of illness should consider testing for Zika viral RNA within 2 weeks of suspected exposure and wait at least 8 weeks after the last date of exposure before being re-tested. If direct viral testing (using rRT-PCR) results initially are negative, ideally, antibody testing would be obtained, if available, at 8 weeks. However, no testing paradigm will absolutely guarantee lack of Zika virus infectivity.
Virus management problems are dramatically compounded in areas endemic for Zika. Women and men who have had Zika virus disease should wait at least 6 months after illness onset to attempt reproduction. The temporal relationship between the presence of viral RNA and infectivity is not known definitively, and so the absolute duration of time to wait before attempting pregnancy is unknown. Male and female partners who become infected should avoid all forms of intimate sexual conduct or use condoms for the same 6 months. There is no evidence Zika will cause congenital infection in pregnancies initiated after resolution of maternal Zika viremia. However, any testing performed at a time other than the time of treatment might not reflect true viral status, particularly in areas of active Zika virus transmission.
Prevention
Women and men, especially those residing in areas of active Zika virus transmission, should talk with their physicians regarding pregnancy plans and avoid mosquito bites using the usual precautions: avoid mosquito areas, drain standing water, use mosquito repellent containing DEET, and use mosquito netting. Some people have gone so far as to relocate to nonendemic areas.
Those contemplating pregnancy should be advised to consider what they would do if they become exposed to or have suspected or confirmed Zika virus during pregnancy. Additional considerations are gamete or embryo cryopreservation and quarantine until a subsequent rRT-PCR test result is negative in both the male and female and at least 8 weeks have passed from gamete collection.
Patient counseling essentials
Counsel patients considering reproduction about:
- Zika virus as a new reproductive hazard
- the significance of the hazard to the fetus if infected
- the areas of active transmission, and that they are constantly changing
- avoidance of Zika areas if possible
- methods of transmission through mosquito bites or sex
- avoidance of mosquito bites
- symptoms of Zika infection
- safe sex practices
- testing limitations and knowledge deficiency about Zika.
Not uncommonly, clinical situations require complex individualized management decisions regarding trade-offs of risks, especially in older patients with decreased ovarian reserve. Consultation with infectious disease and reproductive specialists should be obtained when complicated and consequential decisions have to be made.
All practitioners should inform their patients, especially those undergoing fertility treatments, about Zika, and develop language in their informed consent that conveys the gap in knowledge to these patients.
Read how obesity specifically affects reproduction in an adverse way
Obesity adversely affects reproduction, but how specifically?
Practice Committee of the American Society for Reproductive Medicine. Obesity and Reproduction: A committee opinion. Fertil Steril. 2015;104(5):1116-1126.
The prevalence of obesity has increased substantially over the past 2 decades. Almost two-thirds of women and three-fourths of men in the United States are overweight or obese (defined as a body mass index [BMI] ≥25 kg/m2 and BMI ≥30 kg/m2, respectively; TABLE). Nearly 50% of reproductive-age women are obese.
A disease of excess body fat and insulin resistance, obesity increases the risks of hypertension, diabetes, dyslipidemia, cardiovascular disease, sleep apnea, respiratory problems, and cancer as well as other serious health problems. While not all individuals with obesity will have infertility, obesity is associated with impaired reproduction in both women and men, adverse obstetric outcomes, and health problems in offspring. The American Society for Reproductive Medicine (ASRM) reviewed this important issue in a recent practice committee opinion.
Menstrual cycle and ovulatory dysfunction
Menstrual cycle abnormalities are more common in women with obesity. Elevated levels of insulin in obese women suppress sex hormone−binding globulin (SHBG) which in turn reduces gonadotropin secretion due to increased production of estrogen from conversion of androgens by adipose aromatase.1 Adipose tissue produces adipokines, which directly can suppress ovarian function.2
Ovulatory dysfunction is common among obese women; the relative risk of such dysfunction is 3.1 (95% confidence interval [CI], 2.2−4.4) among women with BMI levels >27 kg/m2 versus BMI levels 20.0 to 24.9 kg/m2.3,4 Obesity decreases fecundity even in women with normal menstrual cycles.5 This may in part be due to altered ovulatory dynamics with reduced early follicular luteinizing hormone pulse amplitude accompanied by prolonged folliculogenesis and reduced luteal progesterone levels.6
Compared with normal-weight women, obese women have a lower chance of conception within 1 year of stopping contraception; about 66% of obese women conceive within 1 year of stopping contraception, compared with about 81% of women with normal weight.7 Results of a Dutch study of 3,029 women with regular ovulation, at least one patent tube, and a partner with a normal semen analysis indicated a direct correlation between obesity and delayed conception, with a 4% lower spontaneous pregnancy rate per kg/m2 increase in women with a BMI >29 kg/m2 versus a BMI of 21 to 29 kg/m2 (hazard ratio, 0.96; 95% CI, 0.91−0.99).8
Assisted reproduction
Assisted reproduction in women with obesity is associated with lower success rates than in women with normal weight. A systematic review of 27 in vitro fertilization (IVF) studies (23 of which were retrospective) reveals 10% lower live-birth rate in overweight (BMI >25 kg/m2) versus normal-weight women (BMI <25 kg/m2) undergoing IVF (odds ratio [OR], 0.90; 95% CI, 0.82−1.0).9 Data from a meta-analysis of 33 IVF studies, including 47,967 cycles, show that, compared with women with a BMI <25 kg/m2, overweight or obese women have significantly reduced rates of clinical pregnancy (relative risk [RR], 0.90; P<.0001) and live birth (RR, 0.84; P = .0002).10
Results of a retrospective study of 4,609 women undergoing first IVF or IVF/intracytoplasmic sperm injection cycles revealed impaired embryo implantation (controlling for embryo quality and transfer day), reducing the age-adjusted odds of live birth in a BMI-dependent manner by 37% (BMI, 30.0−34.9 kg/m2), 61% (BMI, 35.0−39.9 kg/m2), and 68% (BMI, >40 kg/m2) compared with women with a BMI of 18.5 to 24.9 kg/m2.11 In a study of 12,566 Danish couples undergoing assisted reproduction, overweight and obese ovulatory women had a 12% (95% CI, 0.79−0.99) and 25% (95% CI, 0.63−0.90) reduction in IVF-related live birth rate, respectively (referent BMI, 18.5−24.9 kg/m2), with a 2% (95% CI, 0.97−0.99) decrease in live-birth rate for every one-unit increase in BMI.12 Putative mechanisms for these findings include altered oocyte morphology and reduced fertilization in eggs from obese women,13 and impaired embryo quality in women less than age 35.14 Oocytes from women with a BMI >25 kg/m2 are smaller and less likely to complete development postfertilization, with embryos arrested prior to blastulation containing more triglyceride than those forming blastocysts.15
Blastocysts developed from oocytes of high-BMI women are smaller, contain fewer cells and have a higher content of triglycerides, lower glucose consumption, and altered amino acid metabolism compared with embryos of normal-weight women (BMI <24.9 kg/m2).15 Obesity may alter endometrial receptivity during IVF given the finding that third-party surrogate women with a BMI >35 kg/m2 have a lower live-birth rate (25%) compared with women with a BMI <35 kg/m2 (49%; P<.05).16
Pregnancy outcomes
Obesity is linked to an increased risk of miscarriage. Results of a meta-analysis of 33 IVF studies including 47,967 cycles indicated that overweight or obese women have a higher rate of miscarriage (RR, 1.31; P<.0001) than normal-weight women (BMI <25 kg/m2).17 Maternal and perinatal morbid obesity are strongly associated with obstetric and perinatal complications, including gestational diabetes, hypertension, preeclampsia, preterm delivery, shoulder dystocia, fetal distress, early neonatal death, and small- as well as large-for-gestational age infants.
Obese women who conceive by IVF are at increased risk for preeclampsia, gestational diabetes, preterm delivery, and cesarean delivery.13 Authors of a meta-analysis of 18 observational studies concluded that obese mothers were at increased odds of pregnancies affected by such birth defects as neural tube defects, cardiovascular anomalies, and cleft lip and palate, among others.18
In addition to being the cause of these fetal abnormalities, maternal metabolic dysfunction is linked to promoting obesity in offspring, thereby perpetuating a cycle of obesity and adverse health outcomes that include an increased risk of premature death in adult offspring in subsequent generations.13
Treatment for obesity
Lifestyle modification is the first-line treatment for obesity.
Pre-fertility therapy and pregnancy goals. Targets for pregnancy should include:
- preconception weight loss to a BMI of 35 kg/m2
- prevention of excess weight gain in pregnancy
- long-term reduction in weight.
For all obese individuals, lifestyle modifications should include a weight loss of 7% of body weight and increased physical activity to at least 150 minutes of moderate activity, such as walking, per week. Calorie restriction should be emphasized. A 500 to 1,000 kcal/day decrease from usual dietary intake is expected to result in a 1- to 2-lb weight loss per week. A low-calorie diet of 1,000 to 1,200 kcal/day can lead to an average 10% decrease in total body weight over 6 months.
Adjunct supervised medical therapy or bariatric surgery can play an important role in successful weight loss prepregnancy but are not appropriate for women actively attempting conception. Importantly, pregnancy should be deferred for a minimum of 1 year after bariatric surgery. The decision to postpone pregnancy to achieve weight loss must be balanced against the risk of declining fertility with advancing age of the woman.
Read about when to treat subclinical hypothyroidism
Optimal management of subclinical hypothyroidism in women with infertility
Practice Committee of the American Society for Reproductive Medicine. Subclinical hypothyroidism in the infertile female population: a guideline. Fertil Steril. 2015;104(3):545-553.
Thyroid disorders long have been associated with the potential for adverse reproductive outcomes. While overt hypothyroidism has been linked to infertility, increased miscarriage risk, and poor maternal and fetal outcomes, controversy has existed regarding the association between subclinical hypothyroidism (SCH) and reproductive problems. The ASRM recently published a guideline on the role of SCH in the infertile female population.
How is subclinical hypothyroidism defined?
SCH is classically defined as a thyrotropin (TSH) level above the upper limit of normal range (4.5−5.0 mIU/L) with normal free thyroxine (FT4) levels. The National Health and Nutrition Examination Survey (NHANES III) population has been used to establish normative data for TSH for a disease-free population. These include a median serum level for TSH of 1.5 mIU/L, with the corresponding 2.5 and 97.5 percentiles of 0.41 and 6.10, respectively.19 Data from the National Academy of Clinical Biochemistry, however, reveal that 95% of individuals without evidence of thyroid disease have a TSH level <2.5 mIU/L, and that the normal reference range is skewed to the right.20 Adjusting the upper limit of the normal range to 2.5 mIU/L would result in an additional 11.8% to 14.2% of the United States population (22 to 28 million individuals) being diagnosed with hypothyroidism.
This information raises several important questions.
1. Should nonpregnant women be treated for SCH?
No. There is no benefit from the standpoint of lipid profile or alteration of cardiovascular risk in the treatment of TSH levels between 5 and 10 mIU/L and, therefore, treatment of individuals with TSH <5 mIU/L is questionable. Furthermore, the risk of overtreatment resulting in bone loss is a concern. The Endocrine Society does not recommend changing the current normal TSH range for nonpregnant women.
2. What are normal TSH levels in pregnant women?
Because human chorionic gonadotropin (hCG) can bind to and affect the TSH receptor, thereby influencing TSH values, the normal range for TSH is modified in pregnancy. The Endocrine Society recommends the following pregnancy trimester guidelines for TSH levels: 2.5 mIU/L is the recommended upper limit of normal in the first trimester, 3.0 mIU/L in the second trimester, and 3.5 mIU/L in the third trimester.
3. Is untreated SCH associated with miscarriage?
There is fair evidence that SCH, defined as a TSH level >4 mIU/L during pregnancy, is associated with miscarriage, but there is insufficient evidence that TSH levels between 2.5 and 4 mIU/L are associated with miscarriage.
4. Is untreated SCH associated with infertility?
Limited data are available to assess the effect of SCH on infertility. While a few studies show an association between SCH on unexplained infertility and ovulatory disorders, SCH does not appear to be increased in other causes of infertility.
5. Is SCH associated with adverse obstetric outcomes?
Available data reveal that SCH with TSH levels outside the normal pregnancy range are associated with an increased risk of such obstetric complications as placental abruption, preterm birth, fetal death, and preterm premature rupture of membranes (PPROM). However, it is unclear if prepregnancy TSH levels between 2.5 and 4 mIU/L are associated with adverse obstetric outcomes.
6. Does untreated SCH affect developmental outcomes in children?
The fetus is solely dependent on maternal thyroid hormone in early pregnancy because the fetal thyroid does not produce thyroid hormone before 10 to 13 weeks of gestation. Significant evidence has associated untreated maternal hypothyroidism with delayed fetal neurologic development, impaired school performance, and lower intelligence quotient (IQ) among offspring.21 There is fair evidence that SCH diagnosed in pregnancy is associated with adverse neurologic development. There is no evidence that SCH prior to pregnancy is associated with adverse neurodevelopmental outcomes. It should be noted that only one study has examined whether treatment of SCH improves developmental outcomes (measured by IQ scored at age 3 years) and no significant differences were observed in women with SCH who were treated with levothyroxine versus those who were not.22
7. Does treatment of SCH improve miscarriage rates, live-birth rates, and/or clinical pregnancy rates?
Small randomized controlled studies of women undergoing infertility treatment and a few observational studies in the general population yield good evidence that levothyroxine treatment in women with SCH defined as TSH >4.0 mIU/L is associated with improvement in pregnancy, live birth, and miscarriage rates. There are no randomized trials assessing whether levothyroxine treatment in women with TSH levels between 2.5 and 4 mIU/L would yield similar benefits to those observed in women with TSH levels above 4 mIU/L.
8. Are thyroid antibodies associated with infertility or adverse reproductive outcomes?
There is good evidence that the thyroid autoimmunity, or the presence of TPO-Ab, is associated with miscarriage and fair evidence that it is associated with infertility. Treatment with levothyroxine may improve pregnancy outcomes especially if the TSH level is above 2.5 mIU/L.
9. Should there be universal screening for hypothyroidism in the first trimester of pregnancy?
Current evidence does not reveal a benefit of universal screening at this time. The American College of Obstetricians and Gynecologists does not recommend routine screening for hypothyroidism in pregnancy unless women have risk factors for thyroid disease, including a personal or family history of thyroid disease, physical findings or symptoms of goiter or hypothyroidism, type 1 diabetes mellitus, infertility, history of miscarriage or preterm delivery, and/or personal or family history of autoimmune disease.
The bottom line
SCH, defined as a TSH level greater than the upper limit of normal range (4.5−5.0 mIU/L)with normal FT4 levels, is associated with adverse reproductive outcomes including miscarriage, pregnancy complications, and delayed fetal neurodevelopment. Thyroid supplementation is beneficial; however, treatment has not been shown to improve long-term neurologic developmental outcomes in offspring. Data are limited on whether TSH values between 2.5 mIU/L and the upper range of normal are associated with adverse pregnancy outcomes and therefore treatment in this group remains controversial. Although available evidence is weak, there may be a benefit in some subgroups, and because risk is minimal, it may be reasonable to treat or to monitor levels and treat above nonpregnant and pregnancy ranges. There is fair evidence that thyroid autoimmunity (positive thyroid antibody) is associated with miscarriage and infertility. Levothyroxine therapy may improve pregnancy outcomes especially if the TSH level is above 2.5 mIU/L. While universal screening of thyroid function in pregnancy is not recommended, women at high risk for thyroid disease should be screened.23
Share your thoughts! Send your Letter to the Editor to [email protected]. Please include your name and the city and state in which you practice.
- Pasquali R, Pelusi C, Genghini S, Cacciari M, Gambineri A. Obesity and reproductive disorders in women. Hum Reprod Update. 2003;9(4):359-372.
- Greisen S, Ledet T, Møller N, et al. Effects of leptin on basal and FSH stimulated steroidogenesis in human granulosa luteal cells. Acta Obstet Gynecol Scand. 2000;79(11):931-935.
- Rich-Edwards JW, Goldman MB, Willett WC, et al. Adolescent body mass index and infertility caused by ovulatory disorder. Am J Obstet Gynecol. 1994;171(1):171-177.
- Grodstein F, Goldman MB, Cramer DW. Body mass index and ovulatory infertility. Epidemiology. 1994;5(2):247-250.
- Gesink Law DC, Maclehose RF, Longnecker MP. Obesity and time to pregnancy. Hum Reprod. 2007;22(2):414-420.
- Jain A, Polotsky AJ, Rochester D, et al. Pulsatile luteinizing hormone amplitude and progesterone metabolite excretion are reduced in obese women. J Clin Endocrinol Metab. 2007;92(7):2468-2473.
- Lake JK, Power C, Cole TJ. Women's reproductive health: the role of body mass index in early and adult life. Int J Obes Relat Metab Disord. 1997;21(6):432-438.
- van der Steeg JW, Steures P, Eijkemans MJ, et al. Obesity affects spontaneous pregnancy chances in subfertile, ovulatory women. Hum Reprod. 2008;23(2):324-328.
- Koning AM, Mutsaerts MA, Kuchenbecker WK, et al. Complications and outcome of assisted reproduction technologies in overweight and obese women [Published correction appears in Hum Reprod. 2012;27(8):2570.] Hum Reprod. 2012;27(2):457-467.
- Rittenberg V, Seshadri S, Sunkara SK, Sobaleva S, Oteng-Ntim E, El-Toukhy T. Effect of body mass index on IVF treatment outcome: an updated systematic review and meta-analysis. Reprod Biomed Online. 2011;23(4):421-439.
- Moragianni VA, Jones SM, Ryley DA. The effect of body mass index on the outcomes of first assisted reproductive technology cycles. Fertil Steril. 2012;98(1):102-108.
- Petersen GL, Schmidt L, Pinborg A, Kamper-Jørgensen M. The influence of female and male body mass index on live births after assisted reproductive technology treatment: a nationwide register-based cohort study. Fertil Steril. 2013;99(6):1654-1662.
- Practice Committee of the American Society for Reproductive Medicine. Obesity and Reproduction: A committee opinion. Fertil Steril. 2015;104(5):1116-1126.
- Metwally M, Cutting R, Tipton A, Skull J, Ledger WL, Li TC. Effect of increased body mass index on oocyte and embryo quality in IVF patients. Reprod Biomed Online. 2007;15(5):532-538.
- Leary C, Leese HJ, Sturmey RG. Human embryos from overweight and obese women display phenotypic and metabolic abnormalities. Hum Reprod. 2015;30(1):122-132.
- Deugarte D, Deugarte C, Sahakian V. Surrogate obesity negatively impacts pregnancy rates in third-party reproduction. Fertil Steril. 2010;93(3):1008-1010.
- Rittenberg V, Seshadri S, Sunkara SK, Sobaleva S, Oteng-Ntim E, El-Toukhy T. Effect of body mass index on IVF treatment outcome: an updated systematic review and meta-analysis. Reprod Biomed Online. 2011;23(4):421-439.
- Stothard KJ, Tennant PWG, Bell R, Rankin J. Maternal overweight and obesity and the risk of congenital anomalies: a systematic review and meta-analysis. JAMA. 2009;301(6):636-650.
- Hollowell JG, Staehling NW, Flanders WD, et al. Serum TSH, T(4), and thyroid antibodies in the United States population (1988 to 1994): National Health and Nutrition Examination Survey (NHANES III). J Clin Endocrinol Metab. 2002;87(2):489-499.
- Baloch Z, Carayon P, Conte-Devolx B, et al. Laboratory medicine practice guidelines. Laboratory support for the diagnosis and monitoring of thyroid disease. Thyroid. 2003;13(1):3-126.
- Pop VJ, Kuijpens JL, van Baar AL, et al. Low maternal free thyroxine concentrations during early pregnancy are associated with impaired psychomotor development in infancy. Clin Endocrinol (Oxf). 1999;50(2):149-155.
- Lazarus JH, Bestwick JP, Channon S, et al. Antenatal thyroid screening and childhood cognitive function. N Engl J Med. 2012;366(17):493-501.
- Practice Committee of the American Society for Reproductive Medicine. Subclinical hypothyroidism in the infertile female population: a guideline. Fertil Steril. 2015;104(3):545-553.
First EDition: Liquid Nicotine Risks, more
Risks of Electronic Cigarettes Include Unintentional Ingestion of Liquid Nicotine
BY JEFF BAUER
A recent case report of a 6-year-old girl who developed severe toxicity and required intubation after an unintentional exposure to liquid nicotine emphasizes a potential danger of commercially available liquid nicotine, which is highly concentrated, unreliably packaged, and poorly regulated.
Liquid nicotine is commonly sold in concentrated “refill” solutions intended for electronic cigarette users to dilute themselves. Previous studies have found that these refill products have unreliable commercial labeling, and that the actual nicotine concentration of these solutions can vary widely from the advertised concentration.
In this case report, the girl’s mother had purchased a concentrated nicotine solution online and had used an empty ibuprofen bottle, which she relabeled as “NIC,” to dilute the solution. Afterward, the patient’s father gave his daughter a 10-mL dose of the liquid from the repurposed bottle, believing it to be ibuprofen. Immediately upon consumption, the girl experienced a burning sensation in her mouth and throat. When the father tasted the liquid, he realized it contained the nicotine solution.
Within 5 minutes of the ingestion, the patient’s father called the regional poison control center and emergency medical services, while the girl’s mother attempted to manually induce vomiting, which produced only a small amount of emesis. When the paramedics arrived, the girl was conscious and breathing spontaneously, but she did not respond to questions or follow commands. The only intervention the paramedics performed was insertion of a peripheral intravenous line.
The girl arrived at the ED approximately 25 minutes after having ingested the nicotine. Her vital signs were: temperature, 95.4°F; heart rate (HR), 140 to 150 beats/min; and blood pressure, 93/70 mm Hg. Oxygen saturation was 95% on room air. She was alternately agitated and unresponsive. Her HR decreased to 60 beats/min, and she developed vomiting, diaphoresis, fasciculations, obtundation, and copious secretions. She was given ondansetron (0.1 mg/kg) and lorazepam (0.05 mg/kg), and within 6 minutes from arrival, she was sedated and intubated. Activated charcoal (25 g) was administered via nasogastric tube, and she was admitted to the pediatric intensive care unit.
Laboratory results from blood drawn upon the girl’s arrival at the ED indicated elevated lactate, creatinine, and potassium levels. A serum sample obtained 60 minutes after the girl had ingested the liquid was notable for elevated levels of nicotine (348 ng/mL). With the parents’ permission, the liquid in the ibuprofen container was analyzed and found to contain nicotine, 70.3 mg/mL, which meant the girl had consumed 703 mg of nicotine, or 35 mg/kg. A recent review suggested a fatal nicotine dose of 500 to 1,000 mg in adults. Assuming the mother had correctly diluted the liquid nicotine by half as she had intended to, the original product’s nicotine concentration was 140.6 mg/mL, or 234% of the amount listed on the package (60 mg/mL).
The girl remained sedated and intubated overnight without requiring additional medication or treatment. She was extubated the next morning. Her lactate, creatinine, and potassium levels returned to normal, and electrocardiography and chest radiography results were normal. She was discharged home in stable condition. The Department of Human Services conducted a brief investigation, which they closed when the patient was discharged.
The authors of this case report concluded that emergency physicians (EPs) should be aware of the widespread availability of liquid nicotine products, and the potential of severe toxicity from ingestion of liquid nicotine.
Noble MJ, Longstreet B, Hendrickson RG, Gerona R. Unintentional pediatric ingestion of electronic cigarette nicotine refill liquid necessitating intubation. Ann Emerg Med. 2017;69(1):94-97. doi:10.1016/j.annemergmed.2016.08.448.
Emergency Radiologists’ Job Satisfaction Tied to How Often They Have to Work Overnight Shifts
BY JEFF BAUER
According to a recent survey of emergency radiologists, those who frequently work overnight shifts are less likely to be satisfied with their job than counterparts who work fewer or no overnight shifts.
Approximately 1,100 emergency radiologists received an e-mail invitation to complete an online survey; 327 did so (29.6% response rate). Seventy-three percent of respondents were male, 69% were age 40 years or older, and 87% practiced full-time. Respondents were asked to rate statements such as “I enjoy my job” and “At times I feel overwhelmed at work” on a Likert scale from “disagree or strongly disagree” to “agree or strongly agree.”
Overall, 81% of respondents reported some measure of job enjoyment. There was an association between the average number of overnight shifts performed per year and job enjoyment. Emergency radiologists who did no overnight shifts were 2.21 times more likely to report enjoying their job than those who worked 17 weeks or more of overnight shifts a year.
Hanna TN, Shekhani H, Lamoureux C, et al. Emergency radiology practice patterns: shifts, schedules, and job satisfaction. J Am Coll Radiol. 2016. Dec 4. [Epub ahead of print]. doi:10.1016/j.jacr.2016.09.018.
Discharging Select Diverticulitis Patients From the ED May Be Acceptable
DOUG BRUNK
FRONTLINE MEDICAL NEWS
Among patients diagnosed with diverticulitis via computed tomography (CT) scan in the ED who were discharged home, only 13% required a return visit to the hospital, results from a long-term retrospective analysis demonstrated.
“In select patients whose assessment includes a CT scan, discharge to home from the emergency department with treatment for diverticulitis is safe,” study author Anne-Marie Sirany, MD, said at the annual meeting of the Western Surgical Association.
According to Dr Sirany, a general surgery resident at Hennepin County Medical Center, Minneapolis, diverticulitis accounts for about 150,000 hospital admissions per year in the United States, and only 15% of these patients require surgical intervention. However, between 2006 and 2011, ED visits for diverticulitis increased by 21%, and the annual direct medical cost related to the condition is estimated to exceed $1.8 billion. At the same time, medical literature regarding uncomplicated diverticulitis is scarce. “Most of the literature focuses on complicated diverticulitis, which includes episodes associated with extraluminal air, free perforation, abscess, fistula, obstruction, and stricture,” Dr Sirany said.
A few years ago, researchers conducted a randomized trial to evaluate the treatment of uncomplicated diverticulitis. Patients were diagnosed with diverticulitis in the ED and randomized to either hospital admission or outpatient management at home. The investigators found no significant differences between the readmission rates of the inpatient and outpatient groups, but the health care costs were three times lower in the outpatient group. Dr Sirany and her associates set out to compare the outcomes of patients diagnosed with and treated for diverticulitis in the ED who were discharged to home, versus those who were admitted to the hospital. They reviewed the medical records of 240 patients with a primary diagnosis of diverticulitis by CT scan who were evaluated in the ED at one of four hospitals and one academic medical center from September 2010 to January 2012. The primary outcome was hospital readmission or return to the ED within 30 days, while the secondary outcomes were recurrent diverticulitis or surgical resection for diverticulitis.
The mean age of the 240 patients was 59 years, 45% were men, 22% had a Charlson Comorbidity Index (CCI) of >2, and 7.5% were on corticosteroids or immunosuppressant medications. More than half (62%) were admitted to the hospital, while the remaining 38% were discharged home on oral antibiotics. Compared with patients discharged home, those admitted to the hospital were more likely to be older than 65 years (43% vs 24%, respectively; P = .003), have a CCI of 2 or greater (28% vs 13%; P = .007), were more likely to be on immunosuppressant or steroid medications (11% vs 1%; P = .003), show extraluminal air on CT (30% vs 7%; P < .001), or show abscess on CT (19% vs 1%; P < .001). “Of note: We did not have any patients who had CT scan findings of pneumoperitoneum who were discharged home, and 48% of patients admitted to the hospital had uncomplicated diverticulitis,” she said.
After a median follow-up of 37 months, no significant differences were observed between patients discharged to home and those admitted to the hospital in readmission or return to the ED (13% vs 14%), recurrent diverticulitis (23% in each group), or in colon resection at subsequent encounter (16% vs 19%). “Among patients discharged to home, only one patient required emergency surgery, and this was 20 months after their index admission,” Dr Sirany said. “We think that the low rate of readmission in patients discharged home demonstrates that this is a safe approach to management of patients with diverticulitis, when using information from the CT scan.”
Closer analysis of patients who were discharged home revealed that six patients had extraluminal air on CT scan, three of whom returned to the ED or were admitted to the hospital. In addition, 11% of those with uncomplicated diverticulitis returned to the ED or were admitted to the hospital.
Dr Sirany acknowledged certain limitations of the study, including its retrospective design, a lack of complete follow-up for all patients, and the fact that it included patients with recurrent diverticulitis. “Despite the limitations, we recommend that young, relatively healthy patients with uncomplicated findings on CT scan can be discharged to home and managed as an outpatient,” she said. “In an era where there’s increasing attention to health care costs, we need to think more critically about which patients need to be admitted for management of uncomplicated diverticulitis.”
Microsensor Perfectly Distinguished Coagulopathy Patients From Controls
AMY KARON
FRONTLINE MEDICAL NEWS
Using less than a drop of blood, a portable microsensor provided a comprehensive coagulation profile in <15 minutes and perfectly distinguished various coagulopathies from normal blood samples—handily beating the results from both activated partial thromboplastin time (aPTT) and prothrombin time (PT).
Dubbed ClotChip, the disposable device detects coagulation factors and platelet activity using dielectric spectroscopy, Evi X. Stavrou, MD, said at the annual meeting of the American Society of Hematology. The development points the way for comprehensive, rapid, point-of-care (POC) assessment of critically ill or severely injured patients and those who need ongoing monitoring to evaluate response to anticoagulant therapy, she added.
Existing POC coagulation assays have several shortcomings, Dr Stavrou, of Case Western Reserve University, Cleveland, said during a press briefing at the conference. They are relatively insensitive, fail to measure platelet activity, or are only approved for specific subgroups of patients, such as those on warfarin, she specified.
To develop an alternative, Dr Stavrou and her associates added a parallel-plate capacitive sensing structure to an inexpensive, disposable microfluidic biochip designed to test 9 microliters (less than one drop) of blood. They built the microsensor from biocompatible and chemically inert materials to minimize the chances of artificial contact activation.
To test the device, the researchers used calcium dichloride to induce coagulation in whole blood samples from 11 controls with normal aPTT and PT values. Time curves of output from the microsensor showed that coagulation consistently peaked within 4.5 to 6 minutes.
Next, the investigators tested blood from 12 patients with coagulopathies, including hemophilia A, hemophilia B, acquired von Willebrand factor defect, and congenital hypodysfibrinogenemia. These samples all yielded abnormal curves, with prolonged times to peak that ranged between 7 and 15 minutes—significantly exceeding those of healthy controls (P = .002).
By plotting rates of true positives against rates of true negatives, the researchers obtained areas under the receiver-operating curves of 100% for ClotChip, 78% for aPTT, and 57% for PT. In other words, ClotChip correctly identified all cases and controls in this small patient cohort, while neither aPTT nor PT did.
Finally, the researchers used the microsensor to measure coagulation activity in normal blood samples that they treated with prostaglandin E2 to inhibit platelet aggregation. Normalized permittivity (an electrical measure) was significantly lower than in untreated control samples (P = .03), but time-to-peak values were the same in both groups. This finding confirms the chip can identify abnormal platelet function, Dr Stavrou said. “ClotChip is sensitive to the complete hemostasis process, exhibits better sensitivity and specificity than conventional coagulation assays, and discriminates between coagulation and platelet defects,” she concluded.
The investigators are recruiting volunteers for an expanded round of testing for the device, and are working to optimize construction to further enhance its sensitivity.
Survey: Overprescribing Is the Cause of the Opioid Crisis
M. ALEXANDER OTTO
FRONTLINE MEDICAL NEWS
Almost a third of doctors blamed overprescribing as the cause of the opioid crisis, according to a survey of 225 US primary care, emergency medicine, and pain management physicians by InCrowd, an online physician survey company.
Respondents said their and other physicians’ overprescribing is the single biggest factor fueling the leap in opioid abuse over the past 5 years.
“We were told…that [opioids] wouldn’t be addictive in the great majority of patients. This was obviously wrong,” said a Utah EP in practice for 38 years. Meanwhile, 24% of the respondents cited aggressive patient drug-seeking as the primary cause, and 18% blamed drug dealers.
In short, the survey pointed out what front-line doctors think needs to be fixed as the nation combats prescription opioid abuse and the subsequent heroin epidemic. Their insights “should be a rallying cry” for changes in 2017, said epidemiologist Diane Hayes, PhD, president and cofounder of InCrowd.
Making pain the “fifth vital sign” and allowing patients to downgrade doctors on surveys if they don’t prescribe or refill opioid prescriptions compounded the situation. Lengthy waits for specialists with better pain options, many of whom are not covered by Medicaid or the Affordable Care Act, also added to the problem, survey respondents said.
“We’re caught in the middle” between the Joint Commission on Accreditation of Healthcare Organization’s fifth vital sign and overprescribing, a primary care physician (PCP) said.
Seventy-three percent of survey respondents said that they want opioid alternatives, noting exasperation with nonsteroidal anti-inflammatory drugs, physical therapy, and exercise. About half recommend behavioral health interventions, while 20% recommend vitamin and herbal supplements. Only 10% recommend medical marijuana, probably because it is inaccessible to most US patients. Meanwhile, the respondents said they want opioid prescribing “hemmed in.” Almost two-thirds wanted refill limits and more frequent refill evaluations, and many agreed that there needs to be a weaning protocol before the drugs are even started. Some wanted to limit advertising.
Easton Jackson, MD, a PCP in West Valley City, Utah, who answered the survey, helped make the answers real by sharing his thoughts.
“We need to recognize that…people don’t set out to get addicted to opioids….We need to educate [patients] and assist them with their expectations. They need to understand that they’re going to have pain from surgery and injuries. Our goal isn’t to make them pain-free. It’s to manage their pain,” he said.
“We as physicians need to write for fewer pills and in lower doses. We need to see our patients back sooner. If it’s not working, stop increasing the dose and instead taper the patient off the medication. We need to be familiar with the adjuvant therapies. As easy as it is to say, ‘send them all to the pain specialist,’ there simply aren’t enough of them around,” Dr Jackson said.
Physician respondents to InCrowd’s opioid survey have practiced an average of 25 years, and were scattered around the United States. They filled out the four-question survey during October 27 to 28, 2016. They signed up to receive and answer InCrowd’s questions, and were paid nominally for their time.
Half (50%) of respondents estimated that they prescribed opioids to <10% of their patients; 38% said they prescribed to less than half of their patients; and 12% estimated they prescribed opioids to more than half of their patients.
Adding Respiratory Rate to Triage Criteria Improves Accurate Staging of Chest Trauma Patients
MICHELE G. SULLIVAN
FRONTLINE MEDICAL NEWS
Adding respiratory rate (RR) and suspected blunt chest injury to a trauma assessment in the field significantly improved the appropriate triaging of level III trauma patients.
When the assessment specifically evaluated for tachypnea in the setting of blunt chest injury, undertriaging improved by 1.2%, John Yonge, MD, said at the annual clinical congress of the American College of Surgeons.
“When we applied this new criteria to our 10-year study, we identified 661 patients who should have been activated as a level I or level II,” but instead were assessed as less critically injured, Dr Yonge said in an interview. This initial misstep significantly extended the time before patients could have critical surgical procedures and was related to higher mortality among them.
Dr Yonge, a surgical fellow at Oregon Health & Science University (OHSU), Portland, and his mentor Martin Schreiber, MD, conducted the retrospective study of 7,880 trauma patients admitted at level III activation from 2004 to 2014. The OHSU trauma system has three activation levels.
- Level I activations are reserved for the most critically injured patients; attending trauma surgeon and anesthesiologist presence is mandatory.
- Level II activations capture moderate-to-severe injuries; trauma surgeon and respiratory therapist presence is mandated.
- Level III activations are designed to capture patients who do not require an immediate lifesaving intervention; the presence of the trauma surgery chief resident and attending emergency medicine physician is mandatory.
Patients were considered undertriaged if they were admitted as level III activations, but then required a critical intervention (chest tube placement, intubation, needle thoracostomy, or intracranial pressure monitoring) in the ED or ultimately met level I or II activation criteria.
Among all the level III patients, 466 (6%) were undertriaged: 390 were undertriaged based on the existing level I or II activation criteria, and 76 were considered undertriaged based on the need for a critical intervention.
Most of the undertriaged patients (65%) met criteria for level I activation; the rest should have been triaged as level II patients. Compared with appropriately staged level III patients, mortality among the undertriaged patients was significantly higher (3.2% vs 0.6%). Undertriaged patients also experienced longer delays before initiation of major emergency surgery: a mean of 147 minutes, compared with 106 minutes for appropriately triaged level I patients and 62 minutes for appropriately triaged level II patients.
Dr Yonge then looked for clinical measures that would improve triage. Tachypnea (RR >20 breaths/min) in the field stood out as a significant factor. Tachypneic patients who had a suspected chest injury were 70% more likely to be undertriaged than were those with a normal RR. Tachypnea was significantly associated with a diagnosis of flail chest, ED intubation, and chest-tube placement.
The team then constructed a new triage criterion for patients with suspected chest injury—tachypnea combined with suspected blunt thoracic injury. By applying that model to their study population of level III patients, they determined that the level III undertriage rate would be reduced by 1.2%.
Tying the physiological marker of tachypnea to a suspected clinical diagnosis is a key factor, Dr Yonge noted. “Just adding tachypnea doesn’t help us. In fact, it would overwhelm us, because a trauma patient could very well be tachypneic because he’s experiencing panic. But tying it to a suspected clinical diagnosis gives us a meaningful result.”
He confirmed this linkage with an additional analysis. “We looked to see how severely injured these patients were and found that 71% of them had an Abbreviated Injury Score (AIS) to the chest of 3 or more, indicating a severe chest injury. Only 29% had an AIS of 2 or less. So this proves that respiratory rate is a valid triage criterion and can be used to identify patients who need a higher level of trauma care.”
The challenge now, Dr Yonge said, is incorporating the marker into clinical practice. “It doesn’t matter how many statistics you do, if you can’t educate the prehospital providers in this, it’s useless. They are the crux of the trauma system.”
Although national guidelines do recommend assessing RR as part of field triage, it often isn’t recorded or is only estimated, Dr Yonge said. That’s one reason he used the 20 breaths/min cutoff rate. “It doesn’t even take a full minute to assess this, but it can make a big improvement in care.”

Racial Differences in Adherence to Prescribed Analgesia in Cancer Patients: An Integrated Review of Quantitative Research
From the University of Pennsylvania School of Nursing, Philadelphia, PA.
Abstract
- Background: Racial/ethnic disparities in analgesic treatment for pain have been widely documented in the United States. However, the connection between race/ethnicity and adherence to prescribed analgesics has not been described.
- Objectives: To review and synthesize quantitative research documenting racial/ethnic differences in adherence to prescribed analgesia in cancer patients.
- Methods: We performed a systematic search of quantitative, primary studies in Scopus, CINAHL, PubMed, Ovid, PsychInfo, and EMBASE. The title and abstract of each article was reviewed for relevance and whether inclusion criteria were met. Evidence was examined for relevant outcomes, data collection methods, variables studied in relation to adherence, and the magnitude of association between race/ethnicity and adherence.
- Results: Seven studies met inclusion criteria. Reported rates of adherence varied in studies among Hispanic/Latinos, African Americans, Asians, and whites based on variation in measurement tools, research questions, populations from which participants were recruited, and predictive variables analyzed. Most existing studies of analgesic adherence used self-report to measure adherence. Only 1 study used a validated, real-time electronic instrument to monitor prescribed opioid adherence and had a longitudinal study design.
- Conclusion: Limited research has examined relationships between adherence to prescribed analgesic regimens and racial disparities. Existing studies point to the clinical and socioeconomic factors that may interact with race/ethnicity in explaining analgesic and opioid adherence outcomes in cancer patients.
Key words: race, ethnicity, adherence, opiates, analgesics, pain management, cancer, pain treatment disparities.
The ongoing opioid epidemic and recent development of the Centers for Disease Control and Prevention (CDC) guidelines for chronic pain management have shaped a national conversation on opioid prescription and utilization [1]. The CDC delineates provider recommendations for opioid prescription. This focus on prescribed medication regimens is inadequate without an understanding of how patients take or adhere to prescribed medications. Cancer patients are a unique group. Moderate to severe pain in cancer patients is usually treated with opioids, and adherence to analgesia has been conceptualized a key mediator of cancer pain outcomes. For instance, a recent study found that patterns of analgesic adherence, specifically, inconsistent adherence to strong opioids (World Health Organization step 3), is one of the strongest predictors of health care utilization among outpatients with cancer pain [2]. Approximately 67% to 77% of cancer patients experience pain that requires management with analgesia [3], especially in the absence of access to nonpharmacologic pain treatments [2]. Thus, barriers in relation to adequate pain management can result in poor pain treatment outcomes and impaired quality of life for cancer patients.
Insufficient pain management has been found to have a negative impact on the quality of life and physical and mental functions of patients with cancer [4]. Patients who experience severe cancer pain are significantly more likely to experience multiple other symptoms such as depression, fatigue, and insomnia, resulting in diminished physical function [5], social role function [6], and greater out of pocket cost of managing pain and asso-ciated symptoms [7]. Minority populations, however, disproportionately carry the burden of undertreated pain [4,8–11,13–16]. Evidence suggests that blacks/African Americans are more likely to experience unrelieved cancer pain [4,8–11,13–16]. They are also less likely than their white counterparts to receive analgesic treatment for cancer pain [8–11,13,15,16]. Little is known, however, about racial disparities in relation to adherence to analgesia for cancer pain when providers prescribe analgesics.
The purpose of this paper is to review the published literature that has addressed the associations between disparities and adherence to analgesia among cancer patients. Evidence was examined for outcomes studied, data collection methods, variables studied in relation to adherence, and the magnitude of association based on race and adherence.
Methods
We performed a systematic search of studies published between 1990 and the present in Scopus, CINAHL, PubMed, Ovid, PsychInfo, and the EMBASE databases. The inclusion criteria consisted of published articles in the aforementioned databases that were (1) set in the United States, (2) primary studies, (3) employed quantitative design, (4) assessed adherence or compliance to analgesics or adequacy of pain management using the Pain Management Index (PMI), (5) sample was exclusively minority or may have had a comparative group. The title and abstract of each article in the the search results was reviewed for relevance to study aims and inclusion and exclusion criteria, and any duplicates were eliminated. A total of 6 studies were found using this method (Table 1), and an additional study was found in the reference list of 1 of these 6.
Results
The 7 included studies were observational in nature; 4 were cross-sectional [4,12,15,16], 2 were retrospective [3,14], and 1 was prospective and used objective measures of analgesic adherence [13] (Table 2).
Defining and Operationalizing Adherence
Meghani and Bruner [16] point out that analgesic adherence is a “heterogeneous construct that lends itself to varied results and interpretations depending on the measurements used or dimensions studied.” Adherence to analgesia was explicitly defined in all 7 studies (Table 3). One study reported an adherence rate that was the total dose over 24 hours divided by the dose prescribed then multiplied by 100 [4]. The total dose over 24 hours was used in another study but was converted to an equianalgesic calculation [12]. Another set of studies used a similar definition but specified percentages based on medication or type of prescription, such as an around-the-clock(ATC) regimen [13,15,16]. In 2 studies, adherence was measured based on chart review of yes/no questions posed about whether or not patients had taken medications as prescribed [3,15].
The measurements of adherence differed between studies. Four studies [4,12,14,16] used adherence as a primary outcome and the rest employed adherence as a facet of pain management [3,13,15]. The most frequent measure of adherence was self-report. The widely validated Morisky Medication Adherence Scale (MMAS) instrument was used in 3 of 7 studies [12,13,15]. Meghani and Bruner [15] utilized the modified MMAS plus a previously validated visual analog scale for doses of medication to assess adherence over week- and month-long intervals. One study used patient interviews to capture self-reporting of opioid prescription and opioid use. Additionally, the study used MMAS to further characterize the adherence measurements [12]. Using a more objective method, Meghani et al [13] employed a microprocessor in the medication cap to determine the percentage of the total number of prescribed doses that were actually taken [13]. The processor sensed when the bottle was open, which served as a proxy for taking medications at appropriate times.
Analgesic Adherence Rate
To report the analgesic adherence rates, 6 studies presented a percentage [3,4,12,13,15] and all but 1 highlighted the barriers associated with poor adherence [3,4,12,13,15,16].
The results of a pilot study exploring intentional and unintentional adherence revealed that 85.5% of patients took the prescribed medications in the previous week. Further analysis using visual analogue scale for dose adherence found that that 51% took up to 60% of the prescribed medications [15]. In an exclusively African-American sample, the adherence rate was reported as 46% [4]. Another study by Meghani et al compared adherence to prescribed ATC analgesics between African Americans and whites with cancer-related pain using an electronic monitoring system [13]. The overall adherence rate for African Americans was 53% and 74% for whites [13]. The authors concluded that there was a significant difference between the analgesic adherence rates between African Americans and whites in this study. On sub-analysis, analgesic adherence rates for African Americans were much lower for weak opioids (34%) and higher for long-acting opioids (63%).
In a study of individuals from an outpatient supportive care center with a majority white sample (74% Caucasian), overall 9.6% of patients deviated from the opioid regimen, while approximately 90% reported high adherence [12]. It is important to note that a convenience sample was used here. Of the total 19 patients that deviated from the regimen, 11 used less opioids than prescribed and 8 used higher doses. Upon analysis, the opioid deviation was more frequent in males and non-whites. However, statistical analyses of the magnitude of deviation from prescribed dose and non-white racial/ethnic background were not reported. Within the “non-whites” category, the race/ethnicity is defined as African American (16%, n = 32) and “other” (9%, n = 18). The authors contend that this strong adherence resulted from a strong understanding of the regimen as evidenced by a high agreement between the prescribed dose and the patient reported prescription [12]. Nguyen et al [12] argue that the literature shows that lower adherence rates for minority patients may be explained by the presence of comorbidities and lack of insurance.
Two other studies reported adherence rates for separate insurance cohorts [3,14]. The Medicaid cohort was younger and had a higher percentage of African-American individuals. However, in the self-pay/charity care group, the majority was Hispanic [3]. In the pilot study, the differences between the groups on adherence with prescribed medication regimens did not achieve statistical significance. The data were summarized to suggest that nonadherence was more likely in the self-pay/charity care group and more follow-up visits occurred after discharge [3]. During the larger retrospective study there was no difference in number of patients adhering to the regimen at each follow-up visit in each benefit group. The study concluded that the long-acting opiate adherence was influenced only by the benefits of use and that race/ethnicity was not a statistically significant predictor [14].
Factors Associated with Adherence
Multiple studies investigated factors underlying reported analgesic adherence rates for the ethnic and racial groups studied. Both clinical and sociodemographic variables were associated with analgesic adherence (Table 4). These included cancer type and disease stage [3,4,13,14], pain intensity [3,4,13–16], side effects [13,15], type of analgesic prescribed [3,4,13–16], income/socioeconomic status [3,13,14], behavioral history [3,12,13], gender [3,4,12–16], and perceived barriers [3,4,13,15,16].
Cancer Type and Stage
Most studies did not find significant associations between analgesic adherence rates and cancer type and stage [3,12,14]. However, 1 study that sought to identify unique factors underlying analgesic adherence for African Americans and whites found that whites reported higher analgesic adherence in relation to “time since cancer diagnosis,” possibly indicating disease severity and progression [13]. In another study that involved a majority of African-American patients, individuals with colon and rectal cancer had lower adherence rates [4]. In this study, patients with colon and rectal cancer had more analgesic prescriptions (2.5 +/– 2.3 analgesics) compared to patients with other cancer diagnoses. The authors concluded that an increased medication burden might have contributed to a decreased adherence rate. Overall, other cancer types did not correlate with adherence rates [4].
Pain Intensity
Six studies examined pain intensity and duration [3,4,13–16]. Three studies found a difference in reported pain intensity between racial/ethnic groups [3,13,16], 1 found no correlation between pain intensity and race/ethnicity [14], and 3 concluded that pain intensity was a significant predictor of adherence rates [3,13,15].
Meghani and Bruner’s pilot study explored possible correlates associated with intentional and unintentional nonadherence [15]. Overall, individuals were more likely to report forgetfulness (unintentional nonadherence) and to stop taking pain medicine when feeling “worse” (intentional nonadherence) if they believed that it was easier to deal with pain than with the side effects of analgesia [15]. Further, forgetfulness was negatively associated with the need for “stronger” pain medication. Concern about using too much pain medication was positively correlated with both forgetfulness and carelessness. The need for stronger pain medication was also correlated with significantly higher pain levels and lower pain relief [15].
In a comparative study of African Americans and whites, African Americans reported greater cancer pain and lower pain relief on the Brief Pain Inventory (BPI) and had a negative PMI. The PMI measure is a simple index linking the usual severity of cancer pain with the category of medication prescribed to treat it. PMI is calculated by subtracting patient’s pain levels (“pain worst” score from the BPI coded as mild, moderate, or severe) from the most potent analgesia prescribed. A negative PMI implies inadequate analgesic prescription relative to the reported pain level. Pain intensity was a significant factor related to increased adherence in whites but not African Americans. For African Americans, analgesic adherence was predicted by socioeconomic status, provider communication factors, and side effects. Similarly, in another study that compared African Americans and Hispanics, African Americans were more likely to have a negative PMI than Hispanics and were less likely to report that pain medication relieved pain [16]. In a pilot study that compared Medicaid recipients to self-pay/charity care patients, African-American participants had lower reported pain scores than Hispanics and Caucasians [3]. In the larger follow-up study, however, ethnicity did not prove a significant predictor for pain levels [14].
In a study with exclusively African-American patients, a significant correlation was found between pain intensity and adherence; specifically, as intensity increased, adherence increased [4]. Results for the entire African-American cohort indicated that 90% of patients had analgesic prescriptions for cancer-related pain, but 86% continued to report having moderate to severe worst pain [4]. A study that compared African Americans and whites showed that lower pain relief with analgesics was associated with lower adherence to analgesia for cancer pain among whites [13]. For every unit increase in “least pain” scores (indicating lower pain relief) on the BPI item, dose adherence decreased by 2.88%. Pain levels and relief did not explain adherence rates among African Americans. Whites were also more likely to make decisions on analgesic use based on the amount of relief anticipated from the use of analgesics [13] whereas African Americans were more likely to make analgesic use decisions based on analgesic side effects.
Side Effects
In a pilot study that explored the intricacies of adherence, some individuals felt it was easier to deal with pain than with the side effects of pain medications. These individuals were also more likely to report forgetfulness and to stop taking medications if feeling “worse” [15]. One study, which included African-American and white cohorts, found that an increase in the severity of side effects was associated with lower adherence to analgesia for African Americans but not whites. Furthermore, African Americans reported a greater number of analgesic side effects at baseline. African Americans were also more likely to make analgesic decisions based on side effects in comparison to whites participants, who made decisions based on expectation of pain relief [13]. In a study with exclusively African-American patients, patients with concerns about pain medication possibly causing confusion were more likely to have poor adherence [4].
Type of Analgesic Prescribed
In the analyses, 3 studies found a difference between analgesic prescriptions among ethnic groups [12,13,16], 3 found that there was a statistical significance between type of prescription and adherence [4,13,16], and 2 studies [3,14] found no statistical correlation between type of analgesic prescribed and adherence.
In a study of African Americans and Hispanics, both groups took analgesics on an “as-needed” basis despite the guidelines for cancer pain management [16]. However, African Americans reported taking analgesics less than twice daily. Overall, only a small percentage of patients took sustained-release analgesics that require fewer doses per day [16]. Similarly, in another study that compared adherence between African Americans and whites, the overall analgesic adherence rate was different on sub-analysis for specific analgesic prescriptions. The analgesic adherence rates for African Americans ranged from 34% for weak opioids to 63% for long-acting opioids. In comparison, the analgesic adherence rates for whites ranged from 55% for weak opioids to 78% for long-acting opioids [13]. In conclusion, patients on long-acting opioids were more likely to have higher adherence. Adherence rates for African Americans were found in another study. The adherence rate for adjuvant analgesics was highest at 65%, step 2 opioids at 44% and step 3 opioids at 43% [4].
In a study with exclusively African-American patients, poor adherence was significantly correlated with step 3 opioids [4]. Another study that explored the correlation between type of analgesic and adherence found that intentional nonadherence was less likely in individuals that were prescribed step 3 opioids [15]. Specifically, individuals with this behavior were also more likely to report lower pain levels and chose to stop the use of analgesics when feeling better [15].
Within a pilot study that compared benefit programs and payor groups, the differences in the prescription of long-acting opiates did not reach statistical significance [3]. However, in the larger, definitive study, the comparison revealed that patients in the self-pay/charity care group were less likely to receive a prescription for long-acting opiates. The data further revealed that Hispanic and Asian patients were prescribed long-acting opiates at a lower rate compared to the larger sample. Further, African Americans and Caucasians were prescribed long-acting opiates at a higher rate than the larger sample. In another analysis, with benefits and race/ethnicity, benefits were the only statistically significant predictor. While statistically controlling for race/ethnicity, Medicaid patients were 2.4 times more likely to receive a prescription for long-acting opioids than the self-pay/charity care patients [14].
Income/Socioeconomic Status
Three studies in this analysis [3,13,14] found that income and socioeconomic status were significant predictors of analgesic adherence for cancer pain. In a comparison between African Americans and whites, income was the strongest predictor of analgesic adherence for cancer pain in African Americans [13]; specifically, individuals with a household income of less than $10,000 a year had a 41.83% lower percentage of dose adherence. Among whites, income did not have a significant correlation with analgesic rates [13].
A pilot study and larger definitive study [3,14] were conducted to compare the effects of prescription benefits. The prescription benefits included were Medicaid and self-pay/charity care. Through comparison, none of the Medicaid patients reported financial barriers but the self-pay/charity care patients were more likely to report financial barriers to adherence [3]. In the larger study, the findings indicated that there was significant association of adherence by benefits and race/ethnicity. As mentioned above, benefits were a dominant predictor of long acting opiate use and further adherence [14].
Gender
Apart from ethnicity or race as a variable associated with adherence, association of analgesic adherence and gender were observed in 4 studies [3,13–15] and evaluated in 2 studies. One study [4] found that a patient’s gender and education level did not correlate with adherence rates. However, in another study [12] men were more likely to deviate from the prescribed dose. Overall, within the entire cohort [12] men and minority patients were most likely to deviate from the prescribed dosing regimen in comparison to all other patient demographic factors.
Attitudes and Barriers
Five of the 7 studies investigated perceived barriers to analgesic adherence [3,4,13,15,16]. Four used the Barriers Questionnaire II (BQ-II) [18] to further understand patients’ beliefs about cancer pain management [3,12,13,15]. Using this validated tool, 1 study found that non-white individuals had higher scores on the BQ-II than white patients [12]. Within the non-white group in the above study, the mean score on the BQ-II for African Americans was 1.76 (± 0.81) and the mean score for “other” was 2.16 (± 0.93) [12]. Further, low MMAS scores were significantly associated with higher BQ-II scores. Similarly, higher BQ-II scores correlated with opioid deviation toward higher than prescribed dose [12].
Another study with a primarily African-American cohort did not use the BQ-II but asked specific questions in regards to perceived barriers to analgesics. Within the cohort, 87% reported a fear of addiction to pain medicine. Further, 77% had a fear of injection, 75% were concerned about a tolerance for analgesics, and side effects were a major concern. Overall, nausea was the greatest reported concern followed by potential for confusion, which was negatively associated with taking analgesics. Distracting the doctor from curing their illness was a predictor of improved adherence; however, individuals were more likely to take Tylenol for pain relief. Similarly, no significant barrier items affected adherence to NSAIDs. In relation to step 2 opioids, patients who felt it was important to be strong by not talking about pain were more likely to have better adherence [4]. Similar results with African Americans were identified in another study [13]. In the comparison between African Americans and whites, African Americans had more subjective barriers compared to whites. Particularly for African Americans, each unit increase in concern about distracting the doctor from curing the disease, the percentage of dose adherence decreased by 7.44 [13].
In a study that compared payer groups, a questionnaire elicited reasons for nonadherence [3]. Similar reasons for nonadherence emerged including financial, fear of addiction or increased medication use, and running out medication.
Behavioral History
Only 1 study used CAGE (Cut down, Annoyed, Guilty, and Eye-opener), an alcohol-screening questionnaire, to determine a possible relationship with analgesic adherence. In this study, there were 19 cases of opioid deviation, 16% of which were CAGE positive and had severe deviation toward less than the prescribed doses [12]. In further analysis, no association was found between CAGE positively and opioid deviation to higher intake [12]. Two other studies gathered data on history of depression, substance use, and alcohol use but no significant correlation was found [3,13].
Discussion
Previous literature has reported overall analgesic adherence rates among oncology patients ranging from 62% to 72% [23]. Factors at the provider and system level have been considered in past research, but the patient perspective is poorly represented in the literature [13]. A majority of studies on analgesic adherence have been completed with cohorts made up predominantly of white individuals [13,23,24], while others focus on racially homogenous and/or ethnically different populations in other countries [21,25,26].
This review confirms that there is a paucity of well-designed studies that describe the associations between racial and ethnic disparities and adherence to opioids among patients with cancer pain. This is despite the fact that moderate to severe cancer pain in the U.S. is managed mainly with analgesics and specifically with opioids [19]. In addition, cancer patients with health insurance have both more pharmacy claims as well as more claims for higher doses of opioids [20] compared to noncancer patients. The lack of attention to analgesic and opioid adherence among cancer patients is surprising in the light of the recent high-profile initiatives to reduce opioid misuse [31].
Multiple studies highlighted the importance of pain management education and adequate pain assessment for effective analgesic use [4,16]. In the study in the palliative care setting, the authors concluded that patients who are educated, counseled, and monitored by a palliative or supportive care team have less episodes of opioid deviation and trends toward lower opioid use [12]. A systematic review and meta-analysis confirmed findings that educational interventions for patients improved knowledge about cancer pain management, however, most did not improve reported adherence to analgesics [27,28]. These findings emphasize the need for further research on interventions to improve racial/ethnic disparities in analgesic adherence for cancer pain.
Limitations
The findings of this review should be evaluated in the context of the following limitations. First, adherence to a prescribed regimen is a difficult outcome to measure and a majority of studies in this review used subjective measures to assess analgesic adherence for cancer pain. Of note, self-report was the primary measurement employed. Studies in non–cancer pain settings that have evaluated various methodological approaches to adherence measurement found that patients are likely to over-report adherence when using self-report or a diary format in comparison to an electronic monitoring system. Only 1 study in this review used an objective measure of adherence [13]. Some previous studies contend that self-report in comparison to other, objective measurements of medication adherence are accurate [23]. Further research is needed to determine the most accurate measurement of analgesic adherence in cancer patients.
Also, invariably the studies employed an English-speaking sample, which excludes an understanding of analgesic adherence for cancer pain in linguistically diverse Americans. In addition, most studies included patients who were either white Americans or African Americans and some studies lumped several racial ethnic minority subgroups as “nonwhites” or “other.”
A majority of studies were cross-sectional [4,12,15,16]. For instance, studies used a 24-hour time period to assess ATC medication as well as as-needed regimens, which may not capture the information needed to understand adherence to as-needed regimens [4]. With longitudinal studies, a greater understanding of adherence can be determined. However, there is potential bias with studies that track patients primarily at follow-up appointments. Individuals who are compliant with follow-up appointments may present with different analgesic adherence compared to those who do not attend follow-up appointments. This potential bias should be evaluated in longitudinal studies with various sensitivity analyses or using tools that identify healthy user bias.
Most studies recruited patients from outpatient oncology clinics, however, 1 study was conducted with a sample from an outpatient supportive care center managed by a palliative care team [12]. Due to the goals of palliative care, which include specialized treatment for individuals with serious illness and a focus on symptom management and relief, patients in this setting may have a different attitude toward using opioids.
Conclusion
Although data remain limited, our review suggests that while overuse of opioids has been a well-cited concern in patients with chronic non-cancer pain [21,33], cancer patients demonstrate considerable underuse and inconsistent use of prescribed analgesics. This is important as a recent study found that inconsistent adherence to prescribed around-the-clock analgesics, specifically the interaction of strong opioids and inconsistent adherence, is a strong risk factor for hospitalization among cancer outpatients who are prescribed analgesics for pain [1]. Of note, adherence to opioids in patients with cancer may be driven by a unique set of factors and these factors may differ for minorities and non-minority patients. For instance, studies in this review indicate that income is a strong predictor of analgesic adherence for African Americans but not for whites. This is because race and socioeconomic status frequently overlap in the United States [29]. In addition, like cancer pain, analgesic side effects may also be poorly managed among African Americans and other minorities. For example, in 1 study, Meghani et al used a trade-off analysis technique (conjoint analysis) to understand trade-offs African Americans and whites employ in using analgesics for cancer pain [30]. The authors found that African Americans were more likely to make analgesic adherence decisions based on side effects whereas whites were more likely to make adherence decisions based on pain relief [30]. In subsequent analysis, these authors showed that the race effect found in their previous studies was mediated by the type of analgesics prescribed to African Americans vs. whites [31]. African Americans with cancer pain were prescribed analgesics that had a worse side effect profile after statistically adjusting for insurance type and clinical risks such as renal insufficiency [31].
Together, the available evidence indicates that both patients’ socioeconomic status and clinician treatment bias contributes to racial and ethnic disparities in analgesic adherence for cancer pain and subsequent cancer pain outcomes. Thus, future research should investigate interventions for improving analgesic adherence among low-income minorities. Also, there is a need for clinician-level interventions focusing on cognitive bias modification related to cancer pain and side effects management, which appears to relate to analgesic nonadherence among racial/ethnic minorities. In addition, further research is needed to (1) rigorously describe analgesic and opioid adherence for cancer pain, (2) elucidate racial/ethnic and other socioeconomic and clinical disparities in analgesic and opioid adherence for cancer pain; (3) and clarify the role of analgesic and opioid adherence for cancer patients including outcomes for the patients and the health care system.
Corresponding author: Salimah H. Meghani, PhD, MBE, RN, University of Pennsylvania School of Nursing, Room 337, Fagin Hall, 418 Curie Blvd, Philadelphia, PA 19104, [email protected].
Financial disclosures: None.
1. Dowell D, Haegerich TM, Chou R. CDC guideline for prescribing opioids for chronic pain - United States, 2016. JAMA 2016;315:1624–45.
2. Meghani SH, Knafl GJ. Patterns of analgesic adherence predict health care utilization among outpatients with cancer pain. Patient Prefer Adher 2016;10:81–98.
3. Bryan M, De La Rosa N, Hill AM, et al. Influence of prescription benefits on reported pain in cancer patients. Pain Med 2008;9:1148–57.
4. Rhee YO, Kim E, Kim B. Assessment of pain and analgesic use in African American cancer patients: Factors related to adherence to analgesics. J Immigr Minor Health 2012;14:1045–51.
5. Laird BJ, Scott AC, Colvin LA, et al. Pain, depression, and fatigue as a symptom cluster in advanced cancer. J Pain Symptom Manage 2011;42:1–11.
6. Ferreira KA, Kimura M, Teixeira MJ, et al. Impact of cancer-related symptom synergisms on health-related quality of life and performance status. J Pain Symptom Manage 2008;35:604–16.
7. Craig BM, Strassels SA. Out-of-pocket prices of opioid analgesics in the United States, 1999-2004. Pain Med 2010;11:240–47.
8. Institute of Medicine: Relieving pain in america: a blueprint for transforming prevention, care, education, and research. Washington, DC: National Academies Press; 2011.
9. Institutes of Medicine. Unequal treatment: confronting racial and ethnic disparities in health care. Washington, DC: National Academies Press; 2003.
10. Meghani SH, Byun E, Gallagher RM. Time to take stock: A meta-analysis and systematic review of analgesic treatment disparities for pain in the United States. Pain Med 2012;13:150–74.
11. Cleeland CS, Gonin R, Baez L, Loehrer P, Pandya KJ. Pain and treatment of pain in minority patients with cancer. The Eastern Cooperative Oncology Group Minority Outpatient Pain Study. Ann Intern Med 1997;127:813–6.
12. Nguyen LMT, Rhondali W, De la Cruz M, et al. Frequency and predictors of patient deviation from prescribed opioids and barriers to opioid pain management in patients with advanced cancer. J Pain Symptom Manage 2013;45:506–16.
13. Meghani SH, Thompson AML, Chittams J, et al. Adherence to analgesics for cancer pain: A comparative study of African Americans and whites using an electronic monitoring device. J Pain 2015;16:825–35.
14. Weider R, DeLaRosa N, Bryan M, et al. Prescription coverage in indigent patients affects the use of long acting opioids in management of cancer pain. Pain Med 2014;15:42–51.
15. Meghani SH, Brune DW. A pilot study to identify correlates of intentional versus unintentional nonadherence. Pain Manag Nurs 2013;14:e22-30.
16. Anderson KO, Mendoza TR, Valero V, et al. Minority cancer patients and their providers: pain management attitudes and practice. Cancer 2000;88:1929–38.
17. Downs SH, Black N. The feasibility of creating a checklist for the assessment of the methodological quality both of randomised and non-randomised studies of health care interventions. J Epidemiol Community Health 1998;52:377–84.
18. Ward SE, Goldberg N, Miller-McCauley V, et al. Patient-related barriers to management of cancer pain. Pain 1993;52:319–24.
19. Glare PA, Davies PS, Finlay E, et al. Pain in cancer survivors. J Clin Oncol 2014;32:1739–47.
20. van den Beuken-van Everdingen MH, de Rijke JM, Kessels AG, et al. Prevalence of pain in patients with cancer: a systematic review of the past 40 years. Ann Oncol 2007;18:1437–49.
21. Jacobsen R, Samsanaviciene J, Liubarskiene Z, et al. Barriers to cancer pain management in Danish and Lithuanian patients treated in pain and palliative care units. Pain Manag Nurs 2014; 15:51–8.
22. National Institutes of Health. Pathways to prevention: the role of opioids in the treatment of chronic pain. September 29–30, 2014. Executive summary: final report. Accessed 10 Sep 2015 at https://prevention.nih.gov/docs/programs/p2p/ODPPainPanelStatementFinal_10-02-14.pdf.
23. Miaskowski C, Dodd MJ, West C, et al. Lack of adherence with the analgesic regimen: A significant barrier to effective cancer pain management. J Clin Oncol 2001;19:4275–79.
24. Yoong J, Traeger LN, Gallagher ER, et al. A pilot study to investigate adherence to long-acting opioids among patients with advanced lung cancer. J Palliat Med 2013;16:391–6.
25. Lai YH, Keefe FJ, Sun WZ, et al. Relationship between pain-specific beliefs and adherence to analgesic regimens in Taiwanese cancer patients: A preliminary study. J Pain Symptom Manage 2002;24:415–22.
26. Cohen MZ, Musgrave CF, McGuire DB, et al. The cancer pain experience of Israeli adults 65 years and older: the influence of pain interference, symptom severity, and knowledge and attitudes on pain and pain control. Support Care Cancer 2005;13:708–14.
27. Bennett MI, Bagnall AM, Jose Closs S. How effective are patient-based educational interventions in the management of cancer pain? Systematic review and meta analysis. Pain 2009;143:192–9.
28. Oldenmenger WH, Sillevis Smitt PA, van Dooren S, et al. A systematic review on barriers hindering adequate cancer pain management and interventions to reduce them: a critical appraisal. Eur J Cancer 2009;45:1370–80.
29. Meghani SH, Chittams J. Controlling for socioeconomic status in pain disparities research: all-else-equal analysis when “all else” is not equal. Pain Med 2015;16:2222–5.
30. Meghani SH, Chittams J, Hanlon A, Curry J. Measuring preferences for analgesic treatment for cancer pain: how do African Americans and whites perform on choice-based conjoint analysis experiments? BMC Med Inform Decis Mak 2013;13:118.
31. Meghani SH, Kang Y, Chittams J, et al. African Americans with cancer pain are more likely to receive an analgesic with toxic metabolite despite clinical risks: a mediation analysis study. J Clin Oncol 2014;32:2773–9.
32. Dowell D, Haegerich TM, Chou R. CDC guideline for prescribing opioids forchronic pain - United States, 2016. MMWR Recomm Rep 2016 Mar 18;65:1–49.
33. Chapman CR, Lipschitz DL, Angst MS, et al. Opioid pharmacotherapy for chronic non-cancer pain in the United States: a research guideline for developing an evidence-base. J Pain 2010;11:807–29.
From the University of Pennsylvania School of Nursing, Philadelphia, PA.
Abstract
- Background: Racial/ethnic disparities in analgesic treatment for pain have been widely documented in the United States. However, the connection between race/ethnicity and adherence to prescribed analgesics has not been described.
- Objectives: To review and synthesize quantitative research documenting racial/ethnic differences in adherence to prescribed analgesia in cancer patients.
- Methods: We performed a systematic search of quantitative, primary studies in Scopus, CINAHL, PubMed, Ovid, PsychInfo, and EMBASE. The title and abstract of each article was reviewed for relevance and whether inclusion criteria were met. Evidence was examined for relevant outcomes, data collection methods, variables studied in relation to adherence, and the magnitude of association between race/ethnicity and adherence.
- Results: Seven studies met inclusion criteria. Reported rates of adherence varied in studies among Hispanic/Latinos, African Americans, Asians, and whites based on variation in measurement tools, research questions, populations from which participants were recruited, and predictive variables analyzed. Most existing studies of analgesic adherence used self-report to measure adherence. Only 1 study used a validated, real-time electronic instrument to monitor prescribed opioid adherence and had a longitudinal study design.
- Conclusion: Limited research has examined relationships between adherence to prescribed analgesic regimens and racial disparities. Existing studies point to the clinical and socioeconomic factors that may interact with race/ethnicity in explaining analgesic and opioid adherence outcomes in cancer patients.
Key words: race, ethnicity, adherence, opiates, analgesics, pain management, cancer, pain treatment disparities.
The ongoing opioid epidemic and recent development of the Centers for Disease Control and Prevention (CDC) guidelines for chronic pain management have shaped a national conversation on opioid prescription and utilization [1]. The CDC delineates provider recommendations for opioid prescription. This focus on prescribed medication regimens is inadequate without an understanding of how patients take or adhere to prescribed medications. Cancer patients are a unique group. Moderate to severe pain in cancer patients is usually treated with opioids, and adherence to analgesia has been conceptualized a key mediator of cancer pain outcomes. For instance, a recent study found that patterns of analgesic adherence, specifically, inconsistent adherence to strong opioids (World Health Organization step 3), is one of the strongest predictors of health care utilization among outpatients with cancer pain [2]. Approximately 67% to 77% of cancer patients experience pain that requires management with analgesia [3], especially in the absence of access to nonpharmacologic pain treatments [2]. Thus, barriers in relation to adequate pain management can result in poor pain treatment outcomes and impaired quality of life for cancer patients.
Insufficient pain management has been found to have a negative impact on the quality of life and physical and mental functions of patients with cancer [4]. Patients who experience severe cancer pain are significantly more likely to experience multiple other symptoms such as depression, fatigue, and insomnia, resulting in diminished physical function [5], social role function [6], and greater out of pocket cost of managing pain and asso-ciated symptoms [7]. Minority populations, however, disproportionately carry the burden of undertreated pain [4,8–11,13–16]. Evidence suggests that blacks/African Americans are more likely to experience unrelieved cancer pain [4,8–11,13–16]. They are also less likely than their white counterparts to receive analgesic treatment for cancer pain [8–11,13,15,16]. Little is known, however, about racial disparities in relation to adherence to analgesia for cancer pain when providers prescribe analgesics.
The purpose of this paper is to review the published literature that has addressed the associations between disparities and adherence to analgesia among cancer patients. Evidence was examined for outcomes studied, data collection methods, variables studied in relation to adherence, and the magnitude of association based on race and adherence.
Methods
We performed a systematic search of studies published between 1990 and the present in Scopus, CINAHL, PubMed, Ovid, PsychInfo, and the EMBASE databases. The inclusion criteria consisted of published articles in the aforementioned databases that were (1) set in the United States, (2) primary studies, (3) employed quantitative design, (4) assessed adherence or compliance to analgesics or adequacy of pain management using the Pain Management Index (PMI), (5) sample was exclusively minority or may have had a comparative group. The title and abstract of each article in the the search results was reviewed for relevance to study aims and inclusion and exclusion criteria, and any duplicates were eliminated. A total of 6 studies were found using this method (Table 1), and an additional study was found in the reference list of 1 of these 6.
Results
The 7 included studies were observational in nature; 4 were cross-sectional [4,12,15,16], 2 were retrospective [3,14], and 1 was prospective and used objective measures of analgesic adherence [13] (Table 2).
Defining and Operationalizing Adherence
Meghani and Bruner [16] point out that analgesic adherence is a “heterogeneous construct that lends itself to varied results and interpretations depending on the measurements used or dimensions studied.” Adherence to analgesia was explicitly defined in all 7 studies (Table 3). One study reported an adherence rate that was the total dose over 24 hours divided by the dose prescribed then multiplied by 100 [4]. The total dose over 24 hours was used in another study but was converted to an equianalgesic calculation [12]. Another set of studies used a similar definition but specified percentages based on medication or type of prescription, such as an around-the-clock(ATC) regimen [13,15,16]. In 2 studies, adherence was measured based on chart review of yes/no questions posed about whether or not patients had taken medications as prescribed [3,15].
The measurements of adherence differed between studies. Four studies [4,12,14,16] used adherence as a primary outcome and the rest employed adherence as a facet of pain management [3,13,15]. The most frequent measure of adherence was self-report. The widely validated Morisky Medication Adherence Scale (MMAS) instrument was used in 3 of 7 studies [12,13,15]. Meghani and Bruner [15] utilized the modified MMAS plus a previously validated visual analog scale for doses of medication to assess adherence over week- and month-long intervals. One study used patient interviews to capture self-reporting of opioid prescription and opioid use. Additionally, the study used MMAS to further characterize the adherence measurements [12]. Using a more objective method, Meghani et al [13] employed a microprocessor in the medication cap to determine the percentage of the total number of prescribed doses that were actually taken [13]. The processor sensed when the bottle was open, which served as a proxy for taking medications at appropriate times.
Analgesic Adherence Rate
To report the analgesic adherence rates, 6 studies presented a percentage [3,4,12,13,15] and all but 1 highlighted the barriers associated with poor adherence [3,4,12,13,15,16].
The results of a pilot study exploring intentional and unintentional adherence revealed that 85.5% of patients took the prescribed medications in the previous week. Further analysis using visual analogue scale for dose adherence found that that 51% took up to 60% of the prescribed medications [15]. In an exclusively African-American sample, the adherence rate was reported as 46% [4]. Another study by Meghani et al compared adherence to prescribed ATC analgesics between African Americans and whites with cancer-related pain using an electronic monitoring system [13]. The overall adherence rate for African Americans was 53% and 74% for whites [13]. The authors concluded that there was a significant difference between the analgesic adherence rates between African Americans and whites in this study. On sub-analysis, analgesic adherence rates for African Americans were much lower for weak opioids (34%) and higher for long-acting opioids (63%).
In a study of individuals from an outpatient supportive care center with a majority white sample (74% Caucasian), overall 9.6% of patients deviated from the opioid regimen, while approximately 90% reported high adherence [12]. It is important to note that a convenience sample was used here. Of the total 19 patients that deviated from the regimen, 11 used less opioids than prescribed and 8 used higher doses. Upon analysis, the opioid deviation was more frequent in males and non-whites. However, statistical analyses of the magnitude of deviation from prescribed dose and non-white racial/ethnic background were not reported. Within the “non-whites” category, the race/ethnicity is defined as African American (16%, n = 32) and “other” (9%, n = 18). The authors contend that this strong adherence resulted from a strong understanding of the regimen as evidenced by a high agreement between the prescribed dose and the patient reported prescription [12]. Nguyen et al [12] argue that the literature shows that lower adherence rates for minority patients may be explained by the presence of comorbidities and lack of insurance.
Two other studies reported adherence rates for separate insurance cohorts [3,14]. The Medicaid cohort was younger and had a higher percentage of African-American individuals. However, in the self-pay/charity care group, the majority was Hispanic [3]. In the pilot study, the differences between the groups on adherence with prescribed medication regimens did not achieve statistical significance. The data were summarized to suggest that nonadherence was more likely in the self-pay/charity care group and more follow-up visits occurred after discharge [3]. During the larger retrospective study there was no difference in number of patients adhering to the regimen at each follow-up visit in each benefit group. The study concluded that the long-acting opiate adherence was influenced only by the benefits of use and that race/ethnicity was not a statistically significant predictor [14].
Factors Associated with Adherence
Multiple studies investigated factors underlying reported analgesic adherence rates for the ethnic and racial groups studied. Both clinical and sociodemographic variables were associated with analgesic adherence (Table 4). These included cancer type and disease stage [3,4,13,14], pain intensity [3,4,13–16], side effects [13,15], type of analgesic prescribed [3,4,13–16], income/socioeconomic status [3,13,14], behavioral history [3,12,13], gender [3,4,12–16], and perceived barriers [3,4,13,15,16].
Cancer Type and Stage
Most studies did not find significant associations between analgesic adherence rates and cancer type and stage [3,12,14]. However, 1 study that sought to identify unique factors underlying analgesic adherence for African Americans and whites found that whites reported higher analgesic adherence in relation to “time since cancer diagnosis,” possibly indicating disease severity and progression [13]. In another study that involved a majority of African-American patients, individuals with colon and rectal cancer had lower adherence rates [4]. In this study, patients with colon and rectal cancer had more analgesic prescriptions (2.5 +/– 2.3 analgesics) compared to patients with other cancer diagnoses. The authors concluded that an increased medication burden might have contributed to a decreased adherence rate. Overall, other cancer types did not correlate with adherence rates [4].
Pain Intensity
Six studies examined pain intensity and duration [3,4,13–16]. Three studies found a difference in reported pain intensity between racial/ethnic groups [3,13,16], 1 found no correlation between pain intensity and race/ethnicity [14], and 3 concluded that pain intensity was a significant predictor of adherence rates [3,13,15].
Meghani and Bruner’s pilot study explored possible correlates associated with intentional and unintentional nonadherence [15]. Overall, individuals were more likely to report forgetfulness (unintentional nonadherence) and to stop taking pain medicine when feeling “worse” (intentional nonadherence) if they believed that it was easier to deal with pain than with the side effects of analgesia [15]. Further, forgetfulness was negatively associated with the need for “stronger” pain medication. Concern about using too much pain medication was positively correlated with both forgetfulness and carelessness. The need for stronger pain medication was also correlated with significantly higher pain levels and lower pain relief [15].
In a comparative study of African Americans and whites, African Americans reported greater cancer pain and lower pain relief on the Brief Pain Inventory (BPI) and had a negative PMI. The PMI measure is a simple index linking the usual severity of cancer pain with the category of medication prescribed to treat it. PMI is calculated by subtracting patient’s pain levels (“pain worst” score from the BPI coded as mild, moderate, or severe) from the most potent analgesia prescribed. A negative PMI implies inadequate analgesic prescription relative to the reported pain level. Pain intensity was a significant factor related to increased adherence in whites but not African Americans. For African Americans, analgesic adherence was predicted by socioeconomic status, provider communication factors, and side effects. Similarly, in another study that compared African Americans and Hispanics, African Americans were more likely to have a negative PMI than Hispanics and were less likely to report that pain medication relieved pain [16]. In a pilot study that compared Medicaid recipients to self-pay/charity care patients, African-American participants had lower reported pain scores than Hispanics and Caucasians [3]. In the larger follow-up study, however, ethnicity did not prove a significant predictor for pain levels [14].
In a study with exclusively African-American patients, a significant correlation was found between pain intensity and adherence; specifically, as intensity increased, adherence increased [4]. Results for the entire African-American cohort indicated that 90% of patients had analgesic prescriptions for cancer-related pain, but 86% continued to report having moderate to severe worst pain [4]. A study that compared African Americans and whites showed that lower pain relief with analgesics was associated with lower adherence to analgesia for cancer pain among whites [13]. For every unit increase in “least pain” scores (indicating lower pain relief) on the BPI item, dose adherence decreased by 2.88%. Pain levels and relief did not explain adherence rates among African Americans. Whites were also more likely to make decisions on analgesic use based on the amount of relief anticipated from the use of analgesics [13] whereas African Americans were more likely to make analgesic use decisions based on analgesic side effects.
Side Effects
In a pilot study that explored the intricacies of adherence, some individuals felt it was easier to deal with pain than with the side effects of pain medications. These individuals were also more likely to report forgetfulness and to stop taking medications if feeling “worse” [15]. One study, which included African-American and white cohorts, found that an increase in the severity of side effects was associated with lower adherence to analgesia for African Americans but not whites. Furthermore, African Americans reported a greater number of analgesic side effects at baseline. African Americans were also more likely to make analgesic decisions based on side effects in comparison to whites participants, who made decisions based on expectation of pain relief [13]. In a study with exclusively African-American patients, patients with concerns about pain medication possibly causing confusion were more likely to have poor adherence [4].
Type of Analgesic Prescribed
In the analyses, 3 studies found a difference between analgesic prescriptions among ethnic groups [12,13,16], 3 found that there was a statistical significance between type of prescription and adherence [4,13,16], and 2 studies [3,14] found no statistical correlation between type of analgesic prescribed and adherence.
In a study of African Americans and Hispanics, both groups took analgesics on an “as-needed” basis despite the guidelines for cancer pain management [16]. However, African Americans reported taking analgesics less than twice daily. Overall, only a small percentage of patients took sustained-release analgesics that require fewer doses per day [16]. Similarly, in another study that compared adherence between African Americans and whites, the overall analgesic adherence rate was different on sub-analysis for specific analgesic prescriptions. The analgesic adherence rates for African Americans ranged from 34% for weak opioids to 63% for long-acting opioids. In comparison, the analgesic adherence rates for whites ranged from 55% for weak opioids to 78% for long-acting opioids [13]. In conclusion, patients on long-acting opioids were more likely to have higher adherence. Adherence rates for African Americans were found in another study. The adherence rate for adjuvant analgesics was highest at 65%, step 2 opioids at 44% and step 3 opioids at 43% [4].
In a study with exclusively African-American patients, poor adherence was significantly correlated with step 3 opioids [4]. Another study that explored the correlation between type of analgesic and adherence found that intentional nonadherence was less likely in individuals that were prescribed step 3 opioids [15]. Specifically, individuals with this behavior were also more likely to report lower pain levels and chose to stop the use of analgesics when feeling better [15].
Within a pilot study that compared benefit programs and payor groups, the differences in the prescription of long-acting opiates did not reach statistical significance [3]. However, in the larger, definitive study, the comparison revealed that patients in the self-pay/charity care group were less likely to receive a prescription for long-acting opiates. The data further revealed that Hispanic and Asian patients were prescribed long-acting opiates at a lower rate compared to the larger sample. Further, African Americans and Caucasians were prescribed long-acting opiates at a higher rate than the larger sample. In another analysis, with benefits and race/ethnicity, benefits were the only statistically significant predictor. While statistically controlling for race/ethnicity, Medicaid patients were 2.4 times more likely to receive a prescription for long-acting opioids than the self-pay/charity care patients [14].
Income/Socioeconomic Status
Three studies in this analysis [3,13,14] found that income and socioeconomic status were significant predictors of analgesic adherence for cancer pain. In a comparison between African Americans and whites, income was the strongest predictor of analgesic adherence for cancer pain in African Americans [13]; specifically, individuals with a household income of less than $10,000 a year had a 41.83% lower percentage of dose adherence. Among whites, income did not have a significant correlation with analgesic rates [13].
A pilot study and larger definitive study [3,14] were conducted to compare the effects of prescription benefits. The prescription benefits included were Medicaid and self-pay/charity care. Through comparison, none of the Medicaid patients reported financial barriers but the self-pay/charity care patients were more likely to report financial barriers to adherence [3]. In the larger study, the findings indicated that there was significant association of adherence by benefits and race/ethnicity. As mentioned above, benefits were a dominant predictor of long acting opiate use and further adherence [14].
Gender
Apart from ethnicity or race as a variable associated with adherence, association of analgesic adherence and gender were observed in 4 studies [3,13–15] and evaluated in 2 studies. One study [4] found that a patient’s gender and education level did not correlate with adherence rates. However, in another study [12] men were more likely to deviate from the prescribed dose. Overall, within the entire cohort [12] men and minority patients were most likely to deviate from the prescribed dosing regimen in comparison to all other patient demographic factors.
Attitudes and Barriers
Five of the 7 studies investigated perceived barriers to analgesic adherence [3,4,13,15,16]. Four used the Barriers Questionnaire II (BQ-II) [18] to further understand patients’ beliefs about cancer pain management [3,12,13,15]. Using this validated tool, 1 study found that non-white individuals had higher scores on the BQ-II than white patients [12]. Within the non-white group in the above study, the mean score on the BQ-II for African Americans was 1.76 (± 0.81) and the mean score for “other” was 2.16 (± 0.93) [12]. Further, low MMAS scores were significantly associated with higher BQ-II scores. Similarly, higher BQ-II scores correlated with opioid deviation toward higher than prescribed dose [12].
Another study with a primarily African-American cohort did not use the BQ-II but asked specific questions in regards to perceived barriers to analgesics. Within the cohort, 87% reported a fear of addiction to pain medicine. Further, 77% had a fear of injection, 75% were concerned about a tolerance for analgesics, and side effects were a major concern. Overall, nausea was the greatest reported concern followed by potential for confusion, which was negatively associated with taking analgesics. Distracting the doctor from curing their illness was a predictor of improved adherence; however, individuals were more likely to take Tylenol for pain relief. Similarly, no significant barrier items affected adherence to NSAIDs. In relation to step 2 opioids, patients who felt it was important to be strong by not talking about pain were more likely to have better adherence [4]. Similar results with African Americans were identified in another study [13]. In the comparison between African Americans and whites, African Americans had more subjective barriers compared to whites. Particularly for African Americans, each unit increase in concern about distracting the doctor from curing the disease, the percentage of dose adherence decreased by 7.44 [13].
In a study that compared payer groups, a questionnaire elicited reasons for nonadherence [3]. Similar reasons for nonadherence emerged including financial, fear of addiction or increased medication use, and running out medication.
Behavioral History
Only 1 study used CAGE (Cut down, Annoyed, Guilty, and Eye-opener), an alcohol-screening questionnaire, to determine a possible relationship with analgesic adherence. In this study, there were 19 cases of opioid deviation, 16% of which were CAGE positive and had severe deviation toward less than the prescribed doses [12]. In further analysis, no association was found between CAGE positively and opioid deviation to higher intake [12]. Two other studies gathered data on history of depression, substance use, and alcohol use but no significant correlation was found [3,13].
Discussion
Previous literature has reported overall analgesic adherence rates among oncology patients ranging from 62% to 72% [23]. Factors at the provider and system level have been considered in past research, but the patient perspective is poorly represented in the literature [13]. A majority of studies on analgesic adherence have been completed with cohorts made up predominantly of white individuals [13,23,24], while others focus on racially homogenous and/or ethnically different populations in other countries [21,25,26].
This review confirms that there is a paucity of well-designed studies that describe the associations between racial and ethnic disparities and adherence to opioids among patients with cancer pain. This is despite the fact that moderate to severe cancer pain in the U.S. is managed mainly with analgesics and specifically with opioids [19]. In addition, cancer patients with health insurance have both more pharmacy claims as well as more claims for higher doses of opioids [20] compared to noncancer patients. The lack of attention to analgesic and opioid adherence among cancer patients is surprising in the light of the recent high-profile initiatives to reduce opioid misuse [31].
Multiple studies highlighted the importance of pain management education and adequate pain assessment for effective analgesic use [4,16]. In the study in the palliative care setting, the authors concluded that patients who are educated, counseled, and monitored by a palliative or supportive care team have less episodes of opioid deviation and trends toward lower opioid use [12]. A systematic review and meta-analysis confirmed findings that educational interventions for patients improved knowledge about cancer pain management, however, most did not improve reported adherence to analgesics [27,28]. These findings emphasize the need for further research on interventions to improve racial/ethnic disparities in analgesic adherence for cancer pain.
Limitations
The findings of this review should be evaluated in the context of the following limitations. First, adherence to a prescribed regimen is a difficult outcome to measure and a majority of studies in this review used subjective measures to assess analgesic adherence for cancer pain. Of note, self-report was the primary measurement employed. Studies in non–cancer pain settings that have evaluated various methodological approaches to adherence measurement found that patients are likely to over-report adherence when using self-report or a diary format in comparison to an electronic monitoring system. Only 1 study in this review used an objective measure of adherence [13]. Some previous studies contend that self-report in comparison to other, objective measurements of medication adherence are accurate [23]. Further research is needed to determine the most accurate measurement of analgesic adherence in cancer patients.
Also, invariably the studies employed an English-speaking sample, which excludes an understanding of analgesic adherence for cancer pain in linguistically diverse Americans. In addition, most studies included patients who were either white Americans or African Americans and some studies lumped several racial ethnic minority subgroups as “nonwhites” or “other.”
A majority of studies were cross-sectional [4,12,15,16]. For instance, studies used a 24-hour time period to assess ATC medication as well as as-needed regimens, which may not capture the information needed to understand adherence to as-needed regimens [4]. With longitudinal studies, a greater understanding of adherence can be determined. However, there is potential bias with studies that track patients primarily at follow-up appointments. Individuals who are compliant with follow-up appointments may present with different analgesic adherence compared to those who do not attend follow-up appointments. This potential bias should be evaluated in longitudinal studies with various sensitivity analyses or using tools that identify healthy user bias.
Most studies recruited patients from outpatient oncology clinics, however, 1 study was conducted with a sample from an outpatient supportive care center managed by a palliative care team [12]. Due to the goals of palliative care, which include specialized treatment for individuals with serious illness and a focus on symptom management and relief, patients in this setting may have a different attitude toward using opioids.
Conclusion
Although data remain limited, our review suggests that while overuse of opioids has been a well-cited concern in patients with chronic non-cancer pain [21,33], cancer patients demonstrate considerable underuse and inconsistent use of prescribed analgesics. This is important as a recent study found that inconsistent adherence to prescribed around-the-clock analgesics, specifically the interaction of strong opioids and inconsistent adherence, is a strong risk factor for hospitalization among cancer outpatients who are prescribed analgesics for pain [1]. Of note, adherence to opioids in patients with cancer may be driven by a unique set of factors and these factors may differ for minorities and non-minority patients. For instance, studies in this review indicate that income is a strong predictor of analgesic adherence for African Americans but not for whites. This is because race and socioeconomic status frequently overlap in the United States [29]. In addition, like cancer pain, analgesic side effects may also be poorly managed among African Americans and other minorities. For example, in 1 study, Meghani et al used a trade-off analysis technique (conjoint analysis) to understand trade-offs African Americans and whites employ in using analgesics for cancer pain [30]. The authors found that African Americans were more likely to make analgesic adherence decisions based on side effects whereas whites were more likely to make adherence decisions based on pain relief [30]. In subsequent analysis, these authors showed that the race effect found in their previous studies was mediated by the type of analgesics prescribed to African Americans vs. whites [31]. African Americans with cancer pain were prescribed analgesics that had a worse side effect profile after statistically adjusting for insurance type and clinical risks such as renal insufficiency [31].
Together, the available evidence indicates that both patients’ socioeconomic status and clinician treatment bias contributes to racial and ethnic disparities in analgesic adherence for cancer pain and subsequent cancer pain outcomes. Thus, future research should investigate interventions for improving analgesic adherence among low-income minorities. Also, there is a need for clinician-level interventions focusing on cognitive bias modification related to cancer pain and side effects management, which appears to relate to analgesic nonadherence among racial/ethnic minorities. In addition, further research is needed to (1) rigorously describe analgesic and opioid adherence for cancer pain, (2) elucidate racial/ethnic and other socioeconomic and clinical disparities in analgesic and opioid adherence for cancer pain; (3) and clarify the role of analgesic and opioid adherence for cancer patients including outcomes for the patients and the health care system.
Corresponding author: Salimah H. Meghani, PhD, MBE, RN, University of Pennsylvania School of Nursing, Room 337, Fagin Hall, 418 Curie Blvd, Philadelphia, PA 19104, [email protected].
Financial disclosures: None.
1. Dowell D, Haegerich TM, Chou R. CDC guideline for prescribing opioids for chronic pain - United States, 2016. JAMA 2016;315:1624–45.
2. Meghani SH, Knafl GJ. Patterns of analgesic adherence predict health care utilization among outpatients with cancer pain. Patient Prefer Adher 2016;10:81–98.
3. Bryan M, De La Rosa N, Hill AM, et al. Influence of prescription benefits on reported pain in cancer patients. Pain Med 2008;9:1148–57.
4. Rhee YO, Kim E, Kim B. Assessment of pain and analgesic use in African American cancer patients: Factors related to adherence to analgesics. J Immigr Minor Health 2012;14:1045–51.
5. Laird BJ, Scott AC, Colvin LA, et al. Pain, depression, and fatigue as a symptom cluster in advanced cancer. J Pain Symptom Manage 2011;42:1–11.
6. Ferreira KA, Kimura M, Teixeira MJ, et al. Impact of cancer-related symptom synergisms on health-related quality of life and performance status. J Pain Symptom Manage 2008;35:604–16.
7. Craig BM, Strassels SA. Out-of-pocket prices of opioid analgesics in the United States, 1999-2004. Pain Med 2010;11:240–47.
8. Institute of Medicine: Relieving pain in america: a blueprint for transforming prevention, care, education, and research. Washington, DC: National Academies Press; 2011.
9. Institutes of Medicine. Unequal treatment: confronting racial and ethnic disparities in health care. Washington, DC: National Academies Press; 2003.
10. Meghani SH, Byun E, Gallagher RM. Time to take stock: A meta-analysis and systematic review of analgesic treatment disparities for pain in the United States. Pain Med 2012;13:150–74.
11. Cleeland CS, Gonin R, Baez L, Loehrer P, Pandya KJ. Pain and treatment of pain in minority patients with cancer. The Eastern Cooperative Oncology Group Minority Outpatient Pain Study. Ann Intern Med 1997;127:813–6.
12. Nguyen LMT, Rhondali W, De la Cruz M, et al. Frequency and predictors of patient deviation from prescribed opioids and barriers to opioid pain management in patients with advanced cancer. J Pain Symptom Manage 2013;45:506–16.
13. Meghani SH, Thompson AML, Chittams J, et al. Adherence to analgesics for cancer pain: A comparative study of African Americans and whites using an electronic monitoring device. J Pain 2015;16:825–35.
14. Weider R, DeLaRosa N, Bryan M, et al. Prescription coverage in indigent patients affects the use of long acting opioids in management of cancer pain. Pain Med 2014;15:42–51.
15. Meghani SH, Brune DW. A pilot study to identify correlates of intentional versus unintentional nonadherence. Pain Manag Nurs 2013;14:e22-30.
16. Anderson KO, Mendoza TR, Valero V, et al. Minority cancer patients and their providers: pain management attitudes and practice. Cancer 2000;88:1929–38.
17. Downs SH, Black N. The feasibility of creating a checklist for the assessment of the methodological quality both of randomised and non-randomised studies of health care interventions. J Epidemiol Community Health 1998;52:377–84.
18. Ward SE, Goldberg N, Miller-McCauley V, et al. Patient-related barriers to management of cancer pain. Pain 1993;52:319–24.
19. Glare PA, Davies PS, Finlay E, et al. Pain in cancer survivors. J Clin Oncol 2014;32:1739–47.
20. van den Beuken-van Everdingen MH, de Rijke JM, Kessels AG, et al. Prevalence of pain in patients with cancer: a systematic review of the past 40 years. Ann Oncol 2007;18:1437–49.
21. Jacobsen R, Samsanaviciene J, Liubarskiene Z, et al. Barriers to cancer pain management in Danish and Lithuanian patients treated in pain and palliative care units. Pain Manag Nurs 2014; 15:51–8.
22. National Institutes of Health. Pathways to prevention: the role of opioids in the treatment of chronic pain. September 29–30, 2014. Executive summary: final report. Accessed 10 Sep 2015 at https://prevention.nih.gov/docs/programs/p2p/ODPPainPanelStatementFinal_10-02-14.pdf.
23. Miaskowski C, Dodd MJ, West C, et al. Lack of adherence with the analgesic regimen: A significant barrier to effective cancer pain management. J Clin Oncol 2001;19:4275–79.
24. Yoong J, Traeger LN, Gallagher ER, et al. A pilot study to investigate adherence to long-acting opioids among patients with advanced lung cancer. J Palliat Med 2013;16:391–6.
25. Lai YH, Keefe FJ, Sun WZ, et al. Relationship between pain-specific beliefs and adherence to analgesic regimens in Taiwanese cancer patients: A preliminary study. J Pain Symptom Manage 2002;24:415–22.
26. Cohen MZ, Musgrave CF, McGuire DB, et al. The cancer pain experience of Israeli adults 65 years and older: the influence of pain interference, symptom severity, and knowledge and attitudes on pain and pain control. Support Care Cancer 2005;13:708–14.
27. Bennett MI, Bagnall AM, Jose Closs S. How effective are patient-based educational interventions in the management of cancer pain? Systematic review and meta analysis. Pain 2009;143:192–9.
28. Oldenmenger WH, Sillevis Smitt PA, van Dooren S, et al. A systematic review on barriers hindering adequate cancer pain management and interventions to reduce them: a critical appraisal. Eur J Cancer 2009;45:1370–80.
29. Meghani SH, Chittams J. Controlling for socioeconomic status in pain disparities research: all-else-equal analysis when “all else” is not equal. Pain Med 2015;16:2222–5.
30. Meghani SH, Chittams J, Hanlon A, Curry J. Measuring preferences for analgesic treatment for cancer pain: how do African Americans and whites perform on choice-based conjoint analysis experiments? BMC Med Inform Decis Mak 2013;13:118.
31. Meghani SH, Kang Y, Chittams J, et al. African Americans with cancer pain are more likely to receive an analgesic with toxic metabolite despite clinical risks: a mediation analysis study. J Clin Oncol 2014;32:2773–9.
32. Dowell D, Haegerich TM, Chou R. CDC guideline for prescribing opioids forchronic pain - United States, 2016. MMWR Recomm Rep 2016 Mar 18;65:1–49.
33. Chapman CR, Lipschitz DL, Angst MS, et al. Opioid pharmacotherapy for chronic non-cancer pain in the United States: a research guideline for developing an evidence-base. J Pain 2010;11:807–29.