User login
Merkel Cell Carcinoma: A Review
Merkel cells originally were described by German histopathologist Friedrich Sigmund Merkel in 1875. These unique tactile cells were described as epidermal, nondendritic, and nonkeratinizing. Merkel cells are thought to arise from the neural crest and are believed to be primary neural cells found within the basal layer of the epidermis.1,2 They likely function primarily as slowly adapting type I mechanoreceptors. Origin from the neural crest is controversial, as other investigators have suggested derivation from epidermal keratinocytes.1,2 Tumor cells have been linked to the amine precursor uptake and decarboxylation system.3 In 1972, Toker4 described several cases of trabecular or sweat gland carcinomas of the skin. Upon further investigation, the cells that comprised these tumors were found to have dense core granules on electron microscopy, typical of Merkel cells.1,2 Other terms such as neuroendocrine carcinoma of the skin, small cell carcinoma of the skin, and anaplastic carcinoma of the skin have been used to describe Merkel cell carcinoma (MCC),1 which was suggested by De Wolf-Peeters et al5 in 1980.
Despite being a rare malignancy, MCC follows an aggressive clinical course. Upon presentation, approximately 66% of patients have local disease, 27% have nodal involvement, and 7% have distant metastasis.1 Future treatments will likely center around the novel Merkel cell polyomavirus (MCPyV) and modification of immune responses toward tumor cells. Standardization continues to be lacking in both staging and treatment of this aggressive tumor.
Epidemiology of MCC

| ||
Figure 1. A 2.3×1.5×1.2-cm, hemorrhagic, crusted, | ||
| ||
| ||
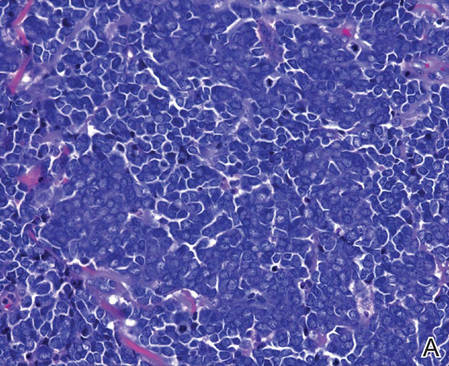
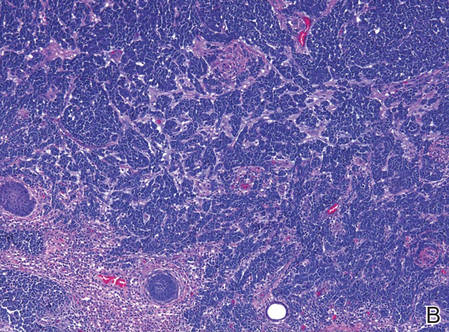
| Figure 2. Merkel cells are small- to medium-sized cells with round nuclei and scant cytoplasm. Granular or stippled chromatin can be seen (A)(H&E, original magnification ×40). Merkel cell carcinoma with trabecular pattern (B) (H&E, original magnification ×10). | ||
Between 1986 and 2006, the incidence of MCC grew substantially.1,2 Figures have been reported at 0.15 cases per 100,000 individuals to 0.6 cases per 100,000 individuals worldwide. In the United States, the age-adjusted incidence of MCC is estimated at 0.24 per 100,000 person-years, which is higher than the estimated 0.13 per 100,000 person-years found in Europe.3 The highest incidence worldwide has been noted in Western Australia, likely due to high levels of UV exposure.1 The incidence of MCC in psoriasis patients who are treated with oral methoxsalen (psoralen) and UVA photochemotherapy is 100 times greater than in the general population, further supporting the role of UV light in the development of MCC.1 White individuals have the highest incidence of MCC worldwide, with men being affected more frequently than women.1,3 The majority of patients with MCC are diagnosed at 70 years or older.1 Approximately 5% of reported MCC patients are diagnosed before 50 years of age.2 Immunosuppression and immunodeficiency likely play a role in the pathogenesis of MCC, and the incidence is increased in solid organ transplant recipients, most commonly renal transplant recipients,1 as well as individuals with chronic lymphocytic leukemia, human immunodeficiency virus infection, and AIDS.1,3 Patients with autoimmune diseases such as rheumatoid arthritis also are at increased risk for MCC.3 Individuals who are diagnosed with MCC are at an increased risk for development of other malignancies including nonmelanoma skin cancers, chronic lymphocytic leukemia, Hodgkin lymphoma, and non-Hodgkin lymphoma.3
Clinical Presentation of MCC
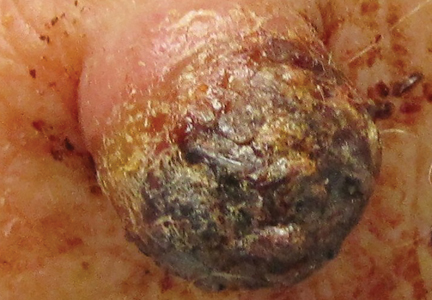
The clinical presentation of MCC can be variable. Most tumors present as firm, red to purple, nontender papules or nodules (Figure 1).1 Tumor size may range from 2 to 200 mm but is most commonly less than 20 mm.2 Growth can be rapid, and tumors are most commonly located on sun-exposed skin. The head and neck areas account for 48% of all MCC cases,1 with the eyelids being frequently involved.2 Merkel cell carcinoma also has been reported on the arms, legs, trunk, back, and buttocks.1 Non–sun-exposed areas are less commonly affected. Mucosal sites (eg, larynx, nasal cavity, pharynx, mouth) account for 5% of primary MCCs.1 Merkel cell carcinoma also has been reported to affect the vulva and penis. Subcutaneous primary MCC has presented without overlying epidermal changes.1 In a case series by Heath et al,6 14% (27/195) of MCC patients presented with nodal disease without any identifiable primary tumor, with the inguinal nodal chain being the most common for this presentation. It currently is not known whether these nodal tumors are primary tumors or metastatic disease with a regression of the primary tumor.1
|
Histopathology of MCC
| ||
| ||
| ||
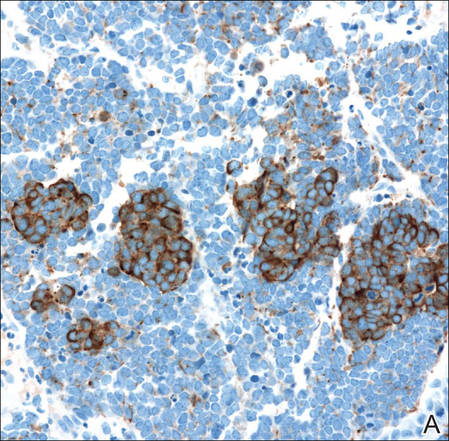
Figure 3. Positive chromogranin staining (A)(original | ||
Merkel cells are small- to medium-sized basophilic cells with round nuclei and scant cytoplasm. Granular or stippled chromatin can be seen on histopathology (Figure 2A).1 Some tumor cells have more vesicular chromatin, multiple small nucleoli, irregular contours, and more abundant cytoplasm. In some reports, irregular contours and abundant cytoplasm were associated with no detectible MCPyV infection.1,3 Merkel cell carcinomas have a primarily nodular architecture, and classification is based on growth pattern and cell size. Three histopathologic growth patterns have been described: nodular, infiltrative, and trabecular. The trabecular pattern is composed of interconnecting strands ofcells (Figure 2B). Tumors with solely intraepidermal involvement (MCC in situ) have been described but are exceedingly rare.1 Cell types are classified according to size, with the intermediate cell type being the most common. The small cell variant may be mistaken for a lymphocytic infiltrate due to the similar size and appearance of both types of cells.1,3
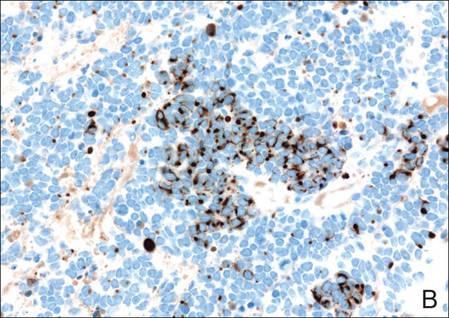
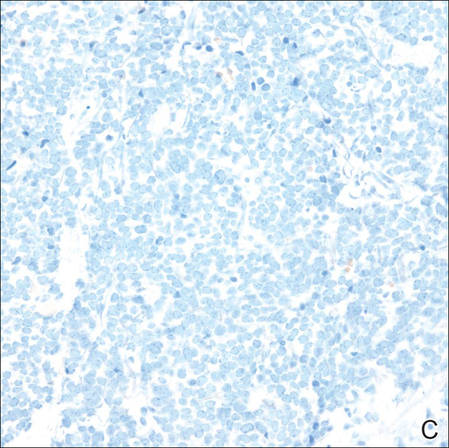
Merkel cell carcinomas can have histopathological overlap with lymphomas, small cell lung cancers, carcinoid tumors, primitive neuroectodermal tumors, neuroblastomas, small cell osteosarcomas, rhabdomyosarcomas, or Ewing sarcomas.1,3 Specifically, differentiation from small cell carcinoma of the lung is of utmost importance. Merkel cell carcinoma stains positively for cytokeratins 8, 18, 19, and 20. The neuroendocrine markers chromogranin (Figure 3A), synaptophysin, and neuron-specific enolase also may show positive staining. Cytokeratin 20, low-molecular-weight cytokeratins (CAM 5.2), and neurofilament immunostains have a high sensitivity for MCC and are the most frequently used.1 Cytokeratin 20 stains in the characteristic paranuclear dot–like pattern, which is a hallmark of MCC (Figure 3B). Cytokeratin 20 positivity in conjunction with negative staining for thyroid transcription factor 1 (Figure 3C) and cytokeratin 7 can aid in differentiation from small cell carcinoma of the lung.1,3
Pathogenesis of MCC
In 2008, Feng et al7 discovered a novel polyomavirus associated with the development of MCC. This novel polyomavirus, MCPyV, is found in approximately 80% of all cases of MCC. Seventeen members of the polyomavirus family have been identified, 9 of which have been found to infect humans, including BK virus, JC virus, WU, MCPyV, human polyomavirus 6, human polyomavirus 7, trichodysplasia spinulosa–associated polyomavirus, human polyomavirus 9, and Simian virus 40.1 Merkel cell polyomavirus infection is found in approximately 60% of the general population and exposure likely occurs early in life. The virus likely is transmitted through skin shedding and nasal secretions, though it also has been found in urine specimens.3 Currently, there is no evidence to suggest vertical viral transmission from mother to fetus.
Merkel cell polyomavirus is composed of early and late gene regions. The early gene region contains both large T antigen (LT) and small T antigen reading frames, which are necessary for viral replication.8 The late region is responsible for encoding viral proteins necessary for viral capsid assembly. Mutations found in viral protein 1 prevent formation of viral particles.9 Large T antigen is substantially overexpressed in MCC and is responsible for tumor suppression through retinoblastoma tumor suppressor protein. It also serves as a binding domain for both heat shock proteins and helicases.8,10 These domains allow the polyomaviruses to use host-cell machinery for viral genome replication while targeting tumor suppressor proteins.8 Upon viral integration into host DNA, viral replication ceases while oncogenic function persists.
The exact mechanism by which the MCPyV contributes to the development of MCC still has yet to be identified. Hypotheses suggest a combination of viral infection with external mutagens (eg, UV radiation). Experimental observations suggest viral contribution is likely due to the large percentage of MCCs that are positive for MCPyV, the identification of LT antigen expression and the role it plays in preserving cell cycle progression, and the role persistent LT antigen expression plays in continued growth of MCC cell lines in vitro.8 Two important cell line preservation mechanisms ensure continued tumor growth, including prevention of apoptosis triggered by DNA damage response mechanisms following UV damage and interaction with the retinoblastoma tumor suppressor protein allowing continued growth.8,11 Other important factors in tumor growth and survival may be the inhibition of apoptosis through the BCL2 (B-cell chronic lymphocytic leukemia/lymphoma 2) proto-oncogene and survivin (baculoviral inhibitor of apoptosis repeat-containing 5 [BIRC5]).12 Survivin has been found to play an important role in MCPyV-positive MCCs.12,13 It has been suggested that lymphangiogenesis in MCC likely is driven by vascular endothelial growth factor-C+CD68+CD163+ M2 macrophages.14 Another survival mechanism specific to polyomaviruses is their ability to interfere with the p53 tumor suppressor pathway.8 Loss of p53 expression by tumor cell nuclei has been associated with poor prognosis.15
Immune Response
Immune response as a role in tumor progression can be primarily centered on the concept of persistent antigen expression as a means of immune downregulation. Dunn et al16 suggested that cancer cells must interact through 3 consecutive phases with the host immune system (immunoediting hypothesis). In the elimination phase, the host immune system is able to recognize and destroy newly transformed cells through both the innate and adaptive immune systems. The second equilibrium phase allows the tumor to remain dormant and growth remains stagnant. Lastly, the tumor is allowed to evade the immune system through the escape phase.8
Host immune responses play an important role in both the progression and prognosis of MCC. High anti-MCPyV capsid antibody titers have been associated with better progression-free survival in some patients.8 Patients with high antibody titers (>10,000) likely have better progression-free survival than those with low antibody titers (<10,000).17 Antibody titers to the LT antigen may serve as a biomarker of MCC disease burden in the future. Rising LT antigen titers have been shown to correlate with disease progression and falling titers correlate with successful treatment.8 Tumoral infiltration of CD8+ T lymphocytes has been shown to be a predictor of survival compared to no intratumoral infiltration.6 Sihto et al18 suggested that this better prognosis from high intratumoral infiltration is not specific to MCPyV-positive MCC; however, it does highlight an important aspect of tumor evasion through the downregulation of cell surface expression of class I major histocompatibility complex antigens, which allows presentation of tumor intracellular peptides to CD8+ T lymphocytes.8 Upregulation of this specific immune response may play a role in the future treatment of MCC.
Staging and Prognosis
Due to the extremely aggressive nature of MCC, patients with local disease and tumors 2 cm or smaller in diameter have a 66% survival at 5 years.1,3 The 5-year survival rate for patients with local metastasis to regional lymph nodes ranges from 26% to 42%. Patients with distant metastasis have an 18% survival rate at 5 years.1,3 Data suggest that sentinel lymph node biopsy should be performed on all patients with MCC regardless of tumor size.1 There are no consensus guidelines to date regarding imaging for the staging of MCC patients. It is suggested that (18F)fluorodeoxyglucose positron emission tomography alone or in combination with computed tomography (CT) may be of value as a single whole-body diagnostic tool for accurate staging.10 It also has been suggested that (18F)fluorodeoxyglucose positron emission tomography and CT may offer more accurate staging than other screening modalities such as CT alone or magnetic resonance imaging.14,19
Treatment of MCC
Surgery remains the mainstay of treatment of MCC. Current National Comprehensive Cancer Network guidelines20 recommend 1- to 2-cm margins for wide local excision or treatment with Mohs micrographic surgery. Sentinel lymph node biopsy should be performed intraoperatively in patients undergoing wide local excision and preoperatively for patients undergoing Mohs micrographic surgery due to potential alterations in lymphatic drainage that may affect lymphoscintigraphy.1
Radiation may be used as primary or adjuvant therapy in patients with MCC. Radiation as primary therapy generally is reserved for patients who are not surgical candidates. It has been suggested that there was no difference in outcome in a small group of patients treated with radiation alone compared to patients who underwent surgery and radiation to the tumor bed.1 Current guidelines suggest a small group of patients may not require adjuvant therapy following adequate resection of some small tumors, and clinical observation may be appropriate.1,3 Chemotherapy may play a palliative role in patients with metastatic MCC. Merkel cell carcinoma has been shown to be chemosensitive but with a high recurrence rate.1 Because the immune system plays an important role in disease prognosis, having an intact immune system likely is paramount in the prevention of further disease progression.
Future Treatments of MCC
Future treatment of MCC may be focused on the viral etiology of most tumors and upregulation of the immune response, which may lead to the possibility of specifically interfering with virus-specific oncoproteins and stimulation of immune responses to virally infected tumor cells.8 The MCPyV large T antigen has been found to be overexpressed in some tumors and may serve as a specific target of therapy.10,21 Survivin, a key cell cycle protein encoded by LT antigen, may be an interesting target given its implication in other cancers.13 Other potential nonviral molecular target antigens include the oncoprotein H1P1 that interacts with c-KIT.8 Specific immunostimulatory cytokines that may be used to upregulate the immune response to tumoral cells may include IL-2, IL-12, IL-15, or IL-21. Therapeutic agents that may be studied in the future to target the immune exhaustion phenomenon associated with tumorigenesis include ipilimumab (cytotoxic T lymphocyte antigen 4 receptor-blocking agent) as well as programmed cell death 1 and programmed cell death 1 ligand 1 (PD-1/PD-L1).8 Neuroendocrine tumors including MCC tend to be highly vascular and express vascular endothelial growth factors and platelet-derived growth factors, which may be other potential therapeutic targets. It has been reported that approximately 95% of MCC patients have CD56+ tumors, and current clinical trials suggest a promising therapeutic response with the immunogen anti-CD56 monoclonal antibody.3
Conclusion
Merkel cell carcinoma is a rare aggressive neuroendocrine tumor that has been associated with a novel polyomavirus. Merkel cell carcinoma tends to affect elderly and immunocompromised patients as well as white individuals. Tumors are most often found in areas of high UV exposure and clinically on sun-exposed skin. Merkel cell polyomavirus is associated with approximately 80% of tumors, and tumorigenesis likely is caused by a number of sequential steps from viral integration into host DNA, mutagenic events, and specific immune responses. Currently there are no consensus guidelines for using imaging for staging of MCCs, but sentinel lymph node biopsy is recommended for all cases due to the aggressive nature of even smaller tumors. Surgery remains the mainstay of treatment, and radiation therapy may be used as a primary or adjuvant treatment. Chemotherapy usually is reserved for patients with metastatic disease purely for palliation. Future treatments of MCC likely will center on the viral etiology of MCC and upregulation of immune responses to virally infected tumor cells.
1. Han S, North J, Canavan T, et al. Merkel cell carcinoma. Hematol Oncol Clin N Am. 2012;26:1351-1374.
2. Goessling W, McKee P, Mayer R. Merkel cell carcinoma. J Clin Oncol. 2002;20:588-598.
3. Donepudi S, DeConti R, Samlowski W. Recent advances in the understanding of the genetics, etiology, and treatment of merkel cell carcinoma. Semin Oncol. 2012;39:163-172.
4. Toker C. Trabecular carcinoma of the skin. Arch Dermatol. 1972;105:107-110.
5. De Wolff-Peeters C, Marien K, Mebis J, et al. A cutaneous APUDoma or Merkel cell tumor? a morphologically recognizable tumor with a biological and histological malignant aspect in contrast with its clinical behavior. Cancer. 1980;46:810-816.
6. Heath M, Jaimes N, Lemos B, et al. Clinical characteristics of Merkel cell carcinoma at diagnosis in 195 patients: the AEIOU features. J Am Acad Dermatol. 2008;58:375-381.
7. Feng H, Shuda M, Chang Y, et al. Clonal integration of a polyomavirus in human Merkel cell carcinoma. Science. 2008;319:1096-1100.
8. Bhatia S, Afanasiev O, Nghiem P. Immunobiology of Merkel cell carcinoma: implications for immunotherapy of a polyomavirus-associated cancer. Curr Oncol Rep. 2011;13:488-497.
9. Amber K, McLeod M, Nouri K. The Merkel cell polyomavirus and its involvement in Merkel cell carcinoma. Dermatol Surg. 2013;39:232-238.
10. Erovic B, Al Habeeb A, Harris L, et al. Significant overexpression of the Merkel cell polyomavirus (MCPyV) large T antigen in Merkel cell carcinoma. Head Neck. 2013;35:184-189.
11. Demetriou S, Ona-Vu K, Sullivan E, et al. Defective DNA repair and cell cycle arrest in cells expressing Merkel cell polyomavirus T antigen. Int J Cancer. 2012;131:1818-1827.
12. Sahi H, Koljonen V, Kavola H, et al. Bcl-2 expression indicates better prognosis of Merkel cell carcinoma regardless of the presence of Merkel cell polyomavirus. Virchows Arch. 2012;461:553-559.
13. Arora R, Shuda M, Guastafierro A, et al. Survivin is a therapeutic target in Merkel cell carcinoma. Sci Transl Med. 2012;4:1-11.
14. Hawryluk E, O’Regan K, Sheehy N, et al. Positron emission tomography/computed tomography imaging in Merkel cell carcinoma: a study of 270 scans in 97 patients at the Dana-Farber/Brigham and Women’s Cancer Center. J Am Acad Dermatol. 2013;68:592-599.
15. Hall B, Pincus L, Yu S, et al. Immunohistochemical prognostication of Merkel cell carcinoma: p63 expression but not polyomavirus status correlates with outcome. J Cutan Pathol. 2012;39:911-917.
16. Dunn GP, Bruce AT, Ikeda H, et al. Cancer immunoediting: from immunosurveillance to tumor escape. Nat Immunol. 2002;3:991-998.
17. Touze A, Le Bidre E, Laude H, et al. High levels of antibodies against Merkel cell polyomavirus identify a subset of patients with Merkel cell carcinoma with better clinical outcome. J Clin Oncol. 2011;29:1612-1619.
18. Sihto H, Bohling T, Kavola H, et al. Tumor infiltrating immune cells and outcome of Merkel cell carcinoma: a population-based study. Clin Cancer Res. 2012;18:2872-2881.
19. Colgan M, Tarantola T, Weaver A, et al. The predictive value of imaging studies in evaluating regional lymph node involvement in Merkel cell carcinoma. J Am Acad Dermatol. 2012;67:1250-1256.
20. NCCN Clinical Practice Guidelines in Oncology. National Comprehensive Cancer Network website. http://www.nccn.org/professionals/physician_gls/f_guidelines.asp#site. Accessed March 22, 2016.
21. Angermeyer S, Hesbacher S, Becker J, et al. Merkel cell polyomavirus-positive Merkel cell carcinoma cells do not require expression of the viral small T antigen. J Invest Dermatol. 2013;133:1-6.
Merkel cells originally were described by German histopathologist Friedrich Sigmund Merkel in 1875. These unique tactile cells were described as epidermal, nondendritic, and nonkeratinizing. Merkel cells are thought to arise from the neural crest and are believed to be primary neural cells found within the basal layer of the epidermis.1,2 They likely function primarily as slowly adapting type I mechanoreceptors. Origin from the neural crest is controversial, as other investigators have suggested derivation from epidermal keratinocytes.1,2 Tumor cells have been linked to the amine precursor uptake and decarboxylation system.3 In 1972, Toker4 described several cases of trabecular or sweat gland carcinomas of the skin. Upon further investigation, the cells that comprised these tumors were found to have dense core granules on electron microscopy, typical of Merkel cells.1,2 Other terms such as neuroendocrine carcinoma of the skin, small cell carcinoma of the skin, and anaplastic carcinoma of the skin have been used to describe Merkel cell carcinoma (MCC),1 which was suggested by De Wolf-Peeters et al5 in 1980.
Despite being a rare malignancy, MCC follows an aggressive clinical course. Upon presentation, approximately 66% of patients have local disease, 27% have nodal involvement, and 7% have distant metastasis.1 Future treatments will likely center around the novel Merkel cell polyomavirus (MCPyV) and modification of immune responses toward tumor cells. Standardization continues to be lacking in both staging and treatment of this aggressive tumor.
Epidemiology of MCC
|
| ||
Figure 1. A 2.3×1.5×1.2-cm, hemorrhagic, crusted, | ||
|
| ||
|
| ||
| Figure 2. Merkel cells are small- to medium-sized cells with round nuclei and scant cytoplasm. Granular or stippled chromatin can be seen (A)(H&E, original magnification ×40). Merkel cell carcinoma with trabecular pattern (B) (H&E, original magnification ×10). | ||
Between 1986 and 2006, the incidence of MCC grew substantially.1,2 Figures have been reported at 0.15 cases per 100,000 individuals to 0.6 cases per 100,000 individuals worldwide. In the United States, the age-adjusted incidence of MCC is estimated at 0.24 per 100,000 person-years, which is higher than the estimated 0.13 per 100,000 person-years found in Europe.3 The highest incidence worldwide has been noted in Western Australia, likely due to high levels of UV exposure.1 The incidence of MCC in psoriasis patients who are treated with oral methoxsalen (psoralen) and UVA photochemotherapy is 100 times greater than in the general population, further supporting the role of UV light in the development of MCC.1 White individuals have the highest incidence of MCC worldwide, with men being affected more frequently than women.1,3 The majority of patients with MCC are diagnosed at 70 years or older.1 Approximately 5% of reported MCC patients are diagnosed before 50 years of age.2 Immunosuppression and immunodeficiency likely play a role in the pathogenesis of MCC, and the incidence is increased in solid organ transplant recipients, most commonly renal transplant recipients,1 as well as individuals with chronic lymphocytic leukemia, human immunodeficiency virus infection, and AIDS.1,3 Patients with autoimmune diseases such as rheumatoid arthritis also are at increased risk for MCC.3 Individuals who are diagnosed with MCC are at an increased risk for development of other malignancies including nonmelanoma skin cancers, chronic lymphocytic leukemia, Hodgkin lymphoma, and non-Hodgkin lymphoma.3
Clinical Presentation of MCC
The clinical presentation of MCC can be variable. Most tumors present as firm, red to purple, nontender papules or nodules (Figure 1).1 Tumor size may range from 2 to 200 mm but is most commonly less than 20 mm.2 Growth can be rapid, and tumors are most commonly located on sun-exposed skin. The head and neck areas account for 48% of all MCC cases,1 with the eyelids being frequently involved.2 Merkel cell carcinoma also has been reported on the arms, legs, trunk, back, and buttocks.1 Non–sun-exposed areas are less commonly affected. Mucosal sites (eg, larynx, nasal cavity, pharynx, mouth) account for 5% of primary MCCs.1 Merkel cell carcinoma also has been reported to affect the vulva and penis. Subcutaneous primary MCC has presented without overlying epidermal changes.1 In a case series by Heath et al,6 14% (27/195) of MCC patients presented with nodal disease without any identifiable primary tumor, with the inguinal nodal chain being the most common for this presentation. It currently is not known whether these nodal tumors are primary tumors or metastatic disease with a regression of the primary tumor.1
|
Histopathology of MCC
|
| ||
|
| ||
|
| ||
Figure 3. Positive chromogranin staining (A)(original | ||
Merkel cells are small- to medium-sized basophilic cells with round nuclei and scant cytoplasm. Granular or stippled chromatin can be seen on histopathology (Figure 2A).1 Some tumor cells have more vesicular chromatin, multiple small nucleoli, irregular contours, and more abundant cytoplasm. In some reports, irregular contours and abundant cytoplasm were associated with no detectible MCPyV infection.1,3 Merkel cell carcinomas have a primarily nodular architecture, and classification is based on growth pattern and cell size. Three histopathologic growth patterns have been described: nodular, infiltrative, and trabecular. The trabecular pattern is composed of interconnecting strands ofcells (Figure 2B). Tumors with solely intraepidermal involvement (MCC in situ) have been described but are exceedingly rare.1 Cell types are classified according to size, with the intermediate cell type being the most common. The small cell variant may be mistaken for a lymphocytic infiltrate due to the similar size and appearance of both types of cells.1,3
Merkel cell carcinomas can have histopathological overlap with lymphomas, small cell lung cancers, carcinoid tumors, primitive neuroectodermal tumors, neuroblastomas, small cell osteosarcomas, rhabdomyosarcomas, or Ewing sarcomas.1,3 Specifically, differentiation from small cell carcinoma of the lung is of utmost importance. Merkel cell carcinoma stains positively for cytokeratins 8, 18, 19, and 20. The neuroendocrine markers chromogranin (Figure 3A), synaptophysin, and neuron-specific enolase also may show positive staining. Cytokeratin 20, low-molecular-weight cytokeratins (CAM 5.2), and neurofilament immunostains have a high sensitivity for MCC and are the most frequently used.1 Cytokeratin 20 stains in the characteristic paranuclear dot–like pattern, which is a hallmark of MCC (Figure 3B). Cytokeratin 20 positivity in conjunction with negative staining for thyroid transcription factor 1 (Figure 3C) and cytokeratin 7 can aid in differentiation from small cell carcinoma of the lung.1,3
Pathogenesis of MCC
In 2008, Feng et al7 discovered a novel polyomavirus associated with the development of MCC. This novel polyomavirus, MCPyV, is found in approximately 80% of all cases of MCC. Seventeen members of the polyomavirus family have been identified, 9 of which have been found to infect humans, including BK virus, JC virus, WU, MCPyV, human polyomavirus 6, human polyomavirus 7, trichodysplasia spinulosa–associated polyomavirus, human polyomavirus 9, and Simian virus 40.1 Merkel cell polyomavirus infection is found in approximately 60% of the general population and exposure likely occurs early in life. The virus likely is transmitted through skin shedding and nasal secretions, though it also has been found in urine specimens.3 Currently, there is no evidence to suggest vertical viral transmission from mother to fetus.
Merkel cell polyomavirus is composed of early and late gene regions. The early gene region contains both large T antigen (LT) and small T antigen reading frames, which are necessary for viral replication.8 The late region is responsible for encoding viral proteins necessary for viral capsid assembly. Mutations found in viral protein 1 prevent formation of viral particles.9 Large T antigen is substantially overexpressed in MCC and is responsible for tumor suppression through retinoblastoma tumor suppressor protein. It also serves as a binding domain for both heat shock proteins and helicases.8,10 These domains allow the polyomaviruses to use host-cell machinery for viral genome replication while targeting tumor suppressor proteins.8 Upon viral integration into host DNA, viral replication ceases while oncogenic function persists.
The exact mechanism by which the MCPyV contributes to the development of MCC still has yet to be identified. Hypotheses suggest a combination of viral infection with external mutagens (eg, UV radiation). Experimental observations suggest viral contribution is likely due to the large percentage of MCCs that are positive for MCPyV, the identification of LT antigen expression and the role it plays in preserving cell cycle progression, and the role persistent LT antigen expression plays in continued growth of MCC cell lines in vitro.8 Two important cell line preservation mechanisms ensure continued tumor growth, including prevention of apoptosis triggered by DNA damage response mechanisms following UV damage and interaction with the retinoblastoma tumor suppressor protein allowing continued growth.8,11 Other important factors in tumor growth and survival may be the inhibition of apoptosis through the BCL2 (B-cell chronic lymphocytic leukemia/lymphoma 2) proto-oncogene and survivin (baculoviral inhibitor of apoptosis repeat-containing 5 [BIRC5]).12 Survivin has been found to play an important role in MCPyV-positive MCCs.12,13 It has been suggested that lymphangiogenesis in MCC likely is driven by vascular endothelial growth factor-C+CD68+CD163+ M2 macrophages.14 Another survival mechanism specific to polyomaviruses is their ability to interfere with the p53 tumor suppressor pathway.8 Loss of p53 expression by tumor cell nuclei has been associated with poor prognosis.15
Immune Response
Immune response as a role in tumor progression can be primarily centered on the concept of persistent antigen expression as a means of immune downregulation. Dunn et al16 suggested that cancer cells must interact through 3 consecutive phases with the host immune system (immunoediting hypothesis). In the elimination phase, the host immune system is able to recognize and destroy newly transformed cells through both the innate and adaptive immune systems. The second equilibrium phase allows the tumor to remain dormant and growth remains stagnant. Lastly, the tumor is allowed to evade the immune system through the escape phase.8
Host immune responses play an important role in both the progression and prognosis of MCC. High anti-MCPyV capsid antibody titers have been associated with better progression-free survival in some patients.8 Patients with high antibody titers (>10,000) likely have better progression-free survival than those with low antibody titers (<10,000).17 Antibody titers to the LT antigen may serve as a biomarker of MCC disease burden in the future. Rising LT antigen titers have been shown to correlate with disease progression and falling titers correlate with successful treatment.8 Tumoral infiltration of CD8+ T lymphocytes has been shown to be a predictor of survival compared to no intratumoral infiltration.6 Sihto et al18 suggested that this better prognosis from high intratumoral infiltration is not specific to MCPyV-positive MCC; however, it does highlight an important aspect of tumor evasion through the downregulation of cell surface expression of class I major histocompatibility complex antigens, which allows presentation of tumor intracellular peptides to CD8+ T lymphocytes.8 Upregulation of this specific immune response may play a role in the future treatment of MCC.
Staging and Prognosis
Due to the extremely aggressive nature of MCC, patients with local disease and tumors 2 cm or smaller in diameter have a 66% survival at 5 years.1,3 The 5-year survival rate for patients with local metastasis to regional lymph nodes ranges from 26% to 42%. Patients with distant metastasis have an 18% survival rate at 5 years.1,3 Data suggest that sentinel lymph node biopsy should be performed on all patients with MCC regardless of tumor size.1 There are no consensus guidelines to date regarding imaging for the staging of MCC patients. It is suggested that (18F)fluorodeoxyglucose positron emission tomography alone or in combination with computed tomography (CT) may be of value as a single whole-body diagnostic tool for accurate staging.10 It also has been suggested that (18F)fluorodeoxyglucose positron emission tomography and CT may offer more accurate staging than other screening modalities such as CT alone or magnetic resonance imaging.14,19
Treatment of MCC
Surgery remains the mainstay of treatment of MCC. Current National Comprehensive Cancer Network guidelines20 recommend 1- to 2-cm margins for wide local excision or treatment with Mohs micrographic surgery. Sentinel lymph node biopsy should be performed intraoperatively in patients undergoing wide local excision and preoperatively for patients undergoing Mohs micrographic surgery due to potential alterations in lymphatic drainage that may affect lymphoscintigraphy.1
Radiation may be used as primary or adjuvant therapy in patients with MCC. Radiation as primary therapy generally is reserved for patients who are not surgical candidates. It has been suggested that there was no difference in outcome in a small group of patients treated with radiation alone compared to patients who underwent surgery and radiation to the tumor bed.1 Current guidelines suggest a small group of patients may not require adjuvant therapy following adequate resection of some small tumors, and clinical observation may be appropriate.1,3 Chemotherapy may play a palliative role in patients with metastatic MCC. Merkel cell carcinoma has been shown to be chemosensitive but with a high recurrence rate.1 Because the immune system plays an important role in disease prognosis, having an intact immune system likely is paramount in the prevention of further disease progression.
Future Treatments of MCC
Future treatment of MCC may be focused on the viral etiology of most tumors and upregulation of the immune response, which may lead to the possibility of specifically interfering with virus-specific oncoproteins and stimulation of immune responses to virally infected tumor cells.8 The MCPyV large T antigen has been found to be overexpressed in some tumors and may serve as a specific target of therapy.10,21 Survivin, a key cell cycle protein encoded by LT antigen, may be an interesting target given its implication in other cancers.13 Other potential nonviral molecular target antigens include the oncoprotein H1P1 that interacts with c-KIT.8 Specific immunostimulatory cytokines that may be used to upregulate the immune response to tumoral cells may include IL-2, IL-12, IL-15, or IL-21. Therapeutic agents that may be studied in the future to target the immune exhaustion phenomenon associated with tumorigenesis include ipilimumab (cytotoxic T lymphocyte antigen 4 receptor-blocking agent) as well as programmed cell death 1 and programmed cell death 1 ligand 1 (PD-1/PD-L1).8 Neuroendocrine tumors including MCC tend to be highly vascular and express vascular endothelial growth factors and platelet-derived growth factors, which may be other potential therapeutic targets. It has been reported that approximately 95% of MCC patients have CD56+ tumors, and current clinical trials suggest a promising therapeutic response with the immunogen anti-CD56 monoclonal antibody.3
Conclusion
Merkel cell carcinoma is a rare aggressive neuroendocrine tumor that has been associated with a novel polyomavirus. Merkel cell carcinoma tends to affect elderly and immunocompromised patients as well as white individuals. Tumors are most often found in areas of high UV exposure and clinically on sun-exposed skin. Merkel cell polyomavirus is associated with approximately 80% of tumors, and tumorigenesis likely is caused by a number of sequential steps from viral integration into host DNA, mutagenic events, and specific immune responses. Currently there are no consensus guidelines for using imaging for staging of MCCs, but sentinel lymph node biopsy is recommended for all cases due to the aggressive nature of even smaller tumors. Surgery remains the mainstay of treatment, and radiation therapy may be used as a primary or adjuvant treatment. Chemotherapy usually is reserved for patients with metastatic disease purely for palliation. Future treatments of MCC likely will center on the viral etiology of MCC and upregulation of immune responses to virally infected tumor cells.
1. Han S, North J, Canavan T, et al. Merkel cell carcinoma. Hematol Oncol Clin N Am. 2012;26:1351-1374.
2. Goessling W, McKee P, Mayer R. Merkel cell carcinoma. J Clin Oncol. 2002;20:588-598.
3. Donepudi S, DeConti R, Samlowski W. Recent advances in the understanding of the genetics, etiology, and treatment of merkel cell carcinoma. Semin Oncol. 2012;39:163-172.
4. Toker C. Trabecular carcinoma of the skin. Arch Dermatol. 1972;105:107-110.
5. De Wolff-Peeters C, Marien K, Mebis J, et al. A cutaneous APUDoma or Merkel cell tumor? a morphologically recognizable tumor with a biological and histological malignant aspect in contrast with its clinical behavior. Cancer. 1980;46:810-816.
6. Heath M, Jaimes N, Lemos B, et al. Clinical characteristics of Merkel cell carcinoma at diagnosis in 195 patients: the AEIOU features. J Am Acad Dermatol. 2008;58:375-381.
7. Feng H, Shuda M, Chang Y, et al. Clonal integration of a polyomavirus in human Merkel cell carcinoma. Science. 2008;319:1096-1100.
8. Bhatia S, Afanasiev O, Nghiem P. Immunobiology of Merkel cell carcinoma: implications for immunotherapy of a polyomavirus-associated cancer. Curr Oncol Rep. 2011;13:488-497.
9. Amber K, McLeod M, Nouri K. The Merkel cell polyomavirus and its involvement in Merkel cell carcinoma. Dermatol Surg. 2013;39:232-238.
10. Erovic B, Al Habeeb A, Harris L, et al. Significant overexpression of the Merkel cell polyomavirus (MCPyV) large T antigen in Merkel cell carcinoma. Head Neck. 2013;35:184-189.
11. Demetriou S, Ona-Vu K, Sullivan E, et al. Defective DNA repair and cell cycle arrest in cells expressing Merkel cell polyomavirus T antigen. Int J Cancer. 2012;131:1818-1827.
12. Sahi H, Koljonen V, Kavola H, et al. Bcl-2 expression indicates better prognosis of Merkel cell carcinoma regardless of the presence of Merkel cell polyomavirus. Virchows Arch. 2012;461:553-559.
13. Arora R, Shuda M, Guastafierro A, et al. Survivin is a therapeutic target in Merkel cell carcinoma. Sci Transl Med. 2012;4:1-11.
14. Hawryluk E, O’Regan K, Sheehy N, et al. Positron emission tomography/computed tomography imaging in Merkel cell carcinoma: a study of 270 scans in 97 patients at the Dana-Farber/Brigham and Women’s Cancer Center. J Am Acad Dermatol. 2013;68:592-599.
15. Hall B, Pincus L, Yu S, et al. Immunohistochemical prognostication of Merkel cell carcinoma: p63 expression but not polyomavirus status correlates with outcome. J Cutan Pathol. 2012;39:911-917.
16. Dunn GP, Bruce AT, Ikeda H, et al. Cancer immunoediting: from immunosurveillance to tumor escape. Nat Immunol. 2002;3:991-998.
17. Touze A, Le Bidre E, Laude H, et al. High levels of antibodies against Merkel cell polyomavirus identify a subset of patients with Merkel cell carcinoma with better clinical outcome. J Clin Oncol. 2011;29:1612-1619.
18. Sihto H, Bohling T, Kavola H, et al. Tumor infiltrating immune cells and outcome of Merkel cell carcinoma: a population-based study. Clin Cancer Res. 2012;18:2872-2881.
19. Colgan M, Tarantola T, Weaver A, et al. The predictive value of imaging studies in evaluating regional lymph node involvement in Merkel cell carcinoma. J Am Acad Dermatol. 2012;67:1250-1256.
20. NCCN Clinical Practice Guidelines in Oncology. National Comprehensive Cancer Network website. http://www.nccn.org/professionals/physician_gls/f_guidelines.asp#site. Accessed March 22, 2016.
21. Angermeyer S, Hesbacher S, Becker J, et al. Merkel cell polyomavirus-positive Merkel cell carcinoma cells do not require expression of the viral small T antigen. J Invest Dermatol. 2013;133:1-6.
Practice Points
- Merkel cell carcinoma has been associated with a novel polyomavirus.
- Merkel cell carcinoma follows a very aggressive course and is most likely metastatic at diagnosis.
Calcium-Containing Crystal-Associated Arthropathies in the Elderly
Calcium pyrophosphate (CPP) crystals may deposit in both articular tissues (predominantly hyaline cartilage and fibrocartilage) and periarticular soft tissues.1,2 Calcium pyrophosphate deposition disease (CPPD) may be asymptomatic or be associated with a spectrum of clinical syndromes, including both acute and chronic inflammatory arthritis.2
The European League Against Rheumatism (EULAR) recently suggested changes in CPPD terminology.2 According to the new EULAR classification, pseudogout, or CPPD, has been reclassified based on new key terms that include several of the previously described disease phenotypes: asymptomatic CPPD; acute CPP crystal arthritis (previously known as pseudogout); osteoarthritis (OA) with CPPD (previously, pseudo-OA); and the chronic CCP crystal inflammatory arthritis (previously, pseudorheumatoid arthritis). In similar fashion, chondrocalcinosis (CC) refers to calcification of the fibrocartilage and/or hyaline cartilage identified by imaging or histologic analysis. Although CC is most commonly seen in CPPD, it is not exclusive to this disease, as it can be seen in other crystal diseases (oxalosis, basic calcium phosphate [BCP]) and can appear as casual finding or coexist with OA.2
Clinical Manifestations
In clinical practice, CPPD may present with several phenotypic forms. In asymptomatic CPPD, CC is a common radiographic finding without clinical symptoms. Acute CPP arthritis always should be suspected in any patient aged > 65 years presenting with acute monoarticular or oligoarticular, migratory or additive, symmetrical, or polyarticular arthritis.3 Acute CCP arthritis is characterized by self-limited acute or subacute attacks of arthritis involving 1 or several extremity joints (knees, wrists, ankles; rarely affects large toe). Typically, the acute attacks last 7 to 10 days. Several unusual sites (eg, the hip joints, trochanteric bursa, and deep spinal joints) also may be affected. However, differences in pattern of joint involvement are insufficient to permit definitive diagnosis without demonstration of the specific crystal type in the inflammatory joint fluid.
Pseudogout attacks closely resemble gouty arthritis; CPPD presents as intermittent flares and often is asymptomatic between flares. Trauma, surgery, or severe medical illness frequently provokes attacks of monosodium urate (MSU) as well as acute CPP arthritis. Systemic findings, such as fever; leukocytosis with a left shift in the differential count; inflammatory markers, such as elevated sedimentation rate (ESR); or C-reactive protein, also can occur, resembling pyogenic arthritis, osteomyelitis, and/or systemic sepsis in the elderly patient.
Diagnosis must be confirmed with aspiration, Gram stain and cultures of the synovial fluid, and evaluation for the presence of CPP crystals under polarized light microscopy.2 The diagnosis can be difficult to confirm secondary to the weakly birefringent nature of CPP crystals.4 Coexistence of MSU and CPP crystals in a single inflammatory effusion is neither uncommon nor unexplained given increased frequencies of both hyperuricemia/gout and CC among elderly patients.5
Chronic CPP crystal inflammatory arthritis may present as a chronic, symmetrical, bilateral, and deforming polyarthritis. It frequently affects the wrists and metacarpophalangeal joints and tendon sheaths. Chronic CPP may resemble rheumatoid arthritis (RA) and produce wrist tenosynovitis, which may manifest as carpal tunnel syndrome and/or cubital tunnel syndrome. Calcium pyrophosphate deposition disease should be on the differential diagnosis in the elderly patient presenting with a clinical picture that resembles “seronegative” RA, with morning stiffness, synovial thickening, localized edema, and restricted motion due to active inflammation or flexion contracture of the hands/wrist. It may present with prominent systemic features, such as leukocytosis, fevers, mental confusion, and inflammatory oligoarthritis or polyarthritis. The diagnosis of CPPD still may be possible even though the rheumatoid factor (RF) is positive, given the increasing likelihood of elevated RF in the older population. In this setting, aspiration of joint fluid and radiography will assist in clarification of the diagnosis. Furthermore, CPPD typically does not cause the type of erosive disease that is often seen in RA.
Calcium pyrophosphate deposition disease also can mimic polymyalgia rheumatica (PMR). A direct comparison of a cohort of patients with pseudo-PMR (PMR/CPPD) with actual PMR patients found that increased age at diagnosis, presence of knee osteoarthritis, tendinous calcifications, and ankle arthritis carried the highest predictive value in patients with CPPD presenting with PMR-like symptoms.6 However, the PMR/CPPD variant can be difficult to distinguish, because both conditions can have elevated systemic inflammatory markers, and both are steroid responsive.
Calcium pyrophosphate deposition disease involving a single joint can rarely lead to extensive destruction—as with neuropathic joints in the absence of any neurologic deficits—and is extremely debilitating. This presentation is not well understood and does not have good treatment alternatives. Calcium pyrophosphate crystals often are associated with manifestations of OA.1,2 Indeed, up to 20% of OA joints have been found to be positive for CPP crystals in various studies. Given the extensive evidence supporting treatment of OA, usually they are treated in a similar fashion with good results. Occasionally, these will have unusual manifestations for typical OA, such as involvement of wrists and metacarpophalangeal joints; however, the presentation is often indolent like OA.
Calcium pyrophosphate crystal deposition involving the spine has been associated with a number of clinical manifestations. Spine stiffness, sometimes associated with bony ankylosis, can resemble ankylosing spondylitis or diffuse idiopathic skeletal hyperostosis. Such symptoms are seen more commonly in familial CPPD rather than in the elderly. However, crystal deposition in the ligamentum flavum at the cervical spine levels has been associated with a condition called crowned dens syndrome.7 Although mostly asymptomatic, it may be present with acute neck pain, fever, and an increased ESR, sometimes mimicking PMR or giant cell arteritis or neurologic symptoms. Similarly, CPP crystal deposition in the posterior longitudinal ligament at the lower levels of the spine may lead to spinal cord compression syndromes or symptoms of either acute nerve compression or chronic spinal stenosis.8,9 Calcium pyrophosphate crystal deposition also can occur in other soft tissues, such as bursae, ligaments, and tendons and may be sufficient to cause local nerve compression, such as carpal or cubital tunnel syndrome.
Epidemiology
Radiographic surveys of the knees, hands, wrists, and pelvis and epidemiologic studies have demonstrated an age-related increase in the prevalence of CPPD: 15% prevalence in patients aged 65 to 74 years, 36% prevalence in patients aged 75 to 84 years, and 50% prevalence in patients aged > 84 years.10 In a recent radiographic study, 40% of patients with CPPD did not present with CC of the knee, and the study’s authors recommended additional radiographs of pelvis, wrists, or hands for accurate diagnosis of radiographic CC.11
Diagnosis
Accurate diagnosis should be achieved on the basis of the clinical picture and demonstration of CPP crystals in synovial fluid or tissue by compensated polarized light microscopy (Figures 1A and 1B).2 The sensitivity and specificity for CPP crystal detection has been shown to be 95.9% and 86.5%, respectively.12 However, the CPP crystal is more readily identified by a rheumatologist rather than in a standard hospital laboratory, which misses 30% of CPP crystals.13
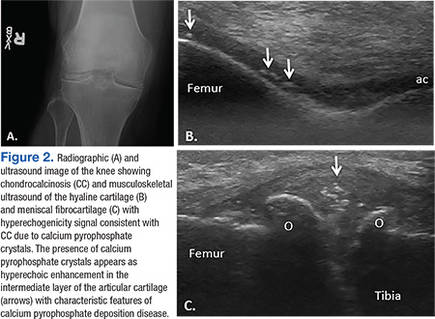
Findings of CC on radiograph strengthens a CPPD diagnosis, but its absence does not rule it out (Figure 2A).2 More recently, the use of new imaging modalities, such as musculoskeletal ultrasound, provides the capacity to visualize crystal deposits within the joint structures, the hyaline cartilage, and/or fibrocartilage (Figure 2B and 2C).14 The presence of hyperechoic bands within the intermediate layer hyaline cartilage and hyperechoic spots in fibrocartilage are consistent with CPP crystal deposits.2,14 The use of computed tomography is the gold standard imaging modality for the identification of CPPD of the spine.15 There is not enough evidence to support the use of magnetic resonance imaging in CPPD, but it may play a role in rare complications.2
Treatment
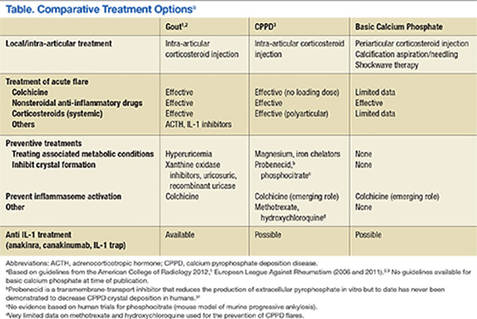
The EULAR recently defined new guidelines for the management of CPPD.16 Asymptomatic CPPD needs no treatment.In other CPPD phenotypes, the goals are to attempt prompt resolution of the acute synovitis, reduction in chronic damage, and management of associated conditions.In acute attacks, treatment modalities used in gout are often required; however, data for CPPD treatment are limited (Table). Treatment relies on the use of colchicine and nonsteroidal anti-inflammatory drugs (NSAIDs), but toxicity and comorbidities in the elderly limit the usage of these drugs.
Given increased renal impairment, the loading dose of colchicine is not recommended.16 Colchicine has recently been shown to completely block crystal-induced maturation of IL-1β in vitro, indicating that the drug acts upstream of inflammasome activation.17 This is in addition to the well-known role of colchicine in inhibition of micro-tubule formation, which likely leads to prevention of cell migration, phagocytosis, and activation of inflammasome.18-20
Intra-articular injection of corticosteroid is an efficient and well-tolerated treatment alternative for monoarticular CPP flares. Oral or parenteral corticosteroids are frequently used for polyarticular flares in particular for those patients in which NSAIDs and colchicine are contraindicated.16 Parenteral adrenocorticotropic hormone has been used in patients with congestive heart failure, renal insufficiency, gastrointestinal bleeding, or resistance to NSAIDs.21 For prophylaxis of acute CPP crystal arthritis, a low dose of oral NSAIDs, oral colchicine, or prednisone may be used with good results.16 In chronic CPP arthritis, continuous use of colchicine, NSAIDs, or low-dose prednisone is often appropriate. If these interventions are ineffective or contraindicated, using hydroxychloroquine (HCQ) and methotrexate (MTX) have been successfully used to control chronic CPP crystal inflammation.22,23 Recent trials have raised questions about MTX, and further trials on HCQ usage are underway.24 Biologic agents targeting IL-1 are not currently approved for the treatment of CPPD, but there are suggestions that it may be effective in refractory cases and induce rapid stable remissions after 3 days of therapy.25
In contrast to gout, there is no specific target therapy for lowering CPP crystal load in the elderly. Crucial in the management of CPPD in the elderly is the search for associated diseases, such as hyperparathyroidism, hemochromatosis, hypomagnesemia, and hypophosphatemia, as well as avoidance of tacrolimus, which facilitates or causes CC.16 Correction of the underlying metabolic disorder, especially when undertaken early, may reduce the severity of CPPD. However, there is little evidence to suggest that treatment of associated disease results in resolution of CPPD—most famously, although therapeutic phlebotomy does not help in hemochromatosis for prevention of crystal disease, chelating agents do seem to be moderately effective.26 Only oral administration of magnesium has shown a reduction in meniscal CC in a patient with CPPD arthropathy.27 In addition, this was in the setting of familial hypomagnesemia associated CPPD. However, unlike uricosuric agents for gout, no pharmacologic treatments can prevent CPPD crystal formation and deposition in tissues.
Therapeutic Agents
Magnesium
Magnesium is a cofactor for the activity of pyrophosphatases that converts inorganic pyrophosphates (PPis) into orthophosphates. In addition, magnesium can increase the solubility of CPP crystals. Early detection and management of hypomagnesemia are recommended, because it occurs in patients who have well-defined conditions and situations: Gitelman syndrome, thiazide and loop diuretics use, tacrolimus use, familial forms of renal magnesium wasting or use of proton pump inhibitors, short bowel syndrome, and intestinal failure in patients receiving home parenteral nutrition. Long-term administration of magnesium in some patients with chronic hypomagnesemia decreased meniscal calcification.27-29
Dietary Calcium
Epidemiologic studies showed a lower incidence of CC in Chinese subjects. The authors of the study speculate that this lower prevalence of CPPD could result from high levels of calcium found in the drinking water in Beijing, which may affect parathyroid hormone secretion.30 Further studies are needed to confirm this hypothesis, as it could be a cheaper approach to pseudogout prevention.
Probenecid
Probenecid is an in vitro inhibitor of the transmembrane PPi transporter thought to possibly prevent extracellular PPi elaboration. However, this observation has not been confirmed by either case reports or clinical trials.31
Phosphocitrate
Phosphocitrate acts directly on preventing crystal deposition in tissues in CPPD as well as BCP based on in vitro evidence and mouse models.32,33
Hyaluronan
An amelioration of pain and increased range of motion were observed in radiographic CC with OA.34 However, it is associated with increased acute CPP arthritis.35
Radiosynovectomy
In a double-blind study of 15 patients with symmetrical CPPD arthropathy, the knee that underwent intra-articular injection of yttrium-90 (5 mCi) plus steroid had less pain, stiffness, joint line tenderness, and effusion compared with the contralateral control knee injected with saline and steroids.36
Precipitators of Acute Pseudogout
Diuretics are known to exacerbate gout, but they also can exacerbate pseudogout. A recent case-control study nested within a United Kingdom general practice database found that loop diuretics rather than hydrochlorothiazide was associated with increased risk of CPPD mediated primarily by magnesium reabsorption in the loop of Henle.28 Chronic kidney disease associated with secondary and tertiary hyperparathyroidism increases calcium or PPi concentration, which leads to CPP-crystal deposition.
In addition, multiple case reports have described acute pseudogout caused by bisphosphonate administration for osteoporosis or Paget disease—more likely in the elderly population. Intravenous pamidronate, oral etidronate, and alendronate therapy have all been described in the elderly.37 The overall mechanism behind this link is not completely understood, but bisphosphonates are structurally similar to PPi. Pseudogout attacks also have been described in neutropenic patients undergoing treatment with granulocyte-colony stimulating factor.38 In addition to pharmaceutical exacerbation of pseudogout, surgical procedures and trauma can precipitate attacks. Joint lavage has been described to increase the incidence of pseudogout.39 It was hypothesized that joint lavage with fluid induced “crystal shedding” from CPPD crystals imbedded in the joint tissue. Patients who underwent meniscectomy of the knee 20 years ago had a 20% incidence of CC in the knee that was operated compared with 4% CC in the contralateral nonoperated knee.40 Overall, the surgery most linked with a pseudogout attack, however, is parathyroidectomy.41
Basic Calcium Phosphate Crystals
Basic calcium phosphate crystals are common but rarely diagnosed due to the cumbersome and expensive methods required to identify these crystals.42 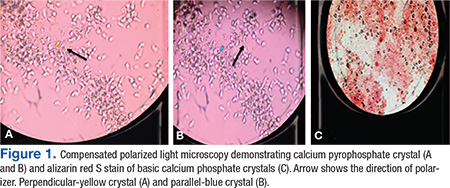
Basic calcium phosphate and CPPD crystals may coexist in synovial fluid. Similar to CPPD, BCP crystal disease is often concurrent with OA and can cause calcification of articular cartilage. Basic calcium phosphate is more common than CPP crystals with occurrence of 30% to 50% in OA synovial fluid.42 Additionally, BCP crystal disease has been linked to increased severity of OA. Basic calcium phosphate crystals in knee joints were found to have radiographically more severe arthritis with larger effusions.44,45 Similarly, BCP crystals in OA synovial fluid correlated with higher Kellgreen-Lawrence grade scores by radiography.42,46
It is currently believed that BCP crystals are continuously formed in the extracellular matrix, and their deposition is actively prevented by PPi present in the matrix.47 Elevated PPi levels, on the other hand, favor the formation of CPP crystals.48 The clinical upshot seems to be that although CPP crystals are almost universally intra-articular and released by chondrocytes, BCD crystals and deposits are more frequently present in soft tissues.
Acute Calcific Tendinitis
Typically, this type of tendinitis involves the shoulder joint and is extra-articular. Common treatments help, including NSAIDs, intra-articular steroids, ice, and rest. In addition, high-energy extracorporeal shock wave therapy has been shown to be effective when used with conscious sedation.49,50 Needling or barbotage in association with lavage and steroid injections also is effective and has occasionally been shown to reduce the size of the calcium deposit as well, often in combination with IV drugs like ethylenediaminetetraacetic acid.51-53
Acute calcific periarthritis of the hand presents similar to gout or pseudogout, affecting the wrist, usually in postmenopausal women.54 Basic calcium phosphate crystals are aspirated from the joint, and periarticular crystals may be subtle. Local steroid injections are beneficial.Milwaukee shoulder syndrome is an arthropathy associated with BCP crystals in the joint fluid and results in extensive destruction of shoulder articular cartilage and surrounding tissues. It is commonly bilateral and occurs in elderly women more often than it does in men.55 Aspiration of the shoulder joint typically reveals a serosanginous fluid. Fluid samples can be assessed for hydroxyapatite crystals by staining with alizarin red dye, which produces a characteristic “halo” or orange-red stain by light microscopy.43 Surgical treatment of Milwaukee shoulder syndrome is difficult due to increased age of the population affected and the severity of the shoulder destruction. Usually a conservative approach of analgesics, recurrent shoulder aspirations, and steroid injections is the best treatment option.
Conclusions
Calcium-containing crystal-associated arthropathies are a complex array of entities that target the veteran elderly population with increasing frequency. Challenges still remain in the diagnosis, crystal identification, and treatment due to coexisting comorbid conditions and polypharmacy commonly seen in veterans. Overall morbidity associated with calcium-containing crystal-associated arthropathies and the coexisting osteoarthritis is great, and focused identification of the disease process with tailored treatment can achieve the goal of decreasing symptoms and improving quality of life.
Acknowledgements
This work was supported by grant P20GM104937 (A.M.R.).
1. Guerne PA, Terkeltaub R. Clinical Features, Diagnosis, and Treatment of CPPD Crystal Arthropathy. In: Terkeltaub R, ed. Gout and Other Crystal Arthropathies. Philadelphia, PA: Saunders/Elsevier; 2012:249-265.
2. Zhang W, Doherty M, Bardin T, et al. European League Against Rheumatism recommendations for calcium pyrophosphate deposition. Part I: terminology and diagnosis. Ann Rheum Dis. 2011;70(4):563-570.
3. McCarty DJ. Calcium pyrophosphate dihydrate crystal deposition disease—1975. Arthritis Rheum. 1976;19(S3):275-285.
4. Ivorra J, Rosas J, Pascual E. Most calcium pyrophosphate crystals appear as non-birefringent. Ann Rheum Dis. 1999;58(9):582-584.
5. Lawrence RC, Felson DT, Helmick CG, et al; National Arthritis Data Workgroup. Estimates of the prevalence of arthritis and other rheumatic conditions in the United States. Part II. Arthritis Rheum. 2008;58(1):26-35.
6. Pego-Reigosa JM, Rodriguez-Rodriguez M, Hurtado-Hernandez Z, et al. Calcium pyrophosphate deposition disease mimicking polymyalgia rheumatica: a prospective followup study of predictive factors for this condition in patients presenting with polymyalgia symptoms. Arthritis Rheum. 2005;53(6):931-938.
7. Bouvet JP, le Parc JM, Michalski B, Benlahrache C, Auquier L. Acute neck pain due to calcifications surrounding the odontoid process: the crowned dens syndrome. Arthritis Rheum. 1985;28(12):1417-1420.
8. Muthukumar N, Karuppaswamy U. Tumoral calcium pyrophosphate dihydrate deposition disease of the ligamentum flavum. Neurosurgery. 2003;53(1):103-109.
9. Armas JB, Couto AR, Bettencourt BF. Spondyloarthritis, diffuse idiopathic skeletal hyperostosis (DISH) and chondrocalcinosis. Adv in Exp Med Biol. 2009;649:37-56.
10. Abhishek A, Doherty M. Epidemiology of calcium pyrophosphate crystal arthritis and basic calcium phosphate crystal arthropathy. Rheum Dis Clin North Am. 2014;40(2):177-191.
11. Abhishek A, Doherty S, Maciewicz R, Muir K, Zhang W, Doherty M. Chondrocalcinosis is common in the absence of knee involvement. Arthritis Res Ther. 2012;14(5):R205.
12. Lumbreras B, Pascual E, Frasquet J, González-Salinas J, Rodríguez E, Hernández-Aguado I. Analysis for crystals in synovial fluid: training of the analysts results in high consistency. Ann Rheum Dis. 2005;64(4):612-615.
13. Szscygiel J, Reginato AM SS. Quality improvements in the identification of crystals from synovial fluid: hospital laboratory versus rheumatology department evaluation. Poster presented at: 2014 ACR/ARHP Annual Meeting; November 15, 2014; Boston, MA.
14. Grassi W, Meenagh G, Pascual E, Filippucci E. “Crystal clear”-sonographic assessment of gout and calcium pyrophosphate deposition disease. Semin Arthritis Rheum. 2006;36(3):197-202.
15. Scutellari PN, Galeotti R, Leprotti S, Ridolfi M, Franciosi R, Antinolfi G. The crowned dens syndrome. Evaluation with CT imaging. Radiol Med. 2007;112(2):195-207.
16. Zhang W, Doherty M, Pascual E, et al. EULAR recommendations for calcium pyrophosphate deposition. Part II: management. Ann Rheum Dis. 2011;70(4):571-575.
17. Martinon F, Pétrilli V, Mayor A, Tardivel A, Tschopp J. Gout-associated uric acid crystals activate the NALP3 inflammasome. Nature. 2006;440(7081):237-241.
18. Nuki G. Colchicine: its mechanism of action and efficacy in crystal-induced inflammation. Curr Rheumatol Rep. 2008;10(3):218-227.
19. Borisy GG, Taylor EW. The mechanism of action of colchicine. Colchicine binding to sea urchin eggs and the mitotic apparatus. J Cell Biol. 1967;34(2):535-548.
20. Borisy GG, Taylor EW. The mechanism of action of colchicine. Binding of colchincine-3H to cellular protein. J Cell Biol. 1967;34(2):525-533.
21. Daoussis D, Antonopoulos I, Andonopoulos AP. ACTH as a treatment for acute crystal-induced arthritis: update on clinical evidence and mechanisms of action. Semin Arthritis Rheum. 2014;43(5):648-653.
22. Rothschild B, Yakubov LE. Prospective 6-month, double-blind trial of hydroxychloroquine treatment of CPDD. Compr Ther. 1997;23(5):327-331.
23. Chollet-Janin A, Finckh A, Dudler J, Guerne PA. Methotrexate as an alternative therapy for chronic calcium pyrophosphate deposition disease: an exploratory analysis. Arthritis Rheum. 2007;56(2):688-692.
24. Finckh A, Mc Carthy GM, Madigan A, et al. Methotrexate in chronic-recurrent calcium pyrophosphate deposition disease: no significant effect in a randomized crossover trial. Arthritis Res Ther. 2014;16(5):458.
25. Moltó A, Ea HK, Richette P, Bardin T, Lioté F. Efficacy of anakinra for refractory acute calcium pyrophosphate crystal arthritis. Joint Bone Spine. 2012;79(6):621-623.
26. Harty LC, Lai D, Connor S, et al. Prevalence and progress of joint symptoms in hereditary hemochromatosis and symptomatic response to venesection. J Clin Rheumatol. 2011;17(4):220-222.
27. Doherty M, Dieppe PA. Double blind, placebo controlled trial of magnesium carbonate in chronic pyrophosphate arthropathy. Ann Rheum Dis. 1983;42(suppl 1):106-107.
28. Rho YH, Zhu Y, Zhang Y, Reginato AM, Choi HK. Risk factors for pseudogout in the general population. Rheumatology (Oxford). 2012;51(11):2070-2074.
29. Park CH, Kim EH, Roh YH, Kim HY, Lee SK. The association between the use of proton pump inhibitors and the risk of hypomagnesemia: a systematic review and meta-analysis. PLoS One. 2014;9(11):e112558.
30. Zhang Y, Terkeltaub R, Nevitt M, et al. Lower prevalence of chondrocalcinosis in Chinese subjects in Beijing than in white subjects in the United States: the Beijing Osteoarthritis Study. Arthritis Rheum. 2006;54(11):3508-3512.
31. Rosenthal AK, Ryan LM. Probenecid inhibits transforming growth factor-beta 1 induced pyrophosphate elaboration by chondrocytes. J Rheumatol. 1994;21(5):896-900.
32. Cheung HS, Sallis JD, Demadis KD, Wierzbicki A. Phosphocitrate blocks calcification-induced articular joint degeneration in a guinea pig model. Arthritis Rheum. 2006;54(8):2452-2461.
33. Sun Y, Mauerhan DR, Honeycutt PR, et al. Calcium deposition in osteoarthritic meniscus and meniscal cell culture. Arthritis Res Ther. 2010;12(2):R56.
34. Daumen-Legre V, Pham T, Acquaviva PC, Lafforgue P. Evaluation of safety and efficacy of viscosupplementation in knee osteoarthritis with chondrocalcinosis. In: Arthritis and Rheumatism.Vol. 42. Lippincott Williams and Wilkins; 1999:S158-S158.
35. Disla E, Infante R, Fahmy A, Karten I, Cuppari GG. Recurrent acute calcium pyrophosphate dihydrate arthritis following intraarticular hyaluronate injection. Arthritis Rheum. 1999;42(6):1302-1303.
36. Doherty M, Dieppe PA. Effect of intra-articularYttrium-90 on chronic pyrophosphate arthropathy of the knee. Lancet. 1981;2(8258):1243-1246.
37. Wendling D, Tisserand G, Griffond V, Saccomani C, Toussirot E. Acute pseudogout after pamidronate infusion. Clin Rheumatol. 2008;27(9):1205-1206.
38. Ames PRJ, Rainey MG. Consecutive pseudogout attacks after repetitive granulocyte colony-stimulating factor administration for neutropenia. Mod Rheumatol. 2007;17(5):445-446.
39. Pasquetti P, Selvi E, Righeschi K, et al. Joint lavage and pseudogout. Ann Rheum Dis. 2004;63(11):1529-1530.
40. Doherty M, Watt I, Dieppe P. Localised chondrocalcinosis in post-meniscectomy knees. Lancet. 1982;1(8283):1207-1210.
41. Rubin MR, Silverberg SJ. Rheumatic manifestations of primary hyperparathyroidism and parathyroid hormone therapy. Curr Rheumatol Rep. 2002;4(2):179-185.
42. Ea HK, Lioté F. Diagnosis and clinical manifestations of calcium pyrophosphate and basic calcium phosphate crystal deposition diseases. Rheum Dis Clin North Am. 2014;40(2):207-229.
43. Paul H, Reginato AJ, Ralph Schumacher HR. Alizarin red s staining as a screening test to detect calcium compounds in synovial fluid. Arthritis Rheum. 1983;26(2):191-200.
44. Molloy ES, McCarthy GM. Basic calcium phosphate crystals: pathways to joint degeneration. Curr Opin Rheumatol. 2006;18(2):187-192.
45. Carroll GJ, Stuart RA, Armstrong JA, Breidahl PD, Laing BA. Hydroxyapatite crystals are a frequent finding in osteoarthritic synovial fluid, but are not related to increased concentrations of keratan sulfate or interleukin 1 beta. J Rheumatol. 1991;18(6):861-866.
46. Derfus BA, Kurian JB, Butler JJ, et al. The high prevalence of pathologic calcium crystals in pre-operative knees. J Rheumatol. 2002;29(3):570-574.
47. Ho AM, Johnson MD, Kingsley DM. Role of the mouse ank gene in control of tissue calcification and arthritis. Science. 2000;289(5477):265-270.
48. Macmullan P, McCarthy G. Treatment and management of pseudogout: insights for the clinician. Ther Adv Musculoskelet Dis. 2012;4(2):121-131.
49. Gerdesmeyer L, Wagenpfeil S, Haake M, et al. Extracorporeal shock wave therapy for the treatment of chronic calcifying tendonitis of the rotator cuff: a randomized controlled trial. JAMA. 2003;290(19):2573-2580.
50. Lee SY, Cheng B, Grimmer-Somers K. The midterm effectiveness of extracorporeal shockwave therapy in the management of chronic calcific shoulder tendinitis. J Shoulder Elbow Surg. 2011;20(5):845-854.
51. Pfister J, Gerber H. Chronic calcifying tendinitis of the shoulder-therapy by percutaneous needle aspiration and lavage: a prospective open study of 62 shoulders. Clin Rheumatol. 1997;16(3):269-274.
52. del Cura JL, Torre I, Zabala R, Legórburu A. Sonographically guided percutaneous needle lavage in calcific tendinitis of the shoulder: short- and long-term results. AJR Am J Roentgenol. 2007;189(3):W128-W134.
53. Yoo JC, Koh KH, Park WH, Park JC, Kim SM, Yoon YC. The outcome of ultrasound-guided needle decompression and steroid injection in calcific tendinitis. J Shoulder Elbow Surg. 2010;19(4):596-600.
54. Wiper JD, Garrido A. Images in clinical medicine. Acute calcific tendinitis. N Engl J Med. 2008;359(23):2477.
55. Halverson PB, Carrera GF, McCarty DJ. Milwaukee shoulder syndrome. Arch Intern Med. 1990;150(3):677-682.
Calcium pyrophosphate (CPP) crystals may deposit in both articular tissues (predominantly hyaline cartilage and fibrocartilage) and periarticular soft tissues.1,2 Calcium pyrophosphate deposition disease (CPPD) may be asymptomatic or be associated with a spectrum of clinical syndromes, including both acute and chronic inflammatory arthritis.2
The European League Against Rheumatism (EULAR) recently suggested changes in CPPD terminology.2 According to the new EULAR classification, pseudogout, or CPPD, has been reclassified based on new key terms that include several of the previously described disease phenotypes: asymptomatic CPPD; acute CPP crystal arthritis (previously known as pseudogout); osteoarthritis (OA) with CPPD (previously, pseudo-OA); and the chronic CCP crystal inflammatory arthritis (previously, pseudorheumatoid arthritis). In similar fashion, chondrocalcinosis (CC) refers to calcification of the fibrocartilage and/or hyaline cartilage identified by imaging or histologic analysis. Although CC is most commonly seen in CPPD, it is not exclusive to this disease, as it can be seen in other crystal diseases (oxalosis, basic calcium phosphate [BCP]) and can appear as casual finding or coexist with OA.2
Clinical Manifestations
In clinical practice, CPPD may present with several phenotypic forms. In asymptomatic CPPD, CC is a common radiographic finding without clinical symptoms. Acute CPP arthritis always should be suspected in any patient aged > 65 years presenting with acute monoarticular or oligoarticular, migratory or additive, symmetrical, or polyarticular arthritis.3 Acute CCP arthritis is characterized by self-limited acute or subacute attacks of arthritis involving 1 or several extremity joints (knees, wrists, ankles; rarely affects large toe). Typically, the acute attacks last 7 to 10 days. Several unusual sites (eg, the hip joints, trochanteric bursa, and deep spinal joints) also may be affected. However, differences in pattern of joint involvement are insufficient to permit definitive diagnosis without demonstration of the specific crystal type in the inflammatory joint fluid.
Pseudogout attacks closely resemble gouty arthritis; CPPD presents as intermittent flares and often is asymptomatic between flares. Trauma, surgery, or severe medical illness frequently provokes attacks of monosodium urate (MSU) as well as acute CPP arthritis. Systemic findings, such as fever; leukocytosis with a left shift in the differential count; inflammatory markers, such as elevated sedimentation rate (ESR); or C-reactive protein, also can occur, resembling pyogenic arthritis, osteomyelitis, and/or systemic sepsis in the elderly patient.
Diagnosis must be confirmed with aspiration, Gram stain and cultures of the synovial fluid, and evaluation for the presence of CPP crystals under polarized light microscopy.2 The diagnosis can be difficult to confirm secondary to the weakly birefringent nature of CPP crystals.4 Coexistence of MSU and CPP crystals in a single inflammatory effusion is neither uncommon nor unexplained given increased frequencies of both hyperuricemia/gout and CC among elderly patients.5
Chronic CPP crystal inflammatory arthritis may present as a chronic, symmetrical, bilateral, and deforming polyarthritis. It frequently affects the wrists and metacarpophalangeal joints and tendon sheaths. Chronic CPP may resemble rheumatoid arthritis (RA) and produce wrist tenosynovitis, which may manifest as carpal tunnel syndrome and/or cubital tunnel syndrome. Calcium pyrophosphate deposition disease should be on the differential diagnosis in the elderly patient presenting with a clinical picture that resembles “seronegative” RA, with morning stiffness, synovial thickening, localized edema, and restricted motion due to active inflammation or flexion contracture of the hands/wrist. It may present with prominent systemic features, such as leukocytosis, fevers, mental confusion, and inflammatory oligoarthritis or polyarthritis. The diagnosis of CPPD still may be possible even though the rheumatoid factor (RF) is positive, given the increasing likelihood of elevated RF in the older population. In this setting, aspiration of joint fluid and radiography will assist in clarification of the diagnosis. Furthermore, CPPD typically does not cause the type of erosive disease that is often seen in RA.
Calcium pyrophosphate deposition disease also can mimic polymyalgia rheumatica (PMR). A direct comparison of a cohort of patients with pseudo-PMR (PMR/CPPD) with actual PMR patients found that increased age at diagnosis, presence of knee osteoarthritis, tendinous calcifications, and ankle arthritis carried the highest predictive value in patients with CPPD presenting with PMR-like symptoms.6 However, the PMR/CPPD variant can be difficult to distinguish, because both conditions can have elevated systemic inflammatory markers, and both are steroid responsive.
Calcium pyrophosphate deposition disease involving a single joint can rarely lead to extensive destruction—as with neuropathic joints in the absence of any neurologic deficits—and is extremely debilitating. This presentation is not well understood and does not have good treatment alternatives. Calcium pyrophosphate crystals often are associated with manifestations of OA.1,2 Indeed, up to 20% of OA joints have been found to be positive for CPP crystals in various studies. Given the extensive evidence supporting treatment of OA, usually they are treated in a similar fashion with good results. Occasionally, these will have unusual manifestations for typical OA, such as involvement of wrists and metacarpophalangeal joints; however, the presentation is often indolent like OA.
Calcium pyrophosphate crystal deposition involving the spine has been associated with a number of clinical manifestations. Spine stiffness, sometimes associated with bony ankylosis, can resemble ankylosing spondylitis or diffuse idiopathic skeletal hyperostosis. Such symptoms are seen more commonly in familial CPPD rather than in the elderly. However, crystal deposition in the ligamentum flavum at the cervical spine levels has been associated with a condition called crowned dens syndrome.7 Although mostly asymptomatic, it may be present with acute neck pain, fever, and an increased ESR, sometimes mimicking PMR or giant cell arteritis or neurologic symptoms. Similarly, CPP crystal deposition in the posterior longitudinal ligament at the lower levels of the spine may lead to spinal cord compression syndromes or symptoms of either acute nerve compression or chronic spinal stenosis.8,9 Calcium pyrophosphate crystal deposition also can occur in other soft tissues, such as bursae, ligaments, and tendons and may be sufficient to cause local nerve compression, such as carpal or cubital tunnel syndrome.
Epidemiology
Radiographic surveys of the knees, hands, wrists, and pelvis and epidemiologic studies have demonstrated an age-related increase in the prevalence of CPPD: 15% prevalence in patients aged 65 to 74 years, 36% prevalence in patients aged 75 to 84 years, and 50% prevalence in patients aged > 84 years.10 In a recent radiographic study, 40% of patients with CPPD did not present with CC of the knee, and the study’s authors recommended additional radiographs of pelvis, wrists, or hands for accurate diagnosis of radiographic CC.11
Diagnosis
Accurate diagnosis should be achieved on the basis of the clinical picture and demonstration of CPP crystals in synovial fluid or tissue by compensated polarized light microscopy (Figures 1A and 1B).2 The sensitivity and specificity for CPP crystal detection has been shown to be 95.9% and 86.5%, respectively.12 However, the CPP crystal is more readily identified by a rheumatologist rather than in a standard hospital laboratory, which misses 30% of CPP crystals.13
Findings of CC on radiograph strengthens a CPPD diagnosis, but its absence does not rule it out (Figure 2A).2 More recently, the use of new imaging modalities, such as musculoskeletal ultrasound, provides the capacity to visualize crystal deposits within the joint structures, the hyaline cartilage, and/or fibrocartilage (Figure 2B and 2C).14 The presence of hyperechoic bands within the intermediate layer hyaline cartilage and hyperechoic spots in fibrocartilage are consistent with CPP crystal deposits.2,14 The use of computed tomography is the gold standard imaging modality for the identification of CPPD of the spine.15 There is not enough evidence to support the use of magnetic resonance imaging in CPPD, but it may play a role in rare complications.2
Treatment
The EULAR recently defined new guidelines for the management of CPPD.16 Asymptomatic CPPD needs no treatment.In other CPPD phenotypes, the goals are to attempt prompt resolution of the acute synovitis, reduction in chronic damage, and management of associated conditions.In acute attacks, treatment modalities used in gout are often required; however, data for CPPD treatment are limited (Table). Treatment relies on the use of colchicine and nonsteroidal anti-inflammatory drugs (NSAIDs), but toxicity and comorbidities in the elderly limit the usage of these drugs.
Given increased renal impairment, the loading dose of colchicine is not recommended.16 Colchicine has recently been shown to completely block crystal-induced maturation of IL-1β in vitro, indicating that the drug acts upstream of inflammasome activation.17 This is in addition to the well-known role of colchicine in inhibition of micro-tubule formation, which likely leads to prevention of cell migration, phagocytosis, and activation of inflammasome.18-20
Intra-articular injection of corticosteroid is an efficient and well-tolerated treatment alternative for monoarticular CPP flares. Oral or parenteral corticosteroids are frequently used for polyarticular flares in particular for those patients in which NSAIDs and colchicine are contraindicated.16 Parenteral adrenocorticotropic hormone has been used in patients with congestive heart failure, renal insufficiency, gastrointestinal bleeding, or resistance to NSAIDs.21 For prophylaxis of acute CPP crystal arthritis, a low dose of oral NSAIDs, oral colchicine, or prednisone may be used with good results.16 In chronic CPP arthritis, continuous use of colchicine, NSAIDs, or low-dose prednisone is often appropriate. If these interventions are ineffective or contraindicated, using hydroxychloroquine (HCQ) and methotrexate (MTX) have been successfully used to control chronic CPP crystal inflammation.22,23 Recent trials have raised questions about MTX, and further trials on HCQ usage are underway.24 Biologic agents targeting IL-1 are not currently approved for the treatment of CPPD, but there are suggestions that it may be effective in refractory cases and induce rapid stable remissions after 3 days of therapy.25
In contrast to gout, there is no specific target therapy for lowering CPP crystal load in the elderly. Crucial in the management of CPPD in the elderly is the search for associated diseases, such as hyperparathyroidism, hemochromatosis, hypomagnesemia, and hypophosphatemia, as well as avoidance of tacrolimus, which facilitates or causes CC.16 Correction of the underlying metabolic disorder, especially when undertaken early, may reduce the severity of CPPD. However, there is little evidence to suggest that treatment of associated disease results in resolution of CPPD—most famously, although therapeutic phlebotomy does not help in hemochromatosis for prevention of crystal disease, chelating agents do seem to be moderately effective.26 Only oral administration of magnesium has shown a reduction in meniscal CC in a patient with CPPD arthropathy.27 In addition, this was in the setting of familial hypomagnesemia associated CPPD. However, unlike uricosuric agents for gout, no pharmacologic treatments can prevent CPPD crystal formation and deposition in tissues.
Therapeutic Agents
Magnesium
Magnesium is a cofactor for the activity of pyrophosphatases that converts inorganic pyrophosphates (PPis) into orthophosphates. In addition, magnesium can increase the solubility of CPP crystals. Early detection and management of hypomagnesemia are recommended, because it occurs in patients who have well-defined conditions and situations: Gitelman syndrome, thiazide and loop diuretics use, tacrolimus use, familial forms of renal magnesium wasting or use of proton pump inhibitors, short bowel syndrome, and intestinal failure in patients receiving home parenteral nutrition. Long-term administration of magnesium in some patients with chronic hypomagnesemia decreased meniscal calcification.27-29
Dietary Calcium
Epidemiologic studies showed a lower incidence of CC in Chinese subjects. The authors of the study speculate that this lower prevalence of CPPD could result from high levels of calcium found in the drinking water in Beijing, which may affect parathyroid hormone secretion.30 Further studies are needed to confirm this hypothesis, as it could be a cheaper approach to pseudogout prevention.
Probenecid
Probenecid is an in vitro inhibitor of the transmembrane PPi transporter thought to possibly prevent extracellular PPi elaboration. However, this observation has not been confirmed by either case reports or clinical trials.31
Phosphocitrate
Phosphocitrate acts directly on preventing crystal deposition in tissues in CPPD as well as BCP based on in vitro evidence and mouse models.32,33
Hyaluronan
An amelioration of pain and increased range of motion were observed in radiographic CC with OA.34 However, it is associated with increased acute CPP arthritis.35
Radiosynovectomy
In a double-blind study of 15 patients with symmetrical CPPD arthropathy, the knee that underwent intra-articular injection of yttrium-90 (5 mCi) plus steroid had less pain, stiffness, joint line tenderness, and effusion compared with the contralateral control knee injected with saline and steroids.36
Precipitators of Acute Pseudogout
Diuretics are known to exacerbate gout, but they also can exacerbate pseudogout. A recent case-control study nested within a United Kingdom general practice database found that loop diuretics rather than hydrochlorothiazide was associated with increased risk of CPPD mediated primarily by magnesium reabsorption in the loop of Henle.28 Chronic kidney disease associated with secondary and tertiary hyperparathyroidism increases calcium or PPi concentration, which leads to CPP-crystal deposition.
In addition, multiple case reports have described acute pseudogout caused by bisphosphonate administration for osteoporosis or Paget disease—more likely in the elderly population. Intravenous pamidronate, oral etidronate, and alendronate therapy have all been described in the elderly.37 The overall mechanism behind this link is not completely understood, but bisphosphonates are structurally similar to PPi. Pseudogout attacks also have been described in neutropenic patients undergoing treatment with granulocyte-colony stimulating factor.38 In addition to pharmaceutical exacerbation of pseudogout, surgical procedures and trauma can precipitate attacks. Joint lavage has been described to increase the incidence of pseudogout.39 It was hypothesized that joint lavage with fluid induced “crystal shedding” from CPPD crystals imbedded in the joint tissue. Patients who underwent meniscectomy of the knee 20 years ago had a 20% incidence of CC in the knee that was operated compared with 4% CC in the contralateral nonoperated knee.40 Overall, the surgery most linked with a pseudogout attack, however, is parathyroidectomy.41
Basic Calcium Phosphate Crystals
Basic calcium phosphate crystals are common but rarely diagnosed due to the cumbersome and expensive methods required to identify these crystals.42
Basic calcium phosphate and CPPD crystals may coexist in synovial fluid. Similar to CPPD, BCP crystal disease is often concurrent with OA and can cause calcification of articular cartilage. Basic calcium phosphate is more common than CPP crystals with occurrence of 30% to 50% in OA synovial fluid.42 Additionally, BCP crystal disease has been linked to increased severity of OA. Basic calcium phosphate crystals in knee joints were found to have radiographically more severe arthritis with larger effusions.44,45 Similarly, BCP crystals in OA synovial fluid correlated with higher Kellgreen-Lawrence grade scores by radiography.42,46
It is currently believed that BCP crystals are continuously formed in the extracellular matrix, and their deposition is actively prevented by PPi present in the matrix.47 Elevated PPi levels, on the other hand, favor the formation of CPP crystals.48 The clinical upshot seems to be that although CPP crystals are almost universally intra-articular and released by chondrocytes, BCD crystals and deposits are more frequently present in soft tissues.
Acute Calcific Tendinitis
Typically, this type of tendinitis involves the shoulder joint and is extra-articular. Common treatments help, including NSAIDs, intra-articular steroids, ice, and rest. In addition, high-energy extracorporeal shock wave therapy has been shown to be effective when used with conscious sedation.49,50 Needling or barbotage in association with lavage and steroid injections also is effective and has occasionally been shown to reduce the size of the calcium deposit as well, often in combination with IV drugs like ethylenediaminetetraacetic acid.51-53
Acute calcific periarthritis of the hand presents similar to gout or pseudogout, affecting the wrist, usually in postmenopausal women.54 Basic calcium phosphate crystals are aspirated from the joint, and periarticular crystals may be subtle. Local steroid injections are beneficial.Milwaukee shoulder syndrome is an arthropathy associated with BCP crystals in the joint fluid and results in extensive destruction of shoulder articular cartilage and surrounding tissues. It is commonly bilateral and occurs in elderly women more often than it does in men.55 Aspiration of the shoulder joint typically reveals a serosanginous fluid. Fluid samples can be assessed for hydroxyapatite crystals by staining with alizarin red dye, which produces a characteristic “halo” or orange-red stain by light microscopy.43 Surgical treatment of Milwaukee shoulder syndrome is difficult due to increased age of the population affected and the severity of the shoulder destruction. Usually a conservative approach of analgesics, recurrent shoulder aspirations, and steroid injections is the best treatment option.
Conclusions
Calcium-containing crystal-associated arthropathies are a complex array of entities that target the veteran elderly population with increasing frequency. Challenges still remain in the diagnosis, crystal identification, and treatment due to coexisting comorbid conditions and polypharmacy commonly seen in veterans. Overall morbidity associated with calcium-containing crystal-associated arthropathies and the coexisting osteoarthritis is great, and focused identification of the disease process with tailored treatment can achieve the goal of decreasing symptoms and improving quality of life.
Acknowledgements
This work was supported by grant P20GM104937 (A.M.R.).
1. Guerne PA, Terkeltaub R. Clinical Features, Diagnosis, and Treatment of CPPD Crystal Arthropathy. In: Terkeltaub R, ed. Gout and Other Crystal Arthropathies. Philadelphia, PA: Saunders/Elsevier; 2012:249-265.
2. Zhang W, Doherty M, Bardin T, et al. European League Against Rheumatism recommendations for calcium pyrophosphate deposition. Part I: terminology and diagnosis. Ann Rheum Dis. 2011;70(4):563-570.
3. McCarty DJ. Calcium pyrophosphate dihydrate crystal deposition disease—1975. Arthritis Rheum. 1976;19(S3):275-285.
4. Ivorra J, Rosas J, Pascual E. Most calcium pyrophosphate crystals appear as non-birefringent. Ann Rheum Dis. 1999;58(9):582-584.
5. Lawrence RC, Felson DT, Helmick CG, et al; National Arthritis Data Workgroup. Estimates of the prevalence of arthritis and other rheumatic conditions in the United States. Part II. Arthritis Rheum. 2008;58(1):26-35.
6. Pego-Reigosa JM, Rodriguez-Rodriguez M, Hurtado-Hernandez Z, et al. Calcium pyrophosphate deposition disease mimicking polymyalgia rheumatica: a prospective followup study of predictive factors for this condition in patients presenting with polymyalgia symptoms. Arthritis Rheum. 2005;53(6):931-938.
7. Bouvet JP, le Parc JM, Michalski B, Benlahrache C, Auquier L. Acute neck pain due to calcifications surrounding the odontoid process: the crowned dens syndrome. Arthritis Rheum. 1985;28(12):1417-1420.
8. Muthukumar N, Karuppaswamy U. Tumoral calcium pyrophosphate dihydrate deposition disease of the ligamentum flavum. Neurosurgery. 2003;53(1):103-109.
9. Armas JB, Couto AR, Bettencourt BF. Spondyloarthritis, diffuse idiopathic skeletal hyperostosis (DISH) and chondrocalcinosis. Adv in Exp Med Biol. 2009;649:37-56.
10. Abhishek A, Doherty M. Epidemiology of calcium pyrophosphate crystal arthritis and basic calcium phosphate crystal arthropathy. Rheum Dis Clin North Am. 2014;40(2):177-191.
11. Abhishek A, Doherty S, Maciewicz R, Muir K, Zhang W, Doherty M. Chondrocalcinosis is common in the absence of knee involvement. Arthritis Res Ther. 2012;14(5):R205.
12. Lumbreras B, Pascual E, Frasquet J, González-Salinas J, Rodríguez E, Hernández-Aguado I. Analysis for crystals in synovial fluid: training of the analysts results in high consistency. Ann Rheum Dis. 2005;64(4):612-615.
13. Szscygiel J, Reginato AM SS. Quality improvements in the identification of crystals from synovial fluid: hospital laboratory versus rheumatology department evaluation. Poster presented at: 2014 ACR/ARHP Annual Meeting; November 15, 2014; Boston, MA.
14. Grassi W, Meenagh G, Pascual E, Filippucci E. “Crystal clear”-sonographic assessment of gout and calcium pyrophosphate deposition disease. Semin Arthritis Rheum. 2006;36(3):197-202.
15. Scutellari PN, Galeotti R, Leprotti S, Ridolfi M, Franciosi R, Antinolfi G. The crowned dens syndrome. Evaluation with CT imaging. Radiol Med. 2007;112(2):195-207.
16. Zhang W, Doherty M, Pascual E, et al. EULAR recommendations for calcium pyrophosphate deposition. Part II: management. Ann Rheum Dis. 2011;70(4):571-575.
17. Martinon F, Pétrilli V, Mayor A, Tardivel A, Tschopp J. Gout-associated uric acid crystals activate the NALP3 inflammasome. Nature. 2006;440(7081):237-241.
18. Nuki G. Colchicine: its mechanism of action and efficacy in crystal-induced inflammation. Curr Rheumatol Rep. 2008;10(3):218-227.
19. Borisy GG, Taylor EW. The mechanism of action of colchicine. Colchicine binding to sea urchin eggs and the mitotic apparatus. J Cell Biol. 1967;34(2):535-548.
20. Borisy GG, Taylor EW. The mechanism of action of colchicine. Binding of colchincine-3H to cellular protein. J Cell Biol. 1967;34(2):525-533.
21. Daoussis D, Antonopoulos I, Andonopoulos AP. ACTH as a treatment for acute crystal-induced arthritis: update on clinical evidence and mechanisms of action. Semin Arthritis Rheum. 2014;43(5):648-653.
22. Rothschild B, Yakubov LE. Prospective 6-month, double-blind trial of hydroxychloroquine treatment of CPDD. Compr Ther. 1997;23(5):327-331.
23. Chollet-Janin A, Finckh A, Dudler J, Guerne PA. Methotrexate as an alternative therapy for chronic calcium pyrophosphate deposition disease: an exploratory analysis. Arthritis Rheum. 2007;56(2):688-692.
24. Finckh A, Mc Carthy GM, Madigan A, et al. Methotrexate in chronic-recurrent calcium pyrophosphate deposition disease: no significant effect in a randomized crossover trial. Arthritis Res Ther. 2014;16(5):458.
25. Moltó A, Ea HK, Richette P, Bardin T, Lioté F. Efficacy of anakinra for refractory acute calcium pyrophosphate crystal arthritis. Joint Bone Spine. 2012;79(6):621-623.
26. Harty LC, Lai D, Connor S, et al. Prevalence and progress of joint symptoms in hereditary hemochromatosis and symptomatic response to venesection. J Clin Rheumatol. 2011;17(4):220-222.
27. Doherty M, Dieppe PA. Double blind, placebo controlled trial of magnesium carbonate in chronic pyrophosphate arthropathy. Ann Rheum Dis. 1983;42(suppl 1):106-107.
28. Rho YH, Zhu Y, Zhang Y, Reginato AM, Choi HK. Risk factors for pseudogout in the general population. Rheumatology (Oxford). 2012;51(11):2070-2074.
29. Park CH, Kim EH, Roh YH, Kim HY, Lee SK. The association between the use of proton pump inhibitors and the risk of hypomagnesemia: a systematic review and meta-analysis. PLoS One. 2014;9(11):e112558.
30. Zhang Y, Terkeltaub R, Nevitt M, et al. Lower prevalence of chondrocalcinosis in Chinese subjects in Beijing than in white subjects in the United States: the Beijing Osteoarthritis Study. Arthritis Rheum. 2006;54(11):3508-3512.
31. Rosenthal AK, Ryan LM. Probenecid inhibits transforming growth factor-beta 1 induced pyrophosphate elaboration by chondrocytes. J Rheumatol. 1994;21(5):896-900.
32. Cheung HS, Sallis JD, Demadis KD, Wierzbicki A. Phosphocitrate blocks calcification-induced articular joint degeneration in a guinea pig model. Arthritis Rheum. 2006;54(8):2452-2461.
33. Sun Y, Mauerhan DR, Honeycutt PR, et al. Calcium deposition in osteoarthritic meniscus and meniscal cell culture. Arthritis Res Ther. 2010;12(2):R56.
34. Daumen-Legre V, Pham T, Acquaviva PC, Lafforgue P. Evaluation of safety and efficacy of viscosupplementation in knee osteoarthritis with chondrocalcinosis. In: Arthritis and Rheumatism.Vol. 42. Lippincott Williams and Wilkins; 1999:S158-S158.
35. Disla E, Infante R, Fahmy A, Karten I, Cuppari GG. Recurrent acute calcium pyrophosphate dihydrate arthritis following intraarticular hyaluronate injection. Arthritis Rheum. 1999;42(6):1302-1303.
36. Doherty M, Dieppe PA. Effect of intra-articularYttrium-90 on chronic pyrophosphate arthropathy of the knee. Lancet. 1981;2(8258):1243-1246.
37. Wendling D, Tisserand G, Griffond V, Saccomani C, Toussirot E. Acute pseudogout after pamidronate infusion. Clin Rheumatol. 2008;27(9):1205-1206.
38. Ames PRJ, Rainey MG. Consecutive pseudogout attacks after repetitive granulocyte colony-stimulating factor administration for neutropenia. Mod Rheumatol. 2007;17(5):445-446.
39. Pasquetti P, Selvi E, Righeschi K, et al. Joint lavage and pseudogout. Ann Rheum Dis. 2004;63(11):1529-1530.
40. Doherty M, Watt I, Dieppe P. Localised chondrocalcinosis in post-meniscectomy knees. Lancet. 1982;1(8283):1207-1210.
41. Rubin MR, Silverberg SJ. Rheumatic manifestations of primary hyperparathyroidism and parathyroid hormone therapy. Curr Rheumatol Rep. 2002;4(2):179-185.
42. Ea HK, Lioté F. Diagnosis and clinical manifestations of calcium pyrophosphate and basic calcium phosphate crystal deposition diseases. Rheum Dis Clin North Am. 2014;40(2):207-229.
43. Paul H, Reginato AJ, Ralph Schumacher HR. Alizarin red s staining as a screening test to detect calcium compounds in synovial fluid. Arthritis Rheum. 1983;26(2):191-200.
44. Molloy ES, McCarthy GM. Basic calcium phosphate crystals: pathways to joint degeneration. Curr Opin Rheumatol. 2006;18(2):187-192.
45. Carroll GJ, Stuart RA, Armstrong JA, Breidahl PD, Laing BA. Hydroxyapatite crystals are a frequent finding in osteoarthritic synovial fluid, but are not related to increased concentrations of keratan sulfate or interleukin 1 beta. J Rheumatol. 1991;18(6):861-866.
46. Derfus BA, Kurian JB, Butler JJ, et al. The high prevalence of pathologic calcium crystals in pre-operative knees. J Rheumatol. 2002;29(3):570-574.
47. Ho AM, Johnson MD, Kingsley DM. Role of the mouse ank gene in control of tissue calcification and arthritis. Science. 2000;289(5477):265-270.
48. Macmullan P, McCarthy G. Treatment and management of pseudogout: insights for the clinician. Ther Adv Musculoskelet Dis. 2012;4(2):121-131.
49. Gerdesmeyer L, Wagenpfeil S, Haake M, et al. Extracorporeal shock wave therapy for the treatment of chronic calcifying tendonitis of the rotator cuff: a randomized controlled trial. JAMA. 2003;290(19):2573-2580.
50. Lee SY, Cheng B, Grimmer-Somers K. The midterm effectiveness of extracorporeal shockwave therapy in the management of chronic calcific shoulder tendinitis. J Shoulder Elbow Surg. 2011;20(5):845-854.
51. Pfister J, Gerber H. Chronic calcifying tendinitis of the shoulder-therapy by percutaneous needle aspiration and lavage: a prospective open study of 62 shoulders. Clin Rheumatol. 1997;16(3):269-274.
52. del Cura JL, Torre I, Zabala R, Legórburu A. Sonographically guided percutaneous needle lavage in calcific tendinitis of the shoulder: short- and long-term results. AJR Am J Roentgenol. 2007;189(3):W128-W134.
53. Yoo JC, Koh KH, Park WH, Park JC, Kim SM, Yoon YC. The outcome of ultrasound-guided needle decompression and steroid injection in calcific tendinitis. J Shoulder Elbow Surg. 2010;19(4):596-600.
54. Wiper JD, Garrido A. Images in clinical medicine. Acute calcific tendinitis. N Engl J Med. 2008;359(23):2477.
55. Halverson PB, Carrera GF, McCarty DJ. Milwaukee shoulder syndrome. Arch Intern Med. 1990;150(3):677-682.

Academic Reasonable Accommodations for Post-9/11 Veterans With Psychiatric Diagnoses, Part 1
Navigating the postsecondary educational pathway can be an intimidating process for post-9/11 veterans struggling with mental health concerns that may alter learning styles and negatively impact performance.1-4 When significant interference with learning ability is anticipated for more than 6 months, these veterans may qualify for formal academic “reasonable” accommodations under federal disability laws that include the Americans with Disabilities Act (ADA) of 1990 as amended in 2008 and Section 504 of the Rehabilitation Act of 1973. These accommodations enable students to compensate for learning disabilities and help support the transition to student life. Student veterans often are not aware of the existence of academic reasonable accommodations, because military separation classes, civilian postdeployment orientation, and popular media do not routinely cover information on this subject.
With an overall objective to ease veteran reintegration into the civilian world and promote emotional stability, health care providers (HCPs) are in a unique position to promote the use of formal academic accommodations for post-9/11 veterans with psychiatric conditions. However, HCPs must have basic information regarding these interventions before initiating discussions with patients. Current peer-reviewed medical literature has scant information regarding specific aspects of academic reasonable accommodations for individuals with psychiatric diagnoses.
The purpose of this 2-part article (part 2 will be published in May 2016) is to promote a greater understanding of academic accommodations for post-9/11 veterans with psychiatric diagnoses. Part 1 provides a brief background regarding issues pertinent to the post-9/11 student veteran role transition and reviews information regarding various aspects of academic reasonable accommodations, including details on the definition, request process, medical documentation requirements, and common accommodation examples.
Although the focus of the article is on the characteristics of post-9/11 veterans who have separated from military service, it also is relevant for providers involved with service members who have not yet separated. The impact of mental health issues, traumatic brain injury (TBI), and psychosocial stressors on learning ability are potentially applicable to many post-9/11 active-duty soldiers and reservists who are pursuing a secondary education. The academic reasonable accommodations discussed are available to any adult who meets the eligibility criteria—regardless of military status.
Influence of Psychiatric Symptoms on Learning
Although each mental health diagnosis is unique, mental health conditions involving mood share the common symptoms of impaired learning ability.3-8 Problems frequently experienced include decreased concentration, shortened attention span, difficulty in making new memories or storing new information, and the inability to recall information previously learned.6-8 Other reported conditions include difficulty with prioritization of tasks, losing track of time, difficulty focusing on tasks, and taking longer to complete assignments.3,4 Increased irritability accompanies many of these issues. Low tolerance to frustration may occur as evidenced by an outburst of anger or resignation to defeat when minor barriers are encountered, especially when authority figures or bureaucratic rules create those perceived barriers.3,4 Persistent impaired ability to articulate ideas or thoughts and difficulty performing abstract thinking also are often noticed when moderate-to-severe mental health symptoms are present.4,8
Medications commonly used to control psychiatric symptoms and stabilize underlying mental health also can produce adverse effects (AEs) that impact learning ability.9,10 Drug AEs vary but often include significant fatigue, impaired memory, and impaired executive function involving insight, judgment, and/or abstract thinking. Depending on the medication, the individual may experience restlessness or insomnia.
Factors Complicating Successful Integration
The transition period from military service to civilian life presents unique complications for student veterans with symptomatic psychiatric concerns.1,11 Veterans who separate from military service go through a civilian transition period of variable intensity influenced by readjustment difficulties and comorbid conditions.11,12 During this time, veterans are reintegrating into civilian life and assuming new roles that include partner, parent, employee, and family member. This transition can cause many symptoms to appear that potentially influence learning to varying degrees. A summary of impediments to learning in post-9/11 veterans is found in Table 1.
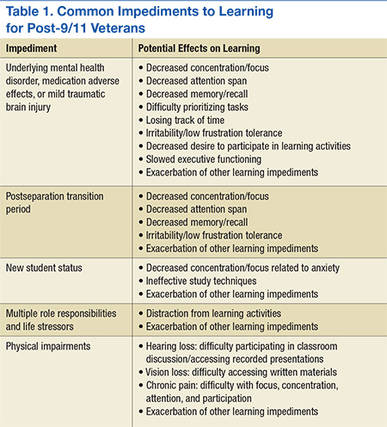
Common transition symptoms include irritability, decreased ability to store and recall information, decreased concentration, decreased attention, and slowed executive functioning.13,14 Sleep disturbances such as altered sleep-wake cycles, nonrestful sleep, inadequate sleep, and nightmares also may occur.13,14 Veterans experiencing these transition period symptoms may face significant difficulties with time management skills, organization, and task execution. If the veteran successfully assimilates into his or her new roles and becomes self-confident within those roles, the symptoms may abate. However, if moderate-to-severe psychiatric symptoms also are present, all transition symptoms likely will have an unpredictable time frame for resolution.3,13,14
Understanding the role responsibilities of student veterans is important in recognizing the added stressors veterans with psychiatric diagnoses have within the academic setting. In general, demographic data indicate that student veterans lead far more complex lives than those of 18- to 22-year-olds who enter postsecondary education without military experience. Student veterans are older, have a broader life experience, and may feel less connected to nonveteran students.15,16 Compared with typical younger college students, undergraduate student veterans are more likely to be married but somewhat less likely to be parents.17 Student veterans who are pursuing graduate degrees are more likely to be married and/or have dependents.17 Those roles imply that student veterans often are juggling multiple responsibilities that are constantly competing for student veterans’ time and attention.
Age differences, multiple roles, and lack of shared life experiences with traditional college students contribute to student veterans’ perceptions of a paucity of campus social support and often lead to a sense of distinct isolation.18,19 These added stressors deplete a veteran’s ability to concentrate on academic studies and may exacerbate the effects of underlying mental health diagnoses, transition issues, and medication use.
Symptomatic psychiatric diagnoses can amplify the difficulties normally experienced when changing from a veteran role to a student veteran role.1 The student veteran’s apprehension about returning to school often is elevated because of the time gap since the veteran was last in a formal, nonmilitary classroom. Acclimated to the structured style of military coursework for many years, student veterans may find adjusting to new teaching styles or different academic expectations awkward.20,21 They may experience heightened anxiety, because expectations of classroom performance may not be as clearcut as it was in the military. Such heightened anxiety can compound learning difficulties caused by underlying emotional states, transition issues, medication AEs, and life stressors.
Related: The VA/DoD Chronic Effects of Neurotrauma Consortium: An Overview at Year 1
Many student veterans with impaired learning ability related to psychiatric symptoms also have secondary physical diagnoses that can impede learning. For example, tinnitus and hearing loss are common in combat veterans.22,23 These issues make it hard to participate in a classroom setting because of difficulty in recognizing speech or filtering out background noise. For some, chronic pain may impede concentration, depress mood, worsen irritability, and make prolonged sitting difficult.24,25 Physical disabilities related to amputation or major joint injury may present challenges to participating in certain types of college settings and/or navigating between classes in a timely fashion.26
Although mild-to-moderate TBI sustained in combat often will spontaneously resolve within 3 months, in some individuals, TBI symptoms may persist after months or years.27,28 During this time, learning styles may be altered for veterans exposed to TBI. Similar to the effects caused by other factors impeding learning in post-9/11 veterans, common post-TBI symptoms that reduce academic performance include fatigue, decreased memory, slowed abstract thinking, difficulty articulating thoughts, poor tolerance to frustration, sleep difficulties, chronic pain, and increased irritability.27-29 Veterans with a history of mild TBI often are found to have clinically significant rates of depression, anxiety, or posttraumatic stress disorder (PTSD).27,28,30,31 These findings mirror those found in the general population.32 Mild TBI and PTSD may further complicate the learning process by exacerbating underlying mental health symptoms that already impair academic performance. The degree to which these individuals with TBI and mental health issues will return to premorbid academic functioning is not predictable based on current literature.33
Recognizing the stressors that some combat veterans face in an academic setting is vital to anticipating the added support that is needed by student veterans with concurrent moderate-to-severe psychiatric issues.34 Symptoms usually noted in the transition period may be much more pronounced. Automatic behaviors developed as survival responses during deployment can complicate participation in the educational arena.4,35 Seemingly mundane tasks, such as the daily school commute, can cause significant anxiety and hypervigilance especially when the veterans must navigate crowds and traffic formerly associated with risk of attack in combat-related circumstances.4 Minor roadway debris or roadside construction also can abnormally heighten anxiety because of reflex training to avoid potentially hidden explosive devices during convoy movements.4 Random assignment of a classroom seat can be stress-provoking, because combat veterans’ training compels them to position themselves with the greatest vantage point, usually nearest to exits and with minimal activity behind them.4,35 A need to constantly survey the surroundings for potential cover from hostile events can cause hyper alertness that distracts the student veteran’s full concentration on academic tasks.3,4
Although veterans should be able to adjust learning styles for minor issues or transitory problems, significant psychiatric symptoms have a negative effect on learning and pose a direct threat to academic performance.33,36-38 Moderate-to-severe psychiatric concerns may further heighten transition symptoms, compound psychosocial adjustment, and complicate TBI recovery. In addition, periods of high stress may further provoke symptoms of the underlying psychiatric diagnosis.
Reasonable Accommodations
In postsecondary education, reasonable accommodations are formal modifications or adjustments in the school environment that enable individuals with physical or psychological issues to successfully learn and function within the academic institution. In general, these academic accommodations for student veterans with mental health diagnoses involve modifying the learning environment to compensate for delays in executive functioning, such as memorization, recall, and complex analysis. Coursework is not altered; rather specific actions are used to assist the student to process and recall the material more easily. The reasonable accommodations also may be structured in a way that avoids exacerbating an underlying mental health diagnosis, such as PTSD or anxiety. The purpose of reasonable accommodations is to effectively remove barriers to a student veteran’s ability to learn and succeed academically.
Federal law states that reasonable accommodations must be implemented by all schools that accept federal monies—including GI bill payments.39 Although schools are not required to implement all preferred accommodations requested by veterans, academic institutions are required to implement reasonable, effective strategies for the individual student veteran with a psychological diagnosis that causes learning impairment. However, these institutions are not required to proactively determine who might qualify for such accommodations. A school will not initiate formal academic accommodations unless a veteran makes a specific request and provides qualifying documentation.
Many veterans qualify for reasonable accommodations in the academic setting to compensate for the negative impact that mental health issues can have on academic performance. Specifically, student veterans with psychiatric diagnoses are classified as having a learning disability and are eligible to receive academic accommodations if the psychiatric condition substantially limits, or is expected to limit, learning for more than 6 months.39 Individuals with psychiatric conditions in remission are still classified as having a disability if the disorder would impede learning when symptomatic. A veteran does not need to establish verification of a psychiatric diagnosis connected to military service in order to receive formal academic accommodations. Student veterans who qualify for formal academic accommodations can be fully functional in all other areas of their lives. Examples of qualifying psychiatric diagnoses include PTSD, depression, anxiety, bipolar disorder, and schizophrenia.
Although accommodations are individually tailored, there are frequently used accommodations for student veterans with psychiatric diagnoses that have been extremely helpful for those who qualify. Additional time for testing helps the student veteran compensate for the difficulty with abstract thinking, concentration, attention, and recall. Low stimulus testing environments, such as a quiet room, enable a veteran to more easily concentrate. Additional time for completion of assignments without academic penalties is beneficial for a veteran experiencing difficulty with attention, focus, concentration, and organization. Assistance with note-taking or advanced access to lecture notes helps the veteran compensate for decreased focus, attention, and short-term memory impairment. Permitting short breaks without repercussions during a lecture allows the veteran to regain focus and composure if he or she is having difficulties with concentration, attention, restlessness, anxiety, body pain, or emotional flares. Tutoring can help the veteran overcome slowed executive functioning. Faculty-approved notes on an index card may help the veteran compensate for extreme difficulty with memory recall. To prevent visual distraction while reading, use of a blank note card or blank sheet of paper during testing may make it easier for the veteran to focus on each sentence or test question.
On a case-by-case basis, other creative strategies may be used to enable the student veteran to participate more fully in the academic setting. Preferential class scheduling can be arranged to compensate for severely altered sleep patterns. Such changes to the schedule mean a veteran would not have to attend classes during a time frame when his or her body is accustomed to sleeping. Flexibility with class attendance decreases external stressors for the veteran who is having intermittent difficulty with severe sleep disturbances or anxiety in group settings. “Unstacking” midterms or finals allows the student veteran to avoid back-to-back exams and enables him or her to study more effectively for each exam. Virtual classes with self-pacing options may provide more flexibility to complete course requirements while the veteran is dealing with fluctuating emotional symptoms.
Legal Process
Barring undue hardship to provide accommodations, the ADA of 1990 as amended in 2008 and Section 504 of the Rehabilitation Act of 1973 enable equal rights and access to benefits and services for all individuals with disabilities to the same degree as persons without such disabilities in multiple environments including the academic setting. Although the U.S. military system narrowly interprets the term disability, individuals classified as having disabilities under these federal laws fall under a much broader definition. Specifically, any person with “a physical or mental impairment that constitutes or results in substantial impediment” of one of life’s major activities is considered to have a disability.39 As per the ADA of 1990, learning is defined as one of the major life activities.39 This law recognizes that the individual with a learning disability may be fully functional in all other areas of his or her life.
Related: Using Life Stories to Connect Veterans and Providers
Because students must officially request and receive approval for these accommodations within the academic institution, the veteran should speak with the school’s disability resource center counselor regarding the process. If the school does not have a disability resource center, then the student veteran should speak to an admissions counselor at the academic facility. The discussion with the facility’s counselor should include which types of accommodations may be possible to compensate for the veteran’s learning impediments. The counselor will inform the veteran of the required medical documentation that enables the school to grant the needed academic accommodations. In general, veterans can qualify for academic accommodations by receiving a letter with medical documentation of the psychiatric disorder, its anticipated effect on learning, and if known, the suggested reasonable accommodations to compensate for the learning deficit. The veteran can receive a qualifying letter from a psychologist, psychiatrist, PCP, social worker, or licensed counselor with the expertise to diagnose and document the disorder. Student veterans can take this letter to the school’s disability resource center to enable the institution to approve and adopt the accommodations for the student veteran. To ensure compliance with privacy regulations and any facility privacy policies, most providers require a signed release of information form before providing the medical documentation letter.
Such letters need to contain only the basic information required by the disability resource center at each school. Common information required for such a letter includes a clear statement that the disorder and diagnosis are present, the symptoms experienced by the student veteran as a result of the diagnosis, and the impact of those symptoms on the veteran’s learning abilities. If possible, the letter also should specify recommended accommodations that can help the student veteran compensate for the disability. Additional details that some schools may request include associated psychological or medical diagnoses and a listing of medications prescribed to the veteran with AEs experienced. Depending on the institution’s individual policy, the letters may require yearly updates. Federal law forbids schools from requiring onerous amounts of documentation to support the need for academic accommodations.
How many of the preapproved accommodations are used is up to the student veteran. Depending on their baseline functional status and mental health issues, eligible veterans may not need to use all the accommodations each semester or for every class. However, formal accommodations are much easier to implement when needed if the student veteran already has the school preapprove them.
Conclusion
Acquired learning disabilities can prevent successful transition to the student veteran role. Implementation of academic reasonable accommodations is an important avenue by which qualifying post-9/11 student veterans with psychiatric diagnoses can compensate for the negative impact mental health symptoms have on learning styles and academic performance. Because academic stressors and emotional stability are closely intertwined, it is crucial that eligible post-9/11 veterans understand and accept the benefits that formal academic accommodations provide in postsecondary education. Academic accommodations should be offered to empower veterans with mental health concerns. A summary of academic reasonable accommodations is provided in Table 2.
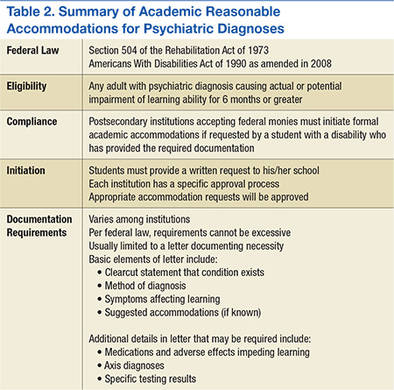
The way clinicians approach this topic will greatly influence veterans’ perspective on academic accommodations. Because there can be a stigma associated with the term learning disability in addition to a general lack of understanding about formal academic accommodations, post-9/11 veterans may not readily pursue the accommodations. Therefore, HCPs should be aware of the best methods for addressing student veterans’ concerns regarding identification of learning disabilities and use of academic accommodations. Unfortunately, information regarding these topics is not readily available in peer-reviewed literature or popular media. Therefore, in part 2, practical interventions for holding crucial conversations with post-9/11 veterans are discussed using a theoretical framework.
1. Barry AE, Whiteman SD, MacDermid Wadsworth S. Student service members/veterans in higher education: a systematic review. J Stud Aff Res Pract. 2014;51(1):30-42.
2. Vasterling JJ, Verfaellie M, Sullivan KD. Mild traumatic brain injury and posttraumatic stress disorder in returning veterans: perspectives from cognitive neuroscience. Clin Psychol Rev. 2009;29(8):674-684.
3. Church TE. Returning veterans on campus with war related injuries and the long road back home. J Postsecond Educ Disabil. 2009;22(1):43-52.
4. Ellison ML, Mueller L, Smelson D, et al. Supporting the education goals of post-9/11 veterans with self-reported PTSD symptoms: a needs assessment. Psychiatr Rehab J. 2012;35(3):209-217.
5. Burriss L, Ayers E, Ginsberg J, Powell DA. Learning and memory impairment in PTSD: relationship to depression. Depress Anxiety. 2008;25(2):149-157.
6. Sweeney JA, Kmiec JA, Kupfer DJ. Neuropsychologic impairments in bipolar and unipolar mood disorders on the CANTAB neurocognitive battery. Biol Psychiatry. 2000;48(7):674-684.
7. Chamberlain SR, Sahakian BJ. The neuropsychology of mood disorders. Curr Psychiatry Rep. 2006;8(6):458-463.
8. Jaeger J, Berns S, Uzelac S, Davis-Conway S. Neurocognitive deficits and disability in major depressive disorder. Psychiatry Res. 2006;145(1):39-48.
9. Fava M, Graves LM, Benazzi F, et al. A cross-sectional study of the prevalence of cognitive and physical symptoms during long-term antidepressant treatment. J Clin Psychiatry. 2006;67(11):1754-1759.
10. Senturk V, Goker C, Bilgic A, et al. Impaired verbal memory and otherwise spared cognition in remitted bipolar patients on monotherapy with lithium or valproate. Bipolar Disord. 2007;9(suppl 1):136-144.
11. Sayer NA, Noorbaloochi S, Frazier P, Carlson K, Gravely A, Murdoch M. Reintegration problems and treatment interests among Iraq and Afghanistan combat veterans receiving VA medical care. Psychiatr Serv. 2010;61(6):589-597.
12. Larson GE, Norman SB. Prospective prediction of functional difficulties among recently separated veterans. J Rehabil Res Dev. 2014;51(3):415-427.
13. Slone LB, Friedman MJ. After the War Zone: A Practical Guide for Returning Troops and Their Families. Boston, MA: Da Capo Press; 2008.
14. Walker RL, Clark ME, Sanders SH. The “postdeployment multi-symptom disorder”: an emerging syndrome in need of a new treatment paradigm. Psychol Serv. 2010;7(3):136-147.
15. DiRamio D, Ackerman R, Mitchell RL. From combat to campus: voices of student-veterans. NASPA J. 2008;45(1):73-102.
16. Rumann CB, Hamrick FA. Student veterans in transition: re-enrolling after war zone deployments. J High Educ. 2010;81(4):431-459.
17. Radford AW. Stats in Brief. Military Service Members and Veterans: A Profile of Those Enrolled in Undergraduate and Graduate Education in 2007-08. Washington, DC: U.S. Department of Education, National Center for Education Statistics: U.S. Government Printing Office; 2011.
18. Whiteman SD, Barry AE, Mroczek, DK, MacDermid Wadsworth S. The development and implications of peer emotional support for student service members/veterans and civilian college students. J Couns Psychol. 2013;60(2):265-278.
19. Griffin KA, Gilbert CK. Better transitions for troops: an application of Schlossberg’s transition framework to analyses of barriers and institutional support structures for student veterans. J High Educ. 2015;86(1):71-97.
20. Steel JL, Salcedo N, Coley J. Service Members in School: Military Veterans’ Experiences Using the Post-9/11 GI Bill and Pursuing Postsecondary Education. Rand Corporation Website. http://www.rand.org/content/dam/rand/pubs/monographs/2011/RAND_MG1083.pdf. Published November 2010. Accessed March 7, 2016.
21. Jones KC. Understanding student veterans in transition. Qual Rep. 2013;18:1-14. http://www.nova.edu/ssss/QR/QR18/jones74.pdf. Published September 16, 2013. Accessed March 7, 2016.
22. Saunders GH, Griest SE. Hearing loss in veterans and the need for hearing loss prevention programs. Noise Health. 2009;11(42):14-21.
23. Yankaskas K. Prelude: noise-induced tinnitus and hearing loss in the military. Hear Res. 2013;295:3-8.
24. Hart RP, Martelli MF, Zasler ND. Chronic pain and neuropsychological functioning. Neuropsychol Rev. 2000;10(3):131-149.
25. Sjogren P, Thomsen AB, Olsen AK. Impaired neuropsychological performance in chronic nonmalignant pain patients receiving long-term oral opioid therapy. J Pain Symptom Manage. 2000;19(2):100-108.
26. McDaniel N, Wolf G, Mahaffy C, Teggins J. Inclusion of students with disabilities in a college chemistry laboratory course. J Postsecond Educ Disabil. 1994;11(1):20-28.
27. Morissette SB, Woodward M, Kimbrel NA, et al. Deployment-related TBI, persistent postconcussive symptoms, PTSD, and depression in OEF/OIF veterans. Rehab Psychol. 2011;56(4):340-350.
28. Orff HJ, Hays CC, Heldreth AA, Stein MB, Twamley EW. Clinical considerations in the evaluation and management of patients following traumatic brain injury. Focus. 2013;11(3):328-340.
29. Schiehser DM, Twamley EW, Liu L, et al. The relationship between postconcussive symptoms and quality of life in veterans with mild to moderate traumatic brain injury. J Head Trauma Rehabil. 2014;30(4):E21-E28.
30. Carlson KF, Nelson D, Orazem RJ, Nugent S, Cifu DX, Sayer NA. Psychiatric diagnoses among Iraq and Afghanistan war veterans screened for deployment-related traumatic brain injury. J Trauma Stress. 2010;23(1):17-24.
31. Taylor BC, Hagel EM, Carlson KF, et al. Prevalence and costs of co-occurring traumatic brain injury with and without psychiatric disturbance and pain among Afghanistan and Iraq war veteran VA Users. Med Care. 2012;50(4):342-346.
32. Bryant RA, O’Donnell ML, Creamer M, McFarlane AC, Clark CR, Silove D. The psychiatric sequelae of traumatic injury. Am J Psychiatry. 2010;167(3):312-320.
33. Dolan S, Martindale S, Robinson J, et al. Neuropsychological sequelae of PTSD and TBI following war deployment among OEF/OIF veterans. Neuropsychol Rev. 2012;22(1):21-34.
34. Elliot M, Gonzalez C, Larsen B. U.S. military veterans transition to college: combat, PTSD, and alienation on campus. J Stud Aff Res Pract. 2011;48(3):279-296.
35. Rumann CB, Hamrick FA. Student veterans in transition: re-enrolling after war zone deployments. J High Educ. 2010;81(4):431-458.
36. Deroma VM, Leach JB, Leverett JP. The relationship between depression and college academic performance. Coll Stud J. 2009;43(2):325-334.
37. Brackney BE, Karabenick SA. Psychopathology and academic performance: the role of motivation and learning strategies. J Couns Psychol. 1995;42(4):456-465.
38. Airaksinen E, Larsson M, Lundberg I, Forsell Y. Cognitive functions in depressive disorders: evidence from a population-based study. Psychol Med. 2004;34(1):83-91.
39. United States Access Board. Americans with Disabilities Act (ADA) of 1990. United States Access Board Website. https://www.access-board.gov/the-board/laws/americans-with-disabilities-act-intro?highlights. Approved July 26, 1990. Accessed March 7, 2016.
Navigating the postsecondary educational pathway can be an intimidating process for post-9/11 veterans struggling with mental health concerns that may alter learning styles and negatively impact performance.1-4 When significant interference with learning ability is anticipated for more than 6 months, these veterans may qualify for formal academic “reasonable” accommodations under federal disability laws that include the Americans with Disabilities Act (ADA) of 1990 as amended in 2008 and Section 504 of the Rehabilitation Act of 1973. These accommodations enable students to compensate for learning disabilities and help support the transition to student life. Student veterans often are not aware of the existence of academic reasonable accommodations, because military separation classes, civilian postdeployment orientation, and popular media do not routinely cover information on this subject.
With an overall objective to ease veteran reintegration into the civilian world and promote emotional stability, health care providers (HCPs) are in a unique position to promote the use of formal academic accommodations for post-9/11 veterans with psychiatric conditions. However, HCPs must have basic information regarding these interventions before initiating discussions with patients. Current peer-reviewed medical literature has scant information regarding specific aspects of academic reasonable accommodations for individuals with psychiatric diagnoses.
The purpose of this 2-part article (part 2 will be published in May 2016) is to promote a greater understanding of academic accommodations for post-9/11 veterans with psychiatric diagnoses. Part 1 provides a brief background regarding issues pertinent to the post-9/11 student veteran role transition and reviews information regarding various aspects of academic reasonable accommodations, including details on the definition, request process, medical documentation requirements, and common accommodation examples.
Although the focus of the article is on the characteristics of post-9/11 veterans who have separated from military service, it also is relevant for providers involved with service members who have not yet separated. The impact of mental health issues, traumatic brain injury (TBI), and psychosocial stressors on learning ability are potentially applicable to many post-9/11 active-duty soldiers and reservists who are pursuing a secondary education. The academic reasonable accommodations discussed are available to any adult who meets the eligibility criteria—regardless of military status.
Influence of Psychiatric Symptoms on Learning
Although each mental health diagnosis is unique, mental health conditions involving mood share the common symptoms of impaired learning ability.3-8 Problems frequently experienced include decreased concentration, shortened attention span, difficulty in making new memories or storing new information, and the inability to recall information previously learned.6-8 Other reported conditions include difficulty with prioritization of tasks, losing track of time, difficulty focusing on tasks, and taking longer to complete assignments.3,4 Increased irritability accompanies many of these issues. Low tolerance to frustration may occur as evidenced by an outburst of anger or resignation to defeat when minor barriers are encountered, especially when authority figures or bureaucratic rules create those perceived barriers.3,4 Persistent impaired ability to articulate ideas or thoughts and difficulty performing abstract thinking also are often noticed when moderate-to-severe mental health symptoms are present.4,8
Medications commonly used to control psychiatric symptoms and stabilize underlying mental health also can produce adverse effects (AEs) that impact learning ability.9,10 Drug AEs vary but often include significant fatigue, impaired memory, and impaired executive function involving insight, judgment, and/or abstract thinking. Depending on the medication, the individual may experience restlessness or insomnia.
Factors Complicating Successful Integration
The transition period from military service to civilian life presents unique complications for student veterans with symptomatic psychiatric concerns.1,11 Veterans who separate from military service go through a civilian transition period of variable intensity influenced by readjustment difficulties and comorbid conditions.11,12 During this time, veterans are reintegrating into civilian life and assuming new roles that include partner, parent, employee, and family member. This transition can cause many symptoms to appear that potentially influence learning to varying degrees. A summary of impediments to learning in post-9/11 veterans is found in Table 1.
Common transition symptoms include irritability, decreased ability to store and recall information, decreased concentration, decreased attention, and slowed executive functioning.13,14 Sleep disturbances such as altered sleep-wake cycles, nonrestful sleep, inadequate sleep, and nightmares also may occur.13,14 Veterans experiencing these transition period symptoms may face significant difficulties with time management skills, organization, and task execution. If the veteran successfully assimilates into his or her new roles and becomes self-confident within those roles, the symptoms may abate. However, if moderate-to-severe psychiatric symptoms also are present, all transition symptoms likely will have an unpredictable time frame for resolution.3,13,14
Understanding the role responsibilities of student veterans is important in recognizing the added stressors veterans with psychiatric diagnoses have within the academic setting. In general, demographic data indicate that student veterans lead far more complex lives than those of 18- to 22-year-olds who enter postsecondary education without military experience. Student veterans are older, have a broader life experience, and may feel less connected to nonveteran students.15,16 Compared with typical younger college students, undergraduate student veterans are more likely to be married but somewhat less likely to be parents.17 Student veterans who are pursuing graduate degrees are more likely to be married and/or have dependents.17 Those roles imply that student veterans often are juggling multiple responsibilities that are constantly competing for student veterans’ time and attention.
Age differences, multiple roles, and lack of shared life experiences with traditional college students contribute to student veterans’ perceptions of a paucity of campus social support and often lead to a sense of distinct isolation.18,19 These added stressors deplete a veteran’s ability to concentrate on academic studies and may exacerbate the effects of underlying mental health diagnoses, transition issues, and medication use.
Symptomatic psychiatric diagnoses can amplify the difficulties normally experienced when changing from a veteran role to a student veteran role.1 The student veteran’s apprehension about returning to school often is elevated because of the time gap since the veteran was last in a formal, nonmilitary classroom. Acclimated to the structured style of military coursework for many years, student veterans may find adjusting to new teaching styles or different academic expectations awkward.20,21 They may experience heightened anxiety, because expectations of classroom performance may not be as clearcut as it was in the military. Such heightened anxiety can compound learning difficulties caused by underlying emotional states, transition issues, medication AEs, and life stressors.
Related: The VA/DoD Chronic Effects of Neurotrauma Consortium: An Overview at Year 1
Many student veterans with impaired learning ability related to psychiatric symptoms also have secondary physical diagnoses that can impede learning. For example, tinnitus and hearing loss are common in combat veterans.22,23 These issues make it hard to participate in a classroom setting because of difficulty in recognizing speech or filtering out background noise. For some, chronic pain may impede concentration, depress mood, worsen irritability, and make prolonged sitting difficult.24,25 Physical disabilities related to amputation or major joint injury may present challenges to participating in certain types of college settings and/or navigating between classes in a timely fashion.26
Although mild-to-moderate TBI sustained in combat often will spontaneously resolve within 3 months, in some individuals, TBI symptoms may persist after months or years.27,28 During this time, learning styles may be altered for veterans exposed to TBI. Similar to the effects caused by other factors impeding learning in post-9/11 veterans, common post-TBI symptoms that reduce academic performance include fatigue, decreased memory, slowed abstract thinking, difficulty articulating thoughts, poor tolerance to frustration, sleep difficulties, chronic pain, and increased irritability.27-29 Veterans with a history of mild TBI often are found to have clinically significant rates of depression, anxiety, or posttraumatic stress disorder (PTSD).27,28,30,31 These findings mirror those found in the general population.32 Mild TBI and PTSD may further complicate the learning process by exacerbating underlying mental health symptoms that already impair academic performance. The degree to which these individuals with TBI and mental health issues will return to premorbid academic functioning is not predictable based on current literature.33
Recognizing the stressors that some combat veterans face in an academic setting is vital to anticipating the added support that is needed by student veterans with concurrent moderate-to-severe psychiatric issues.34 Symptoms usually noted in the transition period may be much more pronounced. Automatic behaviors developed as survival responses during deployment can complicate participation in the educational arena.4,35 Seemingly mundane tasks, such as the daily school commute, can cause significant anxiety and hypervigilance especially when the veterans must navigate crowds and traffic formerly associated with risk of attack in combat-related circumstances.4 Minor roadway debris or roadside construction also can abnormally heighten anxiety because of reflex training to avoid potentially hidden explosive devices during convoy movements.4 Random assignment of a classroom seat can be stress-provoking, because combat veterans’ training compels them to position themselves with the greatest vantage point, usually nearest to exits and with minimal activity behind them.4,35 A need to constantly survey the surroundings for potential cover from hostile events can cause hyper alertness that distracts the student veteran’s full concentration on academic tasks.3,4
Although veterans should be able to adjust learning styles for minor issues or transitory problems, significant psychiatric symptoms have a negative effect on learning and pose a direct threat to academic performance.33,36-38 Moderate-to-severe psychiatric concerns may further heighten transition symptoms, compound psychosocial adjustment, and complicate TBI recovery. In addition, periods of high stress may further provoke symptoms of the underlying psychiatric diagnosis.
Reasonable Accommodations
In postsecondary education, reasonable accommodations are formal modifications or adjustments in the school environment that enable individuals with physical or psychological issues to successfully learn and function within the academic institution. In general, these academic accommodations for student veterans with mental health diagnoses involve modifying the learning environment to compensate for delays in executive functioning, such as memorization, recall, and complex analysis. Coursework is not altered; rather specific actions are used to assist the student to process and recall the material more easily. The reasonable accommodations also may be structured in a way that avoids exacerbating an underlying mental health diagnosis, such as PTSD or anxiety. The purpose of reasonable accommodations is to effectively remove barriers to a student veteran’s ability to learn and succeed academically.
Federal law states that reasonable accommodations must be implemented by all schools that accept federal monies—including GI bill payments.39 Although schools are not required to implement all preferred accommodations requested by veterans, academic institutions are required to implement reasonable, effective strategies for the individual student veteran with a psychological diagnosis that causes learning impairment. However, these institutions are not required to proactively determine who might qualify for such accommodations. A school will not initiate formal academic accommodations unless a veteran makes a specific request and provides qualifying documentation.
Many veterans qualify for reasonable accommodations in the academic setting to compensate for the negative impact that mental health issues can have on academic performance. Specifically, student veterans with psychiatric diagnoses are classified as having a learning disability and are eligible to receive academic accommodations if the psychiatric condition substantially limits, or is expected to limit, learning for more than 6 months.39 Individuals with psychiatric conditions in remission are still classified as having a disability if the disorder would impede learning when symptomatic. A veteran does not need to establish verification of a psychiatric diagnosis connected to military service in order to receive formal academic accommodations. Student veterans who qualify for formal academic accommodations can be fully functional in all other areas of their lives. Examples of qualifying psychiatric diagnoses include PTSD, depression, anxiety, bipolar disorder, and schizophrenia.
Although accommodations are individually tailored, there are frequently used accommodations for student veterans with psychiatric diagnoses that have been extremely helpful for those who qualify. Additional time for testing helps the student veteran compensate for the difficulty with abstract thinking, concentration, attention, and recall. Low stimulus testing environments, such as a quiet room, enable a veteran to more easily concentrate. Additional time for completion of assignments without academic penalties is beneficial for a veteran experiencing difficulty with attention, focus, concentration, and organization. Assistance with note-taking or advanced access to lecture notes helps the veteran compensate for decreased focus, attention, and short-term memory impairment. Permitting short breaks without repercussions during a lecture allows the veteran to regain focus and composure if he or she is having difficulties with concentration, attention, restlessness, anxiety, body pain, or emotional flares. Tutoring can help the veteran overcome slowed executive functioning. Faculty-approved notes on an index card may help the veteran compensate for extreme difficulty with memory recall. To prevent visual distraction while reading, use of a blank note card or blank sheet of paper during testing may make it easier for the veteran to focus on each sentence or test question.
On a case-by-case basis, other creative strategies may be used to enable the student veteran to participate more fully in the academic setting. Preferential class scheduling can be arranged to compensate for severely altered sleep patterns. Such changes to the schedule mean a veteran would not have to attend classes during a time frame when his or her body is accustomed to sleeping. Flexibility with class attendance decreases external stressors for the veteran who is having intermittent difficulty with severe sleep disturbances or anxiety in group settings. “Unstacking” midterms or finals allows the student veteran to avoid back-to-back exams and enables him or her to study more effectively for each exam. Virtual classes with self-pacing options may provide more flexibility to complete course requirements while the veteran is dealing with fluctuating emotional symptoms.
Legal Process
Barring undue hardship to provide accommodations, the ADA of 1990 as amended in 2008 and Section 504 of the Rehabilitation Act of 1973 enable equal rights and access to benefits and services for all individuals with disabilities to the same degree as persons without such disabilities in multiple environments including the academic setting. Although the U.S. military system narrowly interprets the term disability, individuals classified as having disabilities under these federal laws fall under a much broader definition. Specifically, any person with “a physical or mental impairment that constitutes or results in substantial impediment” of one of life’s major activities is considered to have a disability.39 As per the ADA of 1990, learning is defined as one of the major life activities.39 This law recognizes that the individual with a learning disability may be fully functional in all other areas of his or her life.
Related: Using Life Stories to Connect Veterans and Providers
Because students must officially request and receive approval for these accommodations within the academic institution, the veteran should speak with the school’s disability resource center counselor regarding the process. If the school does not have a disability resource center, then the student veteran should speak to an admissions counselor at the academic facility. The discussion with the facility’s counselor should include which types of accommodations may be possible to compensate for the veteran’s learning impediments. The counselor will inform the veteran of the required medical documentation that enables the school to grant the needed academic accommodations. In general, veterans can qualify for academic accommodations by receiving a letter with medical documentation of the psychiatric disorder, its anticipated effect on learning, and if known, the suggested reasonable accommodations to compensate for the learning deficit. The veteran can receive a qualifying letter from a psychologist, psychiatrist, PCP, social worker, or licensed counselor with the expertise to diagnose and document the disorder. Student veterans can take this letter to the school’s disability resource center to enable the institution to approve and adopt the accommodations for the student veteran. To ensure compliance with privacy regulations and any facility privacy policies, most providers require a signed release of information form before providing the medical documentation letter.
Such letters need to contain only the basic information required by the disability resource center at each school. Common information required for such a letter includes a clear statement that the disorder and diagnosis are present, the symptoms experienced by the student veteran as a result of the diagnosis, and the impact of those symptoms on the veteran’s learning abilities. If possible, the letter also should specify recommended accommodations that can help the student veteran compensate for the disability. Additional details that some schools may request include associated psychological or medical diagnoses and a listing of medications prescribed to the veteran with AEs experienced. Depending on the institution’s individual policy, the letters may require yearly updates. Federal law forbids schools from requiring onerous amounts of documentation to support the need for academic accommodations.
How many of the preapproved accommodations are used is up to the student veteran. Depending on their baseline functional status and mental health issues, eligible veterans may not need to use all the accommodations each semester or for every class. However, formal accommodations are much easier to implement when needed if the student veteran already has the school preapprove them.
Conclusion
Acquired learning disabilities can prevent successful transition to the student veteran role. Implementation of academic reasonable accommodations is an important avenue by which qualifying post-9/11 student veterans with psychiatric diagnoses can compensate for the negative impact mental health symptoms have on learning styles and academic performance. Because academic stressors and emotional stability are closely intertwined, it is crucial that eligible post-9/11 veterans understand and accept the benefits that formal academic accommodations provide in postsecondary education. Academic accommodations should be offered to empower veterans with mental health concerns. A summary of academic reasonable accommodations is provided in Table 2.
The way clinicians approach this topic will greatly influence veterans’ perspective on academic accommodations. Because there can be a stigma associated with the term learning disability in addition to a general lack of understanding about formal academic accommodations, post-9/11 veterans may not readily pursue the accommodations. Therefore, HCPs should be aware of the best methods for addressing student veterans’ concerns regarding identification of learning disabilities and use of academic accommodations. Unfortunately, information regarding these topics is not readily available in peer-reviewed literature or popular media. Therefore, in part 2, practical interventions for holding crucial conversations with post-9/11 veterans are discussed using a theoretical framework.
1. Barry AE, Whiteman SD, MacDermid Wadsworth S. Student service members/veterans in higher education: a systematic review. J Stud Aff Res Pract. 2014;51(1):30-42.
2. Vasterling JJ, Verfaellie M, Sullivan KD. Mild traumatic brain injury and posttraumatic stress disorder in returning veterans: perspectives from cognitive neuroscience. Clin Psychol Rev. 2009;29(8):674-684.
3. Church TE. Returning veterans on campus with war related injuries and the long road back home. J Postsecond Educ Disabil. 2009;22(1):43-52.
4. Ellison ML, Mueller L, Smelson D, et al. Supporting the education goals of post-9/11 veterans with self-reported PTSD symptoms: a needs assessment. Psychiatr Rehab J. 2012;35(3):209-217.
5. Burriss L, Ayers E, Ginsberg J, Powell DA. Learning and memory impairment in PTSD: relationship to depression. Depress Anxiety. 2008;25(2):149-157.
6. Sweeney JA, Kmiec JA, Kupfer DJ. Neuropsychologic impairments in bipolar and unipolar mood disorders on the CANTAB neurocognitive battery. Biol Psychiatry. 2000;48(7):674-684.
7. Chamberlain SR, Sahakian BJ. The neuropsychology of mood disorders. Curr Psychiatry Rep. 2006;8(6):458-463.
8. Jaeger J, Berns S, Uzelac S, Davis-Conway S. Neurocognitive deficits and disability in major depressive disorder. Psychiatry Res. 2006;145(1):39-48.
9. Fava M, Graves LM, Benazzi F, et al. A cross-sectional study of the prevalence of cognitive and physical symptoms during long-term antidepressant treatment. J Clin Psychiatry. 2006;67(11):1754-1759.
10. Senturk V, Goker C, Bilgic A, et al. Impaired verbal memory and otherwise spared cognition in remitted bipolar patients on monotherapy with lithium or valproate. Bipolar Disord. 2007;9(suppl 1):136-144.
11. Sayer NA, Noorbaloochi S, Frazier P, Carlson K, Gravely A, Murdoch M. Reintegration problems and treatment interests among Iraq and Afghanistan combat veterans receiving VA medical care. Psychiatr Serv. 2010;61(6):589-597.
12. Larson GE, Norman SB. Prospective prediction of functional difficulties among recently separated veterans. J Rehabil Res Dev. 2014;51(3):415-427.
13. Slone LB, Friedman MJ. After the War Zone: A Practical Guide for Returning Troops and Their Families. Boston, MA: Da Capo Press; 2008.
14. Walker RL, Clark ME, Sanders SH. The “postdeployment multi-symptom disorder”: an emerging syndrome in need of a new treatment paradigm. Psychol Serv. 2010;7(3):136-147.
15. DiRamio D, Ackerman R, Mitchell RL. From combat to campus: voices of student-veterans. NASPA J. 2008;45(1):73-102.
16. Rumann CB, Hamrick FA. Student veterans in transition: re-enrolling after war zone deployments. J High Educ. 2010;81(4):431-459.
17. Radford AW. Stats in Brief. Military Service Members and Veterans: A Profile of Those Enrolled in Undergraduate and Graduate Education in 2007-08. Washington, DC: U.S. Department of Education, National Center for Education Statistics: U.S. Government Printing Office; 2011.
18. Whiteman SD, Barry AE, Mroczek, DK, MacDermid Wadsworth S. The development and implications of peer emotional support for student service members/veterans and civilian college students. J Couns Psychol. 2013;60(2):265-278.
19. Griffin KA, Gilbert CK. Better transitions for troops: an application of Schlossberg’s transition framework to analyses of barriers and institutional support structures for student veterans. J High Educ. 2015;86(1):71-97.
20. Steel JL, Salcedo N, Coley J. Service Members in School: Military Veterans’ Experiences Using the Post-9/11 GI Bill and Pursuing Postsecondary Education. Rand Corporation Website. http://www.rand.org/content/dam/rand/pubs/monographs/2011/RAND_MG1083.pdf. Published November 2010. Accessed March 7, 2016.
21. Jones KC. Understanding student veterans in transition. Qual Rep. 2013;18:1-14. http://www.nova.edu/ssss/QR/QR18/jones74.pdf. Published September 16, 2013. Accessed March 7, 2016.
22. Saunders GH, Griest SE. Hearing loss in veterans and the need for hearing loss prevention programs. Noise Health. 2009;11(42):14-21.
23. Yankaskas K. Prelude: noise-induced tinnitus and hearing loss in the military. Hear Res. 2013;295:3-8.
24. Hart RP, Martelli MF, Zasler ND. Chronic pain and neuropsychological functioning. Neuropsychol Rev. 2000;10(3):131-149.
25. Sjogren P, Thomsen AB, Olsen AK. Impaired neuropsychological performance in chronic nonmalignant pain patients receiving long-term oral opioid therapy. J Pain Symptom Manage. 2000;19(2):100-108.
26. McDaniel N, Wolf G, Mahaffy C, Teggins J. Inclusion of students with disabilities in a college chemistry laboratory course. J Postsecond Educ Disabil. 1994;11(1):20-28.
27. Morissette SB, Woodward M, Kimbrel NA, et al. Deployment-related TBI, persistent postconcussive symptoms, PTSD, and depression in OEF/OIF veterans. Rehab Psychol. 2011;56(4):340-350.
28. Orff HJ, Hays CC, Heldreth AA, Stein MB, Twamley EW. Clinical considerations in the evaluation and management of patients following traumatic brain injury. Focus. 2013;11(3):328-340.
29. Schiehser DM, Twamley EW, Liu L, et al. The relationship between postconcussive symptoms and quality of life in veterans with mild to moderate traumatic brain injury. J Head Trauma Rehabil. 2014;30(4):E21-E28.
30. Carlson KF, Nelson D, Orazem RJ, Nugent S, Cifu DX, Sayer NA. Psychiatric diagnoses among Iraq and Afghanistan war veterans screened for deployment-related traumatic brain injury. J Trauma Stress. 2010;23(1):17-24.
31. Taylor BC, Hagel EM, Carlson KF, et al. Prevalence and costs of co-occurring traumatic brain injury with and without psychiatric disturbance and pain among Afghanistan and Iraq war veteran VA Users. Med Care. 2012;50(4):342-346.
32. Bryant RA, O’Donnell ML, Creamer M, McFarlane AC, Clark CR, Silove D. The psychiatric sequelae of traumatic injury. Am J Psychiatry. 2010;167(3):312-320.
33. Dolan S, Martindale S, Robinson J, et al. Neuropsychological sequelae of PTSD and TBI following war deployment among OEF/OIF veterans. Neuropsychol Rev. 2012;22(1):21-34.
34. Elliot M, Gonzalez C, Larsen B. U.S. military veterans transition to college: combat, PTSD, and alienation on campus. J Stud Aff Res Pract. 2011;48(3):279-296.
35. Rumann CB, Hamrick FA. Student veterans in transition: re-enrolling after war zone deployments. J High Educ. 2010;81(4):431-458.
36. Deroma VM, Leach JB, Leverett JP. The relationship between depression and college academic performance. Coll Stud J. 2009;43(2):325-334.
37. Brackney BE, Karabenick SA. Psychopathology and academic performance: the role of motivation and learning strategies. J Couns Psychol. 1995;42(4):456-465.
38. Airaksinen E, Larsson M, Lundberg I, Forsell Y. Cognitive functions in depressive disorders: evidence from a population-based study. Psychol Med. 2004;34(1):83-91.
39. United States Access Board. Americans with Disabilities Act (ADA) of 1990. United States Access Board Website. https://www.access-board.gov/the-board/laws/americans-with-disabilities-act-intro?highlights. Approved July 26, 1990. Accessed March 7, 2016.
An ECHO-Based Program to Provide Geriatric Specialty Care Consultation and Education
Veterans aged > 85 years are the fastest growing cohort; they are living longer with multiple chronic conditions and functional impairments.1,2 The majority of older veterans (94.6% or about 1.89 million) seeking services in the VA obtain care through primary care providers (PCPs) who are usually not formally trained in geriatrics.1,3 A 2008 Institute of Medicine report noted that geriatric training was inadequate not only for physicians, but also for all health professions.4 For these reasons, new models of care are needed to improve access to geriatric specialists and to improve geriatric care provided by PCPs, especially in rural settings.
In 2010, VA adopted the Patient Aligned Care Team (PACT), based on the patient-centered medical home model, to improve primary care services.5 The PACT was designed to deliver patient-centered care and incorporate a team approach to provide comprehensive, coordinated, and personalized care—common themes found in quality geriatric care.4-6
To provide specialty care support, other programs also were initiated, including the Specialty Care Access Network-Extension for Community Healthcare Outcomes (SCAN-ECHO). It was implemented in 2011 to increase veteran’s access to specialty care providers and educate PCPs in the treatment of specific diseases. The SCAN-ECHO program is a case-based provider education program conducted via a videoconference that usually occurs monthly and is initiated by a referring PCP for a specific disease or topic.
An interdisciplinary team developed the Geriatric SCAN-ECHO program to help improve veteran access to geriatric specialists and influence care provided to older patients seen by PACTs. The team consisted of a geriatrician, gerontological nurse practitioner (NP), registered nurse (RN), neuropsychologist, social worker (SW), pharmacist, and clinic manager. The geriatric team was located in an urban, academic geriatric specialty clinic in VISN 22 that served 2 ambulatory care centers and 8 satellite community-based outpatient clinics (CBOCs). Veterans using the CBOCs had no direct access to geriatric specialists without traveling to the clinic, which for some could be up to 200 miles away.
This article describes the lessons learned from the implementation of a Geriatric SCAN-ECHO program, preliminary staff survey and chart review results. The program began in January 2013 and ended in February 2014. The article also offers recommendations to increase understanding of geriatric principles for PCP teams.
The Geriatric SCAN-ECHO Program
After obtaining patient consent, primary care clinicians submitted a consult that included the reason for referral (Figure 1). This list of reasons (eg, behavioral management of geriatric syndromes, care management strategies for patients with dementia, caregiver support strategies, and strategies for the patient to continue living in the community safely) assisted the referring clinician in identifying potential cases that might benefit from a geriatric interdisciplinary case review. Patient approval to contact a caregiver or spouse was requested so the Geriatric SCAN-ECHO team could gather additional information.
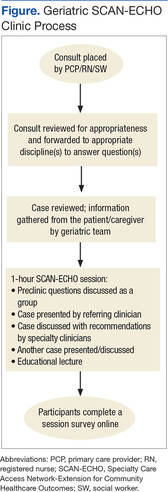
After the team received the consult, the gerontological NP or geriatrician reviewed the case and identified other relevant members of the team. The electronic medical record (EMR) was reviewed and a phone call made to the patient and/or their caregiver by the appropriate team member to obtain more information, which could include the patient’s current living situation by the social worker, a medication review by the pharmacist, and functional assessment (eg, basic and instrumental activities of daily living) by the nurse. If appropriate, the geriatrician used the Montreal Cognitive Assessment (MoCA)-BLIND to assess the patient’s cognitive abilities.7 Finally, the team met to reach a consensus on final recommendations and to identify the didactic lecture topic related to the case being reviewed and presented by members of the Geriatric SCAN-ECHO team.
At the start of each SCAN-ECHO session, the geriatrician asked participants 2 to 3 questions on the clinical topic to be covered to elicit interest and motivation to learn. The referring clinician provided a short summary of the case and reason for referral, and the Geriatric SCAN-ECHO team then provided individual findings and recommendations. Due to the complexity of the referrals, the team usually was able to process 1 to 2 cases during the 1-hour session, with 15 minutes allocated for the didactic.
The didactic lectures consisted of evidence-based tools and guidelines that focused on changing provider practice behavior (eg, Assessing Care of Vulnerable Elders criteria) and were posted on the Geriatric SCAN-ECHO SharePoint site after the session for clinicians to download.8 The topics covered included fall risk and prevention; the screening, diagnosis, and management of cognitive disorders; psychosocial considerations in older adults; use of anticholinergic drugs; and assessment and management of unsafe geriatric drivers. Participants were then sent a survey to evaluate the usefulness of the session and its impact on the clinician’s practice. At the end of each session, a summary of findings and recommendations by the geriatric team also was documented in the patient’s EMR and forwarded to the referring clinician. Several factors differentiated the Geriatric from other SCAN-ECHO specialty programs. First, nurses and SWs were invited to place consults, because they were often the first clinicians to identify problems. In a typical SCAN-ECHO program, only PCPs place a consult to the specialty clinic. Second, an interdisciplinary team responded to consults. This was done so that members of the PACT could learn about domains covered by the other disciplines and receive discipline-specific guidance (SCAN-ECHO consults are often answered by a specialist). Third, the team supplemented EMR records with telephone-based assessments. Most SCAN-ECHO programs relied mainly on EMR records.
Facilitators
Although the Geriatric SCAN-ECHO program began in January 2013, the VA Greater Los Angeles Healthcare System facility already had several SCAN-ECHO programs. An experienced SCAN-ECHO project director assisted in the implementation of the program. The specialists used existing documents to guide the program, such as a service agreement between SCAN-ECHO and the participating satellite facilities and templates for consults and documentation. Other benefits of the established SCAN-ECHO presence included availability of videoconferencing equipment; local clinical informatics staff who were familiar with the setup of interfacility consults, clinic encounters, and workload credit in the EMR; and PACT clinicians who were familiar with the SCAN-ECHO program and format. Finally, the geriatric interdisciplinary team members had worked together cohesively for years and were supported by the Geriatric Research Education and Clinical Center to implement clinical demonstration projects, such as the SCAN-ECHO program.
Implementation Barriers
Initially the program received few consults. The Geriatric SCAN-ECHO program used a sample case to start the discussion and focused on falls. At times there were also only a small number of facilities and attendees who participated. Most of the attendees were MDs and NPs from Primary Care and Psychiatry. None of the nurses or SWs who were invited by their local leadership participated early on. Informal communication with CBOC staff found that they were feeling overwhelmed with other competing demands. There were multiple SCAN-ECHO programs and no protected time to attend the sessions. In addition, nurses might not have identified the program as a priority because the training topic was too general (geriatrics vs pressure ulcer or pain management).
The Geriatric SCAN-ECHO program adjusted the timing of sessions to convene every other month on a day that most CBOCs had staff meetings, allowing for protected time for staff participation. The CBOC staff was invited again to participate. The gerontological NP contacted the referring clinician to report the date of the case review and followed up afterward to ensure that all questions were answered and recommendations were clear.
The increase in marketing and networking led to more facilities participating; however, the number of staff participants remained low. The program team then changed tactics and focused on facilitating specific clinician behavior changes related to common geriatric syndromes instead of case reviews. The team conducted a session providing an overview of dementia recognition and diagnosis, rationale for objective measures, and a demonstration on the administration of the Mini-Cog Assessment Instrument for Dementia and Montreal Cognitive Assessment (MoCA) tools.7 This session had the highest number of total attendees (38), half of whom were nurses.
Feedback after the session resulted in an additional session the following month, which focused on the scoring and documentation of the tools as well as interpretation of the results and how this might be further evaluated by the team. Informal feedback gathered from nurses during this second session included a request for more training, tips on how to administer the tools, and how to document competency in tool administration. A new educational project that would empower PACT nurses to proactively identify and initiate cognitive impairment/dementia evaluations was then started independent of the Geriatric SCAN-ECHO program.
Results
Participants of SCAN-ECHO programs were surveyed on usefulness of information and its influence on their practice (Table 1). A total of 41 respondents (the same person may have attended more than 1 session) completed surveys on 9 Geriatric SCAN-ECHO sessions. Nineteen (46%) were medical doctors, 8 (20%) were NPs, and 14 (34%) were from other disciplines. Overall, the sessions were well received, and participants found the information useful. Because the respondents were from different disciplines and roles, it was not surprising that only 13 respondents (32%) felt that the information would influence their prescribing practices, and only 18 respondents (44%) agreed that the session changed their ordering of diagnostic tests and studies.
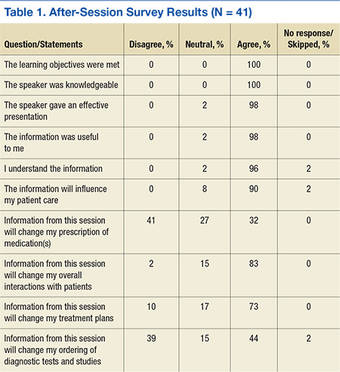
Chart Reviews
Six months after completion of the Geriatric SCAN-ECHO session, the gerontological NP reviewed patient charts and identified rates of adherence for geriatric team recommendations. Eight patient cases were reviewed in 6 of the 9 sessions. The other sessions used sample cases from the team’s experience due to lack of submitted consults. Physicians referred 4 cases, and the rest were from NPs; all were from primary care except for a primary mental health NP. Half of the referred cases were forwarded from other departments (eg, neurobehavior and dementia clinics) to avoid travel. Reasons for referral included geriatric syndrome workup and specific medical questions. All patients were men aged 66 to 94 years (mean = 83.25; SD = 8.29).
Table 2 lists the frequency and adherence to recommendations. If the recommendation was discussed but refused by the patient, it was still noted as completed. Several recommendations might have been presented; thus, adherence to recommendations was categorized as “all,” “some,” or “not at all” adherent. Because the referrals involved complex cases, most cases were referred to other clinical programs managed by the geriatric specialty team for further evaluation and management.
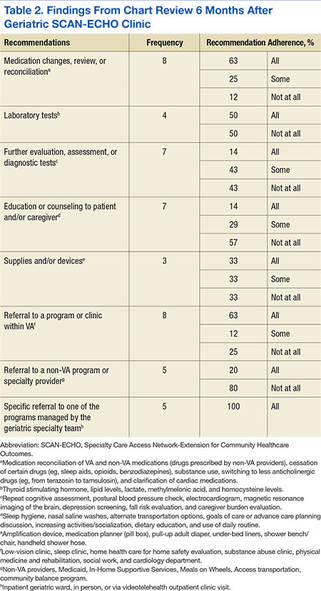
Discussion
Although the Geriatric SCAN-ECHO sessions were well received, the impact of the program was limited by the lack of consults and PACT team involvement. Impact was markedly improved once the focus of the sessions changed from case studies to specific clinical tool administration/practice change. Leadership support and coordination to provide protected team learning time was essential. Incentives to participate might include making geriatric quality indicators part of performance measures to improve practice and quality of care. Although the VA monitors several frail elderly measures that are a reflection of quality geriatric care, it is up to each VISN to determine its performance measures (Kenneth Shay, e-mail communication, February 12, 2013).
The most frequently followed recommendation was referral to a program managed by the geriatric specialty team. Full compliance with this recommendation may be due to the ease of placing a single consult and the interaction between the SCAN-ECHO team and the geriatric specialty services staff. The next most commonly followed recommendations were for medication changes/review and referral to a different program or clinic (not inpatient or outpatient geriatric specialty programs). Because completion of medication reconciliation reminders are tied to pay incentives for VA physicians, this may explain why it was fulfilled at a higher rates compared with other recommendations, suggesting that bonus incentives could boost participation.
The least frequently completed recommendations were referrals to non-VA programs or specialty providers. This may be a reflection of poor communication with non-VA providers and/or documentation of such communications and lack of the availability of the programs near the patient’s residence. Developing remote site referral guides might improve this communication.
Another type of recommendation that was partially or not at all followed was for further evaluation, assessment, or diagnostic tests of specific problems identified by the Geriatric SCAN-ECHO team. This may be due to lack of easy access to specific diagnostic tests in outpatient clinics or lack of staff knowledge and skills on doing geriatric-specific evaluations. The chart reviewer also noted that even when the PCP did the evaluations, the quality was below standard; for example, for depression screening, the chart noted that the patient was asked about having depression; however, no specific tool was used to aid in the diagnosis. Further specificity regarding geriatric syndrome evaluations and increasing staff knowledge of common tools to aid in diagnosis and evaluation are needed.
In 2 of the 8 cases reviewed, the Geriatric SCAN-ECHO program recommended that specific family members needed to be involved in the care of the patient. Unfortunately, most often family members only were used as a means of communication or for coordination of care with the PACT teams (eg, scheduling appointments). Changes needed to provide quality care for geriatric veterans are to include family members, use a fully-realized PACT approach, and have nurses “practice to the full extent of their education and training,” as recommended by the Institute of Medicine.9
Limitations
This article reported on the experience of a geriatric team that implemented an interdisciplinary telehealth-based consultation program. Facilitators and barriers to program execution may be limited to the local site and VA. The survey following the session was developed by the VA SCAN-ECHO program and was not specific to this local program. Limitations of the chart review include a short follow-up of only 6 months after the program. Many of the behavioral changes or educational recommendations might have been discussed but were not documented. Also services done by non-VA providers might not have been documented and, therefore, would not have been included in this chart review.
Conclusions
The geriatric team decided to discontinue the Geriatric SCAN-ECHO program. The key metric for program success was number of cases reviewed. Only 1 to 2 cases were reviewed every other month. Participation in the program markedly increased when the specific learning needs of PACT teams were addressed; however, most cases were referred to GRECC due to the case complexity and were not appropriate for the SCAN-ECHO format. The chart review, patient and caregiver contact, and presentation preparation required the program staff to invest a significant amount time. It took 3 to 4 hours for the staff to prepare for each case. Furthermore, adherence to recommendations was also poor.
Case-based education and training without follow-up of the recommendations likely is not the best approach to improve care of older veterans in the primary care setting. The authors hope that focusing on specific practice changes and working directly with PACTs and specific team members will be more productive and result in improved outcomes for older veterans. Due to the complexity of geriatric cases involving physical, cognitive, and emotional vulnerabilities, these cases may be better handled by direct multidisciplinary examinations.
Acknowledgments
Funding for this project was supported by the Veterans Health Administration Office of Specialty Care Services T-21 funding initiative.
1. U.S. Department of Veterans Affairs. Geriatric ambulatory care. VHA handbook 1140.10. U.S. Department of Veterans Affairs Website. http://www.va.gov/vhapublications/publications.cfm?pub=2. Published April 26, 2010. Accessed March 9, 2016.
2. Federal Interagency Forum on Aging-Related Statistics. Older Americans 2012: Key Indicators of Well-Being. Washington, DC: U.S. Government Printing Office; 2012.
3. Shay K, Schectman G. Primary care for older veterans. Generations. 2010;34(2):35-42.
4. Institute of Medicine. Retooling for an Aging America: Building the Health Care Workforce. Washington, DC: The National Academies Press; 2008.
5. U.S. Department of Veterans Affairs. Patient centered medical home model concept paper. U.S. Department of Veterans Affairs Website. http://www.vacareers.va.gov/assets/common/print/pcmh_conceptpaper.pdf. Published May 23, 2012. Accessed March 9, 2016.
6. Berenson RA, Devers KJ, Burton RA. Will the patient-centered medical home transform the delivery of health care? Urban Institute Website. http://www.urban.org/sites/default/files/alfresco/publication-pdfs/412373-Will-the-Patient-Centered-Medical-Home-Transform-the-Delivery-of-Health-Care-.pdf. Published August 2011. Accessed March 9, 2016.
7. Nasreddine D. MoCA-BLIND. Version 7.1 Original Version. Montreal Cognitive Assessment Website. http://www.mocatest.org/pdf_files/test/MoCA-Test-BLIND.pdf. Accessed March 9, 2016.
8. RAND Health Researchers. Assessing care of vulnerable elders (ACOVE). RAND Corporation Website. http://www.rand.org/health/projects.acove.html. Accessed March 9, 2016.
9. Institute of Medicine. The future of nursing: leading change, advancing health. Institute of Medicine Website. http://www.iom.edu/Reports/2010/The-future-of-nursing-leading-change-advancing-health.aspx. Published October 5, 2010. Updated October 5, 2015. Accessed March 9, 2016.
Veterans aged > 85 years are the fastest growing cohort; they are living longer with multiple chronic conditions and functional impairments.1,2 The majority of older veterans (94.6% or about 1.89 million) seeking services in the VA obtain care through primary care providers (PCPs) who are usually not formally trained in geriatrics.1,3 A 2008 Institute of Medicine report noted that geriatric training was inadequate not only for physicians, but also for all health professions.4 For these reasons, new models of care are needed to improve access to geriatric specialists and to improve geriatric care provided by PCPs, especially in rural settings.
In 2010, VA adopted the Patient Aligned Care Team (PACT), based on the patient-centered medical home model, to improve primary care services.5 The PACT was designed to deliver patient-centered care and incorporate a team approach to provide comprehensive, coordinated, and personalized care—common themes found in quality geriatric care.4-6
To provide specialty care support, other programs also were initiated, including the Specialty Care Access Network-Extension for Community Healthcare Outcomes (SCAN-ECHO). It was implemented in 2011 to increase veteran’s access to specialty care providers and educate PCPs in the treatment of specific diseases. The SCAN-ECHO program is a case-based provider education program conducted via a videoconference that usually occurs monthly and is initiated by a referring PCP for a specific disease or topic.
An interdisciplinary team developed the Geriatric SCAN-ECHO program to help improve veteran access to geriatric specialists and influence care provided to older patients seen by PACTs. The team consisted of a geriatrician, gerontological nurse practitioner (NP), registered nurse (RN), neuropsychologist, social worker (SW), pharmacist, and clinic manager. The geriatric team was located in an urban, academic geriatric specialty clinic in VISN 22 that served 2 ambulatory care centers and 8 satellite community-based outpatient clinics (CBOCs). Veterans using the CBOCs had no direct access to geriatric specialists without traveling to the clinic, which for some could be up to 200 miles away.
This article describes the lessons learned from the implementation of a Geriatric SCAN-ECHO program, preliminary staff survey and chart review results. The program began in January 2013 and ended in February 2014. The article also offers recommendations to increase understanding of geriatric principles for PCP teams.
The Geriatric SCAN-ECHO Program
After obtaining patient consent, primary care clinicians submitted a consult that included the reason for referral (Figure 1). This list of reasons (eg, behavioral management of geriatric syndromes, care management strategies for patients with dementia, caregiver support strategies, and strategies for the patient to continue living in the community safely) assisted the referring clinician in identifying potential cases that might benefit from a geriatric interdisciplinary case review. Patient approval to contact a caregiver or spouse was requested so the Geriatric SCAN-ECHO team could gather additional information.
After the team received the consult, the gerontological NP or geriatrician reviewed the case and identified other relevant members of the team. The electronic medical record (EMR) was reviewed and a phone call made to the patient and/or their caregiver by the appropriate team member to obtain more information, which could include the patient’s current living situation by the social worker, a medication review by the pharmacist, and functional assessment (eg, basic and instrumental activities of daily living) by the nurse. If appropriate, the geriatrician used the Montreal Cognitive Assessment (MoCA)-BLIND to assess the patient’s cognitive abilities.7 Finally, the team met to reach a consensus on final recommendations and to identify the didactic lecture topic related to the case being reviewed and presented by members of the Geriatric SCAN-ECHO team.
At the start of each SCAN-ECHO session, the geriatrician asked participants 2 to 3 questions on the clinical topic to be covered to elicit interest and motivation to learn. The referring clinician provided a short summary of the case and reason for referral, and the Geriatric SCAN-ECHO team then provided individual findings and recommendations. Due to the complexity of the referrals, the team usually was able to process 1 to 2 cases during the 1-hour session, with 15 minutes allocated for the didactic.
The didactic lectures consisted of evidence-based tools and guidelines that focused on changing provider practice behavior (eg, Assessing Care of Vulnerable Elders criteria) and were posted on the Geriatric SCAN-ECHO SharePoint site after the session for clinicians to download.8 The topics covered included fall risk and prevention; the screening, diagnosis, and management of cognitive disorders; psychosocial considerations in older adults; use of anticholinergic drugs; and assessment and management of unsafe geriatric drivers. Participants were then sent a survey to evaluate the usefulness of the session and its impact on the clinician’s practice. At the end of each session, a summary of findings and recommendations by the geriatric team also was documented in the patient’s EMR and forwarded to the referring clinician. Several factors differentiated the Geriatric from other SCAN-ECHO specialty programs. First, nurses and SWs were invited to place consults, because they were often the first clinicians to identify problems. In a typical SCAN-ECHO program, only PCPs place a consult to the specialty clinic. Second, an interdisciplinary team responded to consults. This was done so that members of the PACT could learn about domains covered by the other disciplines and receive discipline-specific guidance (SCAN-ECHO consults are often answered by a specialist). Third, the team supplemented EMR records with telephone-based assessments. Most SCAN-ECHO programs relied mainly on EMR records.
Facilitators
Although the Geriatric SCAN-ECHO program began in January 2013, the VA Greater Los Angeles Healthcare System facility already had several SCAN-ECHO programs. An experienced SCAN-ECHO project director assisted in the implementation of the program. The specialists used existing documents to guide the program, such as a service agreement between SCAN-ECHO and the participating satellite facilities and templates for consults and documentation. Other benefits of the established SCAN-ECHO presence included availability of videoconferencing equipment; local clinical informatics staff who were familiar with the setup of interfacility consults, clinic encounters, and workload credit in the EMR; and PACT clinicians who were familiar with the SCAN-ECHO program and format. Finally, the geriatric interdisciplinary team members had worked together cohesively for years and were supported by the Geriatric Research Education and Clinical Center to implement clinical demonstration projects, such as the SCAN-ECHO program.
Implementation Barriers
Initially the program received few consults. The Geriatric SCAN-ECHO program used a sample case to start the discussion and focused on falls. At times there were also only a small number of facilities and attendees who participated. Most of the attendees were MDs and NPs from Primary Care and Psychiatry. None of the nurses or SWs who were invited by their local leadership participated early on. Informal communication with CBOC staff found that they were feeling overwhelmed with other competing demands. There were multiple SCAN-ECHO programs and no protected time to attend the sessions. In addition, nurses might not have identified the program as a priority because the training topic was too general (geriatrics vs pressure ulcer or pain management).
The Geriatric SCAN-ECHO program adjusted the timing of sessions to convene every other month on a day that most CBOCs had staff meetings, allowing for protected time for staff participation. The CBOC staff was invited again to participate. The gerontological NP contacted the referring clinician to report the date of the case review and followed up afterward to ensure that all questions were answered and recommendations were clear.
The increase in marketing and networking led to more facilities participating; however, the number of staff participants remained low. The program team then changed tactics and focused on facilitating specific clinician behavior changes related to common geriatric syndromes instead of case reviews. The team conducted a session providing an overview of dementia recognition and diagnosis, rationale for objective measures, and a demonstration on the administration of the Mini-Cog Assessment Instrument for Dementia and Montreal Cognitive Assessment (MoCA) tools.7 This session had the highest number of total attendees (38), half of whom were nurses.
Feedback after the session resulted in an additional session the following month, which focused on the scoring and documentation of the tools as well as interpretation of the results and how this might be further evaluated by the team. Informal feedback gathered from nurses during this second session included a request for more training, tips on how to administer the tools, and how to document competency in tool administration. A new educational project that would empower PACT nurses to proactively identify and initiate cognitive impairment/dementia evaluations was then started independent of the Geriatric SCAN-ECHO program.
Results
Participants of SCAN-ECHO programs were surveyed on usefulness of information and its influence on their practice (Table 1). A total of 41 respondents (the same person may have attended more than 1 session) completed surveys on 9 Geriatric SCAN-ECHO sessions. Nineteen (46%) were medical doctors, 8 (20%) were NPs, and 14 (34%) were from other disciplines. Overall, the sessions were well received, and participants found the information useful. Because the respondents were from different disciplines and roles, it was not surprising that only 13 respondents (32%) felt that the information would influence their prescribing practices, and only 18 respondents (44%) agreed that the session changed their ordering of diagnostic tests and studies.
Chart Reviews
Six months after completion of the Geriatric SCAN-ECHO session, the gerontological NP reviewed patient charts and identified rates of adherence for geriatric team recommendations. Eight patient cases were reviewed in 6 of the 9 sessions. The other sessions used sample cases from the team’s experience due to lack of submitted consults. Physicians referred 4 cases, and the rest were from NPs; all were from primary care except for a primary mental health NP. Half of the referred cases were forwarded from other departments (eg, neurobehavior and dementia clinics) to avoid travel. Reasons for referral included geriatric syndrome workup and specific medical questions. All patients were men aged 66 to 94 years (mean = 83.25; SD = 8.29).
Table 2 lists the frequency and adherence to recommendations. If the recommendation was discussed but refused by the patient, it was still noted as completed. Several recommendations might have been presented; thus, adherence to recommendations was categorized as “all,” “some,” or “not at all” adherent. Because the referrals involved complex cases, most cases were referred to other clinical programs managed by the geriatric specialty team for further evaluation and management.
Discussion
Although the Geriatric SCAN-ECHO sessions were well received, the impact of the program was limited by the lack of consults and PACT team involvement. Impact was markedly improved once the focus of the sessions changed from case studies to specific clinical tool administration/practice change. Leadership support and coordination to provide protected team learning time was essential. Incentives to participate might include making geriatric quality indicators part of performance measures to improve practice and quality of care. Although the VA monitors several frail elderly measures that are a reflection of quality geriatric care, it is up to each VISN to determine its performance measures (Kenneth Shay, e-mail communication, February 12, 2013).
The most frequently followed recommendation was referral to a program managed by the geriatric specialty team. Full compliance with this recommendation may be due to the ease of placing a single consult and the interaction between the SCAN-ECHO team and the geriatric specialty services staff. The next most commonly followed recommendations were for medication changes/review and referral to a different program or clinic (not inpatient or outpatient geriatric specialty programs). Because completion of medication reconciliation reminders are tied to pay incentives for VA physicians, this may explain why it was fulfilled at a higher rates compared with other recommendations, suggesting that bonus incentives could boost participation.
The least frequently completed recommendations were referrals to non-VA programs or specialty providers. This may be a reflection of poor communication with non-VA providers and/or documentation of such communications and lack of the availability of the programs near the patient’s residence. Developing remote site referral guides might improve this communication.
Another type of recommendation that was partially or not at all followed was for further evaluation, assessment, or diagnostic tests of specific problems identified by the Geriatric SCAN-ECHO team. This may be due to lack of easy access to specific diagnostic tests in outpatient clinics or lack of staff knowledge and skills on doing geriatric-specific evaluations. The chart reviewer also noted that even when the PCP did the evaluations, the quality was below standard; for example, for depression screening, the chart noted that the patient was asked about having depression; however, no specific tool was used to aid in the diagnosis. Further specificity regarding geriatric syndrome evaluations and increasing staff knowledge of common tools to aid in diagnosis and evaluation are needed.
In 2 of the 8 cases reviewed, the Geriatric SCAN-ECHO program recommended that specific family members needed to be involved in the care of the patient. Unfortunately, most often family members only were used as a means of communication or for coordination of care with the PACT teams (eg, scheduling appointments). Changes needed to provide quality care for geriatric veterans are to include family members, use a fully-realized PACT approach, and have nurses “practice to the full extent of their education and training,” as recommended by the Institute of Medicine.9
Limitations
This article reported on the experience of a geriatric team that implemented an interdisciplinary telehealth-based consultation program. Facilitators and barriers to program execution may be limited to the local site and VA. The survey following the session was developed by the VA SCAN-ECHO program and was not specific to this local program. Limitations of the chart review include a short follow-up of only 6 months after the program. Many of the behavioral changes or educational recommendations might have been discussed but were not documented. Also services done by non-VA providers might not have been documented and, therefore, would not have been included in this chart review.
Conclusions
The geriatric team decided to discontinue the Geriatric SCAN-ECHO program. The key metric for program success was number of cases reviewed. Only 1 to 2 cases were reviewed every other month. Participation in the program markedly increased when the specific learning needs of PACT teams were addressed; however, most cases were referred to GRECC due to the case complexity and were not appropriate for the SCAN-ECHO format. The chart review, patient and caregiver contact, and presentation preparation required the program staff to invest a significant amount time. It took 3 to 4 hours for the staff to prepare for each case. Furthermore, adherence to recommendations was also poor.
Case-based education and training without follow-up of the recommendations likely is not the best approach to improve care of older veterans in the primary care setting. The authors hope that focusing on specific practice changes and working directly with PACTs and specific team members will be more productive and result in improved outcomes for older veterans. Due to the complexity of geriatric cases involving physical, cognitive, and emotional vulnerabilities, these cases may be better handled by direct multidisciplinary examinations.
Acknowledgments
Funding for this project was supported by the Veterans Health Administration Office of Specialty Care Services T-21 funding initiative.
1. U.S. Department of Veterans Affairs. Geriatric ambulatory care. VHA handbook 1140.10. U.S. Department of Veterans Affairs Website. http://www.va.gov/vhapublications/publications.cfm?pub=2. Published April 26, 2010. Accessed March 9, 2016.
2. Federal Interagency Forum on Aging-Related Statistics. Older Americans 2012: Key Indicators of Well-Being. Washington, DC: U.S. Government Printing Office; 2012.
3. Shay K, Schectman G. Primary care for older veterans. Generations. 2010;34(2):35-42.
4. Institute of Medicine. Retooling for an Aging America: Building the Health Care Workforce. Washington, DC: The National Academies Press; 2008.
5. U.S. Department of Veterans Affairs. Patient centered medical home model concept paper. U.S. Department of Veterans Affairs Website. http://www.vacareers.va.gov/assets/common/print/pcmh_conceptpaper.pdf. Published May 23, 2012. Accessed March 9, 2016.
6. Berenson RA, Devers KJ, Burton RA. Will the patient-centered medical home transform the delivery of health care? Urban Institute Website. http://www.urban.org/sites/default/files/alfresco/publication-pdfs/412373-Will-the-Patient-Centered-Medical-Home-Transform-the-Delivery-of-Health-Care-.pdf. Published August 2011. Accessed March 9, 2016.
7. Nasreddine D. MoCA-BLIND. Version 7.1 Original Version. Montreal Cognitive Assessment Website. http://www.mocatest.org/pdf_files/test/MoCA-Test-BLIND.pdf. Accessed March 9, 2016.
8. RAND Health Researchers. Assessing care of vulnerable elders (ACOVE). RAND Corporation Website. http://www.rand.org/health/projects.acove.html. Accessed March 9, 2016.
9. Institute of Medicine. The future of nursing: leading change, advancing health. Institute of Medicine Website. http://www.iom.edu/Reports/2010/The-future-of-nursing-leading-change-advancing-health.aspx. Published October 5, 2010. Updated October 5, 2015. Accessed March 9, 2016.
Possible Simeprevir/Sofosbuvir-Induced Hepatic Decompensation With Acute Kidney Failure
The emergence of hepatitis C (HCV) treatment regimens in the past 5 years has resulted in a major paradigm shift in the management of those infected with this virus. The 2011 approval of boceprevir and telaprevir was associated with a higher virologic response (50%-75%) and a shorter length of therapy depending on the patient population. Despite these gains, first generation direct-acting antivirals (DAAs) required multiple doses, had a higher pill burden with numerous drug interactions, and adverse effects (AEs). In addition, viral resistance limited the full use of the first generation DAAs for all genotypes.
Sofosbuvir, simeprevir, and ledipasvir-sofosbuvir (second generation DAAs) boast even higher (> 90%) sustained virologic response rates (SVR) and more tolerable AE profiles especially anemia, depression, and gastrointestinal symptoms compared with the first generation DAAs. At the time of treatment for this case study, sofosbuvir/ledipasvir was not commercially available. Sofosbuvir in combination with simeprevir with or without ribavirin was one of the preferred treatment options for chronic HCV.1
Unlike the first generation DAAs, which have been associated with a decline in renal function compared with conventional pegylated interferon and ribavirin, sofosbuvir is extensively renally eliminated by glomerular filtration and active tubular secretion as the metabolite GS-331007. On the other hand, simeprevir is hepatically metabolized.
A PubMed literature search for reports of “simeprevir-induced” or “sofosbuvir-induced with hepatic, renal failure, acute kidney injury” yielded only 1 published case of hepatic decompensation likely related to simeprevir, but no case report of simeprevir and sofosbuvir associated with hepatic decompensation and acute kidney injury.4 In this article, the authors describe a case of hepatic decompensation and acute kidney injury caused by simeprevir/sofosbuvir initiation for chronic HCV that required intensive care and dialysis.
Case Report
The patient was a 62-year-old African American man with chronic HCV, genotype 1b, TT IL28B, and 4,980,000 IU baseline viral load. He was treatment naïve with biopsy proven compensated cirrhosis, and Child-Turcotte-Pugh class A with a pretreatment model for end-stage liver disease score of 12. His past medical history included hypertension, chronic kidney disease (CKD) (baseline serum creatinine [SCr] 1.4-1.8 mg/dL), benign prostatic hypertrophy, depression, obesity (30.6 body mass index, 246 lb), and psoriasis. In addition, the patient was on the following maintenance medications: allopurinol, bupropion, diltiazem, sustained-release and immediate-release morphine, sennosides, and terazosin.
In September 2014, the patient was diagnosed with biopsy-confirmed hepatocellular carcinoma (HCC) Barcelona clinic liver cancer stage B T3aN0M0 stage III. He was considered for transarterial chemoembolization (TACE), but treatment was withheld due to subsequent increase in liver function tests (LFTs) with total bilirubin (TB) 2.9 mg/dL, direct bilirubin (DB) 1.8 mg/dL, aspartate aminotransferase test (AST) 130 U/L, and alanine aminotransferase test (ALT) 188 U/L (baseline: TB 1.1 mg/dL, AST 69 U/L, and ALT 76 U/L). These results were thought to be the result of worsening hepatic function from untreated HCV, therefore, treatment was initiated.
The patient was started on simeprevir 150 mg orally daily and sofosbuvir 400 mg orally daily with an estimated baseline creatinine clearance of 67 mL/min per Cockcroft-Gault equation.5 Two days after therapy initiation, the patient presented to the emergency department with the following symptoms: hiccups, nausea, vomiting, and abdominal pain. Laboratory results showed 10.85 mg/dL SCr and 91 mg/dL blood urea nitrogen (BUN), TB increased to 14.6 mg/dL with AST of 325 U/L and ALT 277 U/L. The patient reported no use of acetaminophen, alcohol, nonsteroidal anti-inflammatory drugs, or other nephrotoxic agents.
Upon admission, the patient was diagnosed with drug-induced hepatitis and acute kidney injury (AKI). Simeprevir/sofosbuvir was discontinued along with allopurinol, bupropion, lisinopril, and morphine. An abdominal ultrasound was negative for obstructive uropathy. The patient did not respond to fluid boluses. A nephrologist was consulted, and dialysis was initiated. The patient underwent dialysis for 3 days and his LFTs and SCr levels started trending downward (Figures 1 to 5).
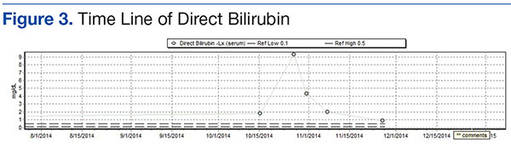
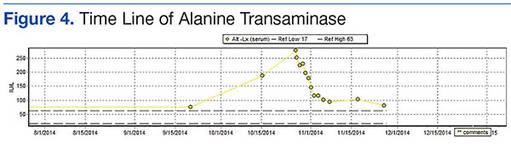
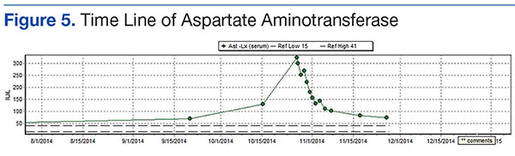
The patient was discharged after 8 days. After 3 weeks, the SCr decreased to 2.29 mg/dL, BUN was 26 mg/dL, TB was 2 mg/dL, DB was 0.9 mg/dL, AST was 73 U/L, and ALT was 81 U/L. Weekly laboratory values continued to improve following discharge but did not return to baseline levels. The patient remained off HCV treatment.
Discussion
The patient had baseline CKD with SCr > 1.5 mg/dL; however, the significant decline in renal function and worsening hepatic function were thought to be the result of external factors. Although hepatorenal syndrome was considered, the authors suspected that the AKI and hepatic decompensation were related to simeprevir/sofosbuvir regimens due to their presumed relationship and probability analysis. Osinusi and colleagues noted a decline in renal function in a patient who received ledipasvir/sofosbuvir for 6 weeks in an open-label pilot study.6 Stine and colleagues also reported on cases of simeprevir-related hepatic decompensation.4
In this case, the authors employed the Naranjo algorithm adverse drug reaction probability scale to assess whether there was a causal relationship between this event and initiation of simeprevir/sofosbuvir regimen.7 The Naranjo score was 4, indicating a possible link between simeprevir/sofosbuvir initiation and hepatic decompensation and AKI. This case may be the first postmarketing report of significant hepatic decompensation and AKI related to simeprevir/sofosbuvir.
Unlike simeprevir, which undergoes extensive oxidative metabolism by CYP3A in the liver and has negligible renal clearance with < 1% of the dose recovered in the urine, sofosbuvir is extensively metabolized by the kidneys with an active metabolite, GS-331007, and about 80% of the dose is recovered in urine (78% as GS-331007; 3.5% as sofosbuvir).8,9 The potential for drug-drug interaction also was assessed because simeprevir is extensively metabolized by the hepatic cytochrome CYP34 system and possibly CYP2C8 and CYP2C19. Clinically significant interactions could have occurred with diltiazem and morphine, because the coadministration of these medications along with simeprevir, an inhibitor of P-glycoprotein (P-gp), and intestinal CYP3A4, may result in increased diltiazem and morphine plasma concentrations.
Of note, because sofosbuvir is a substrate of P-gp, it may have its serum concentration increased by simeprevir. Inducers and inhibitors of P-gp may alter the plasma concentration of sofosbuvir. The major metabolite, GS-331007, is not a substrate of P-gp. Drugs that induce P-gp may reduce the therapeutic effect of sofosbuvir; however, the FDA-labeling suggests that inhibitors of P-gp may be coadministered with sofosbuvir.
According to simeprevir prescribing information, drug interaction studies have demonstrated that moderate CYP3A4 inhibitors, such as diltiazem (although coadministration have not been studied), increased the maximum serum concentration (Cmax), minumum serum concentration (Cmin), and AUC of simeprevir.7 As a result, concurrent use of simeprevir with a moderate CYP3A4 inhibitors is not recommended. Morphine and simeprevir interaction also is possible via the P-gp inhibition of simeprevir. Morphine concentration may have increased and metabolites may have accumulated, leading to urinary retention and elevated creatinine. In addition, decreased oral intake and subsequent nausea/vomiting may have compounded the renal insult.
Conclusion
Given that updated HCV treatment guidelines include simeprevir/sofosbuvir as an alternative treatment option, clinicians should be aware of hepatic decompensation with markedly elevated bilirubin and AKI during simeprevir and sofosbuvir treatment. Careful consideration is needed prior to the initiation of simeprevir/sofosbuvir, particularly in patients with advanced liver disease or known HCC and baseline renal impairment.
1. American Association for the Study of Liver Diseases and the Infectious Diseases Society of America. Recommendations for testing, managing, and treating hepatitis C: Initial Treatment of HCV. American Association for the Study of Liver Diseases and the Infectious Diseases Society of America Website. http://www.hcvguidelines.org. Accessed February 8, 2016.
2. Mauss S, Hueppe D, Alshuth U. Renal impairment is frequent in chronic hepatitis C patient under triple therapy with telaprevir or boceprevir. Hepatology. 2014;59(1):46-48.
3. Virlogeux V, Pradat P, Bailly F, et al. Boceprevir and telaprevir-based triple therapy for chronic hepatitis C: virolgical efficacy and impact on kidney function and model for end-stage liver disease score. J Viral Hepat. 2014;21(9):e98-e107.
4. Stine JG, Intagliata N, Shah L, et al. Hepatic decompensation likely attributable to simeprevir in patients with advanced cirrhosis. Dig Dis Sci. 2015;60(4):1031-1035.
5. Cockcroft DW, Gault MH. Prediction of creatinine clearance from serum creatinine. Nephron. 1976;16(1):31-41.
6. Osinusi A, Kohli A, Marti MM, et al. Re-treamtent of chronic hepatitis C virus genotype 1 infection after relapse: an open-label pilot study. Ann Intern Med. 2014;161(9):634-638.
7. Naranjo CA, Busto U, Sellers EM, et al. A method for estimating the probability of adverse drug reactions. Clin Pharmacol Ther. 1981;30(2):239-245.
8. Olysio (simeprevir) [package insert]. Titusville, NJ: Janssen Therapeutics; 2014.
9. Sovaldi (sofosbuvir) [package insert]. Foster City, CA: Gilead Sciences, Inc; 2014.
The emergence of hepatitis C (HCV) treatment regimens in the past 5 years has resulted in a major paradigm shift in the management of those infected with this virus. The 2011 approval of boceprevir and telaprevir was associated with a higher virologic response (50%-75%) and a shorter length of therapy depending on the patient population. Despite these gains, first generation direct-acting antivirals (DAAs) required multiple doses, had a higher pill burden with numerous drug interactions, and adverse effects (AEs). In addition, viral resistance limited the full use of the first generation DAAs for all genotypes.
Sofosbuvir, simeprevir, and ledipasvir-sofosbuvir (second generation DAAs) boast even higher (> 90%) sustained virologic response rates (SVR) and more tolerable AE profiles especially anemia, depression, and gastrointestinal symptoms compared with the first generation DAAs. At the time of treatment for this case study, sofosbuvir/ledipasvir was not commercially available. Sofosbuvir in combination with simeprevir with or without ribavirin was one of the preferred treatment options for chronic HCV.1
Unlike the first generation DAAs, which have been associated with a decline in renal function compared with conventional pegylated interferon and ribavirin, sofosbuvir is extensively renally eliminated by glomerular filtration and active tubular secretion as the metabolite GS-331007. On the other hand, simeprevir is hepatically metabolized.
A PubMed literature search for reports of “simeprevir-induced” or “sofosbuvir-induced with hepatic, renal failure, acute kidney injury” yielded only 1 published case of hepatic decompensation likely related to simeprevir, but no case report of simeprevir and sofosbuvir associated with hepatic decompensation and acute kidney injury.4 In this article, the authors describe a case of hepatic decompensation and acute kidney injury caused by simeprevir/sofosbuvir initiation for chronic HCV that required intensive care and dialysis.
Case Report
The patient was a 62-year-old African American man with chronic HCV, genotype 1b, TT IL28B, and 4,980,000 IU baseline viral load. He was treatment naïve with biopsy proven compensated cirrhosis, and Child-Turcotte-Pugh class A with a pretreatment model for end-stage liver disease score of 12. His past medical history included hypertension, chronic kidney disease (CKD) (baseline serum creatinine [SCr] 1.4-1.8 mg/dL), benign prostatic hypertrophy, depression, obesity (30.6 body mass index, 246 lb), and psoriasis. In addition, the patient was on the following maintenance medications: allopurinol, bupropion, diltiazem, sustained-release and immediate-release morphine, sennosides, and terazosin.
In September 2014, the patient was diagnosed with biopsy-confirmed hepatocellular carcinoma (HCC) Barcelona clinic liver cancer stage B T3aN0M0 stage III. He was considered for transarterial chemoembolization (TACE), but treatment was withheld due to subsequent increase in liver function tests (LFTs) with total bilirubin (TB) 2.9 mg/dL, direct bilirubin (DB) 1.8 mg/dL, aspartate aminotransferase test (AST) 130 U/L, and alanine aminotransferase test (ALT) 188 U/L (baseline: TB 1.1 mg/dL, AST 69 U/L, and ALT 76 U/L). These results were thought to be the result of worsening hepatic function from untreated HCV, therefore, treatment was initiated.
The patient was started on simeprevir 150 mg orally daily and sofosbuvir 400 mg orally daily with an estimated baseline creatinine clearance of 67 mL/min per Cockcroft-Gault equation.5 Two days after therapy initiation, the patient presented to the emergency department with the following symptoms: hiccups, nausea, vomiting, and abdominal pain. Laboratory results showed 10.85 mg/dL SCr and 91 mg/dL blood urea nitrogen (BUN), TB increased to 14.6 mg/dL with AST of 325 U/L and ALT 277 U/L. The patient reported no use of acetaminophen, alcohol, nonsteroidal anti-inflammatory drugs, or other nephrotoxic agents.
Upon admission, the patient was diagnosed with drug-induced hepatitis and acute kidney injury (AKI). Simeprevir/sofosbuvir was discontinued along with allopurinol, bupropion, lisinopril, and morphine. An abdominal ultrasound was negative for obstructive uropathy. The patient did not respond to fluid boluses. A nephrologist was consulted, and dialysis was initiated. The patient underwent dialysis for 3 days and his LFTs and SCr levels started trending downward (Figures 1 to 5).
The patient was discharged after 8 days. After 3 weeks, the SCr decreased to 2.29 mg/dL, BUN was 26 mg/dL, TB was 2 mg/dL, DB was 0.9 mg/dL, AST was 73 U/L, and ALT was 81 U/L. Weekly laboratory values continued to improve following discharge but did not return to baseline levels. The patient remained off HCV treatment.
Discussion
The patient had baseline CKD with SCr > 1.5 mg/dL; however, the significant decline in renal function and worsening hepatic function were thought to be the result of external factors. Although hepatorenal syndrome was considered, the authors suspected that the AKI and hepatic decompensation were related to simeprevir/sofosbuvir regimens due to their presumed relationship and probability analysis. Osinusi and colleagues noted a decline in renal function in a patient who received ledipasvir/sofosbuvir for 6 weeks in an open-label pilot study.6 Stine and colleagues also reported on cases of simeprevir-related hepatic decompensation.4
In this case, the authors employed the Naranjo algorithm adverse drug reaction probability scale to assess whether there was a causal relationship between this event and initiation of simeprevir/sofosbuvir regimen.7 The Naranjo score was 4, indicating a possible link between simeprevir/sofosbuvir initiation and hepatic decompensation and AKI. This case may be the first postmarketing report of significant hepatic decompensation and AKI related to simeprevir/sofosbuvir.
Unlike simeprevir, which undergoes extensive oxidative metabolism by CYP3A in the liver and has negligible renal clearance with < 1% of the dose recovered in the urine, sofosbuvir is extensively metabolized by the kidneys with an active metabolite, GS-331007, and about 80% of the dose is recovered in urine (78% as GS-331007; 3.5% as sofosbuvir).8,9 The potential for drug-drug interaction also was assessed because simeprevir is extensively metabolized by the hepatic cytochrome CYP34 system and possibly CYP2C8 and CYP2C19. Clinically significant interactions could have occurred with diltiazem and morphine, because the coadministration of these medications along with simeprevir, an inhibitor of P-glycoprotein (P-gp), and intestinal CYP3A4, may result in increased diltiazem and morphine plasma concentrations.
Of note, because sofosbuvir is a substrate of P-gp, it may have its serum concentration increased by simeprevir. Inducers and inhibitors of P-gp may alter the plasma concentration of sofosbuvir. The major metabolite, GS-331007, is not a substrate of P-gp. Drugs that induce P-gp may reduce the therapeutic effect of sofosbuvir; however, the FDA-labeling suggests that inhibitors of P-gp may be coadministered with sofosbuvir.
According to simeprevir prescribing information, drug interaction studies have demonstrated that moderate CYP3A4 inhibitors, such as diltiazem (although coadministration have not been studied), increased the maximum serum concentration (Cmax), minumum serum concentration (Cmin), and AUC of simeprevir.7 As a result, concurrent use of simeprevir with a moderate CYP3A4 inhibitors is not recommended. Morphine and simeprevir interaction also is possible via the P-gp inhibition of simeprevir. Morphine concentration may have increased and metabolites may have accumulated, leading to urinary retention and elevated creatinine. In addition, decreased oral intake and subsequent nausea/vomiting may have compounded the renal insult.
Conclusion
Given that updated HCV treatment guidelines include simeprevir/sofosbuvir as an alternative treatment option, clinicians should be aware of hepatic decompensation with markedly elevated bilirubin and AKI during simeprevir and sofosbuvir treatment. Careful consideration is needed prior to the initiation of simeprevir/sofosbuvir, particularly in patients with advanced liver disease or known HCC and baseline renal impairment.
1. American Association for the Study of Liver Diseases and the Infectious Diseases Society of America. Recommendations for testing, managing, and treating hepatitis C: Initial Treatment of HCV. American Association for the Study of Liver Diseases and the Infectious Diseases Society of America Website. http://www.hcvguidelines.org. Accessed February 8, 2016.
2. Mauss S, Hueppe D, Alshuth U. Renal impairment is frequent in chronic hepatitis C patient under triple therapy with telaprevir or boceprevir. Hepatology. 2014;59(1):46-48.
3. Virlogeux V, Pradat P, Bailly F, et al. Boceprevir and telaprevir-based triple therapy for chronic hepatitis C: virolgical efficacy and impact on kidney function and model for end-stage liver disease score. J Viral Hepat. 2014;21(9):e98-e107.
4. Stine JG, Intagliata N, Shah L, et al. Hepatic decompensation likely attributable to simeprevir in patients with advanced cirrhosis. Dig Dis Sci. 2015;60(4):1031-1035.
5. Cockcroft DW, Gault MH. Prediction of creatinine clearance from serum creatinine. Nephron. 1976;16(1):31-41.
6. Osinusi A, Kohli A, Marti MM, et al. Re-treamtent of chronic hepatitis C virus genotype 1 infection after relapse: an open-label pilot study. Ann Intern Med. 2014;161(9):634-638.
7. Naranjo CA, Busto U, Sellers EM, et al. A method for estimating the probability of adverse drug reactions. Clin Pharmacol Ther. 1981;30(2):239-245.
8. Olysio (simeprevir) [package insert]. Titusville, NJ: Janssen Therapeutics; 2014.
9. Sovaldi (sofosbuvir) [package insert]. Foster City, CA: Gilead Sciences, Inc; 2014.
Recognizing and Treating Neuropsychiatric Symptoms in Parkinson's Disease
From the Department of Neurology, Oregon Health & Science University, Portland, OR.
Abstract
- Objective: To review the clinical characteristics, epidemiology, and management of the most common neuropsychiatric symptoms (NPS) in Parkinson’s disease (PD).
- Methods: Literature review.
- Results: PD has traditionally been considered a disease of impaired motor function. However, neuropsychiatric complications, such as fatigue, depression, anxiety, psychosis, impulse control disorders, and apathy, frequently complicate the course of the illness. Although the development of new medication options in recent years has had a positive benefit on the management of these troublesome symptoms, responses are frequently suboptimal. The development of valid instruments to measure neuropsychiatric symptoms has been vital in research efforts to bridge the gaps in our understanding. Further elucidation of neuropsychiatric pathophysiologies will help to define treatment targets and has the potential to expand our therapeutic armamentarium.
- Conclusion: While NPS affect patients with established disease, recent investigations have demonstrated risk of symptoms in those with early untreated stages of PD; therefore, better understanding of NPS should be the goal of practitioners treating the entire continuum of PD.
Parkinson’s disease (PD) has traditionally been considered a disease of impaired motor function, but increased recognition of nonmotor symptoms and in particular neuropsychiatric symptoms, such as fatigue, depression, anxiety, psychosis, impulse control disorders, and apathy, offer new opportunities for better care of patients. While neuropsychiatric symptoms affect patients with established disease, recent investigations have clearly demonstrated risk of symptoms in those with early untreated stages of PD; therefore, better understanding of neuropsychiatric symptoms should be the goal of practitioners treating the entire continuum of PD. This review will focus on the clinical characteristics, epidemiology, and management of the most common neuropsychiatric symptoms in PD.
Impulse Control Disorders
The recognition that dopaminergic drugs were successful at treating many symptoms of PD was followed by the disturbing realization that impulse control disorders could be an unfortunate side effect in a substantial minority. Impulse control disorders as defined by DSM-IV [1] are disinhibited behaviors that are maladaptive and recurrent, causing personal and relationship consequences. The impulse control disorders that became associated with PD and medication intake, particularly dopamine agonist use, included gambling, hobbyism, punding (stereotyped, seemingly purposeless behaviors), excessive sexual behavior, shopping, hoarding, and less commonly, compulsive eating. The prevalence estimates of these behavioral disturbances range from 6% to 15.5%, compared with < 2% in the general population [2,3]. The addiction-like dopamine dysregulation syndrome, whereby patients self-medicate with high doses of levodopa and short-acting dopamine agonists beyond what is needed for motor control, can lead to significant impairment of the therapeutic alliance in addition to other patient personal relations. With the advent of surgical options to treat PD and its medication complications, it was observed that stimulation of the subthalamic nucleus could be associated with the spectrum of impulse control disorders [4].
Epidemiology/Risk Factors
In a recent systematic review of the literature of impulse control disorders in PD [5], the authors determined that dopaminergic therapy caused compulsive or impulsive behaviors in approximately 10% of PD patients in the course of their treatment, with pathologic gambling and hypersexuality most frequently experienced. Multiple impulse control disorders are not uncommon and may coexist in one-quarter of patients with compulsivity. There appeared to be more disordered behavior with higher comparable doses of agonists. The authors concluded that impulse control disorder symptoms tended to occur with initiation or dose increases of direct D2/D3 agonists, such as pramipexole and ropinirole. Importantly, impulse control disorder behavior improved if not resolved with discontinuation or reduction of dosage of the agonist, even if a compensatory levodopa dosage is added or increased. Perhaps not surprisingly, it was observed that if patients had a preexisting impulse control disorder prior to PD or the initiation of treatment, there was a high likelihood of worsening of symptoms. This small subgroup is estimated at about 1% of PD subjects, which corresponds to the prevalence of impulse control disorders in the general population. Other identified potential risk factors for impulse control disorder development include male gender, young age at onset, a personal or family history of addiction, novelty or risk seeking personality, and a concurrent diagnosis of depression [3]. In a recent study of early PD patients, the risk of developing an impulse control disorder became important once treatment with dopaminergic drugs began and continued for a year or more [6].
Pathogenesis
The pathogenesis is not fully understood, however, mesolimbic dopamine alterations are strongly suspected. It has been long speculated that the high doses of dopamine needed to replete the relatively depleted dorsal striatum overdose the “intact” ventral striatum and cause this neuropsychiatric disorder [7–9]. The additional cognitive impairments in PD, which can include problems with attention, working memory, planning, forethought and decision-making, are faculties that can markedly increase susceptibility to impulse control disorder [8].
The role of serotonin deficiency in the PD brain and its part in inhibiting the patient’s ability to delay rewards adds to the complexity of impulse control disorder pathogenesis. Dorsal raphe nuclei disease in PD results in loss of serotonin innervation to substantial portions of the prefrontal and motor cortices in addition to basal ganglia substructures like the striatum, pallidum and subthalamic nucleus [10]. Together with dopamine, serotonin may work to regulate risk-sensitive decision making, response inhibition, waiting for future rewards, and overall impulse control. Its relative loss therefore also likely contributes to tipping the balance towards impulse dyscontrol [11,12]. The role of other neurotransmitters such as opiate systems involved in the process of acquisition and maintenance of addictive behaviors like dopamine dysregulation syndrome remains to be fully understood.
Treatment
The most successful strategy to address this problem is to reduce or eliminate the offending medication, usually the dopamine agonist. This may be associated with worsening apathy, anxiety or depression; however, substituting levodopa can be a successful strategy in many cases [13]. Zonisamide was described to be possibly effective in a trial of 15 subjects; however, the open label nature of this evidence must be considered as with other case reports using valproate, donepezil, and selective serotonin reuptake inhibitors (SSRIs) [14–16].
Fatigue
An easy to understand operational definition of fatigue is that it is a state of extreme tiredness, weakness, or exhaustion, either physical or mental or both. Fatigue is not uncommon in the general population [17] but is increasingly recognized to occur in numerous disease conditions and is frequently encountered in PD and multiple sclerosis. The latter is of special significance in the consideration of the neurotransmission of fatigue, as it is not thought to be a disease of dopamine deficiency. The pathophysiology remains unclear, and it may differ depending on whether the fatigue is experienced as more physical or mental, or rather motor versus nonmotor as some authors propose.
Fatigue has been conceptualized as central or peripheral in character. Peripheral fatigue is best understood as muscular fatigue caused by repetitive muscular contraction or reduced force generation [18]. Central fatigue however, is divided into mental or physical fatigue. Mental fatigue can occur after sustained attentive or emotional activity. It may alternatively be provoked after boring repetitive tasks or lack of intellectually stimulating activity. Physical fatigue is the sense of body exhaustion or energy to perform physical tasks even though the ability to carry them out exists.
Epidemiology
As recognition of the problem of fatigue increased in the last 2 decades, the realization that one-third to one-half of patients experience it at some point has improved opportunities for recognition and treatment [19]. Fatigue may be the presenting symptom in one-third of patients prior to actual motor symptom onset [20]. Half of untreated PD patients in a biomarker cohort study reported fatigue [6]. Unfortunately, it is also described by patients as one of the most disabling symptoms, causing significant impact on quality of life [19]. Fatigue in PD is associated with higher rates of depressive symptoms, but occurs with higher prevalence in nondepressed patients [21]. Poor ability to initiate and sustain activity due to fatigue is different from depression, excessive sleepiness, or impaired motor function [22,23].
Pathophysiology
The pathophysiology of fatigue remains somewhat unclear, though physical fatigue is likely a significant part of the problem and related to dopamine deficiency based on studies of time and force generation of keyboard strikes in PD subjects before and after L-dopa administration. These subjects had declines in force and increased physical fatigue which improved after L-dopa [24]. In other studies using transcranial magnetic stimulation to study changes in cortical excitability, the degree of physical fatigue correlated with abnormalities in motor evoked potentials during fatiguing exercising. These studies also support the hypothesis that fatigue is a motor symptom [25,26]. In the ELLDOPA study, fatigue worsened more in PD subjects treated with placebo [27]. Other imaging studies have suggested suggested nondopaminergic mechanisms including serotonergic pathway abnormalities [28], thus the question behind the etiology and solution for all cases of fatigue remains to be settled.
Diagnosis
The diagnosis is fatigue may be challenging as it may mask as depression or apathy. There are a number of fatigue rating scales available; however, the validated Parkinson’s Fatigue Scale (PFS) supersedes many of the problems of using a generic scale which could overlap motor questions and potentially be confounding [29,30].
Treatment
Most important is awareness and vigilance for the symptoms of fatigue, depression, and apathy and effort to distinguish between them. It may require structured interviews or assessment tools to properly diagnose the problem. Treatment is less clear in that few studies have clearly indicated the best treatment options. In placebo-controlled trials, methylphenidate did improve fatigue as did levodopa [31]. Modafinil, a hypocretin modulator and a drug first approved by the FDA for treatment of narcolepsy, has demonstrated mixed results in recent years. It may reduce physical fatigue and reduce excessive daytime sleepiness but likely does not reduce subjective symptoms of fatigue [32]. L-dopa can significantly reduce fatigue in many patients, which would argue that it often is a motor symptom [33,24]. In a post-hoc analysis of the ADAGIO delayed start study, patients taking rasagiline 1 mg/day and 2 mg/day (the latter dose exceeds the usual clinical dosing) showed significantly less worsening of symptoms on the PFS compared to placebo over time [34]. It is important to realize that once motor symptoms are optimally treated with dopaminergic medications, while many patients will feel significant relief from fatigue some patients will continue to feel symptomatic.
Apathy
The definition of apathy has become more complicated and refined, incorporating findings from the study of brain disease and behavioral analysis. Marin’s classic elaboration of apathy as lack of motivation not attributable to diminished level of consciousness, cognitive impairment, or emotional distress has been built upon by Levy and Dubois [35–37]. They suggest apathy may be better thought of as an observable behavioral syndrome characterized by a quantitative reduction of self-generated voluntary and purposeful behaviors. They suggest 3 apathetic subtypes: emotional, cognitive, and auto-activational, which reflect different disease states accounting for failure of normal goal-directed behavior.
Epidemiology
Prevalence estimates for apathy in PD vary. This is likely due to the varying recruitment criteria among studies, with some including patients with comorbid depression and dementia and others containing only “pure apathy.” Other reports may have had referral bias issues, as community-based studies report lower prevalences in general. In a group of newly diagnosed PD patients, using more restrictive criteria (apathy subscale of the neuropsychiatric inventory and the diagnostic consensus criteria for apathy validated in PD), Pedersen reported a prevalence of apathy of 14.3% [38]. In a 4-year prospective longitudinal cohort study, an annual incidence rate of 12.3% was reported, with apathy developing in 60% of the cohort by the study’s conclusion [39].
Apathy has been associated with longer disease duration, male gender [40], higher daily levodopa doses [41], more severe parkinsonism [38], and lower education status, though the latter feature remains under debate. Early cognitive deficits appear to be a risk factor for development of apathy [42]. The patterns of cognitive dysfunction and apathy remain unsettled in the literature.
Pathology
The pathology of atrophy remains unexplained and is unlikely to be reduced to a simple atrophy of one nucleus or the tone of one circuit. However, in a small neuroimaging study, severity of apathy correlated with atrophy of the bilateral nucleus accumbens [43], and it is notable that one major input to the nucleus accumbens is the amygdala. According to Braak staging, by stage 4 significant involvement of the amygdala by Lewy bodies has occurred. Others have found changes in grey matter density that could correlate with deficits of the prefrontal-basal ganglia circuitry to produce dysfunction of segregated frontal-subcortical loops. These may correlate with the “autoactivation” deficit pattern of apathy in which patients have a lack of self-initiated actions, even thoughts, though appear more normal when giving externally prompted responses [37,44].
Assessment
Clinically, the relationship between apathy and depression can be hard to disentangle, especially since many studies have found an association between them, especially with regards to apathy and anhedonia. Depression may feature negative self thoughts and sadness while apathy is notable for lack of initiation and effort. Viewed over a longer period of time, apathy tended to worsen in a linear fashion, where depression tended to fluctuate with improvements and exacerbations.
The Movement Disorders Society task force has recommended the Lille Apathy Rating Scale (LARS) for assessment of apathy; English and French versions have been validated in PD patients. It uses a semi-structured interview format assessing 4 dimensions of apathy: self awareness, intellectual curiosity, emotion, and action initiation [45–47].
The impact of apathy cannot be underestimated as this poor show of motivation or effort leads to lack of engagement in old activities or interest in new ones. Spouses may misinterpret this change in behavior as laziness or deliberate social withdrawal, or perhaps entitlement. It is not surprising that apathy routinely shows up on quality of life (QoL) questionnaires as highly impacting patients and families. In one study, apathy was the nonmotor symptom most likely to cause caregiver distress in PD [40,48–50].
Treatment
No approved drugs exist for treatment of apathy. However, clinical experience often confirms that dopaminergic modulation can be helpful in the treatment of apathy as indirect evidence suggests. A meta-analysis of controlled trials using pramipexole and Part I of the Unified Parkinson's disease rating scale (UPDRS) (secondary measure) showed the medication improved scores on this measure of motivation and mood in non-depressed subjects [51] with PD. Rare patients undergoing subthalamic deep brain stimulation have been reported to experience new and sometimes severe apathy after surgery [52]. This was posited at least in part to be the result of reduction of dopaminergic medication due to surgery.
Nondopaminergic pharmacotherapy of apathy is in its infancy. A recent controlled trial of rivastigmine in 31 French subjects with moderate to severe apathy based on LARS showed that 6 months of treatment at 9.5 mg/day improved average scores from –11.5 to –20 compared with placebo. While quality of life did not improve, caregiver burden did. The investigators found in this group of subjects that apathy was a possible herald for early dementia in PD [53].
A post-hoc analysis of the ADAGIO study (rasagiline or placebo in PD patients taking antidepressants) found that rasagiline use was associated with a nonsignificant slowing of apathy development during the trial [54].
Psychosis
Psychotic symptoms are a common occurrence in drug-treated patients, with visual hallucinations occurring in up to 30%, though over a 20-year period up to three-quarters of patients may develop visual hallucinations.After visual, the most common type of hallucination is auditory, followed by the other affected senses such as tactile, olfactory, or even taste [57]. Delusions, which tend to be paranoid in nature, occur in about 5% of patients [55–57]. The presence of psychotic symptoms is associated with poorer quality of life [58].
Symptomatology
The visual hallucinations of PD are usually quite stereotyped, and have been described as “minor” and “non-minor”[59]. Minor hallucinations refer to transient peripheral field stimuli that disappear when brought into central focus, “something flashed by,” a sense of a living being nearby, “a presence in the room,” or illusions whereby objects are transformed, eg, a bush in the yard is a deer.
Auditory hallucinations tend to be vague or indistinct sounds, like music in another room as opposed to voices speaking directly to the patient as might be experienced in a primary psychotic disorder. Tactile forms often involve insects or other animals crawling on the skin. Olfactory hallucinations may take the form of smelling perfume, toxic odors from room vents, etc.
Early in the experience, the visual hallucinations may be amusing in that they consistently remain nonthreatening, similar day to day, and sometimes oddly provide an aspect of comfort or companionship to the patient. More commonly, the hallucinations are bothersome to the patient because the experience indicates to the patient that there is something wrong with their mind. Visual hallucinations often begin in low-stimulus environments, often in the evening or other low-light conditions, but as the problem advances they can occur at any time of day. While visual hallucinations may initially occur for only seconds at a time many days apart, the frequency and duration can increase until they occur hours at a time every day and are accompanied by multiple other visual hallucinations, delusions, and confusion [60].
Delusions tend to be more distressing to patients and caregivers because they are often paranoid in nature. The patient is more likely to act out due to the anxiety the paranoia creates. For example, she may change passwords to online accounts due to a belief that unknown assailants are after her finances. He may go to great lengths trying to prove his wife is cheating.
Risk Factors
While the primary risk factor for psychotic symptom development is dementia [57], it occurs in nondemented patients. Other associations include reduced visual acuity [56], visual processing impairment [61–65], use of dopamine agonists, REM behavior disorder, duration of PD, axial rigidity subtype of disease [61,66–68]. The pathophysiology of psychosis in PD is likely complex and remains currently unexplained. The role of excess dopamine has been described above, but there is also data suggesting cholinergic deficits in the cortex may also contribute. Excess serotonin (increased 5HT2A receptor subtypes) in the temporal lobe within the visual processing pathway has been postulated to be of significance [69,70]. Hypometabolism in visual association areas of the brain in subjects with visual hallucinations has been demonstrated in PET and functional MRI studies [64,71]. This is similar to findings in patients with dementia with Lewy bodies [72].
This review focuses on the primary forms of PD-related psychosis, which occur with a clear sensorium and generally longer exposure to dopaminergic medication. It is important to distinguish 2 other common scenarios in which hallucinations or delusions may occur. In the common toxic-metabolic delirium, a clouded sensorium with attention deficits may be the only clue to the etiology of new onset confusion with visual hallucinations. It is highly likely that resolution of the underlying medical problem will lead to resolution of the new onset psychosis and encephalopathy. In a second scenario, hallucinations precede or occur very shortly after the onset of initiation of dopaminergic medication. This differs from the classic syndrome described earlier, in particular when visual hallucinations precede any initiation of medication, and likely represents the distinction between a diagnosis of Lewy body disease and PD [60].
Treatment
Management of psychosis is approachable, but often the outcome is unsatisfactory and associated with trade-offs in motor control. It is unfortunately true that psychotic symptoms are often associated with increased caregiver burden and are a cause of increased nursing home placements [73]. When considering the workup of psychotic symptoms, the differential diagnosis includes delirium, dream enactment (REM behavior disorder), or less commonly, Bonnet syndrome.
A delirium may be precipitated by a difficult to diagnose infection; new-onset confusion and psychotic symptoms may be the heralding presentation. Urinary tract or upper respiratory tract are common vulnerable sources of infection. Once infection is ruled out, the next practical step is to review the patient’s medication list and manage centrally acting drugs that could be contributing to the altered sensorium. A recent prescription of opioids for a dental treatment or a new muscle relaxant may be a culprit, though it is not that usual. A bladder anticholinergic could be suspect and is worth eliminating especially if its addition coincided with the appearance of the psychotic symptoms. Once the non-dopaminergic medications have been reduced/eliminated, then the PD medications should be considered. The general approach is to eliminate the medications that provide the least benefit while being more likely to contribute to psychotic symptoms. Anticholinergic medications, dopamine agonists, selegiline should all be uppermost in that consideration until one is left with L-dopa and COMT inhibitors (the latter function to increase levodopa availability). Then COMT inhibitors and levodopa can be reduced; however, at any point motor control can suffer with the loss of symptomatic therapies [74].
Clozapine is effective against psychotic symptoms in PD, at doses much lower than used in schizophrenia (300-600mg/day). The average dose in the US randomized controlled clinical trial was 25 mg/day, with no associated motor worsening. Patients in the United States are required by the FDA to be placed in a computer-based registry and monitored for agranulocytosis for the duration of clozapine therapy. This rare adverse event is not dose related. Orthostasis can occur at these low doses however. Fortunately the metabolic syndrome is not associated with this range of administration [75,76].
Quetiapine was not found to be effective in 3 blinded randomized controlled trials despite its rather common use for this purpose. It was not associated with motor worsening, however.
Other neuroleptic medications have not resulted in widespread use, because trials have been open label, or outcomes demonstrated motor worsening. Cholinesterase inhibitors have been the subject of a few positive case series, however results appear to be sporadic, the effect size is relatively small, and side effects of this medication class are common [77–79]. It is clear that there is an unmet need for a medication for psychotic symptoms. Clozapine is effective but onerous in its monitoring requirements. Practically speaking, there are relatively few PD patients who take advantage of it because of its feasibility challenges. Yet the problem of psychotic symptoms is a significant one that imposes important challenges to the patient and caregiver, and may limit the number of medications that the patient needs in order to optimize quality of life.
Pimavanserin, a novel medication which acts as a selective serotonin inverse agonist, is in the early application stages for FDA approval for treatment of psychotic symptoms in PD [80]. In its pivotal phase III controlled trial, the drug reduced not only positive symptoms (hallucinations/delusions) without causing motoric worsening, but also reduced caregiver burden. Pimavanserin improved certain sleep features without causing daytime sedation. If this drug meets final approval, it may present an exciting option for many patients for whom treatment was previously limited.
Depression
A study of early PD suggested that depression is often unrecognized and frequently untreated [1]. Indeed it is not unusual for depression to predate the diagnosis of PD by an average of 4 to 6 years [81]. Expanding to the larger PD population, it is generally accepted that about 30% to 50% of PD patients experience clinically significant depression, and once diagnosed may have a long term course, or may recur [82,83]. This is important as untreated depression is an important cause of poor quality of life in early PD. In addition depression can exacerbate motor disability, lead to earlier motor treatment with medication, and increase caregiver stress [83–85].
Diagnosis
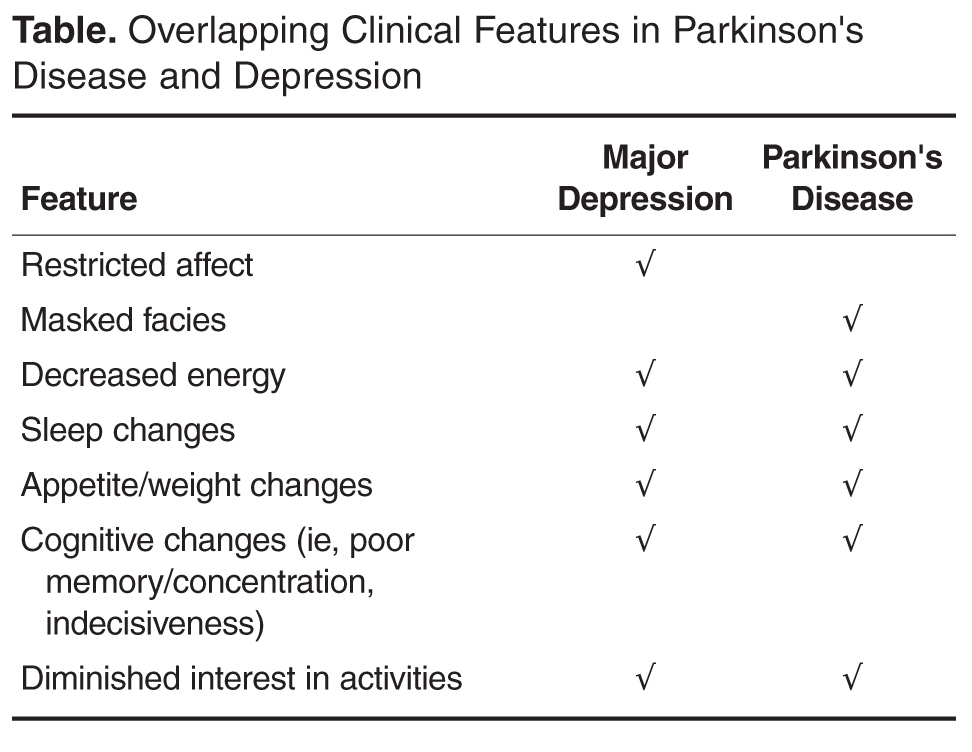
A number of clinimetric rating scales for depression have been used and their advantages have been largely related to their objective nature (quantifiable); thus, they tend to be most useful in epidemiologic research studies or for larger scale screening purposes. Examples include the the Beck Depression Inventory, the Geriatric Depression Scale, and the Hamilton Depression Scale, all of which have been shown to be valid tools in PD (with the exception of the UPDRS Depression). It is important to note that they do not substitute for a diagnostic clinical interview [89].
Suicide is not common in PD, however suicidal ideation is estimated at about 11% in PD patients [90], and while there was concern initially after deep brain stimulation procedures began that suicide incidence was increased, evidence does not support this [91].
Pathophysiology
The pathophysiology of depression in PD is largely unknown however is thought to be less causally due to psychosocial factors and more etiologically driven by brainstem monoamine and serotonergic dysfunction [92]. Nonetheless, similar to other chronic conditions, PD patients can certainly develop fear of disability, guilt about impact on others, or other reactive mood changes. Overall, rates of depression are higher in PD compared with patients with similar conditions matched for disability [93].
Treatment
First, the clinician must determine if depression is a result of short-term fluctuations, chronic undertreatment of motor disease, or longer-term mood phenomenon. One important pattern to recognize are mood fluctuations, which can parallel motor OFF-ON cycling. It can be valuable to distinguish this as “subsyndromic” depression or anxiety (sometimes referred to as “OFF dysphoria”), as it can respond to improvement in antiparkinsonian medication dosing patterns that reduce fluctuations[94–96]. Similarly, elevating chronic motor undertreatment to goal therapy can result in mood normalization.
If symptoms persist despite optimization of motor/nonmotor fluctuations or chronic undertreatment and are severe enough to warrant treatment, then therapies used can range from nonpharmacologic education, support, and mental health referrals, as well as pharmacologic support in the form of medications.
A frequent but uncontrolled observation was that when undertreatment of motor disease was finally redressed, mood often improved. A multicenter randomized controlled trial of pramipexole in PD patients without motor fluctuations but with mild to moderate depressive symptoms showed the drug improved scores on the Beck Depression Inventory over a 12-week period. The improvement in mood was 6 points overall, but by 2 points over placebo, illustrating the importance of the size of the placebo effect [97]. Given the potential side effect profile of dopamine agonists, it may be useful to weigh the antidepressant effects only when their motor benefits are already being employed.
Controlled trials have demonstrated efficacy of both selective serotonin reuptake inhibitors (SSRI) and selective norepinephrine reuptake inhibitors (SNRI) antidepressants in PD. Clinical trials have demonstrated efficacy against placebo or with other antidepressant comparators. Examples of drugs with demonstrated efficacy include citalopram, paroxetine, venlafaxine, and nortriptyline. Results have attempted to illuminate the small unique differences between classes of antidepressants or dynamic properties between drugs within a class. For example, desipramine may nudge scores on a mood scale a few weeks sooner than a purer SSRI. Paroxetine (SSRI) versus venlafaxine (SNRI) improved mood scores comparably in a multicenter trial with a placebo comparator. In general, all have all been demonstrated to be effective and with a relatively low side-effect profile, comparable to the general population[98–102]. While case reports exist in the literature, the interaction of monoamine oxidase B inhibitors and SSRIs has not caused significant hypertensive crises or risk of serotonin syndrome [103,104]. Electroconvulsive therapy (ECT) can be used for severe refractory depression in PD as for non-PD patients, with case reports of very effective results. Due to the rarity of use, systematic evidence for its use is lacking [105,106].
Other novel agents and techniques such as omega-3 fatty acids [107] and repetitive transcranial magnetic stimulation [108] have been reported with promising early results. Cognitive behavioral therapy (CBT), which may involve stress management techniques, sleep hygiene, and caregiver support, additionally almost always provided improvement in measured outcomes, whether the trial was controlled or open label in design. In one RCT of CBT in PD of 14 weeks’ duration, there were significantly more treatment responders in the CBT group, with a number needed to treat of only 2 [109].
Anxiety
Anxiety is also common in PD, at least as common as depression considering that prevalence estimates suggest up to 50% of patients experience it [110–112]. Manifestations of anxiety may include panic attacks, generalized anxiety disorder, social anxiety, or other phobias [113]. Anxiety has an important negative impact on health-related quality of life and is often underrecognized by clinicians [114]. While reliable and valid scales to measure anxiety have been lacking in PD, a new effort has yielded the “Parkinson Anxiety Scale” though full clinimetric properties of the scale remain to be demonstrated (sensitivity to change) [115].
Anxiety that parallels the timing of motor OFF-ON cycling is important to recognize. This “subsyndromic” anxiety or anxiety disorder not otherwise specified (ie, the anxiety does not meet DSM-IV criteria) can respond to improvement in antiparkinsonian medication dosing patterns that reduce fluctuations [116,117]. Indeed, the presence of motor fluctuations is the principle marker of anxiety in many studies [118–120]. In an analogous manner, anxiety can predate PD by years and be part of the nonmotor amalgam of features heralding the disease [6,121].
Treatment
Systematic controlled trials of anxiolytic treatment for PD are lacking; therefore, SSRIs are prescribed for this purpose as in non-PD patients. Until SSRIs are demonstrated to be of benefit in anxiety, they are likely safer than use of benzodiazepines, which are associated with risk for falling, cognitive dysfunction, or autonomic dysregulation in PD patients when used during waking hours. Psychotherapy and other nonpharmacologic approaches are likely to be of benefit. A small study of neuromuscular (massage) therapy demonstrated improvement on the Beck Anxiety Inventory in PD [122]. A case report of ECT for severe anxiety has been published [123].
Conclusion
Neuropsychiatric symptoms are common in PD and new knowledge about clinical features, epidemiology, and treatment options has been gained in the last decade, though much remains to be discovered. The development of valid instruments to measure neuropsychiatric symptoms has been vital in these research efforts to bridge the gaps in our understanding. Further elucidation of the pathophysiologies of neuropsychiatric symptoms will help to define treatment targets and likely fuel drug development and the discovery of drugs with more potent benefit and fewer side effects.
Corresponding author: Kathryn A. Chung, MD, Department of Neurology, Oregon Health & Science University, Portland, OR, [email protected].
Financial disclosures: None.
1. American Psychiatric Association. DSM-IV. 2000.
2. Voon V, Hassan K, Zurowski M, et al. Prevalence of behaviors in Parkinson disease Neurology 2006;67;1254–7.
3. D. Weintraub D, J. Koester J, M. N. Potenza MN, et al. Impulse control disorders in Parkinson disease: a cross-sectional study of 3090 patients. Arch Neurol 2010;67589–95.
4. Hälbig TD, Tse W, Frisina PG, et al. Subthalamic deep brain stimulation and impulse control in Parkinson’s disease. Eur J Neuro 2009;16:493–7.
5. Callesen MB, Scheel-Krüger J, Kringelbach ML, Møller A. A systematic review of impulse control disorders in Parkinson’s disease. J Parkinsons Dis 2013;3:105–38.
6. De Riva P, Smith K, Xie SX, Weintraub D. Course of psychiatric symptoms and global cognition in early course of psychiatric symptoms and global cognition in early Parkinson disease Neurology 2014;83:1–8.
7. Cools R. Dopaminergic modulation of cognitive function-implications for L-DOPA treatment in Parkinson’s disease. Neurosci Biobehav Rev 2006;30:1–23.
8. Rowe JB, Hughes L, Ghosh BCP, et al. Parkinson’s disease and dopaminergic therapy – Differential effects on movement, reward and cognition. Brain 2008;131:2094–105.
9. Cools R, Frank MJ, Gibbs SE, et al. Striatal dopamine predicts outcome-specific reversal learning and its sensitivity to dopaminergic drug administration. J Neurosci 2009;29:1538–43.
10. Di Matteo V, Pierucci M, Esposito E, et al. Serotonin modulation of the basal ganglia circuitry: therapeutic implication for Parkinson’s disease and other motor disorders. Prog Brain Res 2008;172:423–463.
11. Campbell-Meiklejohn D, Wakeley J, Herbert V, et al. Serotonin and dopamine play complementary roles in gambling to recover losses. Neuropsychopharmacology 2011;36:402–10.
12. Macoveanu J, Rowe JB, Hornboll B, et al. Playing it safe but losing anyway-Serotonergic signaling of negative outcomes in dorsomedial prefrontal cortex in the context of risk-aversion. Eur Neuropsychopharmacol 2013;23:919–30.
13. Mamikonyan E, Siderowf AD, Duda JE, et al. NIH Public Access 2009;23:75–80.
14. Ivanco LS, Bohnen NI. Effects of donepezil on compulsive hypersexual behavior in Parkinson disease: a single case study. Am J Ther 2005;12:467–8.
15. Hicks CW, Pandya MM, Itin I, Fernandez HH. Valproate for the treatment of medication-induced impulse-control disorders in three patients with Parkinson’s disease. Parkinsonism Relat Disord 2011;5:379–81.
16. Bermejo PE, Ruiz-Huete C, Anciones B. Zonisamide in managing impulse control disorders in Parkinson’s disease. J Neurol 2010;257:1682–5.
17. Pawlikowska T, Chalder T, Hirsch SR, et al. Population based study of fatigue and psychological distress. BMJ 1994;308:763–6.
18. Lou JS, Kearns G, Oken B, et al. Exacerbated physical fatigue and mental fatigue in Parkinson’s disease. Mov Disord 2001;16:190–6.
19. Herlofson K, Larsen JP. The influence of fatigue on health-related quality of life in patients with Parkinson’s disease. Acta Neurol Scand 2003;107:1–6.
20. Hagell P, Brundin L. Towards an understanding of fatigue in Parkinson disease. J Neurol Neurosurg Psychiatry 2009;80:489–92.
21. Alves G, Wentzel-Larsen T, Larsen JP. Is fatigue an independent and persistent symptom in patients with Parkinson disease? Neurology 2004;63:1908–11.
22. Martinez-Martin P, Catalan MJ, Benito-Leon J, et al. Impact of fatigue in Parkinson’s disease: The fatigue impact scale for daily use (D-FIS). Qual Life Res 2006:15:597–606.
23. Havlikova E, Rosenberger J, Nagyova I, et al. Clinical and psychosocial factors associated with fatigue in patients with Parkinson’s disease. Parkinsonism Relat Disord 2008;14:187–92.
24. Lou JS, Kearns G, Benice T, et al. Levodopa improves physical fatigue in Parkinson’s disease: A double-blind, placebo controlled, crossover study. Mov Disord 2003;18:1108–14.
25. Khedr EM, Galal O, Said A, et al. Lack of post-exercise depression of corticospinal excitability in patients with Parkinson’s disease. Eur J Neurol 2007;14:793–6.
26. Lou JS, Benice T, Kearns G, et al. Levodopa normalizes exercise related cortico-motoneuron excitability abnormalities in Parkinson’s disease. Clin. Neurophysiol 2003;114:930–7.
27. Schifitto G, Friedman JH, Oakes D, et al. Fatigue in levodopa-naive subjects with Parkinson disease. Neurology 2008;71:481–5.
28. Pavese N, Metta V, Bose SK, et al. Fatigue in Parkinson’s disease is linked to striatal and limbic serotonergic dysfunction. Brain 2010;133:3434–43.
29. Brown RG, Dittner A, Findley L, Wessely SC. The Parkinson fatigue scale. Park Relat Disord 2005;11:49–55.
30. Grace J, Mendelsohn A, Friedman JH. A comparison of fatigue measures in Parkinson’s disease. Parkinsonism Relat Disord 2007;13:443–5.
31. Mendonça DA, Menezes K, Jog MS. Methylphenidate improves fatigue scores in Parkinson disease: a randomized controlled trial. Mov Disord 2007;22:2070–6.
32. Lou JS, Dimitrova DM, Park BS, et al. Using modafinil to treat fatigue in Parkinson disease: a double-blind, placebo-controlled pilot study. Clin Neuropharmacol 2009;32:305–10.
33. Ziv I, Avraham M, Michaelov Y, et al. Enhanced fatigue during motor performance in patients with Parkinson’s disease. Neurology 1998;51:1583–6.
34. Stocchi F. Benefits of treatment with rasagiline for fatigue symptoms in patients with early Parkinson’s disease. Eur J Neurol 2014;21:357–60.
35. Marin RS. Apathy: a neuropsychiatric syndrome. J. Neuropsychiatry Clin Neurosci 1991;3:243–4.
36. Marin RS. Apathy: concept, syndrome, neural mechanisms, and treatment. Semin Clin Neuropsychiatry 1996:1:304–14.
37. Levy R, Dubois B. Apathy and the functional anatomy of the prefrontal cortex-basal ganglia circuits. Cerebral Cortex 2006;16:916–28.
38. Pedersen KF, Larsen JP, Alves G, Aarsland D. Prevalence and clinical correlates of apathy in Parkinson’s disease: a community-based study. Parkinsonism Relat Disord 2009;15:295–9.
39. Pedersen KF, Alves G, Aarsland D, Larsen JP. Occurrence and risk factors for apathy in Parkinson disease: a 4-year prospective longitudinal study. J Neurol Neurosurg Psychiatry 2009;80:1279–82.
40. Pedersen KF, Alves G, Brønnick K, et al. Apathy in drug-naïve patients with incident Parkinson’s disease: The Norwegian ParkWest study. J Neurol 2010;257:217–23.
41. Ziropadja L, Stefanova E, Petrovic M, et al. Apathy and depression in Parkinson’s disease: The Belgrade PD study report. Parkinsonism Relat Disord 2012;18:339–42.
42. Dujardin K, Sockeel P, Devos D, et al. Characteristics of apathy in Parkinson’s disease. Mov Disord 2007;22:778–84.
43. Carriere N, Besson P, Dujardin K, et al. Apathy in Parkinson’s disease is associated with nucleus accumbens atrophy: a magnetic resonance imaging shape analysis. Mov Disord 2014;29;897–903.
44. Reijnders JSAM, Scholtissen B, Weber WEJ, et al. Neuroanatomical correlates of apathy in Parkinson’s disease: a magnetic resonance imaging study using voxel-based morphometry. Mov Disord 2010;25:2318–25.
45. Leroi I, Harbishettar V, Andrews M, et al. Carer burden in apathy and impulse control disorders in Parkinson’s disease. Int J Geriatr Psychiatry 2012;27:160–6.
46. Schiehser DM, Liu L, Lessig SL, et al. Predictors of discrepancies in Parkinson’s disease patient and caregiver ratings of apathy, disinhibition, and executive dysfunction before and after diagnosis. J Int Neuropsychol Soc 2013;19:295–304.
47. Benito-León J, Cubo E, Coronell C, et al. Impact of apathy on health-related quality of life in recently diagnosed Parkinson’s disease: The ANIMO study. Mov Disord 2012;27:211–8.
48. Sockeel P, Dujardin K, Devos D, et al. The Lille apathy rating scale (LARS), a new instrument for detecting and quantifying apathy: validation in Parkinson’s disease. J Neurol Neurosurg Psychiatry 2006;77:579–84.
49. Zahodne LB, Young S, Kirsch-Darrow L, et al. Examination of the Lille Apathy Rating Scale in Parkinson disease. Mov Disord 2009;24:677–83.
50. Drijgers RL, Dujardin K, Reijnders JSAM, et al. Validation of diagnostic criteria for apathy in Parkinson’s disease. Parkinsonism Relat Disord 2010;16:656–60.
51. Leentjens AFG, Koester J, Fruh B, et al. The effect of pramipexole on mood and motivational symptoms in parkinson’s disease: A meta-analysis of placebo-controlled studies. Clin Ther 2009;31:89–98.
52. Thobois S, Ardouin C, Lhommée E, et al. Non-motor dopamine withdrawal syndrome after surgery for Parkinson’s disease: Predictors and underlying mesolimbic denervation. Brain 2010;133:1111–27.
53. Devos D, Moreau C, Maltête D, et al. Rivastigmine in apathetic but dementia and depression-free patients with Parkinson’s disease: a double-blind, placebo-controlled, randomised clinical trial. J Neurol Neurosurg Psychiatry 2014;85:668–74.
54. Smith KM, Eyal E, Weintraub D; ADAGIO Investigators. Combined rasagiline and antidepressant use in Parkinson disease in the ADAGIO study: effects on nonmotor symptoms and tolerability. JAMA Neurol 2015;72:88–95.
55. Forsaa EB, Larsen JP, Wentzel-Larsen T, et al. A 12-year population-based study of psychosis in Parkinson disease. Arch Neurol 2010;67:996–1001.
56. Holroyd S, Currie L, Wooten GF. Prospective study of hallucinations and delusions in Parkinson’s disease. J Neurol Neurosurg Psychiatry 2001;70:734–8.
57. Fénelon G, Alves G. Epidemiology of psychosis in Parkinson’s disease. J Neurol Sci 2010;289:12–7.
58. Mack J, Rabins P, Anderson K, et al. Prevalence of psychotic symptoms in a community-based Parkinson disease sample. Am J Geriatr Psychiatry 2012;20:123–32.
59. Ravina B, Marder K, Fernandez HH, et al. Diagnostic criteria for psychosis in Parkinson’s disease: Report of an NINDS, NIMH Work Group. Mov Disord 2007;22:1061–8.
60. Diederich NJ, Fénelon G, Stebbins G, Goetz CG. Hallucinations in Parkinson disease. Nat Rev Neurol 2009;5:331–42.
61. Gallagher DA, Parkkinen L, O’Sullivan SS, et al. Testing an aetiological model of visual hallucinations in Parkinson’s disease. Brain 2011;134:3299–309.
62. Barnes J, Boubert L, Harris J, et al. Reality monitoring and visual hallucinations in Parkinson’s disease. Neuropsychologia 2003:41:565–74.
63. Kurita A, Murakami M, Takagi S, et al. Visual hallucinations and altered visual information processing in Parkinson disease and dementia with Lewy bodies. Mov Disord 2010;25:167–71.
64. Stebbins GT, Goetz CG, Carrillo MC, et al. Altered cortical visual processing in PD with hallucinations: an fMRI study. Neurology 2004;63:1409–16.
65. Williams DR, Lees AJ. Visual hallucinations in the diagnosis of idiopathic Parkinson’s disease: A retrospective autopsy study. Lancet Neurol 2005:4:605–10.
66. Biglan KM, Holloway RG, McDermott MP, Richard IH. Risk factors for somnolence, edema, and hallucinations in early Parkinson disease. Neurology 2007;69:187–95.
67. Kiziltan G, Ozekmekci S, Ertan S, et al. Relationship between age and subtypes of psychotic symptoms in Parkinson’s disease. J Neurol 2007;254:448–52.
68. Ecker D, Unrath A, Kassubek J, Sabolek M. Dopamine agonists and their risk to induce psychotic episodes in Parkinson’s disease: a case-control study. BMC Neurol 2009;9:23.
69. Huot P, Johnston TH, Darr T, et al. Increased 5-HT2A receptors in the temporal cortex of Parkinsonian patients with visual hallucinations. Mov Disord 2010;25:1399–408.
70. Ballanger B, Strafella AP, van Eimeren T, et al. Serotonin 2A receptors and visual hallucinations in Parkinson disease. Arch. Neurol 2010;67:416–21.
71. Boecker H, Ceballos-Baumann O, Volk D, et al. Metabolic alterations in patients with Parkinson disease and visual hallucinations. Arch Neurol 2007;64:984–8.
72. Sanchez-Castaneda C, Rene R, Ramirez-Ruiz B, et al. Frontal and associative visual areas related to visual hallucinations in dementia with Lewy bodies and Parkinson’s disease with dementia. Mov Disord 2010;25:615–22.
73. Goetz CG, Stebbins GT. Risk factors for nursing home placement in advanced Parkinson’s disease. Neurology 1993;43:2227–9.
74. Friedman JH. Parkinson disease psychosis: update. Behav.Neurol 2013;27:469–77.
75. Pollak P, Tison F, Rascol O, et al. Clozapine in drug induced psychosis in Parkinson’s disease: a randomised, placebo controlled study with open follow up. J Neurol Neurosurg Psychiatry 2004;75:689–95.
76. Parkinson Study Group. Low-dose clozapine for the treatment of drug-induced psychosis. N Engl J Med 1999;340:757–63.
77. Sobow T. Parkinson’s disease-related visual hallucinations unresponsive to atypical antipsychotics treated with cholinesterase inhibitors: a case series. Neurol Neurochir Pol 2007;41:276–9.
78. Fabbrini G, Barbanti P, Aurilia C, et al. Donepezil in the treatment of hallucinations and delusions in Parkinson’s disease. Neurol Sci 2002;23:41–3.
79. Bullock R, Cameron A, Hospital WH. Rivastigmine for the treatment of dementia and visual hallucinations associated with Parkinson’s disease: a case series. Curr Med Res Opin 2002;18,:258–64.
80. Cummings J, Isaacson S, Mills R, et al. Pimavanserin for patients with Parkinson’s disease psychosis: a randomised, placebo-controlled phase 3 trial. Lancet 2014;383:533–40.
81. L. Ishihara L, and C. Brayne C. A systematic review of depression and mental illness preceding Parkinson’s disease. Acta Neurol Scand 2006;113:211–20.
82. Reijnders JSAM, Ehrt U, Weber WEJ, et al. A systematic review of prevalence studies of depression in Parkinson’s disease. Mov Disord 2008;23:183–9.
83. Starkstein SE, Mayberg HS, Leiguarda R, et al. A prospective longitudinal study of depression, cognitive decline, and physical impairments in patients with Parkinson’s disease. J Neurol Neurosurg Psychiatry 1992:55:377–82.
84. Müller B, Assmus J, Herlofson K, et al. Importance of motor vs. non-motor symptoms for health-related quality of life in early Parkinson’s disease. Parkinsonism Relat Disord 2013;19:1027–32.
85. Ravina B, Camicioli R, Como PG, et al. The impact of depressive symptoms in early Parkinson disease. Neurology 2007;69:342–7.
86. Marsh L, McDonald WM, Cummings J, et al. Provisional diagnostic criteria for depression in Parkinson’s disease: report of an NINDS/NIMH work group. Mov Disord 2006;21:148–58.
87. Marsh L. Depression and Parkinson’s disease: current knowledge. Curr. Neurol. Neurosci. Rep 2013; 13:409.
88. Starkstein SE, Merello M, Jorge R, et al. A validation study of depressive syndromes in Parkinson’s disease. Mov Disord 2008;23,:538–46.
89. Williams JR, Hirsch ES, Anderson K, et al. A comparison of nine scales to detect depression in Parkinson disease: which scale to use? Neurology 2012;78:998–1006.
90. Nazem S, Siderowf AD, Duda JE, et al. Suicidal and death ideation in Parkinson’s disease. Mov Disord 2008;23:1573–9.
91. Weintraub D, Duda JE, Carlson K, et al. Suicide ideation and behaviours after STN and GPi DBS surgery for Parkinson’s disease: results from a randomised, controlled trial. J Neurol Neurosurg Psychiatry 2013;84:1113–8.
92. Aarsland D, Påhlhagen S, Ballard CG, et al. Depression in Parkinson disease—epidemiology, mechanisms and management. Nat Rev Neurol 2011;8:35–47.
93. Ehmann TS, Beninger RJ, Gawel MJ, Riopelle RJ. Depressive symptoms in Parkinson’s disease: a comparison with disabled control subjects. J Geriatr Psychiatry Neurol 1990;3:3–9.
94. Witjas T, Kaphan E, Azulay JP, et al. Nonmotor fluctuations in Parkinson’s disease: frequent and disabling. Neurology 2002:59:408–13.
95. Nissenbaum H, Quinn NP, Brown RG, et al. Mood swings associated with the ‘on-off’ phenomenon in Parkinson’s disease. Psychol Med 1987;17:899–904.
96. Maricle RA, Nutt JG, Carter JH. Mood and anxiety fluctuation in Parkinson’s disease associated with levodopa infusion: preliminary findings. Mov Disord 1995;10:329–32.
97. Barone P, Poewe W, Albrecht S, et al. Pramipexole for the treatment of depressive symptoms in patients with Parkinson’s disease: a randomised, double-blind, placebo-controlled trial. Lancet Neurol 2010;9:573–80.
98. Devos D, Dujardin K, Poirot I, et al. Comparison of desipramine and citalopram treatments for depression in Parkinson’s disease: a double-blind, randomized, placebo-controlled study. Mov Disord 2008;23:850–7.
99. Richard IH, McDermott MP, Kurlan R, et al. A randomized, double-blind, placebo-controlled trial of antidepressants in Parkinson disease. Neurology 2012;78:1229–36.
100. Menza M, Dobkin RD, Marin H, et al. A controlled trial of antidepressants in patients with Parkinson disease and depression. Neurology 2009;72:886–92.
101. Seppi K, Weintraub D, Coelho M, et al. The Movement Disorder Society evidence-based medicine review update: treatments for the non-motor symptoms of Parkinson’s disease. Mov Disord 2011;26 Suppl 3:S42–80.
102. Skapinakis P, Bakola E, Salanti G, et al. Efficacy and acceptability of selective serotonin reuptake inhibitors for the treatment of depression in Parkinson’s disease: a systematic review and meta-analysis of randomized controlled trials. BMC Neurol 2010;10:49.
103. Richard IH, Kurlan R, Tanner C, et al. Serotonin syndrome and the combined use of deprenyl and an antidepressant in Parkinson’s disease. Parkinson Study Group. Neurology 1997;48:1070–7.
104. Montgomery EB, Panisset M. Retrospective statistical analysis of the incidence of serotonin toxicity in patients taking rasagiline and anti-depressants in clinical trials. Mov Disord 2009;24:359.
105. Bailine S, Kremen N, Kohen I, et al. Bitemporal electroconvulsive therapy for depression in a Parkinson disease patient with a deep-brain stimulator. J ECT 2008;24:171–2.
106. Faber R, Trimble MR. Electroconvulsive therapy in Parkinson’s disease and other movement disorders. Mov Disord 1991;6:293–303.
107. da Silva TM, Munhoz RP, Alvarez C, et al. Depression in Parkinson’s disease: a double-blind, randomized, placebo-controlled pilot study of omega-3 fatty-acid supplementation. J Affect Disord 2008;111:351–9.
108. Pal E, Nagy F, Aschermann Z, et al. The impact of left prefrontal repetitive transcranial magnetic stimulation on depression in Parkinson’s disease: a randomized, double-blind, placebo-controlled study. Mov Disord 2010;25:2311–7.
109. Dobkin RD, Menza M, Allen LA, et al. Cognitive-behavioral therapy for depression in Parkinson’s disease: a randomized, controlled trial. Am J Psychiatry 2011;168:1066–74.
110. Stein MB, Heuser IJ, Juncos JL, Uhde TW. Anxiety disorders in patients with parkinson’s disease. Am J Psychiatry 1990;147:217–20.
111. Nuti A, Ceravolo R, Piccinni A, et al. Psychiatric comorbidity in a population of Parkinson’s disease patients. Eur J Neurol 2004;11:315–20.
112. Marinus J, Leentjens AFG, Visser M, et al. Evaluation of the Hospital Anxiety and Depression Scale in patients With Parkinson’s disease. Clin Neuropharmacol 2002:25:318–24.
113. Dissanayaka NNW, White E, O’Sullivan JD, et al. The clinical spectrum of anxiety in Parkinson’s disease. Mov Disord 2014;29:967–75.
114. Dissanayaka NNW, Sellbach A, Matheson S, et al. Anxiety disorders in Parkinson’s disease: prevalence and risk factors. Mov Disord 2010;25:838–45.
115. Leentjens AFG, Dujardin K, Pontone GM, et al. The Parkinson anxiety scale (PAS): Development and validation of a new anxiety scale. Mov Disord 2014;29:1035–43.
116. Maricle RA, Nutt JG, Valentine RJ, Carter JH. Dose-response relationship of levodopa with mood and anxiety in fluctuating Parkinson’s disease: a double-blind, placebo-controlled study. Neurology 1995;45:1757–60.
117. Erdal KJ. Depression and anxiety in persons with Parkinson’s disease with and without ‘on–off’ phenomena. J Clin Psychol Med Settings 2001:8:293–9.
118. Leentjens AFG, Dujardin K, Marsh L, et al. Symptomatology and markers of anxiety disorders in Parkinson’s disease: a cross-sectional study. Mov. Disord 2011;26:484–92.
119. Solla P, Cannas A, Floris GL, et al. Behavioral, neuropsychiatric and cognitive disorders in Parkinson’s disease patients with and without motor complications. Prog Neuropsychopharmacol Biol Psychiatry 2011;35:1009–13.
120. E. Stefanova E, L. Ziropadja L, M. Petrović M, et al. Screening for anxiety symptoms in Parkinson disease: a cross-sectional study. J Geriatr Psychiatry Neurol 2013;26:34–40.
121. Jacob EL, Gatto NM, Thompson A, et al. Occurrence of depression and anxiety prior to Parkinson’s disease. Parkinsonism Relat Disord 2010;16:576–81.
122. Craig LH, Svircev A, Haber M, Juncos JL. Controlled pilot study of the effects of neuromuscular therapy in patients with Parkinson’s disease. Mov Disord 2006;21:2127–33.
123. Marino L, Friedman JH. Letter to the editor: Successful use of electroconvulsive therapy for refractory anxiety in Parkinson’s disease. Int J Neurosci 2013;123:70–1.
From the Department of Neurology, Oregon Health & Science University, Portland, OR.
Abstract
- Objective: To review the clinical characteristics, epidemiology, and management of the most common neuropsychiatric symptoms (NPS) in Parkinson’s disease (PD).
- Methods: Literature review.
- Results: PD has traditionally been considered a disease of impaired motor function. However, neuropsychiatric complications, such as fatigue, depression, anxiety, psychosis, impulse control disorders, and apathy, frequently complicate the course of the illness. Although the development of new medication options in recent years has had a positive benefit on the management of these troublesome symptoms, responses are frequently suboptimal. The development of valid instruments to measure neuropsychiatric symptoms has been vital in research efforts to bridge the gaps in our understanding. Further elucidation of neuropsychiatric pathophysiologies will help to define treatment targets and has the potential to expand our therapeutic armamentarium.
- Conclusion: While NPS affect patients with established disease, recent investigations have demonstrated risk of symptoms in those with early untreated stages of PD; therefore, better understanding of NPS should be the goal of practitioners treating the entire continuum of PD.
Parkinson’s disease (PD) has traditionally been considered a disease of impaired motor function, but increased recognition of nonmotor symptoms and in particular neuropsychiatric symptoms, such as fatigue, depression, anxiety, psychosis, impulse control disorders, and apathy, offer new opportunities for better care of patients. While neuropsychiatric symptoms affect patients with established disease, recent investigations have clearly demonstrated risk of symptoms in those with early untreated stages of PD; therefore, better understanding of neuropsychiatric symptoms should be the goal of practitioners treating the entire continuum of PD. This review will focus on the clinical characteristics, epidemiology, and management of the most common neuropsychiatric symptoms in PD.
Impulse Control Disorders
The recognition that dopaminergic drugs were successful at treating many symptoms of PD was followed by the disturbing realization that impulse control disorders could be an unfortunate side effect in a substantial minority. Impulse control disorders as defined by DSM-IV [1] are disinhibited behaviors that are maladaptive and recurrent, causing personal and relationship consequences. The impulse control disorders that became associated with PD and medication intake, particularly dopamine agonist use, included gambling, hobbyism, punding (stereotyped, seemingly purposeless behaviors), excessive sexual behavior, shopping, hoarding, and less commonly, compulsive eating. The prevalence estimates of these behavioral disturbances range from 6% to 15.5%, compared with < 2% in the general population [2,3]. The addiction-like dopamine dysregulation syndrome, whereby patients self-medicate with high doses of levodopa and short-acting dopamine agonists beyond what is needed for motor control, can lead to significant impairment of the therapeutic alliance in addition to other patient personal relations. With the advent of surgical options to treat PD and its medication complications, it was observed that stimulation of the subthalamic nucleus could be associated with the spectrum of impulse control disorders [4].
Epidemiology/Risk Factors
In a recent systematic review of the literature of impulse control disorders in PD [5], the authors determined that dopaminergic therapy caused compulsive or impulsive behaviors in approximately 10% of PD patients in the course of their treatment, with pathologic gambling and hypersexuality most frequently experienced. Multiple impulse control disorders are not uncommon and may coexist in one-quarter of patients with compulsivity. There appeared to be more disordered behavior with higher comparable doses of agonists. The authors concluded that impulse control disorder symptoms tended to occur with initiation or dose increases of direct D2/D3 agonists, such as pramipexole and ropinirole. Importantly, impulse control disorder behavior improved if not resolved with discontinuation or reduction of dosage of the agonist, even if a compensatory levodopa dosage is added or increased. Perhaps not surprisingly, it was observed that if patients had a preexisting impulse control disorder prior to PD or the initiation of treatment, there was a high likelihood of worsening of symptoms. This small subgroup is estimated at about 1% of PD subjects, which corresponds to the prevalence of impulse control disorders in the general population. Other identified potential risk factors for impulse control disorder development include male gender, young age at onset, a personal or family history of addiction, novelty or risk seeking personality, and a concurrent diagnosis of depression [3]. In a recent study of early PD patients, the risk of developing an impulse control disorder became important once treatment with dopaminergic drugs began and continued for a year or more [6].
Pathogenesis
The pathogenesis is not fully understood, however, mesolimbic dopamine alterations are strongly suspected. It has been long speculated that the high doses of dopamine needed to replete the relatively depleted dorsal striatum overdose the “intact” ventral striatum and cause this neuropsychiatric disorder [7–9]. The additional cognitive impairments in PD, which can include problems with attention, working memory, planning, forethought and decision-making, are faculties that can markedly increase susceptibility to impulse control disorder [8].
The role of serotonin deficiency in the PD brain and its part in inhibiting the patient’s ability to delay rewards adds to the complexity of impulse control disorder pathogenesis. Dorsal raphe nuclei disease in PD results in loss of serotonin innervation to substantial portions of the prefrontal and motor cortices in addition to basal ganglia substructures like the striatum, pallidum and subthalamic nucleus [10]. Together with dopamine, serotonin may work to regulate risk-sensitive decision making, response inhibition, waiting for future rewards, and overall impulse control. Its relative loss therefore also likely contributes to tipping the balance towards impulse dyscontrol [11,12]. The role of other neurotransmitters such as opiate systems involved in the process of acquisition and maintenance of addictive behaviors like dopamine dysregulation syndrome remains to be fully understood.
Treatment
The most successful strategy to address this problem is to reduce or eliminate the offending medication, usually the dopamine agonist. This may be associated with worsening apathy, anxiety or depression; however, substituting levodopa can be a successful strategy in many cases [13]. Zonisamide was described to be possibly effective in a trial of 15 subjects; however, the open label nature of this evidence must be considered as with other case reports using valproate, donepezil, and selective serotonin reuptake inhibitors (SSRIs) [14–16].
Fatigue
An easy to understand operational definition of fatigue is that it is a state of extreme tiredness, weakness, or exhaustion, either physical or mental or both. Fatigue is not uncommon in the general population [17] but is increasingly recognized to occur in numerous disease conditions and is frequently encountered in PD and multiple sclerosis. The latter is of special significance in the consideration of the neurotransmission of fatigue, as it is not thought to be a disease of dopamine deficiency. The pathophysiology remains unclear, and it may differ depending on whether the fatigue is experienced as more physical or mental, or rather motor versus nonmotor as some authors propose.
Fatigue has been conceptualized as central or peripheral in character. Peripheral fatigue is best understood as muscular fatigue caused by repetitive muscular contraction or reduced force generation [18]. Central fatigue however, is divided into mental or physical fatigue. Mental fatigue can occur after sustained attentive or emotional activity. It may alternatively be provoked after boring repetitive tasks or lack of intellectually stimulating activity. Physical fatigue is the sense of body exhaustion or energy to perform physical tasks even though the ability to carry them out exists.
Epidemiology
As recognition of the problem of fatigue increased in the last 2 decades, the realization that one-third to one-half of patients experience it at some point has improved opportunities for recognition and treatment [19]. Fatigue may be the presenting symptom in one-third of patients prior to actual motor symptom onset [20]. Half of untreated PD patients in a biomarker cohort study reported fatigue [6]. Unfortunately, it is also described by patients as one of the most disabling symptoms, causing significant impact on quality of life [19]. Fatigue in PD is associated with higher rates of depressive symptoms, but occurs with higher prevalence in nondepressed patients [21]. Poor ability to initiate and sustain activity due to fatigue is different from depression, excessive sleepiness, or impaired motor function [22,23].
Pathophysiology
The pathophysiology of fatigue remains somewhat unclear, though physical fatigue is likely a significant part of the problem and related to dopamine deficiency based on studies of time and force generation of keyboard strikes in PD subjects before and after L-dopa administration. These subjects had declines in force and increased physical fatigue which improved after L-dopa [24]. In other studies using transcranial magnetic stimulation to study changes in cortical excitability, the degree of physical fatigue correlated with abnormalities in motor evoked potentials during fatiguing exercising. These studies also support the hypothesis that fatigue is a motor symptom [25,26]. In the ELLDOPA study, fatigue worsened more in PD subjects treated with placebo [27]. Other imaging studies have suggested suggested nondopaminergic mechanisms including serotonergic pathway abnormalities [28], thus the question behind the etiology and solution for all cases of fatigue remains to be settled.
Diagnosis
The diagnosis is fatigue may be challenging as it may mask as depression or apathy. There are a number of fatigue rating scales available; however, the validated Parkinson’s Fatigue Scale (PFS) supersedes many of the problems of using a generic scale which could overlap motor questions and potentially be confounding [29,30].
Treatment
Most important is awareness and vigilance for the symptoms of fatigue, depression, and apathy and effort to distinguish between them. It may require structured interviews or assessment tools to properly diagnose the problem. Treatment is less clear in that few studies have clearly indicated the best treatment options. In placebo-controlled trials, methylphenidate did improve fatigue as did levodopa [31]. Modafinil, a hypocretin modulator and a drug first approved by the FDA for treatment of narcolepsy, has demonstrated mixed results in recent years. It may reduce physical fatigue and reduce excessive daytime sleepiness but likely does not reduce subjective symptoms of fatigue [32]. L-dopa can significantly reduce fatigue in many patients, which would argue that it often is a motor symptom [33,24]. In a post-hoc analysis of the ADAGIO delayed start study, patients taking rasagiline 1 mg/day and 2 mg/day (the latter dose exceeds the usual clinical dosing) showed significantly less worsening of symptoms on the PFS compared to placebo over time [34]. It is important to realize that once motor symptoms are optimally treated with dopaminergic medications, while many patients will feel significant relief from fatigue some patients will continue to feel symptomatic.
Apathy
The definition of apathy has become more complicated and refined, incorporating findings from the study of brain disease and behavioral analysis. Marin’s classic elaboration of apathy as lack of motivation not attributable to diminished level of consciousness, cognitive impairment, or emotional distress has been built upon by Levy and Dubois [35–37]. They suggest apathy may be better thought of as an observable behavioral syndrome characterized by a quantitative reduction of self-generated voluntary and purposeful behaviors. They suggest 3 apathetic subtypes: emotional, cognitive, and auto-activational, which reflect different disease states accounting for failure of normal goal-directed behavior.
Epidemiology
Prevalence estimates for apathy in PD vary. This is likely due to the varying recruitment criteria among studies, with some including patients with comorbid depression and dementia and others containing only “pure apathy.” Other reports may have had referral bias issues, as community-based studies report lower prevalences in general. In a group of newly diagnosed PD patients, using more restrictive criteria (apathy subscale of the neuropsychiatric inventory and the diagnostic consensus criteria for apathy validated in PD), Pedersen reported a prevalence of apathy of 14.3% [38]. In a 4-year prospective longitudinal cohort study, an annual incidence rate of 12.3% was reported, with apathy developing in 60% of the cohort by the study’s conclusion [39].
Apathy has been associated with longer disease duration, male gender [40], higher daily levodopa doses [41], more severe parkinsonism [38], and lower education status, though the latter feature remains under debate. Early cognitive deficits appear to be a risk factor for development of apathy [42]. The patterns of cognitive dysfunction and apathy remain unsettled in the literature.
Pathology
The pathology of atrophy remains unexplained and is unlikely to be reduced to a simple atrophy of one nucleus or the tone of one circuit. However, in a small neuroimaging study, severity of apathy correlated with atrophy of the bilateral nucleus accumbens [43], and it is notable that one major input to the nucleus accumbens is the amygdala. According to Braak staging, by stage 4 significant involvement of the amygdala by Lewy bodies has occurred. Others have found changes in grey matter density that could correlate with deficits of the prefrontal-basal ganglia circuitry to produce dysfunction of segregated frontal-subcortical loops. These may correlate with the “autoactivation” deficit pattern of apathy in which patients have a lack of self-initiated actions, even thoughts, though appear more normal when giving externally prompted responses [37,44].
Assessment
Clinically, the relationship between apathy and depression can be hard to disentangle, especially since many studies have found an association between them, especially with regards to apathy and anhedonia. Depression may feature negative self thoughts and sadness while apathy is notable for lack of initiation and effort. Viewed over a longer period of time, apathy tended to worsen in a linear fashion, where depression tended to fluctuate with improvements and exacerbations.
The Movement Disorders Society task force has recommended the Lille Apathy Rating Scale (LARS) for assessment of apathy; English and French versions have been validated in PD patients. It uses a semi-structured interview format assessing 4 dimensions of apathy: self awareness, intellectual curiosity, emotion, and action initiation [45–47].
The impact of apathy cannot be underestimated as this poor show of motivation or effort leads to lack of engagement in old activities or interest in new ones. Spouses may misinterpret this change in behavior as laziness or deliberate social withdrawal, or perhaps entitlement. It is not surprising that apathy routinely shows up on quality of life (QoL) questionnaires as highly impacting patients and families. In one study, apathy was the nonmotor symptom most likely to cause caregiver distress in PD [40,48–50].
Treatment
No approved drugs exist for treatment of apathy. However, clinical experience often confirms that dopaminergic modulation can be helpful in the treatment of apathy as indirect evidence suggests. A meta-analysis of controlled trials using pramipexole and Part I of the Unified Parkinson's disease rating scale (UPDRS) (secondary measure) showed the medication improved scores on this measure of motivation and mood in non-depressed subjects [51] with PD. Rare patients undergoing subthalamic deep brain stimulation have been reported to experience new and sometimes severe apathy after surgery [52]. This was posited at least in part to be the result of reduction of dopaminergic medication due to surgery.
Nondopaminergic pharmacotherapy of apathy is in its infancy. A recent controlled trial of rivastigmine in 31 French subjects with moderate to severe apathy based on LARS showed that 6 months of treatment at 9.5 mg/day improved average scores from –11.5 to –20 compared with placebo. While quality of life did not improve, caregiver burden did. The investigators found in this group of subjects that apathy was a possible herald for early dementia in PD [53].
A post-hoc analysis of the ADAGIO study (rasagiline or placebo in PD patients taking antidepressants) found that rasagiline use was associated with a nonsignificant slowing of apathy development during the trial [54].
Psychosis
Psychotic symptoms are a common occurrence in drug-treated patients, with visual hallucinations occurring in up to 30%, though over a 20-year period up to three-quarters of patients may develop visual hallucinations.After visual, the most common type of hallucination is auditory, followed by the other affected senses such as tactile, olfactory, or even taste [57]. Delusions, which tend to be paranoid in nature, occur in about 5% of patients [55–57]. The presence of psychotic symptoms is associated with poorer quality of life [58].
Symptomatology
The visual hallucinations of PD are usually quite stereotyped, and have been described as “minor” and “non-minor”[59]. Minor hallucinations refer to transient peripheral field stimuli that disappear when brought into central focus, “something flashed by,” a sense of a living being nearby, “a presence in the room,” or illusions whereby objects are transformed, eg, a bush in the yard is a deer.
Auditory hallucinations tend to be vague or indistinct sounds, like music in another room as opposed to voices speaking directly to the patient as might be experienced in a primary psychotic disorder. Tactile forms often involve insects or other animals crawling on the skin. Olfactory hallucinations may take the form of smelling perfume, toxic odors from room vents, etc.
Early in the experience, the visual hallucinations may be amusing in that they consistently remain nonthreatening, similar day to day, and sometimes oddly provide an aspect of comfort or companionship to the patient. More commonly, the hallucinations are bothersome to the patient because the experience indicates to the patient that there is something wrong with their mind. Visual hallucinations often begin in low-stimulus environments, often in the evening or other low-light conditions, but as the problem advances they can occur at any time of day. While visual hallucinations may initially occur for only seconds at a time many days apart, the frequency and duration can increase until they occur hours at a time every day and are accompanied by multiple other visual hallucinations, delusions, and confusion [60].
Delusions tend to be more distressing to patients and caregivers because they are often paranoid in nature. The patient is more likely to act out due to the anxiety the paranoia creates. For example, she may change passwords to online accounts due to a belief that unknown assailants are after her finances. He may go to great lengths trying to prove his wife is cheating.
Risk Factors
While the primary risk factor for psychotic symptom development is dementia [57], it occurs in nondemented patients. Other associations include reduced visual acuity [56], visual processing impairment [61–65], use of dopamine agonists, REM behavior disorder, duration of PD, axial rigidity subtype of disease [61,66–68]. The pathophysiology of psychosis in PD is likely complex and remains currently unexplained. The role of excess dopamine has been described above, but there is also data suggesting cholinergic deficits in the cortex may also contribute. Excess serotonin (increased 5HT2A receptor subtypes) in the temporal lobe within the visual processing pathway has been postulated to be of significance [69,70]. Hypometabolism in visual association areas of the brain in subjects with visual hallucinations has been demonstrated in PET and functional MRI studies [64,71]. This is similar to findings in patients with dementia with Lewy bodies [72].
This review focuses on the primary forms of PD-related psychosis, which occur with a clear sensorium and generally longer exposure to dopaminergic medication. It is important to distinguish 2 other common scenarios in which hallucinations or delusions may occur. In the common toxic-metabolic delirium, a clouded sensorium with attention deficits may be the only clue to the etiology of new onset confusion with visual hallucinations. It is highly likely that resolution of the underlying medical problem will lead to resolution of the new onset psychosis and encephalopathy. In a second scenario, hallucinations precede or occur very shortly after the onset of initiation of dopaminergic medication. This differs from the classic syndrome described earlier, in particular when visual hallucinations precede any initiation of medication, and likely represents the distinction between a diagnosis of Lewy body disease and PD [60].
Treatment
Management of psychosis is approachable, but often the outcome is unsatisfactory and associated with trade-offs in motor control. It is unfortunately true that psychotic symptoms are often associated with increased caregiver burden and are a cause of increased nursing home placements [73]. When considering the workup of psychotic symptoms, the differential diagnosis includes delirium, dream enactment (REM behavior disorder), or less commonly, Bonnet syndrome.
A delirium may be precipitated by a difficult to diagnose infection; new-onset confusion and psychotic symptoms may be the heralding presentation. Urinary tract or upper respiratory tract are common vulnerable sources of infection. Once infection is ruled out, the next practical step is to review the patient’s medication list and manage centrally acting drugs that could be contributing to the altered sensorium. A recent prescription of opioids for a dental treatment or a new muscle relaxant may be a culprit, though it is not that usual. A bladder anticholinergic could be suspect and is worth eliminating especially if its addition coincided with the appearance of the psychotic symptoms. Once the non-dopaminergic medications have been reduced/eliminated, then the PD medications should be considered. The general approach is to eliminate the medications that provide the least benefit while being more likely to contribute to psychotic symptoms. Anticholinergic medications, dopamine agonists, selegiline should all be uppermost in that consideration until one is left with L-dopa and COMT inhibitors (the latter function to increase levodopa availability). Then COMT inhibitors and levodopa can be reduced; however, at any point motor control can suffer with the loss of symptomatic therapies [74].
Clozapine is effective against psychotic symptoms in PD, at doses much lower than used in schizophrenia (300-600mg/day). The average dose in the US randomized controlled clinical trial was 25 mg/day, with no associated motor worsening. Patients in the United States are required by the FDA to be placed in a computer-based registry and monitored for agranulocytosis for the duration of clozapine therapy. This rare adverse event is not dose related. Orthostasis can occur at these low doses however. Fortunately the metabolic syndrome is not associated with this range of administration [75,76].
Quetiapine was not found to be effective in 3 blinded randomized controlled trials despite its rather common use for this purpose. It was not associated with motor worsening, however.
Other neuroleptic medications have not resulted in widespread use, because trials have been open label, or outcomes demonstrated motor worsening. Cholinesterase inhibitors have been the subject of a few positive case series, however results appear to be sporadic, the effect size is relatively small, and side effects of this medication class are common [77–79]. It is clear that there is an unmet need for a medication for psychotic symptoms. Clozapine is effective but onerous in its monitoring requirements. Practically speaking, there are relatively few PD patients who take advantage of it because of its feasibility challenges. Yet the problem of psychotic symptoms is a significant one that imposes important challenges to the patient and caregiver, and may limit the number of medications that the patient needs in order to optimize quality of life.
Pimavanserin, a novel medication which acts as a selective serotonin inverse agonist, is in the early application stages for FDA approval for treatment of psychotic symptoms in PD [80]. In its pivotal phase III controlled trial, the drug reduced not only positive symptoms (hallucinations/delusions) without causing motoric worsening, but also reduced caregiver burden. Pimavanserin improved certain sleep features without causing daytime sedation. If this drug meets final approval, it may present an exciting option for many patients for whom treatment was previously limited.
Depression
A study of early PD suggested that depression is often unrecognized and frequently untreated [1]. Indeed it is not unusual for depression to predate the diagnosis of PD by an average of 4 to 6 years [81]. Expanding to the larger PD population, it is generally accepted that about 30% to 50% of PD patients experience clinically significant depression, and once diagnosed may have a long term course, or may recur [82,83]. This is important as untreated depression is an important cause of poor quality of life in early PD. In addition depression can exacerbate motor disability, lead to earlier motor treatment with medication, and increase caregiver stress [83–85].
Diagnosis
A number of clinimetric rating scales for depression have been used and their advantages have been largely related to their objective nature (quantifiable); thus, they tend to be most useful in epidemiologic research studies or for larger scale screening purposes. Examples include the the Beck Depression Inventory, the Geriatric Depression Scale, and the Hamilton Depression Scale, all of which have been shown to be valid tools in PD (with the exception of the UPDRS Depression). It is important to note that they do not substitute for a diagnostic clinical interview [89].
Suicide is not common in PD, however suicidal ideation is estimated at about 11% in PD patients [90], and while there was concern initially after deep brain stimulation procedures began that suicide incidence was increased, evidence does not support this [91].
Pathophysiology
The pathophysiology of depression in PD is largely unknown however is thought to be less causally due to psychosocial factors and more etiologically driven by brainstem monoamine and serotonergic dysfunction [92]. Nonetheless, similar to other chronic conditions, PD patients can certainly develop fear of disability, guilt about impact on others, or other reactive mood changes. Overall, rates of depression are higher in PD compared with patients with similar conditions matched for disability [93].
Treatment
First, the clinician must determine if depression is a result of short-term fluctuations, chronic undertreatment of motor disease, or longer-term mood phenomenon. One important pattern to recognize are mood fluctuations, which can parallel motor OFF-ON cycling. It can be valuable to distinguish this as “subsyndromic” depression or anxiety (sometimes referred to as “OFF dysphoria”), as it can respond to improvement in antiparkinsonian medication dosing patterns that reduce fluctuations[94–96]. Similarly, elevating chronic motor undertreatment to goal therapy can result in mood normalization.
If symptoms persist despite optimization of motor/nonmotor fluctuations or chronic undertreatment and are severe enough to warrant treatment, then therapies used can range from nonpharmacologic education, support, and mental health referrals, as well as pharmacologic support in the form of medications.
A frequent but uncontrolled observation was that when undertreatment of motor disease was finally redressed, mood often improved. A multicenter randomized controlled trial of pramipexole in PD patients without motor fluctuations but with mild to moderate depressive symptoms showed the drug improved scores on the Beck Depression Inventory over a 12-week period. The improvement in mood was 6 points overall, but by 2 points over placebo, illustrating the importance of the size of the placebo effect [97]. Given the potential side effect profile of dopamine agonists, it may be useful to weigh the antidepressant effects only when their motor benefits are already being employed.
Controlled trials have demonstrated efficacy of both selective serotonin reuptake inhibitors (SSRI) and selective norepinephrine reuptake inhibitors (SNRI) antidepressants in PD. Clinical trials have demonstrated efficacy against placebo or with other antidepressant comparators. Examples of drugs with demonstrated efficacy include citalopram, paroxetine, venlafaxine, and nortriptyline. Results have attempted to illuminate the small unique differences between classes of antidepressants or dynamic properties between drugs within a class. For example, desipramine may nudge scores on a mood scale a few weeks sooner than a purer SSRI. Paroxetine (SSRI) versus venlafaxine (SNRI) improved mood scores comparably in a multicenter trial with a placebo comparator. In general, all have all been demonstrated to be effective and with a relatively low side-effect profile, comparable to the general population[98–102]. While case reports exist in the literature, the interaction of monoamine oxidase B inhibitors and SSRIs has not caused significant hypertensive crises or risk of serotonin syndrome [103,104]. Electroconvulsive therapy (ECT) can be used for severe refractory depression in PD as for non-PD patients, with case reports of very effective results. Due to the rarity of use, systematic evidence for its use is lacking [105,106].
Other novel agents and techniques such as omega-3 fatty acids [107] and repetitive transcranial magnetic stimulation [108] have been reported with promising early results. Cognitive behavioral therapy (CBT), which may involve stress management techniques, sleep hygiene, and caregiver support, additionally almost always provided improvement in measured outcomes, whether the trial was controlled or open label in design. In one RCT of CBT in PD of 14 weeks’ duration, there were significantly more treatment responders in the CBT group, with a number needed to treat of only 2 [109].
Anxiety
Anxiety is also common in PD, at least as common as depression considering that prevalence estimates suggest up to 50% of patients experience it [110–112]. Manifestations of anxiety may include panic attacks, generalized anxiety disorder, social anxiety, or other phobias [113]. Anxiety has an important negative impact on health-related quality of life and is often underrecognized by clinicians [114]. While reliable and valid scales to measure anxiety have been lacking in PD, a new effort has yielded the “Parkinson Anxiety Scale” though full clinimetric properties of the scale remain to be demonstrated (sensitivity to change) [115].
Anxiety that parallels the timing of motor OFF-ON cycling is important to recognize. This “subsyndromic” anxiety or anxiety disorder not otherwise specified (ie, the anxiety does not meet DSM-IV criteria) can respond to improvement in antiparkinsonian medication dosing patterns that reduce fluctuations [116,117]. Indeed, the presence of motor fluctuations is the principle marker of anxiety in many studies [118–120]. In an analogous manner, anxiety can predate PD by years and be part of the nonmotor amalgam of features heralding the disease [6,121].
Treatment
Systematic controlled trials of anxiolytic treatment for PD are lacking; therefore, SSRIs are prescribed for this purpose as in non-PD patients. Until SSRIs are demonstrated to be of benefit in anxiety, they are likely safer than use of benzodiazepines, which are associated with risk for falling, cognitive dysfunction, or autonomic dysregulation in PD patients when used during waking hours. Psychotherapy and other nonpharmacologic approaches are likely to be of benefit. A small study of neuromuscular (massage) therapy demonstrated improvement on the Beck Anxiety Inventory in PD [122]. A case report of ECT for severe anxiety has been published [123].
Conclusion
Neuropsychiatric symptoms are common in PD and new knowledge about clinical features, epidemiology, and treatment options has been gained in the last decade, though much remains to be discovered. The development of valid instruments to measure neuropsychiatric symptoms has been vital in these research efforts to bridge the gaps in our understanding. Further elucidation of the pathophysiologies of neuropsychiatric symptoms will help to define treatment targets and likely fuel drug development and the discovery of drugs with more potent benefit and fewer side effects.
Corresponding author: Kathryn A. Chung, MD, Department of Neurology, Oregon Health & Science University, Portland, OR, [email protected].
Financial disclosures: None.
1. American Psychiatric Association. DSM-IV. 2000.
2. Voon V, Hassan K, Zurowski M, et al. Prevalence of behaviors in Parkinson disease Neurology 2006;67;1254–7.
3. D. Weintraub D, J. Koester J, M. N. Potenza MN, et al. Impulse control disorders in Parkinson disease: a cross-sectional study of 3090 patients. Arch Neurol 2010;67589–95.
4. Hälbig TD, Tse W, Frisina PG, et al. Subthalamic deep brain stimulation and impulse control in Parkinson’s disease. Eur J Neuro 2009;16:493–7.
5. Callesen MB, Scheel-Krüger J, Kringelbach ML, Møller A. A systematic review of impulse control disorders in Parkinson’s disease. J Parkinsons Dis 2013;3:105–38.
6. De Riva P, Smith K, Xie SX, Weintraub D. Course of psychiatric symptoms and global cognition in early course of psychiatric symptoms and global cognition in early Parkinson disease Neurology 2014;83:1–8.
7. Cools R. Dopaminergic modulation of cognitive function-implications for L-DOPA treatment in Parkinson’s disease. Neurosci Biobehav Rev 2006;30:1–23.
8. Rowe JB, Hughes L, Ghosh BCP, et al. Parkinson’s disease and dopaminergic therapy – Differential effects on movement, reward and cognition. Brain 2008;131:2094–105.
9. Cools R, Frank MJ, Gibbs SE, et al. Striatal dopamine predicts outcome-specific reversal learning and its sensitivity to dopaminergic drug administration. J Neurosci 2009;29:1538–43.
10. Di Matteo V, Pierucci M, Esposito E, et al. Serotonin modulation of the basal ganglia circuitry: therapeutic implication for Parkinson’s disease and other motor disorders. Prog Brain Res 2008;172:423–463.
11. Campbell-Meiklejohn D, Wakeley J, Herbert V, et al. Serotonin and dopamine play complementary roles in gambling to recover losses. Neuropsychopharmacology 2011;36:402–10.
12. Macoveanu J, Rowe JB, Hornboll B, et al. Playing it safe but losing anyway-Serotonergic signaling of negative outcomes in dorsomedial prefrontal cortex in the context of risk-aversion. Eur Neuropsychopharmacol 2013;23:919–30.
13. Mamikonyan E, Siderowf AD, Duda JE, et al. NIH Public Access 2009;23:75–80.
14. Ivanco LS, Bohnen NI. Effects of donepezil on compulsive hypersexual behavior in Parkinson disease: a single case study. Am J Ther 2005;12:467–8.
15. Hicks CW, Pandya MM, Itin I, Fernandez HH. Valproate for the treatment of medication-induced impulse-control disorders in three patients with Parkinson’s disease. Parkinsonism Relat Disord 2011;5:379–81.
16. Bermejo PE, Ruiz-Huete C, Anciones B. Zonisamide in managing impulse control disorders in Parkinson’s disease. J Neurol 2010;257:1682–5.
17. Pawlikowska T, Chalder T, Hirsch SR, et al. Population based study of fatigue and psychological distress. BMJ 1994;308:763–6.
18. Lou JS, Kearns G, Oken B, et al. Exacerbated physical fatigue and mental fatigue in Parkinson’s disease. Mov Disord 2001;16:190–6.
19. Herlofson K, Larsen JP. The influence of fatigue on health-related quality of life in patients with Parkinson’s disease. Acta Neurol Scand 2003;107:1–6.
20. Hagell P, Brundin L. Towards an understanding of fatigue in Parkinson disease. J Neurol Neurosurg Psychiatry 2009;80:489–92.
21. Alves G, Wentzel-Larsen T, Larsen JP. Is fatigue an independent and persistent symptom in patients with Parkinson disease? Neurology 2004;63:1908–11.
22. Martinez-Martin P, Catalan MJ, Benito-Leon J, et al. Impact of fatigue in Parkinson’s disease: The fatigue impact scale for daily use (D-FIS). Qual Life Res 2006:15:597–606.
23. Havlikova E, Rosenberger J, Nagyova I, et al. Clinical and psychosocial factors associated with fatigue in patients with Parkinson’s disease. Parkinsonism Relat Disord 2008;14:187–92.
24. Lou JS, Kearns G, Benice T, et al. Levodopa improves physical fatigue in Parkinson’s disease: A double-blind, placebo controlled, crossover study. Mov Disord 2003;18:1108–14.
25. Khedr EM, Galal O, Said A, et al. Lack of post-exercise depression of corticospinal excitability in patients with Parkinson’s disease. Eur J Neurol 2007;14:793–6.
26. Lou JS, Benice T, Kearns G, et al. Levodopa normalizes exercise related cortico-motoneuron excitability abnormalities in Parkinson’s disease. Clin. Neurophysiol 2003;114:930–7.
27. Schifitto G, Friedman JH, Oakes D, et al. Fatigue in levodopa-naive subjects with Parkinson disease. Neurology 2008;71:481–5.
28. Pavese N, Metta V, Bose SK, et al. Fatigue in Parkinson’s disease is linked to striatal and limbic serotonergic dysfunction. Brain 2010;133:3434–43.
29. Brown RG, Dittner A, Findley L, Wessely SC. The Parkinson fatigue scale. Park Relat Disord 2005;11:49–55.
30. Grace J, Mendelsohn A, Friedman JH. A comparison of fatigue measures in Parkinson’s disease. Parkinsonism Relat Disord 2007;13:443–5.
31. Mendonça DA, Menezes K, Jog MS. Methylphenidate improves fatigue scores in Parkinson disease: a randomized controlled trial. Mov Disord 2007;22:2070–6.
32. Lou JS, Dimitrova DM, Park BS, et al. Using modafinil to treat fatigue in Parkinson disease: a double-blind, placebo-controlled pilot study. Clin Neuropharmacol 2009;32:305–10.
33. Ziv I, Avraham M, Michaelov Y, et al. Enhanced fatigue during motor performance in patients with Parkinson’s disease. Neurology 1998;51:1583–6.
34. Stocchi F. Benefits of treatment with rasagiline for fatigue symptoms in patients with early Parkinson’s disease. Eur J Neurol 2014;21:357–60.
35. Marin RS. Apathy: a neuropsychiatric syndrome. J. Neuropsychiatry Clin Neurosci 1991;3:243–4.
36. Marin RS. Apathy: concept, syndrome, neural mechanisms, and treatment. Semin Clin Neuropsychiatry 1996:1:304–14.
37. Levy R, Dubois B. Apathy and the functional anatomy of the prefrontal cortex-basal ganglia circuits. Cerebral Cortex 2006;16:916–28.
38. Pedersen KF, Larsen JP, Alves G, Aarsland D. Prevalence and clinical correlates of apathy in Parkinson’s disease: a community-based study. Parkinsonism Relat Disord 2009;15:295–9.
39. Pedersen KF, Alves G, Aarsland D, Larsen JP. Occurrence and risk factors for apathy in Parkinson disease: a 4-year prospective longitudinal study. J Neurol Neurosurg Psychiatry 2009;80:1279–82.
40. Pedersen KF, Alves G, Brønnick K, et al. Apathy in drug-naïve patients with incident Parkinson’s disease: The Norwegian ParkWest study. J Neurol 2010;257:217–23.
41. Ziropadja L, Stefanova E, Petrovic M, et al. Apathy and depression in Parkinson’s disease: The Belgrade PD study report. Parkinsonism Relat Disord 2012;18:339–42.
42. Dujardin K, Sockeel P, Devos D, et al. Characteristics of apathy in Parkinson’s disease. Mov Disord 2007;22:778–84.
43. Carriere N, Besson P, Dujardin K, et al. Apathy in Parkinson’s disease is associated with nucleus accumbens atrophy: a magnetic resonance imaging shape analysis. Mov Disord 2014;29;897–903.
44. Reijnders JSAM, Scholtissen B, Weber WEJ, et al. Neuroanatomical correlates of apathy in Parkinson’s disease: a magnetic resonance imaging study using voxel-based morphometry. Mov Disord 2010;25:2318–25.
45. Leroi I, Harbishettar V, Andrews M, et al. Carer burden in apathy and impulse control disorders in Parkinson’s disease. Int J Geriatr Psychiatry 2012;27:160–6.
46. Schiehser DM, Liu L, Lessig SL, et al. Predictors of discrepancies in Parkinson’s disease patient and caregiver ratings of apathy, disinhibition, and executive dysfunction before and after diagnosis. J Int Neuropsychol Soc 2013;19:295–304.
47. Benito-León J, Cubo E, Coronell C, et al. Impact of apathy on health-related quality of life in recently diagnosed Parkinson’s disease: The ANIMO study. Mov Disord 2012;27:211–8.
48. Sockeel P, Dujardin K, Devos D, et al. The Lille apathy rating scale (LARS), a new instrument for detecting and quantifying apathy: validation in Parkinson’s disease. J Neurol Neurosurg Psychiatry 2006;77:579–84.
49. Zahodne LB, Young S, Kirsch-Darrow L, et al. Examination of the Lille Apathy Rating Scale in Parkinson disease. Mov Disord 2009;24:677–83.
50. Drijgers RL, Dujardin K, Reijnders JSAM, et al. Validation of diagnostic criteria for apathy in Parkinson’s disease. Parkinsonism Relat Disord 2010;16:656–60.
51. Leentjens AFG, Koester J, Fruh B, et al. The effect of pramipexole on mood and motivational symptoms in parkinson’s disease: A meta-analysis of placebo-controlled studies. Clin Ther 2009;31:89–98.
52. Thobois S, Ardouin C, Lhommée E, et al. Non-motor dopamine withdrawal syndrome after surgery for Parkinson’s disease: Predictors and underlying mesolimbic denervation. Brain 2010;133:1111–27.
53. Devos D, Moreau C, Maltête D, et al. Rivastigmine in apathetic but dementia and depression-free patients with Parkinson’s disease: a double-blind, placebo-controlled, randomised clinical trial. J Neurol Neurosurg Psychiatry 2014;85:668–74.
54. Smith KM, Eyal E, Weintraub D; ADAGIO Investigators. Combined rasagiline and antidepressant use in Parkinson disease in the ADAGIO study: effects on nonmotor symptoms and tolerability. JAMA Neurol 2015;72:88–95.
55. Forsaa EB, Larsen JP, Wentzel-Larsen T, et al. A 12-year population-based study of psychosis in Parkinson disease. Arch Neurol 2010;67:996–1001.
56. Holroyd S, Currie L, Wooten GF. Prospective study of hallucinations and delusions in Parkinson’s disease. J Neurol Neurosurg Psychiatry 2001;70:734–8.
57. Fénelon G, Alves G. Epidemiology of psychosis in Parkinson’s disease. J Neurol Sci 2010;289:12–7.
58. Mack J, Rabins P, Anderson K, et al. Prevalence of psychotic symptoms in a community-based Parkinson disease sample. Am J Geriatr Psychiatry 2012;20:123–32.
59. Ravina B, Marder K, Fernandez HH, et al. Diagnostic criteria for psychosis in Parkinson’s disease: Report of an NINDS, NIMH Work Group. Mov Disord 2007;22:1061–8.
60. Diederich NJ, Fénelon G, Stebbins G, Goetz CG. Hallucinations in Parkinson disease. Nat Rev Neurol 2009;5:331–42.
61. Gallagher DA, Parkkinen L, O’Sullivan SS, et al. Testing an aetiological model of visual hallucinations in Parkinson’s disease. Brain 2011;134:3299–309.
62. Barnes J, Boubert L, Harris J, et al. Reality monitoring and visual hallucinations in Parkinson’s disease. Neuropsychologia 2003:41:565–74.
63. Kurita A, Murakami M, Takagi S, et al. Visual hallucinations and altered visual information processing in Parkinson disease and dementia with Lewy bodies. Mov Disord 2010;25:167–71.
64. Stebbins GT, Goetz CG, Carrillo MC, et al. Altered cortical visual processing in PD with hallucinations: an fMRI study. Neurology 2004;63:1409–16.
65. Williams DR, Lees AJ. Visual hallucinations in the diagnosis of idiopathic Parkinson’s disease: A retrospective autopsy study. Lancet Neurol 2005:4:605–10.
66. Biglan KM, Holloway RG, McDermott MP, Richard IH. Risk factors for somnolence, edema, and hallucinations in early Parkinson disease. Neurology 2007;69:187–95.
67. Kiziltan G, Ozekmekci S, Ertan S, et al. Relationship between age and subtypes of psychotic symptoms in Parkinson’s disease. J Neurol 2007;254:448–52.
68. Ecker D, Unrath A, Kassubek J, Sabolek M. Dopamine agonists and their risk to induce psychotic episodes in Parkinson’s disease: a case-control study. BMC Neurol 2009;9:23.
69. Huot P, Johnston TH, Darr T, et al. Increased 5-HT2A receptors in the temporal cortex of Parkinsonian patients with visual hallucinations. Mov Disord 2010;25:1399–408.
70. Ballanger B, Strafella AP, van Eimeren T, et al. Serotonin 2A receptors and visual hallucinations in Parkinson disease. Arch. Neurol 2010;67:416–21.
71. Boecker H, Ceballos-Baumann O, Volk D, et al. Metabolic alterations in patients with Parkinson disease and visual hallucinations. Arch Neurol 2007;64:984–8.
72. Sanchez-Castaneda C, Rene R, Ramirez-Ruiz B, et al. Frontal and associative visual areas related to visual hallucinations in dementia with Lewy bodies and Parkinson’s disease with dementia. Mov Disord 2010;25:615–22.
73. Goetz CG, Stebbins GT. Risk factors for nursing home placement in advanced Parkinson’s disease. Neurology 1993;43:2227–9.
74. Friedman JH. Parkinson disease psychosis: update. Behav.Neurol 2013;27:469–77.
75. Pollak P, Tison F, Rascol O, et al. Clozapine in drug induced psychosis in Parkinson’s disease: a randomised, placebo controlled study with open follow up. J Neurol Neurosurg Psychiatry 2004;75:689–95.
76. Parkinson Study Group. Low-dose clozapine for the treatment of drug-induced psychosis. N Engl J Med 1999;340:757–63.
77. Sobow T. Parkinson’s disease-related visual hallucinations unresponsive to atypical antipsychotics treated with cholinesterase inhibitors: a case series. Neurol Neurochir Pol 2007;41:276–9.
78. Fabbrini G, Barbanti P, Aurilia C, et al. Donepezil in the treatment of hallucinations and delusions in Parkinson’s disease. Neurol Sci 2002;23:41–3.
79. Bullock R, Cameron A, Hospital WH. Rivastigmine for the treatment of dementia and visual hallucinations associated with Parkinson’s disease: a case series. Curr Med Res Opin 2002;18,:258–64.
80. Cummings J, Isaacson S, Mills R, et al. Pimavanserin for patients with Parkinson’s disease psychosis: a randomised, placebo-controlled phase 3 trial. Lancet 2014;383:533–40.
81. L. Ishihara L, and C. Brayne C. A systematic review of depression and mental illness preceding Parkinson’s disease. Acta Neurol Scand 2006;113:211–20.
82. Reijnders JSAM, Ehrt U, Weber WEJ, et al. A systematic review of prevalence studies of depression in Parkinson’s disease. Mov Disord 2008;23:183–9.
83. Starkstein SE, Mayberg HS, Leiguarda R, et al. A prospective longitudinal study of depression, cognitive decline, and physical impairments in patients with Parkinson’s disease. J Neurol Neurosurg Psychiatry 1992:55:377–82.
84. Müller B, Assmus J, Herlofson K, et al. Importance of motor vs. non-motor symptoms for health-related quality of life in early Parkinson’s disease. Parkinsonism Relat Disord 2013;19:1027–32.
85. Ravina B, Camicioli R, Como PG, et al. The impact of depressive symptoms in early Parkinson disease. Neurology 2007;69:342–7.
86. Marsh L, McDonald WM, Cummings J, et al. Provisional diagnostic criteria for depression in Parkinson’s disease: report of an NINDS/NIMH work group. Mov Disord 2006;21:148–58.
87. Marsh L. Depression and Parkinson’s disease: current knowledge. Curr. Neurol. Neurosci. Rep 2013; 13:409.
88. Starkstein SE, Merello M, Jorge R, et al. A validation study of depressive syndromes in Parkinson’s disease. Mov Disord 2008;23,:538–46.
89. Williams JR, Hirsch ES, Anderson K, et al. A comparison of nine scales to detect depression in Parkinson disease: which scale to use? Neurology 2012;78:998–1006.
90. Nazem S, Siderowf AD, Duda JE, et al. Suicidal and death ideation in Parkinson’s disease. Mov Disord 2008;23:1573–9.
91. Weintraub D, Duda JE, Carlson K, et al. Suicide ideation and behaviours after STN and GPi DBS surgery for Parkinson’s disease: results from a randomised, controlled trial. J Neurol Neurosurg Psychiatry 2013;84:1113–8.
92. Aarsland D, Påhlhagen S, Ballard CG, et al. Depression in Parkinson disease—epidemiology, mechanisms and management. Nat Rev Neurol 2011;8:35–47.
93. Ehmann TS, Beninger RJ, Gawel MJ, Riopelle RJ. Depressive symptoms in Parkinson’s disease: a comparison with disabled control subjects. J Geriatr Psychiatry Neurol 1990;3:3–9.
94. Witjas T, Kaphan E, Azulay JP, et al. Nonmotor fluctuations in Parkinson’s disease: frequent and disabling. Neurology 2002:59:408–13.
95. Nissenbaum H, Quinn NP, Brown RG, et al. Mood swings associated with the ‘on-off’ phenomenon in Parkinson’s disease. Psychol Med 1987;17:899–904.
96. Maricle RA, Nutt JG, Carter JH. Mood and anxiety fluctuation in Parkinson’s disease associated with levodopa infusion: preliminary findings. Mov Disord 1995;10:329–32.
97. Barone P, Poewe W, Albrecht S, et al. Pramipexole for the treatment of depressive symptoms in patients with Parkinson’s disease: a randomised, double-blind, placebo-controlled trial. Lancet Neurol 2010;9:573–80.
98. Devos D, Dujardin K, Poirot I, et al. Comparison of desipramine and citalopram treatments for depression in Parkinson’s disease: a double-blind, randomized, placebo-controlled study. Mov Disord 2008;23:850–7.
99. Richard IH, McDermott MP, Kurlan R, et al. A randomized, double-blind, placebo-controlled trial of antidepressants in Parkinson disease. Neurology 2012;78:1229–36.
100. Menza M, Dobkin RD, Marin H, et al. A controlled trial of antidepressants in patients with Parkinson disease and depression. Neurology 2009;72:886–92.
101. Seppi K, Weintraub D, Coelho M, et al. The Movement Disorder Society evidence-based medicine review update: treatments for the non-motor symptoms of Parkinson’s disease. Mov Disord 2011;26 Suppl 3:S42–80.
102. Skapinakis P, Bakola E, Salanti G, et al. Efficacy and acceptability of selective serotonin reuptake inhibitors for the treatment of depression in Parkinson’s disease: a systematic review and meta-analysis of randomized controlled trials. BMC Neurol 2010;10:49.
103. Richard IH, Kurlan R, Tanner C, et al. Serotonin syndrome and the combined use of deprenyl and an antidepressant in Parkinson’s disease. Parkinson Study Group. Neurology 1997;48:1070–7.
104. Montgomery EB, Panisset M. Retrospective statistical analysis of the incidence of serotonin toxicity in patients taking rasagiline and anti-depressants in clinical trials. Mov Disord 2009;24:359.
105. Bailine S, Kremen N, Kohen I, et al. Bitemporal electroconvulsive therapy for depression in a Parkinson disease patient with a deep-brain stimulator. J ECT 2008;24:171–2.
106. Faber R, Trimble MR. Electroconvulsive therapy in Parkinson’s disease and other movement disorders. Mov Disord 1991;6:293–303.
107. da Silva TM, Munhoz RP, Alvarez C, et al. Depression in Parkinson’s disease: a double-blind, randomized, placebo-controlled pilot study of omega-3 fatty-acid supplementation. J Affect Disord 2008;111:351–9.
108. Pal E, Nagy F, Aschermann Z, et al. The impact of left prefrontal repetitive transcranial magnetic stimulation on depression in Parkinson’s disease: a randomized, double-blind, placebo-controlled study. Mov Disord 2010;25:2311–7.
109. Dobkin RD, Menza M, Allen LA, et al. Cognitive-behavioral therapy for depression in Parkinson’s disease: a randomized, controlled trial. Am J Psychiatry 2011;168:1066–74.
110. Stein MB, Heuser IJ, Juncos JL, Uhde TW. Anxiety disorders in patients with parkinson’s disease. Am J Psychiatry 1990;147:217–20.
111. Nuti A, Ceravolo R, Piccinni A, et al. Psychiatric comorbidity in a population of Parkinson’s disease patients. Eur J Neurol 2004;11:315–20.
112. Marinus J, Leentjens AFG, Visser M, et al. Evaluation of the Hospital Anxiety and Depression Scale in patients With Parkinson’s disease. Clin Neuropharmacol 2002:25:318–24.
113. Dissanayaka NNW, White E, O’Sullivan JD, et al. The clinical spectrum of anxiety in Parkinson’s disease. Mov Disord 2014;29:967–75.
114. Dissanayaka NNW, Sellbach A, Matheson S, et al. Anxiety disorders in Parkinson’s disease: prevalence and risk factors. Mov Disord 2010;25:838–45.
115. Leentjens AFG, Dujardin K, Pontone GM, et al. The Parkinson anxiety scale (PAS): Development and validation of a new anxiety scale. Mov Disord 2014;29:1035–43.
116. Maricle RA, Nutt JG, Valentine RJ, Carter JH. Dose-response relationship of levodopa with mood and anxiety in fluctuating Parkinson’s disease: a double-blind, placebo-controlled study. Neurology 1995;45:1757–60.
117. Erdal KJ. Depression and anxiety in persons with Parkinson’s disease with and without ‘on–off’ phenomena. J Clin Psychol Med Settings 2001:8:293–9.
118. Leentjens AFG, Dujardin K, Marsh L, et al. Symptomatology and markers of anxiety disorders in Parkinson’s disease: a cross-sectional study. Mov. Disord 2011;26:484–92.
119. Solla P, Cannas A, Floris GL, et al. Behavioral, neuropsychiatric and cognitive disorders in Parkinson’s disease patients with and without motor complications. Prog Neuropsychopharmacol Biol Psychiatry 2011;35:1009–13.
120. E. Stefanova E, L. Ziropadja L, M. Petrović M, et al. Screening for anxiety symptoms in Parkinson disease: a cross-sectional study. J Geriatr Psychiatry Neurol 2013;26:34–40.
121. Jacob EL, Gatto NM, Thompson A, et al. Occurrence of depression and anxiety prior to Parkinson’s disease. Parkinsonism Relat Disord 2010;16:576–81.
122. Craig LH, Svircev A, Haber M, Juncos JL. Controlled pilot study of the effects of neuromuscular therapy in patients with Parkinson’s disease. Mov Disord 2006;21:2127–33.
123. Marino L, Friedman JH. Letter to the editor: Successful use of electroconvulsive therapy for refractory anxiety in Parkinson’s disease. Int J Neurosci 2013;123:70–1.
Treatments for Obstructive Sleep Apnea
From the Center for Narcolepsy, Sleep and Health Research, Department of Biobehavioral Health Science, University of Illinois at Chicago, Chicago, IL.
Abstract
- Objective: To review the efficacy of current treatment options for adults with obstructive sleep apnea (OSA).
- Methods: Review of the literature.
- Results: OSA, characterized by repetitive ≥ 10-second interruptions (apnea) or reductions (hypopnea) in airflow, is initiated by partial or complete collapse in the upper airway despite respiratory effort. When left untreated, OSA is associated with comorbid conditions, such as cardiovascular and metabolic diseases. The current “gold standard” treatment for OSA is continuous positive air pressure (CPAP), which pneumatically stabilizes the upper airways. CPAP has proven efficacy and potential cost savings via decreases in health comorbidities and/or motor-vehicle crashes. However, CPAP treatment is not well-tolerated due to various side effects, and adherence among OSA subjects can be as low as 50% in certain populations. Other treatment options for OSA include improving CPAP tolerability, increasing CPAP adherence through patient interventions, weight loss/exercise, positional therapy, nasal expiratory positive airway pressure, oral pressure therapy, oral appliances, surgery, hypoglossal nerve stimulation, drug treatment, and combining 2 or more of the aforementioned treatments. Despite the many options available to treat OSA, none of them are as efficacious as CPAP. However, many of these treatments are tolerable, and adherence rates are higher than those of the CPAP, making them a more viable treatment option for long-term use.
- Conclusion: Patients need to weigh the benefits and risks of available treatments for OSA. More large randomized controlled studies on treatments or combination of treatments for OSA are needed that measure parameters such as treatment adherence, apnea-hypopnea index, oxygen desaturation, subjective sleepiness, quality of life, and adverse events.
Obstructive sleep apnea (OSA), characterized by repetitive ≥ 10-second interruptions (apnea) or reductions (hypopnea) in airflow (measured as events/hour, called the apnea-hypopnea index [AHI]), is initiated by partial or complete collapse in the upper airway despite respiratory effort [1]. Current estimates of the prevalence of OSA (AHI ≥ 5 and Epworth Sleepiness Scale > 10) in American men and women (aged 30–70 years) are 14% and 5%, respectively, with prevalence rates increasing due to increasing rates of obesity, a risk factor for developing OSA [2]. Hypoxemia/hypercapnia, fragmented sleep, as well as exaggerated fluctuations in heart rhythm, blood pressure, and intrathoracic pressure are some of the acute physiological effects of untreated OSA [1]. These acute effects can develop into long-term sequelae, such as hypertension and other cardiovascular comorbidities [2,3], decrements in cognitive function [4,5], poor mood, reduced quality of life [6,7], and premature death [8,9]. In economic terms, health care cost estimates of OSA and its associated comorbidities rival that of diabetes [10]. Additionally, in the year 2000, more than 800,000 drivers were involved OSA-related motor-vehicle collisions, of which more than 1400 fatalities occurred [11].
Front-line treatment of OSA relies on mechanically stabilizing the upper airway with a column of air via continuous positive airway pressure (CPAP) treatment. Though CPAP is the “gold standard” treatment for OSA with proven efficacy and potential cost savings via decreases in health comorbidities and/or motor-vehicle crashes [10–12], CPAP treatment is not well-tolerated due to various side effects [13–15]. Adherence among OSA subjects can be as low as 50% in certain populations [16–18]. Improved strategies for current and innovative treatments have emerged in the last few years and are the subject of this review.
Improved CPAP Treatment
As stated previously, CPAP pneumatically splints the upper airway, thus preventing it from collapsing during sleep. However, CPAP is not well-tolerated. Modifications to standard CPAP to increase adherence have been met with disappointing results. Humidification with heated tubing delivering heated moistened air did not increase compliance compared to standard CPAP [19]. CPAP was also compared with auto-adjusting CPAP (APAP), where respiration is monitored and the minimum pressure of air is applied to splint the upper airway open. In a meta-analysis, APAP only had very small effect on compliance [20]. Lastly, reduction in pressure during expiration was investigated, and a meta-analysis showed no effect [21,22]. However, recent advances in CPAP delivery give hope to increasing compliance. The S9CPAP machine (Resmed, San Diego, CA), which combines a humidification system and an APAP, showed increased compliance compared to standard CPAP. Compliance increased by an average of 30 minutes per night, and variance of daily usage decreased (eg, patients used it more day-to-day) [23]. However, a randomized blinded study needs to be conducted to corroborate these results.
Promoting CPAP Adherence Through Patient Interventions
Educational, supportive, and behavioral interventions have been used to increase CPAP adherence and have been thoroughly reviewed via meta-analysis [24]. Briefly, 30 studies of various interventions were included and demonstrated that educational, supportive, or behavioral interventions increased CPAP usage in OSA-naive patients. Behavioral interventions increased CPAP usage by over an hour, but the evidence was of “low-quality.” Educational and supportive interventions also increased CPAP usage, with the former having “moderate-quality” evidence [24]. However, whether increased CPAP usage had an effect on symptoms and quality of life was statistically unclear, and the authors recommended further assessment [24]. Three more studies on interventions to increase CPAP usage have been conducted since the aforementioned review. In a randomized controlled study, investigators had OSA patients participate in a 30-minute group social cognitive therapy session (eg, increasing perceived self-efficacy, outcome expectations, and social support) to increase CPAP adherence. Compared to a social interaction control group, there was no increase in adherence rates [25]. In another smaller randomized controlled study that used a social cognition model of behavioral therapy, there were small increases of CPAP usage. At 3 months, the social cognitive intervention increased CPAP usage by an average of 23 minutes per night, increased the number of individuals using their CPAP machine for more than 4 hours compared to standard care group, and decreased symptom of sleepiness [26]. And lastly, a preliminary study looked at increasing adherence rates by utilizing easily accessible alternative care providers, such as nurses and respiratory therapists, for the management of OSA [27]. Though this study had no control group, it did show that good adherence and a decrease in symptoms of sleepiness could be achieved with non-physician management of OSA [27]. A randomized controlled study will be needed to validate the use of alternative care providers.
Interventions have shown some success in increasing adherence rates, but the question remains on who should receive those interventions. Predicting which OSA patients are in most need of an intervention has been studied. A recent study used a 19-question assessment tool called the Index of Nonadherence to PAP to screen for nonadherers (OSA patients who used CPAP for less than 4 hours a night, after 1 month of OSA diagnosis). The assessment tool was 87% sensitive and 63% specific at determining those OSA patients who would not adhere to CPAP treatment [28]. Another study investigated the reliability and validity of a self-rating scale measuring the side effects of CPAP and their consequences on adherence [15]. The investigators showed that the scale was able to reliably discriminate between those who adhered to CPAP treatment and those that did not [15]. Both of these scales can be used to screen OSA patients that need interventions to increase CPAP adherence. Lastly, a recent systematic review showed that a user’s CPAP experience was not defined by the user but by the user’s health care provider, who framed CPAP as “problematic” [29]. The authors argue that users of CPAP are “primed” to reflect negatively on their CPAP experience [29]. Interventions can be used to change the way OSA patients think or feel about their CPAP machines.
When OSA Patients Do Not Adhere to CPAP Treatment
With adherence rates as low as 50% [16–18], those who fail to tolerate CPAP are unlikely to be referred for additional treatment [30]. Those who do tolerate treatment dislike the side effects of CPAP and show an interest in other treatment options [14]. Other treatment options have been shown to decrease the severity of OSA.
Weight Loss and Exercise
OSA prevalence is correlated with body mass index (BMI), and the increasing rates of OSA has been attributed to the increasing rates of obesity in the United States [2]. A meta-analysis of 3 randomized controlled studies of weight loss induced by dieting or lifestyle change showed that weight loss decreased OSA severity. The effect was the greatest for OSA patients who lost more than 10 kg or had severe OSA at baseline [31]. A recent randomized controlled study involving OSA patients with type 2 diabetes investigated if either a weight loss intervention or a diabetes support and education intervention would be able to decrease OSA severity [32]. The weight loss intervention significantly decreased OSA severity, which was largely but not entirely attributed to weight loss. The participants regained 50% of their weight 4 years after the intervention and still had significantly less severe OSA compared to control intervention group. The downside to this intervention is the intensity of the regimen to which the subjects had to adapt: portion-controlled diets with liquid meals and snack bars for the first 4 months and moderate-intensity physical activity for a minimum of 3 hours a week for the first year. After that, patients were still required to follow through with the intervention for 3 years, which included one on-site visit per month and a second contact by phone, mail, or email [32]. One study looked at weight loss and sleep position (supine vs. lateral). The study showed a decrease in AHI in OSA patients that lost weight, and the biggest decrease was in AHI in the lateral sleeping position [33]. Another study looked at the more invasive procedure of bariatric surgery to decrease weight and OSA. At the 1-year follow-up, patients had significantly decreased their BMI and AHI [34]. Two more randomized controlled studies investigated if exercise or fitness level might be beneficial to OSA patients independent of weight loss. Exercise improved AHI even though there was not a significant decrease in weight between the exercise and stretching control group [35]. However, an increase in fitness level did not have any additive effect on the decrease of AHI when weight change was taken into account [36]. The difference in results might be attributed to the latter study using older type 2 diabetic patients and moderate physical activity, while the former studied incorporated moderate-intensity aerobic activity and resistance training for younger patients [35,36]. There is evidence that a sedentary lifestyle increases diurnal leg fluid volume that can shift to the neck during sleep and might play a role in pathogenesis of OSA [37]. Decreasing a sedentary lifestyle by exercising might therefore be beneficial to OSA patients. Given the increasing rates of obesity [2], implementing weight loss as a solution to OSA is viable, especially considering that OSA is not the only comorbid disease of obesity [38].
Positional Therapy
It has been known for some time that sleeping in a supine position doubles a patient’s AHI compared to sleeping in the lateral position [39]. A more recent analysis showed that 60% of patients were “supine predominant OSA;” these patients had supine AHI that was twice that of non-supine AHI [40]. Moreover, a drug-induced sleep endoscopy study showed that the upper airway collapses at multiple levels sleeping in the supine position as opposed to at a single level sleeping in the lateral position [41]. Another study showed that lateral sleeping position improved passive airway anatomy and decreased collapsibility [42]. Many studies have shown that patients who wear a device that alerts the sleeper that he or she is in a supine position (referred to as positional therapy) significantly decreases AHI, but long-term compliance is still an issue, and new and improved devices are needed [43]. Three new studies bolster the effectiveness of positional therapy [44–46]. In all 3 studies, sleeping in the supine position went down to 0% (no change in sleep efficiency [the ratio of total time spent sleeping to the total time spent in bed]), AHI decreased to less than 6, and sleep quality and daytime sleepiness increased and decreased, respectively [44–46]. Compliance was as low as 76% [44] and as high as 93% [46]. For those who cannot tolerate CPAP, positional therapy could be a substitute for decreasing severity of OSA. However, “phenotyping” OSA patients as “supine predominant OSA” would need to be implemented to guarantee efficacy of positional therapy.
Nasal Expiratory Positive Airway Pressure
Oral Pressure Therapy
Retro-palatal collapse occurs in OSA and can be prevented by applying negative pressure to the upper airway [49]. The oral pressure therapy (OPT) device applies gentle suction anteriorly and superiorly to displace the tongue and soft palate and breathing occurs via nasopharyngeal airway [12]. A recent systematic review [49] of OPT revealed that successful OPT treatment rate was 25% to 37% if using standard and stringent definitions of treatment success. Although OPT decreased AHI, residual AHI still remained high due to positional apneas and collapse of upper airway at other levels besides retro-palatal. The authors of this systematic review recommend more rigorous and controlled studies with defined “treatment success” [49]. The advantage of OPT is that adherence was good; patients used the device on average 6 hours a night. There were no severe or serious adverse events with OPT, however oral tissue discomfort or irritation, dental discomfort, and dry mouth were reported [50].
Oral Appliances
Similar to OPT, oral appliances (OAs) attempt to prevent upper airway collapse. OAs either stabilize the tongue, advance the mandible, or lift the soft palate to increase the volumes of the upper airways to avert OSA [16, 51]. The OAs, like the mandibular advancement device, for example, have the added benefit of being fitted specifically for the OSA patient. The mandible for a patient can be advanced to alleviate obstructive apneas, but can also be pulled back if the OA is too uncomfortable or painful. However, there is still dispute on how exactly to titrate these OAs [52]. A meta-analysis recently published looked at all clinical trials of OAs through September 2015. After meeting strict exclusion/inclusion criteria, 17 studies looking at OAs were included in the meta-analysis. There were robust decreases in AHI and in symptoms of sleepiness in OSA patients that used OAs compared to control groups. However, due to the strict inclusion/exclusion criteria of the meta-analysis, all the studies except one used mandibular advancement appliances; one study used a tongue-retaining appliance. The authors concluded that there is sufficient evidence for OAs to be effective in patients with mild-to-moderate OSA [51]. Since the meta-analysis, 6 new studies have been published about OAs. In 4 of the studies (all using mandibular advancement), OAs significantly decreased AHI by 50% or more in the majority of OSA patients [53–56]. The other 2 studies looked at long-term efficacy and compliance. In both studies, there were drastic decreases in AHI when OAs were applied [57, 58]. In one study, about 40% of OSA patients stopped using the OAs. When the change in AHI was stratified between users and non-users, the users group was significantly higher that the non-user group, suggesting that the non-user group were not compliant due to less of an effect of the OA on AHI [57]. In the second study, OSA patients using OAs for a median of 16.5 years were evaluated for long-term efficacy of the OAs. At the short-term follow-up, AHI decreased by more than 50% with use of an OA. However, at the long-term follow-up, the OA lost any effect on AHI. One reason for this is that the OSA patients’ AHI without the OA at the long-term follow-up nearly doubled compared to AHI without OA at the short-term follow-up. The authors conclude that OSA patients using OAs for the long-term might undergo deteriorations in treatment efficacy of OAs, and that regular follow-up appointments with sleep apnea recordings should be implemented [58].
A similarity in all these studies is that adherence was higher for OAs compared to CPAP [51]. The caveat is that most studies have relied on self-reports for adherence rates [12]. However, there were 3 studies that implemented a sensor that measured adherence and compared those results to self-reported OA adherence. All 3 studies showed a strong relationship between self-reports and sensor adherence; patients were honest about adherence to OAs [59–61]. Studies have also been conducted to predict compliance with OAs: higher therapeutic CPAP pressure, age, OSA severity [62], decreased snoring [63], and lower BMI [64, 65] predicted compliance, while dry mouth [63], oropharyngeal crowding [65], and sleeping in a supine position [66] predicted noncompliance. Though adherence rates are high, OAs do not decrease AHI as much as CPAP [67], and a recent study showed that long-term adherence rates might not be different to CPAP adherence rates [68]. OAs, due to their higher adherence rates, are a potential second choice over CPAP. However, they are less efficacious than CPAP at decreasing AHI. That may not be as important since a recent meta-analysis comparing the effects of CPAP or OAs on blood pressure showed that both treatments significantly decreased blood pressure [69]. More studies need to be conducted over long-term efficacy of OAs compared with CPAP.
Surgeries to Treat OSA
Surgery as a treatment option has been extensively reviewed and meta-analyzed [70–78]. Surgery for the treatment of OSA includes tongue suspension [70,74], maxillomandibular advancement (MMA) [72,73,78], pharyngeal surgeries (eg, uvulopharyngopalatoplasty [UPPP]) [73], laser-assisted uvulopalatoplasty (LAUP) [73], radiofrequency ablation (RFA) [73], tracheostomy [71], nasal surgery [75], and glossectomy [77], as well as multi-level and multi-phased procedures [70,74,76,77]. Most studies done on surgeries were case studies, with a minority of investigations that were randomized and controlled. Glossectomy, as part of a multi-level surgical approach, decreased AHI and symptoms of sleepiness, but glossectomy as a stand-alone surgical procedure did not improve AHI [77]. Significant improvements in AHI and sleepiness symptoms were seen in a majority of OSA patients who underwent MMA [72,73,78] and tracheostomy, although tracheostomy was performed for the morbidly obese or those who have failed other traditional surgical treatments [71]. Stand-alone tongue suspension and nasal surgery did not decrease AHI in the majority of patients, though nasal surgery did decrease subjective sleepiness [70,72,74,75]. However, tongue suspension combined with UPPP had better outcomes [70]. LAUP showed inconsistent results with the majority of studies showing no change in AHI, while UPPP and RFA seemed to improved AHI, although some studies showed no change [73]. Multi-level or multi-phase surgeries also showed improvements on OSA severity, but whether these surgeries are better than stand-alone remains to be investigated [73,76]. Morbidity and adverse events, like infection or pain, are common in all of these surgical events [70–78], but there are significant differences between the procedures. For example, MMA had fewer adverse events reported compared to UPPP [73]. More recently, glossectomy via transoral robotic surgery with UPPP [79] or epiglottoplasty [80] has been investigated; there were decreases in AHI, but response rates were between 64% to 73%. Although it seems surgical procedures to treat OSA are plausible, most studies were not rigorous enough to say this with any certainty.
Hypoglossal Nerve Stimulation
OSA subjects experience upper airway obstruction due to loss of genioglossus muscle activity during sleep. Without tongue activation, the negative pressure of breathing causes the upper airways to collapse [81]. Transcutaneous, intraoral, and intramuscular devices used to electrically activate the tongue have been developed and tested; however, although these devices decreased AHI they also induced arousals and sleep fragmentation caused by the electrical stimulus [82–86]. A new method had to be developed that would not be felt by the OSA patient.
In all trials to date, there were significant decreases in AHI as long as 3 years post implantation [87–93]. There were significant improvements in symptoms of sleepiness, mood, quality of life, and sleep quality [87,88,90–94]. When OSA patients had their neurostimulators turned off for 5 days to a week, AHI returned back to baseline levels [89,92]. However, all the trials excluded morbidly obese individuals [87–93] because investigations showed that HNS had no therapeutic effect with elevated BMI [88,90]. The drawbacks of HNS are that it is surgically invasive and minor adverse events have been reported: procedural-related events (eg, numbness/pain/swelling/infection at incision site, temporary tongue weakness) that resolved with time, pain medication, and/or antibiotic treatment, or therapy-related events (eg, tongue abrasions cause by tongue movement over teeth, discomfort associated with stimulation) that resolved after acclimation. Serious adverse events occurred infrequently, such as infection at incision site requiring device removal or subsequent surgery to reposition or replace electrode cuff or malfunctioning neurostimulator [87,88,90]. HNS durability at 18 and 36 months was still very effective, with decreased AHI and increase quality of life and sleep being sustained; adverse events were uncommon this long after implantation [91,93]. Although surgery is required and adverse events are reported, the long-term significant improvement of OSA makes this a very viable treatment option over CPAP. However, increasing prevalence rates of OSA are correlated to increasing obesity rates [2], which may limit the usefulness of HNS since a BMI of more than 40 might preclude individuals to this treatment.
Pharmacologic Treatment
There are no approved pharmacologic treatments for OSA. A recent Cochrane review and meta-analysis assessed clinical trials of various drugs treating OSA. These drugs targeted 5 strategies at alleviating OSA: increasing ventilatory drive (progestogens, theophylline, and acetazolamide), increasing upper airway tone (serotonergics and cholinergics), decreasing rapid eye movement sleep (antidepressants and clonidine), increasing arousal threshold (eszopiclone), and/or increasing the cross-sectional area or reducing the surface tension of the upper airway through topical therapy (fluticasone and lubricant). The review concluded that “some of the drugs may be helpful; however, their tolerability needs to be considered in long-term trials.” Some of these drugs had little or no effect on AHI, and if they did have an effect on AHI, side effects outweighed the benefit [95]. Since then, more investigations of other drugs targeted at the previously aforementioned strategies or via new strategies have been published.
Dronabinol (synthetic Δ9-THC), a nonselective cannabinoid type 1 and type 2 receptor agonist, significantly reduced AHI and improved subjective sleepiness and alertness in a single-blind dose-escalation (2.5, 5, or 10 mg) proof-of-concept study [96,97]. Dronabinol most likely increases upper airway tone though inhibition of vagal afferents [98,99]. There were no serious adverse events associated with dronabinol. Minor adverse events included somnolence and increased appetite. Increased appetite might lead to increased weight and contradict any beneficial effects of dronabinol; however, in the 3-week treatment period no weight gain was observed [97]. This might have been due to drug administration occurring before going to sleep with no opportunity to eat. A larger randomized controlled study will be needed to establish the safety and efficacy of dronabinol.
The sedative zopiclone was used to increase arousal threshold without effecting genioglossus activity [100]. Eszopiclone, a drug in the same class, has been used in the past with unfavorable results [95]. Zopiclone was used in a small double-blind randomized controlled cross-over study. Zopiclone significantly increased respiratory arousal threshold without effecting genioglossus activity or the upper airway’s response to negative pressure. Thus, there was a trend in the zopiclone treatment to increase sleep efficiency. However, zopiclone had no effect on AHI, and increased oxygen desaturation [100]. Similar to eszopiclone, the results for zopiclone are not promising.
A new strategy to treat OSA is to modify pharmacologically “loop gain,” a dimensionless value quantifying the stability of the ventilatory control system. A high loop gain signifies instability in the ventilatory control system and predisposes an OSA person to recurrent apneas [101–103]. Three studies used drugs that inhibit carbonic anhydrase to stabilize the ventilatory control system [104–106]. Two studies used acetazolamide, which decreased loop gain in OSA patients [104,105]. Acetazolamide only decreased AHI in non–rapid eye movement (NREM) sleep, and there was a slight correlation between decrease in loop gain and total AHI [105]. Acetazolamide also decreased ventilatory response to spontaneous arousal, thus promoting ventilatory stability [104]. In the last study, zonisamide, a carbonic anhydrase inhibitor that also causes weight loss, was investigated in OSA patients. Sleep apnea alleviation, measured in terms of absolute elimination of sleep apnea by mechanical or pharmacologic treatment, was 61% and 13% for CPAP and zonisamide, respectively, compared with placebo. In other words, zonisamide decreased AHI but not to the extent of CPAP [106]. Zonisamide also decreased arousals and marginally, but significantly, decreased weight compared to the CPAP group. Although carbonic anhydrase inhibitors have promise as an alternative treatment, long-term use is poorly tolerated [101] and further studies need to be completed.
OSA has been linked with gastroesophageal reflux disease (GERD), with studies suggesting OSA precipitates GERD [107] or GERD precipitates OSA [108]. A meta-analysis was recently published looking at studies that used proton pump inhibitors (PPI) to treat GERD and the effects it would have on OSA [109]. The meta-analysis only included 2 randomized trials and 4 prospective cohort studies. Two of the cohort studies showed a significant decrease, and one cohort showed no difference in apnea indices; and all 4 of the cohort studies showed no difference in AHI. In one trial, the frequency of apnea attacks as recorded by diaries significantly decreased. In 3 cohort studies and one trial, symptoms of sleepiness significantly decreased [109]. A study that was not included in the meta-analysis showed that 3 months of PPI treatment decreased AHI but did not alter sleep efficiency [110]. Larger randomized controlled studies need to be conducted on the effects of PPIs on OSA, especially since PPIs are well tolerated with only weak observational associations between PPI therapy and fractures, pneumonia, mortality, and nutritional deficiencies [111].
The drugs mentioned above have potential for treating OSA in patients intolerant to CPAP. The efficacy and side effects of the drugs will need to be studied for long-term use. However, development of pharmacologic treatments has been hampered by incomplete knowledge of the relevant sleep-dependent peripheral and central neural mechanisms controlling ventilatory drive and upper airway muscles. More importantly, additional basic science research needs to focus on the neurobiological and neurophysiological mechanisms underlying OSA to develop new pharmacotherapies or treatment strategies, or to modify previous treatment strategies.
Treatment Combinations and Phenotyping
It has been recently suggested that combining 2 or more of the above treatments might lead to greater decreases in AHI and greater improvements in subjective sleepiness [112,113]. In fact, one such treatment combination has occurred [114]. Both OA or positional therapy decrease AHI. However, the combination of an OA and positional therapy led to further significant decreases in AHI compared to when those treatments were used alone [114]. To correctly combine treatments, the patient will have to be “phenotyped” via polysomnography to discern the specific pathophysiology of the patient’s OSA. There are published reports of methods to phenotype patients according to their sleep positon, ventilation parameters, loop gain, arousal threshold, and upper airway gain, and if apneic events occur in REM or NREM sleep [40,115]. Defining these traits for individual OSA patients can lead to better efficacy and compliance of combination treatments for OSA. Combination treatment coupled with phenotyping are needed to try to reduce AHI to levels achieved with CPAP.
Conclusion
CPAP is the gold standard treatment because it substantially decreases the severity of OSA just by placing a mask over one’s face before going to sleep. However, it is not tolerable to continually have air forced into your upper airways, and new CPAP devices that heat and humidify the air, and auto titrate the pressure, have been developed to increase adherence rates, but with limited success. For all the treatments listed, a majority do not decrease the severity of OSA to levels achieved with CPAP. However, adherence rates are higher and therefore might, in the long-term, be a better option than CPAP. Some treatments involve invasive surgery to open or stabilize the upper airways, or to implant a stimulator, some treatments involve oral drugs with side effects, and some treatments involve placing appliances on your nose or in your mouth. And some treatments can be combined and individually tailored to the OSA patient via “phenotyping.” For all treatments, the benefits and risks need to be weighed by each patient. More importantly, more large randomized controlled studies on treatments or combination of treatments for OSA are needed using parameters such as treatment adherence, AHI, oxygen desaturation, subjective sleepiness, quality of life, and adverse events (both minor and major) to gauge treatment success in the short-term and long-term. Only then can OSA patients in partnership with their health care provider choose the best treatment option.
Corresponding author: Michael W. Calik, PhD, 845 S. Damen Ave (M/C 802), College of Nursing, Room 740, Chicago, IL 60612, [email protected].
Financial disclosures: None.
1. Somers VK, White DP, Amin R, et al. Sleep apnea and cardiovascular disease: an American Heart Association/American College of Cardiology Foundation Scientific Statement from the American Heart Association Council for High Blood Pressure Research Professional Education Committee, Council on Clinical Cardiology, Stroke Council, and Council on Cardiovascular Nursing. In collaboration with the National Heart, Lung, and Blood Institute National Center on Sleep Disorders Research (National Institutes of Health). Circulation 2008;118:1080–111.
2. Peppard PE, Young T, Barnet JH, et al. Increased prevalence of sleep-disordered breathing in adults. Am J Epidemiol 2013;177:1006–14.
3. Shamsuzzaman AS, Gersh BJ, Somers VK. Obstructive sleep apnea: implications for cardiac and vascular disease. JAMA 2003;290:1906–14.
4. Kim HC, Young T, Matthews CG, et al. Sleep-disordered breathing and neuropsychological deficits. A population-based study. Am J Respir Crit Care Med 1997;156:1813–9.
5. Yaffe K, Laffan AM, Harrison SL, et al. Sleep-disordered breathing, hypoxia, and risk of mild cognitive impairment and dementia in older women. JAMA 2011;306:613–9.
6. Baldwin CM, Griffith KA, Nieto FJ, et al. The association of sleep-disordered breathing and sleep symptoms with quality of life in the Sleep Heart Health Study. Sleep 2001;24:96–105.
7. Peppard PE, Szklo-Coxe M, Hla KM, Young T. Longitudinal association of sleep-related breathing disorder and depression. Arch Intern Med 2006;166:1709–15.
8. Marshall NS, Wong KK, Liu PY, et al. Sleep apnea as an independent risk factor for all-cause mortality: the Busselton Health Study. Sleep 2008;31:1079–85.
9. Young T, Finn L, Peppard PE, et al. Sleep disordered breathing and mortality: eighteen-year follow-up of the Wisconsin sleep cohort. Sleep 2008;31:1071–8.
10. AlGhanim N, Comondore VR, Fleetham J, et al. The economic impact of obstructive sleep apnea. Lung 2008;186:7–12.
11. Sassani A, Findley LJ, Kryger M, et al. Reducing motor-vehicle collisions, costs, and fatalities by treating obstructive sleep apnea syndrome. Sleep 2004;27:453–8.
12. Weaver TE, Calik MW, Farabi SS, et al. Innovative treatments for adults with obstructive sleep apnea. Nat Sci Sleep 2014;6:137–47.
13. Isetta V, Negrin MA, Monasterio C, et al. A Bayesian cost-effectiveness analysis of a telemedicine-based strategy for the management of sleep apnoea: a multicentre randomised controlled trial. Thorax 2015;70:1054–61.
14. Tsuda H, Moritsuchi Y, Higuchi Y, Tsuda T. Oral health under use of continuous positive airway pressure and interest in alternative therapy in patients with obstructive sleep apnoea: a questionnaire-based survey. Gerodontology 2015 Feb 10.
15. Brostrom A, Arestedt KF, Nilsen P, et al. The side-effects to CPAP treatment inventory: the development and initial validation of a new tool for the measurement of side-effects to CPAP treatment. J Sleep Res 2010;19:603–11.
16. Weaver TE, Grunstein RR. Adherence to continuous positive airway pressure therapy: the challenge to effective treatment. Proc Am Thorac Soc 2008 Feb 15;5:173–8.
17. Hedner J, Grote L, Zou D. Pharmacological treatment of sleep apnea: current situation and future strategies. Sleep Med Rev 2008;12:33–47.
18. Smith I, Lasserson TJ, Wright J. Drug therapy for obstructive sleep apnoea in adults. Cochrane Database Syst Rev 2006(2):CD003002.
19. Ruhle KH, Franke KJ, Domanski U, Nilius G. Quality of life, compliance, sleep and nasopharyngeal side effects during CPAP therapy with and without controlled heated humidification. Sleep Breath 2011;15:479–85.
20. Xu T, Li T, Wei D, et al. Effect of automatic versus fixed continuous positive airway pressure for the treatment of obstructive sleep apnea: an up-to-date meta-analysis. Sleep Breath 2012;16:1017–26.
21. Smith I, Lasserson TJ. Pressure modification for improving usage of continuous positive airway pressure machines in adults with obstructive sleep apnoea. Cochrane Database Syst Rev 2009 (4):CD003531.
22. Dungan GC, 2nd, Marshall NS, Hoyos CM, et al. A randomized crossover trial of the effect of a novel method of pressure control (SensAwake) in automatic continuous positive airway pressure therapy to treat sleep disordered breathing. J Clin Sleep Med 2011;7:261–7.
23. Wimms AJ, Richards GN, Benjafield AV. Assessment of the impact on compliance of a new CPAP system in obstructive sleep apnea. Sleep Breath 2013;17:69–76.
24. Wozniak DR, Lasserson TJ, Smith I. Educational, supportive and behavioural interventions to improve usage of continuous positive airway pressure machines in adults with obstructive sleep apnoea. Cochrane Database Syst Rev 2014;1:CD007736.
25. Bartlett D, Wong K, Richards D, et al. Increasing adherence to obstructive sleep apnea treatment with a group social cognitive therapy treatment intervention: a randomized trial. Sleep 2013;36:1647–54.
26. Deng T, Wang Y, Sun M, Chen B. Stage-matched intervention for adherence to CPAP in patients with obstructive sleep apnea: a randomized controlled trial. Sleep Breath 2013;17:791–801.
27. Pendharkar SR, Dechant A, Bischak DP, et al. An observational study of the effectiveness of alternative care providers in the management of obstructive sleep apnoea. J Sleep Res 2015 Oct 27.
28. Sawyer AM, King TS, Hanlon A, et al. Risk assessment for CPAP nonadherence in adults with newly diagnosed obstructive sleep apnea: preliminary testing of the Index for Nonadherence to PAP (I-NAP). Sleep Breath 2014;18:875–83.
29. Ward K, Hoare KJ, Gott M. What is known about the experiences of using CPAP for OSA from the users’ perspective? A systematic integrative literature review. Sleep Med Rev 2014;18:357–66.
30. Russell JO, Gales J, Bae C, Kominsky A. Referral patterns and positive airway pressure adherence upon diagnosis of obstructive sleep apnea. Otolaryngol Head Neck Surg 2015;153:881–7.
31. Hemmingsson E. Does medically induced weight loss improve obstructive sleep apnoea in the obese: review of randomized trials. Clin Obes 2011;1:26–30.
32. Kuna ST, Reboussin DM, Borradaile KE, et al. Long-term effect of weight loss on obstructive sleep apnea severity in obese patients with type 2 diabetes. Sleep 2013;36:641–9A.
33. Kulkas A, Leppanen T, Sahlman J, et al. Weight loss alters severity of individual nocturnal respiratory events depending on sleeping position. Physiol Meas 2014;35:2037–52.
34. Bae EK, Lee YJ, Yun CH, Heo Y. Effects of surgical weight loss for treating obstructive sleep apnea. Sleep Breath 2014;18:901–5.
35. Kline CE, Crowley EP, Ewing GB, et al. The effect of exercise training on obstructive sleep apnea and sleep quality: a randomized controlled trial. Sleep 2011;34:1631–40.
36. Kline CE, Reboussin DM, Foster GD, et al. The effect of changes in cardiorespiratory fitness and weight on obstructive sleep apnea severity in overweight adults with type 2 diabetes. Sleep 2016;39:317–25.
37. Vena D, Yadollahi A, Bradley TD. Modelling fluid accumulation in the neck using simple baseline fluid metrics: implications for sleep apnea. Conf Proc IEEE Eng Med Biol Soc 2014;2014:266–9.
38. Whitlock G, Lewington S, Sherliker P, et al. Body-mass index and cause-specific mortality in 900 000 adults: collaborative analyses of 57 prospective studies. Lancet 2009;373:1083–96.
39. Cartwright RD. Effect of sleep position on sleep apnea severity. Sleep 1984;7:110–4.
40. Joosten SA, Hamza K, Sands S, et al. Phenotypes of patients with mild to moderate obstructive sleep apnoea as confirmed by cluster analysis. Respirology 2012;17:99–107.
41. Lee CH, Kim DK, Kim SY, et al. Changes in site of obstruction in obstructive sleep apnea patients according to sleep position: a DISE study. Laryngoscope 2015;125:248–54.
42. Joosten SA, Edwards BA, Wellman A, et al. The effect of body position on physiological factors that contribute to obstructive sleep apnea. Sleep 2015;38:1469–78.
43. Ravesloot MJ, van Maanen JP, Dun L, de Vries N. The undervalued potential of positional therapy in position-dependent snoring and obstructive sleep apnea-a review of the literature. Sleep Breath 2013;17:39–49.
44. Eijsvogel MM, Ubbink R, Dekker J, et al. Sleep position trainer versus tennis ball technique in positional obstructive sleep apnea syndrome. J Clin Sleep Med 2015;11:139–47.
45. Jackson M, Collins A, Berlowitz D, et al. Efficacy of sleep position modification to treat positional obstructive sleep apnea. Sleep Med 2015;16:545–52.
46. van Maanen JP, Meester KA, Dun LN, et al. The sleep position trainer: a new treatment for positional obstructive sleep apnoea. Sleep Breath 2013;17:771–9.
47. Morrell MJ, Arabi Y, Zahn B, Badr MS. Progressive retropalatal narrowing preceding obstructive apnea. Am J Respir Crit Care Med 1998;158:1974–81.
48. Riaz M, Certal V, Nigam G, et al. Nasal expiratory positive airway pressure devices (Provent) for OSA: a systematic review and meta-analysis. Sleep Disorders 2015;2015:15.
49. Nigam G, Pathak C, Riaz M. Effectiveness of oral pressure therapy in obstructive sleep apnea: a systematic analysis. Sleep Breath 2015 Oct 19.
50. Colrain IM, Black J, Siegel LC, et al. A multicenter evaluation of oral pressure therapy for the treatment of obstructive sleep apnea. Sleep Med 2013;14:830–7.
51. Zhu Y, Long H, Jian F, et al. The effectiveness of oral appliances for obstructive sleep apnea syndrome: A meta-analysis. J Dent 2015;43:1394–402.
52. Dieltjens M, Vanderveken OM, Heyning PH, Braem MJ. Current opinions and clinical practice in the titration of oral appliances in the treatment of sleep-disordered breathing. Sleep Med Rev 2012;16:177–85.
53. Cantore S, Ballini A, Farronato D, et al. Evaluation of an oral appliance in patients with mild to moderate obstructive sleep apnea syndrome intolerant to continuous positive airway pressure use: Preliminary results. Int J Immunopathol Pharmacol 2015 Dec 18.
54. Gjerde K, Lehmann S, Berge ME, et al. Oral appliance treatment in moderate and severe obstructive sleep apnoea patients non-adherent to CPAP. J Oral Rehabil 2015 Dec 27.
55. Jaiswal M, Srivastava GN, Pratap CB, et al. Effect of oral appliance for snoring and obstructive sleep apnea. Int J Orthod Milwaukee 2015;26:67–71.
56. Vecchierini MF, Attali V, Collet JM, et al. A custom-made mandibular repositioning device for obstructive sleep apnoea-hypopnoea syndrome: the ORCADES study. Sleep Med 2015 Jun 29.
57. Haviv Y, Bachar G, Aframian DJ, et al. A 2-year mean follow-up of oral appliance therapy for severe obstructive sleep apnea: a cohort study. Oral Dis 2015;21:386–92.
58. Marklund M. Long-term efficacy of an oral appliance in early treated patients with obstructive sleep apnea. Sleep Breath 2015 Nov 2.
59. Dieltjens M, Braem MJ, Vroegop AV, et al. Objectively measured vs self-reported compliance during oral appliance therapy for sleep-disordered breathing. Chest 2013;144:1495–502.
60. Smith YK, Verrett RG. Evaluation of a novel device for measuring patient compliance with oral appliances in the treatment of obstructive sleep apnea. J Prosthodont 2014;23:31–8.
61. Vanderveken OM, Dieltjens M, Wouters K, et al. Objective measurement of compliance during oral appliance therapy for sleep-disordered breathing. Thorax 2013;68:91–6.
62. Sutherland K, Phillips CL, Davies A, et al. CPAP pressure for prediction of oral appliance treatment response in obstructive sleep apnea. J Clin Sleep Med 2014;10:943–9.
63. Dieltjens M, Verbruggen AE, Braem MJ, et al. Determinants of objective compliance during oral appliance therapy in patients with sleep-related disordered breathing: a prospective clinical trial. JAMA Otolaryngol Head Neck Surg 2015:894–900.
64. Suzuki K, Nakata S, Tagaya M, et al. Prediction of oral appliance treatment outcome in obstructive sleep apnoea syndrome: a preliminary study. B-ENT 2014;10:185–91.
65. Tsuiki S, Ito E, Isono S, et al. Oropharyngeal crowding and obesity as predictors of oral appliance treatment response to moderate obstructive sleep apnea. Chest 2013;144:558–63.
66. Sutherland K, Takaya H, Qian J, et al. Oral appliance treatment response and polysomnographic phenotypes of obstructive sleep apnea. J Clin Sleep Med 2015;11:861–8.
67. Phillips CL, Grunstein RR, Darendeliler MA, et al. Health outcomes of continuous positive airway pressure versus oral appliance treatment for obstructive sleep apnea: a randomized controlled trial. Am J Respir Crit Care Med 2013;187:879–87.
68. Doff MH, Hoekema A, Wijkstra PJ, et al. Oral appliance versus continuous positive airway pressure in obstructive sleep apnea syndrome: a 2-year follow-up. Sleep 2013;36:1289–96.
69. Bratton DJ, Gaisl T, Wons AM, Kohler M. CPAP vs mandibular advancement devices and blood pressure in patients with obstructive sleep apnea: a systematic review and meta-analysis. JAMA 2015;314:2280–93.
70. Bostanci A, Turhan M. A systematic review of tongue base suspension techniques as an isolated procedure or combined with uvulopalatopharyngoplasty in obstructive sleep apnea. Eur Arch Otorhinolaryngol 2015 Oct 27.
71. Camacho M, Certal V, Brietzke SE, et al. Tracheostomy as treatment for adult obstructive sleep apnea: a systematic review and meta-analysis. Laryngoscope 2014;124:803–11.
72. Camacho M, Teixeira J, Abdullatif J, et al. Maxillomandibular advancement and tracheostomy for morbidly obese obstructive sleep apnea: a systematic review and meta-analysis. Otolaryngol Head Neck Surg 2015;152:619–30.
73. Caples SM, Rowley JA, Prinsell JR, et al. Surgical modifications of the upper airway for obstructive sleep apnea in adults: a systematic review and meta-analysis. Sleep 2010;33:1396–407.
74. Handler E, Hamans E, Goldberg AN, Mickelson S. Tongue suspension: an evidence-based review and comparison to hypopharyngeal surgery for OSA. Laryngoscope 2014;124:329–36.
75. Ishii L, Roxbury C, Godoy A, et al. Does nasal surgery improve osa in patients with nasal obstruction and OSA? a meta-analysis. Otolaryngol Head Neck Surg 2015;153:326–33.
76. Lin HC, Friedman M, Chang HW, Gurpinar B. The efficacy of multilevel surgery of the upper airway in adults with obstructive sleep apnea/hypopnea syndrome. Laryngoscope 2008;118:902–8.
77. Murphey AW, Kandl JA, Nguyen SA, et al. The effect of glossectomy for obstructive sleep apnea: a systematic review and meta-analysis. Otolaryngol Head Neck Surg 2015;153:334–42.
78. Zaghi S, Holty JC, Certal V, et al. Maxillomandibular advancement for treatment of obstructive sleep apnea: a meta-analysis. JAMA Otolaryngol Head Neck Surg 2015 Nov 25:1–9.
79. Thaler ER, Rassekh CH, Lee JM, et al. Outcomes for multilevel surgery for sleep apnea: Obstructive sleep apnea, transoral robotic surgery, and uvulopalatopharyngoplasty. Laryngoscope 2015 Jul 7.
80. Arora A, Chaidas K, Garas G, et al. Outcome of TORS to tongue base and epiglottis in patients with OSA intolerant of conventional treatment. Sleep Breath 2015 Dec 15.
81. Remmers JE, deGroot WJ, Sauerland EK, Anch AM. Pathogenesis of upper airway occlusion during sleep. J Appl Physiol Respir Environ Exercise Physiol 1978;44:931–8.
82. Decker MJ, Haaga J, Arnold JL, et al. Functional electrical stimulation and respiration during sleep. J Appl Physiol (1985) 1993;75:1053–61.
83. Edmonds LC, Daniels BK, Stanson AW, et al. The effects of transcutaneous electrical stimulation during wakefulness and sleep in patients with obstructive sleep apnea. Am Rev Respir Dis 1992;146:1030–6.
84. Guilleminault C, Powell N, Bowman B, Stoohs R. The effect of electrical stimulation on obstructive sleep apnea syndrome. Chest 1995;107:67–73.
85. Miki H, Hida W, Chonan T, et al. Effects of submental electrical stimulation during sleep on upper airway patency in patients with obstructive sleep apnea. Am Rev Respir Dis 1989;140:1285–9.
86. Steier J, Seymour J, Rafferty GF, et al. Continuous transcutaneous submental electrical stimulation in obstructive sleep apnea: a feasibility study. Chest 2011;140:998–1007.
87. Eastwood PR, Barnes M, Walsh JH, et al. Treating obstructive sleep apnea with hypoglossal nerve stimulation. Sleep 2011;34:1479–86.
88. Kezirian EJ, Goding GS Jr, Malhotra A, et al. Hypoglossal nerve stimulation improves obstructive sleep apnea: 12-month outcomes. J Sleep Res 2014;23:77–83.
89. Strollo PJ, Jr., Soose RJ, Maurer JT, et al. Upper-airway stimulation for obstructive sleep apnea. N Engl J Med 2014;370:139–49.
90. Van de Heyning PH, Badr MS, Baskin JZ, et al. Implanted upper airway stimulation device for obstructive sleep apnea. Laryngoscope 2012;122:1626–33.
91. Strollo PJ, Gillespie MB, Soose RJ, et al. Upper airway stimulation for obstructive sleep apnea: durability of the treatment effect at 18 months. Sleep 2015;38:1593–8.
92. Woodson BT, Gillespie MB, Soose RJ, et al. Randomized controlled withdrawal study of upper airway stimulation on OSA: short- and long-term effect. Otolaryngol Head Neck Surg 2014;151:880–7.
93. Woodson BT, Soose RJ, Gillespie MB, et al. Three-year outcomes of cranial nerve stimulation for obstructive sleep apnea: the STAR trial. Otolaryngol Head Neck Surg 2015 Nov 17.
94. Soose RJ, Woodson BT, Gillespie MB, et al. Upper airway stimulation for obstructive sleep apnea: self-reported outcomes at 24 months. J Clin Sleep Med 2016;12:43-8.
95. Mason M, Welsh EJ, Smith I. Drug therapy for obstructive sleep apnoea in adults. Cochrane Database Syst Rev 2013;(5):CD003002.
96. Farabi SS, Prasad B, Quinn L, Carley DW. Impact of dronabinol on quantitative electroencephalogram (qEEG) measures of sleep in obstructive sleep apnea syndrome. J Clin Sleep Med 2014;10:49–56.
97. Prasad B, Radulovacki MG, Carley DW. Proof of concept trial of dronabinol in obstructive sleep apnea. Front Psychiatry 2013;4:1.
98. Calik MW, Carley DW. Cannabinoid type 1 and type 2 receptor antagonists prevent attenuation of serotonin-induced reflex apneas by dronabinol in Sprague-Dawley rats. PLoS One 2014;9:e111412.
99. Calik MW, Radulovacki M, Carley DW. Intranodose ganglion injections of dronabinol attenuate serotonin-induced apnea in Sprague-Dawley rat. Respir Physiol Neurobiol. 2014 Jan 1;190:20–4.
100. Carter SG, Berger MS, Carberry JC, et al. Zopiclone increases the arousal threshold without impairing genioglossus activity in obstructive sleep apnea. Sleep 2015 Dec 22.
101. Burgess KR. New insights from the measurement of loop gain in obstructive sleep apnoea. J Physiol 2012;590(Pt 8):1781–2.
102. Eckert DJ, White DP, Jordan AS, et al. Defining phenotypic causes of obstructive sleep apnea. Identification of novel therapeutic targets. Am J Respir Crit Care Med 2013;188:996–1004.
103. Salloum A, Rowley JA, Mateika JH, et al. Increased propensity for central apnea in patients with obstructive sleep apnea: effect of nasal continuous positive airway pressure. Am J Respir Crit Care Med 2010;181:189–93.
104. Edwards BA, Connolly JG, Campana LM, et al. Acetazolamide attenuates the ventilatory response to arousal in patients with obstructive sleep apnea. Sleep 2013;36:281–5.
105. Edwards BA, Sands SA, Eckert DJ, et al. Acetazolamide improves loop gain but not the other physiological traits causing obstructive sleep apnoea. J Physiol 2012;590(Pt 5):1199–211.
106. Eskandari D, Zou D, Karimi M, et al. Zonisamide reduces obstructive sleep apnoea: a randomised placebo-controlled study. Eur Resp J 2014;44:140–9.
107. Yang YX, Spencer G, Schutte-Rodin S, et al. Gastroesophageal reflux and sleep events in obstructive sleep apnea. Eur J Gastroenterol Hepatol 2013;25:1017–23.
108. Gilani S, Quan SF, Pynnonen MA, Shin JJ. Obstructive sleep apnea and gastroesophageal reflux: a multivariate population-level analysis. Otolaryngol Head Neck Surg 2015 Dec 8.
109. Rassameehiran S, Klomjit S, Hosiriluck N, Nugent K. Meta-analysis of the effect of proton pump inhibitors on obstructive sleep apnea symptoms and indices in patients with gastroesophageal reflux disease. Proc (Bayl Univ Med Cent) 2016;29:3–6.
110. Ermis F, Akyuz F, Arici S, et al. Effect of proton pump inhibitor (PPI) treatment in obstructive sleep apnea syndrome: an esophageal impedance-pHmetry study. Hepatogastroenterology 2011;58:1566–73.
111. Reimer C. Safety of long-term PPI therapy. Best Pract Res 2013;27:443–54.
112. Deacon NL, Jen R, Li Y, Malhotra A. Treatment of obstructive sleep apnea. prospects for personalized combined modality therapy. Ann Am Thorac Soc 2016;13:101–8.
113. Shin W, Jen R, Li Y, Malhotra A. Tailored treatment strategies for obstructive sleep apnea. Respir Investig 2016;54:2–7.
114. Dieltjens M, Vroegop AV, Verbruggen AE, et al. A promising concept of combination therapy for positional obstructive sleep apnea. Sleep Breath 2015;19:637–44.
115. Wellman A, Edwards BA, Sands SA, et al. A simplified method for determining phenotypic traits in patients with obstructive sleep apnea. J Appl Physiol (1985) 2013;114:911–22.
From the Center for Narcolepsy, Sleep and Health Research, Department of Biobehavioral Health Science, University of Illinois at Chicago, Chicago, IL.
Abstract
- Objective: To review the efficacy of current treatment options for adults with obstructive sleep apnea (OSA).
- Methods: Review of the literature.
- Results: OSA, characterized by repetitive ≥ 10-second interruptions (apnea) or reductions (hypopnea) in airflow, is initiated by partial or complete collapse in the upper airway despite respiratory effort. When left untreated, OSA is associated with comorbid conditions, such as cardiovascular and metabolic diseases. The current “gold standard” treatment for OSA is continuous positive air pressure (CPAP), which pneumatically stabilizes the upper airways. CPAP has proven efficacy and potential cost savings via decreases in health comorbidities and/or motor-vehicle crashes. However, CPAP treatment is not well-tolerated due to various side effects, and adherence among OSA subjects can be as low as 50% in certain populations. Other treatment options for OSA include improving CPAP tolerability, increasing CPAP adherence through patient interventions, weight loss/exercise, positional therapy, nasal expiratory positive airway pressure, oral pressure therapy, oral appliances, surgery, hypoglossal nerve stimulation, drug treatment, and combining 2 or more of the aforementioned treatments. Despite the many options available to treat OSA, none of them are as efficacious as CPAP. However, many of these treatments are tolerable, and adherence rates are higher than those of the CPAP, making them a more viable treatment option for long-term use.
- Conclusion: Patients need to weigh the benefits and risks of available treatments for OSA. More large randomized controlled studies on treatments or combination of treatments for OSA are needed that measure parameters such as treatment adherence, apnea-hypopnea index, oxygen desaturation, subjective sleepiness, quality of life, and adverse events.
Obstructive sleep apnea (OSA), characterized by repetitive ≥ 10-second interruptions (apnea) or reductions (hypopnea) in airflow (measured as events/hour, called the apnea-hypopnea index [AHI]), is initiated by partial or complete collapse in the upper airway despite respiratory effort [1]. Current estimates of the prevalence of OSA (AHI ≥ 5 and Epworth Sleepiness Scale > 10) in American men and women (aged 30–70 years) are 14% and 5%, respectively, with prevalence rates increasing due to increasing rates of obesity, a risk factor for developing OSA [2]. Hypoxemia/hypercapnia, fragmented sleep, as well as exaggerated fluctuations in heart rhythm, blood pressure, and intrathoracic pressure are some of the acute physiological effects of untreated OSA [1]. These acute effects can develop into long-term sequelae, such as hypertension and other cardiovascular comorbidities [2,3], decrements in cognitive function [4,5], poor mood, reduced quality of life [6,7], and premature death [8,9]. In economic terms, health care cost estimates of OSA and its associated comorbidities rival that of diabetes [10]. Additionally, in the year 2000, more than 800,000 drivers were involved OSA-related motor-vehicle collisions, of which more than 1400 fatalities occurred [11].
Front-line treatment of OSA relies on mechanically stabilizing the upper airway with a column of air via continuous positive airway pressure (CPAP) treatment. Though CPAP is the “gold standard” treatment for OSA with proven efficacy and potential cost savings via decreases in health comorbidities and/or motor-vehicle crashes [10–12], CPAP treatment is not well-tolerated due to various side effects [13–15]. Adherence among OSA subjects can be as low as 50% in certain populations [16–18]. Improved strategies for current and innovative treatments have emerged in the last few years and are the subject of this review.
Improved CPAP Treatment
As stated previously, CPAP pneumatically splints the upper airway, thus preventing it from collapsing during sleep. However, CPAP is not well-tolerated. Modifications to standard CPAP to increase adherence have been met with disappointing results. Humidification with heated tubing delivering heated moistened air did not increase compliance compared to standard CPAP [19]. CPAP was also compared with auto-adjusting CPAP (APAP), where respiration is monitored and the minimum pressure of air is applied to splint the upper airway open. In a meta-analysis, APAP only had very small effect on compliance [20]. Lastly, reduction in pressure during expiration was investigated, and a meta-analysis showed no effect [21,22]. However, recent advances in CPAP delivery give hope to increasing compliance. The S9CPAP machine (Resmed, San Diego, CA), which combines a humidification system and an APAP, showed increased compliance compared to standard CPAP. Compliance increased by an average of 30 minutes per night, and variance of daily usage decreased (eg, patients used it more day-to-day) [23]. However, a randomized blinded study needs to be conducted to corroborate these results.
Promoting CPAP Adherence Through Patient Interventions
Educational, supportive, and behavioral interventions have been used to increase CPAP adherence and have been thoroughly reviewed via meta-analysis [24]. Briefly, 30 studies of various interventions were included and demonstrated that educational, supportive, or behavioral interventions increased CPAP usage in OSA-naive patients. Behavioral interventions increased CPAP usage by over an hour, but the evidence was of “low-quality.” Educational and supportive interventions also increased CPAP usage, with the former having “moderate-quality” evidence [24]. However, whether increased CPAP usage had an effect on symptoms and quality of life was statistically unclear, and the authors recommended further assessment [24]. Three more studies on interventions to increase CPAP usage have been conducted since the aforementioned review. In a randomized controlled study, investigators had OSA patients participate in a 30-minute group social cognitive therapy session (eg, increasing perceived self-efficacy, outcome expectations, and social support) to increase CPAP adherence. Compared to a social interaction control group, there was no increase in adherence rates [25]. In another smaller randomized controlled study that used a social cognition model of behavioral therapy, there were small increases of CPAP usage. At 3 months, the social cognitive intervention increased CPAP usage by an average of 23 minutes per night, increased the number of individuals using their CPAP machine for more than 4 hours compared to standard care group, and decreased symptom of sleepiness [26]. And lastly, a preliminary study looked at increasing adherence rates by utilizing easily accessible alternative care providers, such as nurses and respiratory therapists, for the management of OSA [27]. Though this study had no control group, it did show that good adherence and a decrease in symptoms of sleepiness could be achieved with non-physician management of OSA [27]. A randomized controlled study will be needed to validate the use of alternative care providers.
Interventions have shown some success in increasing adherence rates, but the question remains on who should receive those interventions. Predicting which OSA patients are in most need of an intervention has been studied. A recent study used a 19-question assessment tool called the Index of Nonadherence to PAP to screen for nonadherers (OSA patients who used CPAP for less than 4 hours a night, after 1 month of OSA diagnosis). The assessment tool was 87% sensitive and 63% specific at determining those OSA patients who would not adhere to CPAP treatment [28]. Another study investigated the reliability and validity of a self-rating scale measuring the side effects of CPAP and their consequences on adherence [15]. The investigators showed that the scale was able to reliably discriminate between those who adhered to CPAP treatment and those that did not [15]. Both of these scales can be used to screen OSA patients that need interventions to increase CPAP adherence. Lastly, a recent systematic review showed that a user’s CPAP experience was not defined by the user but by the user’s health care provider, who framed CPAP as “problematic” [29]. The authors argue that users of CPAP are “primed” to reflect negatively on their CPAP experience [29]. Interventions can be used to change the way OSA patients think or feel about their CPAP machines.
When OSA Patients Do Not Adhere to CPAP Treatment
With adherence rates as low as 50% [16–18], those who fail to tolerate CPAP are unlikely to be referred for additional treatment [30]. Those who do tolerate treatment dislike the side effects of CPAP and show an interest in other treatment options [14]. Other treatment options have been shown to decrease the severity of OSA.
Weight Loss and Exercise
OSA prevalence is correlated with body mass index (BMI), and the increasing rates of OSA has been attributed to the increasing rates of obesity in the United States [2]. A meta-analysis of 3 randomized controlled studies of weight loss induced by dieting or lifestyle change showed that weight loss decreased OSA severity. The effect was the greatest for OSA patients who lost more than 10 kg or had severe OSA at baseline [31]. A recent randomized controlled study involving OSA patients with type 2 diabetes investigated if either a weight loss intervention or a diabetes support and education intervention would be able to decrease OSA severity [32]. The weight loss intervention significantly decreased OSA severity, which was largely but not entirely attributed to weight loss. The participants regained 50% of their weight 4 years after the intervention and still had significantly less severe OSA compared to control intervention group. The downside to this intervention is the intensity of the regimen to which the subjects had to adapt: portion-controlled diets with liquid meals and snack bars for the first 4 months and moderate-intensity physical activity for a minimum of 3 hours a week for the first year. After that, patients were still required to follow through with the intervention for 3 years, which included one on-site visit per month and a second contact by phone, mail, or email [32]. One study looked at weight loss and sleep position (supine vs. lateral). The study showed a decrease in AHI in OSA patients that lost weight, and the biggest decrease was in AHI in the lateral sleeping position [33]. Another study looked at the more invasive procedure of bariatric surgery to decrease weight and OSA. At the 1-year follow-up, patients had significantly decreased their BMI and AHI [34]. Two more randomized controlled studies investigated if exercise or fitness level might be beneficial to OSA patients independent of weight loss. Exercise improved AHI even though there was not a significant decrease in weight between the exercise and stretching control group [35]. However, an increase in fitness level did not have any additive effect on the decrease of AHI when weight change was taken into account [36]. The difference in results might be attributed to the latter study using older type 2 diabetic patients and moderate physical activity, while the former studied incorporated moderate-intensity aerobic activity and resistance training for younger patients [35,36]. There is evidence that a sedentary lifestyle increases diurnal leg fluid volume that can shift to the neck during sleep and might play a role in pathogenesis of OSA [37]. Decreasing a sedentary lifestyle by exercising might therefore be beneficial to OSA patients. Given the increasing rates of obesity [2], implementing weight loss as a solution to OSA is viable, especially considering that OSA is not the only comorbid disease of obesity [38].
Positional Therapy
It has been known for some time that sleeping in a supine position doubles a patient’s AHI compared to sleeping in the lateral position [39]. A more recent analysis showed that 60% of patients were “supine predominant OSA;” these patients had supine AHI that was twice that of non-supine AHI [40]. Moreover, a drug-induced sleep endoscopy study showed that the upper airway collapses at multiple levels sleeping in the supine position as opposed to at a single level sleeping in the lateral position [41]. Another study showed that lateral sleeping position improved passive airway anatomy and decreased collapsibility [42]. Many studies have shown that patients who wear a device that alerts the sleeper that he or she is in a supine position (referred to as positional therapy) significantly decreases AHI, but long-term compliance is still an issue, and new and improved devices are needed [43]. Three new studies bolster the effectiveness of positional therapy [44–46]. In all 3 studies, sleeping in the supine position went down to 0% (no change in sleep efficiency [the ratio of total time spent sleeping to the total time spent in bed]), AHI decreased to less than 6, and sleep quality and daytime sleepiness increased and decreased, respectively [44–46]. Compliance was as low as 76% [44] and as high as 93% [46]. For those who cannot tolerate CPAP, positional therapy could be a substitute for decreasing severity of OSA. However, “phenotyping” OSA patients as “supine predominant OSA” would need to be implemented to guarantee efficacy of positional therapy.
Nasal Expiratory Positive Airway Pressure
Oral Pressure Therapy
Retro-palatal collapse occurs in OSA and can be prevented by applying negative pressure to the upper airway [49]. The oral pressure therapy (OPT) device applies gentle suction anteriorly and superiorly to displace the tongue and soft palate and breathing occurs via nasopharyngeal airway [12]. A recent systematic review [49] of OPT revealed that successful OPT treatment rate was 25% to 37% if using standard and stringent definitions of treatment success. Although OPT decreased AHI, residual AHI still remained high due to positional apneas and collapse of upper airway at other levels besides retro-palatal. The authors of this systematic review recommend more rigorous and controlled studies with defined “treatment success” [49]. The advantage of OPT is that adherence was good; patients used the device on average 6 hours a night. There were no severe or serious adverse events with OPT, however oral tissue discomfort or irritation, dental discomfort, and dry mouth were reported [50].
Oral Appliances
Similar to OPT, oral appliances (OAs) attempt to prevent upper airway collapse. OAs either stabilize the tongue, advance the mandible, or lift the soft palate to increase the volumes of the upper airways to avert OSA [16, 51]. The OAs, like the mandibular advancement device, for example, have the added benefit of being fitted specifically for the OSA patient. The mandible for a patient can be advanced to alleviate obstructive apneas, but can also be pulled back if the OA is too uncomfortable or painful. However, there is still dispute on how exactly to titrate these OAs [52]. A meta-analysis recently published looked at all clinical trials of OAs through September 2015. After meeting strict exclusion/inclusion criteria, 17 studies looking at OAs were included in the meta-analysis. There were robust decreases in AHI and in symptoms of sleepiness in OSA patients that used OAs compared to control groups. However, due to the strict inclusion/exclusion criteria of the meta-analysis, all the studies except one used mandibular advancement appliances; one study used a tongue-retaining appliance. The authors concluded that there is sufficient evidence for OAs to be effective in patients with mild-to-moderate OSA [51]. Since the meta-analysis, 6 new studies have been published about OAs. In 4 of the studies (all using mandibular advancement), OAs significantly decreased AHI by 50% or more in the majority of OSA patients [53–56]. The other 2 studies looked at long-term efficacy and compliance. In both studies, there were drastic decreases in AHI when OAs were applied [57, 58]. In one study, about 40% of OSA patients stopped using the OAs. When the change in AHI was stratified between users and non-users, the users group was significantly higher that the non-user group, suggesting that the non-user group were not compliant due to less of an effect of the OA on AHI [57]. In the second study, OSA patients using OAs for a median of 16.5 years were evaluated for long-term efficacy of the OAs. At the short-term follow-up, AHI decreased by more than 50% with use of an OA. However, at the long-term follow-up, the OA lost any effect on AHI. One reason for this is that the OSA patients’ AHI without the OA at the long-term follow-up nearly doubled compared to AHI without OA at the short-term follow-up. The authors conclude that OSA patients using OAs for the long-term might undergo deteriorations in treatment efficacy of OAs, and that regular follow-up appointments with sleep apnea recordings should be implemented [58].
A similarity in all these studies is that adherence was higher for OAs compared to CPAP [51]. The caveat is that most studies have relied on self-reports for adherence rates [12]. However, there were 3 studies that implemented a sensor that measured adherence and compared those results to self-reported OA adherence. All 3 studies showed a strong relationship between self-reports and sensor adherence; patients were honest about adherence to OAs [59–61]. Studies have also been conducted to predict compliance with OAs: higher therapeutic CPAP pressure, age, OSA severity [62], decreased snoring [63], and lower BMI [64, 65] predicted compliance, while dry mouth [63], oropharyngeal crowding [65], and sleeping in a supine position [66] predicted noncompliance. Though adherence rates are high, OAs do not decrease AHI as much as CPAP [67], and a recent study showed that long-term adherence rates might not be different to CPAP adherence rates [68]. OAs, due to their higher adherence rates, are a potential second choice over CPAP. However, they are less efficacious than CPAP at decreasing AHI. That may not be as important since a recent meta-analysis comparing the effects of CPAP or OAs on blood pressure showed that both treatments significantly decreased blood pressure [69]. More studies need to be conducted over long-term efficacy of OAs compared with CPAP.
Surgeries to Treat OSA
Surgery as a treatment option has been extensively reviewed and meta-analyzed [70–78]. Surgery for the treatment of OSA includes tongue suspension [70,74], maxillomandibular advancement (MMA) [72,73,78], pharyngeal surgeries (eg, uvulopharyngopalatoplasty [UPPP]) [73], laser-assisted uvulopalatoplasty (LAUP) [73], radiofrequency ablation (RFA) [73], tracheostomy [71], nasal surgery [75], and glossectomy [77], as well as multi-level and multi-phased procedures [70,74,76,77]. Most studies done on surgeries were case studies, with a minority of investigations that were randomized and controlled. Glossectomy, as part of a multi-level surgical approach, decreased AHI and symptoms of sleepiness, but glossectomy as a stand-alone surgical procedure did not improve AHI [77]. Significant improvements in AHI and sleepiness symptoms were seen in a majority of OSA patients who underwent MMA [72,73,78] and tracheostomy, although tracheostomy was performed for the morbidly obese or those who have failed other traditional surgical treatments [71]. Stand-alone tongue suspension and nasal surgery did not decrease AHI in the majority of patients, though nasal surgery did decrease subjective sleepiness [70,72,74,75]. However, tongue suspension combined with UPPP had better outcomes [70]. LAUP showed inconsistent results with the majority of studies showing no change in AHI, while UPPP and RFA seemed to improved AHI, although some studies showed no change [73]. Multi-level or multi-phase surgeries also showed improvements on OSA severity, but whether these surgeries are better than stand-alone remains to be investigated [73,76]. Morbidity and adverse events, like infection or pain, are common in all of these surgical events [70–78], but there are significant differences between the procedures. For example, MMA had fewer adverse events reported compared to UPPP [73]. More recently, glossectomy via transoral robotic surgery with UPPP [79] or epiglottoplasty [80] has been investigated; there were decreases in AHI, but response rates were between 64% to 73%. Although it seems surgical procedures to treat OSA are plausible, most studies were not rigorous enough to say this with any certainty.
Hypoglossal Nerve Stimulation
OSA subjects experience upper airway obstruction due to loss of genioglossus muscle activity during sleep. Without tongue activation, the negative pressure of breathing causes the upper airways to collapse [81]. Transcutaneous, intraoral, and intramuscular devices used to electrically activate the tongue have been developed and tested; however, although these devices decreased AHI they also induced arousals and sleep fragmentation caused by the electrical stimulus [82–86]. A new method had to be developed that would not be felt by the OSA patient.
In all trials to date, there were significant decreases in AHI as long as 3 years post implantation [87–93]. There were significant improvements in symptoms of sleepiness, mood, quality of life, and sleep quality [87,88,90–94]. When OSA patients had their neurostimulators turned off for 5 days to a week, AHI returned back to baseline levels [89,92]. However, all the trials excluded morbidly obese individuals [87–93] because investigations showed that HNS had no therapeutic effect with elevated BMI [88,90]. The drawbacks of HNS are that it is surgically invasive and minor adverse events have been reported: procedural-related events (eg, numbness/pain/swelling/infection at incision site, temporary tongue weakness) that resolved with time, pain medication, and/or antibiotic treatment, or therapy-related events (eg, tongue abrasions cause by tongue movement over teeth, discomfort associated with stimulation) that resolved after acclimation. Serious adverse events occurred infrequently, such as infection at incision site requiring device removal or subsequent surgery to reposition or replace electrode cuff or malfunctioning neurostimulator [87,88,90]. HNS durability at 18 and 36 months was still very effective, with decreased AHI and increase quality of life and sleep being sustained; adverse events were uncommon this long after implantation [91,93]. Although surgery is required and adverse events are reported, the long-term significant improvement of OSA makes this a very viable treatment option over CPAP. However, increasing prevalence rates of OSA are correlated to increasing obesity rates [2], which may limit the usefulness of HNS since a BMI of more than 40 might preclude individuals to this treatment.
Pharmacologic Treatment
There are no approved pharmacologic treatments for OSA. A recent Cochrane review and meta-analysis assessed clinical trials of various drugs treating OSA. These drugs targeted 5 strategies at alleviating OSA: increasing ventilatory drive (progestogens, theophylline, and acetazolamide), increasing upper airway tone (serotonergics and cholinergics), decreasing rapid eye movement sleep (antidepressants and clonidine), increasing arousal threshold (eszopiclone), and/or increasing the cross-sectional area or reducing the surface tension of the upper airway through topical therapy (fluticasone and lubricant). The review concluded that “some of the drugs may be helpful; however, their tolerability needs to be considered in long-term trials.” Some of these drugs had little or no effect on AHI, and if they did have an effect on AHI, side effects outweighed the benefit [95]. Since then, more investigations of other drugs targeted at the previously aforementioned strategies or via new strategies have been published.
Dronabinol (synthetic Δ9-THC), a nonselective cannabinoid type 1 and type 2 receptor agonist, significantly reduced AHI and improved subjective sleepiness and alertness in a single-blind dose-escalation (2.5, 5, or 10 mg) proof-of-concept study [96,97]. Dronabinol most likely increases upper airway tone though inhibition of vagal afferents [98,99]. There were no serious adverse events associated with dronabinol. Minor adverse events included somnolence and increased appetite. Increased appetite might lead to increased weight and contradict any beneficial effects of dronabinol; however, in the 3-week treatment period no weight gain was observed [97]. This might have been due to drug administration occurring before going to sleep with no opportunity to eat. A larger randomized controlled study will be needed to establish the safety and efficacy of dronabinol.
The sedative zopiclone was used to increase arousal threshold without effecting genioglossus activity [100]. Eszopiclone, a drug in the same class, has been used in the past with unfavorable results [95]. Zopiclone was used in a small double-blind randomized controlled cross-over study. Zopiclone significantly increased respiratory arousal threshold without effecting genioglossus activity or the upper airway’s response to negative pressure. Thus, there was a trend in the zopiclone treatment to increase sleep efficiency. However, zopiclone had no effect on AHI, and increased oxygen desaturation [100]. Similar to eszopiclone, the results for zopiclone are not promising.
A new strategy to treat OSA is to modify pharmacologically “loop gain,” a dimensionless value quantifying the stability of the ventilatory control system. A high loop gain signifies instability in the ventilatory control system and predisposes an OSA person to recurrent apneas [101–103]. Three studies used drugs that inhibit carbonic anhydrase to stabilize the ventilatory control system [104–106]. Two studies used acetazolamide, which decreased loop gain in OSA patients [104,105]. Acetazolamide only decreased AHI in non–rapid eye movement (NREM) sleep, and there was a slight correlation between decrease in loop gain and total AHI [105]. Acetazolamide also decreased ventilatory response to spontaneous arousal, thus promoting ventilatory stability [104]. In the last study, zonisamide, a carbonic anhydrase inhibitor that also causes weight loss, was investigated in OSA patients. Sleep apnea alleviation, measured in terms of absolute elimination of sleep apnea by mechanical or pharmacologic treatment, was 61% and 13% for CPAP and zonisamide, respectively, compared with placebo. In other words, zonisamide decreased AHI but not to the extent of CPAP [106]. Zonisamide also decreased arousals and marginally, but significantly, decreased weight compared to the CPAP group. Although carbonic anhydrase inhibitors have promise as an alternative treatment, long-term use is poorly tolerated [101] and further studies need to be completed.
OSA has been linked with gastroesophageal reflux disease (GERD), with studies suggesting OSA precipitates GERD [107] or GERD precipitates OSA [108]. A meta-analysis was recently published looking at studies that used proton pump inhibitors (PPI) to treat GERD and the effects it would have on OSA [109]. The meta-analysis only included 2 randomized trials and 4 prospective cohort studies. Two of the cohort studies showed a significant decrease, and one cohort showed no difference in apnea indices; and all 4 of the cohort studies showed no difference in AHI. In one trial, the frequency of apnea attacks as recorded by diaries significantly decreased. In 3 cohort studies and one trial, symptoms of sleepiness significantly decreased [109]. A study that was not included in the meta-analysis showed that 3 months of PPI treatment decreased AHI but did not alter sleep efficiency [110]. Larger randomized controlled studies need to be conducted on the effects of PPIs on OSA, especially since PPIs are well tolerated with only weak observational associations between PPI therapy and fractures, pneumonia, mortality, and nutritional deficiencies [111].
The drugs mentioned above have potential for treating OSA in patients intolerant to CPAP. The efficacy and side effects of the drugs will need to be studied for long-term use. However, development of pharmacologic treatments has been hampered by incomplete knowledge of the relevant sleep-dependent peripheral and central neural mechanisms controlling ventilatory drive and upper airway muscles. More importantly, additional basic science research needs to focus on the neurobiological and neurophysiological mechanisms underlying OSA to develop new pharmacotherapies or treatment strategies, or to modify previous treatment strategies.
Treatment Combinations and Phenotyping
It has been recently suggested that combining 2 or more of the above treatments might lead to greater decreases in AHI and greater improvements in subjective sleepiness [112,113]. In fact, one such treatment combination has occurred [114]. Both OA or positional therapy decrease AHI. However, the combination of an OA and positional therapy led to further significant decreases in AHI compared to when those treatments were used alone [114]. To correctly combine treatments, the patient will have to be “phenotyped” via polysomnography to discern the specific pathophysiology of the patient’s OSA. There are published reports of methods to phenotype patients according to their sleep positon, ventilation parameters, loop gain, arousal threshold, and upper airway gain, and if apneic events occur in REM or NREM sleep [40,115]. Defining these traits for individual OSA patients can lead to better efficacy and compliance of combination treatments for OSA. Combination treatment coupled with phenotyping are needed to try to reduce AHI to levels achieved with CPAP.
Conclusion
CPAP is the gold standard treatment because it substantially decreases the severity of OSA just by placing a mask over one’s face before going to sleep. However, it is not tolerable to continually have air forced into your upper airways, and new CPAP devices that heat and humidify the air, and auto titrate the pressure, have been developed to increase adherence rates, but with limited success. For all the treatments listed, a majority do not decrease the severity of OSA to levels achieved with CPAP. However, adherence rates are higher and therefore might, in the long-term, be a better option than CPAP. Some treatments involve invasive surgery to open or stabilize the upper airways, or to implant a stimulator, some treatments involve oral drugs with side effects, and some treatments involve placing appliances on your nose or in your mouth. And some treatments can be combined and individually tailored to the OSA patient via “phenotyping.” For all treatments, the benefits and risks need to be weighed by each patient. More importantly, more large randomized controlled studies on treatments or combination of treatments for OSA are needed using parameters such as treatment adherence, AHI, oxygen desaturation, subjective sleepiness, quality of life, and adverse events (both minor and major) to gauge treatment success in the short-term and long-term. Only then can OSA patients in partnership with their health care provider choose the best treatment option.
Corresponding author: Michael W. Calik, PhD, 845 S. Damen Ave (M/C 802), College of Nursing, Room 740, Chicago, IL 60612, [email protected].
Financial disclosures: None.
1. Somers VK, White DP, Amin R, et al. Sleep apnea and cardiovascular disease: an American Heart Association/American College of Cardiology Foundation Scientific Statement from the American Heart Association Council for High Blood Pressure Research Professional Education Committee, Council on Clinical Cardiology, Stroke Council, and Council on Cardiovascular Nursing. In collaboration with the National Heart, Lung, and Blood Institute National Center on Sleep Disorders Research (National Institutes of Health). Circulation 2008;118:1080–111.
2. Peppard PE, Young T, Barnet JH, et al. Increased prevalence of sleep-disordered breathing in adults. Am J Epidemiol 2013;177:1006–14.
3. Shamsuzzaman AS, Gersh BJ, Somers VK. Obstructive sleep apnea: implications for cardiac and vascular disease. JAMA 2003;290:1906–14.
4. Kim HC, Young T, Matthews CG, et al. Sleep-disordered breathing and neuropsychological deficits. A population-based study. Am J Respir Crit Care Med 1997;156:1813–9.
5. Yaffe K, Laffan AM, Harrison SL, et al. Sleep-disordered breathing, hypoxia, and risk of mild cognitive impairment and dementia in older women. JAMA 2011;306:613–9.
6. Baldwin CM, Griffith KA, Nieto FJ, et al. The association of sleep-disordered breathing and sleep symptoms with quality of life in the Sleep Heart Health Study. Sleep 2001;24:96–105.
7. Peppard PE, Szklo-Coxe M, Hla KM, Young T. Longitudinal association of sleep-related breathing disorder and depression. Arch Intern Med 2006;166:1709–15.
8. Marshall NS, Wong KK, Liu PY, et al. Sleep apnea as an independent risk factor for all-cause mortality: the Busselton Health Study. Sleep 2008;31:1079–85.
9. Young T, Finn L, Peppard PE, et al. Sleep disordered breathing and mortality: eighteen-year follow-up of the Wisconsin sleep cohort. Sleep 2008;31:1071–8.
10. AlGhanim N, Comondore VR, Fleetham J, et al. The economic impact of obstructive sleep apnea. Lung 2008;186:7–12.
11. Sassani A, Findley LJ, Kryger M, et al. Reducing motor-vehicle collisions, costs, and fatalities by treating obstructive sleep apnea syndrome. Sleep 2004;27:453–8.
12. Weaver TE, Calik MW, Farabi SS, et al. Innovative treatments for adults with obstructive sleep apnea. Nat Sci Sleep 2014;6:137–47.
13. Isetta V, Negrin MA, Monasterio C, et al. A Bayesian cost-effectiveness analysis of a telemedicine-based strategy for the management of sleep apnoea: a multicentre randomised controlled trial. Thorax 2015;70:1054–61.
14. Tsuda H, Moritsuchi Y, Higuchi Y, Tsuda T. Oral health under use of continuous positive airway pressure and interest in alternative therapy in patients with obstructive sleep apnoea: a questionnaire-based survey. Gerodontology 2015 Feb 10.
15. Brostrom A, Arestedt KF, Nilsen P, et al. The side-effects to CPAP treatment inventory: the development and initial validation of a new tool for the measurement of side-effects to CPAP treatment. J Sleep Res 2010;19:603–11.
16. Weaver TE, Grunstein RR. Adherence to continuous positive airway pressure therapy: the challenge to effective treatment. Proc Am Thorac Soc 2008 Feb 15;5:173–8.
17. Hedner J, Grote L, Zou D. Pharmacological treatment of sleep apnea: current situation and future strategies. Sleep Med Rev 2008;12:33–47.
18. Smith I, Lasserson TJ, Wright J. Drug therapy for obstructive sleep apnoea in adults. Cochrane Database Syst Rev 2006(2):CD003002.
19. Ruhle KH, Franke KJ, Domanski U, Nilius G. Quality of life, compliance, sleep and nasopharyngeal side effects during CPAP therapy with and without controlled heated humidification. Sleep Breath 2011;15:479–85.
20. Xu T, Li T, Wei D, et al. Effect of automatic versus fixed continuous positive airway pressure for the treatment of obstructive sleep apnea: an up-to-date meta-analysis. Sleep Breath 2012;16:1017–26.
21. Smith I, Lasserson TJ. Pressure modification for improving usage of continuous positive airway pressure machines in adults with obstructive sleep apnoea. Cochrane Database Syst Rev 2009 (4):CD003531.
22. Dungan GC, 2nd, Marshall NS, Hoyos CM, et al. A randomized crossover trial of the effect of a novel method of pressure control (SensAwake) in automatic continuous positive airway pressure therapy to treat sleep disordered breathing. J Clin Sleep Med 2011;7:261–7.
23. Wimms AJ, Richards GN, Benjafield AV. Assessment of the impact on compliance of a new CPAP system in obstructive sleep apnea. Sleep Breath 2013;17:69–76.
24. Wozniak DR, Lasserson TJ, Smith I. Educational, supportive and behavioural interventions to improve usage of continuous positive airway pressure machines in adults with obstructive sleep apnoea. Cochrane Database Syst Rev 2014;1:CD007736.
25. Bartlett D, Wong K, Richards D, et al. Increasing adherence to obstructive sleep apnea treatment with a group social cognitive therapy treatment intervention: a randomized trial. Sleep 2013;36:1647–54.
26. Deng T, Wang Y, Sun M, Chen B. Stage-matched intervention for adherence to CPAP in patients with obstructive sleep apnea: a randomized controlled trial. Sleep Breath 2013;17:791–801.
27. Pendharkar SR, Dechant A, Bischak DP, et al. An observational study of the effectiveness of alternative care providers in the management of obstructive sleep apnoea. J Sleep Res 2015 Oct 27.
28. Sawyer AM, King TS, Hanlon A, et al. Risk assessment for CPAP nonadherence in adults with newly diagnosed obstructive sleep apnea: preliminary testing of the Index for Nonadherence to PAP (I-NAP). Sleep Breath 2014;18:875–83.
29. Ward K, Hoare KJ, Gott M. What is known about the experiences of using CPAP for OSA from the users’ perspective? A systematic integrative literature review. Sleep Med Rev 2014;18:357–66.
30. Russell JO, Gales J, Bae C, Kominsky A. Referral patterns and positive airway pressure adherence upon diagnosis of obstructive sleep apnea. Otolaryngol Head Neck Surg 2015;153:881–7.
31. Hemmingsson E. Does medically induced weight loss improve obstructive sleep apnoea in the obese: review of randomized trials. Clin Obes 2011;1:26–30.
32. Kuna ST, Reboussin DM, Borradaile KE, et al. Long-term effect of weight loss on obstructive sleep apnea severity in obese patients with type 2 diabetes. Sleep 2013;36:641–9A.
33. Kulkas A, Leppanen T, Sahlman J, et al. Weight loss alters severity of individual nocturnal respiratory events depending on sleeping position. Physiol Meas 2014;35:2037–52.
34. Bae EK, Lee YJ, Yun CH, Heo Y. Effects of surgical weight loss for treating obstructive sleep apnea. Sleep Breath 2014;18:901–5.
35. Kline CE, Crowley EP, Ewing GB, et al. The effect of exercise training on obstructive sleep apnea and sleep quality: a randomized controlled trial. Sleep 2011;34:1631–40.
36. Kline CE, Reboussin DM, Foster GD, et al. The effect of changes in cardiorespiratory fitness and weight on obstructive sleep apnea severity in overweight adults with type 2 diabetes. Sleep 2016;39:317–25.
37. Vena D, Yadollahi A, Bradley TD. Modelling fluid accumulation in the neck using simple baseline fluid metrics: implications for sleep apnea. Conf Proc IEEE Eng Med Biol Soc 2014;2014:266–9.
38. Whitlock G, Lewington S, Sherliker P, et al. Body-mass index and cause-specific mortality in 900 000 adults: collaborative analyses of 57 prospective studies. Lancet 2009;373:1083–96.
39. Cartwright RD. Effect of sleep position on sleep apnea severity. Sleep 1984;7:110–4.
40. Joosten SA, Hamza K, Sands S, et al. Phenotypes of patients with mild to moderate obstructive sleep apnoea as confirmed by cluster analysis. Respirology 2012;17:99–107.
41. Lee CH, Kim DK, Kim SY, et al. Changes in site of obstruction in obstructive sleep apnea patients according to sleep position: a DISE study. Laryngoscope 2015;125:248–54.
42. Joosten SA, Edwards BA, Wellman A, et al. The effect of body position on physiological factors that contribute to obstructive sleep apnea. Sleep 2015;38:1469–78.
43. Ravesloot MJ, van Maanen JP, Dun L, de Vries N. The undervalued potential of positional therapy in position-dependent snoring and obstructive sleep apnea-a review of the literature. Sleep Breath 2013;17:39–49.
44. Eijsvogel MM, Ubbink R, Dekker J, et al. Sleep position trainer versus tennis ball technique in positional obstructive sleep apnea syndrome. J Clin Sleep Med 2015;11:139–47.
45. Jackson M, Collins A, Berlowitz D, et al. Efficacy of sleep position modification to treat positional obstructive sleep apnea. Sleep Med 2015;16:545–52.
46. van Maanen JP, Meester KA, Dun LN, et al. The sleep position trainer: a new treatment for positional obstructive sleep apnoea. Sleep Breath 2013;17:771–9.
47. Morrell MJ, Arabi Y, Zahn B, Badr MS. Progressive retropalatal narrowing preceding obstructive apnea. Am J Respir Crit Care Med 1998;158:1974–81.
48. Riaz M, Certal V, Nigam G, et al. Nasal expiratory positive airway pressure devices (Provent) for OSA: a systematic review and meta-analysis. Sleep Disorders 2015;2015:15.
49. Nigam G, Pathak C, Riaz M. Effectiveness of oral pressure therapy in obstructive sleep apnea: a systematic analysis. Sleep Breath 2015 Oct 19.
50. Colrain IM, Black J, Siegel LC, et al. A multicenter evaluation of oral pressure therapy for the treatment of obstructive sleep apnea. Sleep Med 2013;14:830–7.
51. Zhu Y, Long H, Jian F, et al. The effectiveness of oral appliances for obstructive sleep apnea syndrome: A meta-analysis. J Dent 2015;43:1394–402.
52. Dieltjens M, Vanderveken OM, Heyning PH, Braem MJ. Current opinions and clinical practice in the titration of oral appliances in the treatment of sleep-disordered breathing. Sleep Med Rev 2012;16:177–85.
53. Cantore S, Ballini A, Farronato D, et al. Evaluation of an oral appliance in patients with mild to moderate obstructive sleep apnea syndrome intolerant to continuous positive airway pressure use: Preliminary results. Int J Immunopathol Pharmacol 2015 Dec 18.
54. Gjerde K, Lehmann S, Berge ME, et al. Oral appliance treatment in moderate and severe obstructive sleep apnoea patients non-adherent to CPAP. J Oral Rehabil 2015 Dec 27.
55. Jaiswal M, Srivastava GN, Pratap CB, et al. Effect of oral appliance for snoring and obstructive sleep apnea. Int J Orthod Milwaukee 2015;26:67–71.
56. Vecchierini MF, Attali V, Collet JM, et al. A custom-made mandibular repositioning device for obstructive sleep apnoea-hypopnoea syndrome: the ORCADES study. Sleep Med 2015 Jun 29.
57. Haviv Y, Bachar G, Aframian DJ, et al. A 2-year mean follow-up of oral appliance therapy for severe obstructive sleep apnea: a cohort study. Oral Dis 2015;21:386–92.
58. Marklund M. Long-term efficacy of an oral appliance in early treated patients with obstructive sleep apnea. Sleep Breath 2015 Nov 2.
59. Dieltjens M, Braem MJ, Vroegop AV, et al. Objectively measured vs self-reported compliance during oral appliance therapy for sleep-disordered breathing. Chest 2013;144:1495–502.
60. Smith YK, Verrett RG. Evaluation of a novel device for measuring patient compliance with oral appliances in the treatment of obstructive sleep apnea. J Prosthodont 2014;23:31–8.
61. Vanderveken OM, Dieltjens M, Wouters K, et al. Objective measurement of compliance during oral appliance therapy for sleep-disordered breathing. Thorax 2013;68:91–6.
62. Sutherland K, Phillips CL, Davies A, et al. CPAP pressure for prediction of oral appliance treatment response in obstructive sleep apnea. J Clin Sleep Med 2014;10:943–9.
63. Dieltjens M, Verbruggen AE, Braem MJ, et al. Determinants of objective compliance during oral appliance therapy in patients with sleep-related disordered breathing: a prospective clinical trial. JAMA Otolaryngol Head Neck Surg 2015:894–900.
64. Suzuki K, Nakata S, Tagaya M, et al. Prediction of oral appliance treatment outcome in obstructive sleep apnoea syndrome: a preliminary study. B-ENT 2014;10:185–91.
65. Tsuiki S, Ito E, Isono S, et al. Oropharyngeal crowding and obesity as predictors of oral appliance treatment response to moderate obstructive sleep apnea. Chest 2013;144:558–63.
66. Sutherland K, Takaya H, Qian J, et al. Oral appliance treatment response and polysomnographic phenotypes of obstructive sleep apnea. J Clin Sleep Med 2015;11:861–8.
67. Phillips CL, Grunstein RR, Darendeliler MA, et al. Health outcomes of continuous positive airway pressure versus oral appliance treatment for obstructive sleep apnea: a randomized controlled trial. Am J Respir Crit Care Med 2013;187:879–87.
68. Doff MH, Hoekema A, Wijkstra PJ, et al. Oral appliance versus continuous positive airway pressure in obstructive sleep apnea syndrome: a 2-year follow-up. Sleep 2013;36:1289–96.
69. Bratton DJ, Gaisl T, Wons AM, Kohler M. CPAP vs mandibular advancement devices and blood pressure in patients with obstructive sleep apnea: a systematic review and meta-analysis. JAMA 2015;314:2280–93.
70. Bostanci A, Turhan M. A systematic review of tongue base suspension techniques as an isolated procedure or combined with uvulopalatopharyngoplasty in obstructive sleep apnea. Eur Arch Otorhinolaryngol 2015 Oct 27.
71. Camacho M, Certal V, Brietzke SE, et al. Tracheostomy as treatment for adult obstructive sleep apnea: a systematic review and meta-analysis. Laryngoscope 2014;124:803–11.
72. Camacho M, Teixeira J, Abdullatif J, et al. Maxillomandibular advancement and tracheostomy for morbidly obese obstructive sleep apnea: a systematic review and meta-analysis. Otolaryngol Head Neck Surg 2015;152:619–30.
73. Caples SM, Rowley JA, Prinsell JR, et al. Surgical modifications of the upper airway for obstructive sleep apnea in adults: a systematic review and meta-analysis. Sleep 2010;33:1396–407.
74. Handler E, Hamans E, Goldberg AN, Mickelson S. Tongue suspension: an evidence-based review and comparison to hypopharyngeal surgery for OSA. Laryngoscope 2014;124:329–36.
75. Ishii L, Roxbury C, Godoy A, et al. Does nasal surgery improve osa in patients with nasal obstruction and OSA? a meta-analysis. Otolaryngol Head Neck Surg 2015;153:326–33.
76. Lin HC, Friedman M, Chang HW, Gurpinar B. The efficacy of multilevel surgery of the upper airway in adults with obstructive sleep apnea/hypopnea syndrome. Laryngoscope 2008;118:902–8.
77. Murphey AW, Kandl JA, Nguyen SA, et al. The effect of glossectomy for obstructive sleep apnea: a systematic review and meta-analysis. Otolaryngol Head Neck Surg 2015;153:334–42.
78. Zaghi S, Holty JC, Certal V, et al. Maxillomandibular advancement for treatment of obstructive sleep apnea: a meta-analysis. JAMA Otolaryngol Head Neck Surg 2015 Nov 25:1–9.
79. Thaler ER, Rassekh CH, Lee JM, et al. Outcomes for multilevel surgery for sleep apnea: Obstructive sleep apnea, transoral robotic surgery, and uvulopalatopharyngoplasty. Laryngoscope 2015 Jul 7.
80. Arora A, Chaidas K, Garas G, et al. Outcome of TORS to tongue base and epiglottis in patients with OSA intolerant of conventional treatment. Sleep Breath 2015 Dec 15.
81. Remmers JE, deGroot WJ, Sauerland EK, Anch AM. Pathogenesis of upper airway occlusion during sleep. J Appl Physiol Respir Environ Exercise Physiol 1978;44:931–8.
82. Decker MJ, Haaga J, Arnold JL, et al. Functional electrical stimulation and respiration during sleep. J Appl Physiol (1985) 1993;75:1053–61.
83. Edmonds LC, Daniels BK, Stanson AW, et al. The effects of transcutaneous electrical stimulation during wakefulness and sleep in patients with obstructive sleep apnea. Am Rev Respir Dis 1992;146:1030–6.
84. Guilleminault C, Powell N, Bowman B, Stoohs R. The effect of electrical stimulation on obstructive sleep apnea syndrome. Chest 1995;107:67–73.
85. Miki H, Hida W, Chonan T, et al. Effects of submental electrical stimulation during sleep on upper airway patency in patients with obstructive sleep apnea. Am Rev Respir Dis 1989;140:1285–9.
86. Steier J, Seymour J, Rafferty GF, et al. Continuous transcutaneous submental electrical stimulation in obstructive sleep apnea: a feasibility study. Chest 2011;140:998–1007.
87. Eastwood PR, Barnes M, Walsh JH, et al. Treating obstructive sleep apnea with hypoglossal nerve stimulation. Sleep 2011;34:1479–86.
88. Kezirian EJ, Goding GS Jr, Malhotra A, et al. Hypoglossal nerve stimulation improves obstructive sleep apnea: 12-month outcomes. J Sleep Res 2014;23:77–83.
89. Strollo PJ, Jr., Soose RJ, Maurer JT, et al. Upper-airway stimulation for obstructive sleep apnea. N Engl J Med 2014;370:139–49.
90. Van de Heyning PH, Badr MS, Baskin JZ, et al. Implanted upper airway stimulation device for obstructive sleep apnea. Laryngoscope 2012;122:1626–33.
91. Strollo PJ, Gillespie MB, Soose RJ, et al. Upper airway stimulation for obstructive sleep apnea: durability of the treatment effect at 18 months. Sleep 2015;38:1593–8.
92. Woodson BT, Gillespie MB, Soose RJ, et al. Randomized controlled withdrawal study of upper airway stimulation on OSA: short- and long-term effect. Otolaryngol Head Neck Surg 2014;151:880–7.
93. Woodson BT, Soose RJ, Gillespie MB, et al. Three-year outcomes of cranial nerve stimulation for obstructive sleep apnea: the STAR trial. Otolaryngol Head Neck Surg 2015 Nov 17.
94. Soose RJ, Woodson BT, Gillespie MB, et al. Upper airway stimulation for obstructive sleep apnea: self-reported outcomes at 24 months. J Clin Sleep Med 2016;12:43-8.
95. Mason M, Welsh EJ, Smith I. Drug therapy for obstructive sleep apnoea in adults. Cochrane Database Syst Rev 2013;(5):CD003002.
96. Farabi SS, Prasad B, Quinn L, Carley DW. Impact of dronabinol on quantitative electroencephalogram (qEEG) measures of sleep in obstructive sleep apnea syndrome. J Clin Sleep Med 2014;10:49–56.
97. Prasad B, Radulovacki MG, Carley DW. Proof of concept trial of dronabinol in obstructive sleep apnea. Front Psychiatry 2013;4:1.
98. Calik MW, Carley DW. Cannabinoid type 1 and type 2 receptor antagonists prevent attenuation of serotonin-induced reflex apneas by dronabinol in Sprague-Dawley rats. PLoS One 2014;9:e111412.
99. Calik MW, Radulovacki M, Carley DW. Intranodose ganglion injections of dronabinol attenuate serotonin-induced apnea in Sprague-Dawley rat. Respir Physiol Neurobiol. 2014 Jan 1;190:20–4.
100. Carter SG, Berger MS, Carberry JC, et al. Zopiclone increases the arousal threshold without impairing genioglossus activity in obstructive sleep apnea. Sleep 2015 Dec 22.
101. Burgess KR. New insights from the measurement of loop gain in obstructive sleep apnoea. J Physiol 2012;590(Pt 8):1781–2.
102. Eckert DJ, White DP, Jordan AS, et al. Defining phenotypic causes of obstructive sleep apnea. Identification of novel therapeutic targets. Am J Respir Crit Care Med 2013;188:996–1004.
103. Salloum A, Rowley JA, Mateika JH, et al. Increased propensity for central apnea in patients with obstructive sleep apnea: effect of nasal continuous positive airway pressure. Am J Respir Crit Care Med 2010;181:189–93.
104. Edwards BA, Connolly JG, Campana LM, et al. Acetazolamide attenuates the ventilatory response to arousal in patients with obstructive sleep apnea. Sleep 2013;36:281–5.
105. Edwards BA, Sands SA, Eckert DJ, et al. Acetazolamide improves loop gain but not the other physiological traits causing obstructive sleep apnoea. J Physiol 2012;590(Pt 5):1199–211.
106. Eskandari D, Zou D, Karimi M, et al. Zonisamide reduces obstructive sleep apnoea: a randomised placebo-controlled study. Eur Resp J 2014;44:140–9.
107. Yang YX, Spencer G, Schutte-Rodin S, et al. Gastroesophageal reflux and sleep events in obstructive sleep apnea. Eur J Gastroenterol Hepatol 2013;25:1017–23.
108. Gilani S, Quan SF, Pynnonen MA, Shin JJ. Obstructive sleep apnea and gastroesophageal reflux: a multivariate population-level analysis. Otolaryngol Head Neck Surg 2015 Dec 8.
109. Rassameehiran S, Klomjit S, Hosiriluck N, Nugent K. Meta-analysis of the effect of proton pump inhibitors on obstructive sleep apnea symptoms and indices in patients with gastroesophageal reflux disease. Proc (Bayl Univ Med Cent) 2016;29:3–6.
110. Ermis F, Akyuz F, Arici S, et al. Effect of proton pump inhibitor (PPI) treatment in obstructive sleep apnea syndrome: an esophageal impedance-pHmetry study. Hepatogastroenterology 2011;58:1566–73.
111. Reimer C. Safety of long-term PPI therapy. Best Pract Res 2013;27:443–54.
112. Deacon NL, Jen R, Li Y, Malhotra A. Treatment of obstructive sleep apnea. prospects for personalized combined modality therapy. Ann Am Thorac Soc 2016;13:101–8.
113. Shin W, Jen R, Li Y, Malhotra A. Tailored treatment strategies for obstructive sleep apnea. Respir Investig 2016;54:2–7.
114. Dieltjens M, Vroegop AV, Verbruggen AE, et al. A promising concept of combination therapy for positional obstructive sleep apnea. Sleep Breath 2015;19:637–44.
115. Wellman A, Edwards BA, Sands SA, et al. A simplified method for determining phenotypic traits in patients with obstructive sleep apnea. J Appl Physiol (1985) 2013;114:911–22.
2016 Update on minimally invasive gynecologic surgery
Rightly so, the topics of mechanical tissue extraction and hysterectomy approach have dominated the field of obstetrics and gynecology over the past 12 months and more. A profusion of literature has been published on these subjects. However, there are 2 important topics within the field of minimally invasive gynecologic surgery that deserve our attention as well, and I have chosen to focus on these for this Update.
First, laparoscopic treatment of ovarian endometriomas is one of the most commonly performed gynecologic procedures worldwide. Many women undergoing such surgery are of childbearing age and have the desire for future pregnancy. What are best practices for preserving ovarian function in these women? Two studies recently published in the Journal of Minimally Invasive Gynecology addressed this question.
Second, until recently, the rate of bowel injury at laparoscopic gynecologic surgery has not been well established.1 Moreover, mechanical bowel preparation is commonly employed in case intestinal injury does occur, despite the lack of evidence that outcomes of these possible injuries can be improved.2 Understanding the rate of bowel injury can shed light on the overall value of the perceived benefits of bowel preparation. Therefore, I examine 2 recent systematic reviews that analyze the incidence of bowel injury and the value of bowel prep in gynecologic laparoscopic surgery.
bipolar coagulation inferior to suturing or hemostatic sealant for preserving ovarian function
Song T, Kim WY, Lee KW, Kim KH. Effect on ovarian reserve of hemostasis by bipolar coagulation versus suture during laparoendoscopic single-site cystectomy for ovarian endometriomas. J Minim Invasive Gynecol. 2015;22(3):415−420.
Ata B, Turkgeldi E, Seyhan A, Urman B. Effect of hemostatic method on ovarian reserve following laparoscopic endometrioma excision; comparison of suture, hemostatic sealant, and bipolar dessication. A systematic review and meta-analysis. J Minim Invasive Gynecol. 2015;22(3):363−372.

The customary surgical approach for laparoscopic cystectomy is by mechanical stripping of the cyst wall (FIGURE) and the use of bipolar desiccation for hemostasis. Stripping inevitably leads to removal of healthy ovarian cortex,3 especially in inexperienced hands,4 and ovarian follicles inevitably are destroyed during electrosurgical desiccation. When compared with the use of suturing or a hemostatic agent to control bleeding in the ovarian defect, the use of bipolar electrosurgery may harm more of the ovarian cortex, resulting in a comparatively diminished follicular cohort.
Possible deleterious effects on the ovarian reserve can be determined with a blood test to measure anti-Müllerian hormone (AMH) levels postoperatively. Produced by the granulosa cells of the ovary, this hormone directly reflects the remaining ovarian egg supply. Lower levels of AMH have been shown to significantly decrease the success rate of in vitro fertilization (IVF), especially in women older than age 35.5 Moreover, AMH levels in the late reproductive years can be used as a predictive marker of menopause, with lower levels predicting significantly earlier onset.6
Data from 2 recent studies, a quasi-randomized trial by Song and colleagues and a systematic review and meta-analysis by Ata and colleagues emphasize that bipolar desiccation for hemostasis may not be best practice for protecting ovarian reserve during laparoscopic ovarian cystectomy for an endometrioma.
AMH levels decline more significantly for women undergoing bipolar desiccation
Song and colleagues conducted a prospective quasi-randomized study of 125 women whose endometriomas were laparoscopically removed via a single-site approach and managed for hemostasis with either bipolar desiccation or suturing of the ovarian defect with a 2-0 barbed suture. All surgeries were conducted by a single surgeon.
At 3 months postsurgery, mean AMH levels had declined from baseline by 42.2% (interquartile range [IR], 16.5−53.0 ng/mL) in the desiccation group and by 24.6% (IR, 11.6−37.0 ng/mL) in the suture group (P = .001). Multivariate analysis showed that the method used for hemostasis was the only determinant for reduced ovarian reserve.
In their systematic review and meta-analysis, Ata and colleagues included 10 studies--6 qualitative and 4 quantitative. All studies examined the rate of change of serum AMH levels 3 months after laparoscopic removal of an endometrioma.
In their qualitative analysis, 5 of the 6 studies reported a significantly greater decrease in ovarian reserve after bipolar desiccation (varying from 13% to 44%) or a strong trend in the same direction. In the sixth study, the desiccation group had a lower decline in absolute AMH level than in the other 5 studies. The authors note that this 2.7% decline was much lower than the values reported for the bipolar desiccation group of any other study. (Those declines ranged between 19% and 58%.)
Although not significant, in all 3 of the included randomized controlled trials (RCTs), the desiccation groups had a greater loss in AMH level than the hemostatic sealant groups, and in 2 of these RCTs, bipolar desiccation groups had a greater loss than the suturing groups.
Among the 213 study participants in the 3 RCTs and the prospective cohort study included in the quantitative meta-analysis, alternative methods to bipolar desiccation were associated with a 6.95% lower decrease in AMH-level decline (95% confidence interval [CI], −13.0% to −0.9%; P = .02).
What this EVIDENCE means for practice
Compared with the use of bipolar electrosurgery to attain hemostasis, the use of a topical biosurgical agent or suturing could be significantly better for protection of the ovarian follicles during laparoscopic ovarian cystectomy for endometrioma. These alternative methods especially could benefit those women desiring future pregnancy who are demonstrated preoperatively to have a low ovarian reserve. As needed, electrosurgery should be sparingly employed for ovarian hemostasis.
Large Study identifies incidence of bowel injury during gynecologic laproscopy
Llarena NC, Shah AB, Milad MP. Bowel injury in gynecologic laparoscopy: a systematic review. Am J Obstet Gynecol. 2015;125(6):1407−1417.
In no aspect of laparoscopic surgery are preventive strategies more cautiously employed than during peritoneal access. Regardless of the applied technique, there is an irreducible risk of injury to the underlying viscera by either adhesions between the underlying bowel and abdominal wall or during the course of pilot error. Moreover, in the best of hands, bowel injury can occur whenever normal anatomic relationships need to be restored using intra-abdominal adhesiolysis. Given the ubiquity, these risks are never out of the surgeon's mind. Gynecologists are obliged to discuss these risks during the informed consent process.
Until recently, the rate of bowel injury has not been well established. Llarena and colleagues recently have conducted the largest systematic review of the medical literature to date for incidence, presentation, mortality, cause, and location of bowel injury associated with laparoscopic surgery while not necessarily distinguishing for the type of bowel injury. Sixty retrospective and 27 prospective studies met inclusion criteria.
The risk of bowel injury overall and defined
Among 474,063 laparoscopic surgeries conducted between 1972 and 2014, 604 bowel injuries were found, for an incidence of 1 in 769, or 0.13% (95% CI, 0.12−0.14%).
The rate of bowel injury varied by procedure, year, study type, and definition of bowel injury. The incidence of injury according to:
- definition, was 1 in 416 (0.24%) for studies that clearly included serosal injuries and enterotomies versus 1 in 833 (0.12%) for studies not clearly defining the type of bowel injury (relative risk [RR], 0.47; 95% CI, 0.38−0.59; P<.001)
- study type, was 1 in 666 (0.15%) for prospective studies versus 1 in 909 (0.11%) for retrospective studies (RR, 0.78; 95% CI, 0.63−0.96; P = .02)
- procedure, was 1 in 3,333 (0.03%; 95% CI, 0.01−0.03%) for sterilization and 1 in 256 (0.39%; 95% CI, 0.35−0.45%) for hysterectomy
- year, for laparoscopic hysterectomy only, was 1 in 222 (0.45%) before the year 2000 and 1 in 294 (0.34%) after 2000 (RR, 0.75; 95% CI, 0.57−0.98; P = .03).
How were injuries caused, found, and managed?
Thirty studies described the laparoscopic instrument used during 366 reported bowel injuries. The majority of injuries (55%) occurred during initial peritoneal access, with the Veress needle or trocar causing the damage. This was followed by electrosurgery (29%), dissection (11%), and forceps or scissors (4.1%).
According to 40 studies describing 307 injuries, bowel injuries most often were managed by converting to laparotomy (80%); only 8% of injuries were managed with laparoscopy and 2% expectantly.
Surgery to repair the bowel injury was delayed in 154 (41%) of 375 cases. The median time to injury discovery was 3 days (range, 1−13 days).
In only 19 cases were the presenting signs and symptoms of bowel injury recorded. Those reported from most to least often were: peritonitis, abdominal pain, fever, abdominal distention, leukocytosis, leukopenia, and septic shock.
Mortality
Mortality as an outcome was only reported in 29 of the total 90 studies; therefore, mortality may be underreported. Overall, however, death occurred in 1 (0.8%) of 125 bowel injuries.
The overall mortality rate from bowel injury--calculated from the only 42 studies that explicitly mentioned mortality as an outcome--was 1 in 125, or 0.8% (95% CI, 0.36%-1.9%). All 5 reported deaths occurred as a result of delayed recognition of bowel injury, which made the mortality rate for unrecognized bowel injury 1 in 31, or 3.2% (95% CI, 1%-7%). No deaths occurred when the bowel injury was noted intraoperatively.
What this EVIDENCE means for practice
In this review of 474,063 laparoscopic procedures, bowel injury occurred in 1 in 769, or 0.13% of procedures. Bowel injury is more apt to occur during more complicated laparoscopic procedures (compared with laparoscopic sterilization procedures, the risk during hysterectomy was greater than 10-fold).
Most of the injuries were managed by laparotomic surgery despite the potential to repair bowel injury by laparoscopy. Validating that peritoneal access is a high risk part of laparoscopic surgery, the majority of the injuries occurred during insufflation with a Veress needle or during abdominal access by trocar insertion. Nearly one-third of the injuries were from the use of electrosurgery, which are typically associated with a delay in presentation.
In this study, 41% of the injuries were unrecognized at the time of surgery. All 5 of the reported deaths were associated with a delay in diagnosis, with an overall mortality rate of 1 of 125, or 0.8%. Since all of these deaths were associated with a delay in diagnosis, the rate of mortality in unrecognized bowel injury was 5 of 154, or 3.2%. Among women who experienced delayed diagnosis, only 19 of 154 experienced signs or symptoms diagnostic for an underlying bowel injury, particularly when the small bowel was injured.
Can mechanical bowel prep positively affect outcomes in gynecologic laparoscopy, or should it be discarded?
Arnold A, Aitchison LP, Abbott J. Preoperative mechanical bowel preparation for abdominal, laparoscopic, and vaginal surgery: a systematic review. J Minim Invasive Gynecol. 2015;22(5):737−752.
Popularized for more than 4 decades, the practice of presurgical bowel preparation is predicated on the notion that the presence of less, versus more, feces can minimize bacterial count and thereby reduce peritoneal contamination. Logically then, surgical site infections (SSIs) should be reduced with bowel preparation. Moreover, the surgical view and bowel handling during laparoscopic surgery should be improved, with surgical times consequently reduced.
Surgeons must weigh the putative benefits of mechanical bowel preparation against the unpleasant experience it causes for patients, as well as the risks of dehydration or electrolyte disturbance it may cause. To this day, a considerable percentage of gynecologists and colorectal surgeons routinely prep the bowel after weighing all of these factors, despite the paucity of evidence for the practice's efficacy to reduce SSI and improve surgical outcomes.7
The results of this recent systematic review critically question the usefulness of preoperative bowel preparation for abdominal, laparoscopic, and vaginal surgery.
Details of the analysis
The authors evaluated high-quality studies on mechanical bowel preparation to assess evidence for:
- surgeon outcomes, including the surgical field and bowel handling
- operative outcomes, including intraoperative complications and operative times
- patient outcomes, including postoperative complications, overall morbidity, and length of stay.
The authors identified RCTs and prospective or retrospective cohort studies in various surgical specialties comparing preoperative bowel preparation to no such prep. Forty-three studies met inclusion criteria: 38 compared prep to no prep, and 5 compared prep to a single rectal enema. Five high-grade studies in gynecology were included (n = 795), with 4 of them RCTs of gynecologic laparoscopy (n = 645).
Operative field and duration
Of the studies comparing bowel prep with no prep, only the 5 gynecologic ones assessed operative field. Surgical view was perceived as improved in only 1 study. In another, surgeons only could guess allocation half the time.
Sixteen studies evaluated impact of mechanical bowel preparation on duration of surgery: 1 high-quality study found a significant reduction in OR time with bowel prep, and 1 moderate-quality study found longer operative time with bowel prep.
Patient outcomes
Of all studies assessing patient outcomes, 3 high-quality studies of colorectal patients (n = 490) found increased complications from prep versus no prep, including anastomotic dehiscence (P = .05), abdominal complications (P = .028), and infectious complications (P = .05).
Length of stay was assessed in 26 studies, with 4 reporting longer hospital stay with bowel prep and the remaining finding no difference between prep and no prep.
Across all specialties, only 2 studies reported improved outcomes with mechanical bowel preparation. One was a high-quality study reporting reduced 30-day morbidity (P = .018) and infectious complication rates (P = .018), and the other was a moderate-quality study that found reduced SSI (P = .0001) and organ space infection (P = .024) in patients undergoing bowel prep.
Mechanical bowel preparation vs enema
Bowel prep was compared with a single rectal enema in 5 studies. In 2 of these, patient outcomes were worse with enema. One high-quality study of 294 patients reported increased intra-abdominal fecal soiling (P = .008) in the enema group. (The surgeons believed that bowel preparation was more likely to be inadequate in this group, 25% compared with 6%, P<.05.) Whereas there was no statistical difference in the incidence of anastomotic leak between these groups, there was higher reoperation rate in the enema-only group where leakage was diagnosed (6 [4.1%] vs 0, respectively; P = .013).
Bowel prep and preoperative and postoperative symptoms
Six high-quality studies reported on the impact of mechanical bowel preparation on patient symptoms, such as nausea, weakness, abdominal distention, and satisfaction before and after surgery. In all but 1 study patients had significantly greater discomfort with bowel preparation. In 2 of the 6 studies, patients had more diarrhea (P = .0003), a delay in the first bowel movement (P = .001), and a slower return to normal diet (P = .004).
What this EVIDENCE means for practice
The theory behind mechanical bowel preparation is not supported by the evidence. Despite the fact that the bowel is not customarily entered, up to 50% of gynecologic surgeons employ bowel preparation, with the hope of improving visualization and decreasing risk of an anastomotic leak. The colorectal studies in this review demonstrate no evidence for decreased anastomotic leak or infectious complications. By extrapolation, there is no evidence that using preoperative bowel prep bestows any benefit if bowel injury occurs inadvertently and if resection or reanastomosis is then required.
Among the 7 studies examining bowel prep in laparoscopy (4 gynecology, 3 urology, and 1 colorectal), only data from 1 demonstrated an improved surgical field (and in this case only by 1 out of 10 on a Likert scale). The impact of mechanical bowel preparation on the visual field is the same for diagnostic or complex laparoscopic surgeries. One high-quality study with deep endometriosis resection demonstrated no change in the operative field as reflected by no practical differences in OR time or complications.
Preparing the bowel for surgery is an intrusive process that reduces patient satisfaction by inducing weakness, abdominal distention, nausea, vomiting, hunger, and thirst. Whereas this systematic analysis failed to confirm any benefit of the process, it provides evidence for the potential for harm. Mechanical bowel preparation should be discarded as a routine preoperative treatment for patients undergoing minimally invasive gynecologic surgery.
Share your thoughts! Send your Letter to the Editor to [email protected]. Please include your name and the city and state in which you practice.
Andrew I. Brill, MD

Dr. Brill is Director, Minimally Invasive Gynecology and Surgical Education, California Pacific Medical Center, San Francisco, California.
The author reports being a consultant to Aegea Medical, Bovie Medical, Channel Medical, Ethicon, and Karl Storz and a speaker for Boston Scientific, Cooper Surgical, and Ethicon.
Andrew I. Brill, MD
Dr. Brill is Director, Minimally Invasive Gynecology and Surgical Education, California Pacific Medical Center, San Francisco, California.
The author reports being a consultant to Aegea Medical, Bovie Medical, Channel Medical, Ethicon, and Karl Storz and a speaker for Boston Scientific, Cooper Surgical, and Ethicon.
Rightly so, the topics of mechanical tissue extraction and hysterectomy approach have dominated the field of obstetrics and gynecology over the past 12 months and more. A profusion of literature has been published on these subjects. However, there are 2 important topics within the field of minimally invasive gynecologic surgery that deserve our attention as well, and I have chosen to focus on these for this Update.
First, laparoscopic treatment of ovarian endometriomas is one of the most commonly performed gynecologic procedures worldwide. Many women undergoing such surgery are of childbearing age and have the desire for future pregnancy. What are best practices for preserving ovarian function in these women? Two studies recently published in the Journal of Minimally Invasive Gynecology addressed this question.
Second, until recently, the rate of bowel injury at laparoscopic gynecologic surgery has not been well established.1 Moreover, mechanical bowel preparation is commonly employed in case intestinal injury does occur, despite the lack of evidence that outcomes of these possible injuries can be improved.2 Understanding the rate of bowel injury can shed light on the overall value of the perceived benefits of bowel preparation. Therefore, I examine 2 recent systematic reviews that analyze the incidence of bowel injury and the value of bowel prep in gynecologic laparoscopic surgery.
bipolar coagulation inferior to suturing or hemostatic sealant for preserving ovarian function
Song T, Kim WY, Lee KW, Kim KH. Effect on ovarian reserve of hemostasis by bipolar coagulation versus suture during laparoendoscopic single-site cystectomy for ovarian endometriomas. J Minim Invasive Gynecol. 2015;22(3):415−420.
Ata B, Turkgeldi E, Seyhan A, Urman B. Effect of hemostatic method on ovarian reserve following laparoscopic endometrioma excision; comparison of suture, hemostatic sealant, and bipolar dessication. A systematic review and meta-analysis. J Minim Invasive Gynecol. 2015;22(3):363−372.
The customary surgical approach for laparoscopic cystectomy is by mechanical stripping of the cyst wall (FIGURE) and the use of bipolar desiccation for hemostasis. Stripping inevitably leads to removal of healthy ovarian cortex,3 especially in inexperienced hands,4 and ovarian follicles inevitably are destroyed during electrosurgical desiccation. When compared with the use of suturing or a hemostatic agent to control bleeding in the ovarian defect, the use of bipolar electrosurgery may harm more of the ovarian cortex, resulting in a comparatively diminished follicular cohort.
Possible deleterious effects on the ovarian reserve can be determined with a blood test to measure anti-Müllerian hormone (AMH) levels postoperatively. Produced by the granulosa cells of the ovary, this hormone directly reflects the remaining ovarian egg supply. Lower levels of AMH have been shown to significantly decrease the success rate of in vitro fertilization (IVF), especially in women older than age 35.5 Moreover, AMH levels in the late reproductive years can be used as a predictive marker of menopause, with lower levels predicting significantly earlier onset.6
Data from 2 recent studies, a quasi-randomized trial by Song and colleagues and a systematic review and meta-analysis by Ata and colleagues emphasize that bipolar desiccation for hemostasis may not be best practice for protecting ovarian reserve during laparoscopic ovarian cystectomy for an endometrioma.
AMH levels decline more significantly for women undergoing bipolar desiccation
Song and colleagues conducted a prospective quasi-randomized study of 125 women whose endometriomas were laparoscopically removed via a single-site approach and managed for hemostasis with either bipolar desiccation or suturing of the ovarian defect with a 2-0 barbed suture. All surgeries were conducted by a single surgeon.
At 3 months postsurgery, mean AMH levels had declined from baseline by 42.2% (interquartile range [IR], 16.5−53.0 ng/mL) in the desiccation group and by 24.6% (IR, 11.6−37.0 ng/mL) in the suture group (P = .001). Multivariate analysis showed that the method used for hemostasis was the only determinant for reduced ovarian reserve.
In their systematic review and meta-analysis, Ata and colleagues included 10 studies--6 qualitative and 4 quantitative. All studies examined the rate of change of serum AMH levels 3 months after laparoscopic removal of an endometrioma.
In their qualitative analysis, 5 of the 6 studies reported a significantly greater decrease in ovarian reserve after bipolar desiccation (varying from 13% to 44%) or a strong trend in the same direction. In the sixth study, the desiccation group had a lower decline in absolute AMH level than in the other 5 studies. The authors note that this 2.7% decline was much lower than the values reported for the bipolar desiccation group of any other study. (Those declines ranged between 19% and 58%.)
Although not significant, in all 3 of the included randomized controlled trials (RCTs), the desiccation groups had a greater loss in AMH level than the hemostatic sealant groups, and in 2 of these RCTs, bipolar desiccation groups had a greater loss than the suturing groups.
Among the 213 study participants in the 3 RCTs and the prospective cohort study included in the quantitative meta-analysis, alternative methods to bipolar desiccation were associated with a 6.95% lower decrease in AMH-level decline (95% confidence interval [CI], −13.0% to −0.9%; P = .02).
What this EVIDENCE means for practice
Compared with the use of bipolar electrosurgery to attain hemostasis, the use of a topical biosurgical agent or suturing could be significantly better for protection of the ovarian follicles during laparoscopic ovarian cystectomy for endometrioma. These alternative methods especially could benefit those women desiring future pregnancy who are demonstrated preoperatively to have a low ovarian reserve. As needed, electrosurgery should be sparingly employed for ovarian hemostasis.
Large Study identifies incidence of bowel injury during gynecologic laproscopy
Llarena NC, Shah AB, Milad MP. Bowel injury in gynecologic laparoscopy: a systematic review. Am J Obstet Gynecol. 2015;125(6):1407−1417.
In no aspect of laparoscopic surgery are preventive strategies more cautiously employed than during peritoneal access. Regardless of the applied technique, there is an irreducible risk of injury to the underlying viscera by either adhesions between the underlying bowel and abdominal wall or during the course of pilot error. Moreover, in the best of hands, bowel injury can occur whenever normal anatomic relationships need to be restored using intra-abdominal adhesiolysis. Given the ubiquity, these risks are never out of the surgeon's mind. Gynecologists are obliged to discuss these risks during the informed consent process.
Until recently, the rate of bowel injury has not been well established. Llarena and colleagues recently have conducted the largest systematic review of the medical literature to date for incidence, presentation, mortality, cause, and location of bowel injury associated with laparoscopic surgery while not necessarily distinguishing for the type of bowel injury. Sixty retrospective and 27 prospective studies met inclusion criteria.
The risk of bowel injury overall and defined
Among 474,063 laparoscopic surgeries conducted between 1972 and 2014, 604 bowel injuries were found, for an incidence of 1 in 769, or 0.13% (95% CI, 0.12−0.14%).
The rate of bowel injury varied by procedure, year, study type, and definition of bowel injury. The incidence of injury according to:
- definition, was 1 in 416 (0.24%) for studies that clearly included serosal injuries and enterotomies versus 1 in 833 (0.12%) for studies not clearly defining the type of bowel injury (relative risk [RR], 0.47; 95% CI, 0.38−0.59; P<.001)
- study type, was 1 in 666 (0.15%) for prospective studies versus 1 in 909 (0.11%) for retrospective studies (RR, 0.78; 95% CI, 0.63−0.96; P = .02)
- procedure, was 1 in 3,333 (0.03%; 95% CI, 0.01−0.03%) for sterilization and 1 in 256 (0.39%; 95% CI, 0.35−0.45%) for hysterectomy
- year, for laparoscopic hysterectomy only, was 1 in 222 (0.45%) before the year 2000 and 1 in 294 (0.34%) after 2000 (RR, 0.75; 95% CI, 0.57−0.98; P = .03).
How were injuries caused, found, and managed?
Thirty studies described the laparoscopic instrument used during 366 reported bowel injuries. The majority of injuries (55%) occurred during initial peritoneal access, with the Veress needle or trocar causing the damage. This was followed by electrosurgery (29%), dissection (11%), and forceps or scissors (4.1%).
According to 40 studies describing 307 injuries, bowel injuries most often were managed by converting to laparotomy (80%); only 8% of injuries were managed with laparoscopy and 2% expectantly.
Surgery to repair the bowel injury was delayed in 154 (41%) of 375 cases. The median time to injury discovery was 3 days (range, 1−13 days).
In only 19 cases were the presenting signs and symptoms of bowel injury recorded. Those reported from most to least often were: peritonitis, abdominal pain, fever, abdominal distention, leukocytosis, leukopenia, and septic shock.
Mortality
Mortality as an outcome was only reported in 29 of the total 90 studies; therefore, mortality may be underreported. Overall, however, death occurred in 1 (0.8%) of 125 bowel injuries.
The overall mortality rate from bowel injury--calculated from the only 42 studies that explicitly mentioned mortality as an outcome--was 1 in 125, or 0.8% (95% CI, 0.36%-1.9%). All 5 reported deaths occurred as a result of delayed recognition of bowel injury, which made the mortality rate for unrecognized bowel injury 1 in 31, or 3.2% (95% CI, 1%-7%). No deaths occurred when the bowel injury was noted intraoperatively.
What this EVIDENCE means for practice
In this review of 474,063 laparoscopic procedures, bowel injury occurred in 1 in 769, or 0.13% of procedures. Bowel injury is more apt to occur during more complicated laparoscopic procedures (compared with laparoscopic sterilization procedures, the risk during hysterectomy was greater than 10-fold).
Most of the injuries were managed by laparotomic surgery despite the potential to repair bowel injury by laparoscopy. Validating that peritoneal access is a high risk part of laparoscopic surgery, the majority of the injuries occurred during insufflation with a Veress needle or during abdominal access by trocar insertion. Nearly one-third of the injuries were from the use of electrosurgery, which are typically associated with a delay in presentation.
In this study, 41% of the injuries were unrecognized at the time of surgery. All 5 of the reported deaths were associated with a delay in diagnosis, with an overall mortality rate of 1 of 125, or 0.8%. Since all of these deaths were associated with a delay in diagnosis, the rate of mortality in unrecognized bowel injury was 5 of 154, or 3.2%. Among women who experienced delayed diagnosis, only 19 of 154 experienced signs or symptoms diagnostic for an underlying bowel injury, particularly when the small bowel was injured.
Can mechanical bowel prep positively affect outcomes in gynecologic laparoscopy, or should it be discarded?
Arnold A, Aitchison LP, Abbott J. Preoperative mechanical bowel preparation for abdominal, laparoscopic, and vaginal surgery: a systematic review. J Minim Invasive Gynecol. 2015;22(5):737−752.
Popularized for more than 4 decades, the practice of presurgical bowel preparation is predicated on the notion that the presence of less, versus more, feces can minimize bacterial count and thereby reduce peritoneal contamination. Logically then, surgical site infections (SSIs) should be reduced with bowel preparation. Moreover, the surgical view and bowel handling during laparoscopic surgery should be improved, with surgical times consequently reduced.
Surgeons must weigh the putative benefits of mechanical bowel preparation against the unpleasant experience it causes for patients, as well as the risks of dehydration or electrolyte disturbance it may cause. To this day, a considerable percentage of gynecologists and colorectal surgeons routinely prep the bowel after weighing all of these factors, despite the paucity of evidence for the practice's efficacy to reduce SSI and improve surgical outcomes.7
The results of this recent systematic review critically question the usefulness of preoperative bowel preparation for abdominal, laparoscopic, and vaginal surgery.
Details of the analysis
The authors evaluated high-quality studies on mechanical bowel preparation to assess evidence for:
- surgeon outcomes, including the surgical field and bowel handling
- operative outcomes, including intraoperative complications and operative times
- patient outcomes, including postoperative complications, overall morbidity, and length of stay.
The authors identified RCTs and prospective or retrospective cohort studies in various surgical specialties comparing preoperative bowel preparation to no such prep. Forty-three studies met inclusion criteria: 38 compared prep to no prep, and 5 compared prep to a single rectal enema. Five high-grade studies in gynecology were included (n = 795), with 4 of them RCTs of gynecologic laparoscopy (n = 645).
Operative field and duration
Of the studies comparing bowel prep with no prep, only the 5 gynecologic ones assessed operative field. Surgical view was perceived as improved in only 1 study. In another, surgeons only could guess allocation half the time.
Sixteen studies evaluated impact of mechanical bowel preparation on duration of surgery: 1 high-quality study found a significant reduction in OR time with bowel prep, and 1 moderate-quality study found longer operative time with bowel prep.
Patient outcomes
Of all studies assessing patient outcomes, 3 high-quality studies of colorectal patients (n = 490) found increased complications from prep versus no prep, including anastomotic dehiscence (P = .05), abdominal complications (P = .028), and infectious complications (P = .05).
Length of stay was assessed in 26 studies, with 4 reporting longer hospital stay with bowel prep and the remaining finding no difference between prep and no prep.
Across all specialties, only 2 studies reported improved outcomes with mechanical bowel preparation. One was a high-quality study reporting reduced 30-day morbidity (P = .018) and infectious complication rates (P = .018), and the other was a moderate-quality study that found reduced SSI (P = .0001) and organ space infection (P = .024) in patients undergoing bowel prep.
Mechanical bowel preparation vs enema
Bowel prep was compared with a single rectal enema in 5 studies. In 2 of these, patient outcomes were worse with enema. One high-quality study of 294 patients reported increased intra-abdominal fecal soiling (P = .008) in the enema group. (The surgeons believed that bowel preparation was more likely to be inadequate in this group, 25% compared with 6%, P<.05.) Whereas there was no statistical difference in the incidence of anastomotic leak between these groups, there was higher reoperation rate in the enema-only group where leakage was diagnosed (6 [4.1%] vs 0, respectively; P = .013).
Bowel prep and preoperative and postoperative symptoms
Six high-quality studies reported on the impact of mechanical bowel preparation on patient symptoms, such as nausea, weakness, abdominal distention, and satisfaction before and after surgery. In all but 1 study patients had significantly greater discomfort with bowel preparation. In 2 of the 6 studies, patients had more diarrhea (P = .0003), a delay in the first bowel movement (P = .001), and a slower return to normal diet (P = .004).
What this EVIDENCE means for practice
The theory behind mechanical bowel preparation is not supported by the evidence. Despite the fact that the bowel is not customarily entered, up to 50% of gynecologic surgeons employ bowel preparation, with the hope of improving visualization and decreasing risk of an anastomotic leak. The colorectal studies in this review demonstrate no evidence for decreased anastomotic leak or infectious complications. By extrapolation, there is no evidence that using preoperative bowel prep bestows any benefit if bowel injury occurs inadvertently and if resection or reanastomosis is then required.
Among the 7 studies examining bowel prep in laparoscopy (4 gynecology, 3 urology, and 1 colorectal), only data from 1 demonstrated an improved surgical field (and in this case only by 1 out of 10 on a Likert scale). The impact of mechanical bowel preparation on the visual field is the same for diagnostic or complex laparoscopic surgeries. One high-quality study with deep endometriosis resection demonstrated no change in the operative field as reflected by no practical differences in OR time or complications.
Preparing the bowel for surgery is an intrusive process that reduces patient satisfaction by inducing weakness, abdominal distention, nausea, vomiting, hunger, and thirst. Whereas this systematic analysis failed to confirm any benefit of the process, it provides evidence for the potential for harm. Mechanical bowel preparation should be discarded as a routine preoperative treatment for patients undergoing minimally invasive gynecologic surgery.
Share your thoughts! Send your Letter to the Editor to [email protected]. Please include your name and the city and state in which you practice.
In this article
- Preserving ovarian function at laparoscopic cystectomy
- Incidence of bowel injury during gyn surgery
- Usefulness and safety of mechanical bowel preparation
What’s Hot and What’s Not in Our National Organizations: An Emergency Medicine Panel, Part 1
On February 21 to 24, 2016, the Association of Academic Chairs of Emergency Medicine (AACEM) held its 8th annual retreat in Tempe, Arizona. The AACEM is comprised of full, acting, interim, and emeritus chairs and directors of departments of emergency medicine (EM) who work to improve and support academic departments of EM in the advancement of health care through high-quality education and research.
During that event, AACEM President Greg Volturo, MD, organized a panel discussion of EM leaders to provide an update on their organizations’ recent activities. This panel included representatives from seven prominent EM organizations: the American Academy of Emergency Medicine (AAEM), AAEM Resident and Student Association (AAEM/RSA), American Board of Emergency Medicine (ABEM), American College of Emergency Physicians (ACEP), Council of Emergency Medicine Residency Directors (CORD), Emergency Medicine Residents’ Association (EMRA), and Society for Academic Emergency Medicine (SAEM).
The following is the first of a two-part article that provides highlights from that discussion, with reports from the AAEM, AAEM/RSA, ABEM, and ACEP. Part 2 will appear in the May issue and will include reports from the CORD, EMRA, and SAEM.
American Academy of Emergency Medicine
Kevin G. Rodgers, MD, FAAEM, President AAEM

Due Process. AAEM highlighted the problem of the lack of due process for many emergency physicians (EPs). By agreeing to waive their rights to due process when signing contracts with some contract management companies, EPs can unwittingly give their employers the power to terminate them without cause and without notice. AAEM is working with Centers for Medicare & Medicaid Services (CMS) and several congressmen to amend the Medicare Rules for Participation to include an “unwaivable due process guarantee.” In addition, AAEM is requesting an addition to the current Code of Federal Regulation to ensure EPs are entitled “to a fair hearing and appellate review through hospital medical staff mechanisms before any termination or restriction of their professional activity or medical staff privileges. These rights cannot be denied through a third party contract.”
AAEM Residency Visitation Program. AAEM is committed to visiting every EM residency program once every 3 to 4 years, similar to the ACEP and ABEM programs. Residency programs will have the opportunity to select from a list of well-known EM speakers; they will deliver a clinically oriented lecture, followed by a presentation on AAEM. The cost of the program is borne completely by AAEM.
AAEM Physician Group (AAEM-PG). This program was announced at the 2016 AAEM Scientific Assembly. AAEM-PG establishes and supports EM practices where physicians can operate democratically and have an equal voice. It is a practice that is run by the local physicians for the physicians. AAEM-PG will help guide new as well as established EM groups, providing for physicians’ autonomy, fair and equitable practice environments, and career and group longevity.
AAEM Resident and Student Association
Victoria Weston, MD, AAEM/RSA President

Overview. Started in 2005, AAEM/RAS now has over 3,500 members and 58 EM residency programs with 100% participation. Benefits of membership include access to EM:RAP and The Journal of Emergency Medicine, access and opportunities to contribute to an RSA peer-reviewed blog and Modern Resident, and free registration for the AAEM Annual Scientific Assembly. As part of the AAEM Scientific Assembly, AAEM/RSA coordinates a day-long education track in collaboration with the AAEM Young Physician Section, an In-Training Exam review, and a Career Fair and Social.
Congressional Elective. Members of AAEM/RSA can apply to be selected for a one-month “Congressional Elective” with Congressmen Raul Ruiz and Joe Heck, the only two EPs currently in Congress, to teach EPs the process of creating health-policy legislation on Capitol Hill. For 4 weeks, residents work directly in their congressional office and learn to work with constituents to develop relevant health-policy legislation. Residents learn to present legislative briefs, proposals, and research in a productive, succinct, and time-efficient manner. AAEM/RSA also offers an annual Advocacy Day, where residents and students have the opportunity to meet with members of Congress and/or senior congressional staff on Capitol Hill; this year it will be held on June 14, 2016 in Washington, DC.
Toxicology Mobile App. The AAEM/RSA Toxicology mobile app will soon be available for purchase, and is compatible with both iPhone and Android technology. You can search by subject, browse chapters of AAEM/RSA’s Toxicology Handbook, or contact Poison Control with a single click.
American Board of Emergency Medicine
Francis L. Counselman, MD, Immediate Past President, ABEM

Enhanced Oral (eOral) Certification Examination. ABEM has completed its second eOral examination; the third is scheduled for April 2016. Three of the examination cases are now in the new eOral format, which uses a computer monitor, patient avatar, picture archiving and communication system (PACS)-quality radiographs, and dynamic rhythm strips. Feedback from test-takers and examiners has been quite positive. ABEM will be moving more cases to the eOral format in the near future.
ABEM Director of Medical Affairs. ABEM has named its first ever Director of Medical Affairs (DMA): Melissa A. Barton, MD. Dr Barton is a former EM Residency Program Director and has been an ABEM Oral Examiner for the past 10 years. She is the recipient of several teaching and leadership awards. Dr Barton will focus on clinically oriented special projects and represent ABEM’s interests to external organizations.
Emergency Medicine Subspecialties. EM now has 13 subspecialty opportunities for EPs; that’s more than double the number from just 5 years ago. Emergency Medical Services (EMS) now has the most ABEM diplomates (445), followed by Medical Toxicology (367) and Pediatric Emergency Medicine (245).
Lifelong Learning and Self-Assessment (LLSA) Test Accessibility. To provide LLSA readings that better match a diplomate’s area of practice, the EMS and Medical Toxicology LLSA readings and tests can now be used by any diplomate to fulfill his or her Maintenance of Certification (MOC) Part II requirements. Pediatric EM LLSA readings and tests will eventually be made available to all diplomates at a later date. All LLSAs can be accessed through the ABEM Web site (https://www.abem.org).
Maintenance of Certification (MOC) Adds Value. In a survey of ABEM diplomates taking the 2014 ConCert Examination, 92.5% found value in maintaining their ABEM certification. In a follow-up survey in 2015, 90.4% stated their medical knowledge was reinforced and/or increased by preparing and taking the ConCert Examination. In addition to being relevant to our diplomates’ practice, ABEM has worked hard to control MOC costs. ABEM has not increased its fees for the last 5 years for the LLSAs; for all remaining examinations, there has been no fee increase for the past 4 years. When compared to all other boards, the expense of the ABEM MOC Program is at the median, costing EPs approximately $265 per year, or about $5 each week.
American College of Emergency Physicians
Jay A. Kaplan, MD, FACEP, ACEP President

Physician Burnout. Unfortunately, EM leads all specialties in the frequency of physician burnout. Emergency physicians must be aware of burnout, and take proactive steps to avoid it. To help EPs, ACEP has organized an “Emergency Medicine Wellness Week.” Prevention tips include eating well, getting the proper amount of sleep, regular exercise, and improving the work environment. In 2016, Wellness Week ran from January 24 to 30; there is a continuing focus on building resilience and preventing compassion fatigue.
Out of Network (OON) Balance Billing. Insurance companies know that it is solely the cost of insurance premiums that consumers pay attention to, not deductibles or exactly what the insurance covers. Those same insurance companies have been adept at portraying physicians as the cause of “surprise billing.” Emergency physicians need to change the conversation from “surprise billing” to “surprise coverage.” We need to talk about fair coverage for our patients, rather than asking for fair payment for physicians (the latter will follow the former and legislators believe that physicians are already fairly paid). ACEP is considering legal action against CMS and the Center for Consumer Information and Insurance Oversight regarding their final rule on “the greatest of three,” which establishes guidelines for how physicians are to be paid for services rendered.
Pay for Performance and Value-based Reimbursement. ACEP has created a joint task force with the Emergency Department Practice Management Association to create a toolbox for EPs to navigate the changing reimbursement landscape. This includes model legislation and best practices, and there is exploration regarding developing alternative payment models for EM.
Opioid Epidemic. ACEP is a participant in the White House working group exploring this epidemic and identifying strategies to combat this national problem. ACEP has sent a letter to CMS and Health and Human Services (HHS) requesting removal of the pain questions from the Consumer Assessment of Healthcare Providers and Systems (CAHPS) surveys. Emergency physicians should not be penalized on these surveys for not prescribing narcotic analgesics to patients who could be treated appropriately with nonnarcotic medications. ACEP similarly is considering sending a letter to The Joint Commission requesting removal of their emphasis on pain as the “fifth vital sign.”
Mass Casualty Incidents. ACEP has created a “New High-Threat High-Casualty Task Force” to identify best practice recommendations for provision of emergency care in high-threat environments and identify current clinical and operational knowledge gaps surrounding the issue. This in turn will help prioritize future ACEP research objectives based on these gaps. In addition, a white paper is being prepared, highlighting current national efforts and recommending clinical practice guidelines for adults and pediatric patients, as well as a future strategy for ACEP engagement as a national leader in the area of high-threat emergency care.
Diversity. There is a recognized need to increase the diversity in our current and future EM leadership. To that end, ACEP sponsored a Diversity Summit on April 14, 2016 in Dallas to explore these issues and make recommendations.
Emergency Quality Network. ACEP, along with 38 other health care organizations, received a grant in the CMS Transforming Clinical Practice Initiative to help physicians achieve large-scale health transformation. Areas of EM focus include: improving outcomes for patients with sepsis; reducing avoidable imaging in low-risk patients through implementation of ACEP’s Choosing Wisely campaign; and improving the value of ED chest pain evaluation in low-risk patients by reducing avoidable testing and admissions.
Editor’s Note: Part 2 of this article will appear in the May 2016 issue of Emergency Medicine and will feature reports from the Council of Emergency Medicine Residency Directors (CORD), the Emergency Medicine Residents’ Association (EMRA), and the Society for Academic Emergency Medicine (SAEM). Have a comment or question about this article? Let us know: [email protected].
On February 21 to 24, 2016, the Association of Academic Chairs of Emergency Medicine (AACEM) held its 8th annual retreat in Tempe, Arizona. The AACEM is comprised of full, acting, interim, and emeritus chairs and directors of departments of emergency medicine (EM) who work to improve and support academic departments of EM in the advancement of health care through high-quality education and research.
During that event, AACEM President Greg Volturo, MD, organized a panel discussion of EM leaders to provide an update on their organizations’ recent activities. This panel included representatives from seven prominent EM organizations: the American Academy of Emergency Medicine (AAEM), AAEM Resident and Student Association (AAEM/RSA), American Board of Emergency Medicine (ABEM), American College of Emergency Physicians (ACEP), Council of Emergency Medicine Residency Directors (CORD), Emergency Medicine Residents’ Association (EMRA), and Society for Academic Emergency Medicine (SAEM).
The following is the first of a two-part article that provides highlights from that discussion, with reports from the AAEM, AAEM/RSA, ABEM, and ACEP. Part 2 will appear in the May issue and will include reports from the CORD, EMRA, and SAEM.
American Academy of Emergency Medicine
Kevin G. Rodgers, MD, FAAEM, President AAEM
Due Process. AAEM highlighted the problem of the lack of due process for many emergency physicians (EPs). By agreeing to waive their rights to due process when signing contracts with some contract management companies, EPs can unwittingly give their employers the power to terminate them without cause and without notice. AAEM is working with Centers for Medicare & Medicaid Services (CMS) and several congressmen to amend the Medicare Rules for Participation to include an “unwaivable due process guarantee.” In addition, AAEM is requesting an addition to the current Code of Federal Regulation to ensure EPs are entitled “to a fair hearing and appellate review through hospital medical staff mechanisms before any termination or restriction of their professional activity or medical staff privileges. These rights cannot be denied through a third party contract.”
AAEM Residency Visitation Program. AAEM is committed to visiting every EM residency program once every 3 to 4 years, similar to the ACEP and ABEM programs. Residency programs will have the opportunity to select from a list of well-known EM speakers; they will deliver a clinically oriented lecture, followed by a presentation on AAEM. The cost of the program is borne completely by AAEM.
AAEM Physician Group (AAEM-PG). This program was announced at the 2016 AAEM Scientific Assembly. AAEM-PG establishes and supports EM practices where physicians can operate democratically and have an equal voice. It is a practice that is run by the local physicians for the physicians. AAEM-PG will help guide new as well as established EM groups, providing for physicians’ autonomy, fair and equitable practice environments, and career and group longevity.
AAEM Resident and Student Association
Victoria Weston, MD, AAEM/RSA President
Overview. Started in 2005, AAEM/RAS now has over 3,500 members and 58 EM residency programs with 100% participation. Benefits of membership include access to EM:RAP and The Journal of Emergency Medicine, access and opportunities to contribute to an RSA peer-reviewed blog and Modern Resident, and free registration for the AAEM Annual Scientific Assembly. As part of the AAEM Scientific Assembly, AAEM/RSA coordinates a day-long education track in collaboration with the AAEM Young Physician Section, an In-Training Exam review, and a Career Fair and Social.
Congressional Elective. Members of AAEM/RSA can apply to be selected for a one-month “Congressional Elective” with Congressmen Raul Ruiz and Joe Heck, the only two EPs currently in Congress, to teach EPs the process of creating health-policy legislation on Capitol Hill. For 4 weeks, residents work directly in their congressional office and learn to work with constituents to develop relevant health-policy legislation. Residents learn to present legislative briefs, proposals, and research in a productive, succinct, and time-efficient manner. AAEM/RSA also offers an annual Advocacy Day, where residents and students have the opportunity to meet with members of Congress and/or senior congressional staff on Capitol Hill; this year it will be held on June 14, 2016 in Washington, DC.
Toxicology Mobile App. The AAEM/RSA Toxicology mobile app will soon be available for purchase, and is compatible with both iPhone and Android technology. You can search by subject, browse chapters of AAEM/RSA’s Toxicology Handbook, or contact Poison Control with a single click.
American Board of Emergency Medicine
Francis L. Counselman, MD, Immediate Past President, ABEM
Enhanced Oral (eOral) Certification Examination. ABEM has completed its second eOral examination; the third is scheduled for April 2016. Three of the examination cases are now in the new eOral format, which uses a computer monitor, patient avatar, picture archiving and communication system (PACS)-quality radiographs, and dynamic rhythm strips. Feedback from test-takers and examiners has been quite positive. ABEM will be moving more cases to the eOral format in the near future.
ABEM Director of Medical Affairs. ABEM has named its first ever Director of Medical Affairs (DMA): Melissa A. Barton, MD. Dr Barton is a former EM Residency Program Director and has been an ABEM Oral Examiner for the past 10 years. She is the recipient of several teaching and leadership awards. Dr Barton will focus on clinically oriented special projects and represent ABEM’s interests to external organizations.
Emergency Medicine Subspecialties. EM now has 13 subspecialty opportunities for EPs; that’s more than double the number from just 5 years ago. Emergency Medical Services (EMS) now has the most ABEM diplomates (445), followed by Medical Toxicology (367) and Pediatric Emergency Medicine (245).
Lifelong Learning and Self-Assessment (LLSA) Test Accessibility. To provide LLSA readings that better match a diplomate’s area of practice, the EMS and Medical Toxicology LLSA readings and tests can now be used by any diplomate to fulfill his or her Maintenance of Certification (MOC) Part II requirements. Pediatric EM LLSA readings and tests will eventually be made available to all diplomates at a later date. All LLSAs can be accessed through the ABEM Web site (https://www.abem.org).
Maintenance of Certification (MOC) Adds Value. In a survey of ABEM diplomates taking the 2014 ConCert Examination, 92.5% found value in maintaining their ABEM certification. In a follow-up survey in 2015, 90.4% stated their medical knowledge was reinforced and/or increased by preparing and taking the ConCert Examination. In addition to being relevant to our diplomates’ practice, ABEM has worked hard to control MOC costs. ABEM has not increased its fees for the last 5 years for the LLSAs; for all remaining examinations, there has been no fee increase for the past 4 years. When compared to all other boards, the expense of the ABEM MOC Program is at the median, costing EPs approximately $265 per year, or about $5 each week.
American College of Emergency Physicians
Jay A. Kaplan, MD, FACEP, ACEP President
Physician Burnout. Unfortunately, EM leads all specialties in the frequency of physician burnout. Emergency physicians must be aware of burnout, and take proactive steps to avoid it. To help EPs, ACEP has organized an “Emergency Medicine Wellness Week.” Prevention tips include eating well, getting the proper amount of sleep, regular exercise, and improving the work environment. In 2016, Wellness Week ran from January 24 to 30; there is a continuing focus on building resilience and preventing compassion fatigue.
Out of Network (OON) Balance Billing. Insurance companies know that it is solely the cost of insurance premiums that consumers pay attention to, not deductibles or exactly what the insurance covers. Those same insurance companies have been adept at portraying physicians as the cause of “surprise billing.” Emergency physicians need to change the conversation from “surprise billing” to “surprise coverage.” We need to talk about fair coverage for our patients, rather than asking for fair payment for physicians (the latter will follow the former and legislators believe that physicians are already fairly paid). ACEP is considering legal action against CMS and the Center for Consumer Information and Insurance Oversight regarding their final rule on “the greatest of three,” which establishes guidelines for how physicians are to be paid for services rendered.
Pay for Performance and Value-based Reimbursement. ACEP has created a joint task force with the Emergency Department Practice Management Association to create a toolbox for EPs to navigate the changing reimbursement landscape. This includes model legislation and best practices, and there is exploration regarding developing alternative payment models for EM.
Opioid Epidemic. ACEP is a participant in the White House working group exploring this epidemic and identifying strategies to combat this national problem. ACEP has sent a letter to CMS and Health and Human Services (HHS) requesting removal of the pain questions from the Consumer Assessment of Healthcare Providers and Systems (CAHPS) surveys. Emergency physicians should not be penalized on these surveys for not prescribing narcotic analgesics to patients who could be treated appropriately with nonnarcotic medications. ACEP similarly is considering sending a letter to The Joint Commission requesting removal of their emphasis on pain as the “fifth vital sign.”
Mass Casualty Incidents. ACEP has created a “New High-Threat High-Casualty Task Force” to identify best practice recommendations for provision of emergency care in high-threat environments and identify current clinical and operational knowledge gaps surrounding the issue. This in turn will help prioritize future ACEP research objectives based on these gaps. In addition, a white paper is being prepared, highlighting current national efforts and recommending clinical practice guidelines for adults and pediatric patients, as well as a future strategy for ACEP engagement as a national leader in the area of high-threat emergency care.
Diversity. There is a recognized need to increase the diversity in our current and future EM leadership. To that end, ACEP sponsored a Diversity Summit on April 14, 2016 in Dallas to explore these issues and make recommendations.
Emergency Quality Network. ACEP, along with 38 other health care organizations, received a grant in the CMS Transforming Clinical Practice Initiative to help physicians achieve large-scale health transformation. Areas of EM focus include: improving outcomes for patients with sepsis; reducing avoidable imaging in low-risk patients through implementation of ACEP’s Choosing Wisely campaign; and improving the value of ED chest pain evaluation in low-risk patients by reducing avoidable testing and admissions.
Editor’s Note: Part 2 of this article will appear in the May 2016 issue of Emergency Medicine and will feature reports from the Council of Emergency Medicine Residency Directors (CORD), the Emergency Medicine Residents’ Association (EMRA), and the Society for Academic Emergency Medicine (SAEM). Have a comment or question about this article? Let us know: [email protected].

Allegations: Current Trends in Medical Malpractice, Part 2
Most medical malpractice cases are still resolved in a courtroom—typically after years of preparation and personal torment. Yet, overall rates of paid medical malpractice claims among all physicians have been steadily decreasing over the past two decades, with reports showing decreases of 30% to 50% in paid claims since 2000.1-3 At the same time, while median payments and insurance premiums continued to increase until the mid-2000s, they now appear to have plateaued.1
None of these changes occurred in isolation. More than 30 states now have caps on noneconomic or total damages.2 As noted in part 1, since 2000, some states have enacted comprehensive tort reform.4 However, whether these changes in malpractice patterns can be attributed directly to specific policy changes remains a hotly contested issue.
Malpractice Risk in Emergency Medicine
To what extent do the trends in medical malpractice apply to emergency medicine (EM)? While emergency physicians’ (EPs’) perception of malpractice risk ranks higher than any other medical specialty,5 in a review of a large sample of malpractice claims from 1991 through 2005, EPs ranked in the middle among specialties with respect to annual risk of a malpractice claim.6 Moreover, the annual risk of a claim for EPs is just under 8%, compared to 7.4% for all physicians. Yet, for neurosurgery and cardiothoracic surgery—the specialties with the highest overall risk of malpractice claims—the annual risk approaches 20%.6 Regarding payout statistics, less than one-fifth of the claims against EPs resulted in payment.6 In a review of a separate insurance database of closed claims, EPs were named as the primary defendant in only 19% of cases.7
Despite the discrepancies between perceived risk and absolute risk of malpractice claims among EPs, malpractice lawsuits continue to affect the practice of EM. This is evidenced in several surveys, in which the majority of EP participants admitted to practicing “defensive medicine” by ordering tests that were felt to be unnecessary and did so in response to perceived malpractice risk.8-10 Perceived risk also accounts for the significant variation in decision-making in the ED with respect to diagnostic testing and hospitalization of patients.11 One would expect that lowering malpractice risk would result in less so-called unnecessary testing, but whether or not this is truly the case remains to be seen.
Effects of Malpractice Reform
A study by Waxman et al12 on the effects of significant malpractice tort reform in ED care in Texas, Georgia, and South Carolina found no difference in rates of imaging studies, charges, or patient admissions. Furthermore, legislation reform did not increase plaintiff onus to prove proximate “gross negligence” rather than simply a breach from “reasonably skillful and careful” medicine.12 These findings suggest that perception of malpractice risk might simply be serving as a proxy for physicians’ underlying risk tolerance, and be less subject to influence by external forces.
Areas Associated With Malpractice Risk
A number of closed-claim databases attempted to identify the characteristics of patient encounters that can lead to malpractice claims, including patient conditions and sources of error. Diagnostic errors have consistently been found to be the leading cause of malpractice claims, accounting for 28% to 65% of claims, followed by inappropriate management of medical treatment and improper performance of a procedure.7,13-16 A January 2016 benchmarking system report by CRICO Strategies found that 30% of 23,658 medical malpractice claims filed between 2009 through 2013 cited failures in communication as a factor.17 The report also revealed that among these failed communications, those that occurred between health care providers are more likely to result in payout compared to miscommunications between providers and patients.17 This report further noted 70% to 80% of claims closed without payment.7,16 Closed claims were significantly more likely to involve serious injuries or death.7,18 Leading conditions that resulted in claims include myocardial infarction, nonspecific chest pain, symptoms involving the abdomen or pelvis, appendicitis, and orthopedic injuries.7,13,16
Diagnostic Errors
Errors in diagnosis have been attributed to multiple factors in the ED. The two most common factors were failure to order tests and failure to perform an adequate history and physical examination, both of which contribute to rationalization of the practice of defensive medicine under the current tort system.13 Other significant factors associated with errors in diagnosis include misinterpretation of test results or imaging studies and failure to obtain an appropriate consultation. Processes contributing to each of these potential errors include mistakes in judgment, lack of knowledge, miscommunication, and insufficient documentation (Table).15
Strategies for Reducing Malpractice Risk
In part 1, we listed several strategies EPs could adopt to help reduce malpractice risk. In this section, we will discuss in further detail how these strategies help mitigate malpractice claims.
Patient Communication
Open communication with patients is paramount in reducing the risk of a malpractice allegation. Patients are more likely to become angry or frustrated if they sense a physician is not listening to or addressing their concerns. These patients are in turn more likely to file a complaint if they are harmed or experience a bad outcome during their stay in the ED.
Situations in which patients are unable to provide pertinent information also place the EP at significant risk, as the provider must make decisions without full knowledge of the case. Communication with potential resources such as nursing home staff, the patient’s family, and emergency medical service providers to obtain additional information can help reduce risk.
Of course, when evaluating and treating patients, the EP should always take the time to listen to the patient’s concerns during the encounter to ensure his or her needs have been addressed. In the event of a patient allegation or complaint, the EP should make the effort to explore and de-escalate the situation before the patient is discharged.
Discharge Care and Instructions
According to CRICO, premature discharge as a factor in medical malpractice liability results from inadequate assessment and missed opportunities in 41% of diagnosis-related ED cases.16 The following situation illustrates a brief example of such a missed opportunity: A provider makes a diagnosis of urinary tract infection (UTI) in a patient presenting with fever and abdominal pain but whose urinalysis is suspect for contamination and in whom no pelvic examination was performed to rule out other etiologies. When the same patient later returns to the ED with worse abdominal pain, a sterile urine culture invalidates the diagnosis of UTI, and further evaluation leads to a final diagnosis of ruptured appendix.
Prior to discharging any patient, the EP should provide clear and concise at-home care instructions in a manner in which the patient can understand. Clear instructions on how the patient is to manage his or her care after discharge are vital, and failure to do so in terms the patient can understand can create problems if a harmful result occurs. This is especially important in patients with whom there is a communication barrier—eg, language barrier, hearing impairment, cognitive deficit, intoxication, or violent or irrational behavior. In these situations, the EP should always take advantage of available resources and tools such as language lines, interpreters, discharge planners, psychiatric staff, and supportive family members to help reconcile any communication barriers. These measures will in turn optimize patient outcome and reduce the risk of a later malpractice allegation.
Board Certification
All physicians should maintain their respective board certification and specialty training requirements. Efforts in this area help providers to stay up to date in current practice standards and new developments, thus reducing one’s risk of incurring a malpractice claim.
Patient Safety
All members of the care team should engender an environment that is focused on patient safety, including open communication between providers and with nursing staff and technical support teams. Although interruptions can be detrimental to patient care, simply having an understanding of this phenomenon among all staff members can alleviate some of the working stressors in the ED. Effort must be made to create an environment that allows for clarification between nursing staff and physicians without causing undue antagonism. Fostering supportive communication, having a questioning attitude, and seeking clarification can only enhance patient safety.
The importance of the supervisory role of attending physicians to trainees, physician extenders, and nursing staff must be emphasized, and appropriate guidance from the ED attending is germane in keeping patients safe in teaching environments. Additionally, in departments that suffer the burden of high numbers of admitted patient boarders in the ED, attention must be given to the transitional period between decision to admit and termination of ED care and the acquisition of care of the admitting physician. A clear plan of responsibility must be in place for these high-risk situations.
Policies and Procedures
Departmental policies and procedures should be designed to identify and address all late laboratory results data, radiological discrepancies, and culture results in a timely and uniform manner. Since unaddressed results and discrepancies can result in patient harm, patient-callback processes should be designed to reduce risk by addressing these hazards regularly, thoroughly, and in a timely fashion.
Cognitive Biases
An awareness of inherent biases in the medical decision-making process is also helpful to maintain mindfulness in the routine practice of EM and avoid medical errors. The EP should take care not to be influenced by recent events and diagnostic information that is easy to recall or common, and to ensure the differential addresses possibilities beyond the readily available diagnoses. Further, reliance on an existing opinion may be misleading if subsequent judgments are based on this “anchor,” whether it is true or false.
If the data points of the case do not line up as expected, or if there are unexplained outliers, the EP should expand the frame of reference to seek more appropriate possibilities, and avoid attempts to make the data fit a preferred or favored conclusion.
When one fails to recognize that data do not fit the diagnostic presumption, the true diagnosis can be undermined. Such confirmation bias in turn challenges diagnostic success. Hasty judgment without considering and seeking out relevant information can set up diagnostic failure and premature closure.
Remembering the Basics
Finally, providers should follow the basic principles for every patient. Vital signs are vital for a reason, and all abnormal data must be accounted for prior to patient hand off or discharge. Patient turnover is a high-risk occasion, and demands careful attention to case details between the off-going physician, the accepting physician, and the patient.
All patients presenting to the ED for care should leave the ED at their baseline functional level (ie, if they walk independently, they should still walk independently at discharge). If not, the reason should be sought out and clarified with appropriate recommendations for treatment and follow-up.
Patients and staff should always be treated with respect, which in turn will encourage effective communication. Providers should be honest with patients, document truthfully, respect privacy and confidentiality, practice within one’s competence, confirm information, and avoid assumptions. Compassion goes hand in hand with respectful and open communication. Physicians perceived as compassionate and trustworthy are less likely to be the target of a malpractice suit, even when harm has occurred.
Conclusion
Even though the number of paid medical malpractice claims has continued to decrease over the past 20 years, a discrepancy between perceived and absolute risk persists among EPs—one that perpetuates the practice of defensive medicine and continues to affect EM. Despite the current perceptions and climate, EPs can allay their risk of incurring a malpractice claim by employing the strategies outlined above.
1. Mello MM, Studdert DM, Kachalia A. The medical liability climate and prospects for reform. JAMA. 2014;312(20):2146-2155.
2. Paik M, Black B, Hyman DA. The receding tide of medical malpractice: part 1 - national trends. J Empirical Leg Stud. 2013;10(4):612-638.
3. Bishop TF, Ryan AM, Caslino LP. Paid malpractice claims for adverse events in inpatient and outpatient settings. JAMA. 2011;305(23):2427-2431.
4. Kachalia A, Mello MM. New directions in medical liability reform. N Engl J Med. 2011;364(16):
1564-1572.
5. Carrier ER, Reschovsky JD, Mello MM, Mayrell RC, Katz D. Physicians’ fears of malpractice lawsuits are not assured by tort reforms. Health Aff. 2010;29(9):1585-1592.
6. Jena AB, Seabury S, Lakdawalla D, Chandra A. Malpractice risk according to physician specialty. N Engl J Med. 2011;365(7):629-636.
7. Brown TW, McCarthy ML, Kelen GD, Levy F. An epidemiologic study of closed emergency department malpractice claims in a national database of physician malpractice insurers. Acad Emerg Med. 2010;17(5):553-560.
8. Studdert DM, Mello MM, Sage WM, et al. Defensive medicine among high-risk specialist physicians in a volatile malpractice environment. JAMA. 2005;293(21):2609-2617.
9. Bishop TF, Federman AD, Keyhani S. Physicians’ views on defensive medicine: a national survey. Arch Intern Med. 2010;170(12):1081-1083.
10. Massachusetts Medical Society. Investigation of defensive medicine in Massachusetts. November 2008. Available at http://www.massmed.org/defensivemedicine. Accessed March 16, 2016.
11. Katz DA, Williams GC, Brown RL, et al. Emergency physicians’ fear of malpractice in evaluating patient with possible acute cardiac ischemia. Ann Emerg Med. 2005;46(6):525-533.
12. Waxman DA, Greenberg MD, Ridgely MS, Kellermann AL, Heaton P. The effect of malpractice reform on emergency department care. N Engl J Med. 2014;371(16):1518-1525.
13. Kachalia A, Gandhi TK, Puopolo AL, et al. Missed and delayed diagnoses in the emergency department: a study of closed malpractice claims from 4 liability insurers. Ann Emerg Med. 2007;49(2):196-205.
14. Saber Tehrani AS, Lee H, Mathews SC, et al. 25-Year summary of US malpractice claims for diagnostic errors 1986-2010: an analysis from the National Practitioner Data Bank. BMJ Qual Saf. 2013;22(8):672-680.
15. Ross J, Ranum D, Troxel DB. Emergency medicine closed claims study. The Doctors Company. Available at http://www.thedoctors.com/ecm/groups/public/@tdc/@web/@kc/@patientsafety/documents/article/con_id_004776.pdf. Accessed March 16, 2016.
16. Ruoff G, ed. 2011 Annual benchmarking report: malpractice risks in emergency medicine. CRICO strategies. 2012. Available at https://www.rmf.harvard.edu/Strategies/Home/Products-and-Services/Comparative-Data/Annual-Benchmark-Reports. Accessed March 16, 2016.
17. Failures in communication contribute to medical malpractice. January 31, 2016. https://www.rmf.harvard.edu/About-CRICO/Media/Press-Releases/News/2016/February/Failures-in-Communication-Contribute-to-Medical-Malpractice.
18. Studdert DM, Mello MM, Gawande AA, et al. Claims, errors, and compensation payments in medical malpractice litigation. N Engl J Med. 2006;354(19):2024-2033. Accessed March 16, 2016.
Most medical malpractice cases are still resolved in a courtroom—typically after years of preparation and personal torment. Yet, overall rates of paid medical malpractice claims among all physicians have been steadily decreasing over the past two decades, with reports showing decreases of 30% to 50% in paid claims since 2000.1-3 At the same time, while median payments and insurance premiums continued to increase until the mid-2000s, they now appear to have plateaued.1
None of these changes occurred in isolation. More than 30 states now have caps on noneconomic or total damages.2 As noted in part 1, since 2000, some states have enacted comprehensive tort reform.4 However, whether these changes in malpractice patterns can be attributed directly to specific policy changes remains a hotly contested issue.
Malpractice Risk in Emergency Medicine
To what extent do the trends in medical malpractice apply to emergency medicine (EM)? While emergency physicians’ (EPs’) perception of malpractice risk ranks higher than any other medical specialty,5 in a review of a large sample of malpractice claims from 1991 through 2005, EPs ranked in the middle among specialties with respect to annual risk of a malpractice claim.6 Moreover, the annual risk of a claim for EPs is just under 8%, compared to 7.4% for all physicians. Yet, for neurosurgery and cardiothoracic surgery—the specialties with the highest overall risk of malpractice claims—the annual risk approaches 20%.6 Regarding payout statistics, less than one-fifth of the claims against EPs resulted in payment.6 In a review of a separate insurance database of closed claims, EPs were named as the primary defendant in only 19% of cases.7
Despite the discrepancies between perceived risk and absolute risk of malpractice claims among EPs, malpractice lawsuits continue to affect the practice of EM. This is evidenced in several surveys, in which the majority of EP participants admitted to practicing “defensive medicine” by ordering tests that were felt to be unnecessary and did so in response to perceived malpractice risk.8-10 Perceived risk also accounts for the significant variation in decision-making in the ED with respect to diagnostic testing and hospitalization of patients.11 One would expect that lowering malpractice risk would result in less so-called unnecessary testing, but whether or not this is truly the case remains to be seen.
Effects of Malpractice Reform
A study by Waxman et al12 on the effects of significant malpractice tort reform in ED care in Texas, Georgia, and South Carolina found no difference in rates of imaging studies, charges, or patient admissions. Furthermore, legislation reform did not increase plaintiff onus to prove proximate “gross negligence” rather than simply a breach from “reasonably skillful and careful” medicine.12 These findings suggest that perception of malpractice risk might simply be serving as a proxy for physicians’ underlying risk tolerance, and be less subject to influence by external forces.
Areas Associated With Malpractice Risk
A number of closed-claim databases attempted to identify the characteristics of patient encounters that can lead to malpractice claims, including patient conditions and sources of error. Diagnostic errors have consistently been found to be the leading cause of malpractice claims, accounting for 28% to 65% of claims, followed by inappropriate management of medical treatment and improper performance of a procedure.7,13-16 A January 2016 benchmarking system report by CRICO Strategies found that 30% of 23,658 medical malpractice claims filed between 2009 through 2013 cited failures in communication as a factor.17 The report also revealed that among these failed communications, those that occurred between health care providers are more likely to result in payout compared to miscommunications between providers and patients.17 This report further noted 70% to 80% of claims closed without payment.7,16 Closed claims were significantly more likely to involve serious injuries or death.7,18 Leading conditions that resulted in claims include myocardial infarction, nonspecific chest pain, symptoms involving the abdomen or pelvis, appendicitis, and orthopedic injuries.7,13,16
Diagnostic Errors
Errors in diagnosis have been attributed to multiple factors in the ED. The two most common factors were failure to order tests and failure to perform an adequate history and physical examination, both of which contribute to rationalization of the practice of defensive medicine under the current tort system.13 Other significant factors associated with errors in diagnosis include misinterpretation of test results or imaging studies and failure to obtain an appropriate consultation. Processes contributing to each of these potential errors include mistakes in judgment, lack of knowledge, miscommunication, and insufficient documentation (Table).15
Strategies for Reducing Malpractice Risk
In part 1, we listed several strategies EPs could adopt to help reduce malpractice risk. In this section, we will discuss in further detail how these strategies help mitigate malpractice claims.
Patient Communication
Open communication with patients is paramount in reducing the risk of a malpractice allegation. Patients are more likely to become angry or frustrated if they sense a physician is not listening to or addressing their concerns. These patients are in turn more likely to file a complaint if they are harmed or experience a bad outcome during their stay in the ED.
Situations in which patients are unable to provide pertinent information also place the EP at significant risk, as the provider must make decisions without full knowledge of the case. Communication with potential resources such as nursing home staff, the patient’s family, and emergency medical service providers to obtain additional information can help reduce risk.
Of course, when evaluating and treating patients, the EP should always take the time to listen to the patient’s concerns during the encounter to ensure his or her needs have been addressed. In the event of a patient allegation or complaint, the EP should make the effort to explore and de-escalate the situation before the patient is discharged.
Discharge Care and Instructions
According to CRICO, premature discharge as a factor in medical malpractice liability results from inadequate assessment and missed opportunities in 41% of diagnosis-related ED cases.16 The following situation illustrates a brief example of such a missed opportunity: A provider makes a diagnosis of urinary tract infection (UTI) in a patient presenting with fever and abdominal pain but whose urinalysis is suspect for contamination and in whom no pelvic examination was performed to rule out other etiologies. When the same patient later returns to the ED with worse abdominal pain, a sterile urine culture invalidates the diagnosis of UTI, and further evaluation leads to a final diagnosis of ruptured appendix.
Prior to discharging any patient, the EP should provide clear and concise at-home care instructions in a manner in which the patient can understand. Clear instructions on how the patient is to manage his or her care after discharge are vital, and failure to do so in terms the patient can understand can create problems if a harmful result occurs. This is especially important in patients with whom there is a communication barrier—eg, language barrier, hearing impairment, cognitive deficit, intoxication, or violent or irrational behavior. In these situations, the EP should always take advantage of available resources and tools such as language lines, interpreters, discharge planners, psychiatric staff, and supportive family members to help reconcile any communication barriers. These measures will in turn optimize patient outcome and reduce the risk of a later malpractice allegation.
Board Certification
All physicians should maintain their respective board certification and specialty training requirements. Efforts in this area help providers to stay up to date in current practice standards and new developments, thus reducing one’s risk of incurring a malpractice claim.
Patient Safety
All members of the care team should engender an environment that is focused on patient safety, including open communication between providers and with nursing staff and technical support teams. Although interruptions can be detrimental to patient care, simply having an understanding of this phenomenon among all staff members can alleviate some of the working stressors in the ED. Effort must be made to create an environment that allows for clarification between nursing staff and physicians without causing undue antagonism. Fostering supportive communication, having a questioning attitude, and seeking clarification can only enhance patient safety.
The importance of the supervisory role of attending physicians to trainees, physician extenders, and nursing staff must be emphasized, and appropriate guidance from the ED attending is germane in keeping patients safe in teaching environments. Additionally, in departments that suffer the burden of high numbers of admitted patient boarders in the ED, attention must be given to the transitional period between decision to admit and termination of ED care and the acquisition of care of the admitting physician. A clear plan of responsibility must be in place for these high-risk situations.
Policies and Procedures
Departmental policies and procedures should be designed to identify and address all late laboratory results data, radiological discrepancies, and culture results in a timely and uniform manner. Since unaddressed results and discrepancies can result in patient harm, patient-callback processes should be designed to reduce risk by addressing these hazards regularly, thoroughly, and in a timely fashion.
Cognitive Biases
An awareness of inherent biases in the medical decision-making process is also helpful to maintain mindfulness in the routine practice of EM and avoid medical errors. The EP should take care not to be influenced by recent events and diagnostic information that is easy to recall or common, and to ensure the differential addresses possibilities beyond the readily available diagnoses. Further, reliance on an existing opinion may be misleading if subsequent judgments are based on this “anchor,” whether it is true or false.
If the data points of the case do not line up as expected, or if there are unexplained outliers, the EP should expand the frame of reference to seek more appropriate possibilities, and avoid attempts to make the data fit a preferred or favored conclusion.
When one fails to recognize that data do not fit the diagnostic presumption, the true diagnosis can be undermined. Such confirmation bias in turn challenges diagnostic success. Hasty judgment without considering and seeking out relevant information can set up diagnostic failure and premature closure.
Remembering the Basics
Finally, providers should follow the basic principles for every patient. Vital signs are vital for a reason, and all abnormal data must be accounted for prior to patient hand off or discharge. Patient turnover is a high-risk occasion, and demands careful attention to case details between the off-going physician, the accepting physician, and the patient.
All patients presenting to the ED for care should leave the ED at their baseline functional level (ie, if they walk independently, they should still walk independently at discharge). If not, the reason should be sought out and clarified with appropriate recommendations for treatment and follow-up.
Patients and staff should always be treated with respect, which in turn will encourage effective communication. Providers should be honest with patients, document truthfully, respect privacy and confidentiality, practice within one’s competence, confirm information, and avoid assumptions. Compassion goes hand in hand with respectful and open communication. Physicians perceived as compassionate and trustworthy are less likely to be the target of a malpractice suit, even when harm has occurred.
Conclusion
Even though the number of paid medical malpractice claims has continued to decrease over the past 20 years, a discrepancy between perceived and absolute risk persists among EPs—one that perpetuates the practice of defensive medicine and continues to affect EM. Despite the current perceptions and climate, EPs can allay their risk of incurring a malpractice claim by employing the strategies outlined above.
1. Mello MM, Studdert DM, Kachalia A. The medical liability climate and prospects for reform. JAMA. 2014;312(20):2146-2155.
2. Paik M, Black B, Hyman DA. The receding tide of medical malpractice: part 1 - national trends. J Empirical Leg Stud. 2013;10(4):612-638.
3. Bishop TF, Ryan AM, Caslino LP. Paid malpractice claims for adverse events in inpatient and outpatient settings. JAMA. 2011;305(23):2427-2431.
4. Kachalia A, Mello MM. New directions in medical liability reform. N Engl J Med. 2011;364(16):
1564-1572.
5. Carrier ER, Reschovsky JD, Mello MM, Mayrell RC, Katz D. Physicians’ fears of malpractice lawsuits are not assured by tort reforms. Health Aff. 2010;29(9):1585-1592.
6. Jena AB, Seabury S, Lakdawalla D, Chandra A. Malpractice risk according to physician specialty. N Engl J Med. 2011;365(7):629-636.
7. Brown TW, McCarthy ML, Kelen GD, Levy F. An epidemiologic study of closed emergency department malpractice claims in a national database of physician malpractice insurers. Acad Emerg Med. 2010;17(5):553-560.
8. Studdert DM, Mello MM, Sage WM, et al. Defensive medicine among high-risk specialist physicians in a volatile malpractice environment. JAMA. 2005;293(21):2609-2617.
9. Bishop TF, Federman AD, Keyhani S. Physicians’ views on defensive medicine: a national survey. Arch Intern Med. 2010;170(12):1081-1083.
10. Massachusetts Medical Society. Investigation of defensive medicine in Massachusetts. November 2008. Available at http://www.massmed.org/defensivemedicine. Accessed March 16, 2016.
11. Katz DA, Williams GC, Brown RL, et al. Emergency physicians’ fear of malpractice in evaluating patient with possible acute cardiac ischemia. Ann Emerg Med. 2005;46(6):525-533.
12. Waxman DA, Greenberg MD, Ridgely MS, Kellermann AL, Heaton P. The effect of malpractice reform on emergency department care. N Engl J Med. 2014;371(16):1518-1525.
13. Kachalia A, Gandhi TK, Puopolo AL, et al. Missed and delayed diagnoses in the emergency department: a study of closed malpractice claims from 4 liability insurers. Ann Emerg Med. 2007;49(2):196-205.
14. Saber Tehrani AS, Lee H, Mathews SC, et al. 25-Year summary of US malpractice claims for diagnostic errors 1986-2010: an analysis from the National Practitioner Data Bank. BMJ Qual Saf. 2013;22(8):672-680.
15. Ross J, Ranum D, Troxel DB. Emergency medicine closed claims study. The Doctors Company. Available at http://www.thedoctors.com/ecm/groups/public/@tdc/@web/@kc/@patientsafety/documents/article/con_id_004776.pdf. Accessed March 16, 2016.
16. Ruoff G, ed. 2011 Annual benchmarking report: malpractice risks in emergency medicine. CRICO strategies. 2012. Available at https://www.rmf.harvard.edu/Strategies/Home/Products-and-Services/Comparative-Data/Annual-Benchmark-Reports. Accessed March 16, 2016.
17. Failures in communication contribute to medical malpractice. January 31, 2016. https://www.rmf.harvard.edu/About-CRICO/Media/Press-Releases/News/2016/February/Failures-in-Communication-Contribute-to-Medical-Malpractice.
18. Studdert DM, Mello MM, Gawande AA, et al. Claims, errors, and compensation payments in medical malpractice litigation. N Engl J Med. 2006;354(19):2024-2033. Accessed March 16, 2016.