User login
PAs: Does Your Job Fulfill Your Expectations?
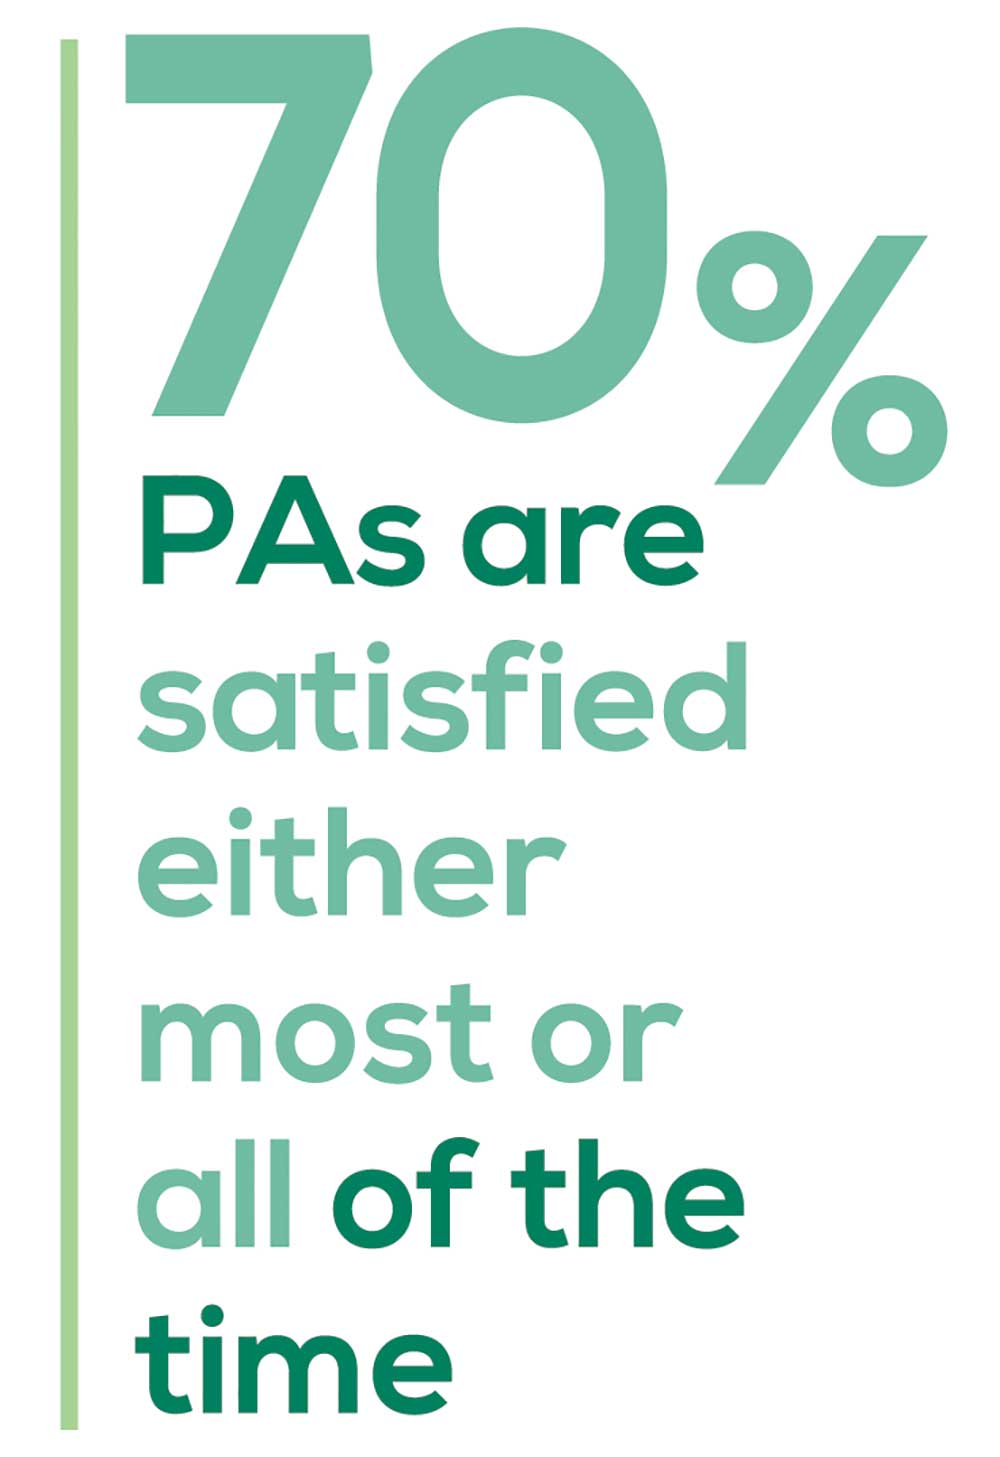
“I have the best job in the world.” This statement sums up how your colleagues feel about being a PA. Although there are certainly problems that deserve attention, the vast majority of clinicians, who are highly educated and practice in all specialties, state that they would re-enter the field if choosing again.
On the following pages, we focus on the details of the survey results, with breakouts by specialty, region, and practice setting. Be sure to check out which benefits your colleagues are getting, how much they’re being reimbursed for continuing medical education, information about salary by gender and time spent during the workweek, and much more. Participants, invited to comment, have provided several illuminating quotes, which we’ve included throughout the article, indicating what it’s like to be “in the trenches.”
WOULD YOU REPEAT THIS?
To get to the heart of the matter, we asked our survey takers “If you were to do it again, would you choose…”
- The same career
- The same educational preparation
- The same practice setting
To see what your colleagues said, go to the next page

The majority of your peers gave an enthusiastic thumbs up to PA practice as a profession choice. Knowing what you know now, 86% of you agreed that you would follow the same career path today as when you entered practice, which is up 5% from last year.
Educational preparation came in for a ringing endorsement, increasing since last year’s survey results (a 3% increase), and practice setting remained virtually the same.
Of PAs in practice between < 1 and 5 years, 94% felt their educational training was adequate; 53% felt their current responsibilities matched their expectations accurately; and 74% said their career expectations were met.
WOULD YOU TAKE A NEW JOB TODAY?
Continuing to probe about your level of satisfaction, we asked how you feel about changing your job. The answer choices were, “I would…”
- Change my job if I could get a better one (ie, better paid)
- Take any other job in which I could earn as much as I do now (ie, Yes, to leave the profession)
- Change both my job and my occupation (ie, I am burned out)
- Not make any changes (ie, No, not for any reason)
We also asked you how many times you’ve changed jobs since graduating from your PA program. The 4 answer choices ranged from “None” to “More than 3 times.” The final question asked which factors influence your decision about seeking/accepting a new position, allowing more than one choice from the list below.
- Salary/compensation
- Options for supplemental income
- Greater independence/more autonomy
- Opportunities for professional growth/development
- Formal career ladder for advancement
- Defined career path
- Recognition and appreciation
- Schedule flexibility
- Geographic location
- Access to and subsidy for more educational opportunities
- Employer reimbursement of school loans
- Specific state scope of practice and licensure law
- Work-life balance, including addressing burnout
- Working conditions
- Avoid toxic coworkers
- Top-of-the-line tools
- Telecommuting
- Cost of living
- Opportunity for outdoor activities/lifestyle
To see what your colleagues said, go to the next page
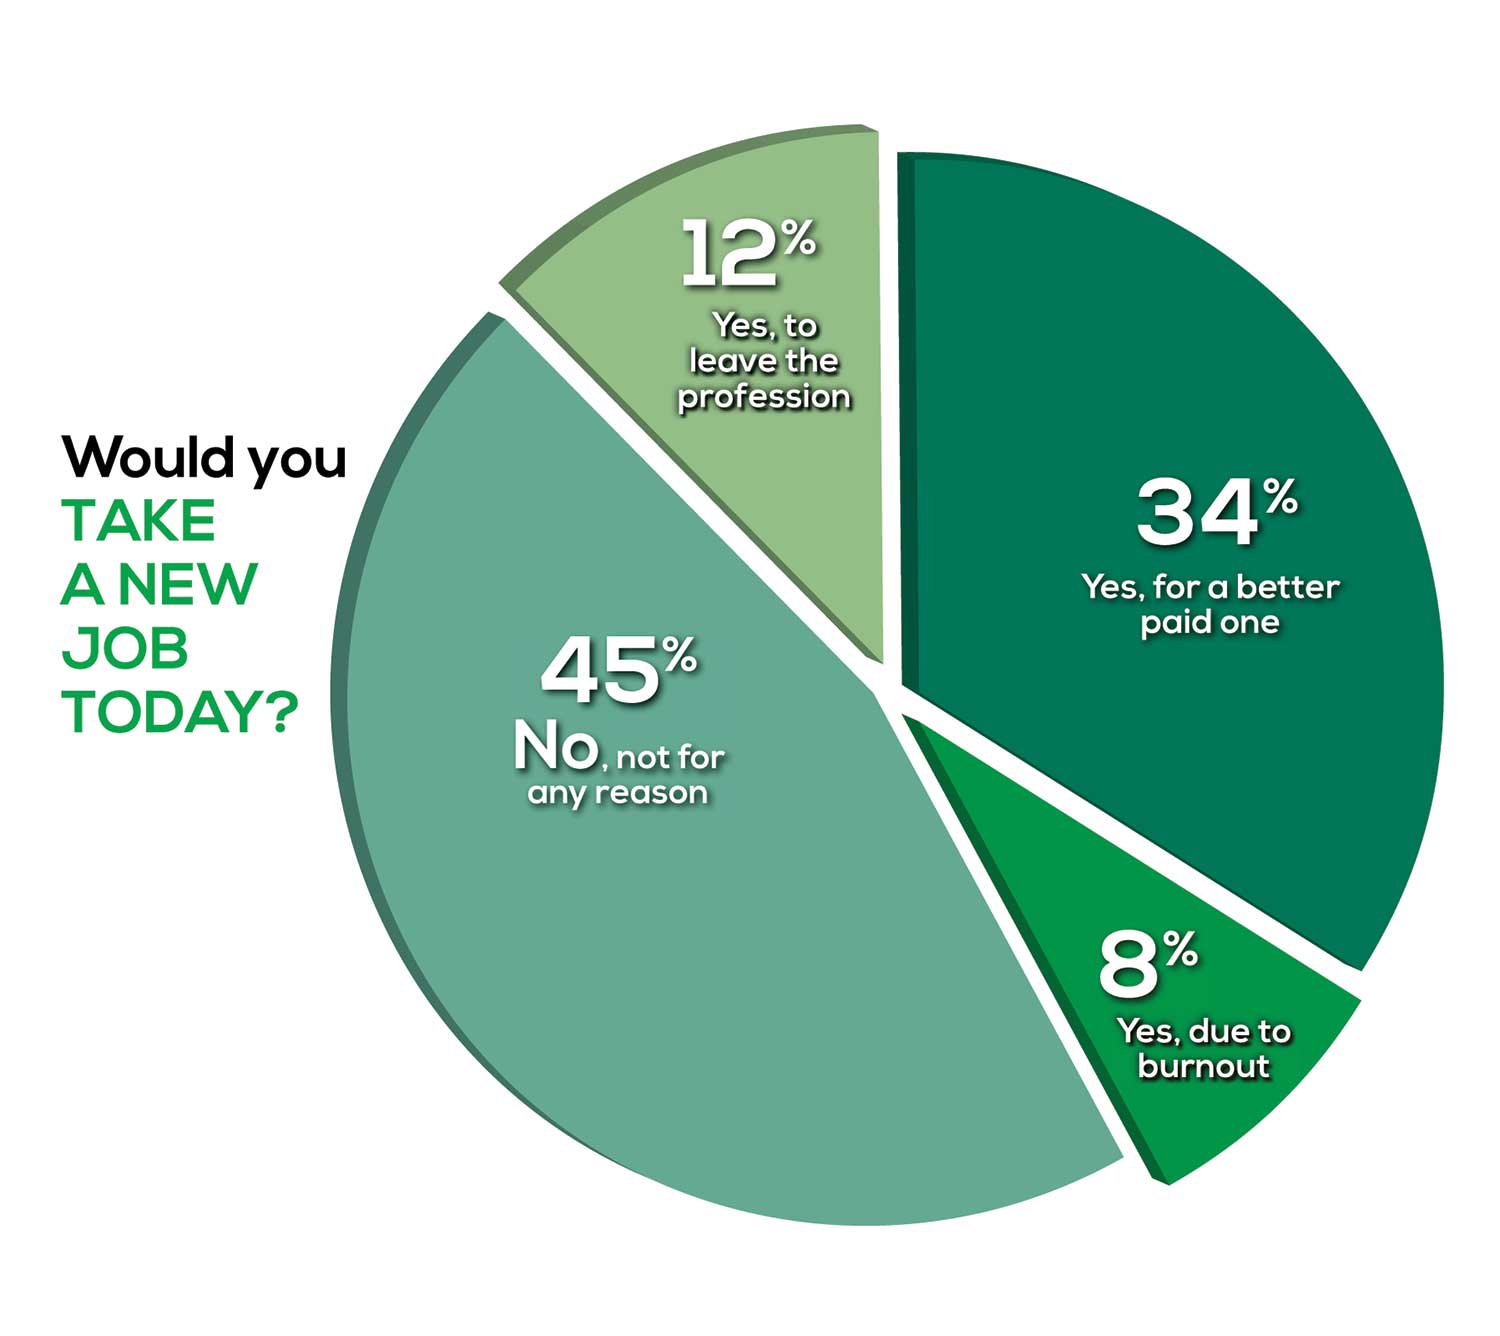
Compared to last year, PAs are 4% more likely to stay with their current job, stating that they would not make any changes, with 4% less likely to leave even if a higher salary were on offer. This is supported by the responses that indicate a fewer number of PAs (27%) have changed jobs at the highest rate (> 3 times) compared to 31% last year.
Although 19% of PAs have never changed jobs, 33% have changed 2 or 3 times, and 27% have changed more 3 times (down 4% from last year). However, more PAs report feeling burned out (up 2% from last year) and wish to leave for another profession (up 6% from last year) compared to last year.
Respondents indicated that the following 4 factors would strongly influence their decision to seek or accept a new position:
- Salary/compensation: 84%
- Work-life balance: 72%
- Schedule flexibility: 68%
- Working conditions: 64%
WHAT MAKES YOU MOST SATISFIED WITH YOUR WORK?
As you are aware, level of satisfaction depends on each of the following, which we asked respondents to rank from 1 to 5.
- Relationships with your colleagues (health care providers and clerical/administrative personnel)
- Quality and duration of patient relationships
- Respect received from patients, their families, and your community
- Ability to make a difference and provide significant help to patients, their families, and your community
To see what your colleagues said, go to the next page

Echoing the survey results—which ranked “Making a difference and providing significant help” as the topmost source of job satisfaction—one of your colleagues commented that, “Ability to offer meaningful support to client needs” affected their satisfaction. On the other hand, though, one clinician wrote, “I am starting to decrease my time in urgent care because I’m seeing more often that administration thinks we are selling a good, not a service—and because of lack of respect by patients as well.”
Compared to last year, the changes in response are
3% decrease: Making a difference and providing significant help
No change: Respect received from patients and their families
6% increase: Relationships with your colleagues
2% increase: Quality and duration of patient relationships
MOST SATISFIED BY SPECIALTY
Knowing that certain specialties offer more advantages than others, we presented a list of 19 medical specialties, asking which is your primary one. We also asked how often you typically feel satisfied with your job, with these answer choices.
- Never
- Occasionally
- About half the time
- Most of the time
- Always
To see what your colleagues said, go to the next page
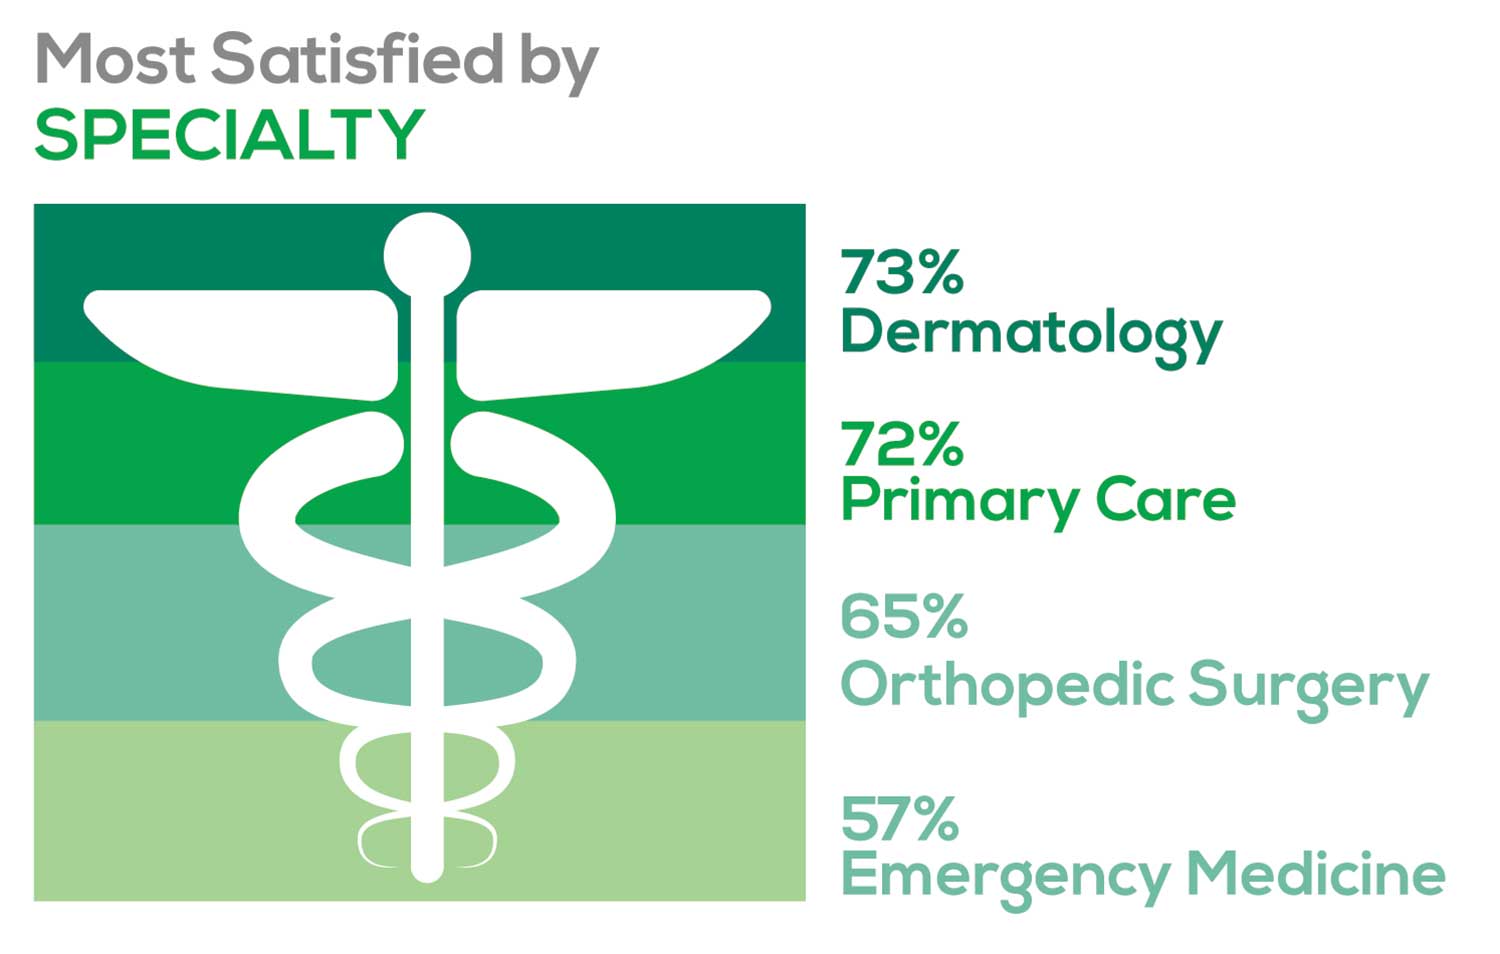
- Dermatology: 73%, a 9% decrease over last year
- Primary Care: 72%, virtually unchanged from last year
- Orthopedic Surgery: 65%, a new entry this year
- Emergency Medicine: 57%, an 8% decrease over last year
As one clinician commented, being “First assistant in surgery” makes a difference in their job satisfaction.
MOST SATISFIED BY PRACTICE SETTING
Working conditions and coworker collegiality are integral to job satisfaction. To learn more about these factors, we asked you to identify the practice settings where you work.
- Academic setting (faculty); school/college health services
- Hospital: inpatient care; outpatient setting or community clinic
- Locum
- Physician practice: solo; single-specialty; multi-specialty
- Public health/occupational health setting; military/government
- Retail/convenient care; urgent care clinic
- Skilled nursing/long-term care facility
We also asked how often you typically feel satisfied with your job, with 5 answer choices ranging from “Never” to “Always.”
To see what your colleagues said, go to the next page
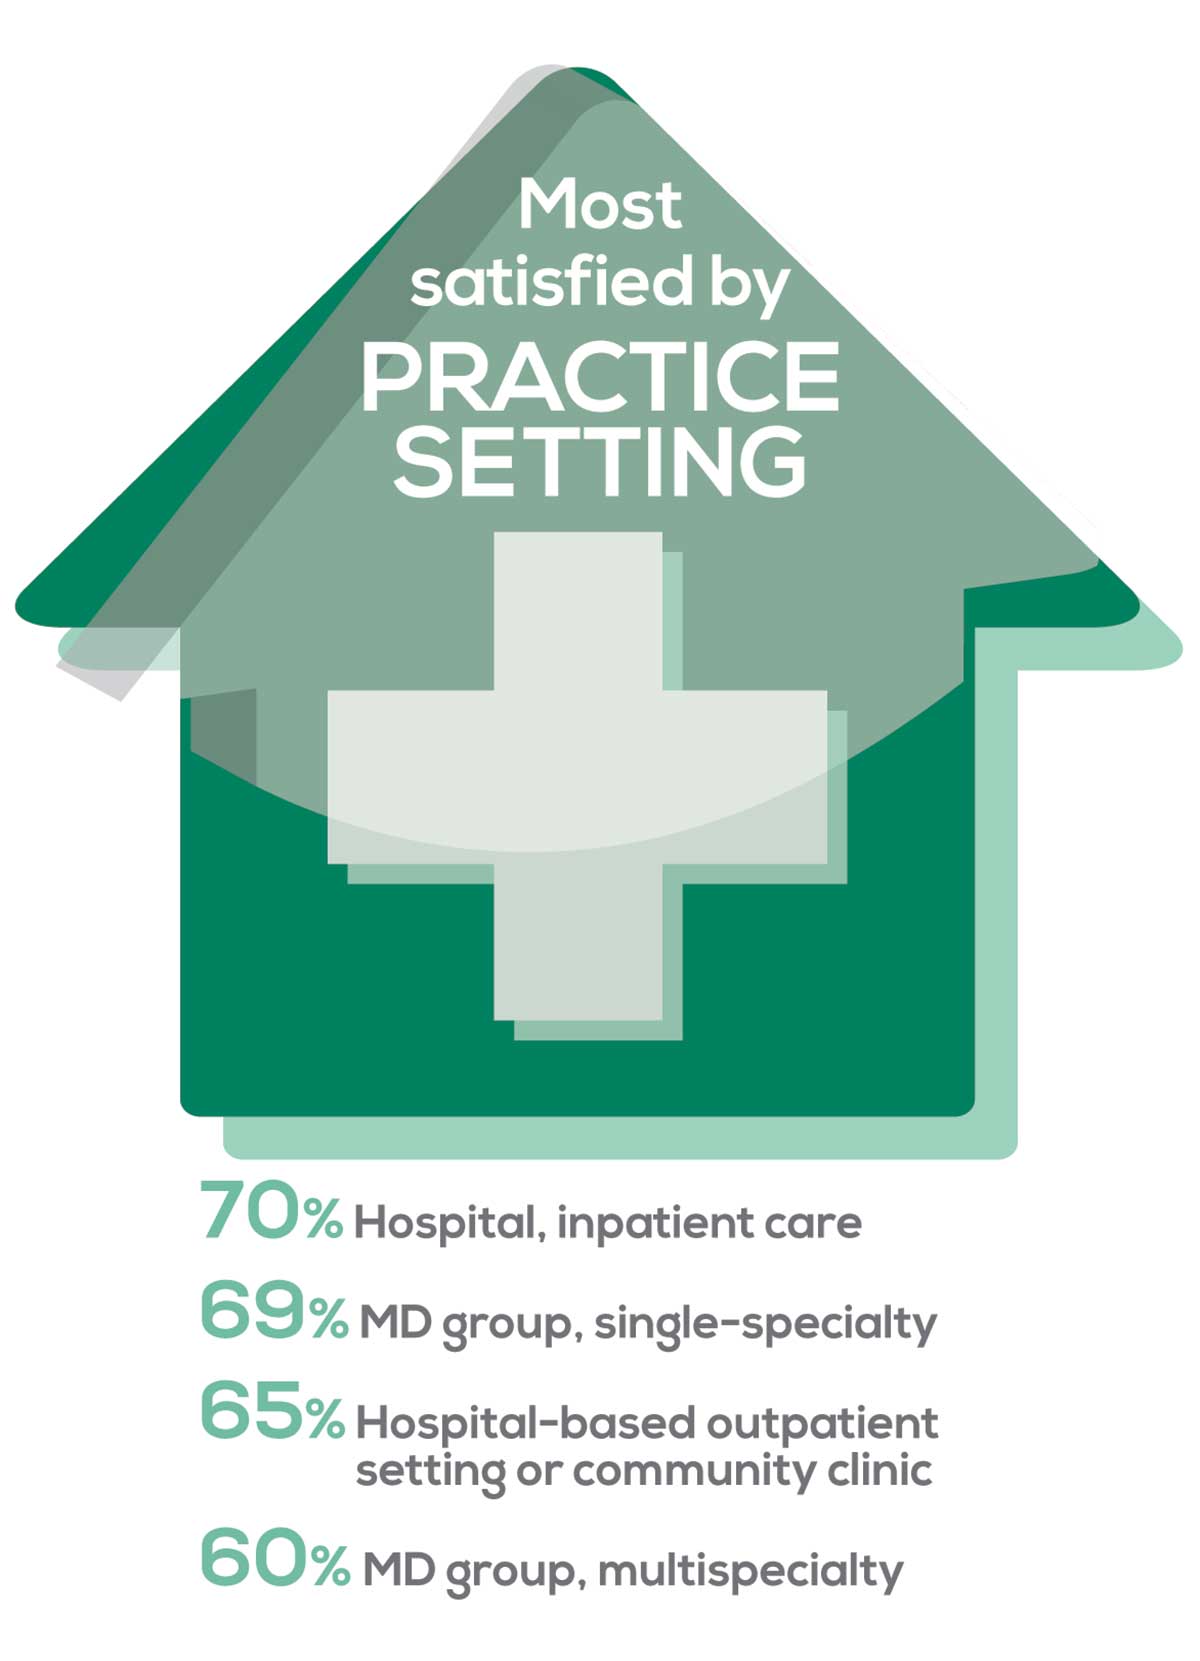
95% of PA respondents work as an employee; of these, 41% work in hospitals, and 31% work in physician offices.1 Therefore, it is gratifying to see that hospital settings and physician groups are satisfying places to work. In addition, this data has not changed significantly since last year.
- US Department of Health and Human Services, Health Resources and Services Administration, The U.S. Health Workforce Chartbook. Rockville, Maryland: U.S. Department of Health and Human Services, 2018.
BENEFITS
As you are aware, having access to the right benefits can go a long way to increasing job satisfaction. In addition to salary as a choice, we listed 30 benefits choices—insurance coverage, additional compensation opportunities, reimbursements, and other—asking which are offered by your employer (access) and which, in lieu of a modest increase in salary, are most important regardless of access. Your responses allowed us to identify the top 7 among your peers.
To see what your colleagues said, go to the next page
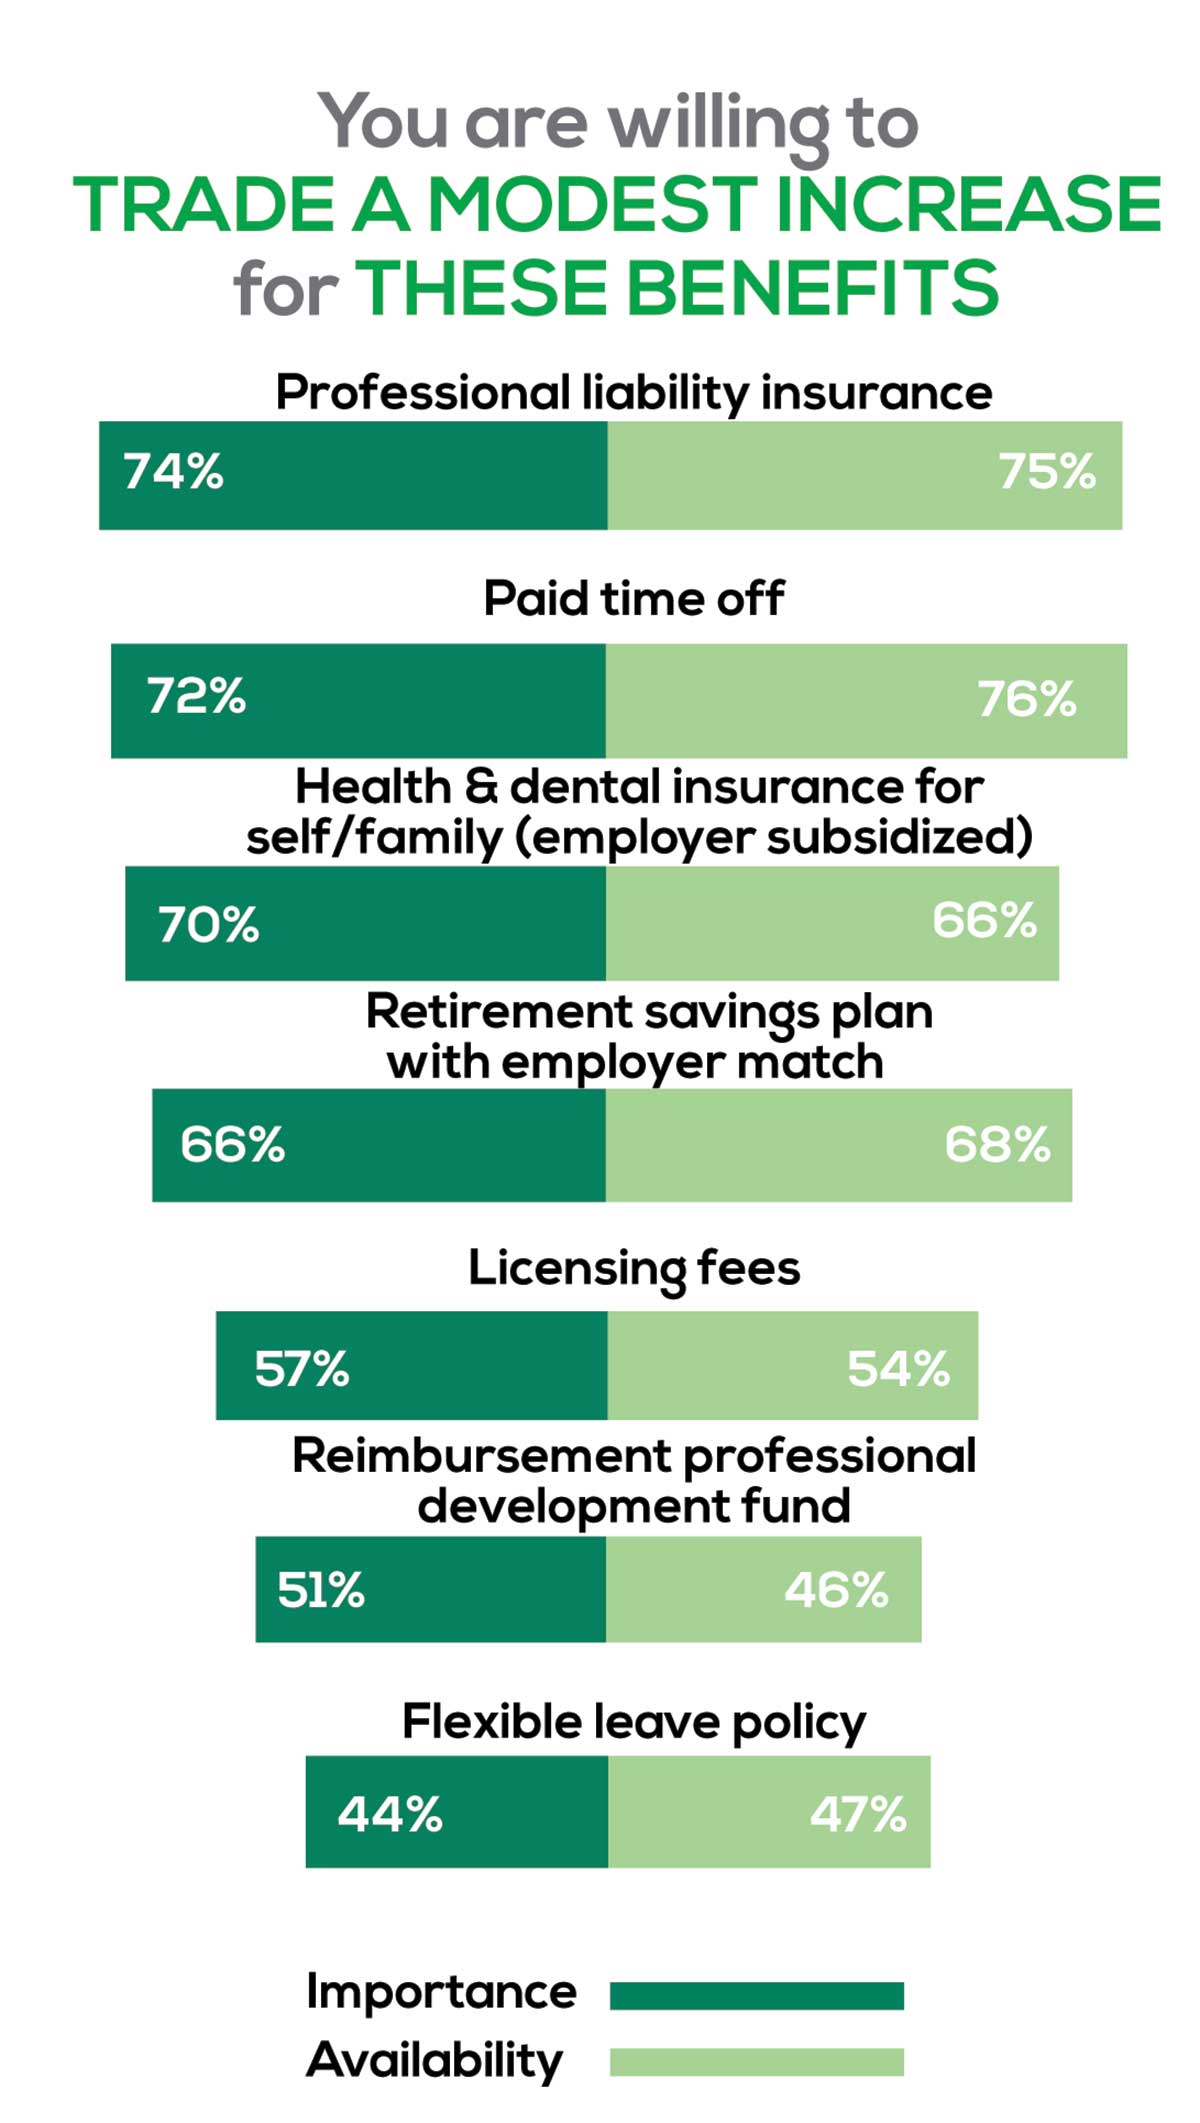
You are willing to trade a modest increase in salary for the following important benefits whether you are a new job seeker or an experienced practitioner.
- Compensation: Paid time off, retirement saving plan with employer match
- Insurance coverage: Professional liability insurance, health & dental insurance for self/family (employer subsidized)
- Reimbursements: Licensing fees, professional development fund
- Other: Flexible leave policy
MOST SATISFIED BY REGION
Location, location, location. Where you work depends in part on where your family is; in part on what jobs are available; what affects your commute, taxes and take home pay; and hence your satisfaction. So, we asked where you work—West, Midwest, Northeast, or South—and paired the data with responses to the question about how often you typically feel satisfied with your job, with 5 answer choices ranging from “Never” to “Always.”
To see what your colleagues said, go to the next page
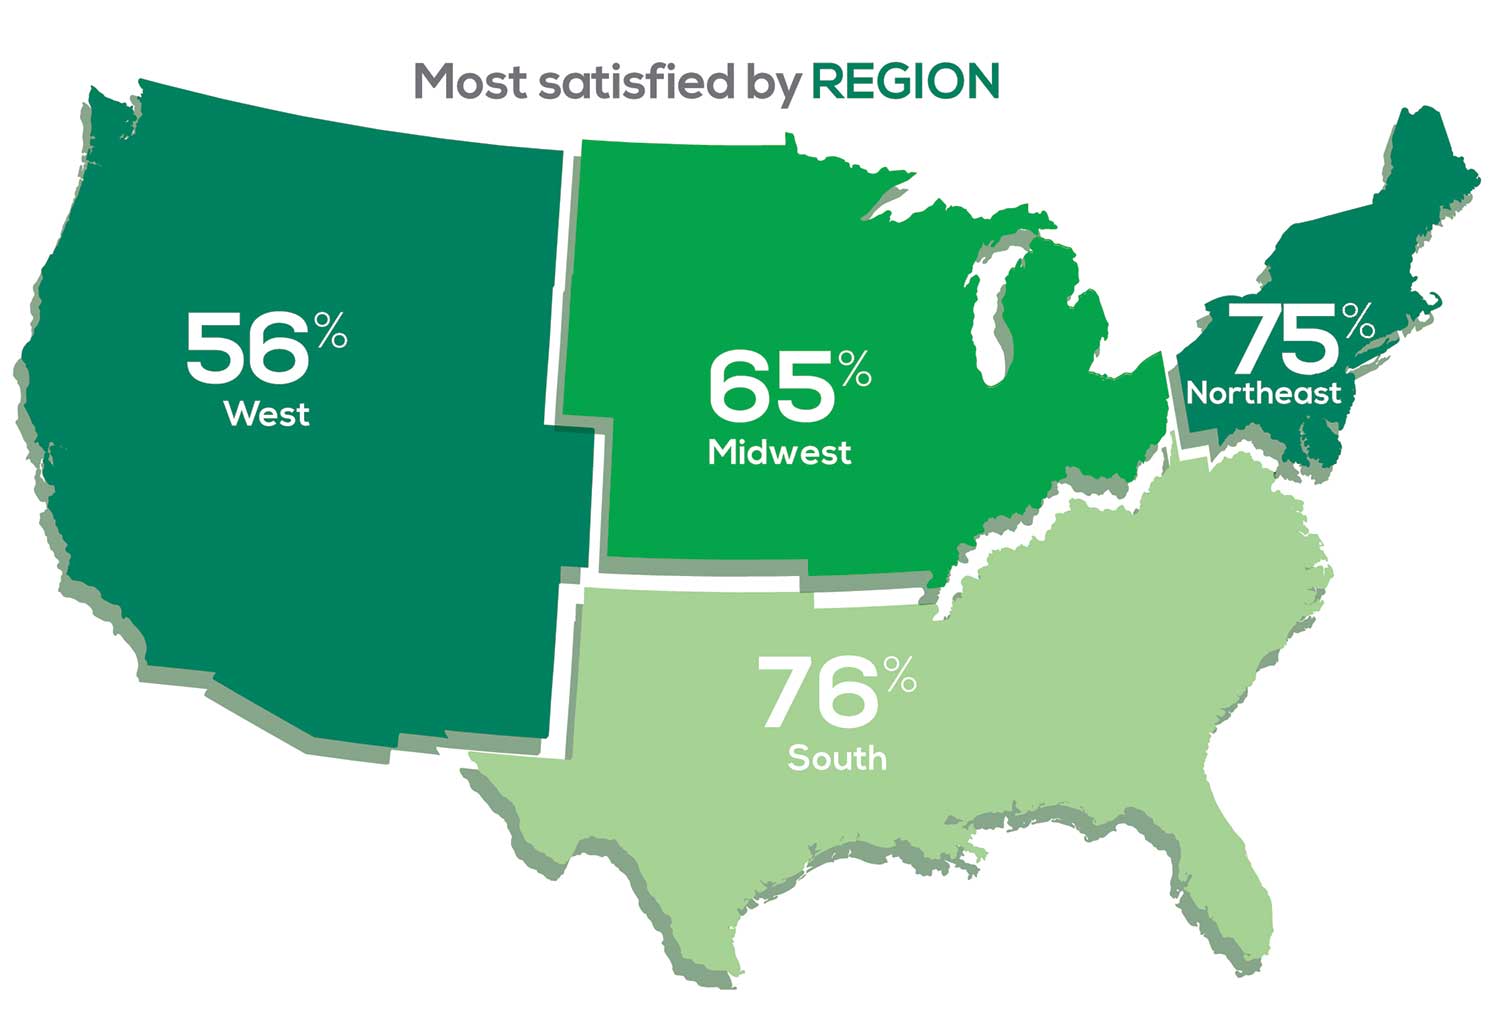
Geographic location is among the factors that influence the decision about seeking or accepting a new job for 53% of PA respondents. Compared to last year, satisfaction levels by region were
- 7% higher than last year in the Northeast
- 5% higher than last year in the South
- 12% lower than last year in the Midwest
- 17% lower than last year in the West
with 27% of PAs practicing in the Northeast; 32% in the South; 21% in the Midwest, and 19% in the West. 76% of PAs working in the South are “most of the time/always” satisfied with their job.
When base salaries are adjusted for cost of living, the top 10 ranked states are, from first to 10th, Oklahoma, Arkansas, Ohio, Texas, Michigan, Indiana, Iowa, New Mexico, Mississippi, and South Dakota.1
- American Academy of PAs. 2019 AAPA Salary Report. Alexandria, VA; 2019.
SALARY
Because you indicated that salary is second in importance only to professional liability insurance coverage as part of a desirable compensation package, we asked you to tell us what your salary bracket is. The amounts ranged from < $50,000 to > $175,000 per year (in $25,000 increments). Combining the responses to this question with those asking about gender and specialty, we are able to tie these factors together for you.
To see what your colleagues said, go to the next page
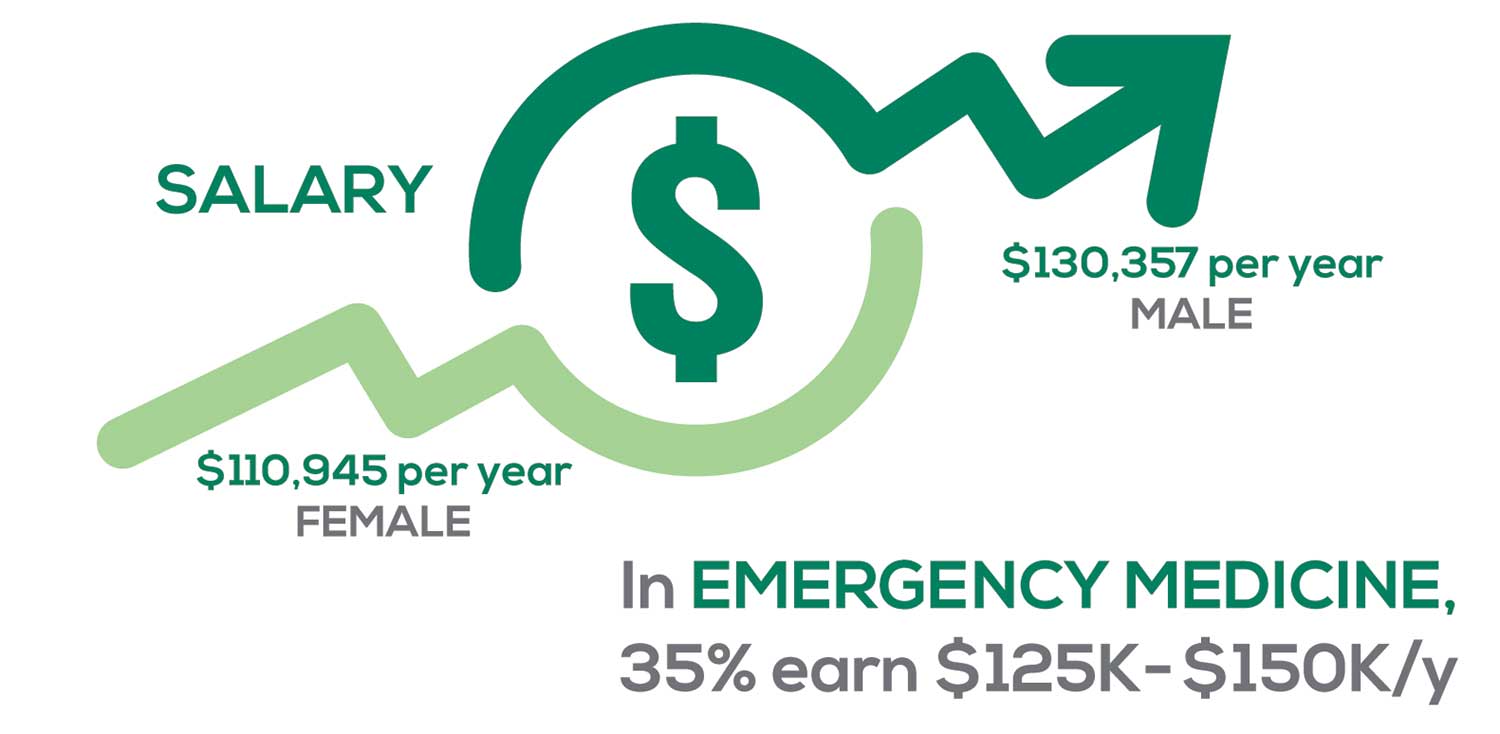
Approximately 5% of PAs earn $50K to $75K per year; 36%, earn $100K to $125K per year; and 5% earn > $175K per year. Similar to responses of previous years, women earn less than men in the PA profession.
PAs practicing in Emergency Medicine (EM) are the most highly compensated, with their median compensation being almost $117K.1 In fact, among those in EM, we found that 35% earn between $125K and $150K per year, up from 27% from last year. Clinicians working in the emergency room encounter more stressors (a clinician noted “Abuse of the emergency room by patients with ridiculous complaints” as a source of dissatisfaction) than those encountered in other specialties, which may be related to the higher compensation.
Although most PAs feel they are adequately compensated, we found that of those who practice in Family Medicine, 19% earn less than $75K per year, up from 6% from last year.
- American Academy of PAs. 2019 AAPA Salary Report. Alexandria, VA; 2019.
WORKWEEK
Job satisfaction, and its opposite, burnout are related to your workload (ie, what you do and how much autonomy you have in deciding how to proceed). To help us evaluate these factors, we asked your colleagues to indicate how many hours per week are typically spent in direct (examine/diagnose/treat) and indirect patient care (perform and interpret labs, x-rays, refill prescriptions, etc.), administrative duties, meetings, and teaching.
We were also interested in whether you assess, treat, and manage decisions
- Independently/by yourself
- In direct contact (in person or by phone) with a collaborating physician
- In consultation with a specialist when providing patient care.
Multiple answer choices were permitted.
To see what your colleagues said, go to the next page
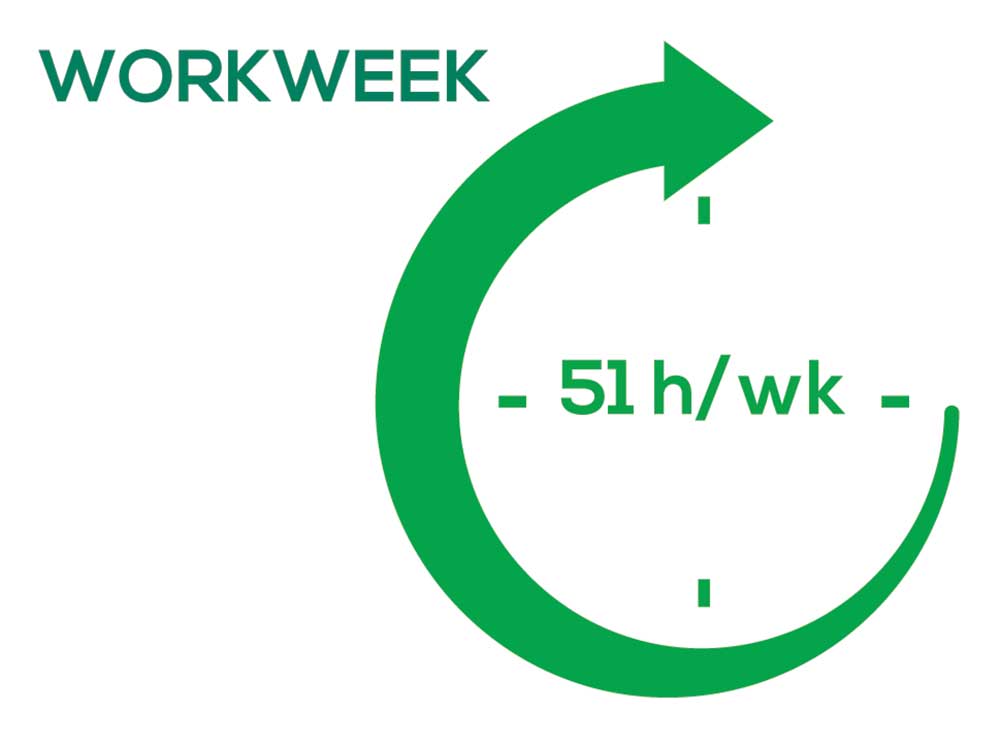
As you can imagine, workload is a very hot topic. In response to, “What else affects your job satisfaction?” the greatest number of comments related to electronic charting and data collection. These activities are felt to demand so much time and effort that it takes away from patient care. The survey responses support this: Compared to last year, although the number of hours worked is the same this year, PAs now spend 1 hour less per week on patient care (direct and indirect) and 1 hour more on other duties (administrative and teaching). As one clinician put it, “…availability of medical assistant/administrative support is huge” in alleviating the sense of being overworked or overextended.
Aside from work hours, clinicians told us they seek positions that allow them “input on all issues related to practice” and flexibility on “what/who I am allowed to treat.” According to the survey, when providing patient care,
- 84% of PAs assess, treat, and manage decisions independently
- 37% collaborate with a physician
- 19% consult with a specialist
supporting the fact that 58% of PAs are satisfied most of the time; 12% are always satisfied.
A side note: Of the 50% of PAs who responded that they are involved in teaching students (78% of whom are PAs), they spend approximately 4 hours a week,
- Either as a clinical preceptor (35%)
- In the classroom (5%)
- Or both (10%).
CME REIMBURSEMENT
As we know, PAs earn continuing medical education (CME) credits in order to maintain certification. Therefore, we asked you to indicate how much financial reimbursement you receive annually for CME; answer choices range from $0 to > $2,000 per year (in $500 increments). We also queried you about how much time you are allotted annually for CME; choices were from “None” to “More than 5 weeks.”
To see what your colleagues said, go to the next page
Many of your colleagues responded to the question “What else affects your job satisfaction?” with “Support for continuing learning” and “Educational opportunities.” This is reflected by 51% of survey respondents who stated that “Reimbursement for professional development” was an important benefit (see “Top 7 Benefits” above).
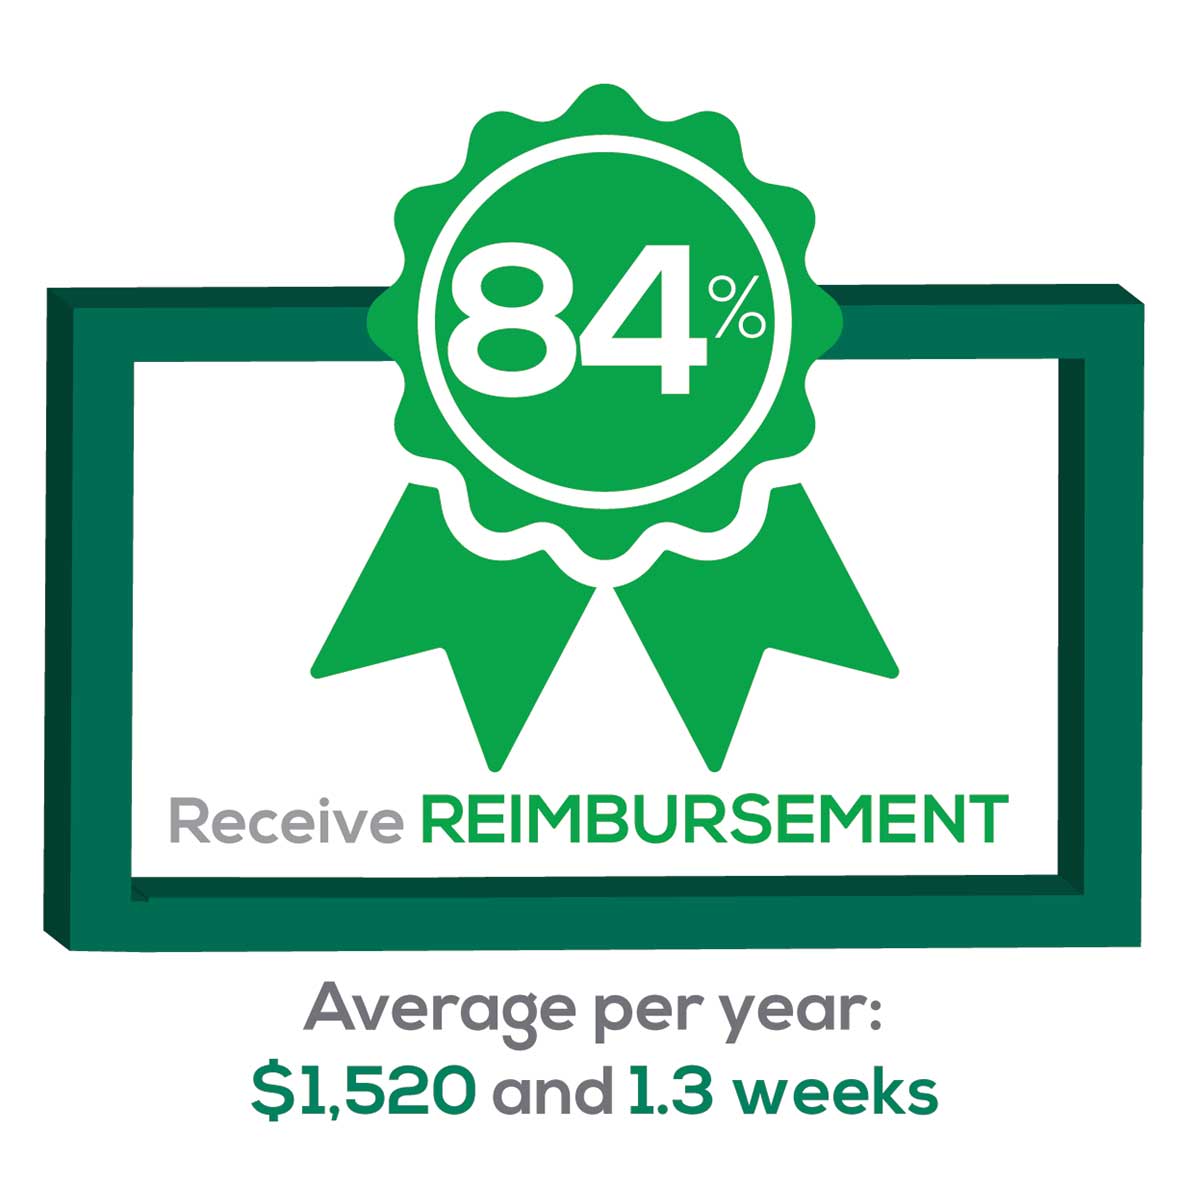
This year, 84% of respondents reported receiving remuneration—either money or time allowed or both—for CME, down 3% from last year. Specifically,
- 16% received $0
- 6%, less than $500
- 10%, between $500 - $1,000
- 25%, between $1,001 - $1,500
- 19%, between $1,501 - $2,000
- 24%, more than $2,000
with average monetary compensation per year up approximately $200 over last year.
Responses to the amount of time you are allotted annually for CME ranged from “None” to “more than 5 weeks.”
- 25%, no time
- 31%, less than 1 week
- 38%, 1-2 weeks
- 3%, 3 weeks
- 1%, 4 weeks
- 0.25%, 5 weeks
- 1%, more than 5 weeks.
In closing, we offer thanks to all the survey participants whose answers helped us understand your current state of job satisfaction and most especially for your frank and enlightening responses to the open-ended questions.
METHODOLOGY
Fielded electronically under the Clinician Reviews logo, an introductory email letter signed by the Editors-in-Chief invited participation in the online 4th annual NP/PA Job Satisfaction Survey of 35 questions.
The survey was fielded August 23, 2019 to a random representative sample of NPs and PAs within the United States, excluding students. The first 150 respondents to complete the survey received a $25 Amazon.com gift certificate.
A total of 1,323 usable responses—a projectable sample size—were received by October 3, 2019, the final cut-off date.
Of the total respondents, 70% are NPs (931) and 30% are PAs (396), which is proportional to the universe of NPs and PAs.1,2 This summary of results is based on only those respondents who designated their profession as NP or PA.
- American Association of Nurse Practitioners. NP Fact Sheet. www.aanp.org/all-about-nps/np-fact-sheet. Accessed November 22, 2019.
- NCCPA. 2018 Statistical Profile of Certified Physician Assistants: an Annual Report of the National Commission on Certification of Physician Assistants. https://prodcmsstoragesa.blob.core.windows.net/uploads/files/2018StatisticalProfileofCertifiedPhysicianAssistants.pdf. Accessed November 22, 2019.
1. American Association of Nurse Practitioners. NP Fact Sheet. www.aanp.org/all-about-nps/np-fact-sheet. Accessed November 22, 2019.
2. NCCPA. 2018 Statistical Profile of Certified Physician Assistants: an Annual Report of the National Commission on Certification of Physician Assistants. https://prodcmsstoragesa.blob.core.windows.net/uploads/files/2018StatisticalProfileofCertifiedPhysicianAssistants.pdf. Accessed November 22, 2019.
“I have the best job in the world.” This statement sums up how your colleagues feel about being a PA. Although there are certainly problems that deserve attention, the vast majority of clinicians, who are highly educated and practice in all specialties, state that they would re-enter the field if choosing again.
On the following pages, we focus on the details of the survey results, with breakouts by specialty, region, and practice setting. Be sure to check out which benefits your colleagues are getting, how much they’re being reimbursed for continuing medical education, information about salary by gender and time spent during the workweek, and much more. Participants, invited to comment, have provided several illuminating quotes, which we’ve included throughout the article, indicating what it’s like to be “in the trenches.”
WOULD YOU REPEAT THIS?
To get to the heart of the matter, we asked our survey takers “If you were to do it again, would you choose…”
- The same career
- The same educational preparation
- The same practice setting
To see what your colleagues said, go to the next page
The majority of your peers gave an enthusiastic thumbs up to PA practice as a profession choice. Knowing what you know now, 86% of you agreed that you would follow the same career path today as when you entered practice, which is up 5% from last year.
Educational preparation came in for a ringing endorsement, increasing since last year’s survey results (a 3% increase), and practice setting remained virtually the same.
Of PAs in practice between < 1 and 5 years, 94% felt their educational training was adequate; 53% felt their current responsibilities matched their expectations accurately; and 74% said their career expectations were met.
WOULD YOU TAKE A NEW JOB TODAY?
Continuing to probe about your level of satisfaction, we asked how you feel about changing your job. The answer choices were, “I would…”
- Change my job if I could get a better one (ie, better paid)
- Take any other job in which I could earn as much as I do now (ie, Yes, to leave the profession)
- Change both my job and my occupation (ie, I am burned out)
- Not make any changes (ie, No, not for any reason)
We also asked you how many times you’ve changed jobs since graduating from your PA program. The 4 answer choices ranged from “None” to “More than 3 times.” The final question asked which factors influence your decision about seeking/accepting a new position, allowing more than one choice from the list below.
- Salary/compensation
- Options for supplemental income
- Greater independence/more autonomy
- Opportunities for professional growth/development
- Formal career ladder for advancement
- Defined career path
- Recognition and appreciation
- Schedule flexibility
- Geographic location
- Access to and subsidy for more educational opportunities
- Employer reimbursement of school loans
- Specific state scope of practice and licensure law
- Work-life balance, including addressing burnout
- Working conditions
- Avoid toxic coworkers
- Top-of-the-line tools
- Telecommuting
- Cost of living
- Opportunity for outdoor activities/lifestyle
To see what your colleagues said, go to the next page
Compared to last year, PAs are 4% more likely to stay with their current job, stating that they would not make any changes, with 4% less likely to leave even if a higher salary were on offer. This is supported by the responses that indicate a fewer number of PAs (27%) have changed jobs at the highest rate (> 3 times) compared to 31% last year.
Although 19% of PAs have never changed jobs, 33% have changed 2 or 3 times, and 27% have changed more 3 times (down 4% from last year). However, more PAs report feeling burned out (up 2% from last year) and wish to leave for another profession (up 6% from last year) compared to last year.
Respondents indicated that the following 4 factors would strongly influence their decision to seek or accept a new position:
- Salary/compensation: 84%
- Work-life balance: 72%
- Schedule flexibility: 68%
- Working conditions: 64%
WHAT MAKES YOU MOST SATISFIED WITH YOUR WORK?
As you are aware, level of satisfaction depends on each of the following, which we asked respondents to rank from 1 to 5.
- Relationships with your colleagues (health care providers and clerical/administrative personnel)
- Quality and duration of patient relationships
- Respect received from patients, their families, and your community
- Ability to make a difference and provide significant help to patients, their families, and your community
To see what your colleagues said, go to the next page
Echoing the survey results—which ranked “Making a difference and providing significant help” as the topmost source of job satisfaction—one of your colleagues commented that, “Ability to offer meaningful support to client needs” affected their satisfaction. On the other hand, though, one clinician wrote, “I am starting to decrease my time in urgent care because I’m seeing more often that administration thinks we are selling a good, not a service—and because of lack of respect by patients as well.”
Compared to last year, the changes in response are
3% decrease: Making a difference and providing significant help
No change: Respect received from patients and their families
6% increase: Relationships with your colleagues
2% increase: Quality and duration of patient relationships
MOST SATISFIED BY SPECIALTY
Knowing that certain specialties offer more advantages than others, we presented a list of 19 medical specialties, asking which is your primary one. We also asked how often you typically feel satisfied with your job, with these answer choices.
- Never
- Occasionally
- About half the time
- Most of the time
- Always
To see what your colleagues said, go to the next page
- Dermatology: 73%, a 9% decrease over last year
- Primary Care: 72%, virtually unchanged from last year
- Orthopedic Surgery: 65%, a new entry this year
- Emergency Medicine: 57%, an 8% decrease over last year
As one clinician commented, being “First assistant in surgery” makes a difference in their job satisfaction.
MOST SATISFIED BY PRACTICE SETTING
Working conditions and coworker collegiality are integral to job satisfaction. To learn more about these factors, we asked you to identify the practice settings where you work.
- Academic setting (faculty); school/college health services
- Hospital: inpatient care; outpatient setting or community clinic
- Locum
- Physician practice: solo; single-specialty; multi-specialty
- Public health/occupational health setting; military/government
- Retail/convenient care; urgent care clinic
- Skilled nursing/long-term care facility
We also asked how often you typically feel satisfied with your job, with 5 answer choices ranging from “Never” to “Always.”
To see what your colleagues said, go to the next page
95% of PA respondents work as an employee; of these, 41% work in hospitals, and 31% work in physician offices.1 Therefore, it is gratifying to see that hospital settings and physician groups are satisfying places to work. In addition, this data has not changed significantly since last year.
- US Department of Health and Human Services, Health Resources and Services Administration, The U.S. Health Workforce Chartbook. Rockville, Maryland: U.S. Department of Health and Human Services, 2018.
BENEFITS
As you are aware, having access to the right benefits can go a long way to increasing job satisfaction. In addition to salary as a choice, we listed 30 benefits choices—insurance coverage, additional compensation opportunities, reimbursements, and other—asking which are offered by your employer (access) and which, in lieu of a modest increase in salary, are most important regardless of access. Your responses allowed us to identify the top 7 among your peers.
To see what your colleagues said, go to the next page
You are willing to trade a modest increase in salary for the following important benefits whether you are a new job seeker or an experienced practitioner.
- Compensation: Paid time off, retirement saving plan with employer match
- Insurance coverage: Professional liability insurance, health & dental insurance for self/family (employer subsidized)
- Reimbursements: Licensing fees, professional development fund
- Other: Flexible leave policy
MOST SATISFIED BY REGION
Location, location, location. Where you work depends in part on where your family is; in part on what jobs are available; what affects your commute, taxes and take home pay; and hence your satisfaction. So, we asked where you work—West, Midwest, Northeast, or South—and paired the data with responses to the question about how often you typically feel satisfied with your job, with 5 answer choices ranging from “Never” to “Always.”
To see what your colleagues said, go to the next page
Geographic location is among the factors that influence the decision about seeking or accepting a new job for 53% of PA respondents. Compared to last year, satisfaction levels by region were
- 7% higher than last year in the Northeast
- 5% higher than last year in the South
- 12% lower than last year in the Midwest
- 17% lower than last year in the West
with 27% of PAs practicing in the Northeast; 32% in the South; 21% in the Midwest, and 19% in the West. 76% of PAs working in the South are “most of the time/always” satisfied with their job.
When base salaries are adjusted for cost of living, the top 10 ranked states are, from first to 10th, Oklahoma, Arkansas, Ohio, Texas, Michigan, Indiana, Iowa, New Mexico, Mississippi, and South Dakota.1
- American Academy of PAs. 2019 AAPA Salary Report. Alexandria, VA; 2019.
SALARY
Because you indicated that salary is second in importance only to professional liability insurance coverage as part of a desirable compensation package, we asked you to tell us what your salary bracket is. The amounts ranged from < $50,000 to > $175,000 per year (in $25,000 increments). Combining the responses to this question with those asking about gender and specialty, we are able to tie these factors together for you.
To see what your colleagues said, go to the next page
Approximately 5% of PAs earn $50K to $75K per year; 36%, earn $100K to $125K per year; and 5% earn > $175K per year. Similar to responses of previous years, women earn less than men in the PA profession.
PAs practicing in Emergency Medicine (EM) are the most highly compensated, with their median compensation being almost $117K.1 In fact, among those in EM, we found that 35% earn between $125K and $150K per year, up from 27% from last year. Clinicians working in the emergency room encounter more stressors (a clinician noted “Abuse of the emergency room by patients with ridiculous complaints” as a source of dissatisfaction) than those encountered in other specialties, which may be related to the higher compensation.
Although most PAs feel they are adequately compensated, we found that of those who practice in Family Medicine, 19% earn less than $75K per year, up from 6% from last year.
- American Academy of PAs. 2019 AAPA Salary Report. Alexandria, VA; 2019.
WORKWEEK
Job satisfaction, and its opposite, burnout are related to your workload (ie, what you do and how much autonomy you have in deciding how to proceed). To help us evaluate these factors, we asked your colleagues to indicate how many hours per week are typically spent in direct (examine/diagnose/treat) and indirect patient care (perform and interpret labs, x-rays, refill prescriptions, etc.), administrative duties, meetings, and teaching.
We were also interested in whether you assess, treat, and manage decisions
- Independently/by yourself
- In direct contact (in person or by phone) with a collaborating physician
- In consultation with a specialist when providing patient care.
Multiple answer choices were permitted.
To see what your colleagues said, go to the next page
As you can imagine, workload is a very hot topic. In response to, “What else affects your job satisfaction?” the greatest number of comments related to electronic charting and data collection. These activities are felt to demand so much time and effort that it takes away from patient care. The survey responses support this: Compared to last year, although the number of hours worked is the same this year, PAs now spend 1 hour less per week on patient care (direct and indirect) and 1 hour more on other duties (administrative and teaching). As one clinician put it, “…availability of medical assistant/administrative support is huge” in alleviating the sense of being overworked or overextended.
Aside from work hours, clinicians told us they seek positions that allow them “input on all issues related to practice” and flexibility on “what/who I am allowed to treat.” According to the survey, when providing patient care,
- 84% of PAs assess, treat, and manage decisions independently
- 37% collaborate with a physician
- 19% consult with a specialist
supporting the fact that 58% of PAs are satisfied most of the time; 12% are always satisfied.
A side note: Of the 50% of PAs who responded that they are involved in teaching students (78% of whom are PAs), they spend approximately 4 hours a week,
- Either as a clinical preceptor (35%)
- In the classroom (5%)
- Or both (10%).
CME REIMBURSEMENT
As we know, PAs earn continuing medical education (CME) credits in order to maintain certification. Therefore, we asked you to indicate how much financial reimbursement you receive annually for CME; answer choices range from $0 to > $2,000 per year (in $500 increments). We also queried you about how much time you are allotted annually for CME; choices were from “None” to “More than 5 weeks.”
To see what your colleagues said, go to the next page
Many of your colleagues responded to the question “What else affects your job satisfaction?” with “Support for continuing learning” and “Educational opportunities.” This is reflected by 51% of survey respondents who stated that “Reimbursement for professional development” was an important benefit (see “Top 7 Benefits” above).
This year, 84% of respondents reported receiving remuneration—either money or time allowed or both—for CME, down 3% from last year. Specifically,
- 16% received $0
- 6%, less than $500
- 10%, between $500 - $1,000
- 25%, between $1,001 - $1,500
- 19%, between $1,501 - $2,000
- 24%, more than $2,000
with average monetary compensation per year up approximately $200 over last year.
Responses to the amount of time you are allotted annually for CME ranged from “None” to “more than 5 weeks.”
- 25%, no time
- 31%, less than 1 week
- 38%, 1-2 weeks
- 3%, 3 weeks
- 1%, 4 weeks
- 0.25%, 5 weeks
- 1%, more than 5 weeks.
In closing, we offer thanks to all the survey participants whose answers helped us understand your current state of job satisfaction and most especially for your frank and enlightening responses to the open-ended questions.
METHODOLOGY
Fielded electronically under the Clinician Reviews logo, an introductory email letter signed by the Editors-in-Chief invited participation in the online 4th annual NP/PA Job Satisfaction Survey of 35 questions.
The survey was fielded August 23, 2019 to a random representative sample of NPs and PAs within the United States, excluding students. The first 150 respondents to complete the survey received a $25 Amazon.com gift certificate.
A total of 1,323 usable responses—a projectable sample size—were received by October 3, 2019, the final cut-off date.
Of the total respondents, 70% are NPs (931) and 30% are PAs (396), which is proportional to the universe of NPs and PAs.1,2 This summary of results is based on only those respondents who designated their profession as NP or PA.
- American Association of Nurse Practitioners. NP Fact Sheet. www.aanp.org/all-about-nps/np-fact-sheet. Accessed November 22, 2019.
- NCCPA. 2018 Statistical Profile of Certified Physician Assistants: an Annual Report of the National Commission on Certification of Physician Assistants. https://prodcmsstoragesa.blob.core.windows.net/uploads/files/2018StatisticalProfileofCertifiedPhysicianAssistants.pdf. Accessed November 22, 2019.
1. American Association of Nurse Practitioners. NP Fact Sheet. www.aanp.org/all-about-nps/np-fact-sheet. Accessed November 22, 2019.
2. NCCPA. 2018 Statistical Profile of Certified Physician Assistants: an Annual Report of the National Commission on Certification of Physician Assistants. https://prodcmsstoragesa.blob.core.windows.net/uploads/files/2018StatisticalProfileofCertifiedPhysicianAssistants.pdf. Accessed November 22, 2019.

NPs: Does Your Job Fulfill Your Expectations?
“I have the best job in the world.” This statement sums up how your colleagues feel about being a NP. Although there are certainly problems that deserve attention, the vast majority of clinicians, who are highly educated and practice in all specialties, state that they would re-enter the field if choosing again.
On the following pages, we focus on the details of the survey results, with breakouts by specialty, region, and practice setting. Be sure to check out which benefits your colleagues are getting, how much they’re being reimbursed for continuing education, information about salary by gender and time spent during the workweek; and much more. Participants, invited to comment, have provided several illuminating quotes, which we’ve included throughout the article, indicating what it’s like to be “in the trenches.”
WOULD YOU REPEAT THIS?
To get to the heart of the matter, we asked our survey takers “If you were to do it again, would you choose…”
- The same career
- The same educational preparation
- The same practice setting
To see what your colleagues said, go to the next page

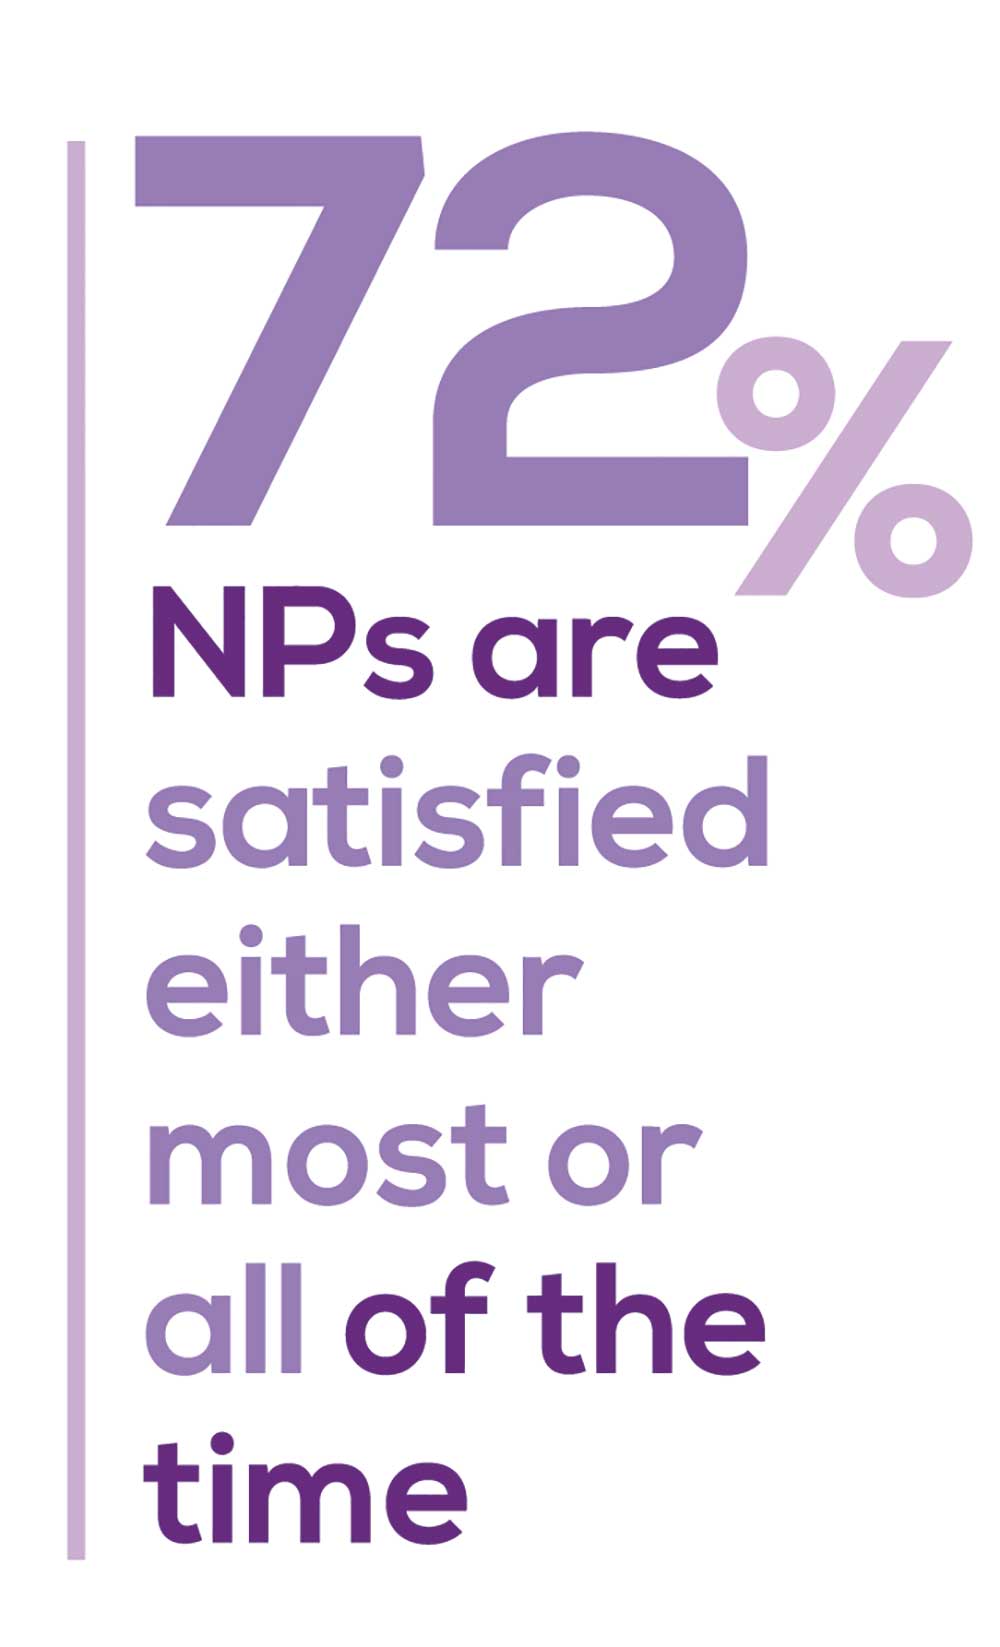
The majority of your peers gave an enthusiastic thumbs up to NP practice as a profession choice. Knowing what you know now, 84% of you agreed that you’d follow the same career path today as when you entered practice, which is up 2% from last year. Educational preparation came in for a ringing endorsement, increasing substantially since last year’s survey results (a 9% increase) and of practice setting up 4%.
Of NPs in practice between < 1 and 5 years, 62% felt their educational training was adequate; 74% felt their current responsibilities matched their expectations fairly accurately; and they were evenly divided on whether or not their career expectations were met.
“I enjoy being an NP and working with patients from all ethnic groups who are mostly uninsured.”
WOULD YOU TAKE A NEW JOB TODAY?
Continuing to probe about your level of satisfaction, we asked how you feel about changing your job. The answer choices were, “I would…”
- Change my job if I could get a better one (ie, better paid)
- Take any other job in which I could earn as much as I do now (ie, Yes, to leave the profession)
- Change both my job and my occupation (ie, I am burned out)
- Not make any changes (e, No, not for any reason)
We also asked you how many times have you’ve changed jobs since graduating from your PA program. The 4 answer choices ranged from “None” to “More than 3 times.” The final question asked which factors influence your decision about seeking/accepting a new position, allowing more than one choice from the list below.
- Salary/compensation
- Options for supplemental income
- Greater independence/more autonomy
- Opportunities for professional growth/development
- Formal career ladder for advancement
- Defined career path
- Recognition and appreciation
- Schedule flexibility
- Geographic location
- Access to and subsidy for more educational opportunities
- Employer reimbursement of school loans
- Specific state scope of practice and licensure law
- Work-life balance, including addressing burnout
- Working conditions
- Avoid toxic coworkers
- Top-of-the-line tools
- Telecommuting Cost of living
- Opportunity for outdoor activities/lifestyle
To see what your colleagues said, go to the next page
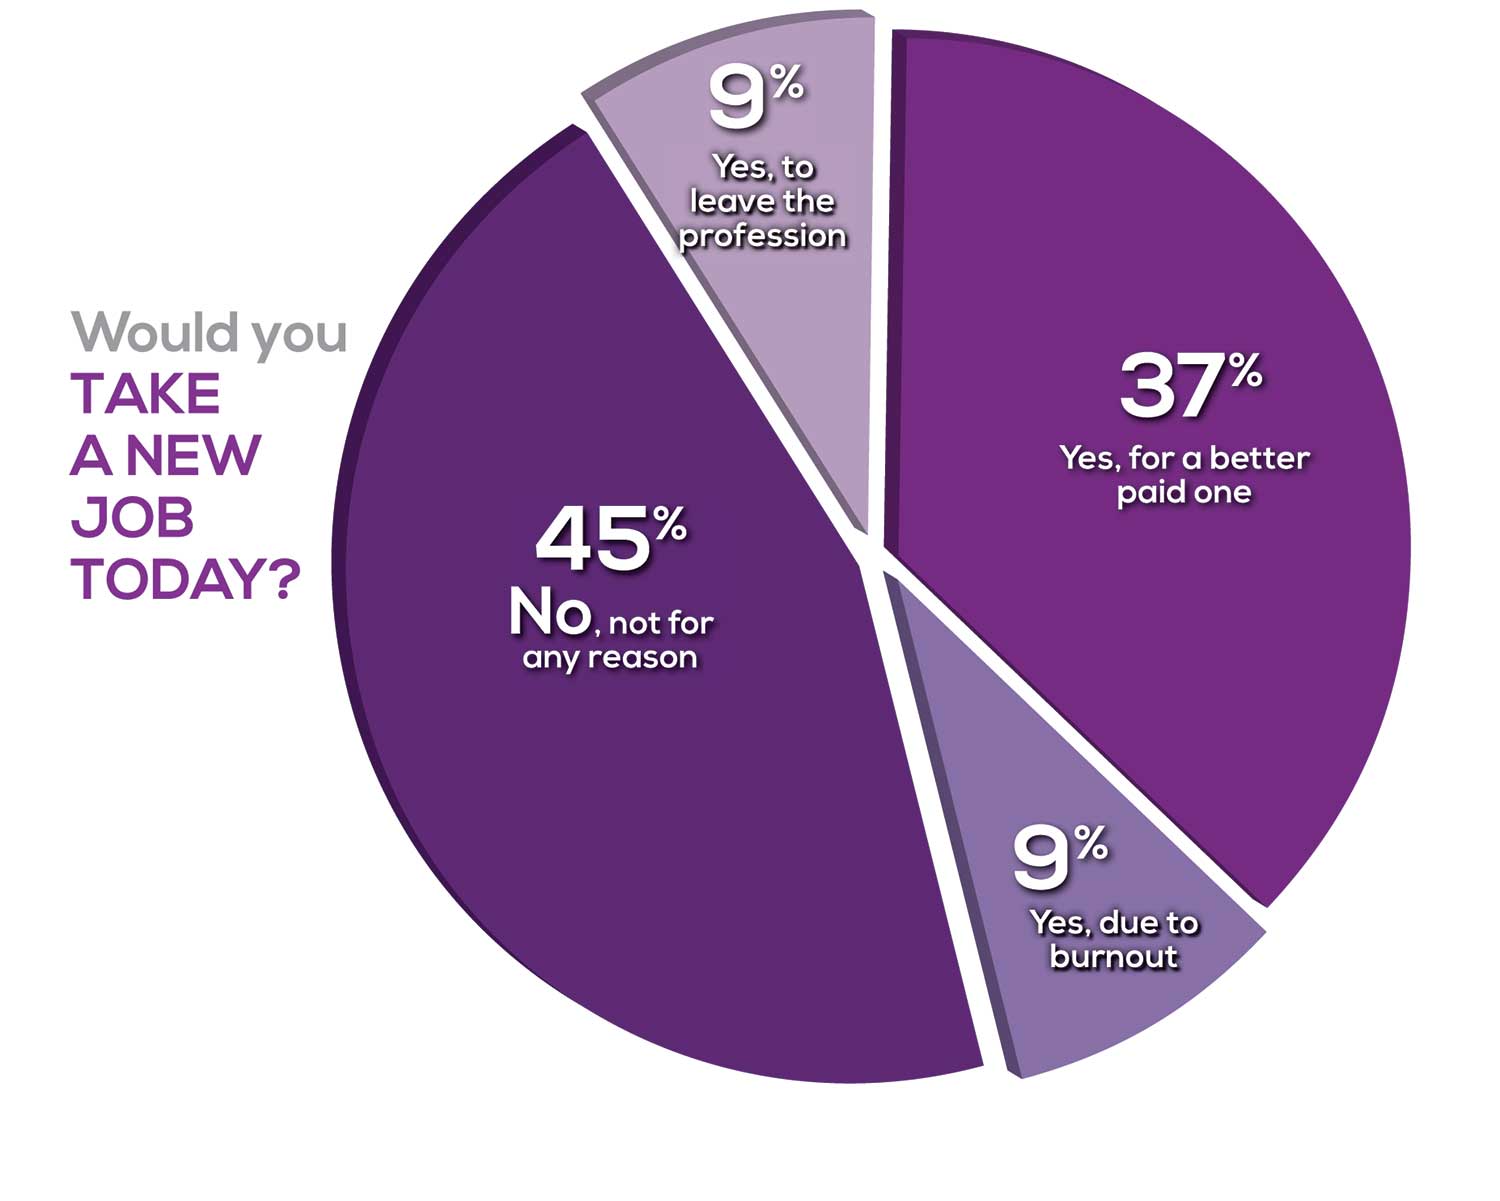
Compared to last year, NPs are 2% more likely to stay with their current job, stating that they would not make any changes. However, a greater number of NPs (31%) have changed jobs at the highest rate (> 3 times) compared to 25% last year.
Although 13% of NPs have never changed jobs, 37% have changed 2 or 3 times, and 31% have changed more 3 times (up 6% from last year). However, more NPs report feeling burned out (up 4% from last year) and wish to leave for another profession (up 3% from last year) compared to last year.
Respondents indicated that the following 4 factors would strongly influence their decision to seek or accept a new position:
- Salary/compensation: 82%
- Work-life balance & Schedule flexibility: 65%
- Working conditions: 63%
WHAT MAKES YOU MOST SATISFIED WITH YOUR WORK?
As you are aware, level of satisfaction depends on each of the following, which we asked respondents to rank from 1 to 5.
- Relationships with your colleagues (health care providers and clerical/admin personnel)
- Quality and duration of patient relationships
- Respect received from patients, their families, and your community
- Ability to make a difference and provide significant help to patients, their families, and your community
To see what your colleagues said, go to the next page
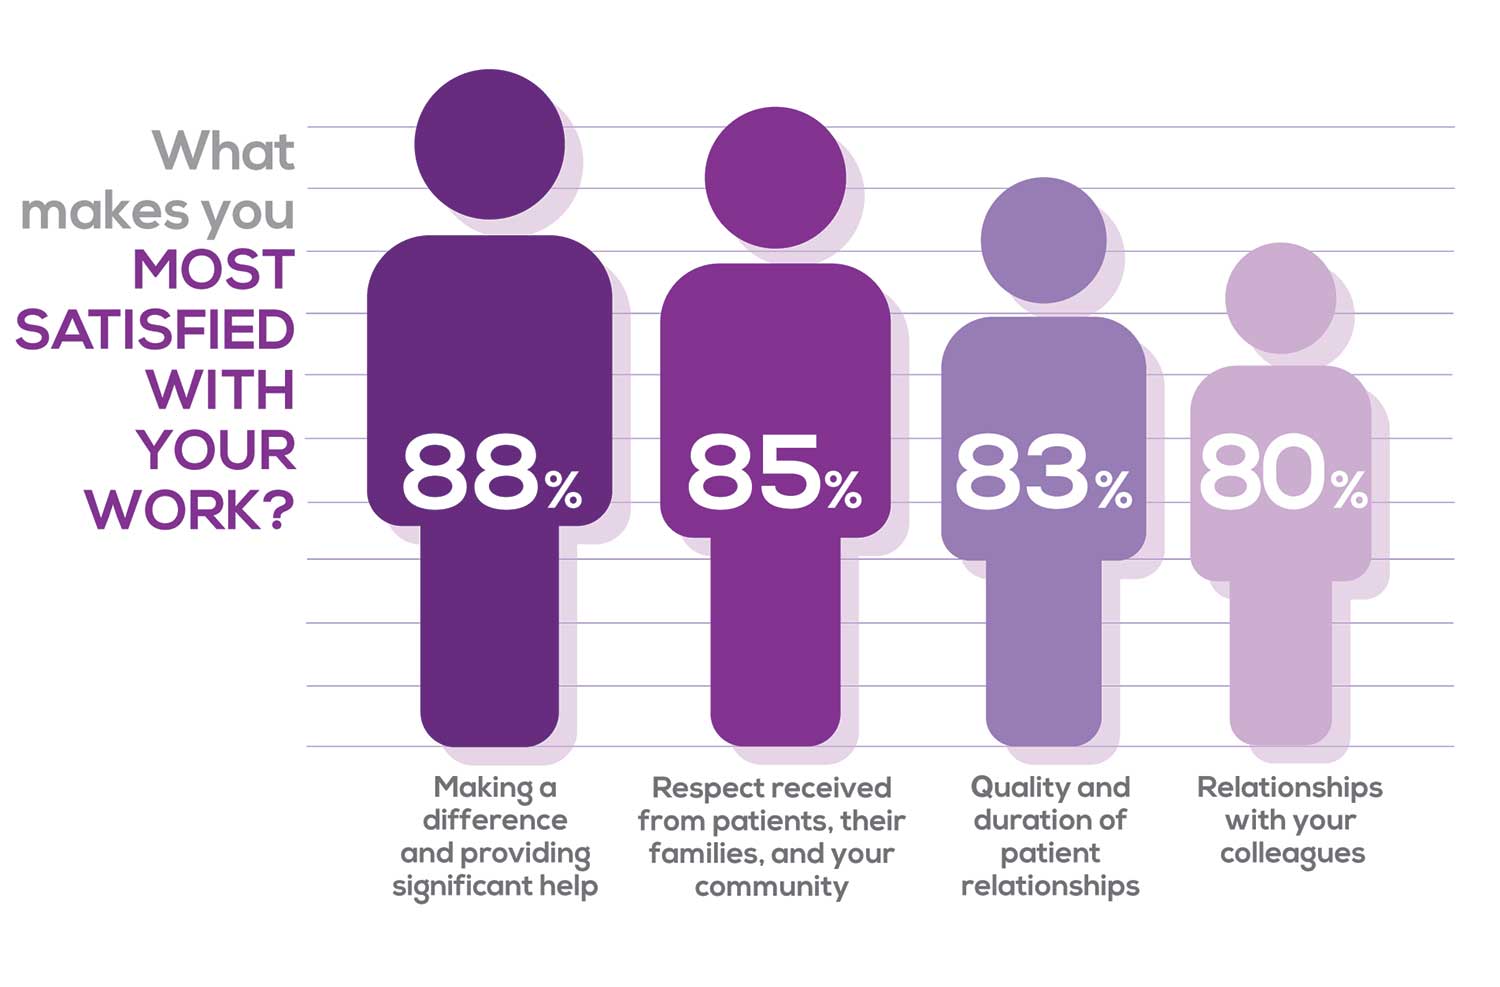
Echoing the survey results—which ranked “Making a difference and providing significant help” as the topmost source of job satisfaction—one of your colleagues commented that, “Ability to offer meaningful support to client needs” affected their satisfaction. On the other hand, though, one clinician wrote, “I feel like we are losing the art of caring and healing because we are rushed/pushed to do and see more.”
Compared to last year, the changes in response are
2% increase: Making a difference and providing significant help
3% increase: Respect received from patients and their families
No change: Relationships with your colleagues
3% increase: Quality and duration of patient relationships
MOST SATISFIED BY SPECIALTY
Knowing that certain specialties offer more advantages than others, we presented a list of 19 medical specialties, asking which is your primary one. We also asked how often you typically feel satisfied with your job, with these answer choices:
- Never
- Occasionally
- About half the time
- Most of the time
- Always
To see what your colleagues said, go to the next page
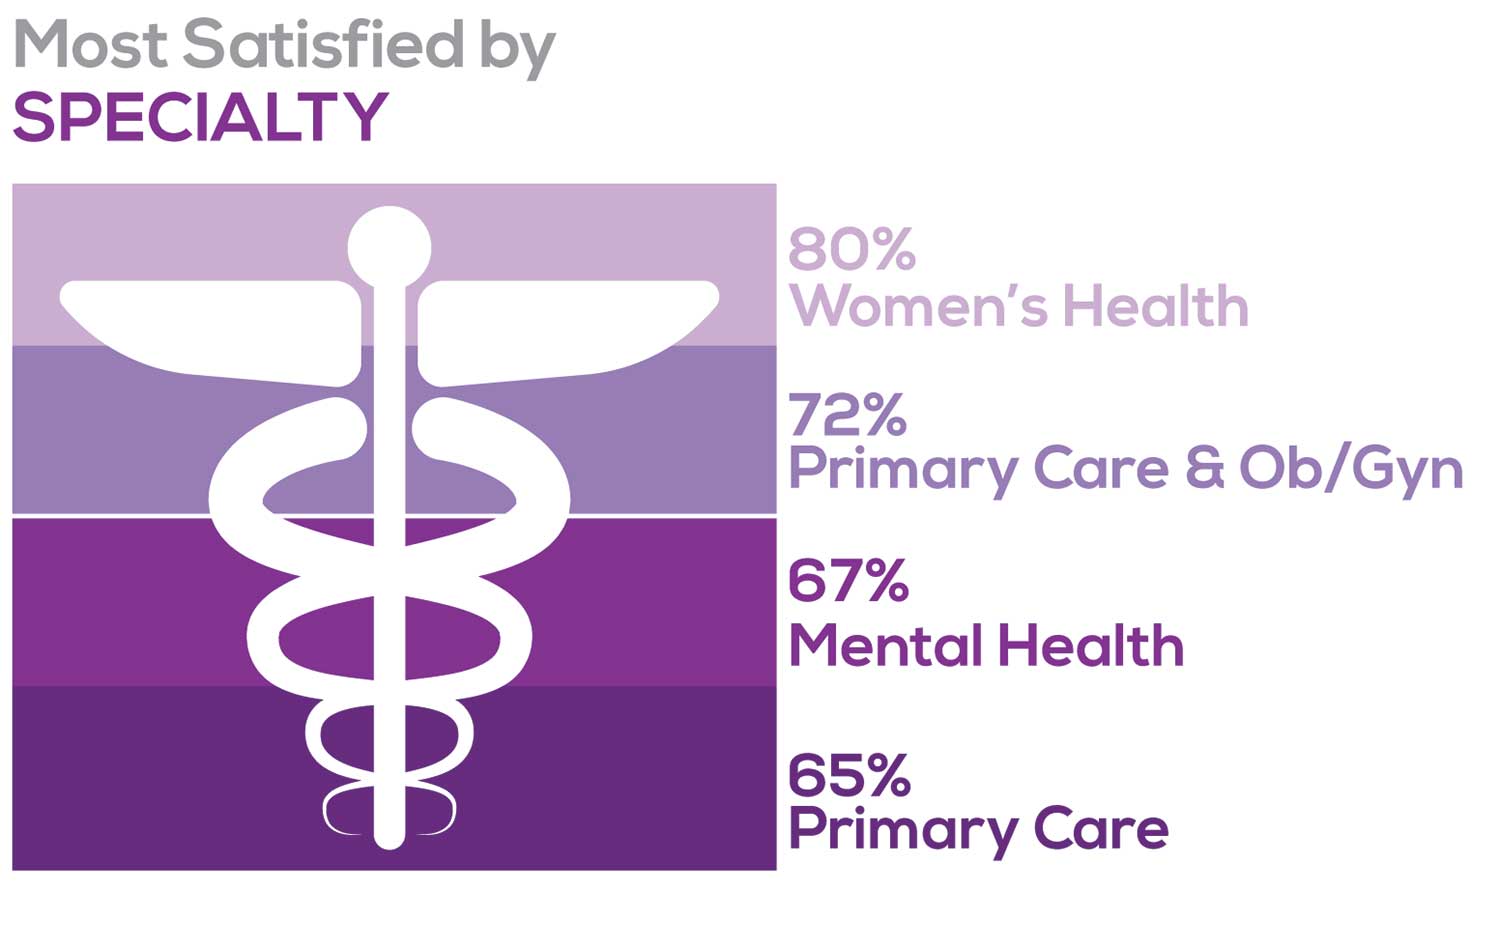
Correlating the data from the 2 questions (primary specialty and frequency of satisfaction) we posed, your peers indicated that the following specialties offered the highest levels of satisfaction.
- Women’s Health: 80%, a 9% increase over last year
- Primary Care & Ob/Gyn: 72%, a 3% increase over last year
- Psychiatric/Mental Health: 67%, a 6% decrease over last year
- Pediatrics: 65%, a 9% decrease over last year
MOST SATISFIED BY PRACTICE SETTING
Working conditions and coworker collegiality are integral to job satisfaction. To learn more about these factors, we asked you to identify the practice settings where you work.
- Academic setting (faculty); school/college health services
- Hospital: inpatient care; outpatient setting or community clinic
- Locum
- Physician practice: solo; single-specialty; multi-specialty
- Public health/occupational health setting; military/government
- Retail/convenient care; urgent care clinic
- Skilled nursing/long-term care facility
- NP practice
We also asked how often you typically feel satisfied with your job, with 5 answer choices ranging from “Never” to “Always.”
To see what your colleagues said, go to the next page
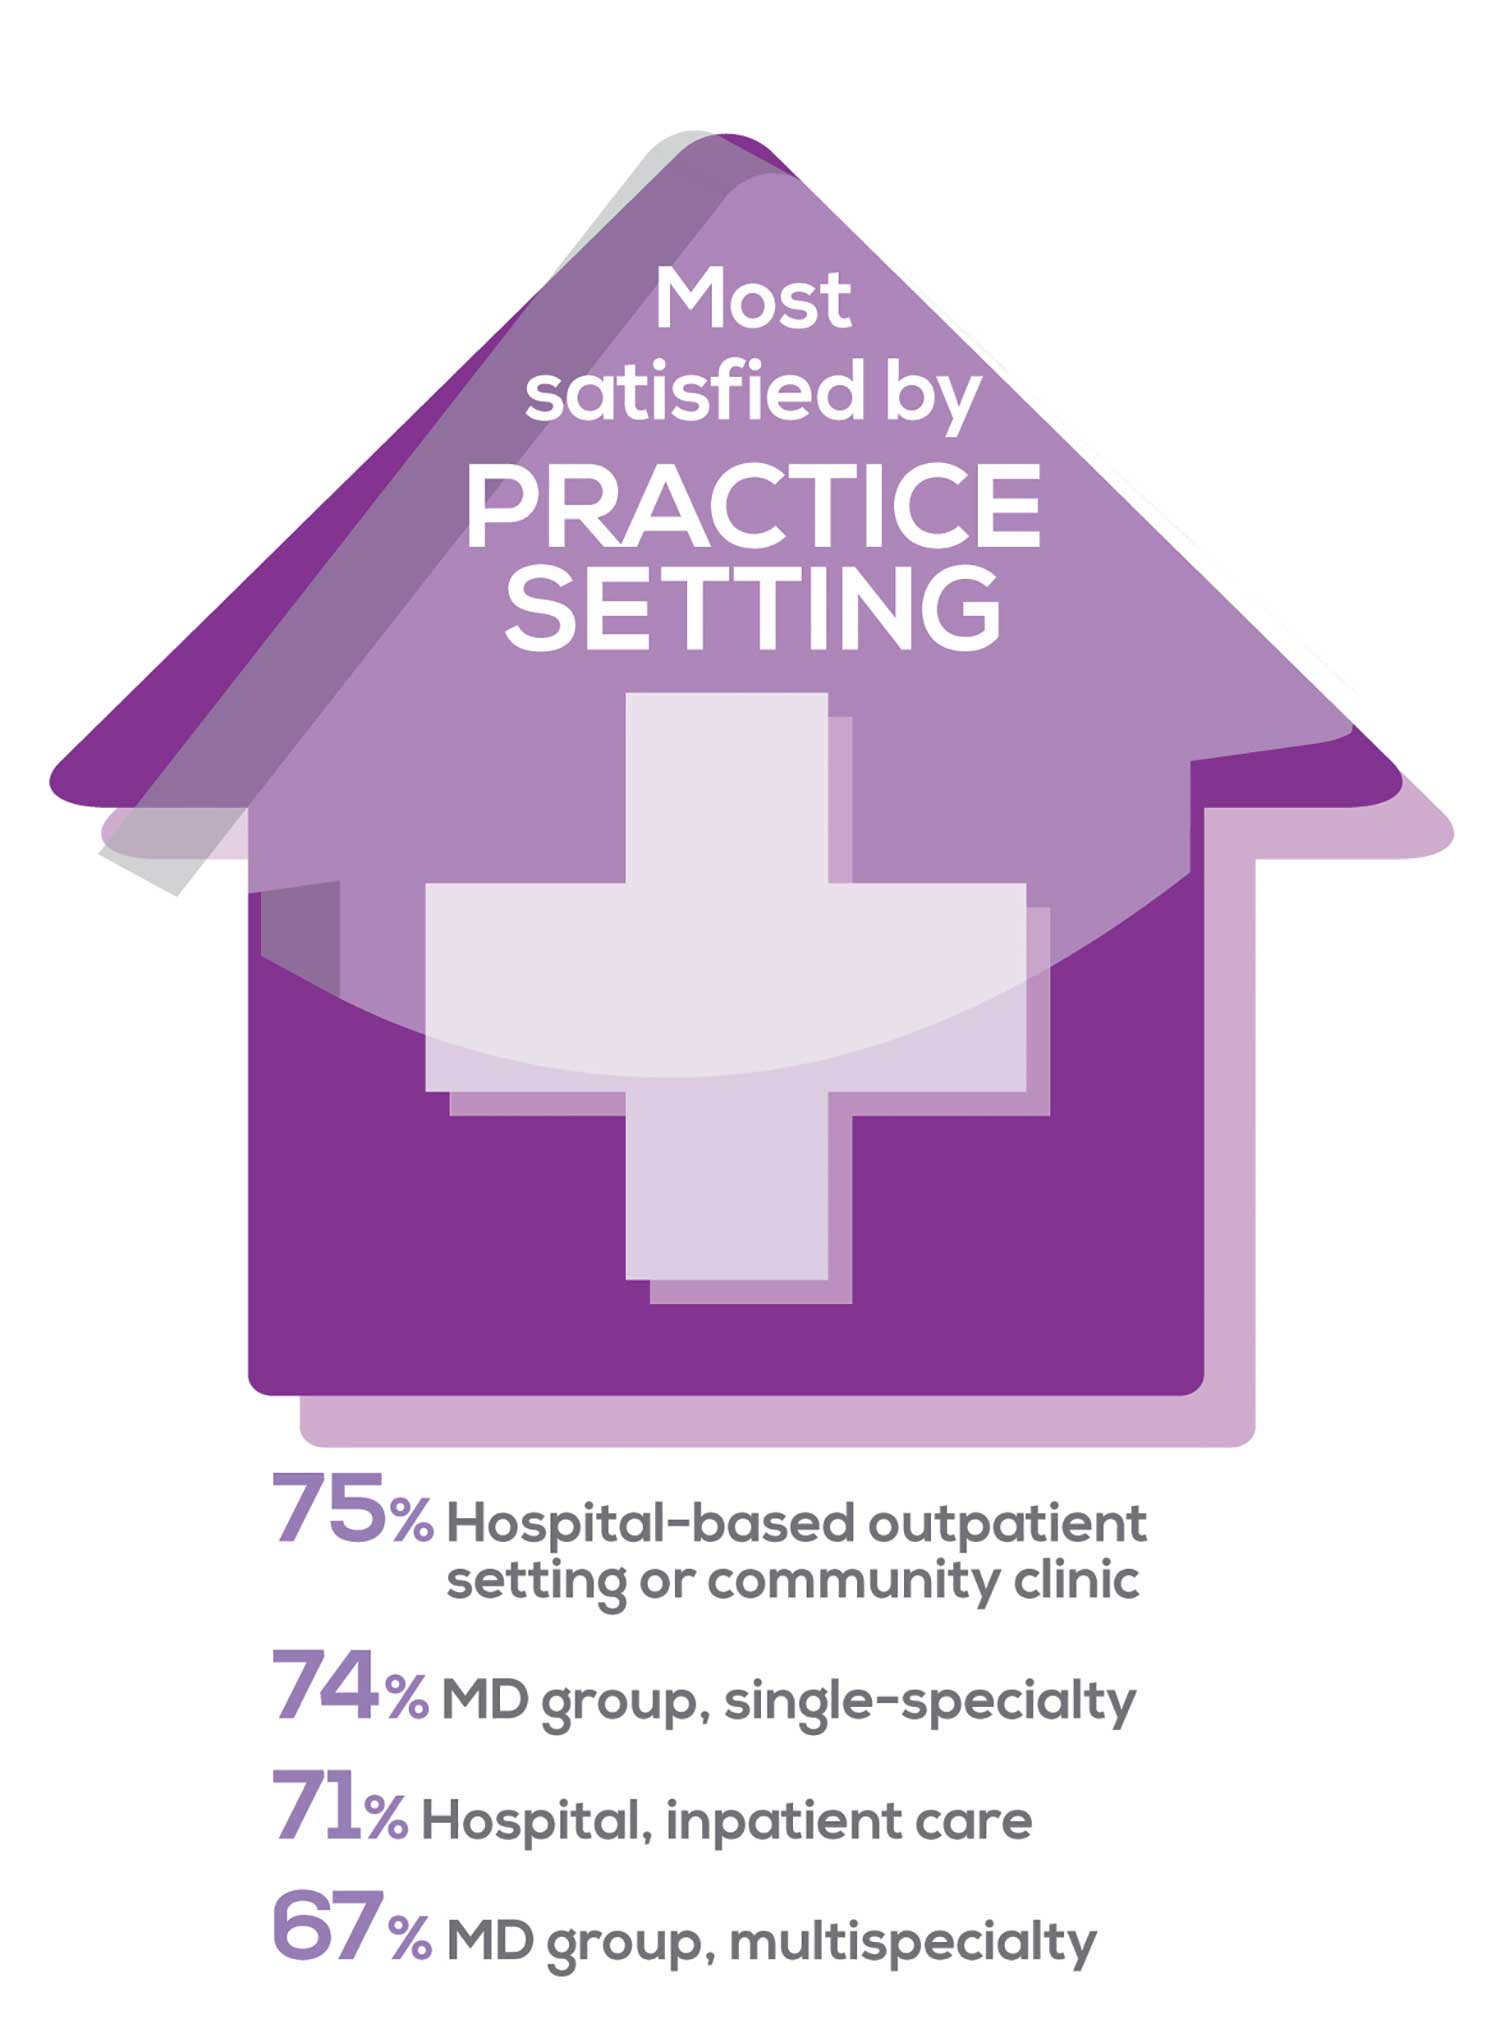
91% of NP respondents work as an employee; of these, 39% work in hospitals, and 25% work in physician offices.1 Therefore, it’s gratifying to see that hospital settings and physician groups are satisfying places to work. In addition, this data has not changed significantly since last year. Not surprisingly (based on comments that “ability to make administrative decisions and have a say in day-to-day operations” and “independent practice” matters), 83% of NPs who work solo were “most of the time/always” satisfied, compared with 72% of those in other practice settings.
- US Department of Health and Human Services, Health Resources and Services Administration, The U.S. Health Workforce Chartbook. Rockville, Maryland: U.S. Department of Health and Human Services, 2018.
BENEFITS
As you are aware, having access to the right benefits can go a long way to increasing job satisfaction. In addition to salary as a choice, we listed 30 benefits choices—insurance coverage, additional compensation opportunities, reimbursements, and other—asking which are offered by your employer (access) and which, in lieu of a modest increase in salary, are most important regardless of access. Your responses allowed us to identify the top 7 among your peers.
To see what your colleagues said, go to the next page
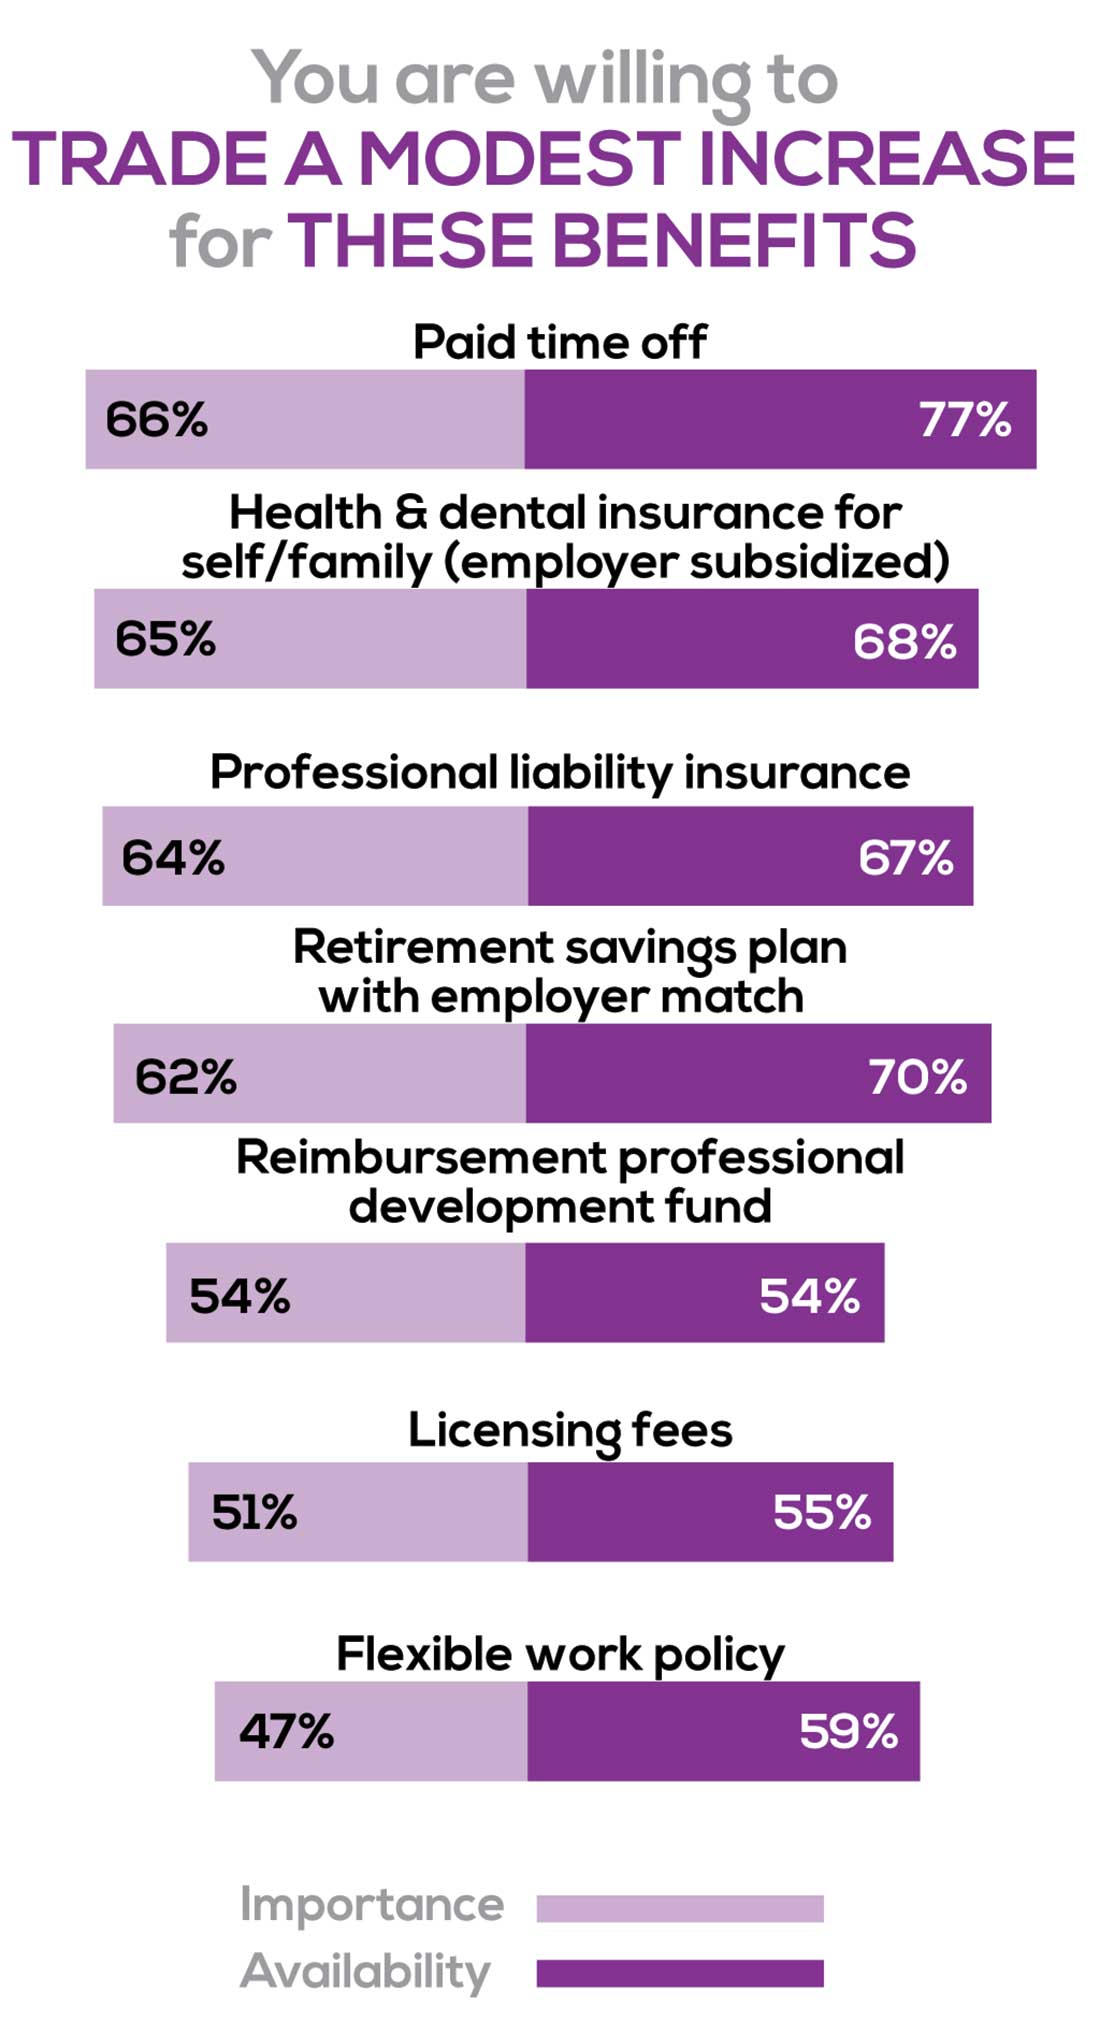
You are willing to trade a modest increase in salary for the following important benefits whether you are a new job seeker or an experienced practitioner.
- Compensation: Paid time off, retirement saving plan with employer match
- Insurance coverage: Health & dental insurance for self/family (employer subsidized), professional liability insurance
- Reimbursements: Professional development fund, licensing fees
- Other: Flexible work policy
MOST SATISFIED BY REGION
Location, location, location. Where you work depends in part on where your family is; in part on what jobs are available; what affects your commute, taxes and take home pay; and hence your satisfaction. Therefore, we asked where you work—West, Midwest, Northeast, or South—and paired the data with responses to the question about how often you typically feel satisfied with your job, with 5 answer choices ranging from “Never” to “Always.”
To see what your colleagues said, go to the next page
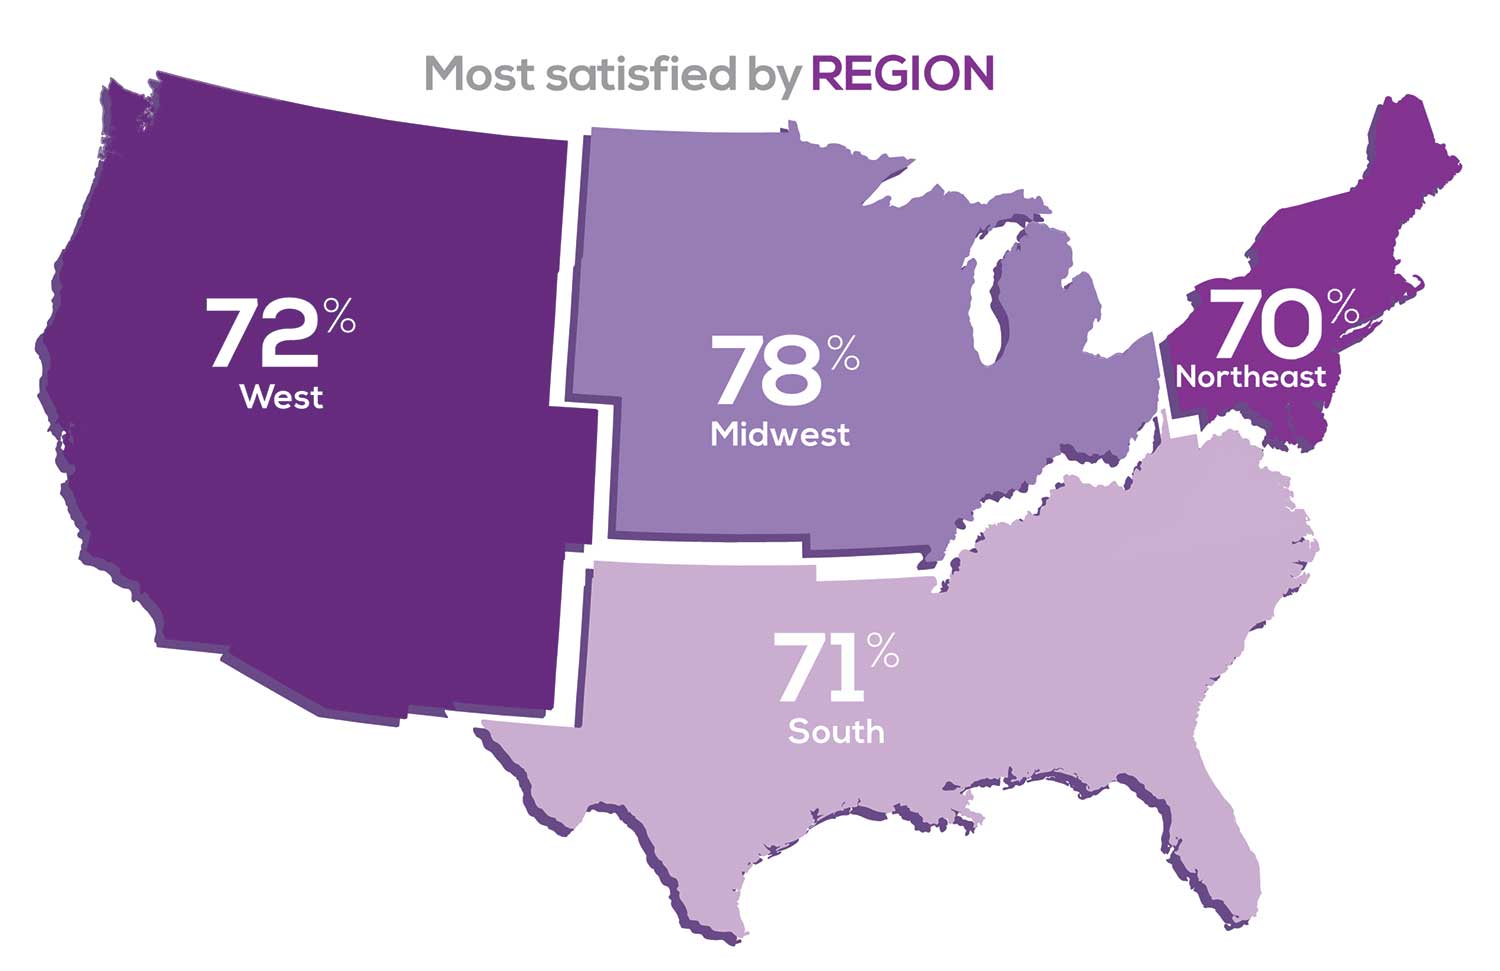
Geographic location is among the factors that influence the decision about seeking or accepting a new job for 50% of NP respondents. Compared to last year, satisfaction levels by region were
- 5% higher than last year in the Midwest
- 4% higher than last year in the South
- 2% lower than last year in the Northeast
- 14% lower than last year in the West
with 34% of NPs practicing in the South; 25% in the Northeast; 20% in the Midwest and West, each. 78% of NPs working in the Midwest are “most of the time/always” satisfied with their job.
SALARY
Because you indicated that salary is the most importance part of a desirable compensation package, we asked you to tell us what your salary bracket is. The amounts ranged from < $50,000 to > $175,000 per year (in $25,000 increments). Combining the responses to this question with those asking about gender and specialty, we are able to tie these factors together for you.
To see what your colleagues said, go to the next page
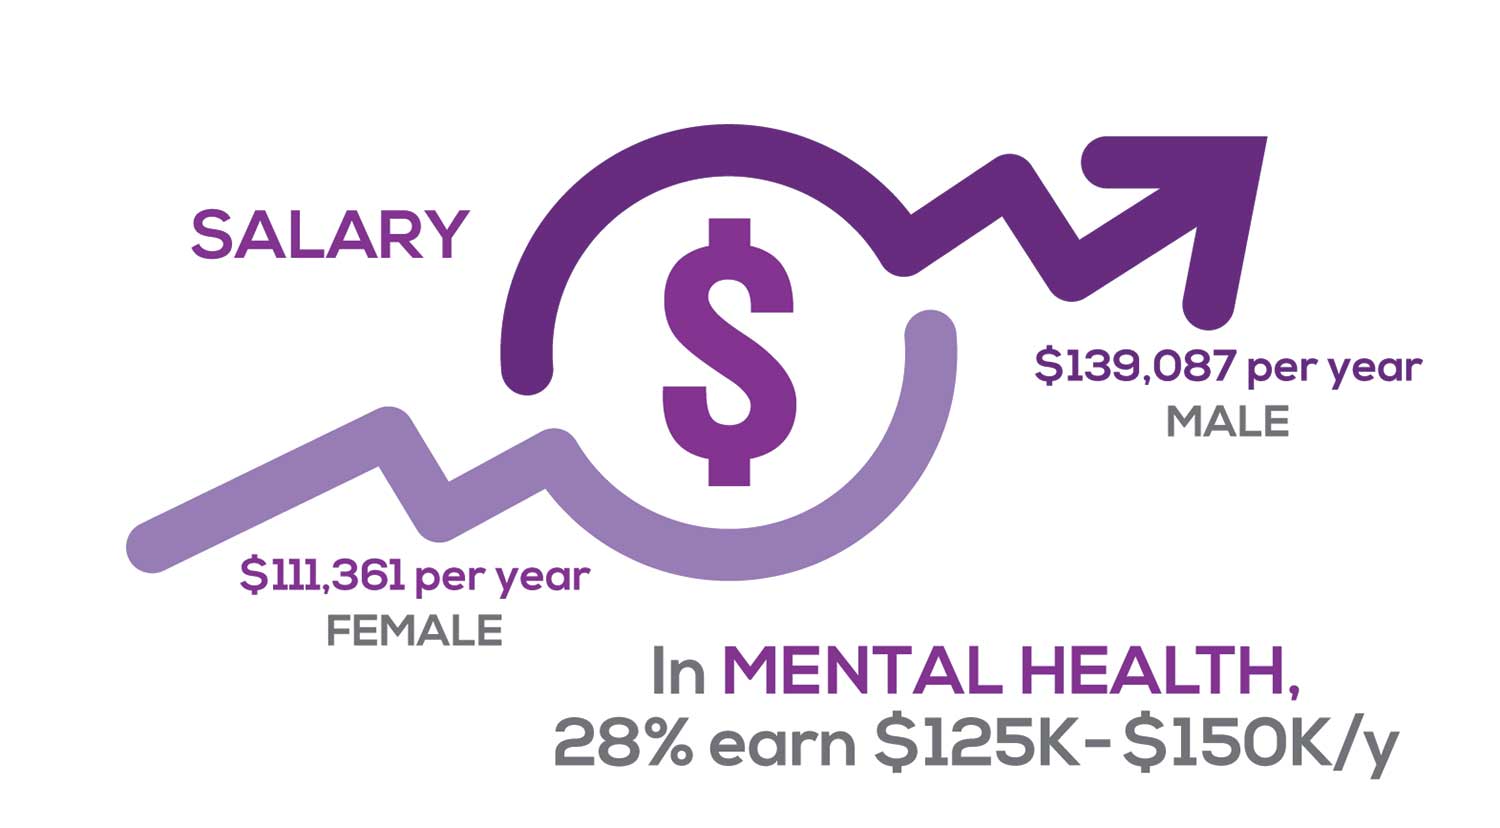
Approximately 11% of NPs earn up to $75K per year; 36% earn $100K to $125K per year; and 5% earn > $175K per year. The mean, full-time salary in 2018 was $106K per year.1 Similar to responses of previous years, women earn less than men in the NP profession.
Among NPs working in Psychiatric/Mental Health, we found that 28% earn between $125K to $150K per year, down 2% from last year. According to Pay Scale, the average salary for a Psychiatric NP is approximately $104K per year but varies according to job location.2 Although most NPs feel they are adequately compensated, we found that of NPs who practice in Pediatrics, 19% earn less than $75K per year, virtually unchanged from last year.
- NP Fact Sheet. 2018 AANP National Nurse Practitioner Sample Survey. https://www.aanp.org/about/all-about-nps/np-fact-sheet. Accessed December 19, 2019.
- Pay Scale. https://www.payscale.com/research/US/Job=Psychiatric_Nurse_Practitioner_(NP)/Salary. Accessed December 18, 2019.
WORKWEEK
Job satisfaction, and its opposite, burnout are related to your workload (ie, what you do and how much autonomy you have in deciding how to proceed). To help us evaluate these factors, we asked your colleagues to indicate how many hours per week are typically spent in direct (examine/diagnose/treat) and indirect patient care (perform and interpret labs, x-rays, refill prescriptions, etc), administrative duties, meetings, and teaching.
We were also interested in whether you assess, treat, and manage decisions
- Independently/by yourself
- In direct contact (in person or by phone) with a collaborating physician
- In consultation with a specialist
when providing patient care. Multiple answer choices were permitted.
To see what your colleagues said, go to the next page

As you can imagine, workload is a very hot topic. In response to, “What else affects your job satisfaction?” the greatest number of comments related to electronic charting and data collection. These activities are felt to demand so much time and effort that it takes away from patient care. The survey responses support this: Compared to last year, although the number of hours worked is the same this year, NPs now spend 1 hour less per week on patient care (direct and indirect) and 1 hour more on other duties (administrative and teaching). As one clinician put it, “…every year the administrative tasks increase but the admin time allowed to do these tasks does not.”
Aside from work hours, clinicians told us they seek positions that allow them “input on all issues related to practice” and flexibility on “what /who I am allowed to treat.” According to the survey, when providing patient care,
- 87% of NPs assess, treat, and manage decisions independently
- 22% collaborate with a physician
- 8% consult with a specialist
supporting the fact that 61% of NPs satisfied with your job most of the time; 11% are always satisfied.
A side note: Of the 68% of NPs who responded that they are involved in teaching students (82% of whom are NPs), they spend approximately 7 hours a week
- Either as a clinical preceptor (52%)
- In the classroom (3%)
- Or both (13%).
CE REIMBURSEMENT
As we know, NPs earn continuing education (CE) credits in order to maintain certification. Therefore, we asked you to indicate how much financial reimbursement you receive annually for CME; answer choices range from $0 to > $2,000 per year (in $500 increments). We also queried you about how much time you are allotted annually for CME; choices were from “None” to “More than 5 weeks.”
To see what your colleagues said, go to the next page
Many of your colleagues responded to the question “What else affects your job satisfaction?” with “Support for continuing learning” and “Educational opportunities.” This is reflected by 54% of survey respondents who stated that “Reimbursement for professional development” was an important benefit (see “Top 7 Benefits” above).
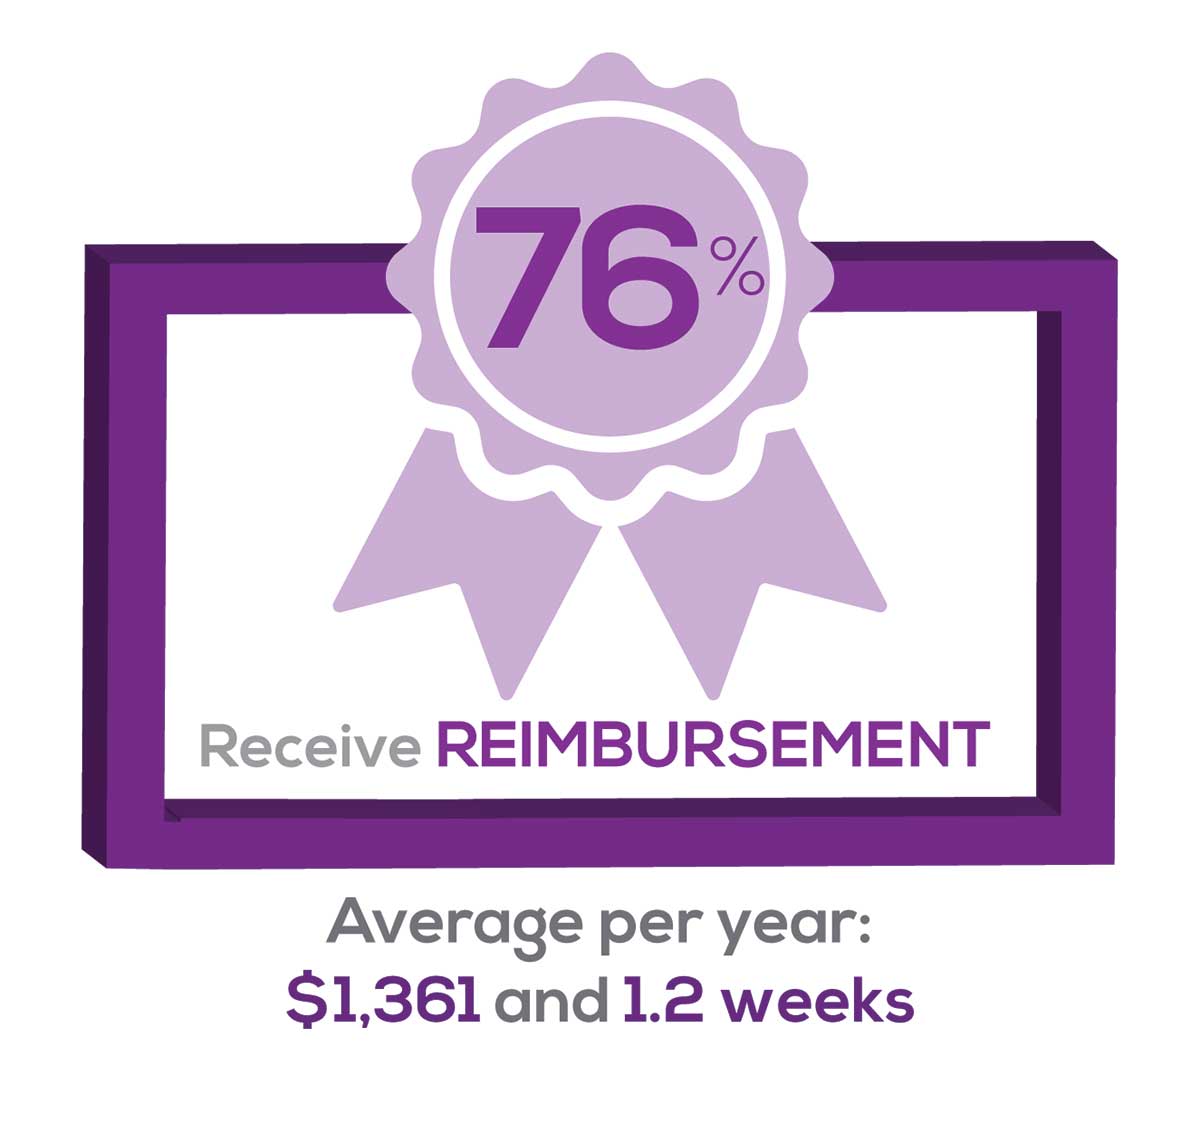
This year, 76% of respondents reported receiving remuneration—either money or time allowed or both—for CE, virtually unchanged from last year. Specifically,
- 24% received $0
- 10%, less than $500
- 13%, between $500 - $1,000
- 19%, between $1,001 - $1,500
- 19%, between $1,501 - $2,000
- 16%, more than $2,000
with average monetary compensation per year up approximately $350 over last year.
Responses to the amount of time you are allotted annually for CME ranged from “None” to “more than 5 weeks.”
- 29%, no time
- 33%, less than 1 week
- 33%, 1-2 weeks
- 2%, 3 weeks
- 1%, 4 weeks
- 0.11%, 5 weeks
- 2%, more than 5 weeks.
In closing, we offer thanks to all the survey participants whose answers helped us understand your current state of job satisfaction and most especially for your frank and enlightening responses to the open-ended questions.
METHODOLOGY
Fielded electronically under the Clinician Reviews logo, an introductory email letter signed by the Editors-in-Chief invited participation in the online 4th annual NP/PA Job Satisfaction Survey of 35 questions.
The survey was fielded August 23, 2019 to a random representative sample of NPs and PAs within the United States, excluding students. The first 150 respondents to complete the survey received a $25 Amazon.com gift certificate.
A total of 1,323 usable responses—a projectable sample size—were received by October 3, 2019, the final cut-off date.
Of the total respondents, 70% are NPs (931) and 30% are PAs (396), which is proportional to the universe of NPs and PAs.1,2 This summary of results is based on only those respondents who designated their profession as NP or PA.
- American Association of Nurse Practitioners. NP Fact Sheet. www.aanp.org/all-about-nps/np-fact-sheet. Accessed November 22, 2019.
- NCCPA. 2018 Statistical Profile of Certified Physician Assistants: an Annual Report of the National Commission on Certification of Physician Assistants. https://prodcmsstoragesa.blob.core.windows.net/uploads/files/2018StatisticalProfileofCertifiedPhysicianAssistants.pdf. Accessed November 22, 2019.
1. American Association of Nurse Practitioners. NP Fact Sheet. www.aanp.org/all-about-nps/np-fact-sheet. Accessed November 22, 2019.
2. NCCPA. 2018 Statistical Profile of Certified Physician Assistants: an Annual Report of the National Commission on Certification of Physician Assistants. https://prodcmsstoragesa.blob.core.windows.net/uploads/files/2018StatisticalProfileofCertifiedPhysicianAssistants.pdf. Accessed November 22, 2019.
“I have the best job in the world.” This statement sums up how your colleagues feel about being a NP. Although there are certainly problems that deserve attention, the vast majority of clinicians, who are highly educated and practice in all specialties, state that they would re-enter the field if choosing again.
On the following pages, we focus on the details of the survey results, with breakouts by specialty, region, and practice setting. Be sure to check out which benefits your colleagues are getting, how much they’re being reimbursed for continuing education, information about salary by gender and time spent during the workweek; and much more. Participants, invited to comment, have provided several illuminating quotes, which we’ve included throughout the article, indicating what it’s like to be “in the trenches.”
WOULD YOU REPEAT THIS?
To get to the heart of the matter, we asked our survey takers “If you were to do it again, would you choose…”
- The same career
- The same educational preparation
- The same practice setting
To see what your colleagues said, go to the next page
The majority of your peers gave an enthusiastic thumbs up to NP practice as a profession choice. Knowing what you know now, 84% of you agreed that you’d follow the same career path today as when you entered practice, which is up 2% from last year. Educational preparation came in for a ringing endorsement, increasing substantially since last year’s survey results (a 9% increase) and of practice setting up 4%.
Of NPs in practice between < 1 and 5 years, 62% felt their educational training was adequate; 74% felt their current responsibilities matched their expectations fairly accurately; and they were evenly divided on whether or not their career expectations were met.
“I enjoy being an NP and working with patients from all ethnic groups who are mostly uninsured.”
WOULD YOU TAKE A NEW JOB TODAY?
Continuing to probe about your level of satisfaction, we asked how you feel about changing your job. The answer choices were, “I would…”
- Change my job if I could get a better one (ie, better paid)
- Take any other job in which I could earn as much as I do now (ie, Yes, to leave the profession)
- Change both my job and my occupation (ie, I am burned out)
- Not make any changes (e, No, not for any reason)
We also asked you how many times have you’ve changed jobs since graduating from your PA program. The 4 answer choices ranged from “None” to “More than 3 times.” The final question asked which factors influence your decision about seeking/accepting a new position, allowing more than one choice from the list below.
- Salary/compensation
- Options for supplemental income
- Greater independence/more autonomy
- Opportunities for professional growth/development
- Formal career ladder for advancement
- Defined career path
- Recognition and appreciation
- Schedule flexibility
- Geographic location
- Access to and subsidy for more educational opportunities
- Employer reimbursement of school loans
- Specific state scope of practice and licensure law
- Work-life balance, including addressing burnout
- Working conditions
- Avoid toxic coworkers
- Top-of-the-line tools
- Telecommuting Cost of living
- Opportunity for outdoor activities/lifestyle
To see what your colleagues said, go to the next page
Compared to last year, NPs are 2% more likely to stay with their current job, stating that they would not make any changes. However, a greater number of NPs (31%) have changed jobs at the highest rate (> 3 times) compared to 25% last year.
Although 13% of NPs have never changed jobs, 37% have changed 2 or 3 times, and 31% have changed more 3 times (up 6% from last year). However, more NPs report feeling burned out (up 4% from last year) and wish to leave for another profession (up 3% from last year) compared to last year.
Respondents indicated that the following 4 factors would strongly influence their decision to seek or accept a new position:
- Salary/compensation: 82%
- Work-life balance & Schedule flexibility: 65%
- Working conditions: 63%
WHAT MAKES YOU MOST SATISFIED WITH YOUR WORK?
As you are aware, level of satisfaction depends on each of the following, which we asked respondents to rank from 1 to 5.
- Relationships with your colleagues (health care providers and clerical/admin personnel)
- Quality and duration of patient relationships
- Respect received from patients, their families, and your community
- Ability to make a difference and provide significant help to patients, their families, and your community
To see what your colleagues said, go to the next page
Echoing the survey results—which ranked “Making a difference and providing significant help” as the topmost source of job satisfaction—one of your colleagues commented that, “Ability to offer meaningful support to client needs” affected their satisfaction. On the other hand, though, one clinician wrote, “I feel like we are losing the art of caring and healing because we are rushed/pushed to do and see more.”
Compared to last year, the changes in response are
2% increase: Making a difference and providing significant help
3% increase: Respect received from patients and their families
No change: Relationships with your colleagues
3% increase: Quality and duration of patient relationships
MOST SATISFIED BY SPECIALTY
Knowing that certain specialties offer more advantages than others, we presented a list of 19 medical specialties, asking which is your primary one. We also asked how often you typically feel satisfied with your job, with these answer choices:
- Never
- Occasionally
- About half the time
- Most of the time
- Always
To see what your colleagues said, go to the next page
Correlating the data from the 2 questions (primary specialty and frequency of satisfaction) we posed, your peers indicated that the following specialties offered the highest levels of satisfaction.
- Women’s Health: 80%, a 9% increase over last year
- Primary Care & Ob/Gyn: 72%, a 3% increase over last year
- Psychiatric/Mental Health: 67%, a 6% decrease over last year
- Pediatrics: 65%, a 9% decrease over last year
MOST SATISFIED BY PRACTICE SETTING
Working conditions and coworker collegiality are integral to job satisfaction. To learn more about these factors, we asked you to identify the practice settings where you work.
- Academic setting (faculty); school/college health services
- Hospital: inpatient care; outpatient setting or community clinic
- Locum
- Physician practice: solo; single-specialty; multi-specialty
- Public health/occupational health setting; military/government
- Retail/convenient care; urgent care clinic
- Skilled nursing/long-term care facility
- NP practice
We also asked how often you typically feel satisfied with your job, with 5 answer choices ranging from “Never” to “Always.”
To see what your colleagues said, go to the next page
91% of NP respondents work as an employee; of these, 39% work in hospitals, and 25% work in physician offices.1 Therefore, it’s gratifying to see that hospital settings and physician groups are satisfying places to work. In addition, this data has not changed significantly since last year. Not surprisingly (based on comments that “ability to make administrative decisions and have a say in day-to-day operations” and “independent practice” matters), 83% of NPs who work solo were “most of the time/always” satisfied, compared with 72% of those in other practice settings.
- US Department of Health and Human Services, Health Resources and Services Administration, The U.S. Health Workforce Chartbook. Rockville, Maryland: U.S. Department of Health and Human Services, 2018.
BENEFITS
As you are aware, having access to the right benefits can go a long way to increasing job satisfaction. In addition to salary as a choice, we listed 30 benefits choices—insurance coverage, additional compensation opportunities, reimbursements, and other—asking which are offered by your employer (access) and which, in lieu of a modest increase in salary, are most important regardless of access. Your responses allowed us to identify the top 7 among your peers.
To see what your colleagues said, go to the next page
You are willing to trade a modest increase in salary for the following important benefits whether you are a new job seeker or an experienced practitioner.
- Compensation: Paid time off, retirement saving plan with employer match
- Insurance coverage: Health & dental insurance for self/family (employer subsidized), professional liability insurance
- Reimbursements: Professional development fund, licensing fees
- Other: Flexible work policy
MOST SATISFIED BY REGION
Location, location, location. Where you work depends in part on where your family is; in part on what jobs are available; what affects your commute, taxes and take home pay; and hence your satisfaction. Therefore, we asked where you work—West, Midwest, Northeast, or South—and paired the data with responses to the question about how often you typically feel satisfied with your job, with 5 answer choices ranging from “Never” to “Always.”
To see what your colleagues said, go to the next page
Geographic location is among the factors that influence the decision about seeking or accepting a new job for 50% of NP respondents. Compared to last year, satisfaction levels by region were
- 5% higher than last year in the Midwest
- 4% higher than last year in the South
- 2% lower than last year in the Northeast
- 14% lower than last year in the West
with 34% of NPs practicing in the South; 25% in the Northeast; 20% in the Midwest and West, each. 78% of NPs working in the Midwest are “most of the time/always” satisfied with their job.
SALARY
Because you indicated that salary is the most importance part of a desirable compensation package, we asked you to tell us what your salary bracket is. The amounts ranged from < $50,000 to > $175,000 per year (in $25,000 increments). Combining the responses to this question with those asking about gender and specialty, we are able to tie these factors together for you.
To see what your colleagues said, go to the next page
Approximately 11% of NPs earn up to $75K per year; 36% earn $100K to $125K per year; and 5% earn > $175K per year. The mean, full-time salary in 2018 was $106K per year.1 Similar to responses of previous years, women earn less than men in the NP profession.
Among NPs working in Psychiatric/Mental Health, we found that 28% earn between $125K to $150K per year, down 2% from last year. According to Pay Scale, the average salary for a Psychiatric NP is approximately $104K per year but varies according to job location.2 Although most NPs feel they are adequately compensated, we found that of NPs who practice in Pediatrics, 19% earn less than $75K per year, virtually unchanged from last year.
- NP Fact Sheet. 2018 AANP National Nurse Practitioner Sample Survey. https://www.aanp.org/about/all-about-nps/np-fact-sheet. Accessed December 19, 2019.
- Pay Scale. https://www.payscale.com/research/US/Job=Psychiatric_Nurse_Practitioner_(NP)/Salary. Accessed December 18, 2019.
WORKWEEK
Job satisfaction, and its opposite, burnout are related to your workload (ie, what you do and how much autonomy you have in deciding how to proceed). To help us evaluate these factors, we asked your colleagues to indicate how many hours per week are typically spent in direct (examine/diagnose/treat) and indirect patient care (perform and interpret labs, x-rays, refill prescriptions, etc), administrative duties, meetings, and teaching.
We were also interested in whether you assess, treat, and manage decisions
- Independently/by yourself
- In direct contact (in person or by phone) with a collaborating physician
- In consultation with a specialist
when providing patient care. Multiple answer choices were permitted.
To see what your colleagues said, go to the next page
As you can imagine, workload is a very hot topic. In response to, “What else affects your job satisfaction?” the greatest number of comments related to electronic charting and data collection. These activities are felt to demand so much time and effort that it takes away from patient care. The survey responses support this: Compared to last year, although the number of hours worked is the same this year, NPs now spend 1 hour less per week on patient care (direct and indirect) and 1 hour more on other duties (administrative and teaching). As one clinician put it, “…every year the administrative tasks increase but the admin time allowed to do these tasks does not.”
Aside from work hours, clinicians told us they seek positions that allow them “input on all issues related to practice” and flexibility on “what /who I am allowed to treat.” According to the survey, when providing patient care,
- 87% of NPs assess, treat, and manage decisions independently
- 22% collaborate with a physician
- 8% consult with a specialist
supporting the fact that 61% of NPs satisfied with your job most of the time; 11% are always satisfied.
A side note: Of the 68% of NPs who responded that they are involved in teaching students (82% of whom are NPs), they spend approximately 7 hours a week
- Either as a clinical preceptor (52%)
- In the classroom (3%)
- Or both (13%).
CE REIMBURSEMENT
As we know, NPs earn continuing education (CE) credits in order to maintain certification. Therefore, we asked you to indicate how much financial reimbursement you receive annually for CME; answer choices range from $0 to > $2,000 per year (in $500 increments). We also queried you about how much time you are allotted annually for CME; choices were from “None” to “More than 5 weeks.”
To see what your colleagues said, go to the next page
Many of your colleagues responded to the question “What else affects your job satisfaction?” with “Support for continuing learning” and “Educational opportunities.” This is reflected by 54% of survey respondents who stated that “Reimbursement for professional development” was an important benefit (see “Top 7 Benefits” above).
This year, 76% of respondents reported receiving remuneration—either money or time allowed or both—for CE, virtually unchanged from last year. Specifically,
- 24% received $0
- 10%, less than $500
- 13%, between $500 - $1,000
- 19%, between $1,001 - $1,500
- 19%, between $1,501 - $2,000
- 16%, more than $2,000
with average monetary compensation per year up approximately $350 over last year.
Responses to the amount of time you are allotted annually for CME ranged from “None” to “more than 5 weeks.”
- 29%, no time
- 33%, less than 1 week
- 33%, 1-2 weeks
- 2%, 3 weeks
- 1%, 4 weeks
- 0.11%, 5 weeks
- 2%, more than 5 weeks.
In closing, we offer thanks to all the survey participants whose answers helped us understand your current state of job satisfaction and most especially for your frank and enlightening responses to the open-ended questions.
METHODOLOGY
Fielded electronically under the Clinician Reviews logo, an introductory email letter signed by the Editors-in-Chief invited participation in the online 4th annual NP/PA Job Satisfaction Survey of 35 questions.
The survey was fielded August 23, 2019 to a random representative sample of NPs and PAs within the United States, excluding students. The first 150 respondents to complete the survey received a $25 Amazon.com gift certificate.
A total of 1,323 usable responses—a projectable sample size—were received by October 3, 2019, the final cut-off date.
Of the total respondents, 70% are NPs (931) and 30% are PAs (396), which is proportional to the universe of NPs and PAs.1,2 This summary of results is based on only those respondents who designated their profession as NP or PA.
- American Association of Nurse Practitioners. NP Fact Sheet. www.aanp.org/all-about-nps/np-fact-sheet. Accessed November 22, 2019.
- NCCPA. 2018 Statistical Profile of Certified Physician Assistants: an Annual Report of the National Commission on Certification of Physician Assistants. https://prodcmsstoragesa.blob.core.windows.net/uploads/files/2018StatisticalProfileofCertifiedPhysicianAssistants.pdf. Accessed November 22, 2019.
1. American Association of Nurse Practitioners. NP Fact Sheet. www.aanp.org/all-about-nps/np-fact-sheet. Accessed November 22, 2019.
2. NCCPA. 2018 Statistical Profile of Certified Physician Assistants: an Annual Report of the National Commission on Certification of Physician Assistants. https://prodcmsstoragesa.blob.core.windows.net/uploads/files/2018StatisticalProfileofCertifiedPhysicianAssistants.pdf. Accessed November 22, 2019.

Consider Ovarian Cancer as a Differential Diagnosis
This year in the United States, there were an estimated 22,530 new cases of ovarian cancer and an estimated 13,980 ovarian cancer deaths.1 Ovarian cancer accounts for more deaths than any other female reproductive system cancer.2 The high mortality rate is attributed to the advanced stage of cancer at initial presentation: Women diagnosed with localized disease have an estimated 5-year survival rate of 92%, while those diagnosed with advanced disease have a 5-year survival rate of 29%.3 For this reason, early detection of ovarian cancer is paramount.
A Personal Story
I think about ovarian cancer every day, because I am a survivor of this deadly disease. In 2018, at age 53, I received the diagnosis of stage 1A high-grade serous carcinoma of the left ovary. My cancer was discovered incidentally: I presented to my health care provider with a 6-month history of metrorrhagia and a prior history of regular menstruation with dysmenorrhea controlled with ibuprofen. My family and personal history of cancer was negative, I had a normal BMI, I didn’t smoke and consumed alcohol only moderately, my lifestyle was active, and I had no chronic diseases and used no medications regularly. My clinician performed a pelvic exam and ordered sexually transmitted infection testing and blood work (complete blood count, metabolic panel, and TSH). The differential diagnosis at this point included
- Thyroid dysfunction
- Perimenopause
- Sexually transmitted infection
- Coagulation defect
- Foreign body
- Infection.
All testing yielded normal findings. At my follow-up appointment, we discussed perimenopause symptoms and agreed that I would continue monitoring the bleeding. If at a later date I wanted to pursue an ultrasound, I was instructed to call the office. It was not suggested that I schedule a follow-up office visit.
Several months later, persistent metrorrhagia prompted me to request a transvaginal ultrasound (TVU)—resulting in the discovery of a left adnexal solid mass and probable endometrial polyp. A referral to a gynecologic oncologist resulted in further imaging, which confirmed the TVU results. Surgical intervention was recommended.
One week later, I underwent robotic-assisted total laparoscopic hysterectomy, bilateral salpingo-oophorectomy, left pelvic and periaortic lymph node dissection, and omentectomy. The pathology report confirmed stage 1A high-grade serous carcinoma of the left ovary, as well as stage 1A grade 1 endometrioid adenocarcinoma of the uterus. I required 6 cycles of chemotherapy before follow-up imaging yielded negative results, with no evidence of metastatic disease.
A Call to Action
The recently updated US Preventive Services Task Force guidelines continue not to recommend annual screening with TVU and/or cancer antigen 125 (CA-125) blood testing for ovarian cancer in asymptomatic, average-risk women. A review of the evidence found no mortality benefit and high false-positive rates, which led to unnecessary surgeries and physiologic stress due to excess cancer worry.4 This (lack of) recommendation leaves the clinician in the position of not performing or ordering screening tests, except in cases in which the patient presents with symptoms or requests screening for ovarian cancer.
Yet it cannot be overstated: The clinician’s role in identifying risk factors for and recognizing symptoms of ovarian cancer is extremely important in the absence of routine screening recommendations. Risk factors include a positive family history of gynecologic, breast, or colon cancers; genetic predisposition; personal history of breast cancer; use of menopausal hormone therapy; excess body weight; smoking; and sedentary lifestyle.3 In my case, my risk for ovarian cancer was average.
Continue to: With regard to symptoms...
With regard to symptoms, most women do not report any until ovarian cancer has reached advanced stages—and even then, the symptoms are vague and nonspecific.5 They may include urinary urgency or frequency; change in bowel habit; difficulty eating or feeling full quickly; persistent back, pelvic, or abdominal pain; extreme tiredness; vaginal bleeding after menopause; increased abdominal size; or bloating on most days.5
So what can we as clinicians do? First, if I may offer a word of caution: When confronted with those vague and nonspecific symptoms, be careful not to dismiss them out of hand as a result of aging, stress, or menopause. As my case demonstrates, for example, metrorrhagia is not necessarily a benign condition for the premenopausal woman.
Furthermore, we can empower patients by educating them about ovarian cancer symptoms and risk factors, information that may promote help-seeking behaviors that aid in early detection. In my case, the continued symptom of abnormal uterine bleeding prompted me to seek further assessment, which led to the discovery of ovarian cancer. Had I not been an educated and empowered patient, I would be telling a completely different story today—most likely one that would include advanced staging. Partner with your patient to discuss available diagnostic testing options and schedule follow-up appointments to monitor presenting complaints.
We also need to partner with our oncology colleagues and researchers. A positive diagnostic test result for possible malignancy necessitates referral to a gynecologic oncologist. Treatment by specialists in high-volume hospitals results in improved ovarian cancer outcomes.6 And we should advocate for continued research to support the discovery of an efficient population screening protocol for this deadly disease.
Finally, and perhaps most radically, I encourage you not to take a watch-and-wait approach in these situations. Ultrasounds are inexpensive, have low mortality risk, and achieve high sensitivity and specificity in detecting and managing adnexal abnormalities.7 In my opinion, the endorsement of TVU testing in this clinical situation is a proactive, prudent, and reasonable action compared with watching and waiting, and it may result in early detection as opposed to advanced disease.
Continue to: I hope that...
I hope that sharing my personal experience with ovarian cancer will compel health care providers to consider this disease as a differential diagnosis and perform appropriate testing when average-risk patients present with nonspecific symptoms. Ultimately, our collective goal should be to increase the survival rate and reduce the suffering associated with ovarian cancer.
1. National Cancer Institute. Cancer Stat Facts: Ovarian Cancer. https://seer.cancer.gov/statfacts/html/ovary.html. Accessed December 3, 2019.
2. American Cancer Society. Key Statistics for Ovarian Cancer. Revised January 8, 2019. www.cancer.org/cancer/ovarian-cancer/about/key-statistics.html. Accessed December 3, 2019.
3. American Cancer Society. Cancer Facts & Figures 2019. www.cancer.org/content/dam/cancer-org/research/cancer-facts-and-statistics/annual-cancer-facts-and-figures/2019/cancer-facts-and-figures-2019.pdf . Accessed December 4, 2019.
4. Grossman DC, Surry SJ, Owens DK, et al. Screening for ovarian cancer: US Preventive Services Task Force Recommendation Statement. JAMA. 2018;319(6):588-594.
5. Smits S, Boivin J, Menon U, Brain K. Influences on anticipated time to ovarian cancer symptom presentation in women at increased risk compared to population risk of ovarian cancer. BMC Cancer. 2017;17(814):1-11.
6. Pavlik EJ. Ten important considerations for ovarian cancer screening. Diagnostics. 2017;7(22):1-11.
7. Ormsby EL, Pavlik EJ, McGahan JP. Ultrasound monitoring of extant adnexal masses in the era of type 1 and type 2 ovarian cancers: lessons learned from ovarian cancer screening trials. Diagnostics. 2017;7(25):1-19.
Yvonne L. Chapman is with Kalamazoo Valley Community College in Michigan.
Yvonne L. Chapman is with Kalamazoo Valley Community College in Michigan.
Yvonne L. Chapman is with Kalamazoo Valley Community College in Michigan.
This year in the United States, there were an estimated 22,530 new cases of ovarian cancer and an estimated 13,980 ovarian cancer deaths.1 Ovarian cancer accounts for more deaths than any other female reproductive system cancer.2 The high mortality rate is attributed to the advanced stage of cancer at initial presentation: Women diagnosed with localized disease have an estimated 5-year survival rate of 92%, while those diagnosed with advanced disease have a 5-year survival rate of 29%.3 For this reason, early detection of ovarian cancer is paramount.
A Personal Story
I think about ovarian cancer every day, because I am a survivor of this deadly disease. In 2018, at age 53, I received the diagnosis of stage 1A high-grade serous carcinoma of the left ovary. My cancer was discovered incidentally: I presented to my health care provider with a 6-month history of metrorrhagia and a prior history of regular menstruation with dysmenorrhea controlled with ibuprofen. My family and personal history of cancer was negative, I had a normal BMI, I didn’t smoke and consumed alcohol only moderately, my lifestyle was active, and I had no chronic diseases and used no medications regularly. My clinician performed a pelvic exam and ordered sexually transmitted infection testing and blood work (complete blood count, metabolic panel, and TSH). The differential diagnosis at this point included
- Thyroid dysfunction
- Perimenopause
- Sexually transmitted infection
- Coagulation defect
- Foreign body
- Infection.
All testing yielded normal findings. At my follow-up appointment, we discussed perimenopause symptoms and agreed that I would continue monitoring the bleeding. If at a later date I wanted to pursue an ultrasound, I was instructed to call the office. It was not suggested that I schedule a follow-up office visit.
Several months later, persistent metrorrhagia prompted me to request a transvaginal ultrasound (TVU)—resulting in the discovery of a left adnexal solid mass and probable endometrial polyp. A referral to a gynecologic oncologist resulted in further imaging, which confirmed the TVU results. Surgical intervention was recommended.
One week later, I underwent robotic-assisted total laparoscopic hysterectomy, bilateral salpingo-oophorectomy, left pelvic and periaortic lymph node dissection, and omentectomy. The pathology report confirmed stage 1A high-grade serous carcinoma of the left ovary, as well as stage 1A grade 1 endometrioid adenocarcinoma of the uterus. I required 6 cycles of chemotherapy before follow-up imaging yielded negative results, with no evidence of metastatic disease.
A Call to Action
The recently updated US Preventive Services Task Force guidelines continue not to recommend annual screening with TVU and/or cancer antigen 125 (CA-125) blood testing for ovarian cancer in asymptomatic, average-risk women. A review of the evidence found no mortality benefit and high false-positive rates, which led to unnecessary surgeries and physiologic stress due to excess cancer worry.4 This (lack of) recommendation leaves the clinician in the position of not performing or ordering screening tests, except in cases in which the patient presents with symptoms or requests screening for ovarian cancer.
Yet it cannot be overstated: The clinician’s role in identifying risk factors for and recognizing symptoms of ovarian cancer is extremely important in the absence of routine screening recommendations. Risk factors include a positive family history of gynecologic, breast, or colon cancers; genetic predisposition; personal history of breast cancer; use of menopausal hormone therapy; excess body weight; smoking; and sedentary lifestyle.3 In my case, my risk for ovarian cancer was average.
Continue to: With regard to symptoms...
With regard to symptoms, most women do not report any until ovarian cancer has reached advanced stages—and even then, the symptoms are vague and nonspecific.5 They may include urinary urgency or frequency; change in bowel habit; difficulty eating or feeling full quickly; persistent back, pelvic, or abdominal pain; extreme tiredness; vaginal bleeding after menopause; increased abdominal size; or bloating on most days.5
So what can we as clinicians do? First, if I may offer a word of caution: When confronted with those vague and nonspecific symptoms, be careful not to dismiss them out of hand as a result of aging, stress, or menopause. As my case demonstrates, for example, metrorrhagia is not necessarily a benign condition for the premenopausal woman.
Furthermore, we can empower patients by educating them about ovarian cancer symptoms and risk factors, information that may promote help-seeking behaviors that aid in early detection. In my case, the continued symptom of abnormal uterine bleeding prompted me to seek further assessment, which led to the discovery of ovarian cancer. Had I not been an educated and empowered patient, I would be telling a completely different story today—most likely one that would include advanced staging. Partner with your patient to discuss available diagnostic testing options and schedule follow-up appointments to monitor presenting complaints.
We also need to partner with our oncology colleagues and researchers. A positive diagnostic test result for possible malignancy necessitates referral to a gynecologic oncologist. Treatment by specialists in high-volume hospitals results in improved ovarian cancer outcomes.6 And we should advocate for continued research to support the discovery of an efficient population screening protocol for this deadly disease.
Finally, and perhaps most radically, I encourage you not to take a watch-and-wait approach in these situations. Ultrasounds are inexpensive, have low mortality risk, and achieve high sensitivity and specificity in detecting and managing adnexal abnormalities.7 In my opinion, the endorsement of TVU testing in this clinical situation is a proactive, prudent, and reasonable action compared with watching and waiting, and it may result in early detection as opposed to advanced disease.
Continue to: I hope that...
I hope that sharing my personal experience with ovarian cancer will compel health care providers to consider this disease as a differential diagnosis and perform appropriate testing when average-risk patients present with nonspecific symptoms. Ultimately, our collective goal should be to increase the survival rate and reduce the suffering associated with ovarian cancer.
1. National Cancer Institute. Cancer Stat Facts: Ovarian Cancer. https://seer.cancer.gov/statfacts/html/ovary.html. Accessed December 3, 2019.
2. American Cancer Society. Key Statistics for Ovarian Cancer. Revised January 8, 2019. www.cancer.org/cancer/ovarian-cancer/about/key-statistics.html. Accessed December 3, 2019.
3. American Cancer Society. Cancer Facts & Figures 2019. www.cancer.org/content/dam/cancer-org/research/cancer-facts-and-statistics/annual-cancer-facts-and-figures/2019/cancer-facts-and-figures-2019.pdf . Accessed December 4, 2019.
4. Grossman DC, Surry SJ, Owens DK, et al. Screening for ovarian cancer: US Preventive Services Task Force Recommendation Statement. JAMA. 2018;319(6):588-594.
5. Smits S, Boivin J, Menon U, Brain K. Influences on anticipated time to ovarian cancer symptom presentation in women at increased risk compared to population risk of ovarian cancer. BMC Cancer. 2017;17(814):1-11.
6. Pavlik EJ. Ten important considerations for ovarian cancer screening. Diagnostics. 2017;7(22):1-11.
7. Ormsby EL, Pavlik EJ, McGahan JP. Ultrasound monitoring of extant adnexal masses in the era of type 1 and type 2 ovarian cancers: lessons learned from ovarian cancer screening trials. Diagnostics. 2017;7(25):1-19.

Fast-tracking psilocybin for refractory depression makes sense
A significant proportion of patients with major depressive disorder (MDD) either do not respond or have partial responses to the currently available Food and Drug Administration–approved antidepressants.

In controlled clinical trials, there is about a 40%-60% symptom remission rate with a 20%-40% remission rate in community-based treatment settings. Not only do those medications lack efficacy in treating MDD, but there are currently no cures for this debilitating illness. As a result, many patients with MDD continue to suffer.

In response to those poor outcomes, researchers and clinicians have developed algorithms aimed at diagnosing the condition of treatment-resistant depression (TRD),1 which enable opportunities for various treatment methods.2 Several studies underway across the United States are testing what some might consider medically invasive procedures, such as electroconvulsive therapy (ECT), deep brain stimulation (DBS), and vagus nerve stimulation (VNS). ECT often is considered the gold standard of treatment response, but it requires anesthesia, induces a convulsion, and needs a willing patient and clinician. DBS has been used more widely in neurological treatment of movement disorders. Pioneering neurosurgical treatment for TRD reported recently in the American Journal of Psychiatry found that DBS of an area in the brain called the subcallosal cingulate produces clear and apparently sustained antidepressant effects.3 VNS4 remains an experimental treatment for MDD. TMS is safe, noninvasive, and approved by the FDA for depression, but responses appear similar to those with usual antidepressants.
It is not surprising, given those outcomes, that ketamine was fast-tracked in 2016. The enthusiasm related to ketamine’s effect on MDD and TRD has grown over time as more research findings reach the public. While it is unknown how ketamine affects the biological neural network, a single intravenous dose of ketamine (0.5 mg/kg) in patients diagnosed with TRD can lead to improved depression symptoms outcomes within a few hours – and those effects were sustained in 65%-70% of patients at 24 hours. Antidepressants take many weeks to show effects. Ketamine’s exciting findings also offered hope to clinicians and patients trying to manage suicidal thoughts and plans. Ketamine was quickly approved by the FDA as a nasal spray medication.
Now, in another encouraging development, the FDA has granted the Usona Institute Breakthrough Therapy designation for psilocybin for the treatment of MDD. The medical benefits of psilocybin, or “magic mushrooms,” has a long empirical history in our literature. Most recently, psilocybin was featured on “60 Minutes,”5 and in his book, “How to Change Your Mind,”6Michael Pollan details how psychedelic drugs where used to investigate and treat psychiatric disorders until the 1960s, when street use and unsupervised administration led to restrictions on their research and clinical use.
With protocol-driven specific trials, they might become critical medications for a wide range of psychiatric disorders, such as depression, PTSD, anxiety, and addictions. Exciting findings are coming from Roland R. Griffiths, PhD, and his team at Johns Hopkins University’s Center for Psychedelic and Consciousness Research. In a recent study8 with cancer patients suffering from depression and anxiety, carefully administered, specific and supervised high doses of psilocybin produced decreases in depression and anxiety, and increases in quality of life and life meaning attitudes. Those improved attitudes, behavior, and responses were sustained by 80% of the sample 6 months post treatment.
Dr. Griffiths’ center is collaborating with Usona, and this collaboration should result in specific guidelines for dose, safety, and protection against abuse and diversion,9 as the study and FDA trials for ketamine have as well.10 It is very encouraging that psychedelic drugs are receiving fast-track designations, and this development reflects a shift in the risk-benefit considerations taking place in our society. Changing attitudes about depression and other psychiatric diseases are encouraging new approaches and new treatments. Psychiatric suffering and pain are being prioritized in research and appreciated by the general public as devastating. Serious, random assignment placebo-controlled and double- blind research studies will define just how valuable these medications might be, what is the safe dose and duration, and for whom they might prove more effective than existing treatments.
The process will take some time. And it is worth remembering that, although research has been promising,11 the number of patients studied, research design, and outcomes are not yet proven for psilosybin.12 The FDA fast-track makes sense, and the agency should continue supporting these efforts for psychedelics. In fact, we think the FDA also should support the promising trials of nitrous oxide13 (laughing gas), and other safe and novel approaches to successfully treat refractory depression. While we wait for personalized psychiatric medicines to be developed and validated through the long process of FDA approval, we will at least have a larger suite of treatment options to match patients with, along with some new algorithms that treat MDD,* TRD, and other disorders just are around the corner.
Dr. Patterson Silver Wolf is an associate professor at Washington University in St. Louis’s Brown School of Social Work. He is a training faculty member for two National Institutes of Health–funded (T32) training programs and serves as the director of the Community Academic Partnership on Addiction (CAPA). He’s chief research officer at the new CAPA Clinic, a teaching addiction treatment facility that is incorporating and testing various performance-based practice technology tools to respond to the opioid crisis and improve addiction treatment outcomes. Dr. Gold is professor of psychiatry (adjunct) at Washington University, St. Louis. He is the 17th Distinguished Alumni Professor at the University of Florida, Gainesville. For more than 40 years, Dr. Gold has worked on developing models for understanding the effects of opioid, tobacco, cocaine, and other drugs, as well as food, on the brain and behavior. He has written several books and published more than 1,000 peer-reviewed scientific articles, texts, and practice guidelines.
References
1. Sackeim HA et al. J Psychiatr Res. 2019 Jun;113:125-36.
2. Conway CR et al. J Clin Psychiatry. 25 Nov;76(11):1569-70.
3. Crowell AL et al. Am J Psychiatry. 2019 Oct 4. doi: 10.1176.appi.ajp.2019.18121427.
4. Kumar A et al. Neuropsychiatr Dis Treat. 2019 Feb 13;15:457-68.
5. Psilocybin sessions: Psychedelics could help people with addiction and anxiety. “60 Minutes” CBS News. 2019 Oct 13.
6. Pollan M. How to Change Your Mind: What the New Science of Psychedelics Teaches Us About Consciousness, Dying, Addiction, Depression, and Transcendence (Penguin Random House, 2018).
7. Nutt D. Dialogues Clin Neurosci. 2019;21(2):139-47.
8. Griffiths RR et al. J Psychopharmacol 2016 Dec;30(12):1181-97.
9. Johnson MW et al. Neuropsychopharmacology. 2018 Nov;142:143-66.
10. Schwenk ES et al. Reg Anesth Pain Med. 2018 Jul;43(5):456-66.
11. Johnson MW et al. Neurotherapeutics. 2017 Jul;14(3):734-40.
12. Mutonni S et al. J Affect Disord. 2019 Nov.1;258:11-24.
13. Nagele P et al. J Clin Psychopharmacol. 2018 Apr;38(2):144-8.
*Correction, 1/9/2020: An earlier version of this story misidentified the intended disease state.
A significant proportion of patients with major depressive disorder (MDD) either do not respond or have partial responses to the currently available Food and Drug Administration–approved antidepressants.
In controlled clinical trials, there is about a 40%-60% symptom remission rate with a 20%-40% remission rate in community-based treatment settings. Not only do those medications lack efficacy in treating MDD, but there are currently no cures for this debilitating illness. As a result, many patients with MDD continue to suffer.
In response to those poor outcomes, researchers and clinicians have developed algorithms aimed at diagnosing the condition of treatment-resistant depression (TRD),1 which enable opportunities for various treatment methods.2 Several studies underway across the United States are testing what some might consider medically invasive procedures, such as electroconvulsive therapy (ECT), deep brain stimulation (DBS), and vagus nerve stimulation (VNS). ECT often is considered the gold standard of treatment response, but it requires anesthesia, induces a convulsion, and needs a willing patient and clinician. DBS has been used more widely in neurological treatment of movement disorders. Pioneering neurosurgical treatment for TRD reported recently in the American Journal of Psychiatry found that DBS of an area in the brain called the subcallosal cingulate produces clear and apparently sustained antidepressant effects.3 VNS4 remains an experimental treatment for MDD. TMS is safe, noninvasive, and approved by the FDA for depression, but responses appear similar to those with usual antidepressants.
It is not surprising, given those outcomes, that ketamine was fast-tracked in 2016. The enthusiasm related to ketamine’s effect on MDD and TRD has grown over time as more research findings reach the public. While it is unknown how ketamine affects the biological neural network, a single intravenous dose of ketamine (0.5 mg/kg) in patients diagnosed with TRD can lead to improved depression symptoms outcomes within a few hours – and those effects were sustained in 65%-70% of patients at 24 hours. Antidepressants take many weeks to show effects. Ketamine’s exciting findings also offered hope to clinicians and patients trying to manage suicidal thoughts and plans. Ketamine was quickly approved by the FDA as a nasal spray medication.
Now, in another encouraging development, the FDA has granted the Usona Institute Breakthrough Therapy designation for psilocybin for the treatment of MDD. The medical benefits of psilocybin, or “magic mushrooms,” has a long empirical history in our literature. Most recently, psilocybin was featured on “60 Minutes,”5 and in his book, “How to Change Your Mind,”6Michael Pollan details how psychedelic drugs where used to investigate and treat psychiatric disorders until the 1960s, when street use and unsupervised administration led to restrictions on their research and clinical use.
With protocol-driven specific trials, they might become critical medications for a wide range of psychiatric disorders, such as depression, PTSD, anxiety, and addictions. Exciting findings are coming from Roland R. Griffiths, PhD, and his team at Johns Hopkins University’s Center for Psychedelic and Consciousness Research. In a recent study8 with cancer patients suffering from depression and anxiety, carefully administered, specific and supervised high doses of psilocybin produced decreases in depression and anxiety, and increases in quality of life and life meaning attitudes. Those improved attitudes, behavior, and responses were sustained by 80% of the sample 6 months post treatment.
Dr. Griffiths’ center is collaborating with Usona, and this collaboration should result in specific guidelines for dose, safety, and protection against abuse and diversion,9 as the study and FDA trials for ketamine have as well.10 It is very encouraging that psychedelic drugs are receiving fast-track designations, and this development reflects a shift in the risk-benefit considerations taking place in our society. Changing attitudes about depression and other psychiatric diseases are encouraging new approaches and new treatments. Psychiatric suffering and pain are being prioritized in research and appreciated by the general public as devastating. Serious, random assignment placebo-controlled and double- blind research studies will define just how valuable these medications might be, what is the safe dose and duration, and for whom they might prove more effective than existing treatments.
The process will take some time. And it is worth remembering that, although research has been promising,11 the number of patients studied, research design, and outcomes are not yet proven for psilosybin.12 The FDA fast-track makes sense, and the agency should continue supporting these efforts for psychedelics. In fact, we think the FDA also should support the promising trials of nitrous oxide13 (laughing gas), and other safe and novel approaches to successfully treat refractory depression. While we wait for personalized psychiatric medicines to be developed and validated through the long process of FDA approval, we will at least have a larger suite of treatment options to match patients with, along with some new algorithms that treat MDD,* TRD, and other disorders just are around the corner.
Dr. Patterson Silver Wolf is an associate professor at Washington University in St. Louis’s Brown School of Social Work. He is a training faculty member for two National Institutes of Health–funded (T32) training programs and serves as the director of the Community Academic Partnership on Addiction (CAPA). He’s chief research officer at the new CAPA Clinic, a teaching addiction treatment facility that is incorporating and testing various performance-based practice technology tools to respond to the opioid crisis and improve addiction treatment outcomes. Dr. Gold is professor of psychiatry (adjunct) at Washington University, St. Louis. He is the 17th Distinguished Alumni Professor at the University of Florida, Gainesville. For more than 40 years, Dr. Gold has worked on developing models for understanding the effects of opioid, tobacco, cocaine, and other drugs, as well as food, on the brain and behavior. He has written several books and published more than 1,000 peer-reviewed scientific articles, texts, and practice guidelines.
References
1. Sackeim HA et al. J Psychiatr Res. 2019 Jun;113:125-36.
2. Conway CR et al. J Clin Psychiatry. 25 Nov;76(11):1569-70.
3. Crowell AL et al. Am J Psychiatry. 2019 Oct 4. doi: 10.1176.appi.ajp.2019.18121427.
4. Kumar A et al. Neuropsychiatr Dis Treat. 2019 Feb 13;15:457-68.
5. Psilocybin sessions: Psychedelics could help people with addiction and anxiety. “60 Minutes” CBS News. 2019 Oct 13.
6. Pollan M. How to Change Your Mind: What the New Science of Psychedelics Teaches Us About Consciousness, Dying, Addiction, Depression, and Transcendence (Penguin Random House, 2018).
7. Nutt D. Dialogues Clin Neurosci. 2019;21(2):139-47.
8. Griffiths RR et al. J Psychopharmacol 2016 Dec;30(12):1181-97.
9. Johnson MW et al. Neuropsychopharmacology. 2018 Nov;142:143-66.
10. Schwenk ES et al. Reg Anesth Pain Med. 2018 Jul;43(5):456-66.
11. Johnson MW et al. Neurotherapeutics. 2017 Jul;14(3):734-40.
12. Mutonni S et al. J Affect Disord. 2019 Nov.1;258:11-24.
13. Nagele P et al. J Clin Psychopharmacol. 2018 Apr;38(2):144-8.
*Correction, 1/9/2020: An earlier version of this story misidentified the intended disease state.
What to do when the evidence is not conclusive
Family physicians try to base treatment decisions on the very best available evidence from randomized trials and other high-quality studies. Very often, however, the evidence is not conclusive. Family physicians are confronted with questions about a wide variety of treatments that may or may not be effective. The classic example for me is the use of chondroitin sulfate/glucosamine for knee osteoarthritis. The preponderance of evidence tells us it is not effective, but one long-term clinical trial did find some benefit.1 And some patients swear by it!
In this issue of JFP, we have 2 articles that fall into this category: 1 by Hahn about the treatment of asthma with macrolides and the other by Sorsby et al about use of positive airway pressure (PAP) for obstructive sleep apnea (OSA).
The article by Hahn is an extensive literature review regarding the effectiveness of macrolides for asthma. Despite 2 meta-analyses and many clinical trials, the results are not conclusive; but they are highly suggestive that macrolides may benefit patients with new-onset asthma and severe asthma that does not respond completely to mainstream treatments. Why don't we have conclusive evidence? Because the right studies have not been done. Most studies of macrolides for asthma have not focused on these 2 groups, so any treatment effect may have been diluted by including patients not likely to respond.
The issue with PAP, also known as CPAP (or continuous positive airway pressure), for the treatment of OSA is different. In this case, the question is: What conditions and outcomes are improved by use of PAP? Studies strongly support that PAP is effective in reducing daytime sleepiness and motor vehicle accidents associated with OSA. Most of us had high hopes that PAP also would reduce the adverse cardiovascular outcomes associated with OSA. But the results of large randomized trials have not found a protective effective.
Enthusiasts argue that the studies have not been of sufficient duration and that the participants did not use their PAP devices long enough each night. Some follow-up studies have suggested a protective effective when the device is used for many years, but those studies have the major flaw of volunteer bias, meaning those who adhere to any treatment have better health outcomes than those who do not adhere.
What should you do when there is uncertainty regarding effectiveness? Use shared decision making: What does the patient want to do after you have explained the possible benefits and harms?
1. Reginster JY, Deroisy R, Rovati LC, et. al. Long-term effects of glucosamine sulphate on osteoarthritis progression: a randomised, placebo-controlled clinical trial. Lancet. 2001;357:251–256.
Editor-in-Chief
Editor-in-Chief
Editor-in-Chief
Family physicians try to base treatment decisions on the very best available evidence from randomized trials and other high-quality studies. Very often, however, the evidence is not conclusive. Family physicians are confronted with questions about a wide variety of treatments that may or may not be effective. The classic example for me is the use of chondroitin sulfate/glucosamine for knee osteoarthritis. The preponderance of evidence tells us it is not effective, but one long-term clinical trial did find some benefit.1 And some patients swear by it!
In this issue of JFP, we have 2 articles that fall into this category: 1 by Hahn about the treatment of asthma with macrolides and the other by Sorsby et al about use of positive airway pressure (PAP) for obstructive sleep apnea (OSA).
The article by Hahn is an extensive literature review regarding the effectiveness of macrolides for asthma. Despite 2 meta-analyses and many clinical trials, the results are not conclusive; but they are highly suggestive that macrolides may benefit patients with new-onset asthma and severe asthma that does not respond completely to mainstream treatments. Why don't we have conclusive evidence? Because the right studies have not been done. Most studies of macrolides for asthma have not focused on these 2 groups, so any treatment effect may have been diluted by including patients not likely to respond.
The issue with PAP, also known as CPAP (or continuous positive airway pressure), for the treatment of OSA is different. In this case, the question is: What conditions and outcomes are improved by use of PAP? Studies strongly support that PAP is effective in reducing daytime sleepiness and motor vehicle accidents associated with OSA. Most of us had high hopes that PAP also would reduce the adverse cardiovascular outcomes associated with OSA. But the results of large randomized trials have not found a protective effective.
Enthusiasts argue that the studies have not been of sufficient duration and that the participants did not use their PAP devices long enough each night. Some follow-up studies have suggested a protective effective when the device is used for many years, but those studies have the major flaw of volunteer bias, meaning those who adhere to any treatment have better health outcomes than those who do not adhere.
What should you do when there is uncertainty regarding effectiveness? Use shared decision making: What does the patient want to do after you have explained the possible benefits and harms?
1. Reginster JY, Deroisy R, Rovati LC, et. al. Long-term effects of glucosamine sulphate on osteoarthritis progression: a randomised, placebo-controlled clinical trial. Lancet. 2001;357:251–256.
1. Reginster JY, Deroisy R, Rovati LC, et. al. Long-term effects of glucosamine sulphate on osteoarthritis progression: a randomised, placebo-controlled clinical trial. Lancet. 2001;357:251–256.
Updates in Our Understanding of Central Centrifugal Cicatricial Alopecia
It has been more than 50 years since central centrifugal cicatricial alopecia (CCCA) was first defined by LoPresti and colleagues1 as hot comb alopecia. Fifty years later, we are only just starting to understand the pathogenesis of CCCA and its systemic implications.
Then and Now
The use of hot combs, a metal device used to straighten naturally curly hair, was ubiquitous in the households of black women in the 1960s. It is no surprise then that this styling process was labeled as the culprit of this disease that affects black women almost exclusively. As the use of hot combs waned but the prevalence of CCCA persisted, its name evolved to chemically induced alopecia—an ode to the popular styling product of the 1990s, the chemical relaxer—and eventually CCCA, a name that reflects its clinical progression and histologic findings.2
Since then, research has explored the association with systemic diseases, some noting increased rates of type 2 diabetes mellitus and thyroid disease, and more recently, an increased rate of fibroids in affected patients.3,4
Clues to Pathogenesis
Compared to other primary cicatricial alopecias, CCCA is unique in that active progression is difficult to detect. Symptoms, such as pruritus, often are minimal or absent, rendering clinical assessment quite difficult.5 Unlike other forms of scarring hair loss, fibrosis, not inflammation, is the predominant clinical feature. The clinical presentation is not unlike a group of disorders termed fibroproliferative disorders, which includes systemic sclerosis, uterine fibroids, atherosclerosis, and keloids, among others. It has been postulated that diseases of aberrant scarring are more common in black individuals due to the protective effect profibrotic alleles have against endemic helminthic infections of sub-Saharan infections, including oncocerciasis.6
A recent study showed an increased expression of fibroproliferative genes, particularly those implicated in other fibroproliferative disorders, in affected scalp of patients with CCCA.7 Most notably, an expression in gene overlap was noted between fibroids and CCCA in this study, though the relationship between these two diseases needs to be further explored.
Gene Variants Identified in CCCA
More recently, a new study has identified a gene variant of peptidyl arginine deiminase 3, PADI3, that is present in approximately one-quarter of studied patients with CCCA.8PADI3 plays a role in hair shaft formation and has been implicated in another hair disorder, uncombable hair syndrome, though the latter presents in children, improves with age, and is not associated with a scarring phenotype.9 However, this study has provided greater insight into our understanding of CCCA by establishing a possible genetic predisposition in patients affected with this disease.8
What’s Next for CCCA?
For years, many patients with CCCA have been turned away with few answers and left thinking that it is their own styling habits that have led to their hair loss,
The future is bright for CCCA. Although our understanding of CCCA is still in its infancy, it is my hope that with greater understanding of this disease will come greater empathy for our patients.
- LoPresti P, Papa CM, Kligman AM. Hot comb alopecia. Arch Dermatol. 1968;98:234-238.
- Gathers RC, Lim HW. Central centrifugal cicatricial alopecia: past, present, and future. J Am Acad Dermatol. 2009;60:660-668.
- Kyei A, Bergfeld WF, Piliang M, et al. Medical and environmental risk factors for the development of central centrifugal cicatricial alopecia: a population study. Arch Dermatol. 2011;147:909-914.
- Dina Y, Okoye GA, Aguh C. Association of uterine leiomyomas with central centrifugal cicatricial alopecia. JAMA Dermatol. 2018;154:213-214.
- Whiting DA, Olsen EA. Central centrifugal cicatricial alopecia. Dermatol Ther. 2008;21:268-278.
- Hellwege JN, Torstenson ES, Russell SB, et al. Evidence of selection as a cause for racial disparities in fibroproliferative disease. PLoS One. 2017;12:e0182791. doi:10.1371/journal.pone.0182791.
- Aguh C, Dina Y, Talbot CC Jr, et al. Fibroproliferative genes are preferentially expressed in central centrifugal cicatricial alopecia. J Am Acad Dermatol. 2018;79:904.e1-912.e1.
- Malki L, Sarig O, Romano MT, et al. Variant PADI3 in central centrifugal cicatricial alopecia. N Engl J Med. 2019;380:833-841.
- Matis WL, Baden H, Green R, et al. Uncombable-hair syndrome. Pediatr Dermatol. 1987;4:215-219.
It has been more than 50 years since central centrifugal cicatricial alopecia (CCCA) was first defined by LoPresti and colleagues1 as hot comb alopecia. Fifty years later, we are only just starting to understand the pathogenesis of CCCA and its systemic implications.
Then and Now
The use of hot combs, a metal device used to straighten naturally curly hair, was ubiquitous in the households of black women in the 1960s. It is no surprise then that this styling process was labeled as the culprit of this disease that affects black women almost exclusively. As the use of hot combs waned but the prevalence of CCCA persisted, its name evolved to chemically induced alopecia—an ode to the popular styling product of the 1990s, the chemical relaxer—and eventually CCCA, a name that reflects its clinical progression and histologic findings.2
Since then, research has explored the association with systemic diseases, some noting increased rates of type 2 diabetes mellitus and thyroid disease, and more recently, an increased rate of fibroids in affected patients.3,4
Clues to Pathogenesis
Compared to other primary cicatricial alopecias, CCCA is unique in that active progression is difficult to detect. Symptoms, such as pruritus, often are minimal or absent, rendering clinical assessment quite difficult.5 Unlike other forms of scarring hair loss, fibrosis, not inflammation, is the predominant clinical feature. The clinical presentation is not unlike a group of disorders termed fibroproliferative disorders, which includes systemic sclerosis, uterine fibroids, atherosclerosis, and keloids, among others. It has been postulated that diseases of aberrant scarring are more common in black individuals due to the protective effect profibrotic alleles have against endemic helminthic infections of sub-Saharan infections, including oncocerciasis.6
A recent study showed an increased expression of fibroproliferative genes, particularly those implicated in other fibroproliferative disorders, in affected scalp of patients with CCCA.7 Most notably, an expression in gene overlap was noted between fibroids and CCCA in this study, though the relationship between these two diseases needs to be further explored.
Gene Variants Identified in CCCA
More recently, a new study has identified a gene variant of peptidyl arginine deiminase 3, PADI3, that is present in approximately one-quarter of studied patients with CCCA.8PADI3 plays a role in hair shaft formation and has been implicated in another hair disorder, uncombable hair syndrome, though the latter presents in children, improves with age, and is not associated with a scarring phenotype.9 However, this study has provided greater insight into our understanding of CCCA by establishing a possible genetic predisposition in patients affected with this disease.8
What’s Next for CCCA?
For years, many patients with CCCA have been turned away with few answers and left thinking that it is their own styling habits that have led to their hair loss,
The future is bright for CCCA. Although our understanding of CCCA is still in its infancy, it is my hope that with greater understanding of this disease will come greater empathy for our patients.
- LoPresti P, Papa CM, Kligman AM. Hot comb alopecia. Arch Dermatol. 1968;98:234-238.
- Gathers RC, Lim HW. Central centrifugal cicatricial alopecia: past, present, and future. J Am Acad Dermatol. 2009;60:660-668.
- Kyei A, Bergfeld WF, Piliang M, et al. Medical and environmental risk factors for the development of central centrifugal cicatricial alopecia: a population study. Arch Dermatol. 2011;147:909-914.
- Dina Y, Okoye GA, Aguh C. Association of uterine leiomyomas with central centrifugal cicatricial alopecia. JAMA Dermatol. 2018;154:213-214.
- Whiting DA, Olsen EA. Central centrifugal cicatricial alopecia. Dermatol Ther. 2008;21:268-278.
- Hellwege JN, Torstenson ES, Russell SB, et al. Evidence of selection as a cause for racial disparities in fibroproliferative disease. PLoS One. 2017;12:e0182791. doi:10.1371/journal.pone.0182791.
- Aguh C, Dina Y, Talbot CC Jr, et al. Fibroproliferative genes are preferentially expressed in central centrifugal cicatricial alopecia. J Am Acad Dermatol. 2018;79:904.e1-912.e1.
- Malki L, Sarig O, Romano MT, et al. Variant PADI3 in central centrifugal cicatricial alopecia. N Engl J Med. 2019;380:833-841.
- Matis WL, Baden H, Green R, et al. Uncombable-hair syndrome. Pediatr Dermatol. 1987;4:215-219.

Reducing the Cost of Dermatology Residency Applications: An Applicant’s Perspective
Another Match Day is approaching. Students find themselves paying more each year to apply to one of the most competitive fields, while program directors struggle to sort through hundreds of stellar applications to invite a handful of candidates for interviews. Estimates place the cost of the application process at $5 million in total for all medical school seniors, or roughly $10,000 per applicant.1 Approximately 60% of these costs occur during the interview process.1,2 In an era in which students routinely graduate medical school with hundreds of thousands of dollars of debt, these costs must be addressed as soon as possible.
This problem is not unique to dermatology; otolaryngology, another especially competitive field, has considered various changes to the match process based on applicants’ feedback.3 As an applicant during the 2018-2019 match cycle for dermatology, I offer 2 solutions that are a starting point aimed at streamlining the application process for both applicants and program directors: regional interview coordination and a cap on the number of residency applications.
Regional Interview Coordination
Regional interview coordination would reduce travel costs and facilitate greater predictability in scheduling clinical rotations. In the current climate, it is not uncommon for applicants to make multiple cross-country round trips in the same week, especially given that the interview season for dermatology, including interviews for preliminary programs, now ranges from mid-October to early February. Although affluent applicants may not be concerned with financial costs of frequent travel, all applicants face travel inconveniences that could be mitigated through regional coordination. For example, an applicant invited to multiple interviews in the New York City area could reserve a room in a single hotel over a period of several days. During each interview day, he/she could travel back and forth from that accommodation to each institution without needing to bring luggage, worrying about reaching the airport on time, or missing a pre-interview dinner at a program in a faraway city.
Given the amount of coordination required among programs, it may lead to more positive working relationships among regional dermatology programs. One limitation of this approach is that competitive programs may be unwilling to cooperate. If even one program deviates from the interview time frame, it reduces the incentive for others to participate. Programs must be willing to sacrifice short-term autonomy in interview scheduling for their long-term shared interest in reducing the application burden for students, which is known as a commitment problem in game theory, and could be addressed through joint decision-making that incorporates the time frame preferences of all programs as well as binding commitments on interview dates that are decided before the process begins.4 Another limitation is that inclement weather could affect all regional programs simultaneously. In this case, offering interviews via video conference for affected students may be a solution.
Capping the Number of Applications
A second method of reducing interview costs would be capping the number of applications. Although matched seniors applied to a median of 72 programs, the Association of American Medical Colleges suggests that dermatology applicants can maximize their return on investment (ie, ratio of interviews to applications) by sending 35 to 55 applications depending on US Medical Licensing Examination scores. Attending more than 10 interviews does not meaningfully improve the chance of matching.5,6
Programs have limited capacity for interviews and must judiciously allocate invitations based solely on the information provided through the Electronic Residency Application Service (ERAS). Given the competitiveness of dermatology, applicants usually will accept every interview invitation. Therefore, applicants who are not genuinely interested in a program may crowd out others who are interested. In a survey of otolaryngology applicants (N=150), 90.6% of respondents admitted applying to programs in which they had no specific interest, simply to increase their chance of matching.3 Capping application numbers would force students to apply more selectively and enable residencies to gauge students’ true interest more effectively. In contrast to regional interview coordination, this policy change would be easy to enforce. It also may be popular; nearly two-thirds of otolaryngology applicants agreed to a hypothetical cap on residency applications to reduce the burden on students and programs.3
An alternative to a hard cap on applications could be restructuring the ERAS application fee to incentivize students to apply to fewer programs. For example, a flat fee might cover application numbers up to the point of diminishing returns, after which the price per application could increase exponentially. This approach would have a similar effect of a hard cap and cause many students to apply to fewer programs; however, one notable drawback is that highly affluent applicants would simply absorb the extra cost and still gain a competitive advantage in applying to more programs, which might further decrease the number of lower-income individuals successfully matching into dermatology.
A benefit of decreased application numbers to program directors would be giving them more time to conduct a holistic review of applicants, rather than attempting to weed out candidates through arbitrary cutoffs for US Medical Licensing Examination scores or Alpha Omega Alpha Honor Medical Society membership. The ERAS could allow applicants the option of stating preferences for geographic regions, desired fellowships, areas of research interest, and other intangible metrics. Selection committees could filter their candidate search by different variables and then look at each candidate holistically.
Limitations of capping application numbers include the risk that such a cap would harm less-competitive applicants while failing to address the primary cost drivers (ie, travel costs). The specific cap number would be controversial and may need to be adjusted higher for special cases such as couples matching and international applicants, thus making a cap seem arbitrary.
Final Thoughts
The dermatology residency match can be streamlined to the benefit of both applicants and selection committees. Regional interview coordination would reduce both financial and logistical barriers for applicants but may be difficult to enforce without cooperation from multiple programs. Capping the number of applications, either through a hard cap or an increased financial barrier, would be relatively easy to enforce and might empower selection committees to conduct more detailed, holistic reviews of applicants; however, certain types of applicants may find the application limits detrimental to their chances of matching. These policy recommendations are meant to be a starting point for discussion. Streamlining the application process is critical to improving the diversity of dermatology residencies.
- Mansouri B, Walker GD, Mitchell J, et al. The cost of applying to dermatology residency: 2014 data estimates. J Am Acad Dermatol. 2016;74:754-756.
- Tichy AL, Peng DH, Lane AT. Applying for dermatology residency is difficult and expensive. J Am Acad Dermatol. 2012;66:696-697.
- Ward M, Pingree C, Laury AM, et al. Applicant perspectives on the otolaryngology residency application process. JAMA Otolaryngol Head Neck Surg. 2017;143:782-787.
- North DC. Institutions and credible commitment. J Inst Theor Econ. 1993;149:11-23.
- Association of American Medical Colleges. Apply smart: data to consider when applying to residency. https://students-residents.aamc.org/applying-residency/filteredresult/apply-smart-data-consider-when-applying-residency/. Accessed November 12, 2019.
- Charting Outcomes in the Match: Characteristics of U.S. Allopathic Seniors Who Matched to Their Preferred Specialty in the 2018 Main Residency Match. 2nd ed. Washington, DC: National Resident Matching Program; July 2018. https://www.nrmp.org/wp-content/uploads/2018/06/Charting-Outcomes-in-the-Match-2018-Seniors.pdf. Accessed November 11, 2019.
Another Match Day is approaching. Students find themselves paying more each year to apply to one of the most competitive fields, while program directors struggle to sort through hundreds of stellar applications to invite a handful of candidates for interviews. Estimates place the cost of the application process at $5 million in total for all medical school seniors, or roughly $10,000 per applicant.1 Approximately 60% of these costs occur during the interview process.1,2 In an era in which students routinely graduate medical school with hundreds of thousands of dollars of debt, these costs must be addressed as soon as possible.
This problem is not unique to dermatology; otolaryngology, another especially competitive field, has considered various changes to the match process based on applicants’ feedback.3 As an applicant during the 2018-2019 match cycle for dermatology, I offer 2 solutions that are a starting point aimed at streamlining the application process for both applicants and program directors: regional interview coordination and a cap on the number of residency applications.
Regional Interview Coordination
Regional interview coordination would reduce travel costs and facilitate greater predictability in scheduling clinical rotations. In the current climate, it is not uncommon for applicants to make multiple cross-country round trips in the same week, especially given that the interview season for dermatology, including interviews for preliminary programs, now ranges from mid-October to early February. Although affluent applicants may not be concerned with financial costs of frequent travel, all applicants face travel inconveniences that could be mitigated through regional coordination. For example, an applicant invited to multiple interviews in the New York City area could reserve a room in a single hotel over a period of several days. During each interview day, he/she could travel back and forth from that accommodation to each institution without needing to bring luggage, worrying about reaching the airport on time, or missing a pre-interview dinner at a program in a faraway city.
Given the amount of coordination required among programs, it may lead to more positive working relationships among regional dermatology programs. One limitation of this approach is that competitive programs may be unwilling to cooperate. If even one program deviates from the interview time frame, it reduces the incentive for others to participate. Programs must be willing to sacrifice short-term autonomy in interview scheduling for their long-term shared interest in reducing the application burden for students, which is known as a commitment problem in game theory, and could be addressed through joint decision-making that incorporates the time frame preferences of all programs as well as binding commitments on interview dates that are decided before the process begins.4 Another limitation is that inclement weather could affect all regional programs simultaneously. In this case, offering interviews via video conference for affected students may be a solution.
Capping the Number of Applications
A second method of reducing interview costs would be capping the number of applications. Although matched seniors applied to a median of 72 programs, the Association of American Medical Colleges suggests that dermatology applicants can maximize their return on investment (ie, ratio of interviews to applications) by sending 35 to 55 applications depending on US Medical Licensing Examination scores. Attending more than 10 interviews does not meaningfully improve the chance of matching.5,6
Programs have limited capacity for interviews and must judiciously allocate invitations based solely on the information provided through the Electronic Residency Application Service (ERAS). Given the competitiveness of dermatology, applicants usually will accept every interview invitation. Therefore, applicants who are not genuinely interested in a program may crowd out others who are interested. In a survey of otolaryngology applicants (N=150), 90.6% of respondents admitted applying to programs in which they had no specific interest, simply to increase their chance of matching.3 Capping application numbers would force students to apply more selectively and enable residencies to gauge students’ true interest more effectively. In contrast to regional interview coordination, this policy change would be easy to enforce. It also may be popular; nearly two-thirds of otolaryngology applicants agreed to a hypothetical cap on residency applications to reduce the burden on students and programs.3
An alternative to a hard cap on applications could be restructuring the ERAS application fee to incentivize students to apply to fewer programs. For example, a flat fee might cover application numbers up to the point of diminishing returns, after which the price per application could increase exponentially. This approach would have a similar effect of a hard cap and cause many students to apply to fewer programs; however, one notable drawback is that highly affluent applicants would simply absorb the extra cost and still gain a competitive advantage in applying to more programs, which might further decrease the number of lower-income individuals successfully matching into dermatology.
A benefit of decreased application numbers to program directors would be giving them more time to conduct a holistic review of applicants, rather than attempting to weed out candidates through arbitrary cutoffs for US Medical Licensing Examination scores or Alpha Omega Alpha Honor Medical Society membership. The ERAS could allow applicants the option of stating preferences for geographic regions, desired fellowships, areas of research interest, and other intangible metrics. Selection committees could filter their candidate search by different variables and then look at each candidate holistically.
Limitations of capping application numbers include the risk that such a cap would harm less-competitive applicants while failing to address the primary cost drivers (ie, travel costs). The specific cap number would be controversial and may need to be adjusted higher for special cases such as couples matching and international applicants, thus making a cap seem arbitrary.
Final Thoughts
The dermatology residency match can be streamlined to the benefit of both applicants and selection committees. Regional interview coordination would reduce both financial and logistical barriers for applicants but may be difficult to enforce without cooperation from multiple programs. Capping the number of applications, either through a hard cap or an increased financial barrier, would be relatively easy to enforce and might empower selection committees to conduct more detailed, holistic reviews of applicants; however, certain types of applicants may find the application limits detrimental to their chances of matching. These policy recommendations are meant to be a starting point for discussion. Streamlining the application process is critical to improving the diversity of dermatology residencies.
- Mansouri B, Walker GD, Mitchell J, et al. The cost of applying to dermatology residency: 2014 data estimates. J Am Acad Dermatol. 2016;74:754-756.
- Tichy AL, Peng DH, Lane AT. Applying for dermatology residency is difficult and expensive. J Am Acad Dermatol. 2012;66:696-697.
- Ward M, Pingree C, Laury AM, et al. Applicant perspectives on the otolaryngology residency application process. JAMA Otolaryngol Head Neck Surg. 2017;143:782-787.
- North DC. Institutions and credible commitment. J Inst Theor Econ. 1993;149:11-23.
- Association of American Medical Colleges. Apply smart: data to consider when applying to residency. https://students-residents.aamc.org/applying-residency/filteredresult/apply-smart-data-consider-when-applying-residency/. Accessed November 12, 2019.
- Charting Outcomes in the Match: Characteristics of U.S. Allopathic Seniors Who Matched to Their Preferred Specialty in the 2018 Main Residency Match. 2nd ed. Washington, DC: National Resident Matching Program; July 2018. https://www.nrmp.org/wp-content/uploads/2018/06/Charting-Outcomes-in-the-Match-2018-Seniors.pdf. Accessed November 11, 2019.

Evidence grows for early axSpA treatment, uveitis flare prevention
The findings from the C-axSpAnd study that Jonathan Kay, MD, and colleagues reported at the annual meeting of the American College of Rheumatology are not surprising. Earlier studies in patients with ankylosing spondylitis showed that short symptom duration is one of the best predictors of good treatment response to TNFi therapy. The highest response rates were obtained in studies conducted in axSpA patients with symptom duration of less than 5 years or even less than 3 years. Since nonradiographic axial spondyloarthritis (nr-axSpA) and r-axSpA are considered as two stages of one disease, it is logical that the same effect is also observed in studies in nr-axSpA. Indeed, in the first study of a tumor necrosis factor inhibitor (TNFi) in nr-axSpA (ABILITY-1), patients with symptom duration less than 5 years responded much better to the TNFi adalimumab than did those with longer symptom duration, and the delta of the response between adalimumab and placebo was much greater. All these results together indicate that early disease stage associated with favorable treatment response in axSpA is better defined by symptom duration than by the presence or absence of structural damage in the sacroiliac joints. Furthermore, these data stress the importance of the early diagnosis in axSpA.
We also know from observational studies and subanalyses from clinical trials that treatment with monoclonal antibodies against TNF is associated with reduction of uveitis flares in axSpA. However, no prospective clinical studies had been conducted with acute anterior uveitis flares as the primary outcome until the C-VIEW study, which was presented by Irene E. van der Horst-Bruinsma, MD, PhD, at ACR 2019. The results of C-VIEW are therefore the first to prospectively address the question of reduction of uveitis flares under TNFi. The main limitation of the study is the lack of a control group, which makes interpretation of the results difficult because it is not clear to what extent the natural course of the disease – which might involve very long flare-free periods lasting from months to years – contributed to the reduction of flares. A randomized, controlled study aimed at label extension is highly desired for patients with acute anterior uveitis, especially for those with a frequently relapsing course resistant to local treatment.

Denis Poddubnyy, MD , is head of the rheumatology department at Charite-Universitätsmedizin Berlin. He disclosed receiving research grants from AbbVie, Lilly, Merck, Novartis, and Pfizer, as well as receiving consultancy or speaker fees from AbbVie, Bristol-Myers Squibb, Celgene, Janssen, Lilly, Merck, Novartis, Pfizer, Roche, and UCB.
The findings from the C-axSpAnd study that Jonathan Kay, MD, and colleagues reported at the annual meeting of the American College of Rheumatology are not surprising. Earlier studies in patients with ankylosing spondylitis showed that short symptom duration is one of the best predictors of good treatment response to TNFi therapy. The highest response rates were obtained in studies conducted in axSpA patients with symptom duration of less than 5 years or even less than 3 years. Since nonradiographic axial spondyloarthritis (nr-axSpA) and r-axSpA are considered as two stages of one disease, it is logical that the same effect is also observed in studies in nr-axSpA. Indeed, in the first study of a tumor necrosis factor inhibitor (TNFi) in nr-axSpA (ABILITY-1), patients with symptom duration less than 5 years responded much better to the TNFi adalimumab than did those with longer symptom duration, and the delta of the response between adalimumab and placebo was much greater. All these results together indicate that early disease stage associated with favorable treatment response in axSpA is better defined by symptom duration than by the presence or absence of structural damage in the sacroiliac joints. Furthermore, these data stress the importance of the early diagnosis in axSpA.
We also know from observational studies and subanalyses from clinical trials that treatment with monoclonal antibodies against TNF is associated with reduction of uveitis flares in axSpA. However, no prospective clinical studies had been conducted with acute anterior uveitis flares as the primary outcome until the C-VIEW study, which was presented by Irene E. van der Horst-Bruinsma, MD, PhD, at ACR 2019. The results of C-VIEW are therefore the first to prospectively address the question of reduction of uveitis flares under TNFi. The main limitation of the study is the lack of a control group, which makes interpretation of the results difficult because it is not clear to what extent the natural course of the disease – which might involve very long flare-free periods lasting from months to years – contributed to the reduction of flares. A randomized, controlled study aimed at label extension is highly desired for patients with acute anterior uveitis, especially for those with a frequently relapsing course resistant to local treatment.
Denis Poddubnyy, MD , is head of the rheumatology department at Charite-Universitätsmedizin Berlin. He disclosed receiving research grants from AbbVie, Lilly, Merck, Novartis, and Pfizer, as well as receiving consultancy or speaker fees from AbbVie, Bristol-Myers Squibb, Celgene, Janssen, Lilly, Merck, Novartis, Pfizer, Roche, and UCB.
The clinical impact of new approvals in sickle cell, MCL
In this edition of “How I Will Treat My Next Patient,” I highlight two recent drug approvals by the Food and Drug Administration – crizanlizumab for sickle cell patients with painful crises and zanubrutinib for mantle cell lymphoma (MCL) patients in relapse.

Crizanlizumab
P-selectin is an adhesion molecule expressed on activated vascular endothelial cells and platelets. It is a key molecule in the initiation of leukocyte rolling on vessel walls and promotes firm attachment and extravasation to underlying tissues during inflammation. Up-regulation of P-selectin on endothelial cells and platelets contributes to the cell-cell interactions involved in the pathogenesis of sickle cell pain crises.
The SUSTAIN study was a multisite, placebo-controlled, randomized phase 2 trial of two different dosage levels of intravenous crizanlizumab (2.5 mg/kg or 5 mg/kg for 52 weeks), a humanized anti–P-selectin antibody, examining its effect on pain crises in patients with sickle cell disease. The primary endpoint was the annual rate of sickle cell pain crises, with a variety of clinically relevant secondary endpoints. The target population had 2-10 pain crises in the 12 months before enrollment. Patients on a stable dose of hydroxyurea for at least the most recent 3 months were allowed to enter, but if patients were not receiving hydroxyurea, it could not be initiated during the trial. Patients who were undergoing chronic red-cell transfusion therapy were excluded.
Among 198 enrolled patients, 35% did not complete the 52 weeks of treatment. Discontinuations were equally balanced among patients assigned to the high-dose, low-dose, and placebo cohorts. Adverse events associated with crizanlizumab included back pain, nausea, pyrexia, and arthralgia. Serious adverse events occurred in 55 patients, with 5 deaths, all of which were unrelated to treatment. Crizanlizumab did not augment hemolysis or bacterial infections.
In the efficacy analysis, patients receiving high-dose crizanlizumab had a median annual rate of 1.63 health care visits for sickle cell pain crises, compared with 2.98 visits for placebo patients (P = .01). In comparison with placebo, high-dose crizanlizumab also delayed the first pain crisis after starting treatment (4.1 months vs. 1.4 months), delayed the median time to a second pain crisis, and decreased the median number of pain crises annually.
More than twice as many high-dose crizanlizumab patients had no pain crisis episodes, compared with placebo patients. In general, differences were more striking in patients who were not taking hydroxyurea and who had non–hemoglobin SS disease. Differences in the primary endpoint between low-dose crizanlizumab and placebo were numerically, but not statistically, different.
How these results influence practice
It has been over 20 years since a new agent (hydroxyurea) was approved for sickle cell patients and, despite its use, sickle cell pain crises remain a frequent problem. Pain crises are associated with worse quality of life and increased risk of death. A promising advance is badly needed, especially in an era in which sensitivity to providers’ role in the opioid addiction crisis is highly scrutinized and may contribute to future undertreatment of pain episodes. This is especially true for patients from areas with high levels of opioid misuse.
The SUSTAIN trial was international, multi-institutional, placebo-controlled, and inclusive. These attributes enhance the likelihood that crizanlizumab will enhance patient care in routine practice. As an intravenous agent, monitoring adherence and toxicity are less challenging than with hydroxyurea. Despite these factors, however, there are some concerns. Crizanlizumab was not free of toxicity, quality of life via the Brief Pain Inventory used in the trial was not improved, and changes in the pain-severity and pain-interference domains were small. Treatment in SUSTAIN ensued for 52 weeks, so the emergence of late neutralizing antibodies and late toxicities with longer-term therapy will require careful postmarketing assessment.
These concerns notwithstanding, anyone who has cared for sickle cell patients would be excited about the potential benefits crizanlizumab could bring to patient care.
Zanubrutinib
The FDA has approved zanubrutinib for the treatment of MCL in adult patients who have received at least one prior therapy. The approval is based on the results of two studies in which overall response rate was the primary endpoint.
BGB-3111-206 (NCT03206970) was a phase 2, open-label, multicenter, single-arm trial of 86 patients with MCL who received at least one prior therapy. Zanubrutinib was given orally at 160 mg twice daily until disease progression or unacceptable toxicity. BGB-3111-AU-003 (NCT 02343120) was a phase 1/2, open-label, dose-escalation trial of B-cell malignancies, including 32 previously treated MCL patients treated with zanubrutinib at 160 mg twice daily or 320 mg once daily.
In the phase 2 trial, 18fluorodeoxyglucose (FDG)–PET scans were required and the ORR was 84% (95% confidence interval, 74%-91%), with a complete response rate of 59% (95% CI, 48%-70%) and a median response duration of 19.5 months (95% CI, 16.6% to not estimable). In the phase 1/2 dose-escalation trial, FDG-PET scans were not required and the ORR was 84% (95% CI, 67%-95%), with a complete response rate of 22% (95% CI, 9%-40%) and a median response duration of 18.5 months (95% CI, 12.6% to not estimable). In both trials, median follow-up on study was about 18 months.
The most common adverse reactions were cytopenias, upper respiratory tract infection, rash, bruising, diarrhea, and cough. The most common serious adverse reactions were pneumonia in 11% and hemorrhage in 5% of patients. Of 118 MCL patients, 8 stopped therapy because of an adverse event, most frequently pneumonia (3.4%).
How these results influence practice
Unfortunately, the therapy of recurrent MCL is noncurative, because of the rapid development of treatment resistance. There are multiple single-and multiagent chemotherapy regimens that may be tried, many incorporating immunotherapy options such as anti-CD20- or Bruton tyrosine kinase (BTK)–targeted agents. Given the limited efficacy of these agents, temporary nature of remissions, and paucity of data comparing these various treatment options, participation in clinical trials is encouraged whenever possible.
Outside of a clinical trial, zanubrutinib joins ibrutinib and acalabrutinib as approved single-agent BTK inhibitors for adult MCL patients in relapse. The impressive ORR and response duration reported for zanubrutinib are similar to the results achieved with the other agents, but the toxicity pattern may be slightly different.
As in the treatment of hormonally sensitive breast cancer, clinicians and patients benefit when they have multiple similar, equally efficacious oral agents with slightly different toxicity patterns so that quality of life can be improved and treatment duration maximized before treatment resistance develops and a more toxic and/or inconvenient therapy needs to be employed.
Whether zanubrutinib has benefits beyond those for MCL patients in relapse will depend on the results of confirmatory trials and patient-reported outcome data.
Dr. Lyss has been a community-based medical oncologist and clinical researcher for more than 35 years, practicing in St. Louis. His clinical and research interests are in the prevention, diagnosis, and treatment of breast and lung cancers and in expanding access to clinical trials to medically underserved populations.
In this edition of “How I Will Treat My Next Patient,” I highlight two recent drug approvals by the Food and Drug Administration – crizanlizumab for sickle cell patients with painful crises and zanubrutinib for mantle cell lymphoma (MCL) patients in relapse.
Crizanlizumab
P-selectin is an adhesion molecule expressed on activated vascular endothelial cells and platelets. It is a key molecule in the initiation of leukocyte rolling on vessel walls and promotes firm attachment and extravasation to underlying tissues during inflammation. Up-regulation of P-selectin on endothelial cells and platelets contributes to the cell-cell interactions involved in the pathogenesis of sickle cell pain crises.
The SUSTAIN study was a multisite, placebo-controlled, randomized phase 2 trial of two different dosage levels of intravenous crizanlizumab (2.5 mg/kg or 5 mg/kg for 52 weeks), a humanized anti–P-selectin antibody, examining its effect on pain crises in patients with sickle cell disease. The primary endpoint was the annual rate of sickle cell pain crises, with a variety of clinically relevant secondary endpoints. The target population had 2-10 pain crises in the 12 months before enrollment. Patients on a stable dose of hydroxyurea for at least the most recent 3 months were allowed to enter, but if patients were not receiving hydroxyurea, it could not be initiated during the trial. Patients who were undergoing chronic red-cell transfusion therapy were excluded.
Among 198 enrolled patients, 35% did not complete the 52 weeks of treatment. Discontinuations were equally balanced among patients assigned to the high-dose, low-dose, and placebo cohorts. Adverse events associated with crizanlizumab included back pain, nausea, pyrexia, and arthralgia. Serious adverse events occurred in 55 patients, with 5 deaths, all of which were unrelated to treatment. Crizanlizumab did not augment hemolysis or bacterial infections.
In the efficacy analysis, patients receiving high-dose crizanlizumab had a median annual rate of 1.63 health care visits for sickle cell pain crises, compared with 2.98 visits for placebo patients (P = .01). In comparison with placebo, high-dose crizanlizumab also delayed the first pain crisis after starting treatment (4.1 months vs. 1.4 months), delayed the median time to a second pain crisis, and decreased the median number of pain crises annually.
More than twice as many high-dose crizanlizumab patients had no pain crisis episodes, compared with placebo patients. In general, differences were more striking in patients who were not taking hydroxyurea and who had non–hemoglobin SS disease. Differences in the primary endpoint between low-dose crizanlizumab and placebo were numerically, but not statistically, different.
How these results influence practice
It has been over 20 years since a new agent (hydroxyurea) was approved for sickle cell patients and, despite its use, sickle cell pain crises remain a frequent problem. Pain crises are associated with worse quality of life and increased risk of death. A promising advance is badly needed, especially in an era in which sensitivity to providers’ role in the opioid addiction crisis is highly scrutinized and may contribute to future undertreatment of pain episodes. This is especially true for patients from areas with high levels of opioid misuse.
The SUSTAIN trial was international, multi-institutional, placebo-controlled, and inclusive. These attributes enhance the likelihood that crizanlizumab will enhance patient care in routine practice. As an intravenous agent, monitoring adherence and toxicity are less challenging than with hydroxyurea. Despite these factors, however, there are some concerns. Crizanlizumab was not free of toxicity, quality of life via the Brief Pain Inventory used in the trial was not improved, and changes in the pain-severity and pain-interference domains were small. Treatment in SUSTAIN ensued for 52 weeks, so the emergence of late neutralizing antibodies and late toxicities with longer-term therapy will require careful postmarketing assessment.
These concerns notwithstanding, anyone who has cared for sickle cell patients would be excited about the potential benefits crizanlizumab could bring to patient care.
Zanubrutinib
The FDA has approved zanubrutinib for the treatment of MCL in adult patients who have received at least one prior therapy. The approval is based on the results of two studies in which overall response rate was the primary endpoint.
BGB-3111-206 (NCT03206970) was a phase 2, open-label, multicenter, single-arm trial of 86 patients with MCL who received at least one prior therapy. Zanubrutinib was given orally at 160 mg twice daily until disease progression or unacceptable toxicity. BGB-3111-AU-003 (NCT 02343120) was a phase 1/2, open-label, dose-escalation trial of B-cell malignancies, including 32 previously treated MCL patients treated with zanubrutinib at 160 mg twice daily or 320 mg once daily.
In the phase 2 trial, 18fluorodeoxyglucose (FDG)–PET scans were required and the ORR was 84% (95% confidence interval, 74%-91%), with a complete response rate of 59% (95% CI, 48%-70%) and a median response duration of 19.5 months (95% CI, 16.6% to not estimable). In the phase 1/2 dose-escalation trial, FDG-PET scans were not required and the ORR was 84% (95% CI, 67%-95%), with a complete response rate of 22% (95% CI, 9%-40%) and a median response duration of 18.5 months (95% CI, 12.6% to not estimable). In both trials, median follow-up on study was about 18 months.
The most common adverse reactions were cytopenias, upper respiratory tract infection, rash, bruising, diarrhea, and cough. The most common serious adverse reactions were pneumonia in 11% and hemorrhage in 5% of patients. Of 118 MCL patients, 8 stopped therapy because of an adverse event, most frequently pneumonia (3.4%).
How these results influence practice
Unfortunately, the therapy of recurrent MCL is noncurative, because of the rapid development of treatment resistance. There are multiple single-and multiagent chemotherapy regimens that may be tried, many incorporating immunotherapy options such as anti-CD20- or Bruton tyrosine kinase (BTK)–targeted agents. Given the limited efficacy of these agents, temporary nature of remissions, and paucity of data comparing these various treatment options, participation in clinical trials is encouraged whenever possible.
Outside of a clinical trial, zanubrutinib joins ibrutinib and acalabrutinib as approved single-agent BTK inhibitors for adult MCL patients in relapse. The impressive ORR and response duration reported for zanubrutinib are similar to the results achieved with the other agents, but the toxicity pattern may be slightly different.
As in the treatment of hormonally sensitive breast cancer, clinicians and patients benefit when they have multiple similar, equally efficacious oral agents with slightly different toxicity patterns so that quality of life can be improved and treatment duration maximized before treatment resistance develops and a more toxic and/or inconvenient therapy needs to be employed.
Whether zanubrutinib has benefits beyond those for MCL patients in relapse will depend on the results of confirmatory trials and patient-reported outcome data.
Dr. Lyss has been a community-based medical oncologist and clinical researcher for more than 35 years, practicing in St. Louis. His clinical and research interests are in the prevention, diagnosis, and treatment of breast and lung cancers and in expanding access to clinical trials to medically underserved populations.