User login
The Safety and Efficacy of AUC/MIC-Guided vs Trough-Guided Vancomycin Monitoring Among Veterans
Vancomycin is a commonly used glycopeptide antibiotic used to treat infections caused by gram-positive organisms. Vancomycin is most often used as a parenteral agent for empiric or definitive treatment of methicillin-resistant Staphylococcus aureus (MRSA). It can also be used for the treatment of other susceptible Staphylococcus or Enterococcus species. Adverse effects of parenteral vancomycin include infusion-related reactions, ototoxicity, and nephrotoxicity.1 Higher vancomycin trough levels have been associated with an increased risk of nephrotoxicity.1-4 The major safety concern with vancomycin is acute kidney injury (AKI). Even mild AKI can prolong hospitalizations, increase the cost of health care, and increase morbidity.2
In March 2020, the American Society of Health-System Pharmacists, the Infectious Diseases Society of America (IDSA), the Pediatric Infectious Disease Society, and the Society of Infectious Diseases Pharmacists released a consensus statement and guidelines regarding the optimization of vancomycin dosing and monitoring for patients with suspected or definitive serious MRSA infections. Based on these guidelines, it is recommended to target an individualized area under the curve/minimum inhibitory concentration (AUC/MIC) ratio of 400 to 600 mg × h/L to maximize clinical efficacy and minimize the risk of AKI.2
Before March 2020, the vancomycin monitoring recommendation was to target trough levels of 10 to 20 mg/L. A goal trough of 15 to 20 mg/L was recommended for severe infections, including sepsis, endocarditis, hospital-acquired pneumonia, meningitis, and osteomyelitis, caused by MRSA. A goal trough of 10 to 15 mg/L was recommended for noninvasive infections, such as skin and soft tissue infections and urinary tract infections, caused by MRSA. Targeting these trough levels was thought to achieve an AUC/MIC ≥ 400 mg × h/L.5 Evidence has since shown that trough values may not be an optimal marker for AUC/MIC values.2
The updated vancomycin therapeutic drug monitoring (TDM) guidelines recommend that health systems transition to AUC/MIC-guided monitoring for suspected or confirmed infections caused by MRSA. There is not enough evidence to recommend AUC/MIC-guided monitoring in patients with noninvasive infections or infections caused by other microbes.2
AUC/MIC-guided monitoring can be achieved in 2 ways. The first method is collecting Cmax (peak level) and Cmin (trough level) serum concentrations, preferably during the same dosing interval. Ideally, Cmax should be drawn 1 to 2 hours after the vancomycin infusion and Cmin should be drawn at the end of the dosing interval. First-order pharmacokinetic equations are used to estimate the AUC/MIC with this method. Bayesian software pharmacokinetic modeling based on 1 or 2 vancomycin concentrations with 1 trough level also can be used for monitoring. Preferably, 2 levels would be obtained to estimate the AUC/MIC when using Bayesian modeling.2
The bactericidal activity of vancomycin was achieved with AUC/MIC ratios of ≥ 400 mg × h/L. AUC/MIC ratios of < 400 mg × h/L increase the incidence of resistant and intermediate strains of S aureus. AUC/MIC-guided monitoring assumes an MIC of 1 mg/L. When the MIC is > 1 mg/L, it is less likely that an AUC/MIC ≥ 400 mg × h/L is achievable. Regardless of the TDM method used, AUC/MIC ratios ≥ 400 mg × h/L are not achievable with conventional dosing methods if the vancomycin MIC is > 2 mg/L in patients with normal renal function. Alternative therapy is recommended to be used for these patients.2
There are multiple studies investigating the therapeutic dosing of vancomycin and the associated incidence of AKI. Previous studies have correlated vancomycin AUC/MICs of 400 mg to 600 mg × h/L with clinical effectiveness.2,6 In 2017, Neely and colleagues looked at the therapeutic dosing of vancomycin in 252 adults with ≥ 1 vancomycin level.7 During this prospective trial, they evaluated patients for 1 year and targeted trough concentrations of 10 to 20 mg/L with infection-specific goal ranges of 10 to 15 mg/L and 15 to 20 mg/L for noninvasive and invasive infections, respectively. They also targeted AUC/MIC ratios ≥ 400 mg × h/L regardless of trough concentration using Bayesian estimated AUC/MICs for 2 years. They found only 19% of trough concentrations to be therapeutic compared with 70% of AUC/MICs. A secondary outcome assessed by Neely and colleagues was nephrotoxicity, which was identified in 8% of patients with trough targets and 2% of patients with AUC/MIC targets.8
Previous studies evaluating the use of vancomycin in the veteran population have focused on AKI incidence, general nephrotoxicity, and 30-day readmission rates.4,7,9,10 Poston-Blahnik and colleagues investigated the rates of AKI in 200 veterans using AUC/MIC-guided vancomycin TDM.5 They found an AKI incidence of 42% of patients with AUC/MICs ≥ 550 mg × h/L and 2% of patients with AUC/MICs < 550 mg × h/L.5 Gyamlani and colleagues investigated the rates of AKI in 33,527 veterans and found that serum vancomycin trough levels ≥ 20 mg/L were associated with a higher risk of AKI.8 Prabaker and colleagues investigated the association between vancomycin trough levels and nephrotoxicity, defined as 0.5 mg/L or a 50% increase in serum creatinine (sCr) in 348 veterans. They found nephrotoxicity in 8.9% of patients.10 Patel and colleagues investigated the effect of AKI on 30-day readmission rates in 216 veterans.10 AKI occurred in 8.8% of patients and of those 19.4% were readmitted within 30 days.10 Current literature lacks evidence regarding the comparison of the safety and efficacy of vancomycin trough-guided vs AUC/MIC-guided TDM in the veteran population. Therefore, the objective of this study was to investigate the differences in the safety and efficacy of vancomycin TDM in the veteran population based on the different monitoring methods used.
METHODS
This study was a retrospective, single-center, quasi-experimental chart review conducted at the Sioux Falls Veterans Affairs Health Care System (SFVAHCS) in South Dakota. Data were collected from the Computerized Patient Record System (CPRS). The SFVAHCS transitioned from trough-guided to AUC/MIC-guided TDM in November 2020.
Patients included in this study were veterans aged ≥ 18 years with orders for parenteral vancomycin between February 1, 2020, and October 31, 2020, for the trough-guided TDM group and between December 1, 2020, and August 31, 2021, for the AUC/MIC-guided TDM group. Patients with vancomycin courses initiated during November 2020 were excluded as both TDM methods were being used at that time. Patients were excluded if their vancomycin course began before February 1, 2020, for the trough-guided TDM group or began during November 2020 for the AUC/MIC-guided TDM group. Patients were excluded if their vancomycin course extended past October 31, 2020, for the trough group or past August 31, 2021, for the AUC/MIC group. Patients on dialysis or missing Cmax, Cmin, or sCr levels were excluded.
This study evaluated both safety (AKI incidence) and effectiveness (time spent in therapeutic range and time to therapeutic range). The primary endpoint was presence of vancomycin-induced AKI, which was based on the most recent Kidney Disease: Improving Global Outcomes (KDIGO) AKI definition: increased sCr of ≥ 0.3 mg/dL or by 50% from baseline sustained over 48 hours without any other explanation for the change.11 A secondary endpoint was the absence or presence of AKI.
Additional secondary endpoints included the presence of the initial trough or AUC/MIC of each vancomycin course within the therapeutic range and the percentage of all trough levels or AUC/MICs within therapeutic, subtherapeutic, and supratherapeutic ranges. The therapeutic range for AUC/MIC-guided TDM was 400 to 600 mg × h/L and 10 to 20 mg/L depending on indication for trough-guided TDM (15-20 mg/L for severe infections and 10-15 mg/L for less invasive infections). The percentage of trough levels or AUC/MICs within therapeutic, subtherapeutic, and supratherapeutic ranges were calculated as a ratio of levels within each range to total levels taken for each patient.
For AUC/MIC-guided TDM the Cmax levels were ideally drawn 1 to 2 hours after vancomycin infusion and Cmin levels were ideally drawn 30 minutes before the next dose. First-order pharmacokinetic equations were used to estimate the AUC/MIC.12 If the timing of a vancomycin level was inappropriate, actual levels were extrapolated based on the timing of the blood draw compared with the ideal Cmin or Cmax time. Extrapolated levels were used for both trough-guided and AUC/MIC-guided TDM groups when appropriate. Vancomycin levels were excluded if they were drawn during the vancomycin infusion.
Study participant age, sex, race, weight, baseline estimated glomerular filtration (eGFR) rate, baseline sCr, concomitant nephrotoxic medications, duration of vancomycin course, indication of vancomycin, and acuity of illness based on indication were collected. sCr levels were collected from the initial day vancomycin was ordered through 72 hours following completion of a vancomycin course to evaluate for AKI. Patients’ charts were reviewed for the use of the following nephrotoxic medications: nonsteroidal anti-inflammatories, angiotensin-converting enzyme inhibitors, angiotensin II receptor blockers, aminoglycosides, piperacillin/tazobactam, loop diuretics, amphotericin B, acyclovir, intravenous contrast, and nephrotoxic chemotherapy (cisplatin). The category of concomitant nephrotoxic medications was also collected including the continuation of a home nephrotoxic medication vs the initiation of a new nephrotoxic medication.
Statistical Analysis
The primary endpoint of the incidence of vancomycin-induced AKI was compared using a Fisher exact test. The secondary endpoint of the percentage of trough levels or AUC/MICs in the therapeutic, subtherapeutic, and supratherapeutic range were compared using a student t test. The secondary endpoint of first level or AUC/MIC within goal range was compared using a χ2 test. Continuous baseline characteristics were reported as a mean and compared using a student t test. Nominal baseline characteristics were reported as a percentage and compared using the χ2 test. P values < .05 were considered statistically significant.
RESULTS
This study included 97 patients, 43 in the AUC/MIC group and 54 in the trough group. 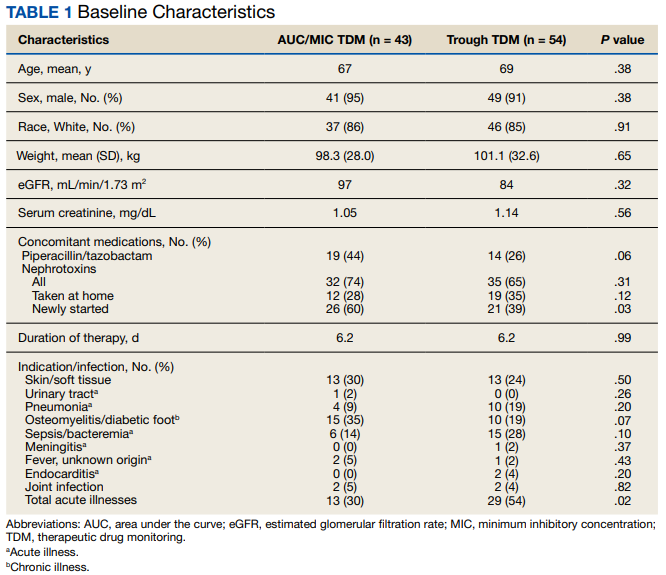
One (2%) patient in the AUC/MIC group and 2 (4%) patients in the trough group experienced vancomycin-induced AKI (P = .10) (Table 2).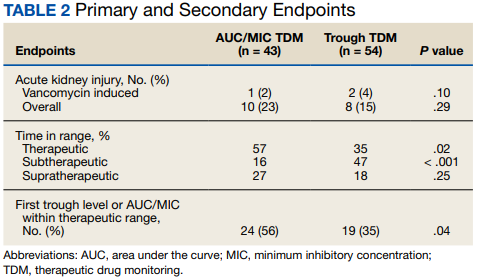
DISCUSSION
There was no statistically significant difference between the 2 groups for the vancomycin-induced AKI (P = .10), the primary endpoint, or overall AKI (P = .29), the secondary endpoint. It should be noted that there was more overall AKI in the AUC/MIC group. Veterans in the AUC/MIC group were found to have their first AUC/MIC within the therapeutic range statistically significantly more often than the first trough level in the trough group (P = .04). The percentage of time spent within therapeutic range was statistically significantly higher in the AUC/MIC-guided TDM group (P = .02). The percentage of time spent subtherapeutic of goal range was statistically significantly higher in the trough-guided TDM group (P < .001). There was no statistically significant difference found in the percent of time spent supratherapeutic of goal range (P = .25). However, the observed percentage of time spent supratherapeutic of goal range was higher in the AUC/MIC group. These results indicate that AUC/MIC-guided TDM may be more efficacious with regard to time in therapeutic range and time to therapeutic range.
The finding of increased AKI with AUC/MIC-guided TDM does not align with previous studies.8 The prospective study by Neely and colleagues found that AUC/MIC-guided TDM resulted in more time in the therapeutic range as well as less nephrotoxicity compared with trough-guided TDM, although it was limited by its lack of randomization and did not account for other causes of nephrotoxicity.8 They found that only 19% of trough concentrations were therapeutic compared with 70% of AUC/MICs and found nephrotoxicity in 8% of trough-guided TDM patients compared with 2% of AUC/MIC-guided TDM patients.8
Unlike Nealy and colleagues, our study did not find lower nephrotoxicity associated with AUC/MIC-guided TDM. Multiple factors may have influenced our results. Our AUC/MIC group had significantly more newly started concomitant nephrotoxins and other nephrotoxic medications used during the vancomycin courses compared with the trough-guided group, which may have influenced AKI outcomes. It also should be noted that there was significantly more time spent subtherapeutic of the goal range and significantly less time in the goal range in the trough group compared with the AUC/MIC group. In our study, the trough-guided group had significantly more patients with acute illness compared with the AUC/MIC group (skin, soft tissue, and joint infections were similar between the groups). The group with more acutely ill patients would have been expected to have more nephrotoxicity. However, despite the acute illnesses, patients in the trough-guided group spent more time in the subtherapeutic range. This may explain the increased nephrotoxicity in the AUC/MIC group since those patients spent more time in the therapeutic range.
This study used the most recent KDIGO AKI definition: either an increase in sCr of ≥ 0.3 mg/dL or a 50% increase in sCr from baseline sustained over 48 hours without any other explanation for the change in renal function.11 This AKI definition is stricter than the previous definition, which was used by earlier studies, including Neely and colleagues, to evaluate rates of vancomycin-induced AKI.2,3 Therefore, the rates of overall AKI found in this study may be higher than in previous studies due to the definition of AKI used.
Limitations
This study was limited by its retrospective nature, lack of randomization, and small sample size. To decrease the potential for error in this study, analysis of power and a larger study sample would have been beneficial. During the COVID-19 pandemic, increased pneumonia cases may have hidden bacterial causes and caused an undercount. Nephrotoxicity may also be related to volume depletion, severe systemic illness, dehydration, or hypotension. Screening was completed via chart review for these alternative causes of nephrotoxicity in this study but may not be completely accounted for due to lack of documentation and the retrospective nature of this study.
CONCLUSIONS
This study did not find a significant difference in the rates of vancomycin-induced or overall AKI between AUC/MIC-guided and trough-guided TDM. However, this study may not have been powered to detect a significant difference in the primary endpoint. This study indicated that AUC/MIC-guided TDM of vancomycin resulted in a quicker time to the therapeutic range and a higher percentage of overall time in the therapeutic range as compared with trough-guided TDM. The results of this study indicated that trough-guided monitoring resulted in a higher percentage of time in a subtherapeutic range. This study also found that the first AUC/MIC calculated was within therapeutic range more often than the first trough level collected.
These results indicate that AUC/MIC-guided TDM may be more effective than trough-guided TDM in the veteran population. However, while AUC/MIC-guided TDM may be more effective with regards to time in therapeutic range and time to therapeutic range, this study did not indicate any safety benefit of AUC/MIC-guided over trough-guided TDM with regards to AKI incidence. Our data indicate that AUC/MIC-guided TDM increases the amount of time in the therapeutic range compared with trough-guided TDM and is not more nephrotoxic. The findings of this study support the recommendation to transition to the use of AUC/MIC-guided TDM of vancomycin in the veteran population.
Acknowledgments
This material is the result of work supported with the use of facilities and resources from the Sioux Falls Veterans Affairs Health Care System.
1. Gallagher J, MacDougall C. Glycopeptides and short-acting lipoglycopeptides In: Antibiotics Simplified. Jones & Bartlett Learning; 2018.
2. Rybak MJ, Le J, Lodise TP, et al. Therapeutic monitoring of vancomycin for serious methicillin-resistant Staphylococcus aureus infections: a revised consensus guideline and review by the American Society of Health-System Pharmacists, the Infectious Diseases Society of America, the Pediatric Infectious Diseases Society, and the Society of Infectious Diseases Pharmacists. Am J Health Syst Pharm. 2020;77(11):835-864. doi:10.1093/ajhp/zxaa036
3. Hermsen ED, Hanson M, Sankaranarayanan J, Stoner JA, Florescu MC, Rupp ME. Clinical outcomes and nephrotoxicity associated with vancomycin trough concentrations during treatment of deep-seated infections. Expert Opin Drug Saf. 2010;9(1):9-14. doi:10.1517/14740330903413514
4. Poston-Blahnik A, Moenster R. Association between vancomycin area under the curve and nephrotoxicity: a single center, retrospective cohort study in a veteran population. Open Forum Infect Dis. 2021;8(5):ofab094. Published 2021 Mar 12. doi:10.1093/ofid/ofab094
5. Rybak M, Lomaestro B, Rotschafer JC, et al. Therapeutic monitoring of vancomycin in adult patients: a consensus review of the American Society of Health-System Pharmacists, the Infectious Diseases Society of America, and the Society of Infectious Diseases Pharmacists. Am J Health Syst Pharm. 2009;66(1):82-98. doi:10.2146/ajhp080434
6. Moise-Broder PA, Forrest A, Birmingham MC, Schentag JJ. Pharmacodynamics of vancomycin and other antimicrobials in patients with Staphylococcus aureus lower respiratory tract infections. Clin Pharmacokinet. 2004;43(13):925-942. doi:10.2165/00003088-200443130-00005
7. Gyamlani G, Potukuchi PK, Thomas F, et al. Vancomycin-Associated Acute Kidney Injury in a Large Veteran Population. Am J Nephrol. 2019;49(2):133-142. doi:10.1159/000496484
8. Neely MN, Kato L, Youn G, et al. Prospective Trial on the Use of Trough Concentration versus Area under the Curve To Determine Therapeutic Vancomycin Dosing. Antimicrob Agents Chemother. 2018;62(2):e02042-17. Published 2018 Jan 25. doi:10.1128/AAC.02042-17
9. Prabaker KK, Tran TP, Pratummas T, Goetz MB, Graber CJ. Elevated vancomycin trough is not associated with nephrotoxicity among inpatient veterans. J Hosp Med. 2012;7(2):91-97. doi:10.1002/jhm.946
10. Patel N, Stornelli N, Sangiovanni RJ, Huang DB, Lodise TP. Effect of vancomycin-associated acute kidney injury on incidence of 30-day readmissions among hospitalized Veterans Affairs patients with skin and skin structure infections. Antimicrob Agents Chemother. 2020;64(10):e01268-20. Published 2020 Sep 21. doi:10.1128/AAC.01268-20
11. Acute Kidney Injury Work Group. Kidney Disease: Improving Global Outcomes (KDIGO) Clinical Practice Guideline for Acute Kidney Injury. Kidney Int. 2012;2(suppl 1):1-138.
12. Pai MP, Neely M, Rodvold KA, Lodise TP. Innovative approaches to optimizing the delivery of vancomycin in individual patients. Adv Drug Deliv Rev. 2014;77:50-57. doi:10.1016/j.addr.2014.05.016
Vancomycin is a commonly used glycopeptide antibiotic used to treat infections caused by gram-positive organisms. Vancomycin is most often used as a parenteral agent for empiric or definitive treatment of methicillin-resistant Staphylococcus aureus (MRSA). It can also be used for the treatment of other susceptible Staphylococcus or Enterococcus species. Adverse effects of parenteral vancomycin include infusion-related reactions, ototoxicity, and nephrotoxicity.1 Higher vancomycin trough levels have been associated with an increased risk of nephrotoxicity.1-4 The major safety concern with vancomycin is acute kidney injury (AKI). Even mild AKI can prolong hospitalizations, increase the cost of health care, and increase morbidity.2
In March 2020, the American Society of Health-System Pharmacists, the Infectious Diseases Society of America (IDSA), the Pediatric Infectious Disease Society, and the Society of Infectious Diseases Pharmacists released a consensus statement and guidelines regarding the optimization of vancomycin dosing and monitoring for patients with suspected or definitive serious MRSA infections. Based on these guidelines, it is recommended to target an individualized area under the curve/minimum inhibitory concentration (AUC/MIC) ratio of 400 to 600 mg × h/L to maximize clinical efficacy and minimize the risk of AKI.2
Before March 2020, the vancomycin monitoring recommendation was to target trough levels of 10 to 20 mg/L. A goal trough of 15 to 20 mg/L was recommended for severe infections, including sepsis, endocarditis, hospital-acquired pneumonia, meningitis, and osteomyelitis, caused by MRSA. A goal trough of 10 to 15 mg/L was recommended for noninvasive infections, such as skin and soft tissue infections and urinary tract infections, caused by MRSA. Targeting these trough levels was thought to achieve an AUC/MIC ≥ 400 mg × h/L.5 Evidence has since shown that trough values may not be an optimal marker for AUC/MIC values.2
The updated vancomycin therapeutic drug monitoring (TDM) guidelines recommend that health systems transition to AUC/MIC-guided monitoring for suspected or confirmed infections caused by MRSA. There is not enough evidence to recommend AUC/MIC-guided monitoring in patients with noninvasive infections or infections caused by other microbes.2
AUC/MIC-guided monitoring can be achieved in 2 ways. The first method is collecting Cmax (peak level) and Cmin (trough level) serum concentrations, preferably during the same dosing interval. Ideally, Cmax should be drawn 1 to 2 hours after the vancomycin infusion and Cmin should be drawn at the end of the dosing interval. First-order pharmacokinetic equations are used to estimate the AUC/MIC with this method. Bayesian software pharmacokinetic modeling based on 1 or 2 vancomycin concentrations with 1 trough level also can be used for monitoring. Preferably, 2 levels would be obtained to estimate the AUC/MIC when using Bayesian modeling.2
The bactericidal activity of vancomycin was achieved with AUC/MIC ratios of ≥ 400 mg × h/L. AUC/MIC ratios of < 400 mg × h/L increase the incidence of resistant and intermediate strains of S aureus. AUC/MIC-guided monitoring assumes an MIC of 1 mg/L. When the MIC is > 1 mg/L, it is less likely that an AUC/MIC ≥ 400 mg × h/L is achievable. Regardless of the TDM method used, AUC/MIC ratios ≥ 400 mg × h/L are not achievable with conventional dosing methods if the vancomycin MIC is > 2 mg/L in patients with normal renal function. Alternative therapy is recommended to be used for these patients.2
There are multiple studies investigating the therapeutic dosing of vancomycin and the associated incidence of AKI. Previous studies have correlated vancomycin AUC/MICs of 400 mg to 600 mg × h/L with clinical effectiveness.2,6 In 2017, Neely and colleagues looked at the therapeutic dosing of vancomycin in 252 adults with ≥ 1 vancomycin level.7 During this prospective trial, they evaluated patients for 1 year and targeted trough concentrations of 10 to 20 mg/L with infection-specific goal ranges of 10 to 15 mg/L and 15 to 20 mg/L for noninvasive and invasive infections, respectively. They also targeted AUC/MIC ratios ≥ 400 mg × h/L regardless of trough concentration using Bayesian estimated AUC/MICs for 2 years. They found only 19% of trough concentrations to be therapeutic compared with 70% of AUC/MICs. A secondary outcome assessed by Neely and colleagues was nephrotoxicity, which was identified in 8% of patients with trough targets and 2% of patients with AUC/MIC targets.8
Previous studies evaluating the use of vancomycin in the veteran population have focused on AKI incidence, general nephrotoxicity, and 30-day readmission rates.4,7,9,10 Poston-Blahnik and colleagues investigated the rates of AKI in 200 veterans using AUC/MIC-guided vancomycin TDM.5 They found an AKI incidence of 42% of patients with AUC/MICs ≥ 550 mg × h/L and 2% of patients with AUC/MICs < 550 mg × h/L.5 Gyamlani and colleagues investigated the rates of AKI in 33,527 veterans and found that serum vancomycin trough levels ≥ 20 mg/L were associated with a higher risk of AKI.8 Prabaker and colleagues investigated the association between vancomycin trough levels and nephrotoxicity, defined as 0.5 mg/L or a 50% increase in serum creatinine (sCr) in 348 veterans. They found nephrotoxicity in 8.9% of patients.10 Patel and colleagues investigated the effect of AKI on 30-day readmission rates in 216 veterans.10 AKI occurred in 8.8% of patients and of those 19.4% were readmitted within 30 days.10 Current literature lacks evidence regarding the comparison of the safety and efficacy of vancomycin trough-guided vs AUC/MIC-guided TDM in the veteran population. Therefore, the objective of this study was to investigate the differences in the safety and efficacy of vancomycin TDM in the veteran population based on the different monitoring methods used.
METHODS
This study was a retrospective, single-center, quasi-experimental chart review conducted at the Sioux Falls Veterans Affairs Health Care System (SFVAHCS) in South Dakota. Data were collected from the Computerized Patient Record System (CPRS). The SFVAHCS transitioned from trough-guided to AUC/MIC-guided TDM in November 2020.
Patients included in this study were veterans aged ≥ 18 years with orders for parenteral vancomycin between February 1, 2020, and October 31, 2020, for the trough-guided TDM group and between December 1, 2020, and August 31, 2021, for the AUC/MIC-guided TDM group. Patients with vancomycin courses initiated during November 2020 were excluded as both TDM methods were being used at that time. Patients were excluded if their vancomycin course began before February 1, 2020, for the trough-guided TDM group or began during November 2020 for the AUC/MIC-guided TDM group. Patients were excluded if their vancomycin course extended past October 31, 2020, for the trough group or past August 31, 2021, for the AUC/MIC group. Patients on dialysis or missing Cmax, Cmin, or sCr levels were excluded.
This study evaluated both safety (AKI incidence) and effectiveness (time spent in therapeutic range and time to therapeutic range). The primary endpoint was presence of vancomycin-induced AKI, which was based on the most recent Kidney Disease: Improving Global Outcomes (KDIGO) AKI definition: increased sCr of ≥ 0.3 mg/dL or by 50% from baseline sustained over 48 hours without any other explanation for the change.11 A secondary endpoint was the absence or presence of AKI.
Additional secondary endpoints included the presence of the initial trough or AUC/MIC of each vancomycin course within the therapeutic range and the percentage of all trough levels or AUC/MICs within therapeutic, subtherapeutic, and supratherapeutic ranges. The therapeutic range for AUC/MIC-guided TDM was 400 to 600 mg × h/L and 10 to 20 mg/L depending on indication for trough-guided TDM (15-20 mg/L for severe infections and 10-15 mg/L for less invasive infections). The percentage of trough levels or AUC/MICs within therapeutic, subtherapeutic, and supratherapeutic ranges were calculated as a ratio of levels within each range to total levels taken for each patient.
For AUC/MIC-guided TDM the Cmax levels were ideally drawn 1 to 2 hours after vancomycin infusion and Cmin levels were ideally drawn 30 minutes before the next dose. First-order pharmacokinetic equations were used to estimate the AUC/MIC.12 If the timing of a vancomycin level was inappropriate, actual levels were extrapolated based on the timing of the blood draw compared with the ideal Cmin or Cmax time. Extrapolated levels were used for both trough-guided and AUC/MIC-guided TDM groups when appropriate. Vancomycin levels were excluded if they were drawn during the vancomycin infusion.
Study participant age, sex, race, weight, baseline estimated glomerular filtration (eGFR) rate, baseline sCr, concomitant nephrotoxic medications, duration of vancomycin course, indication of vancomycin, and acuity of illness based on indication were collected. sCr levels were collected from the initial day vancomycin was ordered through 72 hours following completion of a vancomycin course to evaluate for AKI. Patients’ charts were reviewed for the use of the following nephrotoxic medications: nonsteroidal anti-inflammatories, angiotensin-converting enzyme inhibitors, angiotensin II receptor blockers, aminoglycosides, piperacillin/tazobactam, loop diuretics, amphotericin B, acyclovir, intravenous contrast, and nephrotoxic chemotherapy (cisplatin). The category of concomitant nephrotoxic medications was also collected including the continuation of a home nephrotoxic medication vs the initiation of a new nephrotoxic medication.
Statistical Analysis
The primary endpoint of the incidence of vancomycin-induced AKI was compared using a Fisher exact test. The secondary endpoint of the percentage of trough levels or AUC/MICs in the therapeutic, subtherapeutic, and supratherapeutic range were compared using a student t test. The secondary endpoint of first level or AUC/MIC within goal range was compared using a χ2 test. Continuous baseline characteristics were reported as a mean and compared using a student t test. Nominal baseline characteristics were reported as a percentage and compared using the χ2 test. P values < .05 were considered statistically significant.
RESULTS
This study included 97 patients, 43 in the AUC/MIC group and 54 in the trough group.
One (2%) patient in the AUC/MIC group and 2 (4%) patients in the trough group experienced vancomycin-induced AKI (P = .10) (Table 2).
DISCUSSION
There was no statistically significant difference between the 2 groups for the vancomycin-induced AKI (P = .10), the primary endpoint, or overall AKI (P = .29), the secondary endpoint. It should be noted that there was more overall AKI in the AUC/MIC group. Veterans in the AUC/MIC group were found to have their first AUC/MIC within the therapeutic range statistically significantly more often than the first trough level in the trough group (P = .04). The percentage of time spent within therapeutic range was statistically significantly higher in the AUC/MIC-guided TDM group (P = .02). The percentage of time spent subtherapeutic of goal range was statistically significantly higher in the trough-guided TDM group (P < .001). There was no statistically significant difference found in the percent of time spent supratherapeutic of goal range (P = .25). However, the observed percentage of time spent supratherapeutic of goal range was higher in the AUC/MIC group. These results indicate that AUC/MIC-guided TDM may be more efficacious with regard to time in therapeutic range and time to therapeutic range.
The finding of increased AKI with AUC/MIC-guided TDM does not align with previous studies.8 The prospective study by Neely and colleagues found that AUC/MIC-guided TDM resulted in more time in the therapeutic range as well as less nephrotoxicity compared with trough-guided TDM, although it was limited by its lack of randomization and did not account for other causes of nephrotoxicity.8 They found that only 19% of trough concentrations were therapeutic compared with 70% of AUC/MICs and found nephrotoxicity in 8% of trough-guided TDM patients compared with 2% of AUC/MIC-guided TDM patients.8
Unlike Nealy and colleagues, our study did not find lower nephrotoxicity associated with AUC/MIC-guided TDM. Multiple factors may have influenced our results. Our AUC/MIC group had significantly more newly started concomitant nephrotoxins and other nephrotoxic medications used during the vancomycin courses compared with the trough-guided group, which may have influenced AKI outcomes. It also should be noted that there was significantly more time spent subtherapeutic of the goal range and significantly less time in the goal range in the trough group compared with the AUC/MIC group. In our study, the trough-guided group had significantly more patients with acute illness compared with the AUC/MIC group (skin, soft tissue, and joint infections were similar between the groups). The group with more acutely ill patients would have been expected to have more nephrotoxicity. However, despite the acute illnesses, patients in the trough-guided group spent more time in the subtherapeutic range. This may explain the increased nephrotoxicity in the AUC/MIC group since those patients spent more time in the therapeutic range.
This study used the most recent KDIGO AKI definition: either an increase in sCr of ≥ 0.3 mg/dL or a 50% increase in sCr from baseline sustained over 48 hours without any other explanation for the change in renal function.11 This AKI definition is stricter than the previous definition, which was used by earlier studies, including Neely and colleagues, to evaluate rates of vancomycin-induced AKI.2,3 Therefore, the rates of overall AKI found in this study may be higher than in previous studies due to the definition of AKI used.
Limitations
This study was limited by its retrospective nature, lack of randomization, and small sample size. To decrease the potential for error in this study, analysis of power and a larger study sample would have been beneficial. During the COVID-19 pandemic, increased pneumonia cases may have hidden bacterial causes and caused an undercount. Nephrotoxicity may also be related to volume depletion, severe systemic illness, dehydration, or hypotension. Screening was completed via chart review for these alternative causes of nephrotoxicity in this study but may not be completely accounted for due to lack of documentation and the retrospective nature of this study.
CONCLUSIONS
This study did not find a significant difference in the rates of vancomycin-induced or overall AKI between AUC/MIC-guided and trough-guided TDM. However, this study may not have been powered to detect a significant difference in the primary endpoint. This study indicated that AUC/MIC-guided TDM of vancomycin resulted in a quicker time to the therapeutic range and a higher percentage of overall time in the therapeutic range as compared with trough-guided TDM. The results of this study indicated that trough-guided monitoring resulted in a higher percentage of time in a subtherapeutic range. This study also found that the first AUC/MIC calculated was within therapeutic range more often than the first trough level collected.
These results indicate that AUC/MIC-guided TDM may be more effective than trough-guided TDM in the veteran population. However, while AUC/MIC-guided TDM may be more effective with regards to time in therapeutic range and time to therapeutic range, this study did not indicate any safety benefit of AUC/MIC-guided over trough-guided TDM with regards to AKI incidence. Our data indicate that AUC/MIC-guided TDM increases the amount of time in the therapeutic range compared with trough-guided TDM and is not more nephrotoxic. The findings of this study support the recommendation to transition to the use of AUC/MIC-guided TDM of vancomycin in the veteran population.
Acknowledgments
This material is the result of work supported with the use of facilities and resources from the Sioux Falls Veterans Affairs Health Care System.
1. Gallagher J, MacDougall C. Glycopeptides and short-acting lipoglycopeptides In: Antibiotics Simplified. Jones & Bartlett Learning; 2018.
2. Rybak MJ, Le J, Lodise TP, et al. Therapeutic monitoring of vancomycin for serious methicillin-resistant Staphylococcus aureus infections: a revised consensus guideline and review by the American Society of Health-System Pharmacists, the Infectious Diseases Society of America, the Pediatric Infectious Diseases Society, and the Society of Infectious Diseases Pharmacists. Am J Health Syst Pharm. 2020;77(11):835-864. doi:10.1093/ajhp/zxaa036
3. Hermsen ED, Hanson M, Sankaranarayanan J, Stoner JA, Florescu MC, Rupp ME. Clinical outcomes and nephrotoxicity associated with vancomycin trough concentrations during treatment of deep-seated infections. Expert Opin Drug Saf. 2010;9(1):9-14. doi:10.1517/14740330903413514
4. Poston-Blahnik A, Moenster R. Association between vancomycin area under the curve and nephrotoxicity: a single center, retrospective cohort study in a veteran population. Open Forum Infect Dis. 2021;8(5):ofab094. Published 2021 Mar 12. doi:10.1093/ofid/ofab094
5. Rybak M, Lomaestro B, Rotschafer JC, et al. Therapeutic monitoring of vancomycin in adult patients: a consensus review of the American Society of Health-System Pharmacists, the Infectious Diseases Society of America, and the Society of Infectious Diseases Pharmacists. Am J Health Syst Pharm. 2009;66(1):82-98. doi:10.2146/ajhp080434
6. Moise-Broder PA, Forrest A, Birmingham MC, Schentag JJ. Pharmacodynamics of vancomycin and other antimicrobials in patients with Staphylococcus aureus lower respiratory tract infections. Clin Pharmacokinet. 2004;43(13):925-942. doi:10.2165/00003088-200443130-00005
7. Gyamlani G, Potukuchi PK, Thomas F, et al. Vancomycin-Associated Acute Kidney Injury in a Large Veteran Population. Am J Nephrol. 2019;49(2):133-142. doi:10.1159/000496484
8. Neely MN, Kato L, Youn G, et al. Prospective Trial on the Use of Trough Concentration versus Area under the Curve To Determine Therapeutic Vancomycin Dosing. Antimicrob Agents Chemother. 2018;62(2):e02042-17. Published 2018 Jan 25. doi:10.1128/AAC.02042-17
9. Prabaker KK, Tran TP, Pratummas T, Goetz MB, Graber CJ. Elevated vancomycin trough is not associated with nephrotoxicity among inpatient veterans. J Hosp Med. 2012;7(2):91-97. doi:10.1002/jhm.946
10. Patel N, Stornelli N, Sangiovanni RJ, Huang DB, Lodise TP. Effect of vancomycin-associated acute kidney injury on incidence of 30-day readmissions among hospitalized Veterans Affairs patients with skin and skin structure infections. Antimicrob Agents Chemother. 2020;64(10):e01268-20. Published 2020 Sep 21. doi:10.1128/AAC.01268-20
11. Acute Kidney Injury Work Group. Kidney Disease: Improving Global Outcomes (KDIGO) Clinical Practice Guideline for Acute Kidney Injury. Kidney Int. 2012;2(suppl 1):1-138.
12. Pai MP, Neely M, Rodvold KA, Lodise TP. Innovative approaches to optimizing the delivery of vancomycin in individual patients. Adv Drug Deliv Rev. 2014;77:50-57. doi:10.1016/j.addr.2014.05.016
Rituximab Treatment and Improvement of Health-Related Quality of Life in Patients With Pemphigus
Pemphigus is a group of autoimmune blistering diseases characterized by the development of painful and flaccid blisters on the skin and/or mucous membranes. Pemphigus vulgaris (PV) and pemphigus foliaceus (PF) are 2 major subtypes and can be distinguished by the location of blister formation or the specificity of autoantibodies directed against different desmogleins.1,2 Although rare, pemphigus is considered a serious and life-threatening condition with a great impact on quality of life (QOL) due to disease symptoms (eg, painful lesions, physical appearance of skin lesions) as well as treatment complications (eg, adverse drug effects, cost of treatment).3-6 Moreover, the physical and psychological effects can lead to marked functional morbidity and work-related disability during patients’ productive years.7 Therefore, affected individuals usually have a remarkably compromised health-related quality of life (HRQOL).8 Effective treatments may considerably improve the QOL of patients with pemphigus.6
Despite the available treatment options, finding the best regimen for pemphigus remains a challenge. Corticosteroids are assumed to be the main treatment, though they have considerable side effects.9,10 Adjuvant therapies are used to suppress or modulate immune responses, leading to remission with the least possible need for corticosteroids. Finding an optimal steroid-sparing agent has been the aim of research, and biologic agents seem to be the best option.8 Rituximab (RTX), an anti-CD20 monoclonal antibody, has shown great promise in several studies of its clinical efficacy and has become a first-line treatment in new guidelines.11-14 Rituximab treatment has been associated with notable improvement in physician-assessed outcome measures with a favorable safety profile in patients with pemphigus.11-15 However, it is important to assess response to treatment from a patient’s perspective through the use of outcome-assessment measures that encompass patient-reported outcomes to reflect the complete patient experience and establish the overall impact of RTX as well as its likelihood of acceptance by patients with pemphigus.
In our study, we compared clinical outcomes and HRQOL through the use of disease-specific measures as well as comprehensive generic health status measures among patients with PV and PF who received RTX treatment 3 months earlier and those who received RTX in the last 2 weeks. The clinical relevance of the patient-reported outcomes is discussed.
MATERIALS AND METHODS
Study Design
We conducted a single-center cross-sectional study of 96 patients with pemphigus aged 18 to 65 years of either sex who were willing to participate in this study. Patients with a confirmed diagnosis of PV or PF who received RTX 3 months earlier or in the last 2 weeks were enrolled in the study. Patients were identified using Dermatry.ir, an archiving software that contains patients’ medical data. Exclusion criteria included lack of sufficient knowledge of the concepts of the questionnaires as well as age younger than 16 years. The study was conducted from October 2019 to April 2020 by the Autoimmune Bullous Disease Research Center at Razi Hospital in Tehran, Iran, which is the main dermatology-specific center and teaching hospital of Iran. The study protocol was approved by the relevant ethics committee.
Patients were categorized into 2 groups: (1) those who received RTX 3 months earlier (3M group); and (2) those who received RTX in the last 2 weeks (R group).
After an explanation of the study to participants, informed written consent was signed by each patient, and their personal data (eg, age, sex, education, marital status, smoking status), as well as clinical data (eg, type of pemphigus, duration of disease, site of onset, prednisolone dosage, presence of Nikolsky sign, anti-DSG1 and anti-DSG3 values, Pemphigus Disease Area Index [PDAI] score, RTX treatment protocol); any known comorbidities such as hypertension, diabetes mellitus, or morbid obesity; and any chronic pulmonary, cardiac, endocrinologic, renal, or hepatic condition, were collected and recorded in a predefined Case Record.
Patient-Reported Outcome Measures
The effect of RTX on QOL in patients with pemphigus was assessed using 2 HRQOL instruments: (1) a general health status indicator, the 36-Item Short Form Survey (SF-36), and (2) a validated, Persian version of a dermatology-specific questionnaire, Dermatology Life Quality Index (DLQI). The questionnaires were completed by each patient or by an assistant if needed.
The SF-36 is a widely used 36-item questionnaire measuring functional health and well-being across 8 domains—mental health, pain, physical function, role emotional, role physical, social functioning, vitality, and general health perception—with scores for each ranging from 0 to 100. The physical component scores (PCSs) and mental component scores (MCSs) were derived from these 8 subscales, each ranging from 0 to 400, with higher scores indicating better health status.6
The DLQI, one of the most frequently used QOL measures in dermatology, contains 10 questions, each referring to the prior week and classified in the following 6 subscales: symptoms and feelings, daily activities, leisure, personal relationships, work and school, and treatment.16 The total score ranges from 0 (no impact) to 30 (very high impact), with a higher score indicating a lower QOL (eTable 1). The minimal clinically important difference (MCD) for the DLQI was considered to be 2- to 5-point changes in prior studies.17,18 In this study, we used an MCD of a 5-point change or more between study groups.

Moreover, the patient general assessment (PGA) of disease severity was identified using a 3-point scale (1=mild, 2=moderate, 3=severe).
Statistical Analysis
Data were analyzed using SPSS Statistics version 23. P≤.05 was considered significant. Mean and SD were calculated for descriptive data. The t test, Fisher exact test, analysis of variance, multiple regression analysis, and logistic regression analysis were used to identify the relationship between variables.
RESULTS
Patient Characteristics
A total of 96 patients were enrolled in this study. The mean (SD) age of participants was 41.42 (15.1) years (range, 18–58 years). Of 96 patients whose data were included, 55 (57.29%) patients had received RTX 3 months earlier (3M group) and 41 (42.71%) received RTX in the last 2 weeks (R group). A summary of study patient characteristics in each group is provided in eTable 2. There was no significant difference between the 2 groups in terms of age, sex, type of pemphigus, marital status, education, positive Nikolsky sign, smoking status, existence of comorbidities, site of lesions, and RTX treatment protocol. However, a significant difference was found for duration of disease (P=.0124) and mean prednisolone dosage (P=.001) as well as severity of disease measured by PDAI score (P=.003) and anti-DSG1 (P=.003) and anti-DSG3 (P=.021) values.

Patient-Reported Outcomes
Physical and mental component scores are summarized in eTable 3. Generally, SF-36 scores were improved with RTX treatment in all dimensions except for mental health, though these differences were not statistically significant, with the greatest mean improvement in the role physical index (75.45 in the 3M group vs 53.04 in the R group; P=.009). Mean SF-36 PCS and MCS scores were higher in the 3M group vs the R group, though the difference in MCS score did not reach the level of significance (eTable 3).

Mean DLQI scores in the R and 3M groups were 12.31 and 6.96, respectively, indicating a considerable burden on HRQOL in both groups. However, a statistically significant difference between these values was seen that also was clinically meaningful, indicating a significant improvement of QOL in patients receiving RTX 3 months earlier (P=.005)(eTable 3).
The PGA scores indicated that patients in the 3M group were significantly more likely to report less severe disease vs the R group (P=.008)(eTable 3).
Multivariate Analysis—Effect of the patient characteristics and some disease features on indices of QOL was evaluated using the multiple linear regression model. eTable 4 shows the P values of those analyses.
 for Study Variants")
COMMENT
Pemphigus is a chronic disabling disease with notable QOL impairment due to disease burden as well as the need for long-term use of immunosuppressive agents during the disease course. To study the effect of RTX on QOL of patients with pemphigus, we compared 2 sets of patients. Prior studies have shown that clinically significant effects of RTX take 4 to 12 weeks to appear.19,20 Therefore, we selected patients who received RTX 3 months earlier to measure their HRQOL indices and compare them with patients who had received RTX in the last 2 weeks as a control group to investigate the effect of RTX intrinsically, as this was the focus of this study.
In our study, one of the research tools was the DLQI. Healthy patients typically have an average score of 0.5.21 The mean DLQI score of the patients in R group was 12.31, which was similar to prior analysis8 and reflects a substantial burden of disease comparable to atopic dermatitis and psoriasis.21,22 In patients in the 3M group, the mean DLQI score was lower than the R group (6.96 vs 12.31), indicating a significant (P=.005) and clinically meaningful improvement in QOL of patients due to the dramatic therapeutic effect of RTX. However, this score indicated a moderate effect on HRQOL, even in the context of clinical improvement due to RTX treatment, which may reflect that the short duration of treatment in the 3M group was a limitation of this study. Although the 12-week treatment duration was comparable with other studies19,20 and major differences in objective measures of treatment efficacy were found in PDAI as well as anti-DSG1 and anti-DSG3 values, longer treatment duration may be needed for a more comprehensive assessment of the benefit of RTX on HRQOL indices in patients with pemphigus.
Based on results of the SF-36 questionnaire, PCS and MCS scores were not substantially impaired in the R group considering the fact that a mean score of 50 has been articulated as a normative value for all scales.23 These data demonstrated the importance of using a dermatologic-specific instrument such as the DLQI instead of a general questionnaire to assess QOL in patients with pemphigus. However, better indices were reported with RTX treatment in the 3 SF-36 domains—role physical (P=.009), role emotional (P=.03), and general health perception (P=.03)—with the role physical showing the greatest magnitude of mean change (75.45 in the 3M group vs 53.04 in the R group). Notably, PCS was impaired to a greater extent than MCS in patients in the R group and showed a greater magnitude of improvement after 3 months of treatment. These results could be explained by the fact that MCS can be largely changed in diseases with a direct effect on the central nervous system.23
Our results also revealed that the dose of corticosteroid correlated to HRQOL of patients with pemphigus who recently received RTX therapy. Indeed, it is more likely that patients on lower-dose prednisolone have a higher QOL, especially on physical function and social function dimensions of SF-36. This finding is highly expectable by less severe disease due to RTX treatment and also lower potential dose-dependent adverse effects of long-term steroid therapy.
One of the most striking findings of this study was the correlation of location of lesions to QOL indices. We found that the mucocutaneous phenotype was significantly correlated to greater improvement in role emotional, role physical, and social functioning scores due to RTX treatment compared with cutaneous or mucosal types (P=.02, P=.025, and P=.017, respectively). Although mucosal involvement of the disease can be the most burdensome feature because of its large impact on essential activities such as eating and speaking, cutaneous lesions with unpleasant appearance and undesirable symptoms may have a similar impact on QOL. Therefore, having both mucosal and cutaneous lesions causes a worsened QOL and decreased treatment efficacy vs having only one area involved. This may explain the greater improvement in some QOL indices with RTX treatment.
Limitations—Given the cross-sectional design of this study in which patients were observed at a single time point during their treatment course, it is not possible to establish a clear cause-effect relationship between variables. Moreover, we did not evaluate the impact of RTX or prednisolone adverse effects on QOL. Therefore, further prospective studies with longer treatment durations may help to validate our findings. In addition, MCDs for DLQI and SF-36 in pemphigus need to be determined and validated in future studies.
CONCLUSION
The results of our study demonstrated that patients with pemphigus may benefit from taking RTX, not only in terms of clinical improvement of their disease measured by objective indices such as PDAI and anti-DSG1 and anti-DSG3 values but also in several domains that are important to patients, including physical and mental health status (SF-36), HRQOL (DLQI), and overall disease severity (PGA). Rituximab administration in patients with pemphigus can lead to rapid and significant improvement in HRQOL as well as patient- and physician-assessed measures. Its favorable safety profile along with its impact on patients’ daily lives and mental health makes RTX a suitable treatment option for patients with pemphigus. Moreover, we recommend taking QOL indices into account while evaluating the efficacy of new medications to improve our insight into the patient experience and provide better patient adherence to treatment, which is an important issue for optimal control of chronic disorders.
- Hammers CM, Stanley JR. Mechanisms of disease: pemphigus and bullous pemphigoid. Ann Rev Pathol. 2016;11:175-197.
- Kasperkiewicz M, Ellebrecht CT, Takahashi H, et al. Pemphigus. Nat Rev Dis Primers. 2017;3:17026.
- Mayrshofer F, Hertl M, Sinkgraven R, et al. Significant decrease in quality of life in patients with pemphigus vulgaris, result from the German Bullous Skin Disease (BSD) Study Group. J Dtsch Dermatol Ges. 2005;3:431-435.
- Terrab Z, Benckikhi H, Maaroufi A, et al. Quality of life and pemphigus. Ann Dermatol Venereol. 2005;132:321-328.
- Tabolli S, Mozzetta A, Antinone V, et al. The health impact of pemphigus vulgaris and pemphigus foliaceus assessed using the Medical Outcomes Study 36-item short form health survey questionnaire. Br J Dermatol. 2008;158:1029-1034.
- Paradisi A, Sampogna F, Di Pietro, C, et al. Quality-of-life assessment in patients with pemphigus using a minimum set of evaluation tools. J Am Acad Dermatol. 2009;60:261-269.
- Heelan K, Hitzig SL, Knowles S, et al. Loss of work productivity and quality of life in patients with autoimmune bullous dermatoses. J Cutan Med Surg. 2015;19:546-554.
- Ghodsi SZ, Chams-Davatchi C, Daneshpazhooh M, et al. Quality of life and psychological status of patients with pemphigus vulgaris using Dermatology Life Quality Index and General Health Questionnaires. J Dermatol. 2012;39:141-144.
- Schäcke H, Döcke WD, Asadullah K. Mechanisms involved in the side effects of glucocorticoids. Pharmacol Ther. 2002;96:2343.
- Mohammad-Javad N, Parvaneh H, Maryam G, et al. Randomized trial of tacrolimus 0.1% ointment versus triamcinolone acetonide 0.1% paste in the treatment of oral pemphigus vulgaris. Iranian J Dermatol. 2012;15:42-46.
- Lunardon L, Tsai KJ, Propert KJ, et al. Adjuvant rituximab therapy of pemphigus: a single-center experience with 31 patients. Arch Dermatol. 2012;148:1031-1036.
- Colliou N, Picard D, Caillot F, et al. Long-term remissions of severe pemphigus after rituximab therapy are associated with prolonged failure of desmoglein B cell response. Sci Transl Med. 2013;5:175ra30.
- Heelan K, Al-Mohammedi F, Smith MJ, et al. Durable remission of pemphigus with a fixed-dose rituximab protocol. JAMA Dermatol. 2014;150:703-708.
- Joly P, Maho-Vaillant M, Prost-Squarcioni C, et al. First-line rituximab combined with short-term prednisone versus prednisone alone for the treatment of pemphigus (Ritux3): a prospective, multicentre, parallel-group, open-label randomised trial. Lancet. 2017;389:2031-2040
- Aryanian Z, Balighi K, Daneshpazhooh M, et al. Rituximab exhibits a better safety profile when used as a first line of treatment for pemphigus vulgaris: a retrospective study. Int Immunopharmacol. 2021;96:107755.
- Aghai S, Sodaifi M, Jafari P, et al. DLQI scores in vitiligo: reliability and validity of the Persian version. BMC Dermatol. 2004;4:8.
- Schünemann HJ, Akl EA, Guyatt GH. Interpreting the results of patient reported outcome measures in clinical trials: the clinician’s perspective. Health Qual Life Outcomes. 2006;4:62.
- Quality of life questionnaires. Cardiff University website. Accessed December 16, 2022. http://sites.cardiff.ac.uk/dermatology/quality-oflife/dermatology-quality-of-life-index-dlqi/dlqi-instructions-foruse-and-scoring/
- Kanwar AJ, Tsuruta D, Vinay K, et al. Efficacy and safety of rituximab treatment in Indian pemphigus patients. J Eur Acad Dermatol Venereol. 2013;27:E17-E23.
- Ingen-Housz-Oro S, Valeyrie-Allanore L, Cosnes A, et al. First-line treatment of pemphigus vulgaris with a combination of rituximab and high-potency topical corticosteroids. JAMA Dermatol. 2015;151:200-203.
- Finlay AY, Khan GK. Dermatology Life Quality Index (DLQI): a simple practical measure for routine clinical use. Clin Exp Dermatol. 1994;19:210-216.
- Aghaei S, Moradi A, Ardekani GS. Impact of psoriasis on quality of life in Iran. Indian J Dermatol Venereol Leprol. 2009;75:220.
- Ware JE Jr, Sherbourne CD. The MOS 36-item Short-Form Health Survey (SF-36). 1. conceptual framework and item selection. Med Care. 1992;30:473-483.
Pemphigus is a group of autoimmune blistering diseases characterized by the development of painful and flaccid blisters on the skin and/or mucous membranes. Pemphigus vulgaris (PV) and pemphigus foliaceus (PF) are 2 major subtypes and can be distinguished by the location of blister formation or the specificity of autoantibodies directed against different desmogleins.1,2 Although rare, pemphigus is considered a serious and life-threatening condition with a great impact on quality of life (QOL) due to disease symptoms (eg, painful lesions, physical appearance of skin lesions) as well as treatment complications (eg, adverse drug effects, cost of treatment).3-6 Moreover, the physical and psychological effects can lead to marked functional morbidity and work-related disability during patients’ productive years.7 Therefore, affected individuals usually have a remarkably compromised health-related quality of life (HRQOL).8 Effective treatments may considerably improve the QOL of patients with pemphigus.6
Despite the available treatment options, finding the best regimen for pemphigus remains a challenge. Corticosteroids are assumed to be the main treatment, though they have considerable side effects.9,10 Adjuvant therapies are used to suppress or modulate immune responses, leading to remission with the least possible need for corticosteroids. Finding an optimal steroid-sparing agent has been the aim of research, and biologic agents seem to be the best option.8 Rituximab (RTX), an anti-CD20 monoclonal antibody, has shown great promise in several studies of its clinical efficacy and has become a first-line treatment in new guidelines.11-14 Rituximab treatment has been associated with notable improvement in physician-assessed outcome measures with a favorable safety profile in patients with pemphigus.11-15 However, it is important to assess response to treatment from a patient’s perspective through the use of outcome-assessment measures that encompass patient-reported outcomes to reflect the complete patient experience and establish the overall impact of RTX as well as its likelihood of acceptance by patients with pemphigus.
In our study, we compared clinical outcomes and HRQOL through the use of disease-specific measures as well as comprehensive generic health status measures among patients with PV and PF who received RTX treatment 3 months earlier and those who received RTX in the last 2 weeks. The clinical relevance of the patient-reported outcomes is discussed.
MATERIALS AND METHODS
Study Design
We conducted a single-center cross-sectional study of 96 patients with pemphigus aged 18 to 65 years of either sex who were willing to participate in this study. Patients with a confirmed diagnosis of PV or PF who received RTX 3 months earlier or in the last 2 weeks were enrolled in the study. Patients were identified using Dermatry.ir, an archiving software that contains patients’ medical data. Exclusion criteria included lack of sufficient knowledge of the concepts of the questionnaires as well as age younger than 16 years. The study was conducted from October 2019 to April 2020 by the Autoimmune Bullous Disease Research Center at Razi Hospital in Tehran, Iran, which is the main dermatology-specific center and teaching hospital of Iran. The study protocol was approved by the relevant ethics committee.
Patients were categorized into 2 groups: (1) those who received RTX 3 months earlier (3M group); and (2) those who received RTX in the last 2 weeks (R group).
After an explanation of the study to participants, informed written consent was signed by each patient, and their personal data (eg, age, sex, education, marital status, smoking status), as well as clinical data (eg, type of pemphigus, duration of disease, site of onset, prednisolone dosage, presence of Nikolsky sign, anti-DSG1 and anti-DSG3 values, Pemphigus Disease Area Index [PDAI] score, RTX treatment protocol); any known comorbidities such as hypertension, diabetes mellitus, or morbid obesity; and any chronic pulmonary, cardiac, endocrinologic, renal, or hepatic condition, were collected and recorded in a predefined Case Record.
Patient-Reported Outcome Measures
The effect of RTX on QOL in patients with pemphigus was assessed using 2 HRQOL instruments: (1) a general health status indicator, the 36-Item Short Form Survey (SF-36), and (2) a validated, Persian version of a dermatology-specific questionnaire, Dermatology Life Quality Index (DLQI). The questionnaires were completed by each patient or by an assistant if needed.
The SF-36 is a widely used 36-item questionnaire measuring functional health and well-being across 8 domains—mental health, pain, physical function, role emotional, role physical, social functioning, vitality, and general health perception—with scores for each ranging from 0 to 100. The physical component scores (PCSs) and mental component scores (MCSs) were derived from these 8 subscales, each ranging from 0 to 400, with higher scores indicating better health status.6
The DLQI, one of the most frequently used QOL measures in dermatology, contains 10 questions, each referring to the prior week and classified in the following 6 subscales: symptoms and feelings, daily activities, leisure, personal relationships, work and school, and treatment.16 The total score ranges from 0 (no impact) to 30 (very high impact), with a higher score indicating a lower QOL (eTable 1). The minimal clinically important difference (MCD) for the DLQI was considered to be 2- to 5-point changes in prior studies.17,18 In this study, we used an MCD of a 5-point change or more between study groups.
Moreover, the patient general assessment (PGA) of disease severity was identified using a 3-point scale (1=mild, 2=moderate, 3=severe).
Statistical Analysis
Data were analyzed using SPSS Statistics version 23. P≤.05 was considered significant. Mean and SD were calculated for descriptive data. The t test, Fisher exact test, analysis of variance, multiple regression analysis, and logistic regression analysis were used to identify the relationship between variables.
RESULTS
Patient Characteristics
A total of 96 patients were enrolled in this study. The mean (SD) age of participants was 41.42 (15.1) years (range, 18–58 years). Of 96 patients whose data were included, 55 (57.29%) patients had received RTX 3 months earlier (3M group) and 41 (42.71%) received RTX in the last 2 weeks (R group). A summary of study patient characteristics in each group is provided in eTable 2. There was no significant difference between the 2 groups in terms of age, sex, type of pemphigus, marital status, education, positive Nikolsky sign, smoking status, existence of comorbidities, site of lesions, and RTX treatment protocol. However, a significant difference was found for duration of disease (P=.0124) and mean prednisolone dosage (P=.001) as well as severity of disease measured by PDAI score (P=.003) and anti-DSG1 (P=.003) and anti-DSG3 (P=.021) values.
Patient-Reported Outcomes
Physical and mental component scores are summarized in eTable 3. Generally, SF-36 scores were improved with RTX treatment in all dimensions except for mental health, though these differences were not statistically significant, with the greatest mean improvement in the role physical index (75.45 in the 3M group vs 53.04 in the R group; P=.009). Mean SF-36 PCS and MCS scores were higher in the 3M group vs the R group, though the difference in MCS score did not reach the level of significance (eTable 3).
Mean DLQI scores in the R and 3M groups were 12.31 and 6.96, respectively, indicating a considerable burden on HRQOL in both groups. However, a statistically significant difference between these values was seen that also was clinically meaningful, indicating a significant improvement of QOL in patients receiving RTX 3 months earlier (P=.005)(eTable 3).
The PGA scores indicated that patients in the 3M group were significantly more likely to report less severe disease vs the R group (P=.008)(eTable 3).
Multivariate Analysis—Effect of the patient characteristics and some disease features on indices of QOL was evaluated using the multiple linear regression model. eTable 4 shows the P values of those analyses.
COMMENT
Pemphigus is a chronic disabling disease with notable QOL impairment due to disease burden as well as the need for long-term use of immunosuppressive agents during the disease course. To study the effect of RTX on QOL of patients with pemphigus, we compared 2 sets of patients. Prior studies have shown that clinically significant effects of RTX take 4 to 12 weeks to appear.19,20 Therefore, we selected patients who received RTX 3 months earlier to measure their HRQOL indices and compare them with patients who had received RTX in the last 2 weeks as a control group to investigate the effect of RTX intrinsically, as this was the focus of this study.
In our study, one of the research tools was the DLQI. Healthy patients typically have an average score of 0.5.21 The mean DLQI score of the patients in R group was 12.31, which was similar to prior analysis8 and reflects a substantial burden of disease comparable to atopic dermatitis and psoriasis.21,22 In patients in the 3M group, the mean DLQI score was lower than the R group (6.96 vs 12.31), indicating a significant (P=.005) and clinically meaningful improvement in QOL of patients due to the dramatic therapeutic effect of RTX. However, this score indicated a moderate effect on HRQOL, even in the context of clinical improvement due to RTX treatment, which may reflect that the short duration of treatment in the 3M group was a limitation of this study. Although the 12-week treatment duration was comparable with other studies19,20 and major differences in objective measures of treatment efficacy were found in PDAI as well as anti-DSG1 and anti-DSG3 values, longer treatment duration may be needed for a more comprehensive assessment of the benefit of RTX on HRQOL indices in patients with pemphigus.
Based on results of the SF-36 questionnaire, PCS and MCS scores were not substantially impaired in the R group considering the fact that a mean score of 50 has been articulated as a normative value for all scales.23 These data demonstrated the importance of using a dermatologic-specific instrument such as the DLQI instead of a general questionnaire to assess QOL in patients with pemphigus. However, better indices were reported with RTX treatment in the 3 SF-36 domains—role physical (P=.009), role emotional (P=.03), and general health perception (P=.03)—with the role physical showing the greatest magnitude of mean change (75.45 in the 3M group vs 53.04 in the R group). Notably, PCS was impaired to a greater extent than MCS in patients in the R group and showed a greater magnitude of improvement after 3 months of treatment. These results could be explained by the fact that MCS can be largely changed in diseases with a direct effect on the central nervous system.23
Our results also revealed that the dose of corticosteroid correlated to HRQOL of patients with pemphigus who recently received RTX therapy. Indeed, it is more likely that patients on lower-dose prednisolone have a higher QOL, especially on physical function and social function dimensions of SF-36. This finding is highly expectable by less severe disease due to RTX treatment and also lower potential dose-dependent adverse effects of long-term steroid therapy.
One of the most striking findings of this study was the correlation of location of lesions to QOL indices. We found that the mucocutaneous phenotype was significantly correlated to greater improvement in role emotional, role physical, and social functioning scores due to RTX treatment compared with cutaneous or mucosal types (P=.02, P=.025, and P=.017, respectively). Although mucosal involvement of the disease can be the most burdensome feature because of its large impact on essential activities such as eating and speaking, cutaneous lesions with unpleasant appearance and undesirable symptoms may have a similar impact on QOL. Therefore, having both mucosal and cutaneous lesions causes a worsened QOL and decreased treatment efficacy vs having only one area involved. This may explain the greater improvement in some QOL indices with RTX treatment.
Limitations—Given the cross-sectional design of this study in which patients were observed at a single time point during their treatment course, it is not possible to establish a clear cause-effect relationship between variables. Moreover, we did not evaluate the impact of RTX or prednisolone adverse effects on QOL. Therefore, further prospective studies with longer treatment durations may help to validate our findings. In addition, MCDs for DLQI and SF-36 in pemphigus need to be determined and validated in future studies.
CONCLUSION
The results of our study demonstrated that patients with pemphigus may benefit from taking RTX, not only in terms of clinical improvement of their disease measured by objective indices such as PDAI and anti-DSG1 and anti-DSG3 values but also in several domains that are important to patients, including physical and mental health status (SF-36), HRQOL (DLQI), and overall disease severity (PGA). Rituximab administration in patients with pemphigus can lead to rapid and significant improvement in HRQOL as well as patient- and physician-assessed measures. Its favorable safety profile along with its impact on patients’ daily lives and mental health makes RTX a suitable treatment option for patients with pemphigus. Moreover, we recommend taking QOL indices into account while evaluating the efficacy of new medications to improve our insight into the patient experience and provide better patient adherence to treatment, which is an important issue for optimal control of chronic disorders.
- Hammers CM, Stanley JR. Mechanisms of disease: pemphigus and bullous pemphigoid. Ann Rev Pathol. 2016;11:175-197.
- Kasperkiewicz M, Ellebrecht CT, Takahashi H, et al. Pemphigus. Nat Rev Dis Primers. 2017;3:17026.
- Mayrshofer F, Hertl M, Sinkgraven R, et al. Significant decrease in quality of life in patients with pemphigus vulgaris, result from the German Bullous Skin Disease (BSD) Study Group. J Dtsch Dermatol Ges. 2005;3:431-435.
- Terrab Z, Benckikhi H, Maaroufi A, et al. Quality of life and pemphigus. Ann Dermatol Venereol. 2005;132:321-328.
- Tabolli S, Mozzetta A, Antinone V, et al. The health impact of pemphigus vulgaris and pemphigus foliaceus assessed using the Medical Outcomes Study 36-item short form health survey questionnaire. Br J Dermatol. 2008;158:1029-1034.
- Paradisi A, Sampogna F, Di Pietro, C, et al. Quality-of-life assessment in patients with pemphigus using a minimum set of evaluation tools. J Am Acad Dermatol. 2009;60:261-269.
- Heelan K, Hitzig SL, Knowles S, et al. Loss of work productivity and quality of life in patients with autoimmune bullous dermatoses. J Cutan Med Surg. 2015;19:546-554.
- Ghodsi SZ, Chams-Davatchi C, Daneshpazhooh M, et al. Quality of life and psychological status of patients with pemphigus vulgaris using Dermatology Life Quality Index and General Health Questionnaires. J Dermatol. 2012;39:141-144.
- Schäcke H, Döcke WD, Asadullah K. Mechanisms involved in the side effects of glucocorticoids. Pharmacol Ther. 2002;96:2343.
- Mohammad-Javad N, Parvaneh H, Maryam G, et al. Randomized trial of tacrolimus 0.1% ointment versus triamcinolone acetonide 0.1% paste in the treatment of oral pemphigus vulgaris. Iranian J Dermatol. 2012;15:42-46.
- Lunardon L, Tsai KJ, Propert KJ, et al. Adjuvant rituximab therapy of pemphigus: a single-center experience with 31 patients. Arch Dermatol. 2012;148:1031-1036.
- Colliou N, Picard D, Caillot F, et al. Long-term remissions of severe pemphigus after rituximab therapy are associated with prolonged failure of desmoglein B cell response. Sci Transl Med. 2013;5:175ra30.
- Heelan K, Al-Mohammedi F, Smith MJ, et al. Durable remission of pemphigus with a fixed-dose rituximab protocol. JAMA Dermatol. 2014;150:703-708.
- Joly P, Maho-Vaillant M, Prost-Squarcioni C, et al. First-line rituximab combined with short-term prednisone versus prednisone alone for the treatment of pemphigus (Ritux3): a prospective, multicentre, parallel-group, open-label randomised trial. Lancet. 2017;389:2031-2040
- Aryanian Z, Balighi K, Daneshpazhooh M, et al. Rituximab exhibits a better safety profile when used as a first line of treatment for pemphigus vulgaris: a retrospective study. Int Immunopharmacol. 2021;96:107755.
- Aghai S, Sodaifi M, Jafari P, et al. DLQI scores in vitiligo: reliability and validity of the Persian version. BMC Dermatol. 2004;4:8.
- Schünemann HJ, Akl EA, Guyatt GH. Interpreting the results of patient reported outcome measures in clinical trials: the clinician’s perspective. Health Qual Life Outcomes. 2006;4:62.
- Quality of life questionnaires. Cardiff University website. Accessed December 16, 2022. http://sites.cardiff.ac.uk/dermatology/quality-oflife/dermatology-quality-of-life-index-dlqi/dlqi-instructions-foruse-and-scoring/
- Kanwar AJ, Tsuruta D, Vinay K, et al. Efficacy and safety of rituximab treatment in Indian pemphigus patients. J Eur Acad Dermatol Venereol. 2013;27:E17-E23.
- Ingen-Housz-Oro S, Valeyrie-Allanore L, Cosnes A, et al. First-line treatment of pemphigus vulgaris with a combination of rituximab and high-potency topical corticosteroids. JAMA Dermatol. 2015;151:200-203.
- Finlay AY, Khan GK. Dermatology Life Quality Index (DLQI): a simple practical measure for routine clinical use. Clin Exp Dermatol. 1994;19:210-216.
- Aghaei S, Moradi A, Ardekani GS. Impact of psoriasis on quality of life in Iran. Indian J Dermatol Venereol Leprol. 2009;75:220.
- Ware JE Jr, Sherbourne CD. The MOS 36-item Short-Form Health Survey (SF-36). 1. conceptual framework and item selection. Med Care. 1992;30:473-483.
PRACTICE POINTS
- Pemphigus is an autoimmune blistering disease that can negatively affect patients’ lives.
- Assessing the impact of treatment from a patient’s perspective using outcome assessment measures is important and relevant in trials of new pemphigus treatments including rituximab.
- Rituximab administration in pemphigus patients led to rapid and notable improvement in health-related quality of life and patient-assessed measures.
Factors Influencing Patient Preferences for Phototherapy: A Survey Study
Phototherapy—particularly UVB phototherapy, which utilizes UVB rays of specific wavelengths within the UV spectrum—is indicated for a wide variety of dermatoses. In-office and at-home UVB treatments commonly are used, as are salon tanning and sunbathing. When selecting a form of phototherapy, patients are likely to consider safety, cost, effectiveness, insurance issues, and convenience. Research on patient preferences; the reasons for these preferences; and which options patients perceive to be the safest, most cost-effective, efficacious, and convenient is lacking. We aimed to assess the forms of phototherapy that patients would most consider using; the factors influencing patient preferences; and the forms patients perceived as the safest and most cost-effective, efficacious, and convenient.
Methods
Study Participants—We recruited 500 Amazon Mechanical Turk users who were 18 years or older to complete our REDCap-generated survey. The study was approved by the Wake Forest University institutional review board (Winston-Salem, North Carolina).
Evaluation—Participants were asked, “If you were diagnosed with a skin disease that benefited from UV therapy, which of the following forms of UV therapy would you consider choosing?” Participants were instructed to choose all of the forms they would consider using. Available options included in-office UV, at-home UV, home tanning, salon tanning, sunbathing, and other. Participants were asked to select which factors—from safety, cost, effectiveness, issues with insurance, convenience, and other—influenced their decision-making; which form of phototherapy they would most consider along with the factors that influenced their preference for this specific form of phototherapy; and which options they considered to be safest and most cost-effective, efficacious, and convenient. Participants were asked to provide basic sociodemographic information, level of education, income, insurance status (private, Medicare, Medicaid, Veterans Affairs, and uninsured), and distance from the nearest dermatologist.
Statistical Analysis—Descriptive and inferential statistics (χ2 test) were used to analyze the data with a significance set at P<.05.
Results
Five hundred participants completed the survey (Table 1).

Factors Influencing Patient Preferences—When asked to select all forms of phototherapy they would consider, 186 (37.2%) participants selected in-office UVB, 263 (52.6%) selected at-home UV, 141 (28.2%) selected home tanning, 117 (23.4%) selected salon tanning, 191 (38.2%) selected sunbathing, and 3 (0.6%) selected other. Participants who selected in-office UVB as an option were more likely to also select salon tanning (P<.012). No other relationship was found between the UVB options and the tanning options. When asked which factors influenced their phototherapy preferences, 295 (59%) selected convenience, 266 (53.2%) selected effectiveness, 220 (44%) selected safety, 218 (43.6%) selected cost, 72 (14.4%) selected issues with insurance, and 4 (0.8%) selected other. Forms of Phototherapy Patients Consider Using—When asked which form of phototherapy they would most consider using, 179 (35.8%) participants selected at-home UVB, 108 (21.6%) selected sunbathing, 92 (18.4%) selected in-office UVB, 62 (12.4%) selected home-tanning, 57 (11.4%) selected salon tanning, 1 (0.2%) selected other, and 1 participant provided no response (P<.001).
Reasons for Using Phototherapy—Of the 179 who selected at-home UVB, 125 (70%) cited convenience as a reason. Of the 108 who selected salon tanning as their top choice, 62 (57%) cited cost as a reason. Convenience (P<.001), cost (P<.001), and safety (P=.023) were related to top preference. Issues with insurance did not have a statistically significant relationship with the top preference. However, participant insurance type was related to top phototherapy preference (P=.021), with privately insured patients more likely to select in-office UVB, whereas those with Medicaid and Medicare were more likely to select home or salon tanning. Efficacy was not related to top preference. Furthermore, age, gender, education, income, and distance from nearest dermatologist were not related to top preference.
In-office UVB was perceived to be safest (P<.001) and most efficacious (P<.001). Meanwhile, at-home UVB was selected as most convenient (P<.001). Lastly, sunbathing was determined to be most cost-effective (P<.001)(Table 2). Cost-effectiveness had a relationship (P<.001) with the participant’s insurance, as those with private insurance were more likely to select at-home UVB, whereas those with Medicare or Medicaid were more likely to select the tanning options. Additionally, of the54 uninsured participants in the survey, 29 selected sunbathing as the most cost-effective option.

Comment
Phototherapy Treatment—UVB phototherapy at a wavelength of 290 to 320 nm (311–313 nm for narrowband UVB) is used to treat various dermatoses, including psoriasis and atopic dermatitis. UVB alters skin cytokines, induces apoptosis, promotes immunosuppression, causes DNA damage, and decreases the proliferation of dendritic cells and other cells of the innate immune system.1 In-office and at-home UV therapies make use of UVB wavelengths for treatment, while tanning and sunbathing contain not only UVB but also potentially harmful UVA rays. The wavelengths for indoor tanning devices include UVB at 280 to 315 nm and UVA at 315 to 400 nm, which are similar to those of the sun but with a different ratio of UVB to UVA and more intense total UV.2 When in-office and at-home UVB options are not available, various forms of tanning such as salon tanning and sunbathing may be alternatives that are widely used.3 One of the main reasons patients consider alternative phototherapy options is cost, as 1 in-office UVB treatment may cost $140, but a month of unlimited tanning may cost $30 or perhaps nothing if a patient has a gym membership with access to a tanning bed. Lack of insurance benefits covering phototherapy can exacerbate cost burden.4 However, tanning beds are associated with an increased risk for melanoma and nonmelanoma cancers.5,6 Additionally, all forms of phototherapy are associated with photoaging, but it is more intense with tanning and heliotherapy because of the presence of UVA, which penetrates deeper into the dermis.7 Meanwhile, for those who choose UVB therapy, deciding between an in-office and at-home UVB treatment could be a matter of convenience, as patients must consider long trips to the physician’s office; insurance status, as some insurances may not cover at-home UVB; or efficacy, which might be influenced by the presence of a physician or other medical staff. In many cases, patients may not be informed that at-home UVB is an option.
Patient Preferences—At-home UVB therapy was the most popular option in our study population, with most participants (52.6%) considering using it, and 35.9% choosing it as their top choice over all other phototherapy options. Safety, cost, and convenience were all found to be related to the option participants would most consider using. Prior analysis between at-home UVB and in-office UVB for the treatment of psoriasis determined that at-home UVB is as safe and cost-effective as in-office UVB without the inconvenience of the patient having to take time out of the week to visit the physician’s office,8,9 making at-home UVB an option dermatologists may strongly consider for patients who value safety, cost, and convenience. Oddly, efficacy was not related to the top preference, despite being the second highest–cited factor (53.2%) for which forms of phototherapy participants would consider using. For insurance coverage, those with Medicaid and Medicare selected the cheaper tanning options with higher-than-expected frequencies. Although problems with insurance were not related to the top preference, insurance status was related, suggesting that preferences are tied to cost. Of note, while the number of dermatologists that accept Medicare has increased in the last few years, there still remains an uneven distribution of phototherapy clinics. As of 2015, there were 19 million individuals who qualified for Medicare without a clinic within driving distance.10 This problem likely also exists for many Medicaid patients who may not qualify for at-home UVB. In this scenario, tanning or heliotherapy may be effective alternatives.
In-Office vs At-Home Options—Although in-office UVB was the option considered safest (26.2%) and most efficacious (26.8%), it was followed closely by at-home UVB in both categories (safest, 23.8%; most efficacious, 24.2%). Meanwhile, at-home UVB (40.2%) was chosen as the most convenient. Some patients consider tanning options over in-office UVB because of the inconvenience of traveling to an appointment.11 Therefore, at-home tanning may be a convenient alternative for these patients.
Considerations—Although our study was limited to an adult population, issues with convenience exist for the pediatric population as well, as children may need to miss multiple days of school each week to be treated in the office. For these pediatric patients, an at-home unit is preferable; however; issues with insurance coverage remain a challenge.12 Increasing insurance coverage of at-home units for the pediatric population therefore would be most prudent. However, when other options have been exhausted, including in-office UVB, tanning and sunbathing may be viable alternatives because of cost and convenience. In our study, sunbathing (33.2%) was considered the most cost-effective, likely because it does not require expensive equipment or a visit to a salon or physician’s office. Sunbathing has been effective in treating some dermatologic conditions, such as atopic dermatitis.13 However, it may only be effective during certain months and at different latitudes—conditions that make UVB sun rays more accessible—particularly when treating psoriasis.14 Furthermore, sunbathing may not be as cost-effective in patients with average-severity psoriasis compared with conventional psoriasis therapy because of the costs of travel to areas with sufficient UVB rays for treatment.15 Additionally, insurance status was related to which option was selected as the most cost-effective, as 29 (53.7%) of 54 uninsured participants chose sunbathing as the most cost-effective option, while only 92 (34.2%) of 269 privately insured patients selected sunbathing. Therefore, insurance status may be a factor for dermatologists to consider if a patient prefers a treatment that is cost-effective. Overall, dermatologists could perhaps consider guiding patients and optimizing their treatment plans based on the factors most important to the patients while understanding that costs and insurance status may ultimately determine the treatment option.
Limitations—Survey participants were recruited on Amazon Mechanical Turk, which could create sampling bias. Furthermore, these participants were representative of the general public and not exclusively patients on phototherapy, therefore representing the opinions of the general public and not those who may require phototherapy. Furthermore, given the nature of the survey, the study was limited to the adult population.
- Totonchy MB, Chiu MW. UV-based therapy. Dermatol Clin. 2014;32:399-413, ix-x.
- Nilsen LT, Hannevik M, Veierød MB. Ultraviolet exposure from indoor tanning devices: a systematic review. Br J Dermatol. 2016;174:730-740.
- Su J, Pearce DJ, Feldman SR. The role of commercial tanning beds and ultraviolet A light in the treatment of psoriasis. J Dermatolog Treat. 2005;16:324-326.
- Anderson KL, Huang KE, Huang WW, et al. Dermatology residents are prescribing tanning bed treatment. Dermatol Online J. 2016;22:13030/qt19h4k7sx.
- Wehner MR, Shive ML, Chren MM, et al. Indoor tanning and non-melanoma skin cancer: systematic review and meta-analysis. BMJ. 2012;345:e5909.
- Boniol M, Autier P, Boyle P, et al. Cutaneous melanomaattributable to sunbed use: systematic review and meta-analysis. BMJ. 2012;345:E4757.
- Barros NM, Sbroglio LL, Buffara MO, et al. Phototherapy. An Bras Dermatol. 2021;96:397-407.
- Koek MB, Buskens E, van Weelden H, et al. Home versus outpatient ultraviolet B phototherapy for mild to severe psoriasis: pragmatic multicentre randomized controlled non-inferiority trial (PLUTO study). BMJ. 2009;338:b1542.
- Koek MB, Sigurdsson V, van Weelden H, et al. Cost effectiveness of home ultraviolet B phototherapy for psoriasis: economic evaluation of a randomized controlled trial (PLUTO study). BMJ. 2010;340:c1490.
- Tan SY, Buzney E, Mostaghimi A. Trends in phototherapy utilization among Medicare beneficiaries in the United States, 2000 to 2015. J Am Acad Dermatol. 2018;79:672-679.
- Felton S, Adinoff B, Jeon-Slaughter H, et al. The significant health threat from tanning bed use as a self-treatment for psoriasis. J Am Acad Dermatol. 2016;74:1015-1017.
- Juarez MC, Grossberg AL. Phototherapy in the pediatric population. Dermatol Clin. 2020;38:91-108.
- Autio P, Komulainen P, Larni HM. Heliotherapy in atopic dermatitis: a prospective study on climatotherapy using the SCORAD index. Acta Derm Venereol. 2002;82:436-440.
- Krzys´cin JW, Jarosławski J, Rajewska-Wie˛ch B, et al. Effectiveness of heliotherapy for psoriasis clearance in low and mid-latitudinal regions: a theoretical approach. J Photochem Photobiol B. 2012;115:35-41.
- Snellman E, Maljanen T, Aromaa A, et al. Effect of heliotherapy on the cost of psoriasis. Br J Dermatol. 1998;138:288-292.
Phototherapy—particularly UVB phototherapy, which utilizes UVB rays of specific wavelengths within the UV spectrum—is indicated for a wide variety of dermatoses. In-office and at-home UVB treatments commonly are used, as are salon tanning and sunbathing. When selecting a form of phototherapy, patients are likely to consider safety, cost, effectiveness, insurance issues, and convenience. Research on patient preferences; the reasons for these preferences; and which options patients perceive to be the safest, most cost-effective, efficacious, and convenient is lacking. We aimed to assess the forms of phototherapy that patients would most consider using; the factors influencing patient preferences; and the forms patients perceived as the safest and most cost-effective, efficacious, and convenient.
Methods
Study Participants—We recruited 500 Amazon Mechanical Turk users who were 18 years or older to complete our REDCap-generated survey. The study was approved by the Wake Forest University institutional review board (Winston-Salem, North Carolina).
Evaluation—Participants were asked, “If you were diagnosed with a skin disease that benefited from UV therapy, which of the following forms of UV therapy would you consider choosing?” Participants were instructed to choose all of the forms they would consider using. Available options included in-office UV, at-home UV, home tanning, salon tanning, sunbathing, and other. Participants were asked to select which factors—from safety, cost, effectiveness, issues with insurance, convenience, and other—influenced their decision-making; which form of phototherapy they would most consider along with the factors that influenced their preference for this specific form of phototherapy; and which options they considered to be safest and most cost-effective, efficacious, and convenient. Participants were asked to provide basic sociodemographic information, level of education, income, insurance status (private, Medicare, Medicaid, Veterans Affairs, and uninsured), and distance from the nearest dermatologist.
Statistical Analysis—Descriptive and inferential statistics (χ2 test) were used to analyze the data with a significance set at P<.05.
Results
Five hundred participants completed the survey (Table 1).
Factors Influencing Patient Preferences—When asked to select all forms of phototherapy they would consider, 186 (37.2%) participants selected in-office UVB, 263 (52.6%) selected at-home UV, 141 (28.2%) selected home tanning, 117 (23.4%) selected salon tanning, 191 (38.2%) selected sunbathing, and 3 (0.6%) selected other. Participants who selected in-office UVB as an option were more likely to also select salon tanning (P<.012). No other relationship was found between the UVB options and the tanning options. When asked which factors influenced their phototherapy preferences, 295 (59%) selected convenience, 266 (53.2%) selected effectiveness, 220 (44%) selected safety, 218 (43.6%) selected cost, 72 (14.4%) selected issues with insurance, and 4 (0.8%) selected other. Forms of Phototherapy Patients Consider Using—When asked which form of phototherapy they would most consider using, 179 (35.8%) participants selected at-home UVB, 108 (21.6%) selected sunbathing, 92 (18.4%) selected in-office UVB, 62 (12.4%) selected home-tanning, 57 (11.4%) selected salon tanning, 1 (0.2%) selected other, and 1 participant provided no response (P<.001).
Reasons for Using Phototherapy—Of the 179 who selected at-home UVB, 125 (70%) cited convenience as a reason. Of the 108 who selected salon tanning as their top choice, 62 (57%) cited cost as a reason. Convenience (P<.001), cost (P<.001), and safety (P=.023) were related to top preference. Issues with insurance did not have a statistically significant relationship with the top preference. However, participant insurance type was related to top phototherapy preference (P=.021), with privately insured patients more likely to select in-office UVB, whereas those with Medicaid and Medicare were more likely to select home or salon tanning. Efficacy was not related to top preference. Furthermore, age, gender, education, income, and distance from nearest dermatologist were not related to top preference.
In-office UVB was perceived to be safest (P<.001) and most efficacious (P<.001). Meanwhile, at-home UVB was selected as most convenient (P<.001). Lastly, sunbathing was determined to be most cost-effective (P<.001)(Table 2). Cost-effectiveness had a relationship (P<.001) with the participant’s insurance, as those with private insurance were more likely to select at-home UVB, whereas those with Medicare or Medicaid were more likely to select the tanning options. Additionally, of the54 uninsured participants in the survey, 29 selected sunbathing as the most cost-effective option.
Comment
Phototherapy Treatment—UVB phototherapy at a wavelength of 290 to 320 nm (311–313 nm for narrowband UVB) is used to treat various dermatoses, including psoriasis and atopic dermatitis. UVB alters skin cytokines, induces apoptosis, promotes immunosuppression, causes DNA damage, and decreases the proliferation of dendritic cells and other cells of the innate immune system.1 In-office and at-home UV therapies make use of UVB wavelengths for treatment, while tanning and sunbathing contain not only UVB but also potentially harmful UVA rays. The wavelengths for indoor tanning devices include UVB at 280 to 315 nm and UVA at 315 to 400 nm, which are similar to those of the sun but with a different ratio of UVB to UVA and more intense total UV.2 When in-office and at-home UVB options are not available, various forms of tanning such as salon tanning and sunbathing may be alternatives that are widely used.3 One of the main reasons patients consider alternative phototherapy options is cost, as 1 in-office UVB treatment may cost $140, but a month of unlimited tanning may cost $30 or perhaps nothing if a patient has a gym membership with access to a tanning bed. Lack of insurance benefits covering phototherapy can exacerbate cost burden.4 However, tanning beds are associated with an increased risk for melanoma and nonmelanoma cancers.5,6 Additionally, all forms of phototherapy are associated with photoaging, but it is more intense with tanning and heliotherapy because of the presence of UVA, which penetrates deeper into the dermis.7 Meanwhile, for those who choose UVB therapy, deciding between an in-office and at-home UVB treatment could be a matter of convenience, as patients must consider long trips to the physician’s office; insurance status, as some insurances may not cover at-home UVB; or efficacy, which might be influenced by the presence of a physician or other medical staff. In many cases, patients may not be informed that at-home UVB is an option.
Patient Preferences—At-home UVB therapy was the most popular option in our study population, with most participants (52.6%) considering using it, and 35.9% choosing it as their top choice over all other phototherapy options. Safety, cost, and convenience were all found to be related to the option participants would most consider using. Prior analysis between at-home UVB and in-office UVB for the treatment of psoriasis determined that at-home UVB is as safe and cost-effective as in-office UVB without the inconvenience of the patient having to take time out of the week to visit the physician’s office,8,9 making at-home UVB an option dermatologists may strongly consider for patients who value safety, cost, and convenience. Oddly, efficacy was not related to the top preference, despite being the second highest–cited factor (53.2%) for which forms of phototherapy participants would consider using. For insurance coverage, those with Medicaid and Medicare selected the cheaper tanning options with higher-than-expected frequencies. Although problems with insurance were not related to the top preference, insurance status was related, suggesting that preferences are tied to cost. Of note, while the number of dermatologists that accept Medicare has increased in the last few years, there still remains an uneven distribution of phototherapy clinics. As of 2015, there were 19 million individuals who qualified for Medicare without a clinic within driving distance.10 This problem likely also exists for many Medicaid patients who may not qualify for at-home UVB. In this scenario, tanning or heliotherapy may be effective alternatives.
In-Office vs At-Home Options—Although in-office UVB was the option considered safest (26.2%) and most efficacious (26.8%), it was followed closely by at-home UVB in both categories (safest, 23.8%; most efficacious, 24.2%). Meanwhile, at-home UVB (40.2%) was chosen as the most convenient. Some patients consider tanning options over in-office UVB because of the inconvenience of traveling to an appointment.11 Therefore, at-home tanning may be a convenient alternative for these patients.
Considerations—Although our study was limited to an adult population, issues with convenience exist for the pediatric population as well, as children may need to miss multiple days of school each week to be treated in the office. For these pediatric patients, an at-home unit is preferable; however; issues with insurance coverage remain a challenge.12 Increasing insurance coverage of at-home units for the pediatric population therefore would be most prudent. However, when other options have been exhausted, including in-office UVB, tanning and sunbathing may be viable alternatives because of cost and convenience. In our study, sunbathing (33.2%) was considered the most cost-effective, likely because it does not require expensive equipment or a visit to a salon or physician’s office. Sunbathing has been effective in treating some dermatologic conditions, such as atopic dermatitis.13 However, it may only be effective during certain months and at different latitudes—conditions that make UVB sun rays more accessible—particularly when treating psoriasis.14 Furthermore, sunbathing may not be as cost-effective in patients with average-severity psoriasis compared with conventional psoriasis therapy because of the costs of travel to areas with sufficient UVB rays for treatment.15 Additionally, insurance status was related to which option was selected as the most cost-effective, as 29 (53.7%) of 54 uninsured participants chose sunbathing as the most cost-effective option, while only 92 (34.2%) of 269 privately insured patients selected sunbathing. Therefore, insurance status may be a factor for dermatologists to consider if a patient prefers a treatment that is cost-effective. Overall, dermatologists could perhaps consider guiding patients and optimizing their treatment plans based on the factors most important to the patients while understanding that costs and insurance status may ultimately determine the treatment option.
Limitations—Survey participants were recruited on Amazon Mechanical Turk, which could create sampling bias. Furthermore, these participants were representative of the general public and not exclusively patients on phototherapy, therefore representing the opinions of the general public and not those who may require phototherapy. Furthermore, given the nature of the survey, the study was limited to the adult population.
- Totonchy MB, Chiu MW. UV-based therapy. Dermatol Clin. 2014;32:399-413, ix-x.
- Nilsen LT, Hannevik M, Veierød MB. Ultraviolet exposure from indoor tanning devices: a systematic review. Br J Dermatol. 2016;174:730-740.
- Su J, Pearce DJ, Feldman SR. The role of commercial tanning beds and ultraviolet A light in the treatment of psoriasis. J Dermatolog Treat. 2005;16:324-326.
- Anderson KL, Huang KE, Huang WW, et al. Dermatology residents are prescribing tanning bed treatment. Dermatol Online J. 2016;22:13030/qt19h4k7sx.
- Wehner MR, Shive ML, Chren MM, et al. Indoor tanning and non-melanoma skin cancer: systematic review and meta-analysis. BMJ. 2012;345:e5909.
- Boniol M, Autier P, Boyle P, et al. Cutaneous melanomaattributable to sunbed use: systematic review and meta-analysis. BMJ. 2012;345:E4757.
- Barros NM, Sbroglio LL, Buffara MO, et al. Phototherapy. An Bras Dermatol. 2021;96:397-407.
- Koek MB, Buskens E, van Weelden H, et al. Home versus outpatient ultraviolet B phototherapy for mild to severe psoriasis: pragmatic multicentre randomized controlled non-inferiority trial (PLUTO study). BMJ. 2009;338:b1542.
- Koek MB, Sigurdsson V, van Weelden H, et al. Cost effectiveness of home ultraviolet B phototherapy for psoriasis: economic evaluation of a randomized controlled trial (PLUTO study). BMJ. 2010;340:c1490.
- Tan SY, Buzney E, Mostaghimi A. Trends in phototherapy utilization among Medicare beneficiaries in the United States, 2000 to 2015. J Am Acad Dermatol. 2018;79:672-679.
- Felton S, Adinoff B, Jeon-Slaughter H, et al. The significant health threat from tanning bed use as a self-treatment for psoriasis. J Am Acad Dermatol. 2016;74:1015-1017.
- Juarez MC, Grossberg AL. Phototherapy in the pediatric population. Dermatol Clin. 2020;38:91-108.
- Autio P, Komulainen P, Larni HM. Heliotherapy in atopic dermatitis: a prospective study on climatotherapy using the SCORAD index. Acta Derm Venereol. 2002;82:436-440.
- Krzys´cin JW, Jarosławski J, Rajewska-Wie˛ch B, et al. Effectiveness of heliotherapy for psoriasis clearance in low and mid-latitudinal regions: a theoretical approach. J Photochem Photobiol B. 2012;115:35-41.
- Snellman E, Maljanen T, Aromaa A, et al. Effect of heliotherapy on the cost of psoriasis. Br J Dermatol. 1998;138:288-292.
Practice Points
- Patients have different priorities when selecting phototherapy, including safety, costs, effectiveness, insurance issues, and convenience.
- By offering and educating patients on all forms of phototherapy, dermatologists may help guide patients to their optimal treatment plan according to patient priorities.
A Novel Text Message Protocol to Improve Bowel Preparation for Outpatient Colonoscopies in Veterans
Colorectal cancer is the third leading cause of cancer-related death in both men and women.1 Colonoscopy is the current gold standard for screening due to the ability to remove precancerous lesions but remains highly dependent on the quality of bowel preparation.2 Poor bowel preparation has been associated with impaired adenoma detection as well as increased health care utilization due to the need for a repeat colonoscopy.3
Multiple patient factors are associated with increased risk of poor bowel preparation, including age > 60 years, male sex, diabetes mellitus, and presence of a mental health diagnosis, factors that are prevalent among the veteran population.3-5 Text messages have been shown to improve the quality of bowel preparation by increasing patients' understanding and adherence with the preparation process. Improved adherence with bowel preparation directions is associated with a cleaner colon prior to colonoscopy, leading to a thorough examination. Studies using text messaging instructions prior to colonoscopies have also shown measurable improvement in adenoma detection rate, patient preparation-associated discomfort, and completion of colonoscopy.6-10
In 2016, the Veterans Health Administration (VHA) introduced Annie, one of the first automated text messaging services, named after Army Lieutenant Annie Fox, the first woman to receive the Purple Heart for combat. The Annie platform allows for notifications, instructions, and simple data collection. The development of this platform allows VHA practitioners to engage and educate veterans in a similar way to other health care systems using text messaging protocols. Annie text messages have been piloted for the use of hepatitis C treatment, demonstrating promise of improved medication adherence and patient satisfaction.11 We aimed to develop and pilot the Annie bowel preparation protocol to improve the quality of colonoscopy bowel preparation for outpatients at the Minneapolis Veterans Affairs Medical Center (MVAMC) in Minnesota. A secondary goal included measuring patient satisfaction with the text messaging instructions for outpatient colonoscopy preparation.
Methods
We conducted a single center, prospective, endoscopist-blinded, study with two 3-month long Plan-Do-Study-Act (PDSA) cycles to improve the text messaging bowel preparation protocol at MVAMC between January 2019 and April 2020. The MVAMC Institutional Review Board determined the quality improvement project was exempt. Veterans who had outpatient colonoscopies scheduled were included. Veterans undergoing inpatient colonoscopies or outpatients who could not be reached to obtain informed consent, lacked text message capability, declined participation, or required extended colonoscopy preparation were excluded. Per MVAMC procedures, extended colonoscopy preparation was provided to patients receiving general or monitored anesthesia care, with a history of poor bowel preparation, or with risk factors for poor preparation as determined by the ordering health care professional (HCP). Standard bowel preparation involves ingestion of 4 L of polyethylene glycol 3350 with electrolytes; extended bowel preparation requires ingestion of an additional 2 L to total 6 L and uses a different set of instructions. Additionally, the patient population requiring extended bowel preparation also includes patients with spinal cord injuries, who often are admitted for assistance with extended preparation. Patients who consented to receiving text messages were placed in the Annie intervention group, and all others were placed in the control group.
The control group received standardized patient education, including a mailed copy of bowel preparation instructions and a phone call from a gastroenterology service nurse about 1 to 2 weeks before the procedure. Current MVAMC standard of care involves a phone call from a nurse to confirm that patients have received the polyethylene glycol preparation solution, the mailed instructions, have an escort and transportation, and to answer any questions. Both the usual care and intervention group received the phone call. During this call, the Annie text messaging bowel preparation protocol was introduced; if the veteran chose to participate, consent and enrollment were completed. 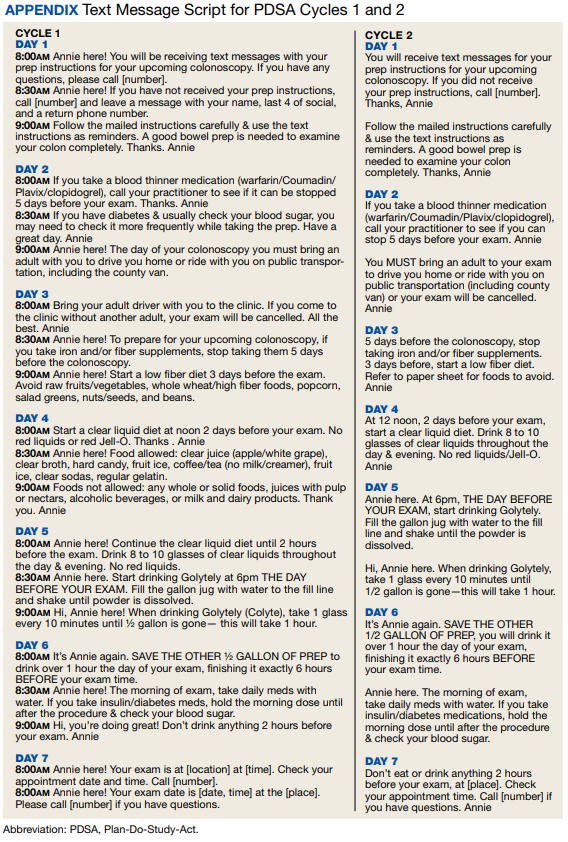
On the day of the colonoscopy, veterans in the intervention group were surveyed in the waiting room about their experience receiving the text messages and soliciting feedback for improvement or surveyed via telephone call within 3 days of their procedure. Patient satisfaction was quantified with a scale from 1 (low) to 10 (high), including questions about how helpful the texts were in relation to total number, timing, and content of messages as well as whether veterans would like to receive the text messages again for future procedures.
We reviewed individual charts and collected Boston Bowel Preparation Scale (BBPS) scores to determine adequate preparation. BBPS assigns a score of 0 to 3 for the right, transverse, and left colon applied upon withdrawal after flushing and suctioning have been completed.12 Adequate preparation is considered a total score of ≥ 6 with no segment scoring < 2. This method of preparation assessment is preferred due to its ability to account for difference in preparation quality among colonic segments, well-defined scoring characteristics, and several studies validating its use showing inter- and intraobserver reliability.12 Follow-up studies have shown validity of the BBPS when compared with relevant outcomes such as polyp detection rate and recommended timing for repeat procedure.13 Variables associated with poor bowel preparation (ie, gender, prior abdominal surgery, impaired mobility, high body mass index, diabetes mellitus, stroke, dementia, any neurologic diagnosis, cirrhosis, smoking, polypharmacy [> 8 active medications], and narcotic or tricyclic antidepressant medication use) were also collected through chart review.3-5 We note that immobility was defined by International Classification of Diseases (ICD)-9 and ICD-10 codes and prescriptions for assistive devices (ie, canes, wheelchairs, 4-wheeled walkers).
Veterans assent to be enrolled in Annie. After enrollment, veterans must text back a specific word response to an initial text message to receive the protocolized messages from the Annie program. A contact phone number to the gastrointestinal nurse line was provided for questions during business hours. The start date for the text message protocol is 6 days prior to the procedure date. If a patient rescheduled their colonoscopy, the Annie database was updated manually.
Statistical Analysis
We used both Pearson χ2 test and 2-sample t test analyses to compare demographic information and patient satisfaction scores between the control and intervention groups. We compared continuous BBPS scores between Annie intervention vs control group using parametric and nonparametric independent t tests using the Mann-Whitney U test. We repeated this analysis controlling for both mental health diagnoses and age using linear regression. We were unable to survey 61 of the 187 veterans who received Annie text messages.
RESULTS
During PDSA cycles 1 and 2, 640 veterans were scheduled for outpatient colonoscopy: 453 veterans were in the control group; 187 veterans were in the intervention group, of which 126 were surveyed. A significant percentage of veterans declined participation because they felt like they did not need reinforced education; others were not eligible for Annie due to requirement for extended bowel preparation, cancelled colonoscopy, inability to physically read text messages, or lack of cell phone.
The mean (SD) age was 65 (8) years; 184 (28.8%) had a diabetes mellitus diagnosis, and the mean (SD) body mass index was 31.6 (6.4). The Annie group was slightly more likely to have mental health diagnoses and lower age compared with the control group (Table 1).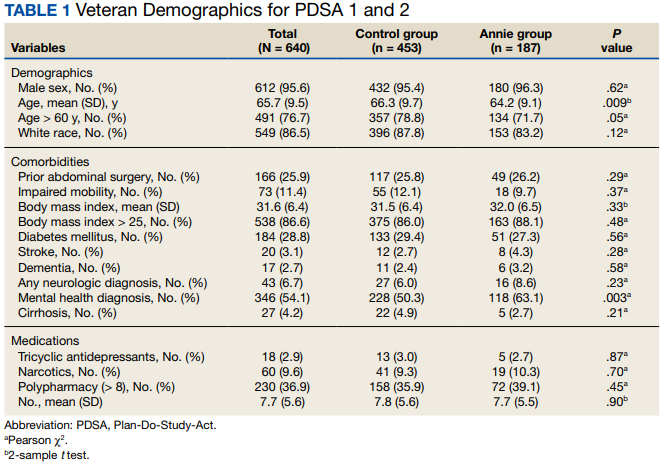
Patient Feedback
We collected feedback from veterans after each PDSA cycle to identify areas for improvement by both in-person and telephone surveys. Based on feedback from PDSA cycle 1, we decreased the total number of text messages to create a more succinct set of instructions. The most frequently requested change involved timing the text messages to align with the exact morning a specific instruction should take place.
Patient satisfaction with the Annie text messaging service was high. 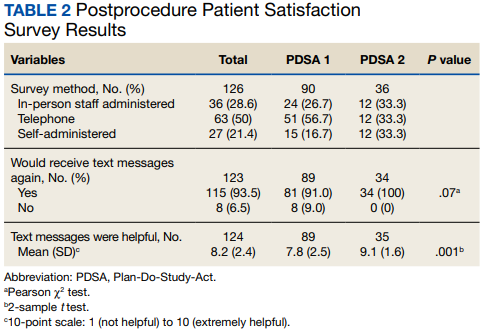
DISCUSSION
To our knowledge, this is the first report of using Annie at a VAMC for colonoscopy bowel preparation improvement. We found a statistically significant improvement in the average BBPS in those receiving Annie text messages compared with the routine care control group. We also found high levels of patient satisfaction with most patients requesting to receive them again for future procedures.
The clinical significance of a BBPS of 7.8 vs 8.2 is unclear, although any score > 6 is considered to be adequate. However, subjectively speaking, the higher the BBPS the cleaner the colon, and theoretically the easier it is to see small or flat polyps. Future steps could include calculating adenoma detection rates for those enrolled in the Annie program vs the control group.
We have received inquiries regarding potential program implementation at other facilities. Success and sustainability of the program will require long-term commitment and ideally protected time for staff. It is helpful to remember that for each person who chooses to enroll in the intervention, the program currently requires that a brief consent note is placed in the patient’s chart. Thus, depending on the facilities’ resources, it is ideal for one staff member to be the designated lead to help oversee, troubleshoot, and train additional personnel. Surveys can be intermittently used to obtain feedback for improvement but are not required for sustainability. Automated text messaging is a promising addition to medicine for clinical education and communication. Future studies should examine the clinical significance (ie, adenoma detection rates) of text messaging bowel preparation protocols.
Limitations
Our study has several limitations. First, this was a single center study, thus generalizability is limited. MVAMC represents a predominantly White, male, and rural population. Second, data are likely an underestimation of the true impact of intervention, because results do not account for patients who were turned away on day of procedure (typically still reporting brown stools at time of check-in for procedure) due to poor preparation or aborted procedures secondary to poor preparation. Only about one-third of the 640 veterans opted to receive Annie text messages.
Studies have shown veterans are willing to use technology for health care; however, access to technology and lack of training remain barriers to use.14 This has been most robustly studied at the VA in veterans experiencing mental illness and homelessness. Targeted strategies to improve veteran adoption of technology within their health care include supplying veterans with cell phones and paid data plans and providing training on specific technology-based resources.15-17 Future improvement for the Annie platform should include improved integration with CPRS. Integration will facilitate automatic import of key information such as mobile phone number or colonoscopy procedure date. Unfortunately, this is not currently an automated process, and the manual workload of staff limits sustainability. Since our study ended, the Annie database now allows an “event date” to be programmed in to center the text message series around. This will be entered at the time of Annie enrollment and eliminate manual activation of the protocol. The issue of updating information for rescheduled procedures remains.
Conclusions
There is increasing evidence that automated text messaging is a promising addition to medicine for clinical education and communication. It continues to gain traction as a readily available and acceptable option, and many patients are willing to incorporate the technology platform into their care plan. We found high patient satisfaction with our protocol, and Annie patients had cleaner bowel preparations compared with control patients. Our study supports the use of text message reminders as an effective intervention for improving patient adherence with bowel preparation instructions. We suspect that creation of a text messaging protocol designed for patients requiring outpatient extended bowel preparation will yield great benefit. As technology continues to improve, future implementation of Annie text messaging will become increasingly seamless within the field of gastroenterology and beyond.
1. Centers for Disease Control and Prevention. Colorectal cancer statistics. Updated June 6, 2022. Accessed September 8, 2022. https://www.cdc.gov/cancer/colorectal/statistics
2. Lieberman D, Ladabaum U, Cruz-Correa M, et al. Screening for colorectal cancer and evolving issues for physicians and patients: a review. JAMA. 2016;316(20):2135-2145. doi:10.1001/jama.2016.17418
3. Nguyen DL, Wieland M. Risk factors predictive of poor quality preparation during average risk colonoscopy screening: the importance of health literacy. J Gastrointestin Liver Dis. 2010;19(4):369-372.
4. Mahmood S, Farooqui SM, Madhoun MF. Predictors of inadequate bowel preparation for colonoscopy: a systematic review and meta-analysis. Eur J Gastroenterol Hepatol. 2018;30(8):819-826. doi:10.1097/MEG.0000000000001175
5. Harrington KM, Nguyen XT, Song RJ, et al. Gender differences in demographic and health characteristics of the Million Veteran Program cohort. Womens Health Issues. 2019;29(suppl 1):S56-S66. doi:10.1016/j.whi.2019.04.012
6. Zhang QX, Li J, Zhang Q, et al. Effect of education by messaging software on the quality of bowel preparation for colonoscopy. Chin Med J (Engl). 2018;131(14):1750-1752. doi:10.4103/0366-6999.235881
7. Walter B, Klare P, Strehle K, et al. Improving the quality and acceptance of colonoscopy preparation by reinforced patient education with short message service: results from a randomized, multicenter study (PERICLES-II). Gastrointest Endosc. 2019;89(3):506-513.e4. doi:10.1016/j.gie.2018.08.014
8. Nadim MM, Doshi S, Coniglio M, et al. Automated text message navigation to improve preparation quality and show rate for colonoscopy. Am J Gastroenterol. 2018;113:S64-S66.
9. Walter B, Frank R, Ludwig L, et al. Smartphone application to reinforce education increases high-quality preparation for colorectal cancer screening colonoscopies in a randomized trial. Clin Gastroenterol Hepatol. 2021;19(2):331-338.e5. doi:10.1016/j.cgh.2020.03.051
10. Guo B, Zuo X, Li Z, et al. Improving the quality of bowel preparation through an app for inpatients undergoing colonoscopy: a randomized controlled trial. J Adv Nurs. 2020;76(4):1037-1045. doi:10.1111/jan.14295
11. Yakovchenko V, Hogan TP, Houston TK, et al. Automated text messaging with patients in department of veterans affairs specialty clinics: cluster randomized trial. J Med Internet Res. 2019;21(8):e14750. doi:10.2196/14750
12. Lai EJ, Calderwood AH, Doros G, Fix OK, Jacobson BC. The Boston bowel preparation scale: a valid and reliable instrument for colonoscopy-oriented research. Gastrointest Endosc. 2009;69(3 Pt 2):620-625. doi:10.1016/j.gie.2008.05.057
13. Calderwood AH, Jacobson BC. Comprehensive validation of the Boston Bowel Preparation Scale. Gastrointest Endosc. 2010;72(4):686-692. doi:10.1016/j.gie.2010.06.068
14. Duan-Porter W, Van Houtven CH, Mahanna EP, et al. Internet use and technology-related attitudes of veterans and informal caregivers of veterans. Telemed J E Health. 2018;24(7):471-480. doi:10.1089/tmj.2017.0015
15. Boston University School of Public Health. how mobile technology can increase veteran healthcare and wellbeing. November 10, 2021. Accessed November 1, 2022. https://www.ideahub.org/research-data/how-mobile-technology-increases-veteran-healthcare-and-wellbeing/
16. Klee A, Stacy M, Rosenheck R, Harkness L, Tsai J. Interest in technology-based therapies hampered by access: A survey of veterans with serious mental illnesses. Psychiatr Rehabil J. 2016;39(2):173-179. doi:10.1037/prj0000180
17. Berrouiguet S, Baca-García E, Brandt S, Walter M, Courtet P. Fundamentals for future mobile-health (mHealth): a systematic review of mobile phone and web-based text messaging in mental health. J Med Internet Res. 2016;18(6):e135. Published 2016 Jun 10. doi:10.2196/jmir.5066
Colorectal cancer is the third leading cause of cancer-related death in both men and women.1 Colonoscopy is the current gold standard for screening due to the ability to remove precancerous lesions but remains highly dependent on the quality of bowel preparation.2 Poor bowel preparation has been associated with impaired adenoma detection as well as increased health care utilization due to the need for a repeat colonoscopy.3
Multiple patient factors are associated with increased risk of poor bowel preparation, including age > 60 years, male sex, diabetes mellitus, and presence of a mental health diagnosis, factors that are prevalent among the veteran population.3-5 Text messages have been shown to improve the quality of bowel preparation by increasing patients' understanding and adherence with the preparation process. Improved adherence with bowel preparation directions is associated with a cleaner colon prior to colonoscopy, leading to a thorough examination. Studies using text messaging instructions prior to colonoscopies have also shown measurable improvement in adenoma detection rate, patient preparation-associated discomfort, and completion of colonoscopy.6-10
In 2016, the Veterans Health Administration (VHA) introduced Annie, one of the first automated text messaging services, named after Army Lieutenant Annie Fox, the first woman to receive the Purple Heart for combat. The Annie platform allows for notifications, instructions, and simple data collection. The development of this platform allows VHA practitioners to engage and educate veterans in a similar way to other health care systems using text messaging protocols. Annie text messages have been piloted for the use of hepatitis C treatment, demonstrating promise of improved medication adherence and patient satisfaction.11 We aimed to develop and pilot the Annie bowel preparation protocol to improve the quality of colonoscopy bowel preparation for outpatients at the Minneapolis Veterans Affairs Medical Center (MVAMC) in Minnesota. A secondary goal included measuring patient satisfaction with the text messaging instructions for outpatient colonoscopy preparation.
Methods
We conducted a single center, prospective, endoscopist-blinded, study with two 3-month long Plan-Do-Study-Act (PDSA) cycles to improve the text messaging bowel preparation protocol at MVAMC between January 2019 and April 2020. The MVAMC Institutional Review Board determined the quality improvement project was exempt. Veterans who had outpatient colonoscopies scheduled were included. Veterans undergoing inpatient colonoscopies or outpatients who could not be reached to obtain informed consent, lacked text message capability, declined participation, or required extended colonoscopy preparation were excluded. Per MVAMC procedures, extended colonoscopy preparation was provided to patients receiving general or monitored anesthesia care, with a history of poor bowel preparation, or with risk factors for poor preparation as determined by the ordering health care professional (HCP). Standard bowel preparation involves ingestion of 4 L of polyethylene glycol 3350 with electrolytes; extended bowel preparation requires ingestion of an additional 2 L to total 6 L and uses a different set of instructions. Additionally, the patient population requiring extended bowel preparation also includes patients with spinal cord injuries, who often are admitted for assistance with extended preparation. Patients who consented to receiving text messages were placed in the Annie intervention group, and all others were placed in the control group.
The control group received standardized patient education, including a mailed copy of bowel preparation instructions and a phone call from a gastroenterology service nurse about 1 to 2 weeks before the procedure. Current MVAMC standard of care involves a phone call from a nurse to confirm that patients have received the polyethylene glycol preparation solution, the mailed instructions, have an escort and transportation, and to answer any questions. Both the usual care and intervention group received the phone call. During this call, the Annie text messaging bowel preparation protocol was introduced; if the veteran chose to participate, consent and enrollment were completed.
On the day of the colonoscopy, veterans in the intervention group were surveyed in the waiting room about their experience receiving the text messages and soliciting feedback for improvement or surveyed via telephone call within 3 days of their procedure. Patient satisfaction was quantified with a scale from 1 (low) to 10 (high), including questions about how helpful the texts were in relation to total number, timing, and content of messages as well as whether veterans would like to receive the text messages again for future procedures.
We reviewed individual charts and collected Boston Bowel Preparation Scale (BBPS) scores to determine adequate preparation. BBPS assigns a score of 0 to 3 for the right, transverse, and left colon applied upon withdrawal after flushing and suctioning have been completed.12 Adequate preparation is considered a total score of ≥ 6 with no segment scoring < 2. This method of preparation assessment is preferred due to its ability to account for difference in preparation quality among colonic segments, well-defined scoring characteristics, and several studies validating its use showing inter- and intraobserver reliability.12 Follow-up studies have shown validity of the BBPS when compared with relevant outcomes such as polyp detection rate and recommended timing for repeat procedure.13 Variables associated with poor bowel preparation (ie, gender, prior abdominal surgery, impaired mobility, high body mass index, diabetes mellitus, stroke, dementia, any neurologic diagnosis, cirrhosis, smoking, polypharmacy [> 8 active medications], and narcotic or tricyclic antidepressant medication use) were also collected through chart review.3-5 We note that immobility was defined by International Classification of Diseases (ICD)-9 and ICD-10 codes and prescriptions for assistive devices (ie, canes, wheelchairs, 4-wheeled walkers).
Veterans assent to be enrolled in Annie. After enrollment, veterans must text back a specific word response to an initial text message to receive the protocolized messages from the Annie program. A contact phone number to the gastrointestinal nurse line was provided for questions during business hours. The start date for the text message protocol is 6 days prior to the procedure date. If a patient rescheduled their colonoscopy, the Annie database was updated manually.
Statistical Analysis
We used both Pearson χ2 test and 2-sample t test analyses to compare demographic information and patient satisfaction scores between the control and intervention groups. We compared continuous BBPS scores between Annie intervention vs control group using parametric and nonparametric independent t tests using the Mann-Whitney U test. We repeated this analysis controlling for both mental health diagnoses and age using linear regression. We were unable to survey 61 of the 187 veterans who received Annie text messages.
RESULTS
During PDSA cycles 1 and 2, 640 veterans were scheduled for outpatient colonoscopy: 453 veterans were in the control group; 187 veterans were in the intervention group, of which 126 were surveyed. A significant percentage of veterans declined participation because they felt like they did not need reinforced education; others were not eligible for Annie due to requirement for extended bowel preparation, cancelled colonoscopy, inability to physically read text messages, or lack of cell phone.
The mean (SD) age was 65 (8) years; 184 (28.8%) had a diabetes mellitus diagnosis, and the mean (SD) body mass index was 31.6 (6.4). The Annie group was slightly more likely to have mental health diagnoses and lower age compared with the control group (Table 1).
Patient Feedback
We collected feedback from veterans after each PDSA cycle to identify areas for improvement by both in-person and telephone surveys. Based on feedback from PDSA cycle 1, we decreased the total number of text messages to create a more succinct set of instructions. The most frequently requested change involved timing the text messages to align with the exact morning a specific instruction should take place.
Patient satisfaction with the Annie text messaging service was high.
DISCUSSION
To our knowledge, this is the first report of using Annie at a VAMC for colonoscopy bowel preparation improvement. We found a statistically significant improvement in the average BBPS in those receiving Annie text messages compared with the routine care control group. We also found high levels of patient satisfaction with most patients requesting to receive them again for future procedures.
The clinical significance of a BBPS of 7.8 vs 8.2 is unclear, although any score > 6 is considered to be adequate. However, subjectively speaking, the higher the BBPS the cleaner the colon, and theoretically the easier it is to see small or flat polyps. Future steps could include calculating adenoma detection rates for those enrolled in the Annie program vs the control group.
We have received inquiries regarding potential program implementation at other facilities. Success and sustainability of the program will require long-term commitment and ideally protected time for staff. It is helpful to remember that for each person who chooses to enroll in the intervention, the program currently requires that a brief consent note is placed in the patient’s chart. Thus, depending on the facilities’ resources, it is ideal for one staff member to be the designated lead to help oversee, troubleshoot, and train additional personnel. Surveys can be intermittently used to obtain feedback for improvement but are not required for sustainability. Automated text messaging is a promising addition to medicine for clinical education and communication. Future studies should examine the clinical significance (ie, adenoma detection rates) of text messaging bowel preparation protocols.
Limitations
Our study has several limitations. First, this was a single center study, thus generalizability is limited. MVAMC represents a predominantly White, male, and rural population. Second, data are likely an underestimation of the true impact of intervention, because results do not account for patients who were turned away on day of procedure (typically still reporting brown stools at time of check-in for procedure) due to poor preparation or aborted procedures secondary to poor preparation. Only about one-third of the 640 veterans opted to receive Annie text messages.
Studies have shown veterans are willing to use technology for health care; however, access to technology and lack of training remain barriers to use.14 This has been most robustly studied at the VA in veterans experiencing mental illness and homelessness. Targeted strategies to improve veteran adoption of technology within their health care include supplying veterans with cell phones and paid data plans and providing training on specific technology-based resources.15-17 Future improvement for the Annie platform should include improved integration with CPRS. Integration will facilitate automatic import of key information such as mobile phone number or colonoscopy procedure date. Unfortunately, this is not currently an automated process, and the manual workload of staff limits sustainability. Since our study ended, the Annie database now allows an “event date” to be programmed in to center the text message series around. This will be entered at the time of Annie enrollment and eliminate manual activation of the protocol. The issue of updating information for rescheduled procedures remains.
Conclusions
There is increasing evidence that automated text messaging is a promising addition to medicine for clinical education and communication. It continues to gain traction as a readily available and acceptable option, and many patients are willing to incorporate the technology platform into their care plan. We found high patient satisfaction with our protocol, and Annie patients had cleaner bowel preparations compared with control patients. Our study supports the use of text message reminders as an effective intervention for improving patient adherence with bowel preparation instructions. We suspect that creation of a text messaging protocol designed for patients requiring outpatient extended bowel preparation will yield great benefit. As technology continues to improve, future implementation of Annie text messaging will become increasingly seamless within the field of gastroenterology and beyond.
1. Centers for Disease Control and Prevention. Colorectal cancer statistics. Updated June 6, 2022. Accessed September 8, 2022. https://www.cdc.gov/cancer/colorectal/statistics
2. Lieberman D, Ladabaum U, Cruz-Correa M, et al. Screening for colorectal cancer and evolving issues for physicians and patients: a review. JAMA. 2016;316(20):2135-2145. doi:10.1001/jama.2016.17418
3. Nguyen DL, Wieland M. Risk factors predictive of poor quality preparation during average risk colonoscopy screening: the importance of health literacy. J Gastrointestin Liver Dis. 2010;19(4):369-372.
4. Mahmood S, Farooqui SM, Madhoun MF. Predictors of inadequate bowel preparation for colonoscopy: a systematic review and meta-analysis. Eur J Gastroenterol Hepatol. 2018;30(8):819-826. doi:10.1097/MEG.0000000000001175
5. Harrington KM, Nguyen XT, Song RJ, et al. Gender differences in demographic and health characteristics of the Million Veteran Program cohort. Womens Health Issues. 2019;29(suppl 1):S56-S66. doi:10.1016/j.whi.2019.04.012
6. Zhang QX, Li J, Zhang Q, et al. Effect of education by messaging software on the quality of bowel preparation for colonoscopy. Chin Med J (Engl). 2018;131(14):1750-1752. doi:10.4103/0366-6999.235881
7. Walter B, Klare P, Strehle K, et al. Improving the quality and acceptance of colonoscopy preparation by reinforced patient education with short message service: results from a randomized, multicenter study (PERICLES-II). Gastrointest Endosc. 2019;89(3):506-513.e4. doi:10.1016/j.gie.2018.08.014
8. Nadim MM, Doshi S, Coniglio M, et al. Automated text message navigation to improve preparation quality and show rate for colonoscopy. Am J Gastroenterol. 2018;113:S64-S66.
9. Walter B, Frank R, Ludwig L, et al. Smartphone application to reinforce education increases high-quality preparation for colorectal cancer screening colonoscopies in a randomized trial. Clin Gastroenterol Hepatol. 2021;19(2):331-338.e5. doi:10.1016/j.cgh.2020.03.051
10. Guo B, Zuo X, Li Z, et al. Improving the quality of bowel preparation through an app for inpatients undergoing colonoscopy: a randomized controlled trial. J Adv Nurs. 2020;76(4):1037-1045. doi:10.1111/jan.14295
11. Yakovchenko V, Hogan TP, Houston TK, et al. Automated text messaging with patients in department of veterans affairs specialty clinics: cluster randomized trial. J Med Internet Res. 2019;21(8):e14750. doi:10.2196/14750
12. Lai EJ, Calderwood AH, Doros G, Fix OK, Jacobson BC. The Boston bowel preparation scale: a valid and reliable instrument for colonoscopy-oriented research. Gastrointest Endosc. 2009;69(3 Pt 2):620-625. doi:10.1016/j.gie.2008.05.057
13. Calderwood AH, Jacobson BC. Comprehensive validation of the Boston Bowel Preparation Scale. Gastrointest Endosc. 2010;72(4):686-692. doi:10.1016/j.gie.2010.06.068
14. Duan-Porter W, Van Houtven CH, Mahanna EP, et al. Internet use and technology-related attitudes of veterans and informal caregivers of veterans. Telemed J E Health. 2018;24(7):471-480. doi:10.1089/tmj.2017.0015
15. Boston University School of Public Health. how mobile technology can increase veteran healthcare and wellbeing. November 10, 2021. Accessed November 1, 2022. https://www.ideahub.org/research-data/how-mobile-technology-increases-veteran-healthcare-and-wellbeing/
16. Klee A, Stacy M, Rosenheck R, Harkness L, Tsai J. Interest in technology-based therapies hampered by access: A survey of veterans with serious mental illnesses. Psychiatr Rehabil J. 2016;39(2):173-179. doi:10.1037/prj0000180
17. Berrouiguet S, Baca-García E, Brandt S, Walter M, Courtet P. Fundamentals for future mobile-health (mHealth): a systematic review of mobile phone and web-based text messaging in mental health. J Med Internet Res. 2016;18(6):e135. Published 2016 Jun 10. doi:10.2196/jmir.5066
Contralateral Constrictor Dose Predicts Swallowing Function After Radiation for Head and Neck Cancer
Radiation therapy can cause long-term dysphagia that seriously affects quality of life for survivors of head and neck (H&N) cancer.1-3 Numerous studies have linked pharyngeal constrictor dose to long-term dysphagia, but conclusions about the dose distribution that can be safely tolerated have been inconsistent. For example, a group from the Netherlands found that the mean dose to the superior pharyngeal constrictor muscle and the supraglottic larynx were each predictive of dysphagia.4 A subsequent Vanderbilt study refuted these findings, reporting that these structures were not predictive but that dose to the inferior pharyngeal constrictor muscle was.5 Other studies have connected late dysphagia with dose to the middle pharyngeal constrictor muscle, total larynx, oral cavity, contralateral submandibular gland, contralateral parotid gland, or a combination of these structures.6-14 NRG Oncology trials commonly evaluate dose to the “uninvolved pharynx,” which is the total pharyngeal constrictor muscle volume minus the planning target volume for the lowest dose target volume. NRG H&N trials 3, 4, 5, 6, 8, and 9 all use uninvolved pharynx mean dose ≤ 45 Gy as a constraint to judge radiation plan quality.
Differences in methodology or patient population may explain the inconsistency of prior studies on dosimetric predictors of dysphagia, but it is possible that these studies did not evaluate the optimal metric for dysphagia. This study evaluates a novel organ at risk, the contralateral pharyngeal constrictor muscle, to determine whether dose to this structure is predictive of late swallowing function. The study also compares a constraint based on this structure to the NRG uninvolved pharynx constraint mentioned earlier.
Methods
This study is a retrospective review of patients treated at the Richard L. Roudebush Veterans Affairs (VA) Medical Center in Indianapolis, Indiana. Patients were identified by searching the VA Cancer Registry for patients treated for H&N squamous cell carcinoma between September 1, 2016, and August 30, 2019. Eligible sites included cancers of the nasopharynx, oropharynx, hypopharynx, larynx and oral cavity, as well as H&N cancer of an unknown primary site. Only patients treated with primary radiation with concurrent systemic therapy were included. Patients were excluded if they had prior surgery or radiation to the H&N.
The pharyngeal constrictor muscles were contoured per the techniques described by Bhide and colleagues.11 The contralateral constrictor was defined as the half of the constrictor volume contralateral to the primary site. For midline tumors, the side of the neck with a lower volume of lymph node metastases was judged to be the contralateral side. 
One-year dysphagia was defined as having a gastronomy tube (G-tube) in place or an abnormal modified barium swallow (MBS) ≥ 12 months after the completion of radiation. At the study institution, MBS is not routinely done after therapy but is ordered if a patient or clinician has concerns about swallowing function. MBS was considered abnormal if there was laryngeal penetration that reached the level of the glottis or was not ejected from the larynx.
Results
The VA Cancer Registry identified 113 patients treated for H&N cancer during the study period. Of these, 55 patients met the inclusion criteria. No patients were lost to follow-up. The median follow-up was 29 months. The median age was 67 years (range, 41-83) (Table 1). 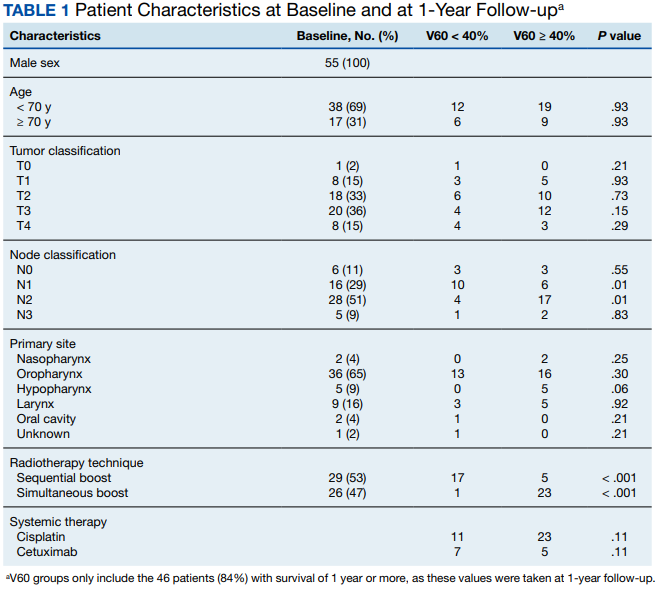
All patients were treated with intensity-modulated radiotherapy (IMRT). Patients treated with a sequential boost had an initial dose of 54 Gy and/or 50 Gy, followed by a boost to a total of 70 Gy at 2 Gy per fraction. Patients treated with a simultaneous integrated boost (SIB) technique received 69.96 Gy in 33 fractions, with elective volumes treated to 54.45 Gy in 33 fractions. Both patients with nasopharyngeal cancer were treated with SIB plans and had an intermediate dose volume of 59.4 Gy.
Systemic therapy was weekly cisplatin in 41 patients (75%) and cetuximab in 14 (25%). Twenty percent of patients receiving cisplatin switched to an alternative agent during treatment, most commonly carboplatin.
Forty-nine patients (89%) had a G-tube placed before starting radiation. G-tubes were in place for an interval of 0 to 47 months (mean, 8.6); 12 (22%) had a G-tube > 12 months. After completion of radiation, 18 patients (33%) had an abnormal MBS. These were done 1 to 50 months (mean, 14.8) after completion of radiation. Abnormal MBS occurred ≥ 12 months after radiation in 9 patients, 5 of whom had their G-tube in place for less than a year.
Forty-six patients (84%) survived more than 1 year and could be evaluated for late swallowing function. One-year dysphagia was seen in 17 (37%) of these patients. Recurrence was seen in 20 patients (36%), with locoregional recurrence in 12 (60%) of these cases. Recurrence occurred at a range of 0 to 15 months (mean, 5.6). Neither recurrence (P = .69) nor locoregional recurrence (P = .11) was associated with increased 1-year dysphagia.
In patients who could be evaluated for long-term swallowing function, contralateral constrictor V60 ranged from 0% to 100% (median, 51%). V60 was < 40% in 18 patients (39%). With V60 < 40%, there was a 6% rate of 1-year dysphagia compared with 57% for V60 ≥ 40% (P < .001).
Patients with contralateral constrictor V60 < 40 and V60 ≥ 40 both had a mean age of 65 years. χ2 analysis did not show a difference in T stage or systemic treatment but did show that patients with V60 < 40% were more likely to have N1 disease (P = .01), and less likely to have N2 disease (P = .01) compared with patients with V60 ≥ 40%. The difference in 1-year dysphagia between N0 to N1 patients (27%) and N2 to N3 patients (46%) was not statistically significant (P = .19).
In patients who could be evaluated for long-term swallowing function, the uninvolved pharynx volume median of the total constrictor volume was 32% (range, < 1%-62%). The uninvolved pharynx mean dose ranged from 28 to 68 Gy (median, 45). When the uninvolved pharynx mean dose was < 45 Gy, 1-year dysphagia was 22% compared with 52% with a dose ≥ 45 Gy (P = .03).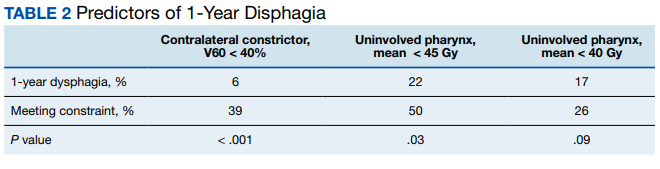
Air cavity editing was performed in 27 patients (49%). One-year survival was 93% with air cavity editing, and 75% without, which was not statistically significant. Locoregional recurrence occurred in 3 patients (11%) with air cavity editing, and 9 (32%) without, which was not statistically significant. In patients surviving at least 1 year, contralateral constrictor V60 averaged 33% with editing and 62% without editing (P < .001). One-year dysphagia was 12% with air cavity editing and 67% without editing (P < .001).
An SIB technique was done in 26 patients (47%). One-year survival was 85% (n = 22) with SIB and 83% (n = 24) with sequential boost, which was not statistically significant. Locoregional recurrence occurred in 19% with SIB, and 32% with sequential boost, which was not statistically significant. For SIB patients alive at 1 year, the median contralateral V60 was 28%, compared with 66% for patients treated with sequential technique. Seventeen patients (77%) with SIB had V60 < 40%. Nineteen (86%) of SIB plans also had air cavity editing. One patient (5%) with SIB had dysphagia at 1 year, compared with 16 (67%) sequential patients (P < .001).
Discussion
This is the first study to link contralateral constrictor dose to long-term dysphagia in patients treated with radiation for H&N cancer. Editing the boost volume off air cavities was associated with lower contralateral constrictor V60 and with less long-term dysphagia. This may indicate that optimizing plans to meet a contralateral constrictor constraint can reduce rates of long-term dysphagia.
The most useful clinical predictors are those that identify a patient at low risk for toxicity. These constraints are useful because they reassure physicians that treatments will have a favorable risk/benefit ratio while identifying plans that may need modification before starting treatment.
The contralateral constrictor outperformed the uninvolved pharynx in identifying patients at low risk for long-term dysphagia. This difference could not be overcome by decreasing the threshold of the pharynx constraint, as 17% of patients with dysphagia had a mean dose of < 40 Gy to the uninvolved pharynx, which was not statistically significant.
An advantage of contralateral constrictor is that it is independent of planning target volume (PTV) size. The uninvolved pharynx structure depends on the PTV contour, so it may obscure a connection between PTV size and dysphagia.
In the context of a clinical trial, only measuring dose to the uninvolved pharynx may allow more plans to meet constraints, but even in NRG trials, physicians have some control over target volumes. For example, NRG HN009, a national trial for patients with H&N cancer, recommends editing the CTV_7000 (clinical target volume treated to 70 Gy) off air cavities but does not define how much the volume should be cropped or specify protocol violations if the volume is not cropped.15 Furthermore, constraints used in clinical trials are often adopted for use outside the trial, where physicians have extensive control over target volumes.
The broad range of uninvolved pharynx volume relative to total constrictor volume confounds predictions using this variable. For example, according to the NRG constraint, a patient with an uninvolved pharynx mean dose of 44 Gy will have a low risk of dysphagia even if this structure is only 1% of the total constrictor. The contralateral constrictor is always about 50% of the total constrictor volume, which means that predictions using this structure will not be confounded by the same variation in volume size.
Figure 2 shows a representative patient who met the NRG uninvolved pharynx constraint but developed long-term dysphagia. 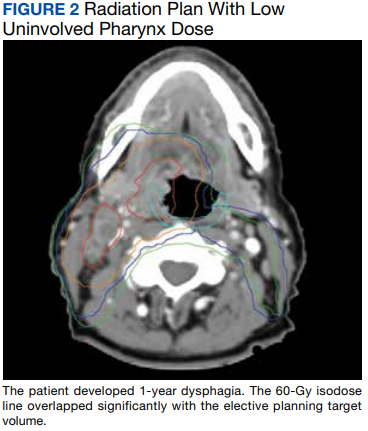
Pharyngoesophageal stricture is a common cause of dysphagia after IMRT for H&N cancer.16 Radiation has been shown to decrease pharyngeal function in patients with H&N cancer.17 Sparing one side of the pharynx may allow for better pharyngeal compliance throughout the length of the pharynx, possibly decreasing the rate of pharyngoesophageal stricture. Additionally, constraining the contralateral constrictor may preserve strength on this side, allowing it to compensate for weakness on the side of the primary cancer. An exercise sometimes used for dysphagia involves head rotation toward the affected side during swallowing. This technique has been shown to cause food to move to the unaffected side.18 Sparing the contralateral constrictor may help such techniques work better in patients with H&N cancer.
Few studies have commented specifically on dose to swallowing structures contralateral to the primary tumor. Two studies have proposed contralateral submandibular gland constraints for dysphagia (not xerostomia), but neither measured the dose to the contralateral constrictor muscle.9,10 Although the contralateral submandibular dose may correlate with dose to the constrictor on that side, the submandibular gland may have a less direct impact on swallowing than the constrictor muscle, and its limited dimensions may make constraints based on the gland less robust for cancers outside the oropharynx.
Another study reported improved quality of life in patients who were not treated with elective contralateral retropharyngeal radiation.19 Although it is likely that doses to the contralateral constrictor were lower in patients who did not receive elective radiation to this area, this study did not measure or constrain doses to the contralateral constrictors.
Limitations
This study is limited by its single institution, retrospective design, small sample size, and by all patients being male. The high correlation between air cavity editing and the use of SIB makes it impossible to assess the impact of each technique individually. Patients with contralateral constrictor V60 < 40% were less likely to have N2 disease, but N2 to N3 disease did not predict higher 1-year dysphagia, so the difference in N-category cannot fully explain the difference in 1-year dysphagia. It is possible that unreported factors, such as CTV, may contribute significantly to swallowing function. Nevertheless, within the study population, contralateral constrictor dose was able to identify a group with a low rate of long-term dysphagia.
Conclusions
Contralateral constrictor dose is a promising predictor of late dysphagia for patients with H&N cancer treated with radiation with concurrent systemic therapy. Contralateral constrictor V60 < 40% was able to identify a group of patients with a low rate of 1-year dysphagia in this single-center retrospective study. The correlation between air cavity editing and contralateral constrictor V60 suggests that contralateral constrictor dose may depend partly on technique. Further studies are needed to see if the contralateral constrictor dose can be used to predict long-term dysphagia prospectively and in other patient populations.
1. Langendijk JA, Doornaert P, Verdonck-de Leeuw IM, et al. Impact of late treatment-related toxicity on quality of life among patients with head and neck cancer treated with radiotherapy. J Clin Oncol. 2008;26(22):3770-3776. doi:10.1200/JCO.2007.14.6647
2. Nguyen NP, Frank C, Moltz CC, et al. Impact of dysphagia on quality of life after treatment of head-and-neck cancer. Int J Radiat Oncol Biol Phys. 2005;61(3):772-778. doi:10.1016/j.ijrobp.2004.06.017
3. Ramaekers BLT, Joore MA, Grutters JPC, et al. The impact of late treatment-toxicity on generic health-related quality of life in head and neck cancer patients after radiotherapy. Oral Oncol. 2011;47(8):768-774. doi:10.1016/j.oraloncology.2011.05.012
4. Christianen MEMC, Schilstra C, Beetz I, et al. Predictive modelling for swallowing dysfunction after primary (chemo)radiation: results of a prospective observational study. Radiother Oncol. 2012;105(1):107-114. doi:10.1016/j.radonc.2011.08.009
5. Vlachich G, Spratt DE, Diaz R, et al. Dose to inferior pharyngeal conctrictor predicts prolonged gastrostomy tube dependence with concurrent intensity-modulated radiation therapy and chemotherapy for locally-advanced head and neck cancer. Radiother Oncol. 2014;110(3):435-440. doi:10.1016/j.radonc.2013.12.007
6. Mogadas S, Busch CJ, Pflug Cet al. Influence of radiation dose to pharyngeal constrictor muscles on late dysphagia and quality of life in patients with locally advanced oropharyngeal carcinoma. Strahlenther Onkol. 2020;196(6):522-529. doi:10.1007/s00066-019-01572-0
7. Caglar HB, Tishler RB, Othus M, et al. Dose to larynx predicts of swallowing complications after intensity-modulated radiotherapy. Int J Radiat Oncol Biol Phys. 2008;72(4):1110-1118. doi:10.1016/j.ijrobp.2008.02.048
8. Schwartz DL, Hutcheson K, Barringer D, et al. Candidate dosimetric predictors of long-term swallowing dysfunction after oropharyngeal intensity-modulated radiotherapy. Int J Radiat Oncol Biol Phys. 2010;78(5):1356-1365. doi:10.1016/j.ijrobp.2009.10.002
9. Gensheimer MF, Nyflot M, Laramore GE, Laio JL, Parvathaneni U. Contribution of submandibular gland and swallowing structure sparing to post-radiation therapy peg dependence in oropharynx cancer patients treated with split-neck IMRT technique. Radiat Oncol. 2015;11(1):1-7. doi:10.1186/s13014-016-0726-3
10. Hedström J, Tuomi L, Finizia C, Olsson C. Identifying organs at risk for radiation-induced late dysphagia in head and neck cancer patients. Clin Transl Radiat Oncol. 2019;19:87-95. doi:10.1016/j.ctro.2019.08.005
11. Bhide SA, Gulliford S, Kazi R, et al. Correlation between dose to the pharyngeal constrictors and patient quality of life and late dysphagia following chemo-IMRT for head and neck cancer. Radiother Oncol. 2009;93(3):539-544. doi:10.1016/j.radonc.2009.09.017
12. Caudell JJ, Schaner PE, Desmond RA, Meredith RF, Spencer SA, Bonner JA. Dosimetric factors associated with long-term dysphagia after definitive radiotherapy for squamous cell carcinoma of the head and neck. Int J Radiat Oncol Biol Phys. 2010;76(2):403-409. doi:10.1016/j.ijrobp.2009.02.017
13. Levendag PC, Teguh DN, Voet P, et al. Dysphagia disorders in patients with cancer of the oropharynx are significantly affected by the radiation therapy dose to the superior and middle constrictor muscle: a dose-effect relationship. Radiother Oncol. 2007;85(1):64-73. doi:10.1016/j.radonc.2007.07.009
14. Eisbruch A, Schwartz M, Rasch C, et al. Dysphagia and aspiration after chemoradiotherapy for head-and-neck cancer: which anatomic structures are affected and can they be spared by IMRT? Int J Radiat Oncol Biol Phys. 2004;60(5):1425-1439. doi:10.1016/j.ijrobp.2004.05.050
15. Harari PM; NRG Oncology. Comparing high-dose cisplatin every three weeks to low-dose cisplatin weekly when combined with radiation for patients with advanced head and neck cancer. ClinicalTrials.gov identifier: NCT05050162. Updated November 25, 2022. Accessed December 7, 2022. https://clinicaltrials.gov/ct2/show/NCT05050162
16. Wang JJ, Goldsmith TA, Holman AS, Cianchetti M, Chan AW. Pharyngoesophageal stricture after treatment for head and neck cancer. Head Neck. 2011;34(7):967-973. doi:10.1002/hed.21842
17. Kendall KA, McKenzie SW, Leonard RJ, Jones CU. Timing of swallowing events after single-modality treatment of head and neck carcinoma with radiotherapy. Ann Otol Rhinol Laryngol. 2000;109(8, pt 1):767-775. doi:10.1177/000348940010900812
18. Ohmae Y, Ogura M, Kitahara S. Effects of head rotation on pharyngeal function during normal swallow. Ann Otol Rhinol Laryngol. 1998;107(4):344-348. doi:10.1177/000348949810700414
19. Spencer CR, Gay HA, Haughey BH, et al. Eliminating radiotherapy to the contralateral retropharyngeal and high level II lymph nodes in head and neck squamous cell carcinoma is safe and improves quality of life. Cancer. 2014;120(24):3994-4002. doi:10.1002/cncr.28938
Radiation therapy can cause long-term dysphagia that seriously affects quality of life for survivors of head and neck (H&N) cancer.1-3 Numerous studies have linked pharyngeal constrictor dose to long-term dysphagia, but conclusions about the dose distribution that can be safely tolerated have been inconsistent. For example, a group from the Netherlands found that the mean dose to the superior pharyngeal constrictor muscle and the supraglottic larynx were each predictive of dysphagia.4 A subsequent Vanderbilt study refuted these findings, reporting that these structures were not predictive but that dose to the inferior pharyngeal constrictor muscle was.5 Other studies have connected late dysphagia with dose to the middle pharyngeal constrictor muscle, total larynx, oral cavity, contralateral submandibular gland, contralateral parotid gland, or a combination of these structures.6-14 NRG Oncology trials commonly evaluate dose to the “uninvolved pharynx,” which is the total pharyngeal constrictor muscle volume minus the planning target volume for the lowest dose target volume. NRG H&N trials 3, 4, 5, 6, 8, and 9 all use uninvolved pharynx mean dose ≤ 45 Gy as a constraint to judge radiation plan quality.
Differences in methodology or patient population may explain the inconsistency of prior studies on dosimetric predictors of dysphagia, but it is possible that these studies did not evaluate the optimal metric for dysphagia. This study evaluates a novel organ at risk, the contralateral pharyngeal constrictor muscle, to determine whether dose to this structure is predictive of late swallowing function. The study also compares a constraint based on this structure to the NRG uninvolved pharynx constraint mentioned earlier.
Methods
This study is a retrospective review of patients treated at the Richard L. Roudebush Veterans Affairs (VA) Medical Center in Indianapolis, Indiana. Patients were identified by searching the VA Cancer Registry for patients treated for H&N squamous cell carcinoma between September 1, 2016, and August 30, 2019. Eligible sites included cancers of the nasopharynx, oropharynx, hypopharynx, larynx and oral cavity, as well as H&N cancer of an unknown primary site. Only patients treated with primary radiation with concurrent systemic therapy were included. Patients were excluded if they had prior surgery or radiation to the H&N.
The pharyngeal constrictor muscles were contoured per the techniques described by Bhide and colleagues.11 The contralateral constrictor was defined as the half of the constrictor volume contralateral to the primary site. For midline tumors, the side of the neck with a lower volume of lymph node metastases was judged to be the contralateral side.
One-year dysphagia was defined as having a gastronomy tube (G-tube) in place or an abnormal modified barium swallow (MBS) ≥ 12 months after the completion of radiation. At the study institution, MBS is not routinely done after therapy but is ordered if a patient or clinician has concerns about swallowing function. MBS was considered abnormal if there was laryngeal penetration that reached the level of the glottis or was not ejected from the larynx.
Results
The VA Cancer Registry identified 113 patients treated for H&N cancer during the study period. Of these, 55 patients met the inclusion criteria. No patients were lost to follow-up. The median follow-up was 29 months. The median age was 67 years (range, 41-83) (Table 1).
All patients were treated with intensity-modulated radiotherapy (IMRT). Patients treated with a sequential boost had an initial dose of 54 Gy and/or 50 Gy, followed by a boost to a total of 70 Gy at 2 Gy per fraction. Patients treated with a simultaneous integrated boost (SIB) technique received 69.96 Gy in 33 fractions, with elective volumes treated to 54.45 Gy in 33 fractions. Both patients with nasopharyngeal cancer were treated with SIB plans and had an intermediate dose volume of 59.4 Gy.
Systemic therapy was weekly cisplatin in 41 patients (75%) and cetuximab in 14 (25%). Twenty percent of patients receiving cisplatin switched to an alternative agent during treatment, most commonly carboplatin.
Forty-nine patients (89%) had a G-tube placed before starting radiation. G-tubes were in place for an interval of 0 to 47 months (mean, 8.6); 12 (22%) had a G-tube > 12 months. After completion of radiation, 18 patients (33%) had an abnormal MBS. These were done 1 to 50 months (mean, 14.8) after completion of radiation. Abnormal MBS occurred ≥ 12 months after radiation in 9 patients, 5 of whom had their G-tube in place for less than a year.
Forty-six patients (84%) survived more than 1 year and could be evaluated for late swallowing function. One-year dysphagia was seen in 17 (37%) of these patients. Recurrence was seen in 20 patients (36%), with locoregional recurrence in 12 (60%) of these cases. Recurrence occurred at a range of 0 to 15 months (mean, 5.6). Neither recurrence (P = .69) nor locoregional recurrence (P = .11) was associated with increased 1-year dysphagia.
In patients who could be evaluated for long-term swallowing function, contralateral constrictor V60 ranged from 0% to 100% (median, 51%). V60 was < 40% in 18 patients (39%). With V60 < 40%, there was a 6% rate of 1-year dysphagia compared with 57% for V60 ≥ 40% (P < .001).
Patients with contralateral constrictor V60 < 40 and V60 ≥ 40 both had a mean age of 65 years. χ2 analysis did not show a difference in T stage or systemic treatment but did show that patients with V60 < 40% were more likely to have N1 disease (P = .01), and less likely to have N2 disease (P = .01) compared with patients with V60 ≥ 40%. The difference in 1-year dysphagia between N0 to N1 patients (27%) and N2 to N3 patients (46%) was not statistically significant (P = .19).
In patients who could be evaluated for long-term swallowing function, the uninvolved pharynx volume median of the total constrictor volume was 32% (range, < 1%-62%). The uninvolved pharynx mean dose ranged from 28 to 68 Gy (median, 45). When the uninvolved pharynx mean dose was < 45 Gy, 1-year dysphagia was 22% compared with 52% with a dose ≥ 45 Gy (P = .03).
Air cavity editing was performed in 27 patients (49%). One-year survival was 93% with air cavity editing, and 75% without, which was not statistically significant. Locoregional recurrence occurred in 3 patients (11%) with air cavity editing, and 9 (32%) without, which was not statistically significant. In patients surviving at least 1 year, contralateral constrictor V60 averaged 33% with editing and 62% without editing (P < .001). One-year dysphagia was 12% with air cavity editing and 67% without editing (P < .001).
An SIB technique was done in 26 patients (47%). One-year survival was 85% (n = 22) with SIB and 83% (n = 24) with sequential boost, which was not statistically significant. Locoregional recurrence occurred in 19% with SIB, and 32% with sequential boost, which was not statistically significant. For SIB patients alive at 1 year, the median contralateral V60 was 28%, compared with 66% for patients treated with sequential technique. Seventeen patients (77%) with SIB had V60 < 40%. Nineteen (86%) of SIB plans also had air cavity editing. One patient (5%) with SIB had dysphagia at 1 year, compared with 16 (67%) sequential patients (P < .001).
Discussion
This is the first study to link contralateral constrictor dose to long-term dysphagia in patients treated with radiation for H&N cancer. Editing the boost volume off air cavities was associated with lower contralateral constrictor V60 and with less long-term dysphagia. This may indicate that optimizing plans to meet a contralateral constrictor constraint can reduce rates of long-term dysphagia.
The most useful clinical predictors are those that identify a patient at low risk for toxicity. These constraints are useful because they reassure physicians that treatments will have a favorable risk/benefit ratio while identifying plans that may need modification before starting treatment.
The contralateral constrictor outperformed the uninvolved pharynx in identifying patients at low risk for long-term dysphagia. This difference could not be overcome by decreasing the threshold of the pharynx constraint, as 17% of patients with dysphagia had a mean dose of < 40 Gy to the uninvolved pharynx, which was not statistically significant.
An advantage of contralateral constrictor is that it is independent of planning target volume (PTV) size. The uninvolved pharynx structure depends on the PTV contour, so it may obscure a connection between PTV size and dysphagia.
In the context of a clinical trial, only measuring dose to the uninvolved pharynx may allow more plans to meet constraints, but even in NRG trials, physicians have some control over target volumes. For example, NRG HN009, a national trial for patients with H&N cancer, recommends editing the CTV_7000 (clinical target volume treated to 70 Gy) off air cavities but does not define how much the volume should be cropped or specify protocol violations if the volume is not cropped.15 Furthermore, constraints used in clinical trials are often adopted for use outside the trial, where physicians have extensive control over target volumes.
The broad range of uninvolved pharynx volume relative to total constrictor volume confounds predictions using this variable. For example, according to the NRG constraint, a patient with an uninvolved pharynx mean dose of 44 Gy will have a low risk of dysphagia even if this structure is only 1% of the total constrictor. The contralateral constrictor is always about 50% of the total constrictor volume, which means that predictions using this structure will not be confounded by the same variation in volume size.
Figure 2 shows a representative patient who met the NRG uninvolved pharynx constraint but developed long-term dysphagia.
Pharyngoesophageal stricture is a common cause of dysphagia after IMRT for H&N cancer.16 Radiation has been shown to decrease pharyngeal function in patients with H&N cancer.17 Sparing one side of the pharynx may allow for better pharyngeal compliance throughout the length of the pharynx, possibly decreasing the rate of pharyngoesophageal stricture. Additionally, constraining the contralateral constrictor may preserve strength on this side, allowing it to compensate for weakness on the side of the primary cancer. An exercise sometimes used for dysphagia involves head rotation toward the affected side during swallowing. This technique has been shown to cause food to move to the unaffected side.18 Sparing the contralateral constrictor may help such techniques work better in patients with H&N cancer.
Few studies have commented specifically on dose to swallowing structures contralateral to the primary tumor. Two studies have proposed contralateral submandibular gland constraints for dysphagia (not xerostomia), but neither measured the dose to the contralateral constrictor muscle.9,10 Although the contralateral submandibular dose may correlate with dose to the constrictor on that side, the submandibular gland may have a less direct impact on swallowing than the constrictor muscle, and its limited dimensions may make constraints based on the gland less robust for cancers outside the oropharynx.
Another study reported improved quality of life in patients who were not treated with elective contralateral retropharyngeal radiation.19 Although it is likely that doses to the contralateral constrictor were lower in patients who did not receive elective radiation to this area, this study did not measure or constrain doses to the contralateral constrictors.
Limitations
This study is limited by its single institution, retrospective design, small sample size, and by all patients being male. The high correlation between air cavity editing and the use of SIB makes it impossible to assess the impact of each technique individually. Patients with contralateral constrictor V60 < 40% were less likely to have N2 disease, but N2 to N3 disease did not predict higher 1-year dysphagia, so the difference in N-category cannot fully explain the difference in 1-year dysphagia. It is possible that unreported factors, such as CTV, may contribute significantly to swallowing function. Nevertheless, within the study population, contralateral constrictor dose was able to identify a group with a low rate of long-term dysphagia.
Conclusions
Contralateral constrictor dose is a promising predictor of late dysphagia for patients with H&N cancer treated with radiation with concurrent systemic therapy. Contralateral constrictor V60 < 40% was able to identify a group of patients with a low rate of 1-year dysphagia in this single-center retrospective study. The correlation between air cavity editing and contralateral constrictor V60 suggests that contralateral constrictor dose may depend partly on technique. Further studies are needed to see if the contralateral constrictor dose can be used to predict long-term dysphagia prospectively and in other patient populations.
1. Langendijk JA, Doornaert P, Verdonck-de Leeuw IM, et al. Impact of late treatment-related toxicity on quality of life among patients with head and neck cancer treated with radiotherapy. J Clin Oncol. 2008;26(22):3770-3776. doi:10.1200/JCO.2007.14.6647
2. Nguyen NP, Frank C, Moltz CC, et al. Impact of dysphagia on quality of life after treatment of head-and-neck cancer. Int J Radiat Oncol Biol Phys. 2005;61(3):772-778. doi:10.1016/j.ijrobp.2004.06.017
3. Ramaekers BLT, Joore MA, Grutters JPC, et al. The impact of late treatment-toxicity on generic health-related quality of life in head and neck cancer patients after radiotherapy. Oral Oncol. 2011;47(8):768-774. doi:10.1016/j.oraloncology.2011.05.012
4. Christianen MEMC, Schilstra C, Beetz I, et al. Predictive modelling for swallowing dysfunction after primary (chemo)radiation: results of a prospective observational study. Radiother Oncol. 2012;105(1):107-114. doi:10.1016/j.radonc.2011.08.009
5. Vlachich G, Spratt DE, Diaz R, et al. Dose to inferior pharyngeal conctrictor predicts prolonged gastrostomy tube dependence with concurrent intensity-modulated radiation therapy and chemotherapy for locally-advanced head and neck cancer. Radiother Oncol. 2014;110(3):435-440. doi:10.1016/j.radonc.2013.12.007
6. Mogadas S, Busch CJ, Pflug Cet al. Influence of radiation dose to pharyngeal constrictor muscles on late dysphagia and quality of life in patients with locally advanced oropharyngeal carcinoma. Strahlenther Onkol. 2020;196(6):522-529. doi:10.1007/s00066-019-01572-0
7. Caglar HB, Tishler RB, Othus M, et al. Dose to larynx predicts of swallowing complications after intensity-modulated radiotherapy. Int J Radiat Oncol Biol Phys. 2008;72(4):1110-1118. doi:10.1016/j.ijrobp.2008.02.048
8. Schwartz DL, Hutcheson K, Barringer D, et al. Candidate dosimetric predictors of long-term swallowing dysfunction after oropharyngeal intensity-modulated radiotherapy. Int J Radiat Oncol Biol Phys. 2010;78(5):1356-1365. doi:10.1016/j.ijrobp.2009.10.002
9. Gensheimer MF, Nyflot M, Laramore GE, Laio JL, Parvathaneni U. Contribution of submandibular gland and swallowing structure sparing to post-radiation therapy peg dependence in oropharynx cancer patients treated with split-neck IMRT technique. Radiat Oncol. 2015;11(1):1-7. doi:10.1186/s13014-016-0726-3
10. Hedström J, Tuomi L, Finizia C, Olsson C. Identifying organs at risk for radiation-induced late dysphagia in head and neck cancer patients. Clin Transl Radiat Oncol. 2019;19:87-95. doi:10.1016/j.ctro.2019.08.005
11. Bhide SA, Gulliford S, Kazi R, et al. Correlation between dose to the pharyngeal constrictors and patient quality of life and late dysphagia following chemo-IMRT for head and neck cancer. Radiother Oncol. 2009;93(3):539-544. doi:10.1016/j.radonc.2009.09.017
12. Caudell JJ, Schaner PE, Desmond RA, Meredith RF, Spencer SA, Bonner JA. Dosimetric factors associated with long-term dysphagia after definitive radiotherapy for squamous cell carcinoma of the head and neck. Int J Radiat Oncol Biol Phys. 2010;76(2):403-409. doi:10.1016/j.ijrobp.2009.02.017
13. Levendag PC, Teguh DN, Voet P, et al. Dysphagia disorders in patients with cancer of the oropharynx are significantly affected by the radiation therapy dose to the superior and middle constrictor muscle: a dose-effect relationship. Radiother Oncol. 2007;85(1):64-73. doi:10.1016/j.radonc.2007.07.009
14. Eisbruch A, Schwartz M, Rasch C, et al. Dysphagia and aspiration after chemoradiotherapy for head-and-neck cancer: which anatomic structures are affected and can they be spared by IMRT? Int J Radiat Oncol Biol Phys. 2004;60(5):1425-1439. doi:10.1016/j.ijrobp.2004.05.050
15. Harari PM; NRG Oncology. Comparing high-dose cisplatin every three weeks to low-dose cisplatin weekly when combined with radiation for patients with advanced head and neck cancer. ClinicalTrials.gov identifier: NCT05050162. Updated November 25, 2022. Accessed December 7, 2022. https://clinicaltrials.gov/ct2/show/NCT05050162
16. Wang JJ, Goldsmith TA, Holman AS, Cianchetti M, Chan AW. Pharyngoesophageal stricture after treatment for head and neck cancer. Head Neck. 2011;34(7):967-973. doi:10.1002/hed.21842
17. Kendall KA, McKenzie SW, Leonard RJ, Jones CU. Timing of swallowing events after single-modality treatment of head and neck carcinoma with radiotherapy. Ann Otol Rhinol Laryngol. 2000;109(8, pt 1):767-775. doi:10.1177/000348940010900812
18. Ohmae Y, Ogura M, Kitahara S. Effects of head rotation on pharyngeal function during normal swallow. Ann Otol Rhinol Laryngol. 1998;107(4):344-348. doi:10.1177/000348949810700414
19. Spencer CR, Gay HA, Haughey BH, et al. Eliminating radiotherapy to the contralateral retropharyngeal and high level II lymph nodes in head and neck squamous cell carcinoma is safe and improves quality of life. Cancer. 2014;120(24):3994-4002. doi:10.1002/cncr.28938
New Razor Technology Improves Appearance and Quality of Life in Men With Pseudofolliculitis Barbae
Pseudofolliculitis barbae (PFB)(also known as razor bumps or shaving bumps)1 is a skin condition that consists of papules resulting from ingrown hairs.2 In more severe cases, papules become pustules, then abscesses, which can cause scarring.1,2 The condition can be distressing for patients, with considerable negative impact on their daily lives.3 The condition also is associated with shaving-related stinging, burning, pruritus, and cuts on the skin.4
Pseudofolliculitis barbae is most common in men of African descent due to the curved nature of the hair follicle,2,5,6 with an estimated prevalence in this population of 45% to 83%,1,6 but it can affect men of other ethnicities.7 A genetic polymorphism in a gene encoding a keratin specific to the hair follicle also has been found to predispose some individuals to PFB.5 When hair from a curved or destabilized hair follicle is cut to form a sharp tip, it is susceptible to extrafollicular and/or transfollicular penetration,5,6,8 as illustrated in Figure 1.

With extrafollicular or transfollicular penetration, the hair shaft re-enters or retracts into the dermis, triggering an inflammatory response that may be exacerbated by subsequent shaving.2 Few studies have been published that aim to identify potential shaving solutions for individuals with PFB who elect to or need to continue shaving.
A new razor technology comprising 2 blades separated by a bridge feature has been designed specifically for men with razor bumps (SkinGuard [Procter & Gamble]). The SkinGuard razor redistributes shaving pressure so that there is less force from the blades on the skin and inflamed lesions than without the bridge, as seen in Figure 2. The razor has been designed to protect the skin from the blades, thereby minimizing the occurrence of new lesions and allowing existing lesions to heal.
![Test razor bridge feature (SkinGuard [Procter & Gamble]) minimizes the force of the razor blades on the skin. Copyright 2022 The Procter & Gamble Company.](https://cdn.mdedge.com/files/s3fs-public/Moran_2.jpg "Test razor bridge feature (SkinGuard [Procter & Gamble]) minimizes the force of the razor blades on the skin. Copyright 2022 The Procter & Gamble Company.")
The primary purpose of this study was to assess the appearance of males with razor bumps and shaving irritation when using the new razor technology in a regular shaving routine. The secondary objective was to measure satisfaction of the shaving experience when using the new razor by means of assessing itching, burning, and stinging using the participant global severity assessment (PGSA) and the impact on quality of life (QOL) measures.
Methods
Participants—Eligible participants were male, aged 20 to 60 years, and had clinically diagnosed PFB as well as symptoms of skin irritation from shaving. Participants were recruited from a dermatology clinic and via institutional review board–approved advertising.
Those eligible for inclusion in the study had a shaving routine that comprised shaving at least 3 times a week using a wet-shave, blade-razor technique accompanied by only a shave gel or foam. In addition, eligible participants had mild to moderate symptoms of skin irritation (a minimum of 10 razor bumps) from shaving based on investigator global severity assessment (IGSA) rating scales and were willing to shave at least 5 times a week during the study period. Participants could continue certain topical and systemic interventions for their skin.
Participants were excluded from the study if they had an underlying inflammatory disease that could manifest with a skin rash or were using any of these medications: topical benzoyl peroxide, topical clindamycin, topical retinoids, or oral antibiotics.
Study Design—A prospective, open-label study was conducted over a period of 12 weeks at a single site in the United States. Investigators instructed participants to shave 5 or more times per week with the test razor and to keep a daily shaving journal to track the number of shaves and compliance.
Participants were evaluated at the baseline screening visit, then at 4, 8, and 12 weeks. Evaluations included an investigator lesion count, the IGSA, and the PGSA. The PGSA was used to evaluate subjective clinical measurements (ie, indicate how much postshave burning/itching/stinging the participant was experiencing). The impact of shaving on daily life was evaluated at the baseline screening visit and at 12 weeks with the Participant Quality of Life Questionnaire comprised of 22 QOL statements. eTable 1 summarizes the investigator assessments used in the study, and eTable 2 summarizes the participant self-assessments. Both tables include the scale details and results interpretation for each assessment.

The study was approved by the local institutional review board, and all participants provided written informed consent in accordance with Title 21 of the Code of Federal Regulations, Part 50.

Study Visits—At the baseline screening visit, participants provided written informed consent and completed a prestudy shave questionnaire concerning shaving preparations, techniques, and opinions. Participants also provided a medical history, including prior and concomitant medications, and were evaluated using the inclusion/exclusion criteria. Investigators explained adverse event reporting to the participants. Participants were provided with an adequate supply of test razors for the 12-week period.
Data Analysis—Means and SDs were calculated for the study measures assessed at each visit. Analyses were performed evaluating change from baseline in repeated-measures analysis of variance models. These models were adjusted for baseline levels of the outcome measure and visit number. The magnitude of change from baseline was evaluated against a null hypothesis of 0% change. This longitudinal model adjusted for any potential differing baseline levels among participants. Statistical significance was defined as P<.05. SAS version 9.4 (SAS Institute Inc) was used for all analyses.
Results
In total, 21 individuals were enrolled, and 20 completed the study. Participants who completed the study were non-Hispanic Black (n=10); non-Hispanic White (n=8); Asian (n=1); or White, American Indian (n=1). All participants adhered to the protocol and reported shaving at least 5 times a week for 12 weeks using the test razor. One participant was removed after he was found to have a history of sarcoidosis, making him ineligible for the study. No study-related adverse events were reported.
Papules and Pustules—Over the course of the 12-week study, the papule count decreased significantly from baseline. Results from the investigator lesion count (see eTable 1 for key) indicated that by week 12—adjusted for number of papules at baseline—the mean percentage reduction was estimated to be 59.6% (P<.0001). A significant decrease in papule count also was observed between the baseline visit and week 8 (57.2%; P<.0001). A nonsignificant decrease was observed at week 4 (18.9%; P=.17). Only 3 participants presented with pustules at baseline, and the pustule count remained low over the course of the study. No significant change was noted at week 12 vs baseline (P=.98). Notably, there was no increase in pustule count at the end of the study compared with baseline (Table 1).
Skin Appearance—An improvement in the skin’s appearance over the course of the study from baseline was consistent with an improvement in the IGSA. The IGSA score significantly improved from a mean (SD) measurement of 2.5 (0.6) (indicating mild to moderate inflammation) at baseline to 1.4 (0.8) at week 8 (P<.0001) and 1.2 (1.1) (indicating mild inflammation to almost clear) at week 12 (P<.0001). The observed decrease in severity of skin condition and skin inflammation is shown in Figure 3.
 scores (0=clear; 1=almost clear; 2=mild; 3=moderate; 4=severe; 5=very severe) from baseline to 12 weeks. Error bars indicate SD.")
Significant improvements were observed in every category of the PGSA at week 12 vs baseline (P≤.0007)(Table 2). At week 12, there was a significant (P≤.05) increase from baseline in participant agreement for all 22 QOL metrics describing positive shave experience, achieving results, skin feel, self-confidence, and social interactions (Figure 4), which supports the positive impact of adopting a shaving regimen with the test razor. Notably, after using the test razor for 12 weeks, men reported that they were more likely to agree with the statements “my skin felt smooth,” “my skin felt good to touch,” and “I was able to achieve a consistently good shave.” Other meaningful increases occurred in “shaving was something I looked forward to doing,” “others thought I looked clean cut,” “I looked my best for my family/others/work,” and “I felt comfortable/confident getting closer to others.” All QOL statements are shown in Figure 4.
 scores at baseline (visit 1) and at week 12 (visit 4). All week 12 scores were significantly higher (P≤.05 vs baseline)")
Comment
Improvement With Novel Razor Technology—For the first time, frequent use of a novel razor technology designed specifically for men with PFB was found to significantly improve skin appearance, shave satisfaction, and QOL after 12 weeks vs baseline in participants clinically diagnosed with PFB. In men with shave-related skin irritation and razor bumps who typically wet-shaved with a razor at least 3 times a week, use of the test razor with their regular shaving preparation product 5 or more times per week for 12 weeks was associated with significant improvements from baseline in investigator lesion count, IGSA, PGSA, and Participant Quality of Life Questionnaire measurements.
Study strengths included the quantification of the change in the number of lesions and the degree of severity by a trained investigator in a prospective clinical study along with an assessment of the impact on participant QOL. A lack of a control arm could be considered a limitation of the study; however, study end points were evaluated compared with baseline, with each participant serving as their own control. Spontaneous resolution of the condition with their standard routine was considered highly unlikely in these participants; therefore, in the absence of any other changes, improvements were attributed to regular use of the test product over the course of the study. The results presented here provide strong support for the effectiveness of the new razor technology in improving the appearance of men with razor bumps and shaving irritation.
Hair Removal Tools for the Management of PFB—Although various tools and techniques have been proposed in the past for men with PFB, the current test razor technology provided unique benefits, including improvements in appearance and severity of the condition as well as a positive impact on QOL. In 1979, Conte and Lawrence9 evaluated the effect of using an electric hair clipper and twice-daily use of a skin-cleansing pad on the occurrence of PFB. Participants (n=96) allowed their beards to grow out for 1 month, after which they started shaving with an electric clipper with a triple O head. The authors reported a favorable response in 95% (91/96) of cases. However, the electric clippers left 1 mm of beard at the skin level,9 which may not be acceptable for those who prefer a clean-shaven appearance.6
A prospective survey of 22 men of African descent with PFB found use of a safety razor was preferred over an electric razor.10 The single-arm study evaluated use of a foil-guarded shaver (single-razor blade) in the management of PFB based on investigator lesion counts and a participant questionnaire. Participants were asked to shave at least every other day and use a specially designed preshave brush. A mean reduction in lesion counts was observed at 2 weeks (29.6%), 4 weeks (38.1%), and 6 weeks (47.1%); statistical significance was not reported. At 6 weeks, 77.3% (17/22) of participants judged the foil-guarded shaver to be superior to other shaving devices in controlling their razor bumps, and 90.9% (20/22) indicated they would recommend the shaver to others with PFB. The authors hypothesized that the guard buffered the skin from the blade, which might otherwise facilitate the penetration of ingrowing hairs and cause trauma to existing lesions.
The mean reduction in lesion count from baseline observed at week 4 was greater in the study with the foil-guarded shaver and preshave brush (38% reduction)10 than in our study (19% reduction in papule count). Different methodologies, use of a preshave brush in the earlier study, and a difference in lesion severity at baseline may have contributed to this difference. The study with the foil-guarded shaver concluded after 6 weeks, and there was a 47.1% reduction in lesion counts vs baseline.10 In contrast, the current study continued for 12 weeks, and a 59.6% reduction in lesion counts was reported. Participants from both studies reported an improved shaving experience compared with their usual practice,10 though only the current study explored the positive impact of the new razor technology on participant QOL.
Preventing Hairs From Being Cut Too Close—The closeness of the shave is believed to be a contributory factor in the development and persistence of PFB6,8,11 based on a tendency for the distal portion of tightly curled hair shafts to re-enter the skin after shaving via transfollicular penetration.12 Inclusion of a buffer in the razor between the sharp blades and the skin has been proposed to prevent hairs from being cut too close and causing transfollicular penetration.12
In the test razor used in the current study, the bridge technology acted as the buffer to prevent hairs from being cut too close to the skin and to reduce blade contact with the skin (Figure 2). Having only 2 blades also reduced the closeness of the shave compared with 5-bladed technologies,13 as each hair can only be pulled and cut up to a maximum of 2 times per shaving stroke. Notably, this did not impact the participants’ QOL scores related to achieving a close shave or skin feeling smooth; both attributes were significantly improved at 12 weeks vs baseline (Figure 4).
By reducing blade contact with the skin, the bridge technology in the test razor was designed to prevent excessive force from being applied to the skin through the blades. Reduced blade loading minimizes contact with and impact on sensitive skin.14 Additional design features of the test razor to minimize the impact of shaving on the skin include treatment of the 2 blades with low-friction coatings, which allows the blades to cut through the beard hair with minimal force, helping to reduce the tug-and-pull effect that may otherwise result in irritation and inflammation.13,15 Lubrication strips before and after the blades in the test razor reduce friction between the blades and the skin to further protect the skin from the blades.15
Shaving With Multiblade Razors Does Not Exacerbate PFB—In a 1-week, split-faced, randomized study of 45 Black men, shaving with a manual 3-bladed razor was compared with use of 3 different chemical depilatory formulations.16 Shaving every other day for 1 week with the manual razor resulted in more papule formation but less irritation than use of the depilatories. The authors concluded that a study with longer duration was needed to explore the impact of shaving on papule formation in participants with a history of PFB.16
In 2013, an investigator-blinded study of 90 African American men with PFB compared the impact of different shaving regimens on the signs and symptoms of PFB over a 12-week period.4 Participants were randomized to 1 of 3 arms: (1) shaving 2 to 3 times per week with a triple-blade razor and standard products (control group); (2) shaving daily with a 5-bladed razor and standard products; and (3) shaving daily with a 5-bladed razor and “advanced” specific pre- and postshave products. The researchers found that the mean papule measurement significantly decreased from baseline in the advanced (P=.01) and control (P=.016) groups. Between-group comparison revealed no significant differences for papule or pustule count among each arm. For the investigator-graded severity, the change from baseline was significant for all 3 groups (P≤.04); however, the differences among groups were not significant. Importantly, these data demonstrated that PFB was not exacerbated by multiblade razors used as part of a daily shaving regimen.4
The findings of the current study were consistent with those of Daniel et al4 in that there was no exacerbation of the signs and symptoms of PFB associated with daily shaving. However, rather than requiring participants to change their entire shaving regimen, the present study only required a change of razor type. Moreover, the use of the new razor technology significantly decreased papule counts at week 12 vs the baseline measurement (P<.0001) and was associated with an improvement in subjective skin severity measurements. The participants in the present study reported significantly less burning, stinging, and itching after using the test product for 12 weeks (P<.0001).
Impact of Treatment on QOL—The current study further expanded on prior findings by combining these clinical end points with the QOL results to assess the test razor’s impact on participants’ lives. Results showed that over the course of 12 weeks, the new razor technology significantly improved the participants’ QOL in all questions related to shaving experience, achieving results, skin feel, self-confidence, and social interactions. The significant improvement in QOL included statements such as “shaving was a pleasant experience,” “I was able to achieve a consistently good shave,” and “my skin felt smooth.” Participants also reported improvements in meaningful categories such as “my shave made me feel attractive” and “I felt comfortable/confident getting closer to others.” As the current study showed, a shave regimen has the potential to change participants’ overall assessment of their QOL, a variable that must not be overlooked.
Conclusion
In men with clinically diagnosed PFB, regular shaving with a razor designed to protect the skin was found to significantly decrease lesion counts, increase shave satisfaction, and improve QOL after 12 weeks compared with their usual shaving practice (baseline measures). This razor technology provides another option to help manage PFB for men who wish to or need to continue shaving.
Acknowledgments—The clinical study was funded by the Procter & Gamble Company. Editorial writing assistance, supported financially by the Procter & Gamble Company, was provided by Gill McFeat, PhD, of McFeat Science Ltd (Devon, United Kingdom).
- Alexander AM, Delph WI. Pseudofolliculitis barbae in the military. a medical, administrative and social problem. J Natl Med Assoc. 1974;66:459-464, 479.
- Kligman AM, Strauss JS. Pseudofolliculitis of the beard. AMA Arch Derm. 1956;74:533-542.
- Banta J, Bowen C, Wong E, et al. Perceptions of shaving profiles and their potential impacts on career progression in the United States Air Force. Mil Med. 2021;186:187-189.
- Daniel A, Gustafson CJ, Zupkosky PJ, et al. Shave frequency and regimen variation effects on the management of pseudofolliculitis barbae. J Drugs Dermatol. 2013;12:410-418.
- Winter H, Schissel D, Parry DA, et al. An unusual Ala12Thr polymorphism in the 1A alpha-helical segment of the companion layer-specific keratin K6hf: evidence for a risk factor in the etiology of the common hair disorder pseudofolliculitis barbae. J Invest Dermatol. 2004;122:652-657.
- Perry PK, Cook-Bolden FE, Rahman Z, et al. Defining pseudofolliculitis barbae in 2001: a review of the literature and current trends. J Am Acad Dermatol. 2002;46(2 suppl understanding):S113-S119.
- McMichael AJ. Hair and scalp disorders in ethnic populations. Dermatol Clin. 2003;21:629-644.
- Ribera M, Fernández-Chico N, Casals M. Pseudofolliculitis barbae [in Spanish]. Actas Dermosifiliogr. 2010;101:749-757.
- Conte MS, Lawrence JE. Pseudofolliculitis barbae. no ‘pseudoproblem.’ JAMA. 1979;241:53-54.
- Alexander AM. Evaluation of a foil-guarded shaver in the management of pseudofolliculitis barbae. Cutis. 1981;27:534-537, 540-542.
- Weiss AN, Arballo OM, Miletta NR, et al. Military grooming standards and their impact on skin diseases of the head and neck. Cutis. 2018;102:328;331-333.
- Alexis A, Heath CR, Halder RM. Folliculitis keloidalis nuchae and pseudofolliculitis barbae: are prevention and effective treatment within reach? Dermatol Clin. 2014;32:183-191.
- Cowley K, Vanoosthuyze K, Ertel K, et al. Blade shaving. In: Draelos ZD, ed. Cosmetic Dermatology: Products and Procedures. 2nd ed. John Wiley & Sons; 2015:166-173.
- Cowley K, Vanoosthuyze K. Insights into shaving and its impact on skin. Br J Dermatol. 2012;166(suppl 1):6-12.
- Cowley K, Vanoosthuyze K. The biomechanics of blade shaving. Int J Cosmet Sci. 2016;38(suppl 1):17-23.
- Kindred C, Oresajo CO, Yatskayer M, et al. Comparative evaluation of men’s depilatory composition versus razor in black men. Cutis. 2011;88:98-103.
Pseudofolliculitis barbae (PFB)(also known as razor bumps or shaving bumps)1 is a skin condition that consists of papules resulting from ingrown hairs.2 In more severe cases, papules become pustules, then abscesses, which can cause scarring.1,2 The condition can be distressing for patients, with considerable negative impact on their daily lives.3 The condition also is associated with shaving-related stinging, burning, pruritus, and cuts on the skin.4
Pseudofolliculitis barbae is most common in men of African descent due to the curved nature of the hair follicle,2,5,6 with an estimated prevalence in this population of 45% to 83%,1,6 but it can affect men of other ethnicities.7 A genetic polymorphism in a gene encoding a keratin specific to the hair follicle also has been found to predispose some individuals to PFB.5 When hair from a curved or destabilized hair follicle is cut to form a sharp tip, it is susceptible to extrafollicular and/or transfollicular penetration,5,6,8 as illustrated in Figure 1.
With extrafollicular or transfollicular penetration, the hair shaft re-enters or retracts into the dermis, triggering an inflammatory response that may be exacerbated by subsequent shaving.2 Few studies have been published that aim to identify potential shaving solutions for individuals with PFB who elect to or need to continue shaving.
A new razor technology comprising 2 blades separated by a bridge feature has been designed specifically for men with razor bumps (SkinGuard [Procter & Gamble]). The SkinGuard razor redistributes shaving pressure so that there is less force from the blades on the skin and inflamed lesions than without the bridge, as seen in Figure 2. The razor has been designed to protect the skin from the blades, thereby minimizing the occurrence of new lesions and allowing existing lesions to heal.
The primary purpose of this study was to assess the appearance of males with razor bumps and shaving irritation when using the new razor technology in a regular shaving routine. The secondary objective was to measure satisfaction of the shaving experience when using the new razor by means of assessing itching, burning, and stinging using the participant global severity assessment (PGSA) and the impact on quality of life (QOL) measures.
Methods
Participants—Eligible participants were male, aged 20 to 60 years, and had clinically diagnosed PFB as well as symptoms of skin irritation from shaving. Participants were recruited from a dermatology clinic and via institutional review board–approved advertising.
Those eligible for inclusion in the study had a shaving routine that comprised shaving at least 3 times a week using a wet-shave, blade-razor technique accompanied by only a shave gel or foam. In addition, eligible participants had mild to moderate symptoms of skin irritation (a minimum of 10 razor bumps) from shaving based on investigator global severity assessment (IGSA) rating scales and were willing to shave at least 5 times a week during the study period. Participants could continue certain topical and systemic interventions for their skin.
Participants were excluded from the study if they had an underlying inflammatory disease that could manifest with a skin rash or were using any of these medications: topical benzoyl peroxide, topical clindamycin, topical retinoids, or oral antibiotics.
Study Design—A prospective, open-label study was conducted over a period of 12 weeks at a single site in the United States. Investigators instructed participants to shave 5 or more times per week with the test razor and to keep a daily shaving journal to track the number of shaves and compliance.
Participants were evaluated at the baseline screening visit, then at 4, 8, and 12 weeks. Evaluations included an investigator lesion count, the IGSA, and the PGSA. The PGSA was used to evaluate subjective clinical measurements (ie, indicate how much postshave burning/itching/stinging the participant was experiencing). The impact of shaving on daily life was evaluated at the baseline screening visit and at 12 weeks with the Participant Quality of Life Questionnaire comprised of 22 QOL statements. eTable 1 summarizes the investigator assessments used in the study, and eTable 2 summarizes the participant self-assessments. Both tables include the scale details and results interpretation for each assessment.
The study was approved by the local institutional review board, and all participants provided written informed consent in accordance with Title 21 of the Code of Federal Regulations, Part 50.
Study Visits—At the baseline screening visit, participants provided written informed consent and completed a prestudy shave questionnaire concerning shaving preparations, techniques, and opinions. Participants also provided a medical history, including prior and concomitant medications, and were evaluated using the inclusion/exclusion criteria. Investigators explained adverse event reporting to the participants. Participants were provided with an adequate supply of test razors for the 12-week period.
Data Analysis—Means and SDs were calculated for the study measures assessed at each visit. Analyses were performed evaluating change from baseline in repeated-measures analysis of variance models. These models were adjusted for baseline levels of the outcome measure and visit number. The magnitude of change from baseline was evaluated against a null hypothesis of 0% change. This longitudinal model adjusted for any potential differing baseline levels among participants. Statistical significance was defined as P<.05. SAS version 9.4 (SAS Institute Inc) was used for all analyses.
Results
In total, 21 individuals were enrolled, and 20 completed the study. Participants who completed the study were non-Hispanic Black (n=10); non-Hispanic White (n=8); Asian (n=1); or White, American Indian (n=1). All participants adhered to the protocol and reported shaving at least 5 times a week for 12 weeks using the test razor. One participant was removed after he was found to have a history of sarcoidosis, making him ineligible for the study. No study-related adverse events were reported.
Papules and Pustules—Over the course of the 12-week study, the papule count decreased significantly from baseline. Results from the investigator lesion count (see eTable 1 for key) indicated that by week 12—adjusted for number of papules at baseline—the mean percentage reduction was estimated to be 59.6% (P<.0001). A significant decrease in papule count also was observed between the baseline visit and week 8 (57.2%; P<.0001). A nonsignificant decrease was observed at week 4 (18.9%; P=.17). Only 3 participants presented with pustules at baseline, and the pustule count remained low over the course of the study. No significant change was noted at week 12 vs baseline (P=.98). Notably, there was no increase in pustule count at the end of the study compared with baseline (Table 1).
Skin Appearance—An improvement in the skin’s appearance over the course of the study from baseline was consistent with an improvement in the IGSA. The IGSA score significantly improved from a mean (SD) measurement of 2.5 (0.6) (indicating mild to moderate inflammation) at baseline to 1.4 (0.8) at week 8 (P<.0001) and 1.2 (1.1) (indicating mild inflammation to almost clear) at week 12 (P<.0001). The observed decrease in severity of skin condition and skin inflammation is shown in Figure 3.
Significant improvements were observed in every category of the PGSA at week 12 vs baseline (P≤.0007)(Table 2). At week 12, there was a significant (P≤.05) increase from baseline in participant agreement for all 22 QOL metrics describing positive shave experience, achieving results, skin feel, self-confidence, and social interactions (Figure 4), which supports the positive impact of adopting a shaving regimen with the test razor. Notably, after using the test razor for 12 weeks, men reported that they were more likely to agree with the statements “my skin felt smooth,” “my skin felt good to touch,” and “I was able to achieve a consistently good shave.” Other meaningful increases occurred in “shaving was something I looked forward to doing,” “others thought I looked clean cut,” “I looked my best for my family/others/work,” and “I felt comfortable/confident getting closer to others.” All QOL statements are shown in Figure 4.
Comment
Improvement With Novel Razor Technology—For the first time, frequent use of a novel razor technology designed specifically for men with PFB was found to significantly improve skin appearance, shave satisfaction, and QOL after 12 weeks vs baseline in participants clinically diagnosed with PFB. In men with shave-related skin irritation and razor bumps who typically wet-shaved with a razor at least 3 times a week, use of the test razor with their regular shaving preparation product 5 or more times per week for 12 weeks was associated with significant improvements from baseline in investigator lesion count, IGSA, PGSA, and Participant Quality of Life Questionnaire measurements.
Study strengths included the quantification of the change in the number of lesions and the degree of severity by a trained investigator in a prospective clinical study along with an assessment of the impact on participant QOL. A lack of a control arm could be considered a limitation of the study; however, study end points were evaluated compared with baseline, with each participant serving as their own control. Spontaneous resolution of the condition with their standard routine was considered highly unlikely in these participants; therefore, in the absence of any other changes, improvements were attributed to regular use of the test product over the course of the study. The results presented here provide strong support for the effectiveness of the new razor technology in improving the appearance of men with razor bumps and shaving irritation.
Hair Removal Tools for the Management of PFB—Although various tools and techniques have been proposed in the past for men with PFB, the current test razor technology provided unique benefits, including improvements in appearance and severity of the condition as well as a positive impact on QOL. In 1979, Conte and Lawrence9 evaluated the effect of using an electric hair clipper and twice-daily use of a skin-cleansing pad on the occurrence of PFB. Participants (n=96) allowed their beards to grow out for 1 month, after which they started shaving with an electric clipper with a triple O head. The authors reported a favorable response in 95% (91/96) of cases. However, the electric clippers left 1 mm of beard at the skin level,9 which may not be acceptable for those who prefer a clean-shaven appearance.6
A prospective survey of 22 men of African descent with PFB found use of a safety razor was preferred over an electric razor.10 The single-arm study evaluated use of a foil-guarded shaver (single-razor blade) in the management of PFB based on investigator lesion counts and a participant questionnaire. Participants were asked to shave at least every other day and use a specially designed preshave brush. A mean reduction in lesion counts was observed at 2 weeks (29.6%), 4 weeks (38.1%), and 6 weeks (47.1%); statistical significance was not reported. At 6 weeks, 77.3% (17/22) of participants judged the foil-guarded shaver to be superior to other shaving devices in controlling their razor bumps, and 90.9% (20/22) indicated they would recommend the shaver to others with PFB. The authors hypothesized that the guard buffered the skin from the blade, which might otherwise facilitate the penetration of ingrowing hairs and cause trauma to existing lesions.
The mean reduction in lesion count from baseline observed at week 4 was greater in the study with the foil-guarded shaver and preshave brush (38% reduction)10 than in our study (19% reduction in papule count). Different methodologies, use of a preshave brush in the earlier study, and a difference in lesion severity at baseline may have contributed to this difference. The study with the foil-guarded shaver concluded after 6 weeks, and there was a 47.1% reduction in lesion counts vs baseline.10 In contrast, the current study continued for 12 weeks, and a 59.6% reduction in lesion counts was reported. Participants from both studies reported an improved shaving experience compared with their usual practice,10 though only the current study explored the positive impact of the new razor technology on participant QOL.
Preventing Hairs From Being Cut Too Close—The closeness of the shave is believed to be a contributory factor in the development and persistence of PFB6,8,11 based on a tendency for the distal portion of tightly curled hair shafts to re-enter the skin after shaving via transfollicular penetration.12 Inclusion of a buffer in the razor between the sharp blades and the skin has been proposed to prevent hairs from being cut too close and causing transfollicular penetration.12
In the test razor used in the current study, the bridge technology acted as the buffer to prevent hairs from being cut too close to the skin and to reduce blade contact with the skin (Figure 2). Having only 2 blades also reduced the closeness of the shave compared with 5-bladed technologies,13 as each hair can only be pulled and cut up to a maximum of 2 times per shaving stroke. Notably, this did not impact the participants’ QOL scores related to achieving a close shave or skin feeling smooth; both attributes were significantly improved at 12 weeks vs baseline (Figure 4).
By reducing blade contact with the skin, the bridge technology in the test razor was designed to prevent excessive force from being applied to the skin through the blades. Reduced blade loading minimizes contact with and impact on sensitive skin.14 Additional design features of the test razor to minimize the impact of shaving on the skin include treatment of the 2 blades with low-friction coatings, which allows the blades to cut through the beard hair with minimal force, helping to reduce the tug-and-pull effect that may otherwise result in irritation and inflammation.13,15 Lubrication strips before and after the blades in the test razor reduce friction between the blades and the skin to further protect the skin from the blades.15
Shaving With Multiblade Razors Does Not Exacerbate PFB—In a 1-week, split-faced, randomized study of 45 Black men, shaving with a manual 3-bladed razor was compared with use of 3 different chemical depilatory formulations.16 Shaving every other day for 1 week with the manual razor resulted in more papule formation but less irritation than use of the depilatories. The authors concluded that a study with longer duration was needed to explore the impact of shaving on papule formation in participants with a history of PFB.16
In 2013, an investigator-blinded study of 90 African American men with PFB compared the impact of different shaving regimens on the signs and symptoms of PFB over a 12-week period.4 Participants were randomized to 1 of 3 arms: (1) shaving 2 to 3 times per week with a triple-blade razor and standard products (control group); (2) shaving daily with a 5-bladed razor and standard products; and (3) shaving daily with a 5-bladed razor and “advanced” specific pre- and postshave products. The researchers found that the mean papule measurement significantly decreased from baseline in the advanced (P=.01) and control (P=.016) groups. Between-group comparison revealed no significant differences for papule or pustule count among each arm. For the investigator-graded severity, the change from baseline was significant for all 3 groups (P≤.04); however, the differences among groups were not significant. Importantly, these data demonstrated that PFB was not exacerbated by multiblade razors used as part of a daily shaving regimen.4
The findings of the current study were consistent with those of Daniel et al4 in that there was no exacerbation of the signs and symptoms of PFB associated with daily shaving. However, rather than requiring participants to change their entire shaving regimen, the present study only required a change of razor type. Moreover, the use of the new razor technology significantly decreased papule counts at week 12 vs the baseline measurement (P<.0001) and was associated with an improvement in subjective skin severity measurements. The participants in the present study reported significantly less burning, stinging, and itching after using the test product for 12 weeks (P<.0001).
Impact of Treatment on QOL—The current study further expanded on prior findings by combining these clinical end points with the QOL results to assess the test razor’s impact on participants’ lives. Results showed that over the course of 12 weeks, the new razor technology significantly improved the participants’ QOL in all questions related to shaving experience, achieving results, skin feel, self-confidence, and social interactions. The significant improvement in QOL included statements such as “shaving was a pleasant experience,” “I was able to achieve a consistently good shave,” and “my skin felt smooth.” Participants also reported improvements in meaningful categories such as “my shave made me feel attractive” and “I felt comfortable/confident getting closer to others.” As the current study showed, a shave regimen has the potential to change participants’ overall assessment of their QOL, a variable that must not be overlooked.
Conclusion
In men with clinically diagnosed PFB, regular shaving with a razor designed to protect the skin was found to significantly decrease lesion counts, increase shave satisfaction, and improve QOL after 12 weeks compared with their usual shaving practice (baseline measures). This razor technology provides another option to help manage PFB for men who wish to or need to continue shaving.
Acknowledgments—The clinical study was funded by the Procter & Gamble Company. Editorial writing assistance, supported financially by the Procter & Gamble Company, was provided by Gill McFeat, PhD, of McFeat Science Ltd (Devon, United Kingdom).
- Alexander AM, Delph WI. Pseudofolliculitis barbae in the military. a medical, administrative and social problem. J Natl Med Assoc. 1974;66:459-464, 479.
- Kligman AM, Strauss JS. Pseudofolliculitis of the beard. AMA Arch Derm. 1956;74:533-542.
- Banta J, Bowen C, Wong E, et al. Perceptions of shaving profiles and their potential impacts on career progression in the United States Air Force. Mil Med. 2021;186:187-189.
- Daniel A, Gustafson CJ, Zupkosky PJ, et al. Shave frequency and regimen variation effects on the management of pseudofolliculitis barbae. J Drugs Dermatol. 2013;12:410-418.
- Winter H, Schissel D, Parry DA, et al. An unusual Ala12Thr polymorphism in the 1A alpha-helical segment of the companion layer-specific keratin K6hf: evidence for a risk factor in the etiology of the common hair disorder pseudofolliculitis barbae. J Invest Dermatol. 2004;122:652-657.
- Perry PK, Cook-Bolden FE, Rahman Z, et al. Defining pseudofolliculitis barbae in 2001: a review of the literature and current trends. J Am Acad Dermatol. 2002;46(2 suppl understanding):S113-S119.
- McMichael AJ. Hair and scalp disorders in ethnic populations. Dermatol Clin. 2003;21:629-644.
- Ribera M, Fernández-Chico N, Casals M. Pseudofolliculitis barbae [in Spanish]. Actas Dermosifiliogr. 2010;101:749-757.
- Conte MS, Lawrence JE. Pseudofolliculitis barbae. no ‘pseudoproblem.’ JAMA. 1979;241:53-54.
- Alexander AM. Evaluation of a foil-guarded shaver in the management of pseudofolliculitis barbae. Cutis. 1981;27:534-537, 540-542.
- Weiss AN, Arballo OM, Miletta NR, et al. Military grooming standards and their impact on skin diseases of the head and neck. Cutis. 2018;102:328;331-333.
- Alexis A, Heath CR, Halder RM. Folliculitis keloidalis nuchae and pseudofolliculitis barbae: are prevention and effective treatment within reach? Dermatol Clin. 2014;32:183-191.
- Cowley K, Vanoosthuyze K, Ertel K, et al. Blade shaving. In: Draelos ZD, ed. Cosmetic Dermatology: Products and Procedures. 2nd ed. John Wiley & Sons; 2015:166-173.
- Cowley K, Vanoosthuyze K. Insights into shaving and its impact on skin. Br J Dermatol. 2012;166(suppl 1):6-12.
- Cowley K, Vanoosthuyze K. The biomechanics of blade shaving. Int J Cosmet Sci. 2016;38(suppl 1):17-23.
- Kindred C, Oresajo CO, Yatskayer M, et al. Comparative evaluation of men’s depilatory composition versus razor in black men. Cutis. 2011;88:98-103.
Practice Points
- Pseudofolliculitis barbae (PFB) is a common follicular inflammatory disorder associated with shaving, most commonly seen in men of African ancestry. It can be distressing and cause a substantial impact on quality of life (QOL).
- Frequent use of a novel razor technology designed specifically for men with PFB was found to improve skin appearance and QOL after 12 weeks vs baseline.
- This razor technology provides an alternative approach to help manage PFB for men who wish to or need to continue shaving.

Neurosurgery Operating Room Efficiency During the COVID-19 Era
From the Department of Neurological Surgery, Vanderbilt University Medical Center, Nashville, TN (Stefan W. Koester, Puja Jagasia, and Drs. Liles, Dambrino IV, Feldman, and Chambless), and the Department of Anesthesiology, Vanderbilt University Medical Center, Nashville, TN (Drs. Mathews and Tiwari).
ABSTRACT
Background: The COVID-19 pandemic has had broad effects on surgical care, including operating room (OR) staffing, personal protective equipment (PPE) utilization, and newly implemented anti-infective measures. Our aim was to assess neurosurgery OR efficiency before the COVID-19 pandemic, during peak COVID-19, and during current times.
Methods: Institutional perioperative databases at a single, high-volume neurosurgical center were queried for operations performed from December 2019 until October 2021. March 12, 2020, the day that the state of Tennessee declared a state of emergency, was chosen as the onset of the COVID-19 pandemic. The 90-day periods before and after this day were used to define the pre-COVID-19, peak-COVID-19, and post-peak restrictions time periods for comparative analysis. Outcomes included delay in first-start and OR turnover time between neurosurgical cases. Preset threshold times were used in analyses to adjust for normal leniency in OR scheduling (15 minutes for first start and 90 minutes for turnover). Univariate analysis used Wilcoxon rank-sum test for continuous outcomes, while chi-square test and Fisher’s exact test were used for categorical comparisons. Significance was defined as P < .05.
Results: First-start time was analyzed in 426 pre-COVID-19, 357 peak-restrictions, and 2304 post-peak-restrictions cases. The unadjusted mean delay length was found to be significantly different between the time periods, but the magnitude of increase in minutes was immaterial (mean [SD] minutes, 6 [18] vs 10 [21] vs 8 [20], respectively; P = .004). The adjusted average delay length and proportion of cases delayed beyond the 15-minute threshold were not significantly different. The proportion of cases that started early, as well as significantly early past a 15-minute threshold, have not been impacted. There was no significant change in turnover time during peak restrictions relative to the pre-COVID-19 period (88 [100] minutes vs 85 [95] minutes), and turnover time has since remained unchanged (83 [87] minutes).
Conclusion: Our center was able to maintain OR efficiency before, during, and after peak restrictions even while instituting advanced infection-control strategies. While there were significant changes, delays were relatively small in magnitude.
Keywords: operating room timing, hospital efficiency, socioeconomics, pandemic.
The COVID-19 pandemic has led to major changes in patient care both from a surgical perspective and in regard to inpatient hospital course. Safety protocols nationwide have been implemented to protect both patients and providers. Some elements of surgical care have drastically changed, including operating room (OR) staffing, personal protective equipment (PPE) utilization, and increased sterilization measures. Furloughs, layoffs, and reassignments due to the focus on nonelective and COVID-19–related cases challenged OR staffing and efficiency. Operating room staff with COVID-19 exposures or COVID-19 infections also caused last-minute changes in staffing. All of these scenarios can cause issues due to actual understaffing or due to staff members being pushed into highly specialized areas, such as neurosurgery, in which they have very little experience. A further obstacle to OR efficiency included policy changes involving PPE utilization, sterilization measures, and supply chain shortages of necessary resources such as PPE.
Neurosurgery in particular has been susceptible to COVID-19–related system-wide changes given operator proximity to the patient’s respiratory passages, frequency of emergent cases, and varying anesthetic needs, as well as the high level of specialization needed to perform neurosurgical care. Previous studies have shown a change in the makeup of neurosurgical patients seeking care, as well as in the acuity of neurological consult of these patients.1 A study in orthopedic surgery by Andreata et al demonstrated worsened OR efficiency, with significantly increased first-start and turnover times.2 In the COVID-19 era, OR quality and safety are crucially important to both patients and providers. Providing this safe and effective care in an efficient manner is important for optimal neurosurgical management in the long term.3 Moreover, the financial burden of implementing new protocols and standards can be compounded by additional financial losses due to reduced OR efficiency.
Methods
To analyze the effect of COVID-19 on neurosurgical OR efficiency, institutional perioperative databases at a single high-volume center were queried for operations performed from December 2019 until October 2021. March 12, 2020, was chosen as the onset of COVID-19 for analytic purposes, as this was the date when the state of Tennessee declared a state of emergency. The 90-day periods before and after this date were used for comparative analysis for pre-COVID-19, peak COVID-19, and post-peak-restrictions time periods. The peak COVID-19 period was defined as the 90-day period following the initial onset of COVID-19 and the surge of cases. For comparison purposes, post-peak COVID-19 was defined as the months following the first peak until October 2021 (approximately 17 months). COVID-19 burden was determined using a COVID-19 single-institution census of confirmed cases by polymerase chain reaction (PCR) for which the average number of cases of COVID-19 during a given month was determined. This number is a scaled trend, and a true number of COVID-19 cases in our hospital was not reported.
Neurosurgical and neuroendovascular cases were included in the analysis. Outcomes included delay in first-start and OR turnover time between neurosurgical cases, defined as the time from the patient leaving the room until the next patient entered the room. Preset threshold times were used in analyses to adjust for normal leniency in OR scheduling (15 minutes for first start and 90 minutes for turnover, which is a standard for our single-institution perioperative center). Statistical analyses, including data aggregation, were performed using R, version 4.0.1 (R Foundation for Statistical Computing). Patients’ demographic and clinical characteristics were analyzed using an independent 2-sample t-test for interval variables and a chi-square test for categorical variables. Significance was defined as P < .05.
Results
First-Start Time
First-start time was analyzed in 426 pre-COVID-19, 357 peak-COVID-19, and 2304 post-peak-COVID-19 cases. The unadjusted mean delay length was significantly different between the time periods, but the magnitude of increase in minutes was immaterial (mean [SD] minutes, 6 [18] vs 10 [21] vs 8 [20], respectively; P = .004) (Table 1). 
The adjusted average delay length and proportion of cases delayed beyond the 15-minute threshold were not significantly different, but they have been slightly higher since the onset of COVID-19. The proportion of cases that have started early, as well as significantly early past a 15-minute threshold, have also trended down since the onset of the COVID-19 pandemic, but this difference was again not significant. The temporal relationship of first-start delay, both unadjusted and adjusted, from December 2019 to October 2021 is shown in Figure 1. The trend of increasing delay is loosely associated with the COVID-19 burden experienced by our hospital. The start of COVID-19 as well as both COVID-19 peaks have been associated with increased delays in our hospital. Unadjusted and (B) adjusted first-start delay in operating room efficiency relative to COVID-19 census.")
Turnover Time
Turnover time was assessed in 437 pre-COVID-19, 278 peak-restrictions, and 2411 post-peak-restrictions cases. Turnover time during peak restrictions was not significantly different from pre-COVID-19 (88 [100] vs 85 [95]) and has since remained relatively unchanged (83 [87], P = .78). A similar trend held for comparisons of proportion of cases with turnover time past 90 minutes and average times past the 90-minute threshold (Table 2). The temporal relationship between COVID-19 burden and turnover time, both unadjusted and adjusted, from December 2019 to October 2021 is shown in Figure 2. Both figures demonstrate a slight initial increase in turnover time delay at the start of COVID-19, which stabilized with little variation thereafter.

 Unadjusted and (B) adjusted turnover time in operating room efficiency relative to COVID-19 census.")
Discussion
We analyzed the OR efficiency metrics of first-start and turnover time during the 90-day period before COVID-19 (pre-COVID-19), the 90 days following Tennessee declaring a state of emergency (peak COVID-19), and the time following this period (post-COVID-19) for all neurosurgical and neuroendovascular cases at Vanderbilt University Medical Center (VUMC). We found a significant difference in unadjusted mean delay length in first-start time between the time periods, but the magnitude of increase in minutes was immaterial (mean [SD] minutes for pre-COVID-19, peak-COVID-19, and post-COVID-19: 6 [18] vs 10 [21] vs 8 [20], respectively; P = .004). No significant increase in turnover time between cases was found between these 3 time periods. Based on metrics from first-start delay and turnover time, our center was able to maintain OR efficiency before, during, and after peak COVID-19.
After the Centers for Disease Control and Prevention released guidelines recommending deferring elective procedures to conserve beds and PPE, VUMC made the decision to suspend all elective surgical procedures from March 18 to April 24, 2020. Prior research conducted during the COVID-19 pandemic has demonstrated more than 400 types of surgical procedures with negatively impacted outcomes when compared to surgical outcomes from the same time frame in 2018 and 2019.4 For more than 20 of these types of procedures, there was a significant association between procedure delay and adverse patient outcomes.4 Testing protocols for patients prior to surgery varied throughout the pandemic based on vaccination status and type of procedure. Before vaccines became widely available, all patients were required to obtain a PCR SARS-CoV-2 test within 48 to 72 hours of the scheduled procedure. If the patient’s procedure was urgent and testing was not feasible, the patient was treated as a SARS-CoV-2–positive patient, which required all health care workers involved in the case to wear gowns, gloves, surgical masks, and eye protection. Testing patients preoperatively likely helped to maintain OR efficiency since not all patients received test results prior to the scheduled procedure, leading to cancellations of cases and therefore more staff available for fewer cases.
After vaccines became widely available to the public, testing requirements for patients preoperatively were relaxed, and only patients who were not fully vaccinated or severely immunocompromised were required to test prior to procedures. However, approximately 40% of the population in Tennessee was fully vaccinated in 2021, which reflects the patient population of VUMC.5 This means that many patients who received care at VUMC were still tested prior to procedures.
Adopting adequate safety protocols was found to be key for OR efficiency during the COVID-19 pandemic since performing surgery increased the risk of infection for each health care worker in the OR.6 VUMC protocols identified procedures that required enhanced safety measures to prevent infection of health care workers and avoid staffing shortages, which would decrease OR efficiency. Protocols mandated that only anesthesia team members were allowed to be in the OR during intubation and extubation of patients, which could be one factor leading to increased delays and decreased efficiency for some institutions. Methods for neurosurgeons to decrease risk of infection in the OR include postponing all nonurgent cases, reappraising the necessity for general anesthesia and endotracheal intubation, considering alternative surgical approaches that avoid the respiratory tract, and limiting the use of aerosol-generating instruments.7,8 VUMC’s success in implementing these protocols likely explains why our center was able to maintain OR efficiency throughout the COVID-19 pandemic.
A study conducted by Andreata et al showed a significantly increased mean first-case delay and a nonsignificant increased turnover time in orthopedic surgeries in Northern Italy when comparing surgeries performed during the COVID-19 pandemic to those performed prior to COVID-19.2 Other studies have indicated a similar trend in decreased OR efficiency during COVID-19 in other areas around the world.9,10 These findings are not consistent with our own findings for neurosurgical and neuroendovascular surgeries at VUMC, and any change at our institution was relatively immaterial. Factors that threatened to change OR efficiency—but did not result in meaningful changes in our institutional experience—include delays due to pending COVID-19 test results, safety procedures such as PPE donning, and planning difficulties to ensure the existence of teams with non-overlapping providers in the case of a surgeon being infected.2,11-13
Globally, many surgery centers halted all elective surgeries during the initial COVID-19 spike to prevent a PPE shortage and mitigate risk of infection of patients and health care workers.8,12,14 However, there is no centralized definition of which neurosurgical procedures are elective, so that decision was made on a surgeon or center level, which could lead to variability in efficiency trends.14 One study on neurosurgical procedures during COVID-19 found a 30% decline in all cases and a 23% decline in emergent procedures, showing that the decrease in volume was not only due to cancellation of elective procedures.15 This decrease in elective and emergent surgeries created a backlog of surgeries as well as a loss in health care revenue, and caused many patients to go without adequate health care.10 Looking forward, it is imperative that surgical centers study trends in OR efficiency from COVID-19 and learn how to better maintain OR efficiency during future pandemic conditions to prevent a backlog of cases, loss of health care revenue, and decreased health care access.
Limitations
Our data are from a single center and therefore may not be representative of experiences of other hospitals due to different populations and different impacts from COVID-19. However, given our center’s high volume and diverse patient population, we believe our analysis highlights important trends in neurosurgery practice. Notably, data for patient and OR timing are digitally generated and are entered manually by nurses in the electronic medical record, making it prone to errors and variability. This is in our experience, and if any error is present, we believe it is minimal.
Conclusion
The COVID-19 pandemic has had far-reaching effects on health care worldwide, including neurosurgical care. OR efficiency across the United States generally worsened given the stresses of supply chain issues, staffing shortages, and cancellations. At our institution, we were able to maintain OR efficiency during the known COVID-19 peaks until October 2021. Continually functional neurosurgical ORs are important in preventing delays in care and maintaining a steady revenue in order for hospitals and other health care entities to remain solvent. Further study of OR efficiency is needed for health care systems to prepare for future pandemics and other resource-straining events in order to provide optimal patient care.
Corresponding author: Campbell Liles, MD, Vanderbilt University Medical Center, Department of Neurological Surgery, 1161 21st Ave. South, T4224 Medical Center North, Nashville, TN 37232-2380; [email protected]
Disclosures: None reported.
1. Koester SW, Catapano JS, Ma KL, et al. COVID-19 and neurosurgery consultation call volume at a single large tertiary center with a propensity- adjusted analysis. World Neurosurg. 2021;146:e768-e772. doi:10.1016/j.wneu.2020.11.017
2. Andreata M, Faraldi M, Bucci E, Lombardi G, Zagra L. Operating room efficiency and timing during coronavirus disease 2019 outbreak in a referral orthopaedic hospital in Northern Italy. Int Orthop. 2020;44(12):2499-2504. doi:10.1007/s00264-020-04772-x
3. Dexter F, Abouleish AE, Epstein RH, et al. Use of operating room information system data to predict the impact of reducing turnover times on staffing costs. Anesth Analg. 2003;97(4):1119-1126. doi:10.1213/01.ANE.0000082520.68800.79
4. Zheng NS, Warner JL, Osterman TJ, et al. A retrospective approach to evaluating potential adverse outcomes associated with delay of procedures for cardiovascular and cancer-related diagnoses in the context of COVID-19. J Biomed Inform. 2021;113:103657. doi:10.1016/j.jbi.2020.103657
5. Alcendor DJ. Targeting COVID-19 vaccine hesitancy in rural communities in Tennessee: implications for extending the COVID- 19 pandemic in the South. Vaccines (Basel). 2021;9(11):1279. doi:10.3390/vaccines9111279
6. Perrone G, Giuffrida M, Bellini V, et al. Operating room setup: how to improve health care professionals safety during pandemic COVID- 19: a quality improvement study. J Laparoendosc Adv Surg Tech A. 2021;31(1):85-89. doi:10.1089/lap.2020.0592
7. Iorio-Morin C, Hodaie M, Sarica C, et al. Letter: the risk of COVID-19 infection during neurosurgical procedures: a review of severe acute respiratory distress syndrome coronavirus 2 (SARS-CoV-2) modes of transmission and proposed neurosurgery-specific measures for mitigation. Neurosurgery. 2020;87(2):E178-E185. doi:10.1093/ neuros/nyaa157
8. Gupta P, Muthukumar N, Rajshekhar V, et al. Neurosurgery and neurology practices during the novel COVID-19 pandemic: a consensus statement from India. Neurol India. 2020;68(2):246-254. doi:10.4103/0028-3886.283130
9. Mercer ST, Agarwal R, Dayananda KSS, et al. A comparative study looking at trauma and orthopaedic operating efficiency in the COVID-19 era. Perioper Care Oper Room Manag. 2020;21:100142. doi:10.1016/j.pcorm.2020.100142
10. Rozario N, Rozario D. Can machine learning optimize the efficiency of the operating room in the era of COVID-19? Can J Surg. 2020;63(6):E527-E529. doi:10.1503/cjs.016520
11. Toh KHQ, Barazanchi A, Rajaretnam NS, et al. COVID-19 response by New Zealand general surgical departments in tertiary metropolitan hospitals. ANZ J Surg. 2021;91(7-8):1352-1357. doi:10.1111/ ans.17044
12. Moorthy RK, Rajshekhar V. Impact of COVID-19 pandemic on neurosurgical practice in India: a survey on personal protective equipment usage, testing, and perceptions on disease transmission. Neurol India. 2020;68(5):1133-1138. doi:10.4103/0028- 3886.299173
13. Meneghini RM. Techniques and strategies to optimize efficiencies in the office and operating room: getting through the patient backlog and preserving hospital resources. J Arthroplasty. 2021;36(7S):S49-S51. doi:10.1016/j.arth.2021.03.010
14. Jean WC, Ironside NT, Sack KD, et al. The impact of COVID- 19 on neurosurgeons and the strategy for triaging non-emergent operations: a global neurosurgery study. Acta Neurochir (Wien). 2020;162(6):1229-1240. doi:10.1007/s00701-020- 04342-5
15. Raneri F, Rustemi O, Zambon G, et al. Neurosurgery in times of a pandemic: a survey of neurosurgical services during the COVID-19 outbreak in the Veneto region in Italy. Neurosurg Focus. 2020;49(6):E9. doi:10.3171/2020.9.FOCUS20691
From the Department of Neurological Surgery, Vanderbilt University Medical Center, Nashville, TN (Stefan W. Koester, Puja Jagasia, and Drs. Liles, Dambrino IV, Feldman, and Chambless), and the Department of Anesthesiology, Vanderbilt University Medical Center, Nashville, TN (Drs. Mathews and Tiwari).
ABSTRACT
Background: The COVID-19 pandemic has had broad effects on surgical care, including operating room (OR) staffing, personal protective equipment (PPE) utilization, and newly implemented anti-infective measures. Our aim was to assess neurosurgery OR efficiency before the COVID-19 pandemic, during peak COVID-19, and during current times.
Methods: Institutional perioperative databases at a single, high-volume neurosurgical center were queried for operations performed from December 2019 until October 2021. March 12, 2020, the day that the state of Tennessee declared a state of emergency, was chosen as the onset of the COVID-19 pandemic. The 90-day periods before and after this day were used to define the pre-COVID-19, peak-COVID-19, and post-peak restrictions time periods for comparative analysis. Outcomes included delay in first-start and OR turnover time between neurosurgical cases. Preset threshold times were used in analyses to adjust for normal leniency in OR scheduling (15 minutes for first start and 90 minutes for turnover). Univariate analysis used Wilcoxon rank-sum test for continuous outcomes, while chi-square test and Fisher’s exact test were used for categorical comparisons. Significance was defined as P < .05.
Results: First-start time was analyzed in 426 pre-COVID-19, 357 peak-restrictions, and 2304 post-peak-restrictions cases. The unadjusted mean delay length was found to be significantly different between the time periods, but the magnitude of increase in minutes was immaterial (mean [SD] minutes, 6 [18] vs 10 [21] vs 8 [20], respectively; P = .004). The adjusted average delay length and proportion of cases delayed beyond the 15-minute threshold were not significantly different. The proportion of cases that started early, as well as significantly early past a 15-minute threshold, have not been impacted. There was no significant change in turnover time during peak restrictions relative to the pre-COVID-19 period (88 [100] minutes vs 85 [95] minutes), and turnover time has since remained unchanged (83 [87] minutes).
Conclusion: Our center was able to maintain OR efficiency before, during, and after peak restrictions even while instituting advanced infection-control strategies. While there were significant changes, delays were relatively small in magnitude.
Keywords: operating room timing, hospital efficiency, socioeconomics, pandemic.
The COVID-19 pandemic has led to major changes in patient care both from a surgical perspective and in regard to inpatient hospital course. Safety protocols nationwide have been implemented to protect both patients and providers. Some elements of surgical care have drastically changed, including operating room (OR) staffing, personal protective equipment (PPE) utilization, and increased sterilization measures. Furloughs, layoffs, and reassignments due to the focus on nonelective and COVID-19–related cases challenged OR staffing and efficiency. Operating room staff with COVID-19 exposures or COVID-19 infections also caused last-minute changes in staffing. All of these scenarios can cause issues due to actual understaffing or due to staff members being pushed into highly specialized areas, such as neurosurgery, in which they have very little experience. A further obstacle to OR efficiency included policy changes involving PPE utilization, sterilization measures, and supply chain shortages of necessary resources such as PPE.
Neurosurgery in particular has been susceptible to COVID-19–related system-wide changes given operator proximity to the patient’s respiratory passages, frequency of emergent cases, and varying anesthetic needs, as well as the high level of specialization needed to perform neurosurgical care. Previous studies have shown a change in the makeup of neurosurgical patients seeking care, as well as in the acuity of neurological consult of these patients.1 A study in orthopedic surgery by Andreata et al demonstrated worsened OR efficiency, with significantly increased first-start and turnover times.2 In the COVID-19 era, OR quality and safety are crucially important to both patients and providers. Providing this safe and effective care in an efficient manner is important for optimal neurosurgical management in the long term.3 Moreover, the financial burden of implementing new protocols and standards can be compounded by additional financial losses due to reduced OR efficiency.
Methods
To analyze the effect of COVID-19 on neurosurgical OR efficiency, institutional perioperative databases at a single high-volume center were queried for operations performed from December 2019 until October 2021. March 12, 2020, was chosen as the onset of COVID-19 for analytic purposes, as this was the date when the state of Tennessee declared a state of emergency. The 90-day periods before and after this date were used for comparative analysis for pre-COVID-19, peak COVID-19, and post-peak-restrictions time periods. The peak COVID-19 period was defined as the 90-day period following the initial onset of COVID-19 and the surge of cases. For comparison purposes, post-peak COVID-19 was defined as the months following the first peak until October 2021 (approximately 17 months). COVID-19 burden was determined using a COVID-19 single-institution census of confirmed cases by polymerase chain reaction (PCR) for which the average number of cases of COVID-19 during a given month was determined. This number is a scaled trend, and a true number of COVID-19 cases in our hospital was not reported.
Neurosurgical and neuroendovascular cases were included in the analysis. Outcomes included delay in first-start and OR turnover time between neurosurgical cases, defined as the time from the patient leaving the room until the next patient entered the room. Preset threshold times were used in analyses to adjust for normal leniency in OR scheduling (15 minutes for first start and 90 minutes for turnover, which is a standard for our single-institution perioperative center). Statistical analyses, including data aggregation, were performed using R, version 4.0.1 (R Foundation for Statistical Computing). Patients’ demographic and clinical characteristics were analyzed using an independent 2-sample t-test for interval variables and a chi-square test for categorical variables. Significance was defined as P < .05.
Results
First-Start Time
First-start time was analyzed in 426 pre-COVID-19, 357 peak-COVID-19, and 2304 post-peak-COVID-19 cases. The unadjusted mean delay length was significantly different between the time periods, but the magnitude of increase in minutes was immaterial (mean [SD] minutes, 6 [18] vs 10 [21] vs 8 [20], respectively; P = .004) (Table 1).
The adjusted average delay length and proportion of cases delayed beyond the 15-minute threshold were not significantly different, but they have been slightly higher since the onset of COVID-19. The proportion of cases that have started early, as well as significantly early past a 15-minute threshold, have also trended down since the onset of the COVID-19 pandemic, but this difference was again not significant. The temporal relationship of first-start delay, both unadjusted and adjusted, from December 2019 to October 2021 is shown in Figure 1. The trend of increasing delay is loosely associated with the COVID-19 burden experienced by our hospital. The start of COVID-19 as well as both COVID-19 peaks have been associated with increased delays in our hospital.
Turnover Time
Turnover time was assessed in 437 pre-COVID-19, 278 peak-restrictions, and 2411 post-peak-restrictions cases. Turnover time during peak restrictions was not significantly different from pre-COVID-19 (88 [100] vs 85 [95]) and has since remained relatively unchanged (83 [87], P = .78). A similar trend held for comparisons of proportion of cases with turnover time past 90 minutes and average times past the 90-minute threshold (Table 2). The temporal relationship between COVID-19 burden and turnover time, both unadjusted and adjusted, from December 2019 to October 2021 is shown in Figure 2. Both figures demonstrate a slight initial increase in turnover time delay at the start of COVID-19, which stabilized with little variation thereafter.
Discussion
We analyzed the OR efficiency metrics of first-start and turnover time during the 90-day period before COVID-19 (pre-COVID-19), the 90 days following Tennessee declaring a state of emergency (peak COVID-19), and the time following this period (post-COVID-19) for all neurosurgical and neuroendovascular cases at Vanderbilt University Medical Center (VUMC). We found a significant difference in unadjusted mean delay length in first-start time between the time periods, but the magnitude of increase in minutes was immaterial (mean [SD] minutes for pre-COVID-19, peak-COVID-19, and post-COVID-19: 6 [18] vs 10 [21] vs 8 [20], respectively; P = .004). No significant increase in turnover time between cases was found between these 3 time periods. Based on metrics from first-start delay and turnover time, our center was able to maintain OR efficiency before, during, and after peak COVID-19.
After the Centers for Disease Control and Prevention released guidelines recommending deferring elective procedures to conserve beds and PPE, VUMC made the decision to suspend all elective surgical procedures from March 18 to April 24, 2020. Prior research conducted during the COVID-19 pandemic has demonstrated more than 400 types of surgical procedures with negatively impacted outcomes when compared to surgical outcomes from the same time frame in 2018 and 2019.4 For more than 20 of these types of procedures, there was a significant association between procedure delay and adverse patient outcomes.4 Testing protocols for patients prior to surgery varied throughout the pandemic based on vaccination status and type of procedure. Before vaccines became widely available, all patients were required to obtain a PCR SARS-CoV-2 test within 48 to 72 hours of the scheduled procedure. If the patient’s procedure was urgent and testing was not feasible, the patient was treated as a SARS-CoV-2–positive patient, which required all health care workers involved in the case to wear gowns, gloves, surgical masks, and eye protection. Testing patients preoperatively likely helped to maintain OR efficiency since not all patients received test results prior to the scheduled procedure, leading to cancellations of cases and therefore more staff available for fewer cases.
After vaccines became widely available to the public, testing requirements for patients preoperatively were relaxed, and only patients who were not fully vaccinated or severely immunocompromised were required to test prior to procedures. However, approximately 40% of the population in Tennessee was fully vaccinated in 2021, which reflects the patient population of VUMC.5 This means that many patients who received care at VUMC were still tested prior to procedures.
Adopting adequate safety protocols was found to be key for OR efficiency during the COVID-19 pandemic since performing surgery increased the risk of infection for each health care worker in the OR.6 VUMC protocols identified procedures that required enhanced safety measures to prevent infection of health care workers and avoid staffing shortages, which would decrease OR efficiency. Protocols mandated that only anesthesia team members were allowed to be in the OR during intubation and extubation of patients, which could be one factor leading to increased delays and decreased efficiency for some institutions. Methods for neurosurgeons to decrease risk of infection in the OR include postponing all nonurgent cases, reappraising the necessity for general anesthesia and endotracheal intubation, considering alternative surgical approaches that avoid the respiratory tract, and limiting the use of aerosol-generating instruments.7,8 VUMC’s success in implementing these protocols likely explains why our center was able to maintain OR efficiency throughout the COVID-19 pandemic.
A study conducted by Andreata et al showed a significantly increased mean first-case delay and a nonsignificant increased turnover time in orthopedic surgeries in Northern Italy when comparing surgeries performed during the COVID-19 pandemic to those performed prior to COVID-19.2 Other studies have indicated a similar trend in decreased OR efficiency during COVID-19 in other areas around the world.9,10 These findings are not consistent with our own findings for neurosurgical and neuroendovascular surgeries at VUMC, and any change at our institution was relatively immaterial. Factors that threatened to change OR efficiency—but did not result in meaningful changes in our institutional experience—include delays due to pending COVID-19 test results, safety procedures such as PPE donning, and planning difficulties to ensure the existence of teams with non-overlapping providers in the case of a surgeon being infected.2,11-13
Globally, many surgery centers halted all elective surgeries during the initial COVID-19 spike to prevent a PPE shortage and mitigate risk of infection of patients and health care workers.8,12,14 However, there is no centralized definition of which neurosurgical procedures are elective, so that decision was made on a surgeon or center level, which could lead to variability in efficiency trends.14 One study on neurosurgical procedures during COVID-19 found a 30% decline in all cases and a 23% decline in emergent procedures, showing that the decrease in volume was not only due to cancellation of elective procedures.15 This decrease in elective and emergent surgeries created a backlog of surgeries as well as a loss in health care revenue, and caused many patients to go without adequate health care.10 Looking forward, it is imperative that surgical centers study trends in OR efficiency from COVID-19 and learn how to better maintain OR efficiency during future pandemic conditions to prevent a backlog of cases, loss of health care revenue, and decreased health care access.
Limitations
Our data are from a single center and therefore may not be representative of experiences of other hospitals due to different populations and different impacts from COVID-19. However, given our center’s high volume and diverse patient population, we believe our analysis highlights important trends in neurosurgery practice. Notably, data for patient and OR timing are digitally generated and are entered manually by nurses in the electronic medical record, making it prone to errors and variability. This is in our experience, and if any error is present, we believe it is minimal.
Conclusion
The COVID-19 pandemic has had far-reaching effects on health care worldwide, including neurosurgical care. OR efficiency across the United States generally worsened given the stresses of supply chain issues, staffing shortages, and cancellations. At our institution, we were able to maintain OR efficiency during the known COVID-19 peaks until October 2021. Continually functional neurosurgical ORs are important in preventing delays in care and maintaining a steady revenue in order for hospitals and other health care entities to remain solvent. Further study of OR efficiency is needed for health care systems to prepare for future pandemics and other resource-straining events in order to provide optimal patient care.
Corresponding author: Campbell Liles, MD, Vanderbilt University Medical Center, Department of Neurological Surgery, 1161 21st Ave. South, T4224 Medical Center North, Nashville, TN 37232-2380; [email protected]
Disclosures: None reported.
1. Koester SW, Catapano JS, Ma KL, et al. COVID-19 and neurosurgery consultation call volume at a single large tertiary center with a propensity- adjusted analysis. World Neurosurg. 2021;146:e768-e772. doi:10.1016/j.wneu.2020.11.017
2. Andreata M, Faraldi M, Bucci E, Lombardi G, Zagra L. Operating room efficiency and timing during coronavirus disease 2019 outbreak in a referral orthopaedic hospital in Northern Italy. Int Orthop. 2020;44(12):2499-2504. doi:10.1007/s00264-020-04772-x
3. Dexter F, Abouleish AE, Epstein RH, et al. Use of operating room information system data to predict the impact of reducing turnover times on staffing costs. Anesth Analg. 2003;97(4):1119-1126. doi:10.1213/01.ANE.0000082520.68800.79
4. Zheng NS, Warner JL, Osterman TJ, et al. A retrospective approach to evaluating potential adverse outcomes associated with delay of procedures for cardiovascular and cancer-related diagnoses in the context of COVID-19. J Biomed Inform. 2021;113:103657. doi:10.1016/j.jbi.2020.103657
5. Alcendor DJ. Targeting COVID-19 vaccine hesitancy in rural communities in Tennessee: implications for extending the COVID- 19 pandemic in the South. Vaccines (Basel). 2021;9(11):1279. doi:10.3390/vaccines9111279
6. Perrone G, Giuffrida M, Bellini V, et al. Operating room setup: how to improve health care professionals safety during pandemic COVID- 19: a quality improvement study. J Laparoendosc Adv Surg Tech A. 2021;31(1):85-89. doi:10.1089/lap.2020.0592
7. Iorio-Morin C, Hodaie M, Sarica C, et al. Letter: the risk of COVID-19 infection during neurosurgical procedures: a review of severe acute respiratory distress syndrome coronavirus 2 (SARS-CoV-2) modes of transmission and proposed neurosurgery-specific measures for mitigation. Neurosurgery. 2020;87(2):E178-E185. doi:10.1093/ neuros/nyaa157
8. Gupta P, Muthukumar N, Rajshekhar V, et al. Neurosurgery and neurology practices during the novel COVID-19 pandemic: a consensus statement from India. Neurol India. 2020;68(2):246-254. doi:10.4103/0028-3886.283130
9. Mercer ST, Agarwal R, Dayananda KSS, et al. A comparative study looking at trauma and orthopaedic operating efficiency in the COVID-19 era. Perioper Care Oper Room Manag. 2020;21:100142. doi:10.1016/j.pcorm.2020.100142
10. Rozario N, Rozario D. Can machine learning optimize the efficiency of the operating room in the era of COVID-19? Can J Surg. 2020;63(6):E527-E529. doi:10.1503/cjs.016520
11. Toh KHQ, Barazanchi A, Rajaretnam NS, et al. COVID-19 response by New Zealand general surgical departments in tertiary metropolitan hospitals. ANZ J Surg. 2021;91(7-8):1352-1357. doi:10.1111/ ans.17044
12. Moorthy RK, Rajshekhar V. Impact of COVID-19 pandemic on neurosurgical practice in India: a survey on personal protective equipment usage, testing, and perceptions on disease transmission. Neurol India. 2020;68(5):1133-1138. doi:10.4103/0028- 3886.299173
13. Meneghini RM. Techniques and strategies to optimize efficiencies in the office and operating room: getting through the patient backlog and preserving hospital resources. J Arthroplasty. 2021;36(7S):S49-S51. doi:10.1016/j.arth.2021.03.010
14. Jean WC, Ironside NT, Sack KD, et al. The impact of COVID- 19 on neurosurgeons and the strategy for triaging non-emergent operations: a global neurosurgery study. Acta Neurochir (Wien). 2020;162(6):1229-1240. doi:10.1007/s00701-020- 04342-5
15. Raneri F, Rustemi O, Zambon G, et al. Neurosurgery in times of a pandemic: a survey of neurosurgical services during the COVID-19 outbreak in the Veneto region in Italy. Neurosurg Focus. 2020;49(6):E9. doi:10.3171/2020.9.FOCUS20691

Safety and Efficacy of GLP-1 Receptor Agonists and SGLT2 Inhibitors Among Veterans With Type 2 Diabetes
Selecting the best medication regimen for a patient with type 2 diabetes mellitus (T2DM) depends on many factors, such as glycemic control, adherence, adverse effect (AE) profile, and comorbid conditions.1 Selected agents from 2 newer medication classes, glucagon-like peptide 1 receptor agonists (GLP-1 RA) and sodium-glucose cotransporter 2 inhibitors (SGLT2i), have demonstrated cardiovascular and renal protective properties, creating a new paradigm in management.
The American Diabetes Association recommends medications with proven benefit in cardiovascular disease (CVD), such as the GLP-1 RAs liraglutide, injectable semaglutide, or dulaglutide, or the SGLT2i empagliflozin or canagliflozin, as second-line after metformin in patients with established atherosclerotic CVD or indicators of high risk to reduce the risk of major adverse cardiovascular events (MACE).1 SGLT2i are preferred in patients with diabetic kidney disease, and GLP-1 RAs are next in line for selection of agents with proven nephroprotection (liraglutide, injectable semaglutide, dulaglutide). The mechanisms of these benefits are not fully understood but may be due to their extraglycemic effects. The classes likely induce these benefits by different mechanisms: SGLT2i by hemodynamic effects and GLP-1 RAs by anti-inflammatory mechanisms.2 Although there is much interest, evidence is limited regarding the cardiovascular and renal protection benefits of these agents used in combination.
The combined use of GLP-1 RA and SGLT2i agents demonstrated greater benefit than separate use in trials with nonveteran populations.3-7 These studies evaluated effects on hemoglobin A1c (HbA1c) levels, weight loss, blood pressure (BP), and estimated glomerular filtration rate (eGFR).A meta-analysis of 7 trials found that the combination of GLP-1 RA and SGLT2i reduced HbA1c levels, body weight, and systolic blood pressure (SBP).8 All of the changes were statistically significant except for body weight with combination vs SGLT2i alone. Combination therapy was not associated with increased risk of severe hypoglycemia compared with either therapy separately.
The purpose of our study was to evaluate the safety and efficacy of the combined use of GLP-1 RA and SGLT2i in a real-world, US Department of Veterans Affairs (VA) population with T2DM.
Methods
This study was a pre-post, retrospective, single-center chart review. Subjects served as their own control. The project was reviewed and approved by the VA Ann Arbor Healthcare System Institutional Review Board. Subjects prescribed both a GLP-1 RA (semaglutide or liraglutide) and SGLT2i (empagliflozin) between January 1, 2014, and November 10, 2019, were extracted from the Corporate Data Warehouse (CDW) for possible inclusion in the study.
Patients were excluded if they received < 12 weeks of combination GLP-1 RA and SGLT2i therapy or did not have a corresponding 12-week HbA1c level. Patients also were excluded if they had < 12 weeks of monotherapy before starting combination therapy or did not have a baseline HbA1c level, or if the start date of combination therapy was not recorded in the VA electronic health record (EHR). We reviewed data for each patient from 6 months before to 1 year after the second agent was started. Start of the first agent (GLP-1 RA or SGLT2i) was recorded as the date the prescription was picked up in-person or 7 days after release date if mailed to the patient. Start of the second agent (GLP-1 RA or SGLT2i) was defined as baseline and was the date the prescription was picked up in person or 7 days after the release date if mailed.
Baseline measures were taken anytime from 8 weeks after the start of the first agent through 2 weeks after the start of the second agent. Data collected included age, sex, race, height, weight, BP, HbA1c levels, serum creatinine (SCr), eGFR, classes of medications for the treatment of T2DM, and the number of prescribed antihypertensive medications. HbA1c levels, SCr, eGFR, weight, and BP also were collected at 12 weeks (within 8-21 weeks); 26 weeks (within 22-35 weeks); and 52 weeks (within 36-57 weeks) of combination therapy. We reviewed progress notes and laboratory results to determine AEs within 26 weeks before initiating second agent (baseline) and 0 to 26 weeks and 26 to 52 weeks after initiating combination therapy.
The primary objective was to determine the effect on HbA1c levels at 12 weeks when using a GLP-1 RA and SGLT2i in combination vs separately. Secondary objectives were to determine change from baseline in mean body weight, BP, SCr, and eGFR at 12, 26, and 52 weeks; change in HbA1c levels at 26 and 52 weeks; and incidence of prespecified adverse drug reactions during combination therapy vs separately.
Statistical Analysis
Assuming a SD of 1, 80% power, significance level of P < .05, 2-sided test, and a correlation between baseline and follow-up of 0.5, we determined that a sample size of 34 subjects was required to detect a 0.5% change in baseline HbA1c level at 12 weeks. A t test (or Wilcoxon signed rank test if outcome not normally distributed) was conducted to examine whether the expected change from baseline was different from 0 for continuous outcomes. Median change from baseline was reported for SCr as a nonparametric t test (Wilcoxon signed rank test) was used.
Results
We identified 110 patients for possible study inclusion and 39 met eligibility criteria. After record review, 30 patients were excluded for receiving < 12 weeks of combination therapy or no 12 week HbA1c level; 26 patients were excluded for receiving < 12 weeks of monotherapy before starting combination therapy or no baseline HbA1c level; and 15 patients were excluded for lack of documentation in the VA EHR. Of the 39 patients included, 24 (62%) were prescribed empagliflozin first and then 8 started liraglutide and 16 started semaglutide. 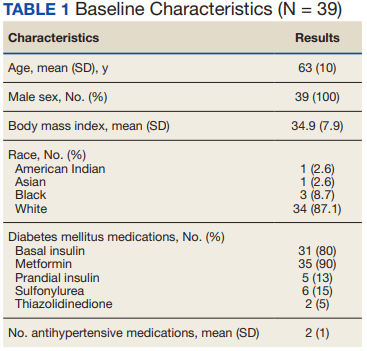
HbA1c levels decreased by 1% after 12 weeks of combination therapy compared with baseline (P < .001), and this reduction was sustained through the duration of the study period (Table 2). 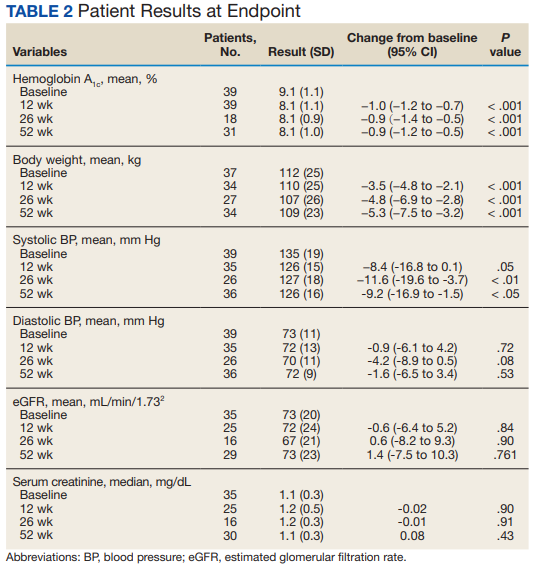
The most common AE during the trial was hypoglycemia, which was mostly mild (level 1) (Table 3). 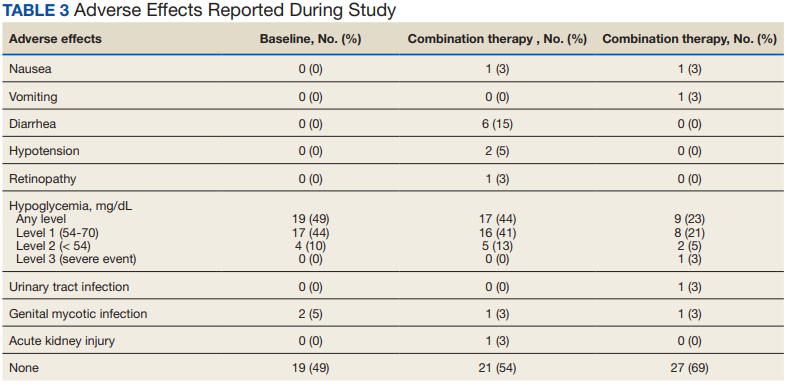
Discussion
This study evaluated the safety and efficacy of combined use of semaglutide or liraglutide and empagliflozin in a veteran population with T2DM. The retrospective chart review captured real-world practice and outcomes. Combination therapy was associated with a significant reduction in HbA1c levels, body weight, and SBP compared with either agent alone. No significant change was seen in DBP, SCr, or eGFR. Overall, the combination of GLP-1 RA and SGLT2i medications demonstrated a good safety profile with most patients reporting no AEs.
Several other studies have assessed the safety and efficacy of using GLP-1 RA and SGLT2i in combination. The DURATION 8 trial is the only double-blind trial to randomize subjects to receive either exenatide once weekly, dapagliflozin, or the combination of both for up to 52 weeks.3 Other controlled trials required stable background therapy with either SGLT2i or GLP-1 RA before randomization to receive the other class or placebo and had durations between 18 and 30 weeks.4-7 The AWARD 10 trial studied the combination of canagliflozin and dulaglutide, which both have proven CVD benefit.4 Other studies did not restrict SGLT2i or GLP-1 RA background therapy to agents with proven CVD benefit.5-7 The present study evaluated the combination of empagliflozin plus liraglutide or semaglutide, agents that all have proven CVD benefit.
A meta-analysis of 7 trials, including those previously mentioned, was conducted to evaluate the combination of GLP-1 RA and SGLT2i.8 The combination significantly reduced HbA1c levels by 0.61% and 0.85% compared with GLP-1 RA or SGLT2i, respectively. Our trial showed greater HbA1c level reduction of 1% with combination therapy compared with either agent separately. This may have been due in part to a higher baseline HbA1c level in our real-world veteran population. The meta-analysis found the combination decreased body weight 2.6 kg and 1.5 kg compared with GLP-1 RA or SGLT2i, respectively.8 This only reached significance with comparison vs GLP-1 RA alone. Our study demonstrated impressive weight loss of up to about 5 kg after 26 and 52 weeks of combination therapy. This is equivalent to about 5% weight loss from baseline, which is clinically significant.9 Liraglutide and semaglutide are the GLP-1 RAs associated with the greatest weight loss, which may contribute to greater weight loss efficacy seen in the present trial.1
In our trial SBP fell lower compared with the meta-analysis. Combination therapy significantly reduced SBP by 4.1 mm Hg and 2.7 mm Hg compared with GLP-1 RA or SGLT2i, respectively, in the meta-analysis.8 We observed a significant 9 to 12 mm Hg reduction in SBP after 26 to 52 weeks of combination therapy compared with baseline. This reduction occurred despite relatively controlled SBP at baseline (135 mm Hg). Each reduction of 10 mm Hg in SBP significantly reduces the risk of MACE, stroke, and heart failure, making our results clinically significant.10 Neither the meta-analysis nor present study found a significant difference in DBP or eGFR with combination therapy.
AEs were similar in this trial compared with the meta-analysis. Combination treatment with GLP-1 RA and SGLT2i did not increase the incidence of severe hypoglycemia in either study.8 Hypoglycemia was the most common AE in this study, but frequency was similar with combination and separate therapy. Both medication classes are associated with low or no risk of hypoglycemia on their own.1 Baseline medications likely contributed to episodes of hypoglycemia seen in this study: About 80% of patients were prescribed basal insulin, 15% were prescribed a sulfonylurea, and 13% were prescribed prandial insulin. There is limited overlap between the known AEs of GLP-1 RA and SGLT2i, making combination therapy a safe option for use in patients with T2DM.
Our study confirms greater reduction in HbA1c levels, weight, and SBP in veterans taking GLP-1 RA and SGLT2i medications in combination compared with separate use in a real-world setting in a veteran population. The magnitude of change seen in this population appears greater compared with previous studies.
Limitations
There were several limitations to our study. Given the retrospective nature, many patients included in the study did not have bloodwork drawn during the specified time frames. Because of this, many patients were excluded and missing data on renal outcomes limited the power to detect differences. Data regarding AEs were limited to what was recorded in the EHR, which may underrepresent the AEs that patients experienced. Finally, our study size was small, consisting primarily of a White and male population, which may limit generalizability.
Further research is needed to validate these findings in this population and should include a larger study population. The impact of combining GLP-1 RA with SGLT2i on cardiorenal outcomes is an important area of ongoing research.
ConclusionS
The combined use of GLP-1 RA and SGLT2i resulted in significant improvement in HbA1c levels, weight, and SBP compared with separate use in this real-world study of a VA population with T2DM. The combination was well tolerated overall. Awareness of these results can facilitate optimal care and outcomes in the VA population.
Acknowledgments
Serena Kelley, PharmD, and Michael Brenner, PharmD, assisted with study design and initial data collection. Julie Strominger, MS, provided statistical support.
1. American Diabetes Association. 9. Pharmacologic approaches to glycemic treatment: standards of medical care in diabetes-2021. Diabetes Care. 2021;44(suppl 1):S111-S124. doi.10.2337/dc21-S009
2. DeFronzo RA. Combination therapy with GLP-1 receptor agonist and SGLT2 inhibitor. Diabetes Obes Metab. 2017;19(10):1353-1362. doi.10.1111/dom.12982
3. Jabbour S, Frias J, Guja C, Hardy E, Ahmed A, Ohman P. Effects of exenatide once weekly plus dapagliflozin, exenatide once weekly, or dapagliflozin, added to metformin monotherapy, on body weight, systolic blood pressure, and triglycerides in patients with type 2 diabetes in the DURATION-8 study. Diabetes Obes Metab. 2018;20(6):1515-1519. doi:10.1111/dom.13206
4. Ludvik B, Frias J, Tinahones F, et al. Dulaglutide as add-on therapy to SGLT2 inhibitors in patients with inadequately controlled type 2 diabetes (AWARD-10): a 24-week, randomised, double-blind, placebo-controlled trial. Lancet Diabetes Endocrinol. 2018;6(5):370-381. doi:10.1016/S2213-8587(18)30023-8
5. Blonde L, Belousova L, Fainberg U, et al. Liraglutide as add-on to sodium-glucose co-transporter-2 inhibitors in patients with inadequately controlled type 2 diabetes: LIRA-ADD2SGLT2i, a 26-week, randomized, double-blind, placebo-controlled trial. Diabetes Obes Metab. 2020;22(6):929-937. doi:10.1111/dom.13978
6. Fulcher G, Matthews D, Perkovic V, et al; CANVAS trial collaborative group. Efficacy and safety of canagliflozin when used in conjunction with incretin-mimetic therapy in patients with type 2 diabetes. Diabetes Obes Metab. 2016;18(1):82-91. doi:10.1111/dom.12589
7. Zinman B, Bhosekar V, Busch R, et al. Semaglutide once weekly as add-on to SGLT-2 inhibitor therapy in type 2 diabetes (SUSTAIN 9): a randomised, placebo-controlled trial. Lancet Diabetes Endocrinol. 2019;7(5):356-367. doi:10.1016/S2213-8587(19)30066-X
8. Mantsiou C, Karagiannis T, Kakotrichi P, et al. Glucagon-like peptide-1 receptor agonists and sodium-glucose co-transporter-2 inhibitors as combination therapy for type 2 diabetes: a systematic review and meta-analysis. Diabetes Obes Metab. 2020;22(10):1857-1868. doi:10.1111/dom.14108
9. US Department of Veterans Affairs, Department of Defense. VA/DoD clinical practice guideline for the management of adult overweight and obesity. Version 3.0. Accessed August 18, 2022. www.healthquality.va.gov/guidelines/CD/obesity/VADoDObesityCPGFinal5087242020.pdf
10. Ettehad D, Emdin CA, Kiran A, et al. Blood pressure lowering for prevention of cardiovascular disease and death: a systematic review and meta-analysis. Lancet. 2015;387(10022):957-967. doi.10.1016/S0140-6736(15)01225-8
Selecting the best medication regimen for a patient with type 2 diabetes mellitus (T2DM) depends on many factors, such as glycemic control, adherence, adverse effect (AE) profile, and comorbid conditions.1 Selected agents from 2 newer medication classes, glucagon-like peptide 1 receptor agonists (GLP-1 RA) and sodium-glucose cotransporter 2 inhibitors (SGLT2i), have demonstrated cardiovascular and renal protective properties, creating a new paradigm in management.
The American Diabetes Association recommends medications with proven benefit in cardiovascular disease (CVD), such as the GLP-1 RAs liraglutide, injectable semaglutide, or dulaglutide, or the SGLT2i empagliflozin or canagliflozin, as second-line after metformin in patients with established atherosclerotic CVD or indicators of high risk to reduce the risk of major adverse cardiovascular events (MACE).1 SGLT2i are preferred in patients with diabetic kidney disease, and GLP-1 RAs are next in line for selection of agents with proven nephroprotection (liraglutide, injectable semaglutide, dulaglutide). The mechanisms of these benefits are not fully understood but may be due to their extraglycemic effects. The classes likely induce these benefits by different mechanisms: SGLT2i by hemodynamic effects and GLP-1 RAs by anti-inflammatory mechanisms.2 Although there is much interest, evidence is limited regarding the cardiovascular and renal protection benefits of these agents used in combination.
The combined use of GLP-1 RA and SGLT2i agents demonstrated greater benefit than separate use in trials with nonveteran populations.3-7 These studies evaluated effects on hemoglobin A1c (HbA1c) levels, weight loss, blood pressure (BP), and estimated glomerular filtration rate (eGFR).A meta-analysis of 7 trials found that the combination of GLP-1 RA and SGLT2i reduced HbA1c levels, body weight, and systolic blood pressure (SBP).8 All of the changes were statistically significant except for body weight with combination vs SGLT2i alone. Combination therapy was not associated with increased risk of severe hypoglycemia compared with either therapy separately.
The purpose of our study was to evaluate the safety and efficacy of the combined use of GLP-1 RA and SGLT2i in a real-world, US Department of Veterans Affairs (VA) population with T2DM.
Methods
This study was a pre-post, retrospective, single-center chart review. Subjects served as their own control. The project was reviewed and approved by the VA Ann Arbor Healthcare System Institutional Review Board. Subjects prescribed both a GLP-1 RA (semaglutide or liraglutide) and SGLT2i (empagliflozin) between January 1, 2014, and November 10, 2019, were extracted from the Corporate Data Warehouse (CDW) for possible inclusion in the study.
Patients were excluded if they received < 12 weeks of combination GLP-1 RA and SGLT2i therapy or did not have a corresponding 12-week HbA1c level. Patients also were excluded if they had < 12 weeks of monotherapy before starting combination therapy or did not have a baseline HbA1c level, or if the start date of combination therapy was not recorded in the VA electronic health record (EHR). We reviewed data for each patient from 6 months before to 1 year after the second agent was started. Start of the first agent (GLP-1 RA or SGLT2i) was recorded as the date the prescription was picked up in-person or 7 days after release date if mailed to the patient. Start of the second agent (GLP-1 RA or SGLT2i) was defined as baseline and was the date the prescription was picked up in person or 7 days after the release date if mailed.
Baseline measures were taken anytime from 8 weeks after the start of the first agent through 2 weeks after the start of the second agent. Data collected included age, sex, race, height, weight, BP, HbA1c levels, serum creatinine (SCr), eGFR, classes of medications for the treatment of T2DM, and the number of prescribed antihypertensive medications. HbA1c levels, SCr, eGFR, weight, and BP also were collected at 12 weeks (within 8-21 weeks); 26 weeks (within 22-35 weeks); and 52 weeks (within 36-57 weeks) of combination therapy. We reviewed progress notes and laboratory results to determine AEs within 26 weeks before initiating second agent (baseline) and 0 to 26 weeks and 26 to 52 weeks after initiating combination therapy.
The primary objective was to determine the effect on HbA1c levels at 12 weeks when using a GLP-1 RA and SGLT2i in combination vs separately. Secondary objectives were to determine change from baseline in mean body weight, BP, SCr, and eGFR at 12, 26, and 52 weeks; change in HbA1c levels at 26 and 52 weeks; and incidence of prespecified adverse drug reactions during combination therapy vs separately.
Statistical Analysis
Assuming a SD of 1, 80% power, significance level of P < .05, 2-sided test, and a correlation between baseline and follow-up of 0.5, we determined that a sample size of 34 subjects was required to detect a 0.5% change in baseline HbA1c level at 12 weeks. A t test (or Wilcoxon signed rank test if outcome not normally distributed) was conducted to examine whether the expected change from baseline was different from 0 for continuous outcomes. Median change from baseline was reported for SCr as a nonparametric t test (Wilcoxon signed rank test) was used.
Results
We identified 110 patients for possible study inclusion and 39 met eligibility criteria. After record review, 30 patients were excluded for receiving < 12 weeks of combination therapy or no 12 week HbA1c level; 26 patients were excluded for receiving < 12 weeks of monotherapy before starting combination therapy or no baseline HbA1c level; and 15 patients were excluded for lack of documentation in the VA EHR. Of the 39 patients included, 24 (62%) were prescribed empagliflozin first and then 8 started liraglutide and 16 started semaglutide.
HbA1c levels decreased by 1% after 12 weeks of combination therapy compared with baseline (P < .001), and this reduction was sustained through the duration of the study period (Table 2).
The most common AE during the trial was hypoglycemia, which was mostly mild (level 1) (Table 3).
Discussion
This study evaluated the safety and efficacy of combined use of semaglutide or liraglutide and empagliflozin in a veteran population with T2DM. The retrospective chart review captured real-world practice and outcomes. Combination therapy was associated with a significant reduction in HbA1c levels, body weight, and SBP compared with either agent alone. No significant change was seen in DBP, SCr, or eGFR. Overall, the combination of GLP-1 RA and SGLT2i medications demonstrated a good safety profile with most patients reporting no AEs.
Several other studies have assessed the safety and efficacy of using GLP-1 RA and SGLT2i in combination. The DURATION 8 trial is the only double-blind trial to randomize subjects to receive either exenatide once weekly, dapagliflozin, or the combination of both for up to 52 weeks.3 Other controlled trials required stable background therapy with either SGLT2i or GLP-1 RA before randomization to receive the other class or placebo and had durations between 18 and 30 weeks.4-7 The AWARD 10 trial studied the combination of canagliflozin and dulaglutide, which both have proven CVD benefit.4 Other studies did not restrict SGLT2i or GLP-1 RA background therapy to agents with proven CVD benefit.5-7 The present study evaluated the combination of empagliflozin plus liraglutide or semaglutide, agents that all have proven CVD benefit.
A meta-analysis of 7 trials, including those previously mentioned, was conducted to evaluate the combination of GLP-1 RA and SGLT2i.8 The combination significantly reduced HbA1c levels by 0.61% and 0.85% compared with GLP-1 RA or SGLT2i, respectively. Our trial showed greater HbA1c level reduction of 1% with combination therapy compared with either agent separately. This may have been due in part to a higher baseline HbA1c level in our real-world veteran population. The meta-analysis found the combination decreased body weight 2.6 kg and 1.5 kg compared with GLP-1 RA or SGLT2i, respectively.8 This only reached significance with comparison vs GLP-1 RA alone. Our study demonstrated impressive weight loss of up to about 5 kg after 26 and 52 weeks of combination therapy. This is equivalent to about 5% weight loss from baseline, which is clinically significant.9 Liraglutide and semaglutide are the GLP-1 RAs associated with the greatest weight loss, which may contribute to greater weight loss efficacy seen in the present trial.1
In our trial SBP fell lower compared with the meta-analysis. Combination therapy significantly reduced SBP by 4.1 mm Hg and 2.7 mm Hg compared with GLP-1 RA or SGLT2i, respectively, in the meta-analysis.8 We observed a significant 9 to 12 mm Hg reduction in SBP after 26 to 52 weeks of combination therapy compared with baseline. This reduction occurred despite relatively controlled SBP at baseline (135 mm Hg). Each reduction of 10 mm Hg in SBP significantly reduces the risk of MACE, stroke, and heart failure, making our results clinically significant.10 Neither the meta-analysis nor present study found a significant difference in DBP or eGFR with combination therapy.
AEs were similar in this trial compared with the meta-analysis. Combination treatment with GLP-1 RA and SGLT2i did not increase the incidence of severe hypoglycemia in either study.8 Hypoglycemia was the most common AE in this study, but frequency was similar with combination and separate therapy. Both medication classes are associated with low or no risk of hypoglycemia on their own.1 Baseline medications likely contributed to episodes of hypoglycemia seen in this study: About 80% of patients were prescribed basal insulin, 15% were prescribed a sulfonylurea, and 13% were prescribed prandial insulin. There is limited overlap between the known AEs of GLP-1 RA and SGLT2i, making combination therapy a safe option for use in patients with T2DM.
Our study confirms greater reduction in HbA1c levels, weight, and SBP in veterans taking GLP-1 RA and SGLT2i medications in combination compared with separate use in a real-world setting in a veteran population. The magnitude of change seen in this population appears greater compared with previous studies.
Limitations
There were several limitations to our study. Given the retrospective nature, many patients included in the study did not have bloodwork drawn during the specified time frames. Because of this, many patients were excluded and missing data on renal outcomes limited the power to detect differences. Data regarding AEs were limited to what was recorded in the EHR, which may underrepresent the AEs that patients experienced. Finally, our study size was small, consisting primarily of a White and male population, which may limit generalizability.
Further research is needed to validate these findings in this population and should include a larger study population. The impact of combining GLP-1 RA with SGLT2i on cardiorenal outcomes is an important area of ongoing research.
ConclusionS
The combined use of GLP-1 RA and SGLT2i resulted in significant improvement in HbA1c levels, weight, and SBP compared with separate use in this real-world study of a VA population with T2DM. The combination was well tolerated overall. Awareness of these results can facilitate optimal care and outcomes in the VA population.
Acknowledgments
Serena Kelley, PharmD, and Michael Brenner, PharmD, assisted with study design and initial data collection. Julie Strominger, MS, provided statistical support.
1. American Diabetes Association. 9. Pharmacologic approaches to glycemic treatment: standards of medical care in diabetes-2021. Diabetes Care. 2021;44(suppl 1):S111-S124. doi.10.2337/dc21-S009
2. DeFronzo RA. Combination therapy with GLP-1 receptor agonist and SGLT2 inhibitor. Diabetes Obes Metab. 2017;19(10):1353-1362. doi.10.1111/dom.12982
3. Jabbour S, Frias J, Guja C, Hardy E, Ahmed A, Ohman P. Effects of exenatide once weekly plus dapagliflozin, exenatide once weekly, or dapagliflozin, added to metformin monotherapy, on body weight, systolic blood pressure, and triglycerides in patients with type 2 diabetes in the DURATION-8 study. Diabetes Obes Metab. 2018;20(6):1515-1519. doi:10.1111/dom.13206
4. Ludvik B, Frias J, Tinahones F, et al. Dulaglutide as add-on therapy to SGLT2 inhibitors in patients with inadequately controlled type 2 diabetes (AWARD-10): a 24-week, randomised, double-blind, placebo-controlled trial. Lancet Diabetes Endocrinol. 2018;6(5):370-381. doi:10.1016/S2213-8587(18)30023-8
5. Blonde L, Belousova L, Fainberg U, et al. Liraglutide as add-on to sodium-glucose co-transporter-2 inhibitors in patients with inadequately controlled type 2 diabetes: LIRA-ADD2SGLT2i, a 26-week, randomized, double-blind, placebo-controlled trial. Diabetes Obes Metab. 2020;22(6):929-937. doi:10.1111/dom.13978
6. Fulcher G, Matthews D, Perkovic V, et al; CANVAS trial collaborative group. Efficacy and safety of canagliflozin when used in conjunction with incretin-mimetic therapy in patients with type 2 diabetes. Diabetes Obes Metab. 2016;18(1):82-91. doi:10.1111/dom.12589
7. Zinman B, Bhosekar V, Busch R, et al. Semaglutide once weekly as add-on to SGLT-2 inhibitor therapy in type 2 diabetes (SUSTAIN 9): a randomised, placebo-controlled trial. Lancet Diabetes Endocrinol. 2019;7(5):356-367. doi:10.1016/S2213-8587(19)30066-X
8. Mantsiou C, Karagiannis T, Kakotrichi P, et al. Glucagon-like peptide-1 receptor agonists and sodium-glucose co-transporter-2 inhibitors as combination therapy for type 2 diabetes: a systematic review and meta-analysis. Diabetes Obes Metab. 2020;22(10):1857-1868. doi:10.1111/dom.14108
9. US Department of Veterans Affairs, Department of Defense. VA/DoD clinical practice guideline for the management of adult overweight and obesity. Version 3.0. Accessed August 18, 2022. www.healthquality.va.gov/guidelines/CD/obesity/VADoDObesityCPGFinal5087242020.pdf
10. Ettehad D, Emdin CA, Kiran A, et al. Blood pressure lowering for prevention of cardiovascular disease and death: a systematic review and meta-analysis. Lancet. 2015;387(10022):957-967. doi.10.1016/S0140-6736(15)01225-8
How Low Is Too Low? A Retrospective Analysis of Very Low LDL-C Levels in Veterans
According to the Centers for Disease Control and Prevention (CDC), approximately 795,000 strokes occur in the United States yearly and are the fifth leading cause of death.1 The CDC also states that about 43 million Americans who could benefit from cholesterol medication are currently taking them.2 As of 2019, West Virginia, Ohio, and Kentucky are 3 states with the highest rates of heart disease mortality.3
Low-density lipoprotein cholesterol (LDL-C) accumulates on the walls of blood vessels, which can lead to coronary heart disease. However, some LDL-C is necessary to maintain proper brain function. Guidelines from the American College of Cardiology (ACC) and American Heart Association (AHA) recommend LDL-C goal levels < 70 mg/dL.4 Yet, there is no consensus on how low LDL-C levels should be. According to clinical practice guidelines for dyslipidemia, developed by the US Department of Veterans Affairs (VA) and US Department of Defense, statin medications are first-line agents for lowering LDL-C. The intensity of the statin medication is based on primary or secondary prevention, atherosclerotic cardiovascular disease (ASCVD) risk, and current LDL-C levels prior to treatment.5
Statin medications are used for primary and secondary prevention of ASCVD. In addition, statin medications decrease total cholesterol, LDL-C, and triglycerides while causing a mild increase in high-density lipoprotein cholesterol. Although statin medications are first-line therapy for LDL-C lowering, other medications can be used to assist in decreasing LDL-C. Ezetimibe, fenofibrates, and proprotein convertase subtilisin/kexin type 9 (PCSK9) inhibitors can also be used.5 Statin medications do pose a risk of severe adverse drug reactions (ADRs), such as rhabdomyolysis and myopathy.6
One prospective cohort study looked at 27,937 women and analyzed total cholesterol, LDL-C, high-density lipoprotein cholesterol, triglycerides, and strokes. The study noted a mean 19.3-year follow-up and within that follow-up, 137 hemorrhagic strokes occurred. Based on the study’s results, LDL-C levels < 70 mg/dL had 2.17 times the risk of experiencing a hemorrhagic stroke.7 A meta-analysis of prospective studies analyzed 476,173 patients and 7487 hemorrhagic stroke cases. This review concluded that a 10 mg/dL increase in LDL-C was associated with a 3% lower risk of hemorrhagic stroke.8
An observational study conducted in Asia of Chinese adults found that 22% of all strokes were hemorrhagic. The incidence of the hemorrhagic strokes was higher for patients who had an LDL-C < 1.8 mmol/L than those who had an LDL-C between 1.8 and 2.6 mmol/L. This study also showed that if hypertension was inadequately treated, the risk of hemorrhagic stroke increased. This study concluded that the benefit of reducing ASCVD outweighs the small risk of hemorrhagic strokes.9
Another prospective cohort study included 96,043 stroke-free participants and analyzed LDL-C concentrations and incidence of intracranial hemorrhage. The average LDL-C concentrations were calculated from data collected in 4 separate reporting years, and incidence of intracranial hemorrhage was confirmed through review of medication records. Over a 9-year follow-up period, the study concluded that participants with an LDL-C level of < 70 mg/dL had a significantly higher risk of developing intracranial hemorrhage than participants with LDL-C levels 70 to 99 mg/dL.10
The safety and effects of prolonged very low LDL-C levels are currently unknown. The current study sought to gather information to determine the risks of very low LDL-C levels in a veteran population.
Methods
A retrospective chart review was conducted on patients aged 18 to 90 years receiving care at the Hershel “Woody” Williams Veterans Affairs Medical Center (HWW VAMC) in Huntington, West Virginia, between January 1, 2010, and September 1, 2020. Approval of the current study was obtained through the Marshall University Institutional Review Board, HWW VAMC Research and Development Committee, and Veterans Health Administration (VHA) DATA Access Request Tracker (DART)/VA Informatic and Computing Infrastructure (VINCI). Data were obtained via the VHA Corporate Data Warehouse (CDW) for the HWW VAMC using Microsoft Structured Query Language (SQL) server available in VINCI. Analysis of the data was conducted using STATA v. 15.
Patients were included if they had a diagnosis of hyperlipidemia/dyslipidemia, received treatment with HMG-CoA reductase inhibitors or PCSK9 medications, and had an LDL-C level ≤ 40 mg/dL. The primary outcome was the rate of intracranial hemorrhage that could be caused by very low LDL-C levels. The secondary outcomes included actions taken by clinicians to address LDL-C level < 40 mg/dL, ADRs, duration of therapy, and medication adherence. Patients were excluded if they were aged < 18 or > 90 years, were pregnant during the study period, had hypothyroidism, received chronic anticoagulation medications, or had a triglyceride level > 300 mg/dL.
Results
The study included 3027 patients. Of those patients, 78 patients were female while 2949 were male, and the mean (SD) age was 68.3 (9.4) years. A subsample of 32 patients was analyzed to determine whether an ADR was noted or low LDL-C level was addressed in the chart. The subsample size was determined through chart review and included patients who had a documented intracranial hemorrhage. None of the 32 patients had an ADR documented, and 6 (19%) had the low LDL-C level addressed in the chart by monitoring levels, reducing statin doses, or discontinuing the medication. Of the total population analyzed, 8 patients (0.3%) had a documented intracranial hemorrhage within 1 year following the low LDL-C level.
We also analyzed the intensity of statin related to the low LDL-C level (Table 1). 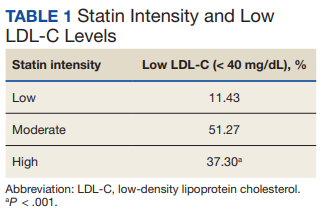
The most common ADRs were muscle, joint, and leg pain, rash, and cramps (Table 2). 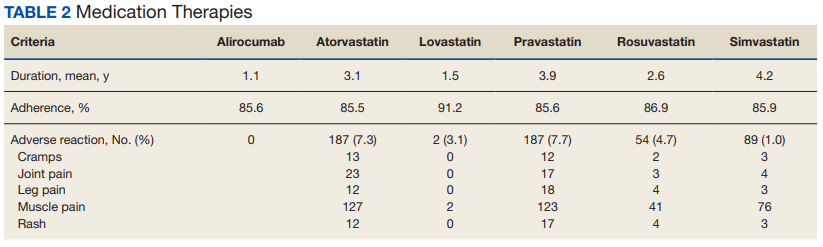
Adherence to the medications and duration of therapy was also analyzed and was found to be similar among the various medications. Lovastatin had the highest percent adherence with 91.2% while atorvastatin had the lowest with 85.5%. It can be noted that lovastatin had a lower documented percentage of ADRs while atorvastatin had a higher documented percentage of ADRs, which can be clinically meaningful when prescribing these medications; however, these similar adherence rates are not influencing the primary outcome of the rate of intracranial hemorrhage due to LDL-C level < 40 mg/dL. Mean duration of therapy lasted between 1 year and > 4 years with 1.1 years for alirocumab and 4.2 for simvastatin. The duration of therapy could be influenced by formulary restrictions during the study time. Nonetheless, patients, regardless of formulary restrictions, have taken these medications for a duration long enough to affect LDL-C levels.
Eight patients of the total sample analyzed had an intracranial hemorrhage within 1 year of having a recorded LDL-C level < 40 mg/dL. Secondarily, 32 patients had clinicians address an LDL-C level < 40 mg/dL through documentation or modifying the medication therapy. The most common ADRs among all medications analyzed were leg and joint pain, rash, and cramps. Of all medications included in this study, the mean duration of therapy was > 1 year, which would allow them to affect LDL-C levels and have those levels monitored and recorded in patients’ charts.
Discussion
When comparing our primary outcome of risk of intracranial hemorrhage with previous literature, the results are consistent with previous outcomes. Previous literature had a smaller sample size but analyzed LDL-C levels < 50 mg/dL and had an outcome of 48 patients experiencing an intracranial hemorrhage within 1 year of an LDL-C level < 50 mg/dL. Due to this study having stricter parameters of LDL-C levels < 40 mg/dL, there were fewer patients with documented intracranial hemorrhages. With there being a risk of intracranial hemorrhage with low LDL-C levels, the results demonstrate the need to monitor and address LDL-C levels.
Limitations
There were several notable limitations to this study. The retrospective, single-center nature coupled with the predominately male study population may affect the generalizability of the study results to patients outside of the facility in which the study was performed. Additionally, the study only included statin medications and PCSK9 inhibitors. With future studies, all lipid-lowering medications could be analyzed. The study was largely reliant on the proper documentation of International Statistical Classification of Diseases, Tenth Revision (ICD-10) codes exclusive to the HWW VAMC, which may exclude patients who first present to outside facilities. Due to time restraints, the incidence of hemorrhage was only analyzed 1 year following an LDL-C level < 40 mg/dL. For considerations for future investigation, the length of time to analyze incidence of hemorrhage could be expanded to be similar to previous studies, and the study could be expanded across the local Veterans Integrated Service Network or VA system. Additionally, the study could have analyzed the percentage of time a patient had an LDL-C level < 40 mg/dL in their lifetime.
Conclusions
These results show there is a risk that patients with an LDL-C level < 40 mg/dL may experience an intracranial hemorrhage. As seen by the results, there is a clinical need for practitioners to routinely monitor and address LDL-C levels. With various guidelines that recommend starting statin medication to reduce risk of ASCVD, it is necessary that practitioners routinely monitor cholesterol levels and adjust the medications according to laboratory results.11
Within 1 year of an LDL-C level < 40 mg/dL, 0.3% of patients had an intracranial hemorrhage. There was no statistical significance between the rate of ADRs among the medications analyzed. High-intensity statin medications were statistically significant in resulting in an LDL-C level < 40 mg/dL compared with moderate- and low-intensity statin medications. Of the 32 subsample of patients, LDL-C levels < 40 mg/mL are not routinely being addressed in the chart by the clinician.
1. Centers for Disease Control and Prevention. Stroke facts. Updated April 5, 2022. Accessed September 21, 2022. https://www.cdc.gov/stroke/facts.htm
2. Centers for Disease Control and Prevention. High cholesterol facts. Updated July 12, 2022. Accessed September 21, 2022. https://www.cdc.gov/cholesterol/facts.htm
3. Centers for Disease Control and Prevention. Heart disease mortality by state. Updated February 25, 2022. Accessed September 21, 2022. https://www.cdc.gov/nchs/pressroom/sosmap/heart_disease_mortality/heart_disease.htm
4. Grundy SM, Stone NJ, Bailey AL, et al. 2018 AHA/ACC/AACVPR/AAPA/ABC/ACPM/ADA/AGS/APhA/ASPC/NLA/PCNA Guideline on the Management of Blood Cholesterol: A Report of the American College of Cardiology/American Heart Association Task Force on Clinical Practice Guidelines. Circulation. 2019;139(25):e1082-e1143. doi:10.1161/CIR.0000000000000625
5. US Department of Veterans Affairs, US Department of Defense. VA/DoD Clinical Practice Guideline for the Management of Dyslipidemia for Cardiovascular Risk Reduction. Version 4.0. US Department of Veterans Affairs. June 2020. Accessed September 21, 2022. https://www.healthquality.va.gov/guidelines/CD/lipids/VADoDDyslipidemiaCPG5087212020.pdf
6. Tomaszewski M, Ste¸pien´ KM, Tomaszewska J, Czuczwar SJ. Statin-induced myopathies. Pharmacol Rep. 2011;63(4):859-66. doi:10.1016/s1734-1140(11)70601-6
7. Rist PM, Buring JE, Ridker PM, Kase CS, Kurth T, Rexrode KM. Lipid levels and the risk of hemorrhagic stroke among women. Neurology. 2019;92(19):e2286-e2294. doi:10.1212/WNL.0000000000007454
8. Ma C, Na M, Neumann S, Gao X. Low-density lipoprotein cholesterol and risk of hemorrhagic stroke: a systematic review and dose-response meta-analysis of prospective studies. Curr Atheroscler Rep. 2019;21(12):52. Published 2019 Nov 20. doi:10.1007/s11883-019-0815-5
9. Lui DT, Tan KC. Low-density lipoprotein cholesterol and stroke: How low should we go? J Diabetes Investig. 2020;11(6):1379-1381. doi:10.1111/jdi.13310
10. Ma C, Gurol ME, Huang Z, et al. Low-density lipoprotein cholesterol and risk of intracerebral hemorrhage: a prospective study. Neurology. 2019;93(5):e445-e457. doi:10.1212/WNL.0000000000007853
11. American Diabetes Association Professional Practice Committee. 10. Cardiovascular disease and risk management: standards of medical care in diabetes—2022. Diabetes Care. 2022;45(suppl 1):S144–S174. doi:10.2337/dc22-S010
According to the Centers for Disease Control and Prevention (CDC), approximately 795,000 strokes occur in the United States yearly and are the fifth leading cause of death.1 The CDC also states that about 43 million Americans who could benefit from cholesterol medication are currently taking them.2 As of 2019, West Virginia, Ohio, and Kentucky are 3 states with the highest rates of heart disease mortality.3
Low-density lipoprotein cholesterol (LDL-C) accumulates on the walls of blood vessels, which can lead to coronary heart disease. However, some LDL-C is necessary to maintain proper brain function. Guidelines from the American College of Cardiology (ACC) and American Heart Association (AHA) recommend LDL-C goal levels < 70 mg/dL.4 Yet, there is no consensus on how low LDL-C levels should be. According to clinical practice guidelines for dyslipidemia, developed by the US Department of Veterans Affairs (VA) and US Department of Defense, statin medications are first-line agents for lowering LDL-C. The intensity of the statin medication is based on primary or secondary prevention, atherosclerotic cardiovascular disease (ASCVD) risk, and current LDL-C levels prior to treatment.5
Statin medications are used for primary and secondary prevention of ASCVD. In addition, statin medications decrease total cholesterol, LDL-C, and triglycerides while causing a mild increase in high-density lipoprotein cholesterol. Although statin medications are first-line therapy for LDL-C lowering, other medications can be used to assist in decreasing LDL-C. Ezetimibe, fenofibrates, and proprotein convertase subtilisin/kexin type 9 (PCSK9) inhibitors can also be used.5 Statin medications do pose a risk of severe adverse drug reactions (ADRs), such as rhabdomyolysis and myopathy.6
One prospective cohort study looked at 27,937 women and analyzed total cholesterol, LDL-C, high-density lipoprotein cholesterol, triglycerides, and strokes. The study noted a mean 19.3-year follow-up and within that follow-up, 137 hemorrhagic strokes occurred. Based on the study’s results, LDL-C levels < 70 mg/dL had 2.17 times the risk of experiencing a hemorrhagic stroke.7 A meta-analysis of prospective studies analyzed 476,173 patients and 7487 hemorrhagic stroke cases. This review concluded that a 10 mg/dL increase in LDL-C was associated with a 3% lower risk of hemorrhagic stroke.8
An observational study conducted in Asia of Chinese adults found that 22% of all strokes were hemorrhagic. The incidence of the hemorrhagic strokes was higher for patients who had an LDL-C < 1.8 mmol/L than those who had an LDL-C between 1.8 and 2.6 mmol/L. This study also showed that if hypertension was inadequately treated, the risk of hemorrhagic stroke increased. This study concluded that the benefit of reducing ASCVD outweighs the small risk of hemorrhagic strokes.9
Another prospective cohort study included 96,043 stroke-free participants and analyzed LDL-C concentrations and incidence of intracranial hemorrhage. The average LDL-C concentrations were calculated from data collected in 4 separate reporting years, and incidence of intracranial hemorrhage was confirmed through review of medication records. Over a 9-year follow-up period, the study concluded that participants with an LDL-C level of < 70 mg/dL had a significantly higher risk of developing intracranial hemorrhage than participants with LDL-C levels 70 to 99 mg/dL.10
The safety and effects of prolonged very low LDL-C levels are currently unknown. The current study sought to gather information to determine the risks of very low LDL-C levels in a veteran population.
Methods
A retrospective chart review was conducted on patients aged 18 to 90 years receiving care at the Hershel “Woody” Williams Veterans Affairs Medical Center (HWW VAMC) in Huntington, West Virginia, between January 1, 2010, and September 1, 2020. Approval of the current study was obtained through the Marshall University Institutional Review Board, HWW VAMC Research and Development Committee, and Veterans Health Administration (VHA) DATA Access Request Tracker (DART)/VA Informatic and Computing Infrastructure (VINCI). Data were obtained via the VHA Corporate Data Warehouse (CDW) for the HWW VAMC using Microsoft Structured Query Language (SQL) server available in VINCI. Analysis of the data was conducted using STATA v. 15.
Patients were included if they had a diagnosis of hyperlipidemia/dyslipidemia, received treatment with HMG-CoA reductase inhibitors or PCSK9 medications, and had an LDL-C level ≤ 40 mg/dL. The primary outcome was the rate of intracranial hemorrhage that could be caused by very low LDL-C levels. The secondary outcomes included actions taken by clinicians to address LDL-C level < 40 mg/dL, ADRs, duration of therapy, and medication adherence. Patients were excluded if they were aged < 18 or > 90 years, were pregnant during the study period, had hypothyroidism, received chronic anticoagulation medications, or had a triglyceride level > 300 mg/dL.
Results
The study included 3027 patients. Of those patients, 78 patients were female while 2949 were male, and the mean (SD) age was 68.3 (9.4) years. A subsample of 32 patients was analyzed to determine whether an ADR was noted or low LDL-C level was addressed in the chart. The subsample size was determined through chart review and included patients who had a documented intracranial hemorrhage. None of the 32 patients had an ADR documented, and 6 (19%) had the low LDL-C level addressed in the chart by monitoring levels, reducing statin doses, or discontinuing the medication. Of the total population analyzed, 8 patients (0.3%) had a documented intracranial hemorrhage within 1 year following the low LDL-C level.
We also analyzed the intensity of statin related to the low LDL-C level (Table 1).
The most common ADRs were muscle, joint, and leg pain, rash, and cramps (Table 2).
Adherence to the medications and duration of therapy was also analyzed and was found to be similar among the various medications. Lovastatin had the highest percent adherence with 91.2% while atorvastatin had the lowest with 85.5%. It can be noted that lovastatin had a lower documented percentage of ADRs while atorvastatin had a higher documented percentage of ADRs, which can be clinically meaningful when prescribing these medications; however, these similar adherence rates are not influencing the primary outcome of the rate of intracranial hemorrhage due to LDL-C level < 40 mg/dL. Mean duration of therapy lasted between 1 year and > 4 years with 1.1 years for alirocumab and 4.2 for simvastatin. The duration of therapy could be influenced by formulary restrictions during the study time. Nonetheless, patients, regardless of formulary restrictions, have taken these medications for a duration long enough to affect LDL-C levels.
Eight patients of the total sample analyzed had an intracranial hemorrhage within 1 year of having a recorded LDL-C level < 40 mg/dL. Secondarily, 32 patients had clinicians address an LDL-C level < 40 mg/dL through documentation or modifying the medication therapy. The most common ADRs among all medications analyzed were leg and joint pain, rash, and cramps. Of all medications included in this study, the mean duration of therapy was > 1 year, which would allow them to affect LDL-C levels and have those levels monitored and recorded in patients’ charts.
Discussion
When comparing our primary outcome of risk of intracranial hemorrhage with previous literature, the results are consistent with previous outcomes. Previous literature had a smaller sample size but analyzed LDL-C levels < 50 mg/dL and had an outcome of 48 patients experiencing an intracranial hemorrhage within 1 year of an LDL-C level < 50 mg/dL. Due to this study having stricter parameters of LDL-C levels < 40 mg/dL, there were fewer patients with documented intracranial hemorrhages. With there being a risk of intracranial hemorrhage with low LDL-C levels, the results demonstrate the need to monitor and address LDL-C levels.
Limitations
There were several notable limitations to this study. The retrospective, single-center nature coupled with the predominately male study population may affect the generalizability of the study results to patients outside of the facility in which the study was performed. Additionally, the study only included statin medications and PCSK9 inhibitors. With future studies, all lipid-lowering medications could be analyzed. The study was largely reliant on the proper documentation of International Statistical Classification of Diseases, Tenth Revision (ICD-10) codes exclusive to the HWW VAMC, which may exclude patients who first present to outside facilities. Due to time restraints, the incidence of hemorrhage was only analyzed 1 year following an LDL-C level < 40 mg/dL. For considerations for future investigation, the length of time to analyze incidence of hemorrhage could be expanded to be similar to previous studies, and the study could be expanded across the local Veterans Integrated Service Network or VA system. Additionally, the study could have analyzed the percentage of time a patient had an LDL-C level < 40 mg/dL in their lifetime.
Conclusions
These results show there is a risk that patients with an LDL-C level < 40 mg/dL may experience an intracranial hemorrhage. As seen by the results, there is a clinical need for practitioners to routinely monitor and address LDL-C levels. With various guidelines that recommend starting statin medication to reduce risk of ASCVD, it is necessary that practitioners routinely monitor cholesterol levels and adjust the medications according to laboratory results.11
Within 1 year of an LDL-C level < 40 mg/dL, 0.3% of patients had an intracranial hemorrhage. There was no statistical significance between the rate of ADRs among the medications analyzed. High-intensity statin medications were statistically significant in resulting in an LDL-C level < 40 mg/dL compared with moderate- and low-intensity statin medications. Of the 32 subsample of patients, LDL-C levels < 40 mg/mL are not routinely being addressed in the chart by the clinician.
1. Centers for Disease Control and Prevention. Stroke facts. Updated April 5, 2022. Accessed September 21, 2022. https://www.cdc.gov/stroke/facts.htm
2. Centers for Disease Control and Prevention. High cholesterol facts. Updated July 12, 2022. Accessed September 21, 2022. https://www.cdc.gov/cholesterol/facts.htm
3. Centers for Disease Control and Prevention. Heart disease mortality by state. Updated February 25, 2022. Accessed September 21, 2022. https://www.cdc.gov/nchs/pressroom/sosmap/heart_disease_mortality/heart_disease.htm
4. Grundy SM, Stone NJ, Bailey AL, et al. 2018 AHA/ACC/AACVPR/AAPA/ABC/ACPM/ADA/AGS/APhA/ASPC/NLA/PCNA Guideline on the Management of Blood Cholesterol: A Report of the American College of Cardiology/American Heart Association Task Force on Clinical Practice Guidelines. Circulation. 2019;139(25):e1082-e1143. doi:10.1161/CIR.0000000000000625
5. US Department of Veterans Affairs, US Department of Defense. VA/DoD Clinical Practice Guideline for the Management of Dyslipidemia for Cardiovascular Risk Reduction. Version 4.0. US Department of Veterans Affairs. June 2020. Accessed September 21, 2022. https://www.healthquality.va.gov/guidelines/CD/lipids/VADoDDyslipidemiaCPG5087212020.pdf
6. Tomaszewski M, Ste¸pien´ KM, Tomaszewska J, Czuczwar SJ. Statin-induced myopathies. Pharmacol Rep. 2011;63(4):859-66. doi:10.1016/s1734-1140(11)70601-6
7. Rist PM, Buring JE, Ridker PM, Kase CS, Kurth T, Rexrode KM. Lipid levels and the risk of hemorrhagic stroke among women. Neurology. 2019;92(19):e2286-e2294. doi:10.1212/WNL.0000000000007454
8. Ma C, Na M, Neumann S, Gao X. Low-density lipoprotein cholesterol and risk of hemorrhagic stroke: a systematic review and dose-response meta-analysis of prospective studies. Curr Atheroscler Rep. 2019;21(12):52. Published 2019 Nov 20. doi:10.1007/s11883-019-0815-5
9. Lui DT, Tan KC. Low-density lipoprotein cholesterol and stroke: How low should we go? J Diabetes Investig. 2020;11(6):1379-1381. doi:10.1111/jdi.13310
10. Ma C, Gurol ME, Huang Z, et al. Low-density lipoprotein cholesterol and risk of intracerebral hemorrhage: a prospective study. Neurology. 2019;93(5):e445-e457. doi:10.1212/WNL.0000000000007853
11. American Diabetes Association Professional Practice Committee. 10. Cardiovascular disease and risk management: standards of medical care in diabetes—2022. Diabetes Care. 2022;45(suppl 1):S144–S174. doi:10.2337/dc22-S010
Assessment of Glucagon-like Peptide-1 Receptor Agonists in Veterans Taking Basal/Bolus Insulin Regimens
In 2019, diabetes mellitus (DM) was the seventh leading cause of death in the United States, and currently, about 11% of the American population has a DM diagnosis.1 Most have a diagnosis of type 2 diabetes (T2DM), which has a strong genetic predisposition, and the risk of developing T2DM increases with age, obesity, and lack of physical activity.1,2 Nearly one-quarter of veterans have a diagnosis of DM, and DM is the leading cause of comorbidities, such as blindness, end-stage renal disease, and amputation for patients receiving care from the Veterans Health Administration (VHA).2 The elevated incidence of DM in the veteran population is attributed to a variety of factors, including exposure to herbicides, such as Agent Orange, advanced age, increased risk of obesity, and limited access to high-quality food.3
After diagnosis, both the American Diabetes Association (ADA) and the American Association of Clinical Endocrinologists and American College of Endocrinology (AACE/ACE) emphasize the appropriate use of lifestyle management and pharmacologic therapy for DM care. The use of pharmacologic agents (oral medications, insulin, or noninsulin injectables) is often determined by efficacy, cost, potential adverse effects (AEs), and patient factors and comorbidities.4,5
The initial recommendation for pharmacologic treatment for T2DM differs slightly between expert guidelines. The ADA and AACE/ACE recommend any of the following as initial monotherapy, listed in order to represent a hierarchy of usage: metformin, glucagon-like peptide-1 receptor agonists (GLP-1 RAs), sodium-glucose cotransporter 2 (SGLT-2) inhibitors, or dipeptidyl peptidase-4 (DPP-4) inhibitors, with the first 3 agents carrying the strongest recommendations.4,5 For patients with established atherosclerotic cardiovascular disease (CVD), chronic kidney disease, or heart failure, it is recommended to start a long-acting GLP-1 RA or SGLT-2 inhibitor. For patients with T2DM and hemoglobin A1c (HbA1c) between 7.5% and 9.0% at diagnosis, the AACE/ACE recommend initiation of dual therapy using metformin alongside another first-line agent and recommend the addition of another antidiabetic agent if glycemic goals are not met after regular follow-up. AACE/ACE recommend the consideration of insulin therapy in symptomatic patients with HbA1c > 9.0%.5 In contrast, the ADA recommends metformin as first-line therapy for all patients with T2DM and recommends dual therapy using metformin and another preferred agent (selection based on comorbidities) when HbA1c is 1.5% to 2% above target. The ADA recommends the consideration of insulin with HbA1c > 10% or with evidence of ongoing catabolism or symptoms of hyperglycemia.4 There are several reasons why insulin may be initiated prior to GLP-1 RAs, including profound hyperglycemia at time of diagnosis or implementation of insulin agents prior to commercial availability of GLP-1 RA.
GLP-1 RAs are analogs of the hormone incretin, which increases glucose-dependent insulin secretion, decreases postprandial glucagon secretion, increases satiety, and slows gastric emptying.6,7 When used in combination with noninsulin agents, GLP-1 RAs have demonstrated HbA1c reductions of 0.5% to 1.5%.8 The use of GLP-1 RAs with basal insulin also has been studied extensively.6,8-10 When the combination of GLP-1 RAs and basal insulin was compared with basal/bolus insulin regimens, the use of the GLP-1 RAs resulted in lower HbA1c levels and lower incidence of hypoglycemia.6,9 Data have demonstrated the complementary mechanisms of using basal insulin and GLP 1 RAs in decreasing HbA1c levels, insulin requirements, and weight compared with using basal insulin monotherapy and basal/bolus combinations.6,9-13 Moreover, 3 GLP-1 RA medications currently on the market (liraglutide, dulaglutide, and semaglutide) have displayed cardiovascular and renal benefits, further supporting the use of these medications.2,5
Despite these benefits, GLP-1 RAs may have bothersome AEs and are associated with a high cost.6 In addition, some studies have found that as the length of therapy increases, the positive effects of these agents may diminish.9,11 In one study, which looked at the impact of the addition of exenatide to patients taking basal or basal/bolus insulin regimens, mean changes in weight were −2.4 kg at 0 to 6 months, −4.3 kg at 6 to 12 months, −6.2 kg at 12 to 18 months, and −5.5 kg at 18 to 27 months. After 18 months, an increase in weight was observed, but the increase remained lower than baseline.11 Another study, conducted over 12 months, found no significant decrease in weight or total daily dose (TDD) of insulin when exenatide or liraglutide were added to various insulin regimens (basal or basal/bolus).13 To date, minimal published data exist regarding the addition of newer GLP-1 RAs and the long-term use of these agents beyond 12 months in patients taking basal/bolus insulin regimens. The primary goal of this study was to evaluate the effect of adding GLP-1 RAs to basal/bolus insulin regimens over a 24-month period.
Methods
This study was a retrospective, electronic health record review of all patients on basal and bolus insulin regimens who received additional therapy with a GLP-1 RA at Veteran Health Indiana in Indianapolis from September 1, 2015, to June 30, 2019. Patients meeting inclusion criteria served as their own control. The primary outcome was change in HbA1c at 3, 6, 12, 18, and 24 months after initiation of the GLP-1 RA. Secondary outcomes included change in weight and TDD of insulin at 3, 6, 12, 18, and 24 months after the initiation of the GLP-1 RAs and incidence of patient-reported or laboratory-confirmed hypoglycemia and other AEs.
Patients were included if they were aged ≥ 18 years with a diagnosis of T2DM, had concomitant prescriptions for both a basal insulin (glargine, detemir, or NPH) and a bolus insulin (aspart, lispro, or regular) before receiving add-on therapy with a GLP-1 RA (exenatide, liraglutide, albiglutide, lixisenatide, dulaglutide, or semaglutide) from September 1, 2015, to June 30, 2019, and had baseline and subsequent HbA1c measurements available in the electronic health record. Patients were excluded if they had a diagnosis of type 1 DM (T1DM), were followed by an outside clinician for DM care, or if the GLP-1 RA was discontinued before subsequent HbA1c measurement. The study protocol was approved by the Research and Development Office of Veteran Health Indiana, and the project was deemed exempt from review by the Indiana University Institutional Review Board due to the retrospective nature of the study.
Data analysis was performed using Excel. Change from baseline for each interval was computed, and 1 sample t tests (2-tailed) compared change from baseline to no change. Due to the disparity in the number of patients with data available at each of the time intervals, a mean plot was presented for each group of patients within each interval, allowing mean changes in individual groups to be observed over time.
Results
One hundred twenty-three subjects met inclusion criteria; 16 patients were excluded due to GLP-1 RA discontinuation before follow-up measurement of HbA1c; 14 were excluded due to patients being managed by a clinician outside of the facility; 1 patient was excluded for lack of documentation regarding baseline and subsequent insulin doses. Ninety-two patient charts were reviewed. Participants had a mean age of 64 years, 95% were male, and 89% were White. Mean baseline HbA1c was 9.2%, mean body mass index was 38.9, and the mean TDD of insulin was 184 units. 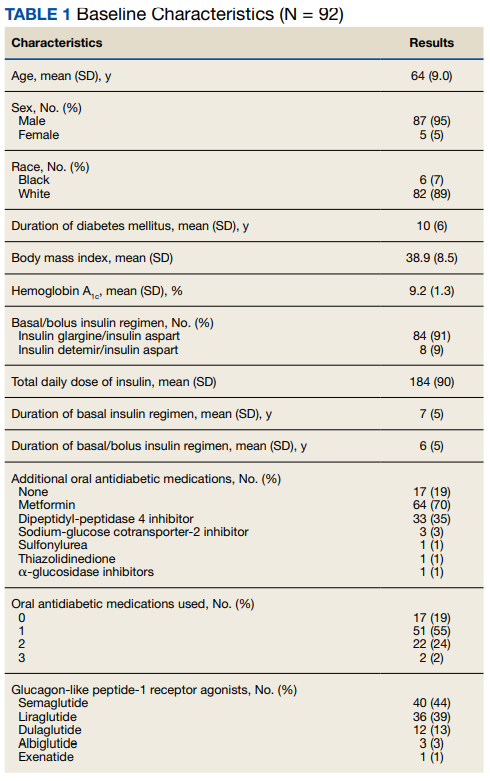
Since some patients switched between GLP-1 RAs throughout the study and there was variation in timing of laboratory and clinic follow-up, ![]()
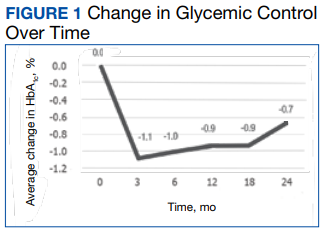
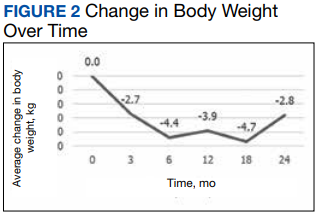
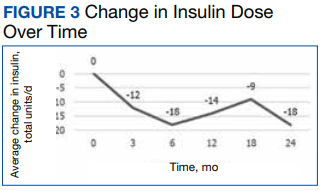
Discussion
Adding a GLP-1 RA to basal/bolus insulin regimens was associated with a statistically significant decrease in HbA1c at each time point through 18 months. The greatest improvement in glycemic control from baseline was seen at 3 months, with improvements in HbA1c diminishing at each subsequent period. The study also demonstrated a significant decrease in weight at each time point through 18 months. The greatest decrease in weight was observed at both 6 and 12 months. Statistically significant decreases in TDD were observed at 3, 6, and 12 months. Insulin changes after 12 months were not found to be statistically significant.
Few studies have previously evaluated the use of GLP-1 RAs in patients with T2DM who are already taking basal/bolus insulin regimens. Gyorffy and colleagues reported significant improvements in glycemic control at 3 and 6 months in a sample of 54 patients taking basal/bolus insulin when liraglutide or exenatide was added, although statistical significance was not found at the final 12-month time point.13 That study also found a significant decrease in weight at 6 months; however there was not a significant reduction in weight at both 3 and 12 months of GLP-1 RA therapy. There was not a significant decrease in TDD at any of the collected time points. Nonetheless, Gyorffy and colleagues concluded that reduction in TDD leveled off after 12 months, which is consistent with this study’s findings. The small size of the study may have limited the ability to detect statistical significance; however, this study was conducted in a population that was racially diverse and included a higher proportion of women, though average age was similar.13
Yoon and colleagues reported weight loss through 18 months, then saw weight increase, though weights did remain lower than baseline. The study also showed no significant change in TDD of insulin after 12 months of concomitant exenatide and insulin therapy.11 Although these results mirror the outcomes observed in this study, Yoon and colleagues did not differentiate results between basal and basal/bolus insulin groups.11 Seino and colleagues observed no significant change in weight after 36 weeks of GLP-1 RA therapy in Japanese patients when used with basal and basal/bolus insulin regimens. Despite the consideration that the population in the study was not overweight (mean body mass index was 25.6), the results of these studies support the idea that effects of GLP-1 RAs on weight and TDD may diminish over time.14
Within the VHA, GLP-1 RAs are nonformulary medications. Patients must meet certain criteria in order to be approved for these agents, which may include diagnosis of CVD, renal disease, or failure to reach glycemic control with the use of oral agents or insulin. Therefore, participants of this study represent a particular subset of VHA patients, many of whom may have been selected for consideration due to long-standing or uncontrolled T2DM and failure of previous therapies. The baseline demographics support this idea, given poor glycemic control at baseline and high insulin requirements. Once approved for GLP-1 RA therapy, semaglutide is currently the preferred agent within the VHA, with other agents available for select considerations. It should be noted that albiglutide, which was the primary agent selected for some of the patients included in this study, was removed from the market in 2017 for economic considerations.15 In the case for these patients, a conversion to a formulary-preferred GLP-1 RA was made.
Most of the patients included in this study (70%) were maintained on metformin from baseline throughout the study period. Fifty-seven percent of patients were taking TDD of insulin > 150 units. Considering the significant cost of concentrated insulins, the addition of GLP-1 RAs to standard insulin may prove to be beneficial from a cost standpoint. Additional research in this area may be warranted to establish more data regarding this potential benefit of GLP-1 RAs as add-on therapy.
Many adverse drug reactions were reported at different periods; however, most of these were associated with the gastrointestinal system, which is consistent with current literature, drug labeling, and the mechanism of action.16 Hypoglycemia occurred in about one-third of the participants; however, it should be noted that alone, GLP-1 RAs are not associated with a high risk of hypoglycemia. Previous studies have found that GLP-1 RA monotherapy is associated with hypoglycemia in 1.6% to 12.6% of patients.17,18 More likely, the combination of basal/bolus insulin and the GLP-1 RA’s effect on increasing insulin sensitivity through weight loss, improving glucose-dependent insulin secretion, or by decreasing appetite and therefore decreasing carbohydrate intake contributed to the hypoglycemia prevalence.
Limitations and Strengths
Limitations of this study include a small patient population and a gradual reduction in available data as time periods progressed, making even smaller sample sizes for subsequent time periods. A majority of participants were older, males and White race. This could have limited the determination of statistical significance and applicability of the results to other patient populations. Another potential limitation was the retrospective nature of the study design, which may have limited reporting of hypoglycemia and other AEs based on the documentation of the clinician.
Strengths included the study duration and the diversity of GLP-1 RAs used by participants, as the impact of many of these agents has not yet been assessed in the literature. In addition, the retrospective nature of the study allows for a more realistic representation of patient adherence, education, and motivation, which are likely different from those of patients included in prospective clinical trials.
There are no clear guidelines dictating the optimal duration of concomitant GLP-1 RA and insulin therapy; however, our study suggests that there may be continued benefits past short-term use. Also our study suggests that patients with T2DM treated with basal/bolus insulin regimens may glean additional benefit from adding GLP-1 RAs; however, further randomized, controlled studies are warranted, particularly in poorly controlled patients requiring even more aggressive treatment regimens, such as concentrated insulins.
Conclusions
In our study, adding GLP-1 RA to basal/bolus insulin was associated with a significant decrease in HbA1c from baseline through 18 months. An overall decrease in weight and TDD of insulin was observed through 24 months, but the change in weight was not significant past 18 months, and the change in insulin requirement was not significant past 12 months. Hypoglycemia was observed in almost one-third of patients, and gastrointestinal symptoms were the most common AE observed as a result of adding GLP-1 RAs. More studies are needed to better evaluate the durability and cost benefit of GLP-1 RAs, especially in patients with high insulin requirements.
Acknowledgments
This material is the result of work supported with resources and facilities at Veteran Health Indiana in Indianapolis. Study data were collected and managed using REDCap electronic data capture tools hosted at Veteran Health Indiana. The authors also acknowledge George Eckert for his assistance with data analysis.
1. American Diabetes Association. Statistics about diabetes. Accessed August 9, 2022. http://www.diabetes.org/diabetes-basics/statistics
2. US Department of Veterans Affairs, Veterans Health Administration, Office of Research and Development. VA research on: diabetes. Updated January 15, 2021. Accessed August 9, 2022. https://www.research.va.gov/topics/diabetes.cfm
3. Federal Practitioner. Federal Health Care Data Trends 2017, Diabetes mellitus. Accessed August 9, 2022. https://www.fedprac-digital.com/federalpractitioner/data_trends_2017?pg=20#pg20
4. American Diabetes Association Professional Practice Committee. 9. Pharmacologic approaches to glycemic treatment: Standards of Medical Care in Diabetes—2022. Diabetes Care. 2022;45(suppl 1):S125-S143. doi:10.2337/dc22-S009
5. Garber AJ, Abrahamson MJ, Barzilay JI, et al. Consensus statement by the American Association of Clinical Endocrinologists and American College of Endocrinology on the comprehensive type 2 diabetes management algorithm – 2019 executive summary. Endocr Pract. 2019;25(1):69-100. doi:10.4158/CS-2018-0535
6. St Onge E, Miller S, Clements E, Celauro L, Barnes K. The role of glucagon-like peptide-1 receptor agonists in the treatment of type 2 diabetes. J Transl Int Med. 2017;5(2):79-89. Published 2017 Jun 30. doi:10.1515/jtim-2017-0015
7. Almandoz JP, Lingvay I, Morales J, Campos C. Switching between glucagon-like peptide-1 receptor agonists: rationale and practical guidance. Clin Diabetes. 2020;38(4):390-402. doi:10.2337/cd19-0100
8. Davies ML, Pham DQ, Drab SR. GLP1-RA add-on therapy in patients with type 2 diabetes currently on a bolus containing insulin regimen. Pharmacotherapy. 2016;36(8):893-905. doi:10.1002/phar.1792
9. Rosenstock J, Guerci B, Hanefeld M, et al. Prandial options to advance basal insulin glargine therapy: testing lixisenatide plus basal insulin versus insulin glulisine either as basal-plus or basal-bolus in type 2 diabetes: the GetGoal Duo-2 Trial Investigators. Diabetes Care. 2016;39(8):1318-1328. doi:10.2337/dc16-0014
10. Levin PA, Mersey JH, Zhou S, Bromberger LA. Clinical outcomes using long-term combination therapy with insulin glargine and exenatide in patients with type 2 diabetes mellitus. Endocr Pract. 2012;18(1):17-25. doi:10.4158/EP11097.OR
11. Yoon NM, Cavaghan MK, Brunelle RL, Roach P. Exenatide added to insulin therapy: a retrospective review of clinical practice over two years in an academic endocrinology outpatient setting. Clin Ther. 2009;31(7):1511-1523. doi:10.1016/j.clinthera.2009.07.021
12. Weissman PN, Carr MC, Ye J, et al. HARMONY 4: randomised clinical trial comparing once-weekly albiglutide and insulin glargine in patients with type 2 diabetes inadequately controlled with metformin with or without sulfonylurea. Diabetologia. 2014;57(12):2475-2484. doi:10.1007/s00125-014-3360-3
13. Gyorffy JB, Keithler AN, Wardian JL, Zarzabal LA, Rittel A, True MW. The impact of GLP-1 receptor agonists on patients with diabetes on insulin therapy. Endocr Pract. 2019;25(9):935-942. doi:10.4158/EP-2019-0023
14. Seino Y, Kaneko S, Fukuda S, et al. Combination therapy with liraglutide and insulin in Japanese patients with type 2 diabetes: a 36-week, randomized, double-blind, parallel-group trial. J Diabetes Investig. 2016;7(4):565-573. doi:10.1111/jdi.12457
15. Optum. Tanzeum (albiglutide)–drug discontinuation. Published 2017. Accessed August 15, 2022. https://professionals.optumrx.com/content/dam/optum3/professional-optumrx/news/rxnews/drug-recalls-shortages/drugwithdrawal_tanzeum_2017-0801.pdf
16. Chun JH, Butts A. Long-acting GLP-1RAs: an overview of efficacy, safety, and their role in type 2 diabetes management. JAAPA. 2020;33(8):3-18. doi:10.1097/01.JAA.0000669456.13763.bd
17. Ozempic semaglutide injection. Prescribing information. Novo Nordisk; 2022. Accessed August 9, 2022. https://www.novo-pi.com/ozempic.pdf
18. Victoza liraglutide injection. Prescribing information. Novo Nordisk; 2021. Accessed August 9, 2022. https://www.novo-pi.com/victoza.pdf
In 2019, diabetes mellitus (DM) was the seventh leading cause of death in the United States, and currently, about 11% of the American population has a DM diagnosis.1 Most have a diagnosis of type 2 diabetes (T2DM), which has a strong genetic predisposition, and the risk of developing T2DM increases with age, obesity, and lack of physical activity.1,2 Nearly one-quarter of veterans have a diagnosis of DM, and DM is the leading cause of comorbidities, such as blindness, end-stage renal disease, and amputation for patients receiving care from the Veterans Health Administration (VHA).2 The elevated incidence of DM in the veteran population is attributed to a variety of factors, including exposure to herbicides, such as Agent Orange, advanced age, increased risk of obesity, and limited access to high-quality food.3
After diagnosis, both the American Diabetes Association (ADA) and the American Association of Clinical Endocrinologists and American College of Endocrinology (AACE/ACE) emphasize the appropriate use of lifestyle management and pharmacologic therapy for DM care. The use of pharmacologic agents (oral medications, insulin, or noninsulin injectables) is often determined by efficacy, cost, potential adverse effects (AEs), and patient factors and comorbidities.4,5
The initial recommendation for pharmacologic treatment for T2DM differs slightly between expert guidelines. The ADA and AACE/ACE recommend any of the following as initial monotherapy, listed in order to represent a hierarchy of usage: metformin, glucagon-like peptide-1 receptor agonists (GLP-1 RAs), sodium-glucose cotransporter 2 (SGLT-2) inhibitors, or dipeptidyl peptidase-4 (DPP-4) inhibitors, with the first 3 agents carrying the strongest recommendations.4,5 For patients with established atherosclerotic cardiovascular disease (CVD), chronic kidney disease, or heart failure, it is recommended to start a long-acting GLP-1 RA or SGLT-2 inhibitor. For patients with T2DM and hemoglobin A1c (HbA1c) between 7.5% and 9.0% at diagnosis, the AACE/ACE recommend initiation of dual therapy using metformin alongside another first-line agent and recommend the addition of another antidiabetic agent if glycemic goals are not met after regular follow-up. AACE/ACE recommend the consideration of insulin therapy in symptomatic patients with HbA1c > 9.0%.5 In contrast, the ADA recommends metformin as first-line therapy for all patients with T2DM and recommends dual therapy using metformin and another preferred agent (selection based on comorbidities) when HbA1c is 1.5% to 2% above target. The ADA recommends the consideration of insulin with HbA1c > 10% or with evidence of ongoing catabolism or symptoms of hyperglycemia.4 There are several reasons why insulin may be initiated prior to GLP-1 RAs, including profound hyperglycemia at time of diagnosis or implementation of insulin agents prior to commercial availability of GLP-1 RA.
GLP-1 RAs are analogs of the hormone incretin, which increases glucose-dependent insulin secretion, decreases postprandial glucagon secretion, increases satiety, and slows gastric emptying.6,7 When used in combination with noninsulin agents, GLP-1 RAs have demonstrated HbA1c reductions of 0.5% to 1.5%.8 The use of GLP-1 RAs with basal insulin also has been studied extensively.6,8-10 When the combination of GLP-1 RAs and basal insulin was compared with basal/bolus insulin regimens, the use of the GLP-1 RAs resulted in lower HbA1c levels and lower incidence of hypoglycemia.6,9 Data have demonstrated the complementary mechanisms of using basal insulin and GLP 1 RAs in decreasing HbA1c levels, insulin requirements, and weight compared with using basal insulin monotherapy and basal/bolus combinations.6,9-13 Moreover, 3 GLP-1 RA medications currently on the market (liraglutide, dulaglutide, and semaglutide) have displayed cardiovascular and renal benefits, further supporting the use of these medications.2,5
Despite these benefits, GLP-1 RAs may have bothersome AEs and are associated with a high cost.6 In addition, some studies have found that as the length of therapy increases, the positive effects of these agents may diminish.9,11 In one study, which looked at the impact of the addition of exenatide to patients taking basal or basal/bolus insulin regimens, mean changes in weight were −2.4 kg at 0 to 6 months, −4.3 kg at 6 to 12 months, −6.2 kg at 12 to 18 months, and −5.5 kg at 18 to 27 months. After 18 months, an increase in weight was observed, but the increase remained lower than baseline.11 Another study, conducted over 12 months, found no significant decrease in weight or total daily dose (TDD) of insulin when exenatide or liraglutide were added to various insulin regimens (basal or basal/bolus).13 To date, minimal published data exist regarding the addition of newer GLP-1 RAs and the long-term use of these agents beyond 12 months in patients taking basal/bolus insulin regimens. The primary goal of this study was to evaluate the effect of adding GLP-1 RAs to basal/bolus insulin regimens over a 24-month period.
Methods
This study was a retrospective, electronic health record review of all patients on basal and bolus insulin regimens who received additional therapy with a GLP-1 RA at Veteran Health Indiana in Indianapolis from September 1, 2015, to June 30, 2019. Patients meeting inclusion criteria served as their own control. The primary outcome was change in HbA1c at 3, 6, 12, 18, and 24 months after initiation of the GLP-1 RA. Secondary outcomes included change in weight and TDD of insulin at 3, 6, 12, 18, and 24 months after the initiation of the GLP-1 RAs and incidence of patient-reported or laboratory-confirmed hypoglycemia and other AEs.
Patients were included if they were aged ≥ 18 years with a diagnosis of T2DM, had concomitant prescriptions for both a basal insulin (glargine, detemir, or NPH) and a bolus insulin (aspart, lispro, or regular) before receiving add-on therapy with a GLP-1 RA (exenatide, liraglutide, albiglutide, lixisenatide, dulaglutide, or semaglutide) from September 1, 2015, to June 30, 2019, and had baseline and subsequent HbA1c measurements available in the electronic health record. Patients were excluded if they had a diagnosis of type 1 DM (T1DM), were followed by an outside clinician for DM care, or if the GLP-1 RA was discontinued before subsequent HbA1c measurement. The study protocol was approved by the Research and Development Office of Veteran Health Indiana, and the project was deemed exempt from review by the Indiana University Institutional Review Board due to the retrospective nature of the study.
Data analysis was performed using Excel. Change from baseline for each interval was computed, and 1 sample t tests (2-tailed) compared change from baseline to no change. Due to the disparity in the number of patients with data available at each of the time intervals, a mean plot was presented for each group of patients within each interval, allowing mean changes in individual groups to be observed over time.
Results
One hundred twenty-three subjects met inclusion criteria; 16 patients were excluded due to GLP-1 RA discontinuation before follow-up measurement of HbA1c; 14 were excluded due to patients being managed by a clinician outside of the facility; 1 patient was excluded for lack of documentation regarding baseline and subsequent insulin doses. Ninety-two patient charts were reviewed. Participants had a mean age of 64 years, 95% were male, and 89% were White. Mean baseline HbA1c was 9.2%, mean body mass index was 38.9, and the mean TDD of insulin was 184 units.
Since some patients switched between GLP-1 RAs throughout the study and there was variation in timing of laboratory and clinic follow-up, ![]()
Discussion
Adding a GLP-1 RA to basal/bolus insulin regimens was associated with a statistically significant decrease in HbA1c at each time point through 18 months. The greatest improvement in glycemic control from baseline was seen at 3 months, with improvements in HbA1c diminishing at each subsequent period. The study also demonstrated a significant decrease in weight at each time point through 18 months. The greatest decrease in weight was observed at both 6 and 12 months. Statistically significant decreases in TDD were observed at 3, 6, and 12 months. Insulin changes after 12 months were not found to be statistically significant.
Few studies have previously evaluated the use of GLP-1 RAs in patients with T2DM who are already taking basal/bolus insulin regimens. Gyorffy and colleagues reported significant improvements in glycemic control at 3 and 6 months in a sample of 54 patients taking basal/bolus insulin when liraglutide or exenatide was added, although statistical significance was not found at the final 12-month time point.13 That study also found a significant decrease in weight at 6 months; however there was not a significant reduction in weight at both 3 and 12 months of GLP-1 RA therapy. There was not a significant decrease in TDD at any of the collected time points. Nonetheless, Gyorffy and colleagues concluded that reduction in TDD leveled off after 12 months, which is consistent with this study’s findings. The small size of the study may have limited the ability to detect statistical significance; however, this study was conducted in a population that was racially diverse and included a higher proportion of women, though average age was similar.13
Yoon and colleagues reported weight loss through 18 months, then saw weight increase, though weights did remain lower than baseline. The study also showed no significant change in TDD of insulin after 12 months of concomitant exenatide and insulin therapy.11 Although these results mirror the outcomes observed in this study, Yoon and colleagues did not differentiate results between basal and basal/bolus insulin groups.11 Seino and colleagues observed no significant change in weight after 36 weeks of GLP-1 RA therapy in Japanese patients when used with basal and basal/bolus insulin regimens. Despite the consideration that the population in the study was not overweight (mean body mass index was 25.6), the results of these studies support the idea that effects of GLP-1 RAs on weight and TDD may diminish over time.14
Within the VHA, GLP-1 RAs are nonformulary medications. Patients must meet certain criteria in order to be approved for these agents, which may include diagnosis of CVD, renal disease, or failure to reach glycemic control with the use of oral agents or insulin. Therefore, participants of this study represent a particular subset of VHA patients, many of whom may have been selected for consideration due to long-standing or uncontrolled T2DM and failure of previous therapies. The baseline demographics support this idea, given poor glycemic control at baseline and high insulin requirements. Once approved for GLP-1 RA therapy, semaglutide is currently the preferred agent within the VHA, with other agents available for select considerations. It should be noted that albiglutide, which was the primary agent selected for some of the patients included in this study, was removed from the market in 2017 for economic considerations.15 In the case for these patients, a conversion to a formulary-preferred GLP-1 RA was made.
Most of the patients included in this study (70%) were maintained on metformin from baseline throughout the study period. Fifty-seven percent of patients were taking TDD of insulin > 150 units. Considering the significant cost of concentrated insulins, the addition of GLP-1 RAs to standard insulin may prove to be beneficial from a cost standpoint. Additional research in this area may be warranted to establish more data regarding this potential benefit of GLP-1 RAs as add-on therapy.
Many adverse drug reactions were reported at different periods; however, most of these were associated with the gastrointestinal system, which is consistent with current literature, drug labeling, and the mechanism of action.16 Hypoglycemia occurred in about one-third of the participants; however, it should be noted that alone, GLP-1 RAs are not associated with a high risk of hypoglycemia. Previous studies have found that GLP-1 RA monotherapy is associated with hypoglycemia in 1.6% to 12.6% of patients.17,18 More likely, the combination of basal/bolus insulin and the GLP-1 RA’s effect on increasing insulin sensitivity through weight loss, improving glucose-dependent insulin secretion, or by decreasing appetite and therefore decreasing carbohydrate intake contributed to the hypoglycemia prevalence.
Limitations and Strengths
Limitations of this study include a small patient population and a gradual reduction in available data as time periods progressed, making even smaller sample sizes for subsequent time periods. A majority of participants were older, males and White race. This could have limited the determination of statistical significance and applicability of the results to other patient populations. Another potential limitation was the retrospective nature of the study design, which may have limited reporting of hypoglycemia and other AEs based on the documentation of the clinician.
Strengths included the study duration and the diversity of GLP-1 RAs used by participants, as the impact of many of these agents has not yet been assessed in the literature. In addition, the retrospective nature of the study allows for a more realistic representation of patient adherence, education, and motivation, which are likely different from those of patients included in prospective clinical trials.
There are no clear guidelines dictating the optimal duration of concomitant GLP-1 RA and insulin therapy; however, our study suggests that there may be continued benefits past short-term use. Also our study suggests that patients with T2DM treated with basal/bolus insulin regimens may glean additional benefit from adding GLP-1 RAs; however, further randomized, controlled studies are warranted, particularly in poorly controlled patients requiring even more aggressive treatment regimens, such as concentrated insulins.
Conclusions
In our study, adding GLP-1 RA to basal/bolus insulin was associated with a significant decrease in HbA1c from baseline through 18 months. An overall decrease in weight and TDD of insulin was observed through 24 months, but the change in weight was not significant past 18 months, and the change in insulin requirement was not significant past 12 months. Hypoglycemia was observed in almost one-third of patients, and gastrointestinal symptoms were the most common AE observed as a result of adding GLP-1 RAs. More studies are needed to better evaluate the durability and cost benefit of GLP-1 RAs, especially in patients with high insulin requirements.
Acknowledgments
This material is the result of work supported with resources and facilities at Veteran Health Indiana in Indianapolis. Study data were collected and managed using REDCap electronic data capture tools hosted at Veteran Health Indiana. The authors also acknowledge George Eckert for his assistance with data analysis.
1. American Diabetes Association. Statistics about diabetes. Accessed August 9, 2022. http://www.diabetes.org/diabetes-basics/statistics
2. US Department of Veterans Affairs, Veterans Health Administration, Office of Research and Development. VA research on: diabetes. Updated January 15, 2021. Accessed August 9, 2022. https://www.research.va.gov/topics/diabetes.cfm
3. Federal Practitioner. Federal Health Care Data Trends 2017, Diabetes mellitus. Accessed August 9, 2022. https://www.fedprac-digital.com/federalpractitioner/data_trends_2017?pg=20#pg20
4. American Diabetes Association Professional Practice Committee. 9. Pharmacologic approaches to glycemic treatment: Standards of Medical Care in Diabetes—2022. Diabetes Care. 2022;45(suppl 1):S125-S143. doi:10.2337/dc22-S009
5. Garber AJ, Abrahamson MJ, Barzilay JI, et al. Consensus statement by the American Association of Clinical Endocrinologists and American College of Endocrinology on the comprehensive type 2 diabetes management algorithm – 2019 executive summary. Endocr Pract. 2019;25(1):69-100. doi:10.4158/CS-2018-0535
6. St Onge E, Miller S, Clements E, Celauro L, Barnes K. The role of glucagon-like peptide-1 receptor agonists in the treatment of type 2 diabetes. J Transl Int Med. 2017;5(2):79-89. Published 2017 Jun 30. doi:10.1515/jtim-2017-0015
7. Almandoz JP, Lingvay I, Morales J, Campos C. Switching between glucagon-like peptide-1 receptor agonists: rationale and practical guidance. Clin Diabetes. 2020;38(4):390-402. doi:10.2337/cd19-0100
8. Davies ML, Pham DQ, Drab SR. GLP1-RA add-on therapy in patients with type 2 diabetes currently on a bolus containing insulin regimen. Pharmacotherapy. 2016;36(8):893-905. doi:10.1002/phar.1792
9. Rosenstock J, Guerci B, Hanefeld M, et al. Prandial options to advance basal insulin glargine therapy: testing lixisenatide plus basal insulin versus insulin glulisine either as basal-plus or basal-bolus in type 2 diabetes: the GetGoal Duo-2 Trial Investigators. Diabetes Care. 2016;39(8):1318-1328. doi:10.2337/dc16-0014
10. Levin PA, Mersey JH, Zhou S, Bromberger LA. Clinical outcomes using long-term combination therapy with insulin glargine and exenatide in patients with type 2 diabetes mellitus. Endocr Pract. 2012;18(1):17-25. doi:10.4158/EP11097.OR
11. Yoon NM, Cavaghan MK, Brunelle RL, Roach P. Exenatide added to insulin therapy: a retrospective review of clinical practice over two years in an academic endocrinology outpatient setting. Clin Ther. 2009;31(7):1511-1523. doi:10.1016/j.clinthera.2009.07.021
12. Weissman PN, Carr MC, Ye J, et al. HARMONY 4: randomised clinical trial comparing once-weekly albiglutide and insulin glargine in patients with type 2 diabetes inadequately controlled with metformin with or without sulfonylurea. Diabetologia. 2014;57(12):2475-2484. doi:10.1007/s00125-014-3360-3
13. Gyorffy JB, Keithler AN, Wardian JL, Zarzabal LA, Rittel A, True MW. The impact of GLP-1 receptor agonists on patients with diabetes on insulin therapy. Endocr Pract. 2019;25(9):935-942. doi:10.4158/EP-2019-0023
14. Seino Y, Kaneko S, Fukuda S, et al. Combination therapy with liraglutide and insulin in Japanese patients with type 2 diabetes: a 36-week, randomized, double-blind, parallel-group trial. J Diabetes Investig. 2016;7(4):565-573. doi:10.1111/jdi.12457
15. Optum. Tanzeum (albiglutide)–drug discontinuation. Published 2017. Accessed August 15, 2022. https://professionals.optumrx.com/content/dam/optum3/professional-optumrx/news/rxnews/drug-recalls-shortages/drugwithdrawal_tanzeum_2017-0801.pdf
16. Chun JH, Butts A. Long-acting GLP-1RAs: an overview of efficacy, safety, and their role in type 2 diabetes management. JAAPA. 2020;33(8):3-18. doi:10.1097/01.JAA.0000669456.13763.bd
17. Ozempic semaglutide injection. Prescribing information. Novo Nordisk; 2022. Accessed August 9, 2022. https://www.novo-pi.com/ozempic.pdf
18. Victoza liraglutide injection. Prescribing information. Novo Nordisk; 2021. Accessed August 9, 2022. https://www.novo-pi.com/victoza.pdf